Embed Size (px)
Citation preview

The Impact of International Baccalaureate’s Primary Years Program (PYP) on Student Performance: Evidence from Michigan and North Carolina∗
Steven W. Hemelt University of North Carolina – Chapel Hill
November 2014
Abstract
This study uses longitudinal administrative data from two states covering 2005-2006 to 2011-2012 to examine the effects of exposure to International Baccalaureate’s Primary Years Program (PYP) on students’ academic performance in grades 3 and 5. I exploit within-school variation over time in the adoption of the PYP to estimate achievement impacts. Across both states, I find that exposure to the PYP improves the reading performance of economically disadvantaged third-graders (by about 0.10 standard deviations), with little evidence of any offsetting, harmful effects on the reading achievement of other students. Yet, I arrive at discordant conclusions about the effects of the PYP on students’ mathematics performance: In Michigan, estimates suggest that fifth-graders exposed to the PYP perform about the same as their non-PYP counterparts, and third-graders perform about 0.07 standard deviations better. In North Carolina, I find negative effects of the PYP on third- and fifth-grade math performance, especially among boys. I find no evidence that these negative impacts are mediated through differential changes in teacher turnover. I close with a discussion the practical significance of the main findings and suggest key areas of focus for future research.
∗ The research reported here was supported by grant funding from the International Baccalaureate Global Research Office to the University of North Carolina – Chapel Hill. This research used data structured and maintained by the Michigan Consortium for Educational Research (MCER). MCER data are modified for analysis purposes using rules governed by MCER and are not identical to those data collected and maintained by the Michigan Department of Education (MDE) and/or Michigan’s Center for Educational Performance and Information (CEPI). Results, information and opinions solely represent the analysis, information and opinions of the author(s) and are not endorsed by, nor do they reflect the views or positions of, grantors, MDE and CEPI or any employee thereof. Thanks to Sue Dynarski, Dave Marcotte, and seminar participants at Elon University’s Economics Department Seminar Series for constructive comments. I am also grateful to Liz Bergeron at the IB for many helpful conversations. Any errors and all opinions are my own.
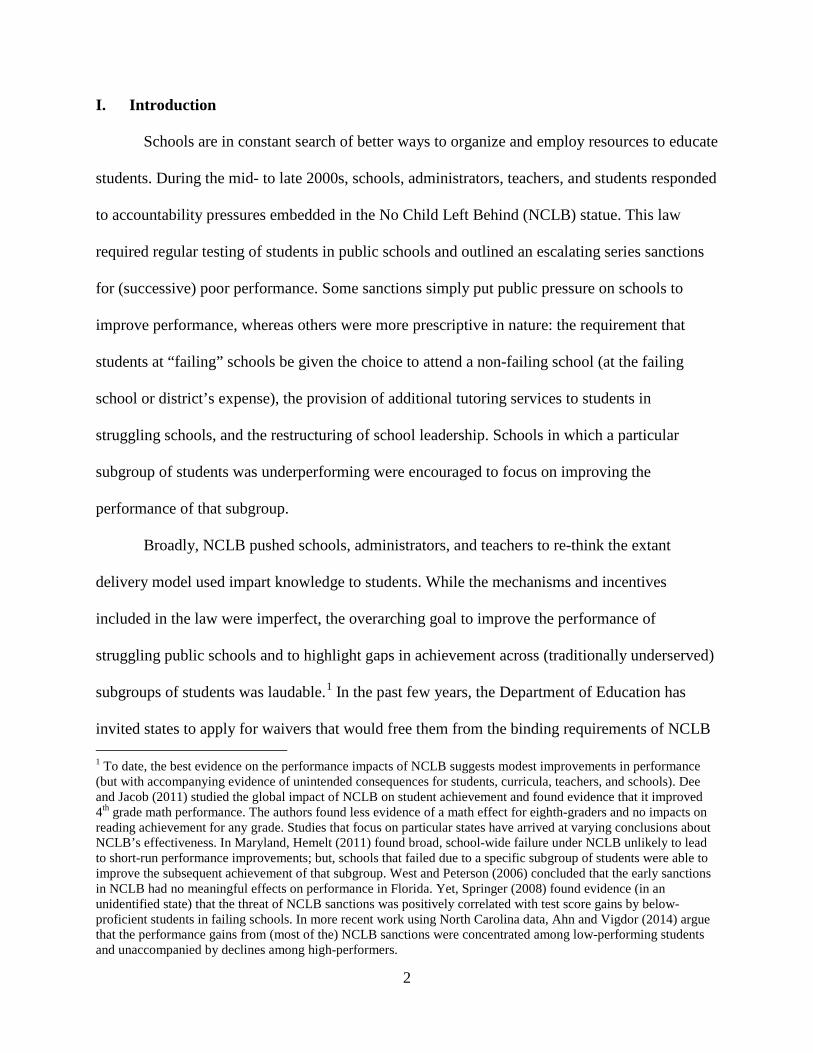
I. Introduction
Schools are in constant search of better ways to organize and employ resources to educate
students. During the mid- to late 2000s, schools, administrators, teachers, and students responded
to accountability pressures embedded in the No Child Left Behind (NCLB) statue. This law
required regular testing of students in public schools and outlined an escalating series sanctions
for (successive) poor performance. Some sanctions simply put public pressure on schools to
improve performance, whereas others were more prescriptive in nature: the requirement that
students at “failing” schools be given the choice to attend a non-failing school (at the failing
school or district’s expense), the provision of additional tutoring services to students in
struggling schools, and the restructuring of school leadership. Schools in which a particular
subgroup of students was underperforming were encouraged to focus on improving the
performance of that subgroup.
Broadly, NCLB pushed schools, administrators, and teachers to re-think the extant
delivery model used impart knowledge to students. While the mechanisms and incentives
included in the law were imperfect, the overarching goal to improve the performance of
struggling public schools and to highlight gaps in achievement across (traditionally underserved)
subgroups of students was laudable.1 In the past few years, the Department of Education has
invited states to apply for waivers that would free them from the binding requirements of NCLB
1 To date, the best evidence on the performance impacts of NCLB suggests modest improvements in performance (but with accompanying evidence of unintended consequences for students, curricula, teachers, and schools). Dee and Jacob (2011) studied the global impact of NCLB on student achievement and found evidence that it improved 4th grade math performance. The authors found less evidence of a math effect for eighth-graders and no impacts on reading achievement for any grade. Studies that focus on particular states have arrived at varying conclusions about NCLB’s effectiveness. In Maryland, Hemelt (2011) found broad, school-wide failure under NCLB unlikely to lead to short-run performance improvements; but, schools that failed due to a specific subgroup of students were able to improve the subsequent achievement of that subgroup. West and Peterson (2006) concluded that the early sanctions in NCLB had no meaningful effects on performance in Florida. Yet, Springer (2008) found evidence (in an unidentified state) that the threat of NCLB sanctions was positively correlated with test score gains by below-proficient students in failing schools. In more recent work using North Carolina data, Ahn and Vigdor (2014) argue that the performance gains from (most of the) NCLB sanctions were concentrated among low-performing students and unaccompanied by declines among high-performers.
2

(e.g., see Center on Education Policy (2013) for an overview) in exchange for a detailed plan of
how the state expects to address low-performing schools and schools where achievement gaps
between advantaged and disadvantaged students are the greatest. Once again, these waivers
nudged states to reflect on how they could improve the delivery, efficiency, and effectiveness of
public education.
Beyond federal legislation, other modes of school reform can be characterized as
attempts to better organize school leadership, curricula, teaching staff, and other resources to
improve student learning and achievement. Examples include charter schools, the Common
Core, and a host of whole-school programs (e.g., Bifulco et al., 2005). One understudied option
is the International Baccalaureate’s (IB) set of programs for elementary, middle, and high
schools. These programs have their own curricula, approach to teaching, learning goals, and
support structures. To become an IB school requires a fairly extensive, multi-faceted application
process – which includes budget projections, site visits, installation of a curricular coordinator,
and evidence of community support.
The goal of this study is to evaluate the effects of International Baccalaureate’s (IB)
Primary Years Program (PYP) on student performance. The PYP is a whole-school program
designed for elementary school children (i.e., ages 3 to 12). The program is centered on several
trans-disciplinary themes, but also outlines specific subject-based goals (i.e., in science, reading,
math, social studies, arts). The overarching approach to education embodied by the PYP is one of
inquiry: Through a variety of linked methods, students are given opportunities to “build meaning
and refine their understanding, principally through structured inquiry” (IB, 2009). The PYP also
stresses the importance of student and teacher self-reflection. I discuss major components of the
PYP and the authorization process below.
3

I focus on schools offering the PYP in Michigan and North Carolina. I exploit variation
in the timing of schools’ authorizations to estimate state-specific impacts on achievement. I use
administrative data that include students’ test scores (in grades 3 and 5) to assess the
performance of elementary school students exposed to the PYP relative to their counterparts not
exposed to the PYP’s curricula, resources, support, and culture. This study is the first to causally
evaluate the impacts of the PYP on student achievement in the United States. Findings from this
work will add to the broad literature on the achievement impacts of various multi-pronged,
whole-school programs and policies.
The paper unfolds as follows. Section II discusses particulars of the Primary Years
Program (PYP) offered by the IB. Section III reviews the scarce existing literature and situates
this paper’s contributions within that extant work. Section IV describes the data and Section V
details the empirical approach to estimating achievement impacts. Section VI discusses the main
results. Section VII concludes by placing the main findings in a broader context and offering
suggestions for particular future research paths.
II. Background on IB’s Primary Years Program (PYP)
The International Baccalaureate (IB) offers four educational programs: the Primary Years
Program (PYP), the Middle Years Program (MYP), the Diploma Program (DP), and the Career-
related Program (CP). The PYP was introduced in 1997. All four programs focus on the
development of the whole student and the cultivation of an “international-mindedness” (IB,
2009).
One distinguishing feature of the PYP is the manner in which concepts are taught through
attachment to particular “units of inquiry.” These units are grade-specific and schools must
develop and implement various units, all of which must be grouped under the PYP’s core trans-
4

disciplinary themes: who we are; where we are in place and time; how we express ourselves;
how the world works; how we organize ourselves; and sharing the planet (IB, 2012). For
example, the trans-disciplinary theme “how the world works” focuses on the understanding of
mathematical and scientific concepts and the application of those concepts to questions about the
natural world and its laws, interactions between the natural world and human societies, and the
process by which technological advances impact society (IB, 2012). Each line of inquiry is
expressed through a series of “central ideas.” For instance, one “central idea” that falls under the
trans-disciplinary theme of “how the world works” is “Our activity is usually connected to the
Earth’s natural cycles” (IB, 2012, p. 15). This line of inquiry is directed at 3-4 year-old students.
Children examine night and day cycles (dark and light), seasonal changes, and health and safety
as related to climate and seasonal changes (p. 15). The PYP also requires schools and teachers to
identify subject-specific curricular goals. These subject-specific goals are then embedded in the
framework of the interconnected lines of inquiry.
In their final year of the PYP, students engage in an in-depth, collaborative project (i.e.,
the “exhibition”). This project requires students to form groups, select a real-life issue, apply
knowledge gained from their PYP schooling to this issue through research, draw conclusions,
and describe what actions (in the real world) should be taken as a result of those conclusions.
Teachers act as mentors for groups of students: they facilitate the research process, structure the
exhibition format (including the final, oral presentation), plan collaboratively with other teachers,
and communicate with parents about students’ exhibition progress (IB, 2008).
Schools interested in offering the PYP (and thereby becoming an IB school) must
undergo an extensive and multi-faceted application process. Broadly, schools move from a
consideration phase into a candidate phase and then finally become authorized. The
5

consideration phase involves assessments of the school’s ability to offer the PYP as intended, the
time it will take to get up and running, the capacity of administrators to support the program, and
the potential benefits that implementation of the program could bring to the school and
surrounding community. If this phase produces promising results, the school formally enters the
authorization process, identifies the person at the school who will become the PYP Coordinator,
identifies resources necessary for implementation, and sends staff to IB-recognized professional
development (IB, 2010). The school then submits an “application for candidacy” substantiating
the school’s ability to implement all facets of the IB program (this includes a 5-year budget
projection and evidence of community support). If the school receives a favorable decision from
the IB, it progresses to the candidate phase. This phase must last at least one year. The core
component of this stage is the requirement that the school conduct a “trial implementation” of
the full PYP (IB, 2010, p. 3). At the end of this period, the IB makes a mandatory consultation
visit to the school. The IB then issues a report that includes recommendations about the
implementation of the PYP moving forward. After successful completion of this candidacy
phase, the school becomes fully authorized as an IB school and continues to implement the PYP.
The IB PYP authorization process is quite comprehensive. The manner in which this
process works has important implications for how I will analyze the effects of the PYP on
student performance in Michigan and North Carolina.
III. Literature Review
There is sparse evidence on the achievement impacts of IB’s PYP in the United States.
Among the few extant studies, two examine performance outcomes for PYP schools (Stillisano
et al., 2010; Frank, 2009) and one explores factors that influence the process through which
schools become authorized as PYP providers (Hall et al., 2009). In Georgia, Hall et al. (2009)
6

concluded that district-level support was essential for schools interested in adopting IB’s PYP
platform.
In Texas, researchers compared the math and reading performance on state test (Texas
Assessment of Knowledge and Skills, TAKS) of students in 22 PYP schools to students in non-
PYP schools that “looked like” the PYP schools (in terms of observable characteristics).
Specifically, Stillisano et al. (2010) matched PYP and non-PYP schools based on the percentage
of students eligible for free or reduced-price lunch (FARM), racial and ethnic makeup, and
district membership. They found no detectable difference in achievement for students at PYP
schools, relative to students at non-PYP elementary schools. Finally, Frank (2009) examined the
reading performance of one PYP school compared to 16 non-PYP schools in South Carolina and
found increases in reading achievement, especially for FARM and male students. Yet, since he
only examined one PYP school, is it difficult to attribute this academic improvement to the
existence of the PYP curricula. There are a variety of other factors particular to that one school
that may have generated the observed achievement improvements.
This paper contributes to this sparse literature in a number of ways. First, it provides the
first estimates of the achievement effects of the PYP in elementary schools across North Carolina
and Michigan. To do so, it uses quasi-experimental methods that attempt to address concerns
about selection into PYP school status – in order to arrive at estimates of achievement effects
that can more plausibly be interpreted as causal. Given evidence of heterogeneous treatment
effects by gender and economic disadvantage of various multi-pronged, intensive educational
interventions (Anderson, 2008; Hemelt et al., 2013), I focus not only on average impacts, but
also explore impacts by different policy-relevant subgroups of students (e.g., by poverty status).
7
IV. Data
This study uses detailed administrative data on students in Michigan and North Carolina
public elementary schools from 2005-2006 to 2011-2012. Specifically, I use longitudinal data
from the Michigan Consortium for Educational Research (MCER)2 and the Education Policy
Initiative at Carolina (EPIC)3 to create state-specific cohorts of first-time third- and fifth-graders
in public elementary schools in each academic year. These data allow me to associate each
student with the school in which she spent the most time in each academic year.
The rich administrative data available in these two states include students’ subject-
specific scores on state tests (i.e., the Michigan Educational Assessment Program, MEAP; and
North Carolina’s end-of-course tests, EOCs), and socio-demographic characteristics (i.e., sex,
race and ethnicity, eligibility for free or reduced-price lunch (FARM), limited English proficient
(LEP) status, special education). Third and fifth grade tests scores are first available in the 2005-
2006 academic year. In both states, the main outcomes of interest are math and reading test
scores in grades 3 and 5. In Michigan, I am also able to study science test scores in grade 5. I
standardize test scores to have mean zero and standard deviation one within each subject-grade-
year cell, by state. This allows the reader to interpret any effects in standard deviation units and
helps adjust for any changes over time in the scaling of either state’s tests.
Since special education students take different, alternate state assessments, I exclude
them from all analytic samples. I then supplement these student-level data with information from
the Common Core of Data (CCD) on a few school-level measures: the student-teacher ratio, the
share of students in the school (in each year) eligible for free or reduced-price meals, total
enrollment, and geographic location (i.e., urban, rural, town, or suburban).
2 For more information on MCER, please see http://michiganconsortium.org/ 3 For more information on EPIC, please see http://publicpolicy.unc.edu/epic-2/
8

In order to identify the year in which a school became an IB school and started offering
the PYP, I use information provided directly from the IB Global Research Office that records the
date each school entered key phases of the process (i.e., candidate, authorized). In Michigan
(North Carolina), there are 20 schools (12 schools) that became authorized as PYP schools
largely during the time frame captured by this sample, 7 (2) that progressed only to the candidate
phase, and 13 (2) that declared formal interest in adopting the PYP in the future.
For each state, I work with two analytic samples: One contains all students in the state’s
public elementary schools. The second is restricted to students in schools that adopted the IB’s
PYP or declared an interest in adopting it during the time period captured by the data (i.e., 2006
to 2012). Each sample lends itself to a particular approach to estimating the effects of the IB PYP
on student performance.
Tables 1a (Michigan) and 1b (North Carolina) present descriptive statistics on each of
these samples. In each table, Panel A depicts the socio-demographic makeup of public
elementary schools across the entire state. Comparing panels A and B illustrates differences
between all public elementary schools in a state and the subset of elementary schools that have
(or are interested in having) the PYP. The two states are of similar size (in terms of third- and
fifth-grade student counts), but differ in their demographic constitution. Relative to Michigan,
public elementary schools in North Carolina enroll greater shares of black, Hispanic, and LEP
students. Geographically, more public elementary schools in North Carolina reside in rural areas,
compared to Michigan (i.e., 44 percent versus 24 percent). Yet, panel B in Table 1b illustrates
that 80 percent of North Carolina’s IB and IB-interested elementary schools serve students in
urban areas.
9
V. Methods
Many studies try to assess the impact of different types of schools or school-wide
programs (e.g., charter, Catholic) on student achievement. The key challenge in this literature is
selection bias: students (along with their parents) choose to attend such schools, and schools
often choose to enter particular programs – therefore, such students and schools likely differ in a
host of ways, both observed and unobserved. This same problem applies to trying to estimate the
causal impact of exposure to the school-wide PYP on student achievement. In the absence of
randomly assigning the PYP to schools (and thereby students), no estimation strategy provides
foolproof evidence of a causal impact of the PYP on student achievement. In the methods below,
I attempt to approximate this ideal situation through the careful use of quasi-experimental
methods. I adopt two analytic approaches to estimate the impact of IB’s PYP on student
achievement.
A. Method 1: School Fixed Effects
The first method relies on comparisons over time in a school’s academic performance. I
exploit variation in the timing of authorizations (i.e., when a given school began implementing
the PYP curricula) to estimate effects of the PYP on student achievement. This estimation
strategy exploits within-school variation in academic performance – comparing grade-specific
student achievement after the school adopted the PYP to before:
𝑌𝑌𝑖𝑖𝑖𝑖𝑖𝑖 = 𝛼𝛼 + 𝛽𝛽1𝑃𝑃𝑌𝑌𝑃𝑃𝑖𝑖𝑖𝑖 + 𝛽𝛽2𝑋𝑋𝑖𝑖𝑖𝑖𝑖𝑖 + 𝛼𝛼𝑖𝑖 + 𝛼𝛼𝑖𝑖 + 𝜀𝜀𝑖𝑖𝑖𝑖𝑖𝑖 (1)
where 𝑌𝑌𝑖𝑖𝑖𝑖𝑖𝑖 is the (math, reading, or science) test score of student i in school s during year t;
𝑃𝑃𝑌𝑌𝑃𝑃𝑖𝑖𝑖𝑖 is an indicator variable equal to one if school s was implementing the IB PYP curricula in
year t. 𝑋𝑋𝑖𝑖𝑖𝑖𝑖𝑖 is a vector of socio-demographic student characteristics including sex, race and
ethnicity, eligibility for free/reduced-price meals (FARM), and limited English proficiency
10
(LEP) status, and 𝜀𝜀𝑖𝑖𝑖𝑖𝑖𝑖 is a stochastic error term. I run separate models for each grade and subject
(e.g., third-grade math). In all models, I cluster standard errors at the school level.
I include school (𝛼𝛼𝑖𝑖) and year (𝛿𝛿𝑖𝑖) fixed effects to control for static, unobserved school-
level attributes that may be correlated with student achievement (and selection into the IB
program) – as well as any secular changes in test scores over time. The empirical question of
interest then becomes: How do students in a given school perform during years in which the PYP
was in effect, relative to their (observationally similar) peers in the same school during non-PYP
years (net of common trends in student performance)? In the model above, 𝛽𝛽1 represents the
average effect of the PYP on student achievement.
In model 1, the effect of the PYP on achievement is identified off of within-school
changes in students’ achievement over time. In other words, a PYP school’s comparison school
is itself in an earlier time period.
B. Method 2: Focused Comparisons of Similar Schools
The second approach to estimating the effects of PYP schools is to compare the
performance of such schools to a group of non-PYP “control schools” that look identical. While I
can measure certain attributes of public schools in Michigan and North Carolina using
information from the Common Core of Data (CCD), there is always the possibility that
unobserved characteristics of schools are what drive any PYP achievement effects, rather than
the PYP curricula and supports. In order to construct a more plausible control group of schools, I
use information from the IB Global Research Office on schools in each state that are currently in
the process of applying to become authorized PYP schools.4 The assumption is that these schools
are similar to PYP schools in unobservable ways that may cause a school to seek PYP
authorization (e.g., resources, parental involvement, teacher and principal preferences,
4 In Michigan there are 13 such elementary schools; but in North Carolina there are only two.
11
community support) and also shape student performance. In addition, I control for a set of
observable school characteristics (𝑍𝑍𝑖𝑖𝑖𝑖) that may change over time and influence student
performance. I estimate the effect of the PYP using this restricted sample of students in PYP and
“applicant” control schools and the following model:
𝑌𝑌𝑖𝑖𝑖𝑖𝑖𝑖 = 𝛼𝛼 + 𝛽𝛽1𝑃𝑃𝑌𝑌𝑃𝑃𝑖𝑖𝑖𝑖 + 𝛽𝛽2𝑋𝑋𝑖𝑖𝑖𝑖𝑖𝑖 + 𝛽𝛽3𝑍𝑍𝑖𝑖𝑖𝑖 + 𝛼𝛼𝑖𝑖 + 𝜀𝜀𝑖𝑖𝑖𝑖𝑖𝑖 (2)
In model 2, the achievement effect of the PYP is identified off of average differences in
performance between PYP and “applicant” control schools, net of year fixed effects. As in the
first approach, I run model 2 separately for each grade and subject (e.g., third-grade math) and
cluster standard errors at the school level.
In both approaches, I define the year in which treatment (i.e., the implementation of the
PYP) begins as one year prior to the official authorization date for a school (provided by IB).
Since schools must implement all components of the program for one year during their
“candidacy phase,” this is the point at which exposure to the curricula, resources, and methods of
the PYP actually begins.5
Figure 1 depicts distributions of when PYP treatment began for schools in Michigan
(panel A) and North Carolina (panel B). The vertical lines in each panel demarcate the time
period captured by the data. The variation in PYP authorizations looks quite different across the
two states. IB PYP schools in Michigan were more frequently authorized during later years
within this time frame (with a modal year of 2011), whereas the bulk of IB PYP schools in North
Carolina were authorized earlier (with a modal year of 2007). These inter-temporal differences in
5 This definition of “treatment” has an important implication for schools in each state that only progressed to the “candidate phase” during this time period (n = 9). Specifically, this approach counts the years in which these schools were candidates as part of the control group. This is likely a more conservative approach, since any positive effects of the PYP curricula on student achievement would be biased downward by the characterization of these school-by-year observations as part of the control condition. Nevertheless, when I re-estimate all results presented in Tables 2a/2b through 4a/4b including the latest year in which these schools were candidates as “treatment years,” I end up with very similar results. This is partly mechanical, since candidacy for 6 of these 9 schools (total, across both states) began in the last year of data in the sample.
12

authorization patterns across states highlight the relative strengths and weakness of each state’s
identifying variation: For a number of schools in Michigan, I observe several years of pre-PYP
data (i.e., student achievement prior to IB PYP authorization), but few post-treatment years. In
North Carolina, I observe the opposite: For many schools, I can see several years of post-
treatment achievement data, but only a couple years of pre-treatment data. Therefore, in
Michigan, the post-PYP achievement measures are likely to be relatively noisier; whereas in
North Carolina, characterizing the pre-treatment trends is more difficult. Nevertheless, in both
states there is ample variation within the time frame captured by the data in the initial year
schools offered the PYP.6
In both approaches, it is important to recognize that any treatment effects of the PYP
curricula must be interpreted as impacts on top of any direct influence the application process
may have had on student achievement. That is, leading up to candidacy, PYP schools are
organizing resources, installing a PYP director, garnering support, and making any other
necessary administrative and organizational changes to prepare to deliver the new curricula. I do
not know exact application dates for schools. Even if I did, my relatively short panel of data
would have limited capacity to parse the relative contributions of administrative changes and
curricular implementation to any average treatment effects. Nevertheless, it is important to
consider the possibility that organizational and administrative changes leading up to a school’s
candidacy may independently affect student performance. This caveat applies not only to the IB
programs, but also to any school-wide intervention or program that requires advanced planning
and preparation.
6 Since the last year of data in the state samples is 2011-2012, any schools that began offering the PYP in 2012 or later (or were authorized to offer the PYP earlier than 2006) do not contribute meaningful variation to identifying effects.
13

VI. Results
A. Average Impacts of the Primary Years Program (PYP)
Tables 2a and 2b present results for third-grade (math and reading) test scores while
Tables 3a and 3b report results for fifth grade, in Michigan and North Carolina, respectively.
Across all four tables, columns 1 through 3 illustrate how the progressive addition of various sets
of controls affects the point estimate of interest (using the sample and approach of model 1). The
estimates in column 1 are based off of a multivariate regression model that includes the treatment
indicator, year effects, and student-level covariates. Column 2 adds a modest set of school-level
covariates. Finally, column 3 presents subject-specific estimates from the preferred model: This
specification adds school fixed effects, thereby exploiting only within-school variation over time
in student performance and PYP status to estimate achievement effects. This specification
controls for static unobserved differences between PYP-adopting and non-PYP-adopting schools
expected to shape the likelihood of using the PYP as well as student performance. Column 4
presents results based on the restricted analytic sample and approach of model 2.
In the discussion that follows, I focus on estimates in each state from the preferred model
with school fixed effects (i.e., column 3). Estimates from the restricted state-specific samples and
model 2 (presented in column 4) tend to be qualitatively similar.7 In Michigan, there is evidence
that the PYP moderately boosts third-grade math achievement. Specifically, exposure to the PYP
is associated with a 0.07 standard deviation increase in third-grade math performance. On
average, I find no impact of the PYP on reading achievement in third grade. For Michigan fifth-
graders, exposure to the PYP has little impact on math, reading, or science achievement – for
better or worse. The findings in Table 3a illustrate that fifth-grade Michiganders exposed to the
7 This is especially true in Michigan, where there are many more “interested” schools (n = 13), relative to North Carolina (n = 2). This makes inferences from the second, restricted sample approach more tenuous for North Carolina since the “control” group in this restricted sample includes just two schools.
14

PYP perform about the same as their counterparts not exposed to the program’s curricula,
resources, and culture.
In North Carolina, a different story emerges from the findings in Tables 2b and 3b.
Exposure to the PYP appears to negatively affect mathematics performance, for students in both
third and fifth grade. On average, the PYP decreases third- and fifth-grade math performance by
about 0.10 standard deviations. In North Carolina, estimates for the impact of the PYP on
reading performance are noisy, but point to no detectable effects in neither third nor fifth grade.
B. Heterogeneous Impacts of the PYP by Gender and Economic Disadvantage
Tables 4a and 4b explore heterogeneous effects of exposure to the PYP by student gender
and poverty status (i.e., eligibility for free or reduced-price meals, FARM) in Michigan and
North Carolina. These tables present estimates from the preferred school fixed effects model
(i.e., the specification represented by column 3 in Tables 2a/2b and 3a/3b). Across the various
subgroup point estimates in Table 4, one common finding emerges: In both Michigan and North
Carolina, exposure to the PYP increases the reading performance of economically disadvantaged
third-grade students (i.e., students eligible for free or reduced-price meals). The magnitude of
this achievement bump is about 0.13 standard deviations in Michigan and 0.10 standard
deviations in North Carolina. In neither case do corresponding estimates suggest that these gains
come at the expense of non-FARM students.
In Michigan, the signs and pattern of coefficients in Table 4a provide suggestive evidence
that the PYP may benefit female and FARM students more than male and non-FARM students.
For example, column 5 finds that female students exposed to the PYP in Michigan perform about
0.07 standard deviations higher on fifth-grade science tests, compared to their female
counterparts not exposed to the PYP curricula. Yet, many of these pairwise differences (i.e.,
15

male versus female effect of PYP for third-grade math) are not statistically different; therefore
the reader should over-interpret patterns of results across grades, subjects, and subgroups. In
contrast, Table 4b more clearly demonstrates that the overall negative impacts of the PYP on
third- and fifth-grade math performance in North Carolina are driven by large, negative effects of
the PYP on boys’ math achievement (of between -0.11 and -0.17 standard deviations).
C. Can Teacher Turnover Explain Findings in North Carolina?
Recent dismay at the rising rate of teacher turnover in North Carolina (e.g., Klein, 2013;
Bonner & Hui, 2014) points to one mechanism that could underlie the negative math impacts of
the PYP: If adoption of the PYP lead to (or coincided with) higher rates of teacher turnover, the
negative impacts of the PYP may operate through such teacher churning. In a difficult policy
climate around public education, it is quite plausible that the adoption of a new, multi-faceted,
school-level program could spur additional teacher flight. The best and most recent evidence
linking teacher turnover and student performance finds that a one standard deviation increase in
teacher turnover corresponds to a decline in math achievement of about 2 percent of a standard
deviation (Ronfeldt et al., 2013, p. 18).
To explore this hypothesis, I exploit the fact that North Carolina’s administrative data allow
me to link individual teachers to the school (and grade) in which they taught in a given year.8
There are two (related) concerns at work: Frist, a new, large, program that demands much from
teachers may increase turnover. Second, the short-run implementation of a new program may be
comprised in schools with large shares of new teachers (who are trying to juggle many other new
responsibilities in addition to the program), thereby depressing achievement. Therefore, I create
variables that measure the share of teachers in a specific grade (i.e., grades 3 and 5) who are new
8 This is not true of Michigan’s student-level longitudinal database until the 2010-2011 year (i.e., the penultimate year of my panel).
16

to a school in each year.9 I first use these variables as outcomes and estimate the same school
fixed effects specification as above. Next, I use these variables as covariates and examine if (and
to what degree) the coefficient of interest (on “PYP”) changes as I control for variation in the
share of new teachers over time.
Table 5 presents these results. I focus on math achievement (in grades 3 and 5) since this is
the subject area with the clearest findings for North Carolina. In columns 1 and 4, I directly test
the impact of the PYP on teacher turnover. In both cases, I find no evidence that the PYP led to
increases in the share of new teachers in a school (by grade): both coefficients are small,
negative,10 and statistically insignificant. Columns 2 and 5 reproduce the preferred estimates
(from earlier tables) of the impact of PYP on third- and fifth-grade math performance,
respectively. Then, in columns 3 and 6, I control for teacher turnover and observe (as expected
given the results on columns 1 and 4), very little reduction in the negative impact of the PYP on
math performance. I conclude that teacher turnover cannot explain the negative impacts of the
PYP on the math performance of elementary school students in North Carolina.
Interestingly, my estimates of the impact of teacher turnover (using the grade-specific share
of new teachers in a given school and year to measure this phenomenon) closely mirror those of
Ronfeldt and colleagues (2013). I find that an increase in the share of new teachers in a school
from 0 to 100 percent is associated with a decline in third-grade math performance of about 0.09
standard deviations. This implies that a one standard deviation increase in teacher turnover
9 There are several ways one could operationalize the construct of interest: teacher turnover. Ronfeldt and colleagues (2013) examine the achievement impacts of two different measures of teacher turnover: a) the proportion of teachers in a given grade level in year t-1 who left the school by year t; and b) the proportion of teachers in a given grade level who are new (movers or first-year teachers) to the school in year t (pp. 10-11). They find very similar performance impacts regardless of the measure used. Therefore, I adopt the latter, the share of new teachers in a school and year. I am most concerned with the capacity for teacher shuffling to affect implementation of the school-wide program. This version of teacher turnover closely tracks this concern. 10 This is qualitatively consistent with the notion that the IB requires evidence of community and teacher buy-in for authorization.
17

translates into a decrease in math performance among third-graders of about 0.02 standard
deviations (which the same as the estimate in Ronfeldt et al. (2013) based on fourth- and fifth-
grade students in New York City schools). This further affirms that, even though teacher
turnover itself has a statistically significant, negative impact on student achievement (in my
analytic sample), it does not explain the negative effects of the PYP on third- and fifth-grade
math performance in North Carolina.
VII. Concluding Discussion and Future Research
Overall, these analyses paint somewhat different pictures of the performance impacts of
the PYP in Michigan versus North Carolina. The one common finding is that exposure to the
PYP appears to increase the reading performance of economically disadvantaged third-graders in
both states (by about one-tenth of a standard deviation), with little countervailing evidence of
negative impacts on other students. These effects occur during a time in which other NCLB-
induced interventions going on in schools may have had their own, concurrent impacts on
achievement. Yet, the best evidence on NCLB finds no effects on reading performance (Dee &
Jacob, 2011). In light of the persistent proclivity of research on educational interventions and
curricula to find effects on math performance but not reading performance, this particular finding
should become a specific (confirmatory) hypothesis for future research on the PYP.
This paper arrives at different conclusions about the effects of the PYP on students’
mathematics performance, depending on the state: In Michigan, estimates suggest that fifth-
graders perform about the same as their non-PYP counterparts, and third-graders exposed to the
PYP perform about 0.07 standard deviations better. Yet, in North Carolina, I find negative
effects of the PYP on third- and fifth-grade math performance, especially among boys. I test one
compelling mechanism through which these negative effects may have come about: teacher
18
turnover. Yet, I find no evidence to support the notion that the PYP generated increased in
teacher turnover and depressed student performance in North Carolina. The data currently
available cannot further sort out the underlying mechanisms potentially responsible for these
divergent conclusions. It will be important for future research to examine why the PYP might
affect the math achievement of similarly-aged children differently in different states. Candidate
reasons include variation in the content of state tests versus what is covered in the PYP math
curriculum, implementation differences, variation in teacher quality, differences in students
served by IB schools in each state,11 and differing pedagogical foci across states based on the
same, common PYP curriculum.
As one way to contextualize the size of these (positive and negative) effects, we can look
to recent experimental evidence on the effects of attending a charter school (specifically, a
Knowledge is Power Program (KIPP) school enrolling students in grades 5 through 8). Angrist et
al. (2010) find average achievement gains of 0.36 standard deviations in math and 0.12 standard
deviations in reading for each year a student spends in the KIPP school. These effects are most
pronounced for low-achieving students. By this benchmark, the effects (both positive and
negative) of the IB PYP are small to moderate. A second way is to compare these effects to the
effects of other types of educational interventions. For example, the impact of the PYP on
FARM students’ third-grade reading performance is roughly comparable in magnitude to the
effect on student performance of adding 10 additional instructional days to the school year and to
11 The descriptive statistics in Tables 1a and 1b give some credence to this potential explanation: In Michigan, when moving from a sample that includes all public elementary schools to a sample that only includes IB and IB-interested public elementary schools, the school-level (i.e., not grade-level) share of FARM students falls by 11 percentage points (i.e., from 0.43 to 0.32). In North Carolina, the opposite occurs: The share of FARM students increases by 7 percentage points (from 0.56 to 0.63). These figures illustrate that North Carolina elementary schools serve a more disadvantaged population of students, relative to Michigan – and that this contrast is only amplified among schools offering (or interested in offering) the IB PYP in each state.
19
a one standard deviation increase in teacher effectiveness (Marcotte & Hansen, 2010; Rockoff,
2004).
While the school fixed effects approach adopted here improves substantially upon extant
literature that tries to assess the achievement effects of IB’s PYP, it still suffers from important
limitations that warrant caution in the causal interpretation of its estimates. Most importantly, if
there exist other unobservable characteristics of schools that differentially changed across PYP
and non-PYP schools, coincided with the adoption of the PYP curricula (and persisted), and
affect achievement, these changes could bias the estimates of PYP achievement effects reported
here. Since schools adopted the PYP at different times, such a factor is difficult to imagine. Yet,
for this reason, we must interpret such effects with appropriate caution.
Future work on the achievement impacts of IB’s PYP will focus on a subset of IB schools
that have operated admission lotteries due to over-subscription. These lottery data will allow
researchers to compare subsequent outcomes of students randomly offered a slot in an IB school
to those not offered a seat. Since the offer of admission is randomly assigned, estimates from this
design are comparable to an experiment and can be more confidently interpreted as causal.
Taken together, this work will allow researchers and policymakers to better understand the
effects of IB’s programs on the academic performance of students in different states and clarify
the degree to which quasi-experimental results mirror results from randomized settings.
20

References
Ahn, T., & Vigdor, J. (2014). The impact of No Child Left Behind’s accountability sanctions on school performance: Regression discontinuity evidence from North Carolina. NBER Working Paper Series, No. 20511. Access: http://www.nber.org/papers/w20511
Anderson, M. L. (2008). Multiple inference and gender differences in the effects of early
intervention: A reevaluation of the Abecedarian, Perry Preschool, and Early Training projects. Journal of the American Statistical Association, 103, 1481-1495.
Angrist, J. D., Dynarski, S. M., Kane, T. J., Pathak, PA., & Walters, C. R. (2010). Inputs and
impacts in charter schools: KIPP Lynn. American Economic Review, 100(2), 239-243. Bonner, L., & Hui, T. K. (2014, October 30). NC teacher turnover rate dips slightly, though more
leave for out-of-state jobs. News & Observer, Local/State, Education. Access: http://www.newsobserver.com/2014/10/30/4279054/teacher-turnover-rate-dips-slightly.html
Bifulco, R., Duncombe, W., & Yinger, J. (2005). Does whole-school reform boost student
performance? The case of New York City. Journal of Policy Analysis and Management, 24(1), 47-72.
Center on Education Policy (2013). States’ perspectives on Waivers: Relief from NCLB, concern
about long-term solutions. George Washington University: Washington, DC. Access: http://www.cep-dc.org/displayDocument.cfm?DocumentID=418
Dee, T., & Jacob, B. (2011). The impact of No Child Left Behind on student achievement.
Journal of Policy Analysis and Management, 30(3), 418-446. Frank, J. (2009). The Impact of the Primary Years Program of the International Baccalaureate
Organization on the English Language Arts State Test Scores of Third, Fourth, and Fifth Grade Students in South Carolina. (Doctoral dissertation). Retrieved from: http://www.eric.ed.gov/ERICIbPortal/search/detailmini.jsp?_nfpb=true&_&ERICExtSearch_SearchValue_0=ED527071&ERICExtSearch_SearchType_0=no&accno=ED527071
Hall J., Elder, T., et al. (2009). The primary years programme field study. Education Policy and
Evaluation Center, University of Georgia. Access: http://www.ibo.org/research/policy/programmevalidation/pyp/documents/PYPFieldStudy2009.pdf
Hemelt, S.W., Roth, K. B., & Eaton, W. W. Elementary school interventions: Experimental
evidence on postsecondary outcomes. Educational Evaluation and Policy Analysis, 35(4), 413-436.
21

Hemelt, S. W. (2011). Performance effects of failure to make Adequate Yearly Progress (AYP): Evidence from a regression discontinuity framework. Economics of Education Review, 30(4), 702-723.
International Baccalaureate (2012). Developing a transdisciplinary programme of inquiry. IB:
Cardiff, Wales (UK). International Baccalaureate (2010). Guide to school authorization: Primary Years Programme.
IB: Cardiff, Wales (UK). International Baccalaureate (2009). The primary years programme: A basis for practice. IB:
Cardiff, Wales (UK). International Baccalaureate (2008). Exhibition guidelines. IB: Cardiff, Wales (UK). Klein, R. (2013, December 5). Fears of mass teacher exodus stirred by new North Carolina
report. The Huffington Post, Politics. Access: http://www.huffingtonpost.com/2013/12/05/north-carolina-teacher-turnover_n_4393603.html
Marcotte, D. E., & Hansen, B. (2010). Time for school? Education Next, 10(1), 52-59. Rockoff, J. E. (2004). The impact of individual teachers on student achievement: Evidence from
panel data. American Economic Review, 94(2), 247-252 Sillisano, J. R., et. al. (2010). Evaluation of International Baccalaureate Programmes in Texas
schools. College Station, Texas: State of Texas Education Research Center. Access: http://www.ibo.org/research/policy/programmevalidation/pyp/documents/EvaluationofIBProgramsinTexasSchools2010.pdf
Springer, M. (2008). The influence of an NCLB accountability plan on the distribution of student
test score gains. Economics of Education Review, 27(5), 556-563. West, M., & Peterson, P. (2006). The efficacy of choice threats within school accountability
systems: Results from legislatively induced experiments. The Economic Journal, 116(510), C46-C62.
22

Figure 1. Distribution of Initial Year of PYP Treatment Status A. Michigan
B. North Carolina
Notes: Figure displays counts of schools according to the (spring of the) year prior to when the school became officially authorized to offer the IB’s PYP. This is the first year of “treatment” since schools must pilot the full PYP for one year prior to receiving final authorization. As of 2013, there were 20 (12) IB elementary schools offering the PYP in Michigan (North Carolina).
02
46
8N
umbe
r of S
choo
ls
2003 2005 2007 2009 2011 2013 2015Year
01
23
45
Num
ber o
f Sch
ools
2003 2005 2007 2009 2011 2013 2015Year

Table 1a. Descriptive Statistics by Sample: Michigan
A. Students in All Michigan Public Elementary Schools
Variable Mean Standard Deviation Mean Standard
DeviationStudent characteristicsFemale 0.52 0.50 0.52 0.50Black 0.19 0.39 0.19 0.39Hispanic 0.06 0.24 0.06 0.23White 0.70 0.46 0.71 0.45Other 0.05 0.23 0.05 0.22FARM 0.46 0.50 0.44 0.50LEP 0.06 0.23 0.04 0.20
School characteristicsStudent-teacher ratio 19.05 23.80 18.95 22.05Enrollment 443.88 159.40 465.78 181.31Share of FARM students 0.43 0.27 0.43 0.27Urbanicity City 0.25 0.44 0.24 0.43 Suburb 0.41 0.49 0.42 0.49 Town 0.10 0.30 0.11 0.31 Rural 0.24 0.42 0.23 0.42
N(students) for mathN(students) for reading
B. Students in Michigan IB PYP Schools and PYP-Interested Schools
Variable Mean Standard Deviation Mean Standard
DeviationStudent characteristicsFemale 0.53 0.50 0.52 0.50Black 0.14 0.34 0.16 0.37Hispanic 0.05 0.23 0.05 0.23White 0.73 0.44 0.70 0.46Other 0.08 0.27 0.08 0.28FARM 0.36 0.48 0.39 0.49LEP 0.11 0.31 0.11 0.31
School characteristicsStudent-teacher ratio 18.23 2.94 18.23 2.97Enrollment 464.47 207.03 473.92 229.10Share of FARM students 0.32 0.28 0.32 0.28Urbanicity City 0.24 0.42 0.30 0.46 Suburb 0.57 0.50 0.49 0.50 Town 0.08 0.27 0.07 0.25 Rural 0.11 0.32 0.15 0.35
N(students) for mathN(students) for reading
13,95413,908
10,73010,695
672,866
Grade 3 Grade 5
Grade 3 Grade 5
674,091 690,413689,091
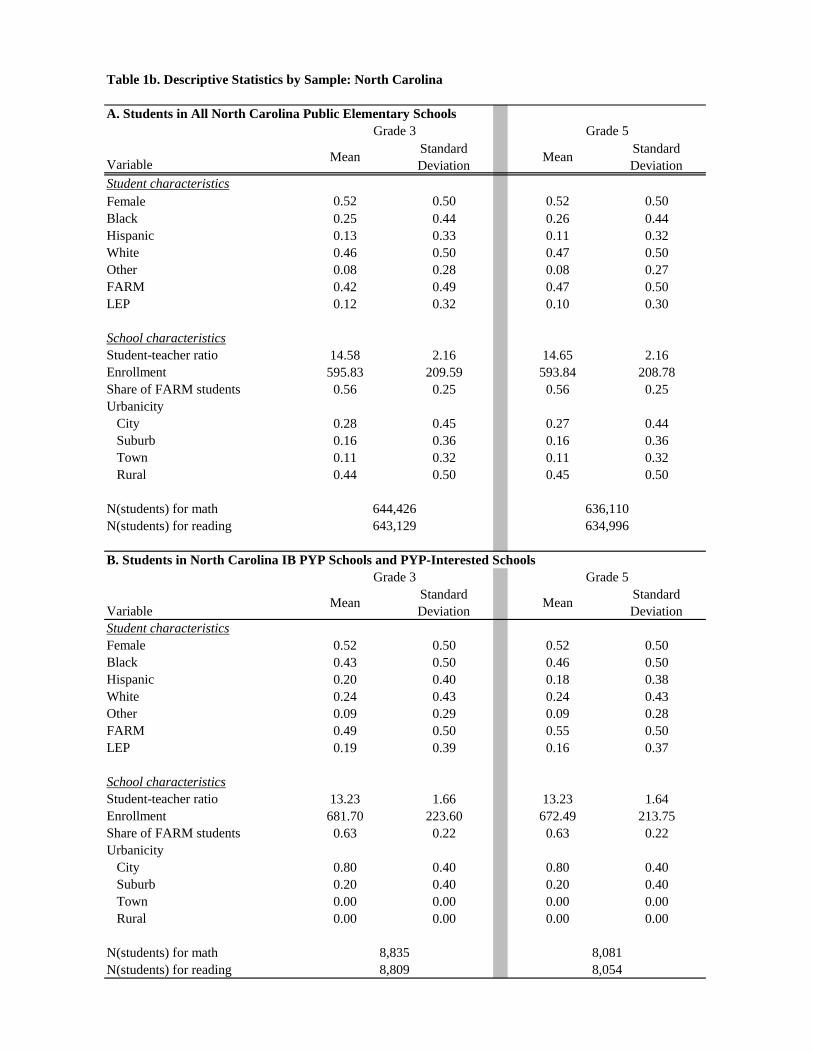
Table 1b. Descriptive Statistics by Sample: North Carolina
A. Students in All North Carolina Public Elementary Schools
Variable Mean Standard Deviation Mean Standard
DeviationStudent characteristicsFemale 0.52 0.50 0.52 0.50Black 0.25 0.44 0.26 0.44Hispanic 0.13 0.33 0.11 0.32White 0.46 0.50 0.47 0.50Other 0.08 0.28 0.08 0.27FARM 0.42 0.49 0.47 0.50LEP 0.12 0.32 0.10 0.30
School characteristicsStudent-teacher ratio 14.58 2.16 14.65 2.16Enrollment 595.83 209.59 593.84 208.78Share of FARM students 0.56 0.25 0.56 0.25Urbanicity City 0.28 0.45 0.27 0.44 Suburb 0.16 0.36 0.16 0.36 Town 0.11 0.32 0.11 0.32 Rural 0.44 0.50 0.45 0.50
N(students) for mathN(students) for reading
B. Students in North Carolina IB PYP Schools and PYP-Interested Schools
Variable Mean Standard Deviation Mean Standard
DeviationStudent characteristicsFemale 0.52 0.50 0.52 0.50Black 0.43 0.50 0.46 0.50Hispanic 0.20 0.40 0.18 0.38White 0.24 0.43 0.24 0.43Other 0.09 0.29 0.09 0.28FARM 0.49 0.50 0.55 0.50LEP 0.19 0.39 0.16 0.37
School characteristicsStudent-teacher ratio 13.23 1.66 13.23 1.64Enrollment 681.70 223.60 672.49 213.75Share of FARM students 0.63 0.22 0.63 0.22Urbanicity City 0.80 0.40 0.80 0.40 Suburb 0.20 0.40 0.20 0.40 Town 0.00 0.00 0.00 0.00 Rural 0.00 0.00 0.00 0.00
N(students) for mathN(students) for reading
8,8358,809
8,0818,054
643,129
Grade 3 Grade 5
Grade 3 Grade 5
644,426 636,110634,996

Table 2a. Impacts of IB's Primary Years Program (PYP) on Student Performance: Michigan, Grade 3
Subject (1) (2) (3) (4)A. MathematicsStandardized math score (grade 3) 0.222*** 0.112** 0.067** 0.176**
(0.061) (0.048) (0.033) (0.075)
Controls:Include student-level controls? Yes Yes Yes YesInclude school-level controls? No Yes Yes YesInclude school fixed effects? No No Yes No
Sample:Students in all MI public schools X X X (n = 674,175)Students in IB and IB-interested schools X (n = 13,958)
B. ReadingStandardized reading score (grade 3) 0.131** 0.052 0.051 0.055
(0.054) (0.052) (0.037) (0.051)
Controls:Include student-level controls? Yes Yes Yes YesInclude school-level controls? No Yes Yes YesInclude school fixed effects? No No Yes No
Sample:Students in all MI public schools X X X (n = 672,951)Students in IB and IB-interested schools X (n = 13,912)
Notes: Each cell reports the coefficient on indicator for "PYP." Test scores are standardized to have mean zero and standard deviation one within a subject-grade-year in Michigan. All models include year effects. Student-level controls include race, ethnicity, gender, eligibility for free or reduced-price meals (FARM) and limited English proficiency (LEP). School-level controls include enrollment, student-teacher ratio, share of students in a school who are eligible for free or reduced-price meals, and urbanicity. All models include dummy variables for students (schools) with missing covariate information. Sample sizes are in numbers of students. Robust standard errors clustered at the school level appear in parentheses: *** p<0.01, ** p<0.05, * p<0.1.
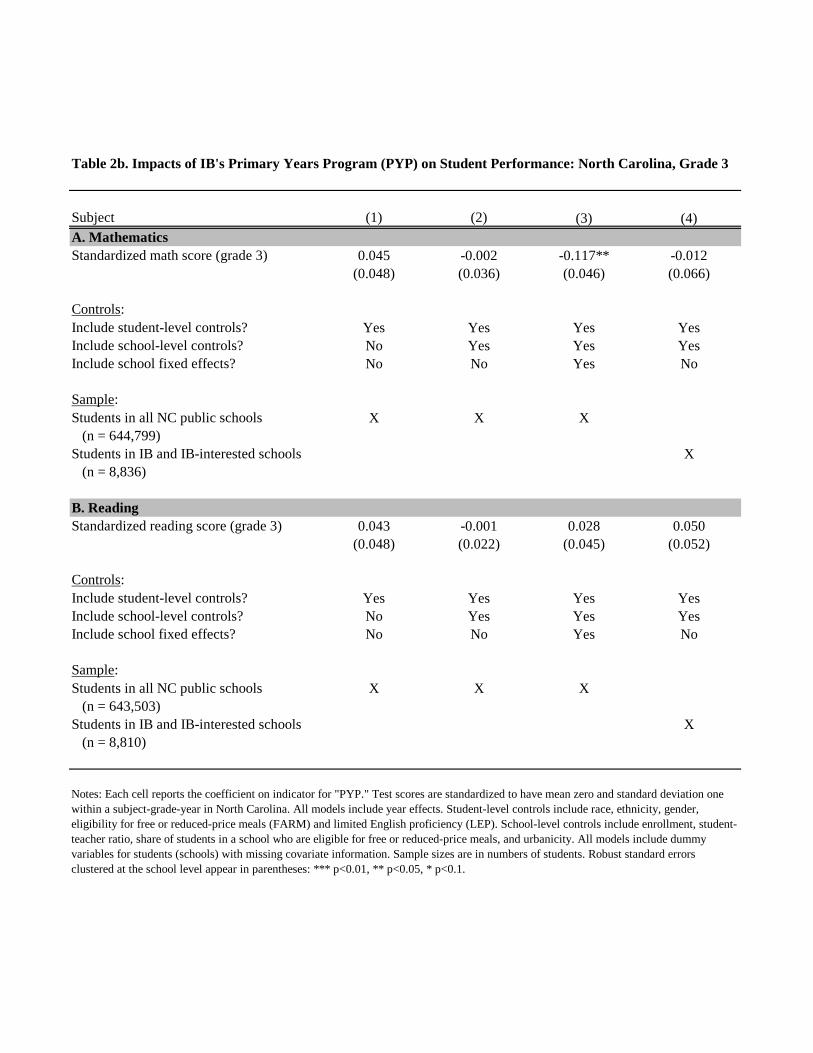
Table 2b. Impacts of IB's Primary Years Program (PYP) on Student Performance: North Carolina, Grade 3
Subject (1) (2) (3) (4)A. MathematicsStandardized math score (grade 3) 0.045 -0.002 -0.117** -0.012
(0.048) (0.036) (0.046) (0.066)
Controls:Include student-level controls? Yes Yes Yes YesInclude school-level controls? No Yes Yes YesInclude school fixed effects? No No Yes No
Sample:Students in all NC public schools X X X (n = 644,799)Students in IB and IB-interested schools X (n = 8,836)
B. ReadingStandardized reading score (grade 3) 0.043 -0.001 0.028 0.050
(0.048) (0.022) (0.045) (0.052)
Controls:Include student-level controls? Yes Yes Yes YesInclude school-level controls? No Yes Yes YesInclude school fixed effects? No No Yes No
Sample:Students in all NC public schools X X X (n = 643,503)Students in IB and IB-interested schools X (n = 8,810)
Notes: Each cell reports the coefficient on indicator for "PYP." Test scores are standardized to have mean zero and standard deviation one within a subject-grade-year in North Carolina. All models include year effects. Student-level controls include race, ethnicity, gender, eligibility for free or reduced-price meals (FARM) and limited English proficiency (LEP). School-level controls include enrollment, student-teacher ratio, share of students in a school who are eligible for free or reduced-price meals, and urbanicity. All models include dummy variables for students (schools) with missing covariate information. Sample sizes are in numbers of students. Robust standard errors clustered at the school level appear in parentheses: *** p<0.01, ** p<0.05, * p<0.1.

Table 3a. Impacts of IB's Primary Years Program (PYP) on Student Performance: Michigan, Grade 5
Subject (1) (2) (3) (4)A. MathematicsStandardized math score (grade 5) 0.171** 0.030 0.020 0.003
(0.073) (0.064) (0.078) (0.087)
Controls:Include student-level controls? Yes Yes Yes YesInclude school-level controls? No Yes Yes YesInclude school fixed effects? No No Yes No
Sample:Students in all MI public schools X X X (n = 690,487)Students in IB and IB-interested schools X (n = 10,733)
B. ReadingStandardized reading score (grade 5) 0.158*** 0.050 -0.013 -0.018
(0.047) (0.042) (0.033) (0.047)
Controls:Include student-level controls? Yes Yes Yes YesInclude school-level controls? No Yes Yes YesInclude school fixed effects? No No Yes No
Sample:Students in all MI public schools X X X (n = 689,164)Students in IB and IB-interested schools X (n = 10,698)
C. ScienceStandardized science score (grade 5) 0.099** 0.003 0.010 -0.007
(0.042) (0.041) (0.032) (0.055)
Controls:Include school fixed effects? No No Yes NoInclude student-level controls? No Yes No YesInclude school-level controls? No No No Yes
Sample:Students in all MI public schools X X X (n = 688,087)Students in IB and IB-interested schools X (n = 10,695)
Notes: Each cell reports the coefficient on indicator for "PYP." Test scores are standardized to have mean zero and standard deviation one within a subject-grade-year in Michigan. All models include year effects. Student-level controls include race, ethnicity, gender, eligibility for free or reduced-price meals (FARM) and limited English proficiency (LEP). School-level controls include enrollment, student-teacher ratio, share of students in a school who are eligible for free or reduced-price meals, and urbanicity. All models include dummy variables for students (schools) with missing covariate information. Sample sizes are in numbers of students. Robust standard errors clustered at the school level appear in parentheses: *** p<0.01, ** p<0.05, * p<0.1.

Table 3b. Impacts of IB's Primary Years Program (PYP) on Student Performance: North Carolina, Grade 5
Subject (1) (2) (3) (4)A. MathematicsStandardized math score (grade 5) 0.043 -0.054* -0.097* -0.005
(0.033) (0.030) (0.058) (0.059)
Controls:Include student-level controls? Yes Yes Yes YesInclude school-level controls? No Yes Yes YesInclude school fixed effects? No No Yes No
Sample:Students in all NC public schools X X X (n = 636,676)Students in IB and IB-interested schools X (n = 8,083)
B. ReadingStandardized reading score (grade 5) 0.075 -0.002 -0.035 0.057
(0.056) (0.030) (0.055) (0.067)
Controls:Include student-level controls? Yes Yes Yes YesInclude school-level controls? No Yes Yes YesInclude school fixed effects? No No Yes No
Sample:Students in all NC public schools X X X (n = 635,546)Students in IB and IB-interested schools X (n = 8,056)
Notes: Each cell reports the coefficient on indicator for "PYP." Test scores are standardized to have mean zero and standard deviation one within a subject-grade-year in North Carolina. All models include year effects. Student-level controls include race, ethnicity, gender, eligibility for free or reduced-price meals (FARM) and limited English proficiency (LEP). School-level controls include enrollment, student-teacher ratio, share of students in a school who are eligible for free or reduced-price meals, and urbanicity. All models include dummy variables for students (schools) with missing covariate information. Sample sizes are in numbers of students. Robust standard errors clustered at the school level appear in parentheses: *** p<0.01, ** p<0.05, * p<0.1.

3rd Grade Math Score
3rd Grade Reading Score
5th Grade Math Score
5th Grade Reading Score
5th Grade Science Score
Subgroup (1) (2) (3) (4) (5)A. GenderFemale 0.077** 0.063 0.067 0.032 0.071*
(0.032) (0.039) (0.068) (0.043) (0.043)
Male 0.047 0.032 -0.035 -0.062 -0.058(0.049) (0.056) (0.101) (0.043) (0.038)
B. Free and Reduced-Price Meals (FARM) statusFARM 0.063 0.129*** 0.087 0.003 -0.011
(0.039) (0.034) (0.066) (0.055) (0.031)
Non-FARM 0.056 -0.001 -0.029 -0.038 0.005(0.041) (0.041) (0.096) (0.043) (0.044)
Notes: Each cell reports the coefficient on indicator for "PYP." The underlying analytic sample from which all subgroup samples are cut includes all students in Michigan public elementary schools. Test scores are standardized to have mean zero and standard deviation one within a subject-grade-year in Michigan. All models include school fixed effects, year effects, student-level controls, and school-level controls. Student-level controls include race, ethnicity, gender, eligibility for free or reduced-price meals (FARM) and limited English proficiency (LEP). School-level controls include enrollment, student-teacher ratio, share of students in a school who are eligible for free or reduced-price meals, and urbanicity. All models include dummy variables for students (schools) with missing covariate information. Sample sizes are in numbers of students. Robust standard errors clustered at the school level appear in parentheses: *** p<0.01, ** p<0.05, * p<0.1.
Table 4a. Heterogeneous Impacts of IB's Primary Years Program (PYP) on Student Performance by Gender and Economic Disadvantage: Michigan

3rd Grade Math Score
3rd Grade Reading Score
5th Grade Math Score
5th Grade Reading Score
Subgroup (1) (2) (3) (4)A. GenderFemale -0.060 0.049 -0.088 -0.009
(0.059) (0.064) (0.089) (0.078)
Male -0.172*** 0.004 -0.107*** -0.065(0.048) (0.053) (0.041) (0.048)
B. Free and Reduced-Price Meals (FARM) statusFARM -0.057 0.098** -0.108* -0.028
(0.062) (0.048) (0.063) (0.078)
Non-FARM -0.105 0.048 -0.078 -0.029(0.067) (0.066) (0.063) (0.051)
Notes: Each cell reports the coefficient on indicator for "PYP." The underlying analytic sample from which all subgroup samples are cut includes all students in North Carolina public elementary schools. Test scores are standardized to have mean zero and standard deviation one within a subject-grade-year in North Carolina. All models include school fixed effects, year effects, student-level controls, and school-level controls. Student-level controls include race, ethnicity, gender, eligibility for free or reduced-price meals (FARM) and limited English proficiency (LEP). School-level controls include enrollment, student-teacher ratio, share of students in a school who are eligible for free or reduced-price meals, and urbanicity. All models include dummy variables for students (schools) with missing covariate information. Sample sizes are in numbers of students. Robust standard errors clustered at the school level appear in parentheses: *** p<0.01, ** p<0.05, * p<0.1.
Table 4b. Heterogeneous Impacts of IB's Primary Years Program (PYP) on Student Performance by Gender and Economic Disadvantage: North Carolina

Table 5. Can Teacher Turnover Explain Negative PYP Impacts in North Carolina?
Share of New Teachers
Standardized Math Score
Standardized Math Score
Share of New Teachers
Standardized Math Score
Standardized Math Score
(1) (2) (3) (4) (5) (6)PYP -0.015 -0.117** -0.113** -0.015 -0.097* -0.095*
(0.024) (0.046) (0.047) (0.015) (0.058) (0.057)Share of new teachers -0.089*** -0.084***
(0.012) (0.011)
Outcome mean 0.24 0.26
Grade 3 Grade 5
Notes: Columns 2 and 5 display results from the preferred specification (i.e., from column 3 in Tables 2b and 3b). Share of new teachers is calculated as the proportion of teachers in a given grade level who are new (movers or first-year teachers) to the school in year t. Robust standard errors clustered at the school level appear in parentheses: *** p<0.01, ** p<0.05, * p<0.1.