Embed Size (px)
Citation preview
Carnegie Mellon UniversityResearch Showcase @ CMU
Heinz College Research Heinz College
10-2011
The Impact of Jury Race in Criminal TrialsShamena AnwarCarnegie Mellon University, [email protected]
Patrick BayerDuke University
Randi HjalmarssonUniversity of London
Follow this and additional works at: http://repository.cmu.edu/heinzworks
Part of the Databases and Information Systems Commons, and the Public Policy Commons
This Article is brought to you for free and open access by the Heinz College at Research Showcase @ CMU. It has been accepted for inclusion in HeinzCollege Research by an authorized administrator of Research Showcase @ CMU. For more information, please contact [email protected].
Published InQuarterly Journal of Economics, 127, 2, 1017-1055.
THE IMPACT OF JURY RACE IN CRIMINAL TRIALS*
SHAMENA ANWAR
PATRICK BAYER
RANDI HJALMARSSON
October 2011
Abstract
This paper examines the impact of jury racial composition on trial outcomes using a data
set of felony trials in Florida between 2000 and 2010. We utilize a research design that exploits day-to-day variation in the composition of the jury pool to isolate quasi-random
variation in the composition of the seated jury, finding evidence that: (i) juries formed
from all-white jury pools convict black defendants significantly (16 percentage points)
more often than white defendants and (ii) this gap in conviction rates is entirely eliminated when the jury pool includes at least one black member. The impact of jury
race is much greater than what a simple correlation of the race of the seated jury and
conviction rates would suggest. These findings imply that the application of justice is highly uneven and raise obvious concerns about the fairness of trials in jurisdictions with
a small proportion of blacks in the jury pool.
!!!!!!!!!!!!!!!!!!!!!!!!!!!!!!!!!!!!!!!!!!!!!!!!!!!!!!!!!!!!!* We thank Peter Arcidiacono, Dan Black, Marcus Casey, Jane Cooley, Kerwin Charles, Jonah Gelbach, Larry Katz,
John Kennan, Derek Neal, Jeremy Stein, Chris Taber, Christopher Winship and seminar participants at Carnegie
Mellon, Chicago, Columbia, Duke, Rochester, Syracuse, Wisconsin and the NBER Summer Institute and five
anonymous referees for many helpful comments and suggestions on earlier drafts of this paper. Corresponding
author: Patrick Bayer, Department of Economics, Duke University, 213 Social Sciences Building, Box 90097,
Durham, NC 27708 USA, Tel: (919) 660-1815, Email: [email protected], Fax: 919-684-8974.
!
! 1!
I. INTRODUCTION
The Sixth Amendment to the U.S. Constitution establishes the right of a defendant charged with a
crime to a trial by an impartial jury.1 Yet the history of American criminal justice is replete with cases
where the abstract promise of jury impartiality has been called into question. Of special concern are
settings where a minority member of a population is tried in a location in which few, if any, members of
the same minority are likely to serve on the jury.2 This concern has arisen repeatedly in the context of
race, as blacks generally constitute a small fraction of the population, and therefore seated juries, in the
majority of U.S. states and counties. Vastly unequal outcomes – the proportion of blacks in the prison
population is almost four times that in the general population – along with anecdotal evidence from many
cases have led numerous observers to question whether the criminal justice system treats black defendants
(and victims) fairly.
The empirical evaluation of the effect of jury composition on trial outcomes is fraught with
difficulties. Studies based on experimental evidence from “mock” trials are limited by numerous
simplifications made for experimental expediency and, more fundamentally, by the substantially lower
stakes compared to real criminal trials.3 And, the few studies that examine the correlation between the
composition of the seated jury and trial outcomes are problematic because the seated jury results from a
non-random selection process.4 In particular, in the vast majority of criminal trials in the United States,
prosecution and defense attorneys are able to exclude a sizeable number of potential jurors in the jury
pool from the seated jury without explanation through the use of peremptory challenges. As a result, even
!!!!!!!!!!!!!!!!!!!!!!!!!!!!!!!!!!!!!!!!!!!!!!!!!!!!!!!!!!!!!1 The 6th Amendment states that “In all criminal prosecutions, the accused shall enjoy the right to a speedy and
public trial, by an impartial jury of the State and district wherein the crime shall have been committed;”!2 Sommers and Ellsworth (2003) highlight some of the higher profile cases where there have been questions about
the role of race in jury decisions. !3 For instance, mock jurors typically hear a substantially condensed version of a case, i.e. a one-page write-up, do
not see a “defendant”, and decide the verdict individually rather than coming to a unanimous decision as a group. In
addition, they are rarely representative of the population and are actually often white college students. Sommers
(2007) provides a recent review of this literature. He highlights (i) the fact that the findings are mixed and (ii) that
there is little research that looks at whether black and white jurors are differentially affected by juror’s race (two exceptions are Bernard [1979] and Skolnick and Shaw [1997]).!4 See Bowers , Steiner and Sandys (2001), who look at capital trials, and Daudistel et al (1999), who look at non-
felony trials. Also of note, Lee (2009) finds evidence that states that switched from key-man jury selection
procedures to more random selection procedures, which were meant to increase black representation on juries, saw a
resulting drop in the share of non-whites among new admissions to prison.!
! 2!
if the initial jury pool is randomly drawn, the composition of the seated jury may be correlated with the
nature of the charges and evidence in the case as well as the attributes of the defendant.
Given the limitations of the existing literature, the main goal of this paper is to provide the first
empirical evidence of the effects of jury composition on trial outcomes based on quasi-random variation
in jury composition and data from real criminal trials.5 We do so by combining a data set that provides
information on both the seated jury and jury pool for each trial with a research design that seeks to isolate
a random source of variation in jury composition. Our data set consists of all felony trials for which jury
selection began in Sarasota and Lake Counties, Florida during 5.5- and 10-year periods, respectively, in
the 2000s. The data are unusually rich in providing information on the age, race, and gender not only for
each of the 6 – 7 members of the seated jury but also for the approximately 27 members of the jury pool
for the trial from which the seated jury is selected. The data set also contains detailed information about
the race and gender of the defendant, the criminal charge(s), and the final jury verdict.
Our research design exploits the variation in the composition of the jury pool across trials, which
is driven primarily by which eligible jurors in the county are randomly called for jury duty on a given
day.6 In essence, we examine how conviction rates for white and black defendants vary with the
composition of the jury pool rather than the seated jury. The day-to-day variation in the composition of
the jury pool does in fact appear to be random – the composition of the pool is uncorrelated with the
characteristics of the defendant and the criminal charges. And, because the eligible jury population in
both Sarasota and Lake Counties is less than five percent black, much of the variation in the sample is
between pools in which there are no black potential jurors (36 percent) and those with at least one black
member (64 percent).
!!!!!!!!!!!!!!!!!!!!!!!!!!!!!!!!!!!!!!!!!!!!!!!!!!!!!!!!!!!!!5 Studies providing compelling empirical research designs to estimate the effect of race in other areas include
Bertrand and Mullainathan (2004) in employment; Ross and Yinger (2002) in mortgage lending; Knowles, Persico
and Todd (2001), Anwar and Fang (2006), and Antonovics and Knight (2009) in motor vehicle stops and searches;;
and Price and Wolfers (2010) and Parsons et.al. (2011) in sports refereeing.!6A handful of studies utilize random variation in other aspects of the criminal justice system. Abrams, Bertrand, and
Mullainathan (forthcoming) use the random assignment of judges to study racial disparities in sentencing. Kling
(2006) uses random judge assignment as a source of exogenous variation in sentence length. Abrams and Yoon
(2007) use the random assignment of felony cases to public defenders to study the effect of attorney ability on case
outcomes.!
! 3!
The evidence regarding the impact of the jury pool on conviction rates is straightforward and
striking: the presence of even one or two blacks in the jury pool results in significantly higher conviction
rates for white defendants and lower conviction rates for black defendants. Specifically, in cases with no
blacks in the jury pool, black defendants are convicted at an 81 percent rate and white defendants at a 66
percent rate. When the jury pool includes at least one black potential juror, conviction rates are almost
identical: 71 percent for black defendants and 73 percent for white defendants. The estimated impact of
the racial composition of the jury pool on trial outcomes is statistically significant and leads to three main
conclusions: (i) there is a significant gap in conviction rates for black versus white defendants when there
are no blacks in the jury pool, (ii) the gap in conviction rates for black versus white defendants is
eliminated when there is at least one black member of the jury pool, and (iii) conviction rates for white
defendants are significantly higher when there is at least one black member of the jury pool (versus all-
white jury pools). The estimates are robust to a number of alternative specifications, e.g., the inclusion of
other case and defendant characteristics interacted with jury race, and the same pattern holds in both Lake
and Sarasota counties independently.
Having established that the racial composition of the jury pool has a substantial impact on
conviction rates, we consider a number of possible channels through which random variation in the
composition of the jury pool might affect trial outcomes. Most obviously and directly, having at least one
black member in the jury pool makes it feasible to have a black member on the seated jury. Black
representation on the seated jury might affect trial outcomes not only through the jury deliberation and
decision process but also by affecting how the case is presented and argued by the prosecution and
defense attorneys.
Adding black potential jurors to the pool can also affect trial outcomes even when these jurors are
not ultimately seated on the jury. This indirect effect comes about through the jury selection process if
attorneys on each side use their peremptory challenges to strike the potential jurors most likely to be
hostile to their case. We would expect the defense attorney, for example, to systematically strike those
jurors with the highest ex ante probabilities of conviction (i.e., those in the upper tail of the distribution)
! 4!
based on their observable attributes and answers to pre-trial questioning. In this way, whenever attorneys
use peremptory challenges to strike black members of the pool (presumably when they are in the tail of
the distribution), they forgo the possibility of excluding another potential juror with a similar ex ante
probability of convicting. This pulls the likelihood of conviction for the seated jurors towards that
excluded person’s position even though he or she does not wind up serving on the jury.
In addition to illustrating how a member of the jury pool could affect trial outcomes even without
being seated, this view of the selection process also provides an explanation for another striking fact from
the data: that black and white potential jurors in the pool are about equally likely to be seated. While
attorneys may have additional motivations for seating black jurors in proportion to their representation in
the pool – in particular, it is illegal to consider race when using peremptory challenges –the distributions
of ex ante likelihoods of conviction for white and black members of the jury pool may naturally overlap
significantly when there is substantial within-race heterogeneity. Given this heterogeneity, the attorneys
will effectively seat a significant number of black potential jurors whose ex ante likelihoods of conviction
are not all that different than those of the seated white jurors.
That the presence of black members of the jury pool might have a substantial effect on trial
outcomes even when no black jurors are actually seated for the trial is also consistent with the pattern of
correlation of the composition of the seated jury with trial outcomes. Strikingly, OLS estimates of the
black-white conviction rate gap when there is at least one black member of the seated jury, for example,
are almost identical to the estimated causal effect of having at least one black potential juror in the pool.
That these point estimates are similar in magnitude despite the fact that a black juror is seated in only 40
percent of the cases in which there is a black member of the jury pool implies that jury race has a broader
impact than what a naïve OLS analysis of the effect of seated jury composition would suggest. That is,
while the black-white conviction gap declines by an average of 16 percentage points in all trials in which
there is at least one black member of the jury pool, a naive OLS analysis of the effect of the seated jury
would instead appear to imply that such a decline occurred only in the smaller subset of cases in which a
black juror was actually seated.
! 5!
We conclude the paper with a discussion of the implications of our findings regarding the fair and
equal application of the law. Our main findings imply that the application of justice is highly uneven, as
even small changes in the composition of the jury pool have a large impact on average conviction rates
for black versus white defendants. They also show that defendants of each race do relatively better when
the jury pool contains more members of their own race, raising obvious concerns about whether black
defendants receive a fair trial in jurisdictions with a small proportion of blacks in the jury pool. The
ability of our analysis to draw firm conclusions about the fairness of trial outcomes, however, is
fundamentally limited by the fact that the strength of the evidence in cases brought against white and
black defendants is not observed directly in the data. As a result, it is impossible to draw firm conclusions
about what relative conviction rates should be for black and white defendants. If, in fact, the strength of
the evidence in cases involving black and white defendants is comparable, our results would imply that
juries resulting from all-white jury pools require weaker standards of evidence to convict black versus
white defendants, while juries resulting from jury pools with at least some black members apply
comparable standards.
The remainder of the paper proceeds as follows. Section II provides background information on
jury selection in the United States and jury trials in Florida while Section III describes the data. Section
IV presents our main analysis of the impact of jury racial composition on conviction rates for black and
white defendants as well as a number of alternative specifications that establish the robustness of our
main findings. Section V interprets our findings in the context of a number of additional empirical
regularities and potential channels through which variation in the jury pool might affect trial outcomes.
Section VI concludes by discussing the implications of our findings for the fair and equal application of
the law.
II. THE JURY TRIAL
II.A. Overview of the Jury Selection Process
! 6!
The jury trial is a prominent part of the U.S. justice system. Hannaford-Agor et al. (2007)
estimate that there are 154,000 jury trials per year in the U.S., 66 percent of which are criminal trials.
They also estimate that 32 million people are summoned each year for jury service and that 1.5 million
jurors are impaneled each year. While many details are determined at the state level, the core elements of
jury selection are fairly standard across jurisdictions. Each jurisdiction has a master jury list, which is a
list of individuals that are considered to be potential jurors and is often based on voter registration or
driver’s license records. Eligibility criteria for jury service are also fairly consistent across states: an
individual must be a U.S. citizen, a resident of the geographic jurisdiction served by the court, able to
speak/understand English, and not under a legal disability (felony conviction or incompetence) (Rottman
and Strickland, 2006). Individuals from the master jury list are randomly selected to receive a summons
for jury service, which requests that the individual appear at the courthouse on a given date for jury
selection (voir dire).
To give a brief overview of the process, let us suppose that 100 individuals receive a summons to
appear (and that they actually do appear) on a given day. For simplicity, assume that the jury for just one
trial is to be chosen. Of the 100 potential jurors, suppose 30 are called into the courtroom to be in the
venire, i.e. the actual pool of jurors from which the jury is chosen. The prosecutor and defense attorneys
(or the judge, depending on the state) then ask the potential jurors a series of questions, which are
designed to determine whether the individual is fit to serve as an impartial member of the jury. Some
individuals are simply excused from service, perhaps because of a medical condition. Other individuals
are removed for cause by the judge because they cannot be impartial or follow the law; for instance, they
may have a personal relationship with the defendant or state that they are unwilling to impose a particular
punishment, like the death penalty. Both prosecutor and defense attorneys can request a removal for
cause, and there is generally no limit to the amount of such requests.
Finally, both the prosecutor and defense attorneys have the option to use peremptory challenges
to strike potential jurors from the jury. Such challenges are differentiated from removals for cause in that
the attorneys do not have to state the reason for the strike and there are a limited number of peremptory
! 7!
challenges available to both the prosecution and defense.7 Though the attorneys do not have to provide a
reason for dismissing a juror, a peremptory challenge cannot be used to strike a juror solely on the basis
of race or gender.8 Numerous studies, however, indicate that the use of the peremptory challenge is not
race neutral; rather, they often find that prosecutors are more likely to strike black venire members and
defense attorneys are more likely to strike white venire members (Rose 1999; Turner et. al 1986; Baldus
et. al 2001; Sommers and Norton 2007; Diamond et. al. 2009).9 Though race appears to play a role in both
the prosecutor’s and defense’s use of peremptory challenges, studies have also shown that these opposing
challenges cancel each other out, in the sense that there is no overall effect on the racial composition of
the jury (Rose 1999 and Diamond et. al. 2009). Importantly, however, even without affecting the number
of seated jurors of each race, the use of peremptory challenges may affect trial outcomes by altering the
attributes (potentially unobserved in the data) of the seated jurors of each race.
Thus, jury selection begins with a large pool (30 individuals in our running example); potential
jurors are then interviewed in sequence and potentially excused, removed for cause, or struck via the
peremptory challenge. Those who survive voir dire make up the jury, the size of which depends on the
jurisdiction and type of trial. Historically, juries were composed of 12 individuals; 12-member juries are
still used in many states and especially in serious criminal trials. In part to reduce court costs, however,
many states now use smaller juries (6-8 jurors) for civil trials and less serious criminal trials (Hannaford-
Agor 2009; Waters 2004). In addition, one or two alternates are often chosen at this time (through the
same set of questioning and dismissing procedures).
!!!!!!!!!!!!!!!!!!!!!!!!!!!!!!!!!!!!!!!!!!!!!!!!!!!!!!!!!!!!!7 The number of challenges allocated to both sides depends on the state and type of trial (criminal or civil, felony or
misdemeanor, capital or non-capital); in some states, the prosecution and defense are allotted different numbers of
strikes.!8 The Supreme Court first confronted the issue of race-based peremptory challenges in 1965 in Swain v. Alabama.
The burden of proof on the defendant to demonstrate bias was significantly lessoned in Batson v. Kentucky (1986),
which allowed a case for purposeful racial discrimination in jury selection to be made on the basis of the jury
selection in a single case rather than historical averages for the entire jurisdiction.!9 Baldus et. al. (2001) provide anecdotal evidence that race plays a role in jury selection, including the description of an attorney training video by Philadelphia prosecutor Jack McMahon, which provides jury selection strategy that
focused on race and class. Stevenson and Friedman (1994) describe the trial of Albert Jefferson in Alabama, during
which the prosecutor exercised his discretionary challenges against 24 of the 26 African Americans among the
prospective jurors, resulting in an all-white jury. Long after the trial, the defense discovered the prosecution’s juror
ranking system: strong, medium, weak, and black (the least desirable category).!
! 8!
II.B. Jury Trials in Sarasota County and Lake County, Florida
In Florida, circuit courts have jurisdiction over felonies, family law matters, civil cases of over
$15,000, probate/guardianship/mental health, and juvenile dependency and delinquency. County courts
have jurisdiction over misdemeanors, small claims (up to $5,000), civil cases of $15,000 and less, and
traffic offenses. We will be studying felony jury trials in Sarasota County and Lake County and hence are
using data from two circuit courts. Chapter 913 of The 2009 Florida Statutes provides details about the
jury trial in Florida. First, all non-capital cases have 6-person juries with 0-2 alternates; capital cases have
12-person juries. Second, the state and the defendant are both allocated equal numbers of peremptory
challenges, which depend on the type of offense. If the offense is punishable by death or life
imprisonment, then there are ten challenges; if the offense is punishable by imprisonment of more than 12
months, then there are six challenges; for all other offenses, there are three challenges.
We obtained the following details specific to jury trials in Sarasota County Circuit Court and
Lake County Circuit Court from the Courts’ websites and communications with administrators of the
courts.10 Both Sarasota and Lake Counties use one source list, driver’s licenses from the Department of
Highway Safety and Motor Vehicles, to compile the master jury list. Both counties use a jury
management software program to randomly choose individuals from this master list to receive a summons
requesting that they appear at the courthouse on a particular date. Some individuals who receive a
summons are eligible for an automatic exemption and need not appear in court.11 The eligibility criteria
(also listed on the websites) are in line with those described in the general overview in the previous
section.12
!!!!!!!!!!!!!!!!!!!!!!!!!!!!!!!!!!!!!!!!!!!!!!!!!!!!!!!!!!!!!10 http://www.sarasotaclerk.com/default.asp?Page=68 ; http://lakecountyclerk.org/courts/jury_management.aspx !11 Individuals can be automatically excused if: (i) they are an expectant mother, (ii) they are a parent who is not
employed full time and has custody of a child under 6, (iii) they are a full time law enforcement officer, (iv) they served as a juror in Sarasota county in the last 365 days, (v) they are responsible for the care of another who is
incapable of caring for himself, or (vi) they are 70 or older and wish not to report (at this time or permanently).!12 Individuals are eligible for jury duty if they are a legal resident of the State of Florida and Sarasota or Lake
County and they possess a valid Florida driver’s license or identification card. Thus, individuals who are permanent
residents of other states but spend the winter months in Florida would not be eligible for jury duty. !
! 9!
Individuals who do not excuse themselves for the reasons stated above and who are eligible to
serve check-in on the date summoned; upon check-in, they are entered into the jury management software
program. From the sample of checked-in individuals, this software randomly chooses individuals to
participate in a particular panel. It is important to note that the jury management software program only
utilizes data about jurors and does not have information about the defendants or case characteristics.
Individuals whose names are called out enter the courtroom to participate in voir dire, during which
questioning is done by both the attorneys (defense and prosecution) and the judge.
III. DATA
III.A. Description of Jury Data from Sarasota and Lake Counties
Our analysis is conducted using felony jury trial data for Lake County and Sarasota County,
Florida. As each county circuit court maintains their own records of jury trials, these data were obtained
through separate requests to each county. To the best of our knowledge, Sarasota County and Lake
County are the only two circuit courts in Florida (of reasonable size) that maintain information on the race
of jurors and members of the jury pool. The inclusion of the race of each jury member, let alone each
member of the jury pool, makes these data particularly rare.13 Since a standardized record system is not
used throughout Florida, the type of information and format of the data available vary somewhat across
counties. Thus, the majority of our analysis is conducted with a single, combined data set of Lake and
Sarasota County trials, using those variables that can be commonly identified in both counties. Following
is a brief description of the data obtained for each county as well as the combined data set.
The office of the Clerk of the Sarasota County Circuit Court provided us with information on all
felony trials for which jury selection began between January 1, 2004 and June 1, 2009. Note that because
of the (oftentimes long) lag between the date at which an offense is filed with the courts and the date at
!!!!!!!!!!!!!!!!!!!!!!!!!!!!!!!!!!!!!!!!!!!!!!!!!!!!!!!!!!!!!13 Generally, few courts maintain records that identify the race of each jury member and even fewer identify the race
of the jury pool member; in fact, many do not even keep records of the jury pool. To obtain the data used in this
paper, we sent data request letters to every felony court in fifteen states. Most courts indicated that they were unable
to provide data because either judicial records are excluded from public records request or these data are not
collected or maintained.!
! 10!
which a verdict is rendered, our data set contains trials for offenses dating as far back as 1999. For each
trial, we have data for both the defendant and the jury. The defendant data includes the name, race, and
gender of the defendant as well as information about the charged offenses, including a detailed crime
code, the date that the offense was filed, the date that the judgment was handed down, and the verdict for
each offense. For our main analysis, we restrict our sample to trials in which at least one of the charged
offenses resulted in a verdict of guilty or not guilty by the jury.14 The jury data includes the name, date of
birth, gender, and race of each individual in the jury pool as well as whether or not they were seated.
However, we cannot distinguish between individuals who are seated and those who became alternates; all
of these individuals appear to be ‘seated’.
Data were also provided to us by the Lake County Clerk of Courts for all felony jury trials from
March 1, 2000 to April 2, 2010. As in Sarasota County, we know each potential juror’s name, race,
gender, date of birth, and whether they were seated or assigned as alternates. In terms of the defendant
information, the Lake County Clerk of Courts only provided the case number and defendant name. We
used this information to manually collect the following information from the Lake County Clerk of
Courts Online Court Records website: city of residence, sex, race, attorney, judge, the number of charges,
the type of charge, and the verdict for each charge.15 As in Sarasota, we restrict our sample to trials in
which at least one of the charged offenses resulted in a verdict of guilty or not guilty by the jury.16
Since all felony trials in Florida other than capital trials have six-member juries, we exclude
capital trials from our analysis. Since each jury should have six members plus zero to two alternates, we
drop those cases with less than six jurors/alternates identified in the data and those with more than 8. We
also drop those cases with multiple defendants and those in which the defendant names do not match the
!!!!!!!!!!!!!!!!!!!!!!!!!!!!!!!!!!!!!!!!!!!!!!!!!!!!!!!!!!!!!14 Charges for which the verdict was neither guilty nor not guilty had the following possible outcomes: dropped,
noelle prosequi, filed, dismissed due to speedy trial, dismissed with no reason given, consolidated, adjudication
withheld by judge and unable to stand trial. We test the sensitivity of our results to the exclusion of these cases
below.!15 The data were collected from the following website:
http://www.lakecountyclerk.org/record_searches/court_records_agreement.aspx?to=%2Frecord%5Fsearches%2Fonl
ine%5Fcourt%5Frecords%2Fonline%5Fcourt%5Frecords%2Easp?target%3D%5Fblank. !16 Other possible verdicts include: pled, nolle prosequi, no information, dismissed by judge, and mistrial. We will
test the sensitivity of our results to redefining pleas as decisions of guilty by the jury.!
! 11!
online record (i.e. in Lake County).17 We are left with a dataset of 785 felony jury trials, 401 of which are
from Sarasota County and 384 of which are from Lake County. Our analysis focuses on the 712 trials in
which the main dependent variables are defined and the defendant is identified as being either black (n =
333) or white (n = 379).
III.B. Summary Statistics
Table I presents descriptive statistics for both the defendant and jury variables for all 785 felony
trials overall and separately for the black and white defendants used in our analysis.18 Overall, 44 percent
of defendants are black and the average number of charges is 2.99. We identify whether each defendant is
charged with an offense in the following categories, regardless of the verdict associated with the charge:
murder (non-capital), robbery, other violent offenses, property offenses, drug offenses, sex offenses,
weapons offenses, and other offenses. Overall, the most common crime categories are other offenses (33
percent), other violent offenses (31 percent), and drug offenses (25 percent). There are some differences
in the distribution of crime types across defendant race: 38 percent of black defendants have at least one
drug charge compared with 14 percent of white defendants. In contrast, 8 percent of black defendants are
charged with a sex offense compared to 18 percent of white defendants.
We consider two possible outcome measures or verdicts: whether the defendant was convicted of
at least one offense and the percent of the first five offenses for which the defendant was convicted. 74.5
percent of black defendants and 70.2 percent of white defendants were convicted of at least one offense.
On average, seated juries have seven members (including alternates) drawn from jury pools with 27
individuals.19
!!!!!!!!!!!!!!!!!!!!!!!!!!!!!!!!!!!!!!!!!!!!!!!!!!!!!!!!!!!!!17 Specifically, we drop eight Sarasota cases that have too few or too many jurors; capital cases are thus dropped as a
result of having more than eight jurors. Note that in Lake County, the capital cases were not provided in the same
data set, and hence, we do not ‘drop’ any capital cases. In Lake County, we drop 13 cases that do not have six seated jurors, i.e. the jury is not correctly identified, 20 cases with multiple defendants, and two incorrectly labeled cases. !18 In Table A.1, we provide additional summary statistics separately for Lake and Sarasota County.!"#!While not reported in Table I, the average composition of the jury pools is 51 percent female, 25 percent age 40 or
younger and 27 percent age 60 or older. These statistics are identical for defendants of each race. The age and
gender composition of the seated jury differs from these statistics by at most 2 percentage points. !!
! 12!
Approximately 64 percent of cases had at least one black potential juror in the pool, while just 28
percent of trials had at least one black member on the seated jury. These percentages are driven primarily
by the small proportion of blacks in the jury pool – 3.9 percent.20 In fact, blacks are slightly more
represented on seated juries (4.6 percent) than in the jury pool, implying that potential black jurors are
slightly more likely to be seated than white jurors. Given the relatively small fraction of blacks in the
population of Lake and Sarasota counties, the primary source of variation in our study is between jury
pools with zero versus a small number of black potential jurors. Because the population of the United
States is approximately 12 percent black, such settings are more the norm than the exception. That said, it
is important to emphasize that the findings presented below may not be representative of the effect of jury
race in jurisdictions with higher fractions of blacks in the population. Such settings are essentially “out-
of-sample” and racial attitudes as well as juror interactions are likely to be different in jurisdictions with a
much higher fraction of black residents.
Table II examines whether variation in the demographic composition of the jury pool across
trials is uncorrelated with defendant and case characteristics, consistent with the notion that the jury pool
varies quasi-randomly from trial to trial. Specifically, we regress a particular jury composition measure,
such as whether there are any black jurors in the pool, on observable defendant and case characteristics.21
If the jury pool were truly randomly assigned to cases, the regression coefficients should be close to zero
and statistically insignificant. This is essentially what we find, as just two of the 48 coefficients presented
in this table are statistically significant at the 5 percent level and the magnitudes of all coefficients are
quite small.22 While these regressions cannot rule out the possibility that the composition of the jury pool
is related to attributes of the defendant or case that are unobserved to us, they suggest that this should not
!!!!!!!!!!!!!!!!!!!!!!!!!!!!!!!!!!!!!!!!!!!!!!!!!!!!!!!!!!!!!20 According to the U.S. Census Bureau, 9.4 percent of Lake County residents were black in 2009 compared to 4.8
percent in Sarasota County. Fukurai, Butler, and Booth (1991) and Sommers (2008) suggest numerous reasons that
the jury pool is disproportionately less black than the population, including racial differences in (i) ineligibility due
to criminal records, (ii) likelihood of having a driver licenses or being registered to vote, (iii) responses to summons for jury duty, and (iv) residential mobility.!21 Note that 14 cases are dropped from these regressions due to incomplete charge information.!22 Additional regressions of the gender and age composition of the pool on the defendant and case characteristics,
reported in Table A.2, provide further evidence of random assignment. Again, just two of 48 coefficients are
significant at the five percent level.!
! 13!
be a major concern. These results are also consistent with the jury management software (i) randomly
choosing potential jurors from the master list to receive summons for jury duty and (ii) randomly
choosing from the group of summoned individual those who will participate in voir dire for a particular
trial.23
IV. THE EFFECT OF THE RACIAL COMPOSITION OF THE JURY POOL ON CONVICTION RATES
In this section, we examine the impact of the racial composition of the jury pool on conviction
rates for white and black defendants. The left panels of Table III present cross-tabulations that show how
conviction rates vary with whether there are any blacks in the jury pool. When there are no potential black
jurors in the pool, black defendants are significantly more likely than whites to be convicted of at least
one crime (81 percent for blacks versus 66 percent for whites). However, as the number of blacks in the
pool increases, this differential goes away: in fact, with at least one black member of the jury pool,
conviction rates are almost identical (71 percent for blacks and 73 percent for whites). The right panels of
Table III show how conviction rates vary with the number of blacks in the pool. Given the sample sizes,
the data is fairly noisy once there are multiple black jurors in the pool and so, throughout the rest of the
paper, we focus on the variation between cases in which there are no blacks in the pool and cases in
which there is at least one.
The first column of Table IV expresses these results in regression form: the dependant variable is
an indicator for whether the defendant was convicted of at least one charged crime and the regressors
include indicators for: (i) whether the defendant is black, (ii) whether there are any black jurors in the
pool, and (iii) the interaction of these two variables. Column (2) reports these key coefficients from a
specification that includes additional control variables for the gender and age composition of the pool, a
county dummy, and a set of dummy variables for the year of filing. Including controls for other
characteristics of the jury pool accounts for potential correlations between jury race, gender, and age and
!!!!!!!!!!!!!!!!!!!!!!!!!!!!!!!!!!!!!!!!!!!!!!!!!!!!!!!!!!!!!23 Table A.3 provides a direct comparison of the average of each demographic and case characteristic for jury pools
with and without any black members. These means are only significantly different at the five percent level for one
variable, total charges, supporting the notion that jury pools are randomly assigned to cases.!
! 14!
adding year dummies addresses the possibility that crime patterns or convictions rates may be trending
systematically over time. In all cases, the additional control variables described above are fully interacted
with the defendant’s race. This allows for the possibility that these control variables have a differential
effect for black and white defendants, just as we have allowed for the racial composition of the jury
pool.24
The point estimates for the three key coefficients are remarkably robust and statistically
significant in the specification that includes controls. For expositional convenience, we use the
specification reported in Column (2) as our benchmark specification for the remainder of the paper and
discuss the results referring to this specification. The coefficient estimates in this benchmark specification
support three main conclusions. First, there is a large (16 percentage point) gap in conviction rates for
black versus white defendants when there are no blacks in the jury pool. Second, the gap in conviction
rates for black versus white defendants is significantly lower when there is at least one black member in
the jury pool. In fact, the point estimate implies that the entire gap is eliminated in this case. And, third,
conviction rates for white defendants are sharply (10.5 percentage points) higher when there is at least
one black member of the jury pool (versus all-white jury pools).25 The third and fourth columns of Table
IV repeat the same structure as the first two columns using the fraction of the first five offenses on which
the defendant was found guilty as the dependant variable. The results are similar in both magnitude and
statistical significance.
Before considering the robustness of these findings to additional alternative explanations, it is
worth emphasizing that the coefficient estimates reported in Table IV are not only significant in the
!!!!!!!!!!!!!!!!!!!!!!!!!!!!!!!!!!!!!!!!!!!!!!!!!!!!!!!!!!!!!24 In addition, each control variable is demeaned (prior to being interacted), which ensures that the main coefficients
in Table IV are reported at the sample mean in each specification and therefore comparable; i.e. there is no need to look at the coefficients on the interaction variables included in the vector of controls.!25 The findings from this benchmark specification are also qualitatively and quantitatively comparable when
estimated via a probit model rather than a linear probability model. Specifically, the estimated marginal effects are:
Black Defendant (0.18), Any Blacks in Pool (0.10), and Black Defendant*Any Blacks in Pool (-0.19). Each of these
estimates is significant at the 5 or 1 percent level.!
! 15!
statistical sense but are also large in magnitude.26 Given that very few jury pools have more than two
black members, the results presented above reveal large changes in conviction rates with the addition of
just one or two black members to an otherwise homogeneously white jury pool. Moreover, it is important
to bear in mind that the magnitude of these effects reflects the average impact potential black jurors have
on conviction rates regardless of whether they are actually seated on the trial jury – in fact, each black
member of the jury pool has about a one-third chance of being seated. In the next section of the paper, we
discuss ways in which members of the jury pool might affect trial outcomes both when they are seated
and when they are dismissed through peremptory challenges.
Table V reports estimates for a number of alternative specifications using whether the defendant
was convicted of at least one crime as the dependant variable. Column (1) repeats the benchmark
specification (Column 2 of Table IV). Column (2) of Table V reports estimates for a specification that
includes controls for a set of additional defendant and case characteristics (gender, offense category, and
number of offenses) fully interacted with the jury pool composition.27 Controlling for defendant and case
characteristics addresses the possibility that the effect of jury race on conviction rates is not driven
directly by the race of the defendant but by other differences across cases (e.g., the type of offense the
defendant is charged with) that are correlated with defendant race. In effect, the specification shown in
Column (2) compares outcomes by defendant and jury race within the same crime category. Despite
adding twenty additional control variables to a regression with 712 observations, the point estimates for
all three key coefficients remain similar to the benchmark specification and statistically significant at
standard confidence levels. Column (3) adds a full set of judge fixed effects fully interacted with
!!!!!!!!!!!!!!!!!!!!!!!!!!!!!!!!!!!!!!!!!!!!!!!!!!!!!!!!!!!!!26 While not reported in Table IV, the specifications reported in Columns (2) and (4) here also provide estimates of
the way that other aspects of jury composition affect racial gaps in convictions. It is worth noting that neither age
nor gender has a significant (in magnitude or statistically) impact on the racial gaps in conviction rates.!27 As above, when interactions of the controls and jury composition are included, the point estimates are reported at
the mean to ensure comparability across specifications.!
! 16!
defendant race (50 variables in all) to the benchmark specification, again leading to essentially the same
conclusions both qualitatively and quantitatively.28
Columns (4)-(6) consider the robustness of the results to alternative ways of categorizing trial
outcomes that are not simple verdicts of “guilty” or “not guilty” by the jury. For instance, Column (4)
redefines as guilty 133 cases in Lake County that are pled by the defendant at some point after a jury pool
is chosen (but before the case actually goes to the jury). It is theoretically ambiguous whether such cases
should be included in the analysis (categorized as guilty verdicts). On the one hand, it makes sense to
include them if these plea bargains are reached because the composition of the jury implies that a guilty
verdict is very likely. On the other hand, if these plea bargains are reached for reasons unrelated to the
jury composition (as they would be if reached prior to jury selection), including them biases the
coefficients towards zero as the outcome is, by construction, the same for all of these trials regardless of
the jury composition.29 Column (5) recodes those 25 Sarasota cases that did not have guilty or not guilty
jury verdicts associated with it (see footnote 14) as not guilty while Column (6) repeats the same exercise,
coding these cases as guilty. In all cases, the results are very similar to the benchmark results reported in
Column (1) of Table V.
Table VI explores the heterogeneity of the results across a number of different subsamples.
Given the relatively small number of observations in each of these specifications, we report results for the
baseline specification (i.e., without any additional control variables). Column (1) repeats the baseline
specification (Column 1 of Table IV), while columns (2) and (3) report analogous specifications,
estimated separately for Lake and Sarasota Counties, respectively. These specifications reveal a
!!!!!!!!!!!!!!!!!!!!!!!!!!!!!!!!!!!!!!!!!!!!!!!!!!!!!!!!!!!!!28 While it might seem preferable to use the specification that includes case and defendant characteristics and
interactions (20 additional variables) or that includes judge fixed effects and interactions (50 additional variables) as
the benchmark specification for all subsequent analyses, we are concerned that the limited size of our sample would
lead to over-fitting the data when so many incidental parameters are added to the specification. As a result, we use the more parsimonious specification reported in Columns (2) and (4) of Table IV as the benchmark specification
throughout the rest of our analysis.!29 It appears that many of the plea bargains included here are reached the day the case is scheduled to be heard in
court but before voir dire begins. In particular, in about one-third of cases, we observe data characterizing the
composition of the jury pool but not a seated jury, suggesting that voir dire did not actually occur in these cases. !
! 17!
remarkably similar qualitative pattern of results in each county; the magnitude of the key coefficients is
generally greater in Lake County.
The final three columns of Table VI examine heterogeneity across crime categories, reporting
separate estimates for defendants charged with drug, violent, and property crimes, respectively.30 While
the standard errors are larger than for the full sample due to the small number of observations in each
crime category, many of the key coefficients are statistically significant and especially large for drug and
violent crimes. The point estimates imply that all-white jury pools convict black defendants of drug
crimes at an almost 25 percentage point higher rate than white defendants and that this gap is not only
eliminated but even reversed when at least one black potential juror is added to the pool. In this case, the
gap closes both because conviction rates for white defendants rise while those for blacks fall significantly.
A similar pattern emerges for violent crimes, although the only coefficient that is statistically significant
in this case is the interaction term, which implies that adding at least one black potential juror to the pool
decreases conviction rates for black defendants relative to whites. The impact of jury race is statistically
insignificant for property crimes; if anything, the point estimates imply that jury pools with at least one
black member are more favorable to white versus black defendants for these crimes.
V. UNDERSTANDING THE IMPACT OF JURY RACE ON TRIAL OUTCOMES
The evidence presented in Tables II-VI leads to a number of robust conclusions about the impact
of the racial composition of the jury pool on trial outcomes. Having established these main results, we
now consider possible mechanisms through which the jury pool might affect conviction rates and attempt
to distinguish which mechanisms are most consistent with the pattern of trial outcomes and jury selection
observed in the data.
!!!!!!!!!!!!!!!!!!!!!!!!!!!!!!!!!!!!!!!!!!!!!!!!!!!!!!!!!!!!!30 Note that it is possible for defendants to be charged with multiple crimes. The dependant variable here is whether
the defendant was found guilty of the crime in the corresponding category. These dependant variables are only
defined, however, for those cases in which a jury verdict was reached in the given category. Given the small sample
sizes, the large set of benchmark controls are excluded from these specifications; when they are included, the
qualitative pattern of results remains but there is a decrease in precision.!
! 18!
V.A. Possible Mechanisms
The most direct way that the racial composition of the jury pool might affect trial outcomes is
through its impact on the racial composition of the seated jury. It is, of course, impossible to have any
black members on the seated jury if there are no black members in the jury pool. Black members of the
seated jury might affect trial outcomes in a number of ways, including through: (i) the jury deliberation
and decision process and (ii) the way that the attorneys present the evidence in the case. In the
deliberation and decision process, a black member of the seated jury could have an effect on the outcome
either if she was generally more (or less) likely to vote to convict than the white juror that she replaced or
if her presence changed the nature of the deliberations, thereby affecting the votes of the other white
members of the jury. The latter could arise if the black member of the jury was able to contribute a
different perspective during the jury deliberations or if white jurors were more concerned about appearing
racially biased in the presence of a black colleague. For instance, Sommers (2002, 2006) found that
racially mixed mock juries, compared to all white juries, tended to deliberate longer, discuss more case
facts, raise more questions about what was missing from the trials, and be more likely to discuss race
issues, such as profiling, during deliberations.
The addition of one or two blacks to the jury pool could also have an indirect effect on trial
outcomes even when no blacks are seated on the jury. If the attorneys can use observable attributes of
potential jurors (e.g., age, appearance, race) along with their answers to pre-trial questioning to form ex
ante expectations of their likelihoods of conviction, we would generally expect the attorneys on each side
to use their peremptory challenges to strike those potential jurors most likely to be hostile to their side. As
a result, whenever an attorney uses a peremptory challenge to strike a black potential juror, she forgoes
the possibility of excluding another potential juror with a similar ex ante likelihood of convicting. Put
another way, even when black potential jurors are struck via peremptory challenges, they are essentially
replaced on the jury by white jurors with similar attitudes towards the case.31
!!!!!!!!!!!!!!!!!!!!!!!!!!!!!!!!!!!!!!!!!!!!!!!!!!!!!!!!!!!!!31 The presence of black jurors in the pool might also affect trial outcomes indirectly if pre-trial interactions among
members of the jury pool alter the attitudes of the white jurors who are ultimately seated.!
! 19!
Figures I-III illustrate the logic of this indirect effect on trial outcomes. We begin by considering
a setting in which the jury pool is homogeneously white. Figure I depicts a normal distribution !w(x) with
mean µw that characterizes the ex ante likelihood of conviction for white potential jurors. Jurors with
higher values of x are more likely to convict; for example, the probability of conviction might be written
P(x) = exp(x)/(1+exp(x)). To keep this illustration simple, we assume that jurors affect outcomes only
through their position x and that the attorneys use their peremptory challenges to strike the potential jurors
that are most likely to be hostile to their side; we discuss the implications of relaxing these assumptions
below. In this way, defense attorneys strike those potential jurors with ex ante probabilities of conviction
in the upper tails of the distribution while the prosecution strikes potential jurors in the lower tail. If each
attorney strikes a fixed percentage of the jury pool, the seated jury would consist of jurors drawn from
truncated distributions with cutoffs xH and xL.
Note that throughout this section, we ignore the fact that in actual trials a finite number of
potential jurors are drawn from these distributions and so the truncation points will vary from case to
case. Instead, for expositional simplicity, we assume that a continuum of jurors is in the pool and that
attorneys on each side can strike a fixed percentage of jurors.
Figure II considers a setting with at least some black potential jurors in the pool. It depicts two
normal distributions !w(x) and !B(x) with means µw and µB that determine the ex ante likelihood of
conviction for white and black potential jurors, respectively. For expositional convenience, we have
drawn normal distributions with the same variance and with!µw > µB, which, given our main results above,
might illustrate the case of a black defendant. An analogous figure that is consistent with our findings for
white defendants could be created by switching the locations of !w(x) and !B(x) in the figure.
! 20!
As illustrated in Figure II, compared to a world with only white potential jurors, adding black
potential jurors to the pool puts more weight in the overall distribution of the jury pool on lower levels of
x, thereby shifting the truncation points towards the location of the black distribution: to xH* and xL*. 32
Figure III repeats Figure II but shades the regions of the distributions affected by the addition of
some potential black jurors to the jury pool. There are two effects of adding blacks to the jury pool.
First, those blacks with values of x between the truncation points xH* and xL* are seated on the jury. The
likelihood of conviction of the blacks that are seated on the jury forms the basis for the direct effect
described above.33 Second, because the prosecution now uses some of its peremptory challenges to strike
black potential jurors drawn from the lower tail, it has fewer challenges left to remove potential white
jurors with relatively low probabilities of conviction. As a result, white jurors between the lower
truncation points xL and xL* are now seated on the jury. The addition of these whites to the jury forms the
basis for the indirect effect described above.
Relative to the case of the all-white jury pool, the new black and white jurors that are seated when
blacks are in the pool are much less likely to convict than the set of white jurors they replace on the seated
jury – those with ex ante likelihoods of conviction between truncation points xH and xH*. Moreover,
notice that the average position of seated black jurors is actually significantly higher than the marginal
white jurors that are added because the prosecution uses some of its peremptory challenges to strike
potential blacks jurors in the lower tail of the distribution. This suggests that the indirect effect has the
potential to be quite large, even compared to the direct effect.
In addition to illustrating the indirect mechanism through which the racial composition of the jury
pool can affect trial outcomes, this simple description of the jury selection process can also help to
explain a number of patterns in the data. For example, the within-race heterogeneity depicted in Figures I-
!!!!!!!!!!!!!!!!!!!!!!!!!!!!!!!!!!!!!!!!!!!!!!!!!!!!!!!!!!!!!32 In thinking about where the truncation points should be drawn in Figure II, it is important to keep in mind that the
distribution function for the full jury will more closely resemble the distribution for whites since jury pools in the
data are generally less than 5 percent black. !33 Specifically, the average position of seated black jurors, µB*, is lower than the average position of white jurors
seated when the pool is all-white, µw. Notice also that because the blacks least likely to convict are struck by the
prosecution, the mean of the truncated distribution for blacks on the seated jury is higher than that for those in the
jury pool: µB* > µB.!
! 21!
III provides a coherent potential explanation for why black members of the jury pool might be seated at
rates roughly comparable to their white counterparts. In particular, as long as there is a significant amount
of overlap in the ex ante probabilities of conviction for white and black potential jurors, the substantial
fraction of black members of the pool with values of x between the truncation points xH* and xL* will be
seated. We discuss other motives that attorneys might have to seat black jurors – e.g., to avoid charges of
racial discrimination – in more detail below.
V.B. Comparing with Estimates of the Effect of the Seated Jury on Trial Outcomes
Table VII examines how the conviction rates of white and black defendants are related to the
proportion of blacks on the seated jury as well as the jury pool for our two main dependant variables. In
all cases, the specifications include controls that correspond to the benchmark specification described
above.34 Columns (1) and (3) repeat the estimates of the impact of the racial composition of the jury pool
on conviction from Table IV. Given the quasi-random variation in the composition of the jury pool, these
estimates can be given a clear causal interpretation. The regressions reported in the columns (2) and (4)
of Table VII condition on the composition of the seated jury, which is non-random, and, therefore, should
not be given a causal interpretation. Instead they should be viewed as simply describing how conviction
rates vary with the composition of the seated jury.
Columns (2) and (4) report parameter estimates for OLS regressions that relate trial outcomes to
the race of the seated jury. Strikingly, the coefficients that characterize the black-white conviction rate
gap when there is at least one black member seated on the jury are almost exactly the same size as the
estimated impact of having at least one black potential juror in the pool (e.g., 0.166 vs. 0.164). That these
point estimates are roughly the same size despite the fact that a black juror is seated only 40 percent of the
time that there is a black member of the jury pool suggests that jury race has a broader impact than what a
simple analysis of the effect of the seated jury would seem to imply. Put another way, our primary results
imply that the black-white conviction gap declines by an average of 16 percentage points in all trials in
!!!!!!!!!!!!!!!!!!!!!!!!!!!!!!!!!!!!!!!!!!!!!!!!!!!!!!!!!!!!!34 That is, they include controls for the gender and age of the jury pool, county, and year of filing.!
! 22!
which there is at least one black member of the jury pool. A naive OLS analysis of the effect of the
seated jury, however, would instead appear to imply that such a decline occurred only in the smaller
subset of cases in which a black juror was seated.35
V.C. Putting the Magnitude of the Estimated Effects in Context
If the simple theoretical framework illustrated in Figures I-III approximates the jury selection
process and trial outcomes are only a function of the x positions of the members of the seated jury, the
magnitudes of our main findings imply that the distributions of the ex ante conviction rates must be fairly
diffuse. In particular, our results suggest that by randomly adding just one to two black jurors to a pool of
27 potential jurors, conviction rates for white defendants increase by 6-11 percentage points (depending
on the exact specification) and decrease by a comparable amount for black defendants. We draw attention
here to two considerations that have implications for interpreting the magnitudes of the effects.
First, it is important to note that of all the possible cases that a district attorney (prosecutor) could
bring against potential defendants, a very small fraction go to trial and are decided by a jury verdict. On
the one hand, in cases where the quality of the evidence is insufficient to generate a reasonable ex ante
probability of conviction, the prosecution is likely to drop the charges rather than bring the case to trial.
This has the benefit of saving time spent preparing and presenting the case at trial and preserving
reasonably high conviction rates for cases brought to trial, a metric on which prosecutors are often judged.
Likewise, in many cases where both sides expect a guilty verdict, pre-trial plea bargains are reached;
these minimize the prosecutor’s trial costs and ensure a guilty verdict, often in exchange for a lighter
sentence. In fact, almost 90 percent of criminal defendants in U.S. District Courts plead guilty and 97
!!!!!!!!!!!!!!!!!!!!!!!!!!!!!!!!!!!!!!!!!!!!!!!!!!!!!!!!!!!!!$%!While it might seem natural to report IV estimates of the effect of the composition of the seated jury on conviction
rates, instrumenting for the presence of blacks on the seated jury with the presence of blacks in the jury pool, such
estimates could be interpreted as the causal LATE (Local Average Treatment Effect) under the strong assumption
that the only channel through which the presence of blacks in the jury pool affects trial outcomes is by increasing the
likelihood of having blacks on the seated jury. If, on the other hand, any of the indirect channels discussed above are important, the IV estimates do not have a clear interpretation and so, to avoid confusion, we do not report IV
estimates here. Because at least one black juror is seated in approximately 40 percent of the cases in which there is a
black potential juror in the pool, the first stage of such an IV regression has a coefficient of about 0.40 and, as a
result, the IV coefficients on jury race are about 2.5 times greater in magnitude than those reported for the OLS
regressions reported in Columns (2) and (5). !
! 23!
percent of all convictions are the result of plea rather than a conviction by a court or jury.36 As a result of
these pre-trial selection mechanisms, the set of cases that go to trial are systematically more likely to be
those where the quality of the evidence is in considerable dispute among the parties. Thus, it might not be
terribly surprising if potential jurors have fairly diffuse ex ante conviction rates for this especially select
subset of cases.
Second, as we mentioned above, it may be possible for certain members of the jury to have an
impact on the trial and deliberations that goes beyond the impact of their ex ante likelihood of conviction.
If the inclusion of a black member on the seated jury impacts the way that the trial is presented by the
attorneys or the way that white jurors deliberate, the seated black juror could essentially pull the other
members of the jury towards his or her position, thereby strengthening the direct effect described above.
Of course, we would generally expect the attorneys to take this into account and, therefore, be more likely
to strike black jurors ceteris paribus. In the example illustrated in Figure III, this would have the effect of
shifting the threshold for black potential jurors higher, resulting in black potential jurors being seated at
lower rates and those that were seated being more systematically selected from the upper portion of the
distribution of ex ante conviction rates and, therefore more similar to white jurors.
This rationale for striking more black potential jurors may be countered, however, by concerns
among attorneys about not wanting to use (or to appear to be using) race as a factor in exercising their
peremptory challenge. Specifically, prosecutors may want to avoid a claim by the defense that the trial
should be invalidated on the grounds that there were no blacks selected onto the jury; such a challenge has
come to be termed a “Batson challenge”. If attorneys in fact place some weight on seating black jurors
roughly in proportion to their representation in the jury pool when using their peremptory challenges, they
may set the ex ante conviction rate threshold for black potential jurors differently than they do for
whites.37 Returning to Figure III, by setting a threshold for seating black potential jurors at a value xL**
below xL*, prosecutors would seat a higher fraction of black jurors, thereby also lowering the mean
!!!!!!!!!!!!!!!!!!!!!!!!!!!!!!!!!!!!!!!!!!!!!!!!!!!!!!!!!!!!!36 See http://www.uscourts.gov/Statistics/JudicialFactsAndFigures/JudicialFactsAndFigures2009.aspx.!37 Note that if prosecutors had especially high rates of excluding black potential jurors when the defendant was
black, this pattern would be straightforward to detect over time using a data set like the one used in our analysis.!
! 24!
position of the seated black jury members, µB**. This would tend to increase the size of the direct effect
without having much impact on the indirect effect.
VI. IMPLICATIONS AND CONCLUSION
Given the main findings presented in Section IV and the discussion of potential mechanisms in
Section V, we conclude the paper with a discussion of the implications of our results for the fair and equal
application of the law. Most plainly, our main findings imply that conviction rates for black and white
defendants are similar when there is at least some representation of blacks in the jury pool but that in the
absence of such representation, black defendants are substantially more likely to be convicted. Defendants
of each race do relatively better when the jury pool contains more members of their own race and, as a
result, black defendants are clearly disadvantaged relative to their white counterparts when the proportion
of blacks in the jury pool is so small.
Another immediate implication of our main findings is that the application of criminal justice in
these Florida counties is highly uneven, as a small change in the composition of the jury pool (i.e., adding
one black member) has a large impact on the conviction rates of black versus white defendants. While
heterogeneity in the jury pool is obviously unavoidable, a potentially desirable feature of a justice system
is that jury verdicts are not arbitrary given the evidence. In this context, increasing the number of jurors
on the seated jury would substantially reduce the variability of the trial outcomes, increase black
representation in the jury pool and on seated juries, and make trial outcomes more equal for white and
black defendants.
What our results imply regarding the fairness of jury trials for defendants of each race is much
more difficult to say. As the discussion of Section V makes clear, when jurors have heterogeneous
likelihoods of conviction, any random variation in the jury pool will affect the likelihood that the seated
jury convicts the defendant. But, such a model has nothing to say about which juror in the distribution is
applying the most appropriate ex ante standard of evidence for defendants of each race. The problem is
that without any direct measure of the objective strength of the evidence that is brought in cases with
! 25!
black versus white defendants, we have no way of discerning what relative conviction rates for black
versus white defendants should be. If, in fact, the quality of the evidence brought in the cases of white and
black defendants in our sample is comparable, our results would imply that juries formed from all-white
jury pools require a weaker standard of evidence to convict black versus white defendants. This is a very
serious potential implication of our analysis, but one that we cannot reach conclusively without knowing
more about the quality of evidence presented in each case.
While gauging the objective quality of the evidence in the cases in our sample is beyond the
scope of this paper, future research could use objective and subjective analyses of the trial transcripts in
these cases to provide further insight into the fairness question. If, for example, experimental subjects
were presented with trial transcripts (neutral as to the race of the defendants), it would be possible to
measure whether the quality of the evidence in the cases with black defendants was in fact comparable to
those with white defendants. Such an analysis could be done within crime category and could conceivably
test whether black and white experimental subjects respond differently to the evidence, when presented in
a way that did not directly indicate the race of the defendant.38
A final implication of our analysis follows from the fact that trials with all-white jury pools result
in higher conviction rates for black defendants and lower conviction rates for whites relative to jury pools
with at least one black potential juror. This pattern is generally inconsistent with a world in which jurors
of each race apply the same standard of evidence for defendants of both races. More specifically, if jurors
of each race perceive the evidence presented in a trial identically and apply the same standard of evidence
to white and black defendants, it may be possible for jurors of one race to require a higher (lower)
standard of evidence to convict and, therefore, convict defendants of both races less (more) often.
Importantly, in this case, if jurors are applying the same standards, it is impossible for conviction rates for
defendants of one race to rise while those for defendants of the other race to fall no matter what the
distribution of quality of evidence is for defendants of each race (Anwar and Fang, 2006). Put another
!!!!!!!!!!!!!!!!!!!!!!!!!!!!!!!!!!!!!!!!!!!!!!!!!!!!!!!!!!!!!38 Clearly such an analysis would be subject to concerns about the credibility of the evaluation of evidence by
experimental subjects in a non-trial setting discussed above. !
! 26!
way, if jurors of one race are generally tougher, then they had better be tougher on all defendants or the
evidence would suggest that they are not applying the same standards.
The crossing pattern exhibited by our main findings thus leads to our final conclusion: that jurors
of at least one race (and possibly both) either interpret evidence differently depending on the race of the
defendant or use a standard of evidence that varies with the race of the defendant. Either possibility
implies that the interaction of defendant and jury race fundamentally alters the mapping of evidence to
conviction rates and, thus, that the impact of the racial composition of the jury pool (and seated jury) is a
factor that merits much more attention and analysis in order to ensure the fairness of the criminal justice
system.
CARNEGIE MELLON UNIVERSITY
DUKE UNIVERSITY AND NBER
QUEEN MARY, UNIVERSITY OF LONDON AND CEPR
! 27!
REFERENCES
Abrams, David, Marianne Bertrand, and Sendhil Mullainathan, “Do Judges Vary in Their Treatment of
Race?,” Journal of Legal Studies, forthcoming, 2011.
Abrams, David and Albert Yoon,"The Luck of the Draw: Using Random Case Assignment to Investigate Attorney Ability," The University of Chicago Law Review, 74:4 (2009), 1145-1177.
Antonovics, Kate L. and Brian G. Knight, “A New Look at Racial Profiling: Evidence from the Boston Police Department,” Review of Economics and Statistics, 91 (2009), 163–177.
Anwar, Shamena and Hanming Fang, “An Alternative Test of Racial Prejudice in Motor Vehicle
Searches: Theory and Evidence,” American Economic Review, 96:1 (2006), 127-151.
Ayres, Ian and Joel Waldfogel, “A Market Test for Race Discrimination in Bail Setting,” Stanford Law Review, 46 (1994), 987.
Baldus, D. C., Woodworth, G. G., Zuckerman, D., Weiner, N. A., and Broffitt, B., “The use of peremptory challenges in capital murder trials: A legal and empirical analysis,” University of
Pennsylvania Journal of Constitutional Law, 3 (2001), 3-169.
Bernard, J.L., “Interaction Between the Race of the Defendant and that of Jurors in Determining
Verdicts”, Law and Psychology Review, 5 (1979), 103-111.
Bertrand, Marianne and Sendhil Mullainathan, “Are Emily and Greg More Employable than
Lakisha and Jamal? A Field Experiment on Labor Market Discrimination,” American Economic Review,
94:4 (2004), 991–1013.
Bowers, W.J, B.D Steiner, and M. Sandys, “Death Sentencing in Black and White: An Empirical
Analysis of Jurors’ Race and Jury Racial Composition,” University of Pennsylvania Journal of
Constitutional Law, 3 (2001), 171-275.
Daudistel, H. C., H.M. Hosch, M.D. Holmes, and J.B. Graves, “Effects of defendant ethnicity on juries’ dispositions of felony cases,” Journal of Applied Social Psychology, 29 (1999), 317–336.
Diamond, Shari Seidman, Destiny Peery, Francis Dolan, and Emily Dolan, “Achieving Diversity on the
Jury: Jury Size and the Peremptory Challenge,” Journal of Empirical Legal Studies, 6:3 (2009), 425-449.
Fukurai, Hiroshi, Edgar Butler, and Richard Booth, “Where did black jurors go? A Theoretical synthesis
of racial disenfranchisement in the jury system and jury selection,” Journal of Black Studies, 22 (1991),
196-215.
Hannaford-Agor, Paula, “Some Differences Between States” in the July 2009 issue of eJournal USA,
Anatomy of a Jury Trial, Bureau of International Information Programs, U.S. Department of State., 2009.
Hannaford-Agor, Paula, Hon. Gregory Mize, and Nicole Waters, “The State-of-the-States Survey of Jury
Improvement Efforts: A Compendium Reportm,” National Center for State Courts, 2007.
Kling, Jeffrey, "Incarceration Length, Employment, and Earnings," American Economic Review, 96
(2006), 863-876.
! 28!
Knowles, John, Nicola Persico, and Petra Todd, “Racial Bias in Motor Vehicle Searches: Theory
and Evidence,” Journal of Political Economy, 109 (2001), 203–228.
Lee, Jean N, “Do Jurors Discriminate? Evidence from Changes in State Juror Selection Procedures,”
Unpublished Manuscript, (2009).
Parsons, Christopher, Johan Sulaeman, Michael C. Yates and Daniel S. Hamermesh, “Strike Three:
Discrimination, Incentives, and Evaluation,” American Economic Review, 101:4 (2011), 1410-1435.
Price, Joseph and Justin Wolfers, “Racial Discrimination Among NBA Referees,” Quarterly Journal
of Economics, 125:4 (2010), 1859–1887.
Rose, Mary, “The Peremptory Challenge Accused of Race or Gender Discrimination? Some Data from
One County,” Law and Human Behavior, 23 (1999), 695-702.
Ross, Stephen and John Yinger, The Color of Credit: Mortgage Discrimination, Research Methodology,
and Fair-Lending Enforcement, (Cambridge, MA: MIT Press, 2002).
Rottman, David and Shauna Strickland, “State Court Organization, 2004,” U.S. Department of Justice,
Bureau of Justice Statistics, Washington DC, USGPO, 2006.
Skolnick, P., and J.I. Shaw, “The O.J. Simpson criminal trial verdict: Racism or status shield?,” Journal
of Social Issues, 53 (1997), 503–516.
Sommers, Samuel, “The Effects of Race Salience and Racial Composition on Individual and Group
Decision-Making,” Unpublished PhD Dissertation. University of Michigan, (2002).
Sommers, Samuel and P.C. Ellsworth , “How much do we really know about race and juries? A review of
social science theory and research,” Chicago-Kent Law Review, 78 (2003), 997-1031
Sommers, Samuel, “On Racial Diversity and Group Decision – Making: Identifying Multiple Effects of
Racial Composition on Jury Deliberations,” Journal of Personality and Social Psychology, 90 (2006),
597-612.
Sommers, Samuel and Michael Norton, “Race-Based Judgments, Race-Neutral Justifications:
Experimental Examination of Peremptory Use and the Batson Challenge Procedure,” Law and Human
Behavior, 31 (2007), 261-273.
Sommers, Samuel, “Race and the decision making of juries,” Legal and Criminological Psychology, 12
(2007), 171-187.
Sommers, Samuel, “Determinants and Consequences of Jury Racial Diversity: Empirical Findings,
Implications, and Directions for Future Research,” Social Issues and Policy Review, 2 (2008), 65-102.
Stevenson, Bryan and Ruth Friedman, “Deliberate Indifference: Judicial Tolerance of Racial Bias in
Criminal Justice,” Washington and Lee Law Review, 51 (1994), 509.

! 29!
Turner, B. M., R.D. Lovell, J.D. Young, and W.F. Denny, “Race and peremptory challenges during voir
dire: Do prosecution and defense agree?,” Journal of Criminal Justice, 14 (1986), 61-69.
Waters, Nicole. “Does Jury Size Matter? A Review of the Literature” National Center for State Courts,
(2004).
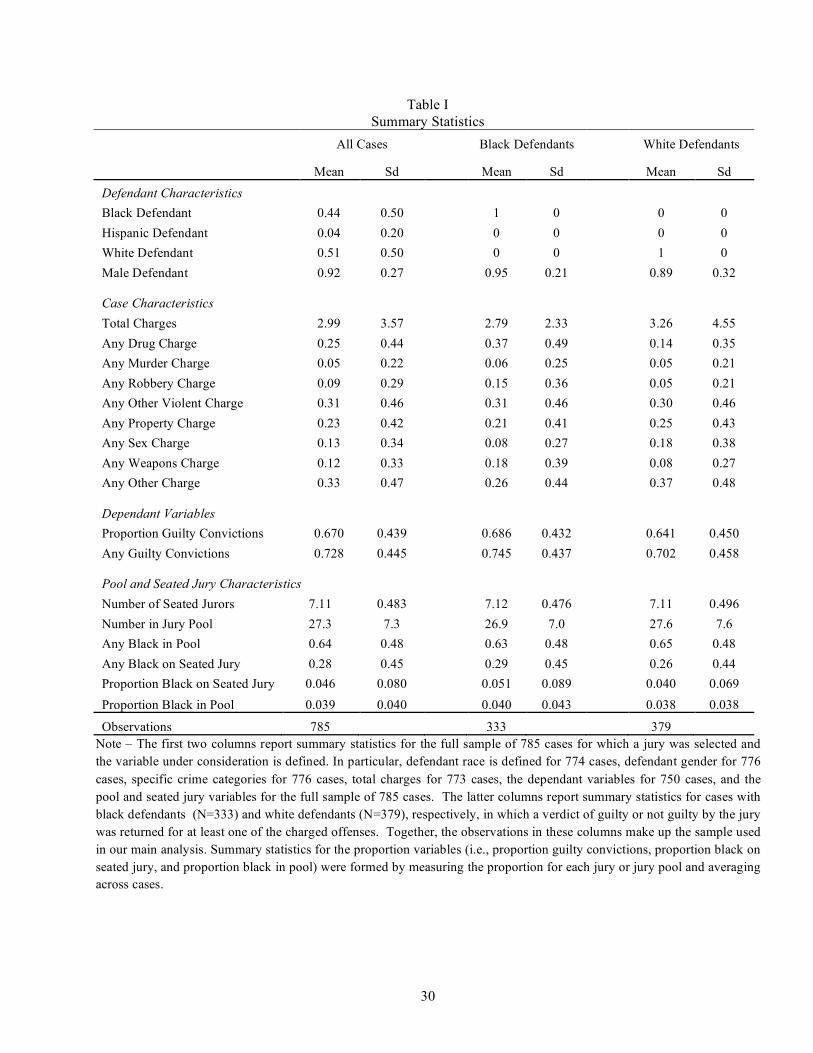
! 30!
Table I
Summary Statistics
All Cases Black Defendants White Defendants
Mean Sd Mean Sd Mean Sd
Defendant Characteristics
Black Defendant 0.44 0.50 1 0 0 0
Hispanic Defendant 0.04 0.20 0 0 0 0
White Defendant 0.51 0.50 0 0 1 0
Male Defendant 0.92 0.27 0.95 0.21 0.89 0.32
Case Characteristics
Total Charges 2.99 3.57 2.79 2.33 3.26 4.55
Any Drug Charge 0.25 0.44 0.37 0.49 0.14 0.35
Any Murder Charge 0.05 0.22 0.06 0.25 0.05 0.21
Any Robbery Charge 0.09 0.29 0.15 0.36 0.05 0.21
Any Other Violent Charge 0.31 0.46 0.31 0.46 0.30 0.46
Any Property Charge 0.23 0.42 0.21 0.41 0.25 0.43
Any Sex Charge 0.13 0.34 0.08 0.27 0.18 0.38
Any Weapons Charge 0.12 0.33 0.18 0.39 0.08 0.27
Any Other Charge 0.33 0.47 0.26 0.44 0.37 0.48
Dependant Variables
Proportion Guilty Convictions 0.670 0.439 0.686 0.432 0.641 0.450
Any Guilty Convictions 0.728 0.445 0.745 0.437 0.702 0.458
Pool and Seated Jury Characteristics
Number of Seated Jurors 7.11 0.483 7.12 0.476 7.11 0.496
Number in Jury Pool 27.3 7.3 26.9 7.0 27.6 7.6
Any Black in Pool 0.64 0.48 0.63 0.48 0.65 0.48
Any Black on Seated Jury 0.28 0.45 0.29 0.45 0.26 0.44
Proportion Black on Seated Jury 0.046 0.080 0.051 0.089 0.040 0.069
Proportion Black in Pool 0.039 0.040 0.040 0.043 0.038 0.038
Observations 785 333 379
Note – The first two columns report summary statistics for the full sample of 785 cases for which a jury was selected and
the variable under consideration is defined. In particular, defendant race is defined for 774 cases, defendant gender for 776
cases, specific crime categories for 776 cases, total charges for 773 cases, the dependant variables for 750 cases, and the
pool and seated jury variables for the full sample of 785 cases. The latter columns report summary statistics for cases with
black defendants (N=333) and white defendants (N=379), respectively, in which a verdict of guilty or not guilty by the jury
was returned for at least one of the charged offenses. Together, the observations in these columns make up the sample used
in our main analysis. Summary statistics for the proportion variables (i.e., proportion guilty convictions, proportion black on
seated jury, and proportion black in pool) were formed by measuring the proportion for each jury or jury pool and averaging
across cases.
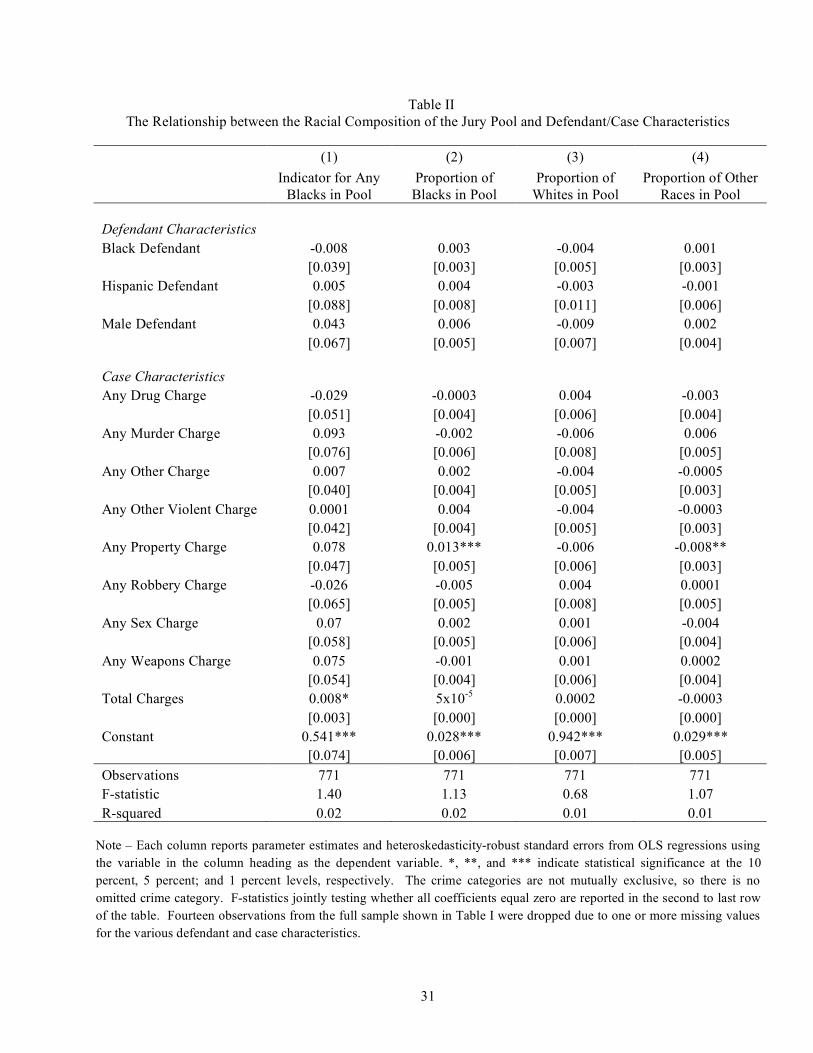
! 31!
Table II
The Relationship between the Racial Composition of the Jury Pool and Defendant/Case Characteristics
(1) (2) (3) (4)
Indicator for Any
Blacks in Pool
Proportion of
Blacks in Pool
Proportion of
Whites in Pool
Proportion of Other
Races in Pool
Defendant Characteristics
Black Defendant -0.008 0.003 -0.004 0.001
[0.039] [0.003] [0.005] [0.003]
Hispanic Defendant 0.005 0.004 -0.003 -0.001
[0.088] [0.008] [0.011] [0.006]
Male Defendant 0.043 0.006 -0.009 0.002
[0.067] [0.005] [0.007] [0.004]
Case Characteristics
Any Drug Charge -0.029 -0.0003 0.004 -0.003
[0.051] [0.004] [0.006] [0.004]
Any Murder Charge 0.093 -0.002 -0.006 0.006
[0.076] [0.006] [0.008] [0.005]
Any Other Charge 0.007 0.002 -0.004 -0.0005
[0.040] [0.004] [0.005] [0.003]
Any Other Violent Charge 0.0001 0.004 -0.004 -0.0003
[0.042] [0.004] [0.005] [0.003]
Any Property Charge 0.078 0.013*** -0.006 -0.008**
[0.047] [0.005] [0.006] [0.003]
Any Robbery Charge -0.026 -0.005 0.004 0.0001
[0.065] [0.005] [0.008] [0.005]
Any Sex Charge 0.07 0.002 0.001 -0.004
[0.058] [0.005] [0.006] [0.004]
Any Weapons Charge 0.075 -0.001 0.001 0.0002
[0.054] [0.004] [0.006] [0.004]
Total Charges 0.008* 5x10-5 0.0002 -0.0003
[0.003] [0.000] [0.000] [0.000]
Constant 0.541*** 0.028*** 0.942*** 0.029***
[0.074] [0.006] [0.007] [0.005]
Observations 771 771 771 771
F-statistic 1.40 1.13 0.68 1.07
R-squared 0.02 0.02 0.01 0.01
Note – Each column reports parameter estimates and heteroskedasticity-robust standard errors from OLS regressions using
the variable in the column heading as the dependent variable. *, **, and *** indicate statistical significance at the 10
percent, 5 percent; and 1 percent levels, respectively. The crime categories are not mutually exclusive, so there is no
omitted crime category. F-statistics jointly testing whether all coefficients equal zero are reported in the second to last row
of the table. Fourteen observations from the full sample shown in Table I were dropped due to one or more missing values
for the various defendant and case characteristics.
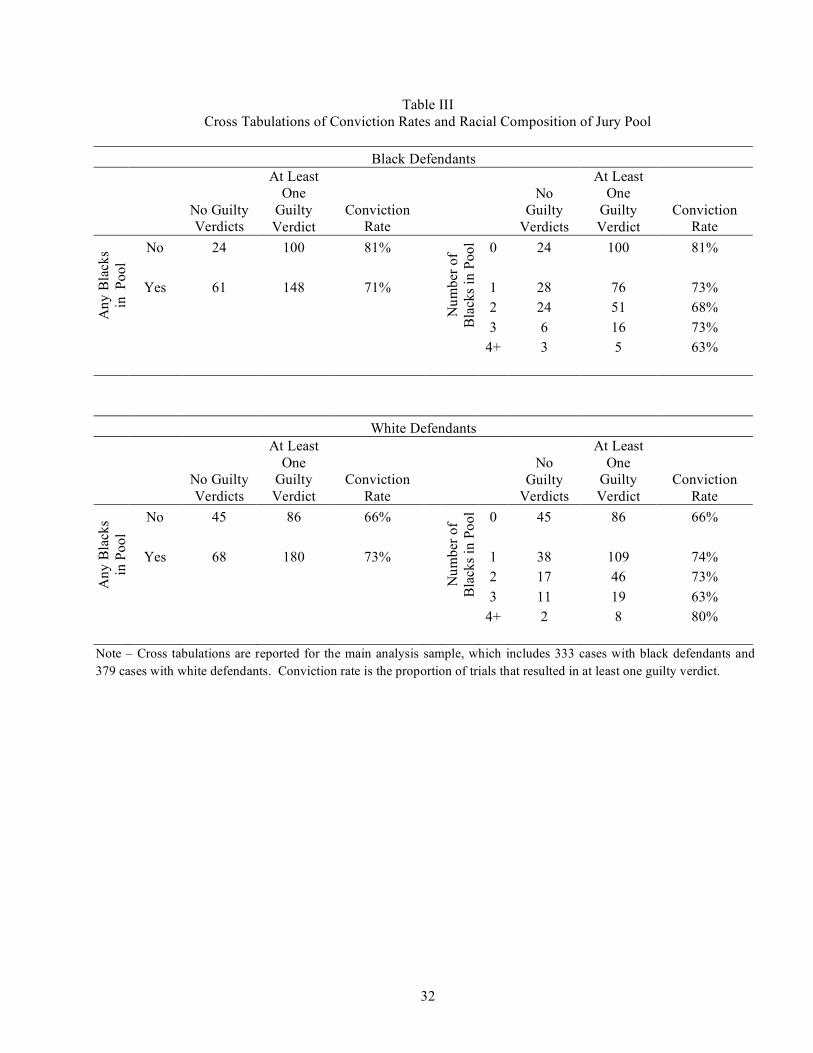
! 32!
Table III
Cross Tabulations of Conviction Rates and Racial Composition of Jury Pool
Black Defendants
No Guilty Verdicts
At Least One
Guilty
Verdict
Conviction Rate
No Guilty
Verdicts
At Least One
Guilty
Verdict
Conviction Rate
No 24 100 81% 0 24 100 81%
Yes 61 148 71% 1 28 76 73%
2 24 51 68%
An
y B
lack
s
in P
oo
l
Nu
mb
er o
f B
lack
s in
Po
ol
3 6 16 73%
4+ 3 5 63%
White Defendants
No Guilty
Verdicts
At Least
One Guilty
Verdict
Conviction
Rate
No
Guilty Verdicts
At Least
One Guilty
Verdict
Conviction
Rate
No 45 86 66% 0 45 86 66%
Yes 68 180 73% 1 38 109 74%
2 17 46 73%
An
y B
lack
s
in P
oo
l
Nu
mb
er o
f B
lack
s in
Po
ol
3 11 19 63%
4+ 2 8 80%
Note – Cross tabulations are reported for the main analysis sample, which includes 333 cases with black defendants and
379 cases with white defendants. Conviction rate is the proportion of trials that resulted in at least one guilty verdict.
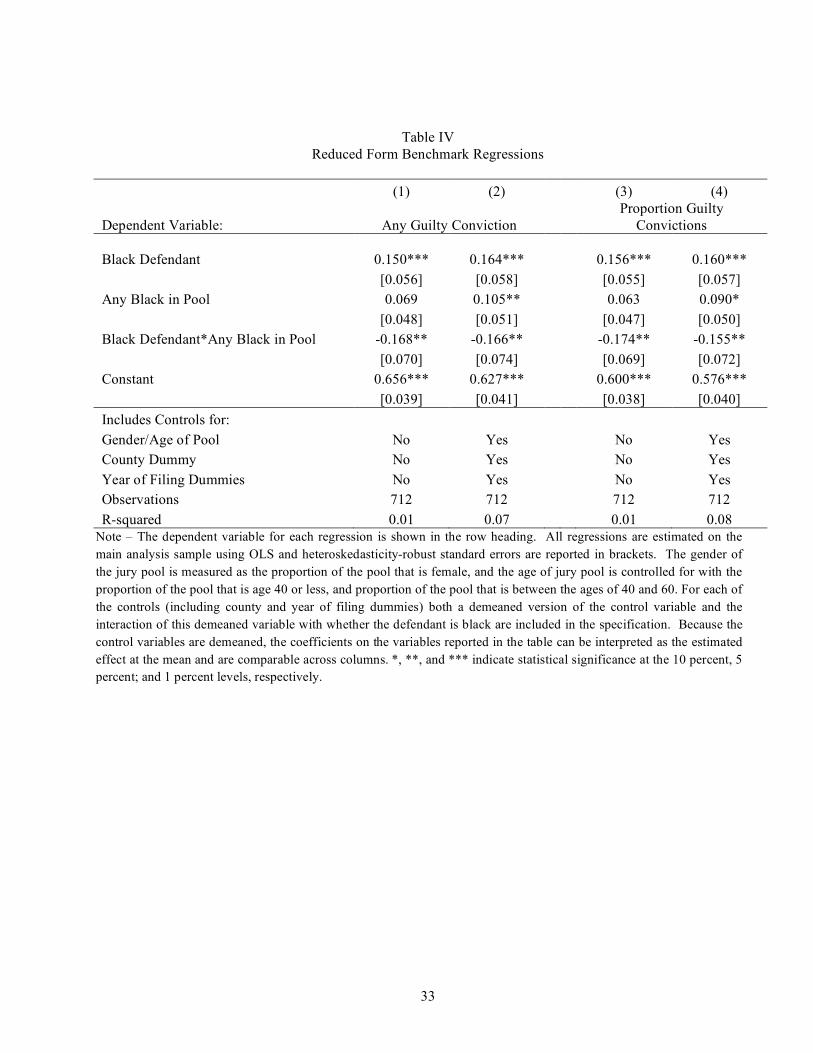
! 33!
Table IV
Reduced Form Benchmark Regressions
(1) (2) (3) (4)
Dependent Variable: Any Guilty Conviction
Proportion Guilty
Convictions
Black Defendant 0.150*** 0.164***
0.156*** 0.160***
[0.056] [0.058] [0.055] [0.057]
Any Black in Pool 0.069 0.105** 0.063 0.090*
[0.048] [0.051] [0.047] [0.050]
Black Defendant*Any Black in Pool -0.168** -0.166** -0.174** -0.155**
[0.070] [0.074] [0.069] [0.072]
Constant 0.656*** 0.627*** 0.600*** 0.576***
[0.039] [0.041] [0.038] [0.040]
Includes Controls for:
Gender/Age of Pool No Yes No Yes
County Dummy No Yes No Yes
Year of Filing Dummies No Yes No Yes
Observations 712 712 712 712
R-squared 0.01 0.07 0.01 0.08 Note – The dependent variable for each regression is shown in the row heading. All regressions are estimated on the
main analysis sample using OLS and heteroskedasticity-robust standard errors are reported in brackets. The gender of
the jury pool is measured as the proportion of the pool that is female, and the age of jury pool is controlled for with the
proportion of the pool that is age 40 or less, and proportion of the pool that is between the ages of 40 and 60. For each of
the controls (including county and year of filing dummies) both a demeaned version of the control variable and the
interaction of this demeaned variable with whether the defendant is black are included in the specification. Because the
control variables are demeaned, the coefficients on the variables reported in the table can be interpreted as the estimated
effect at the mean and are comparable across columns. *, **, and *** indicate statistical significance at the 10 percent, 5
percent; and 1 percent levels, respectively.
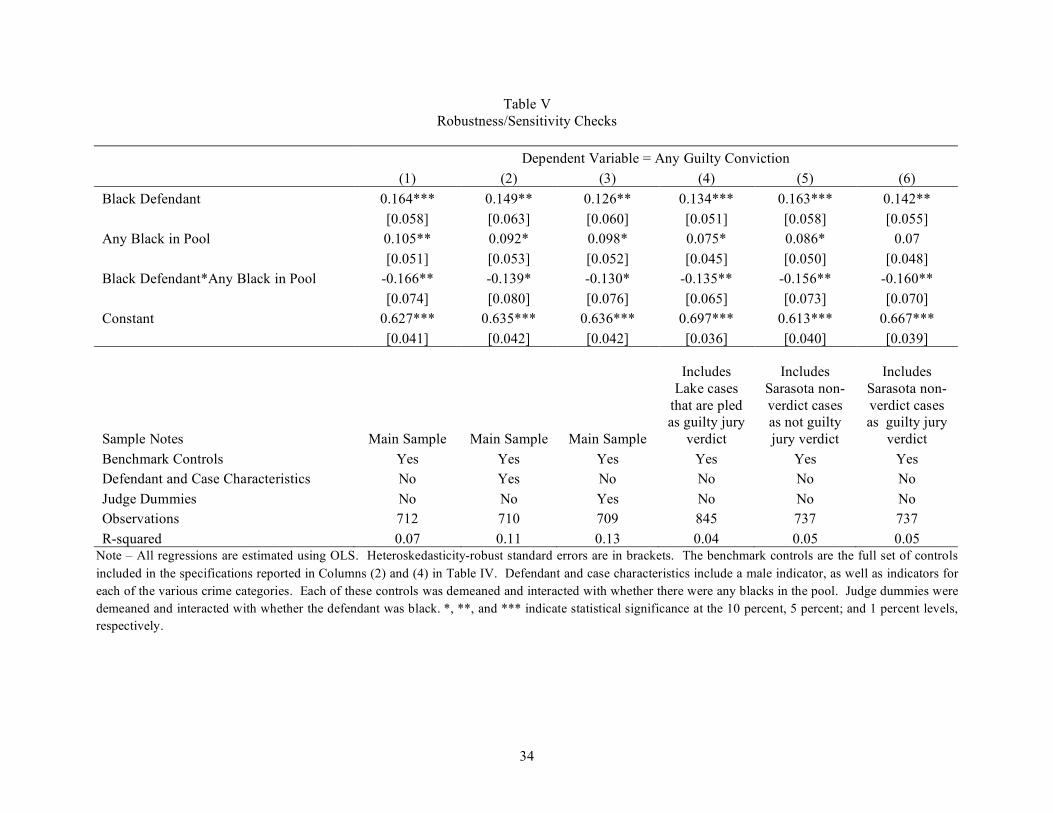
! 34!
Table V
Robustness/Sensitivity Checks
Dependent Variable = Any Guilty Conviction
(1) (2) (3) (4) (5) (6)
Black Defendant 0.164*** 0.149** 0.126** 0.134*** 0.163*** 0.142**
[0.058] [0.063] [0.060] [0.051] [0.058] [0.055]
Any Black in Pool 0.105** 0.092* 0.098* 0.075* 0.086* 0.07
[0.051] [0.053] [0.052] [0.045] [0.050] [0.048]
Black Defendant*Any Black in Pool -0.166** -0.139* -0.130* -0.135** -0.156** -0.160**
[0.074] [0.080] [0.076] [0.065] [0.073] [0.070]
Constant 0.627*** 0.635*** 0.636*** 0.697*** 0.613*** 0.667***
[0.041] [0.042] [0.042] [0.036] [0.040] [0.039]
Sample Notes Main Sample Main Sample Main Sample
Includes
Lake cases
that are pled
as guilty jury
verdict
Includes
Sarasota non-
verdict cases
as not guilty
jury verdict
Includes
Sarasota non-
verdict cases
as guilty jury
verdict
Benchmark Controls Yes Yes Yes Yes Yes Yes
Defendant and Case Characteristics No Yes No No No No
Judge Dummies No No Yes No No No
Observations 712 710 709 845 737 737
R-squared 0.07 0.11 0.13 0.04 0.05 0.05 Note – All regressions are estimated using OLS. Heteroskedasticity-robust standard errors are in brackets. The benchmark controls are the full set of controls
included in the specifications reported in Columns (2) and (4) in Table IV. Defendant and case characteristics include a male indicator, as well as indicators for
each of the various crime categories. Each of these controls was demeaned and interacted with whether there were any blacks in the pool. Judge dummies were
demeaned and interacted with whether the defendant was black. *, **, and *** indicate statistical significance at the 10 percent, 5 percent; and 1 percent levels,
respectively.
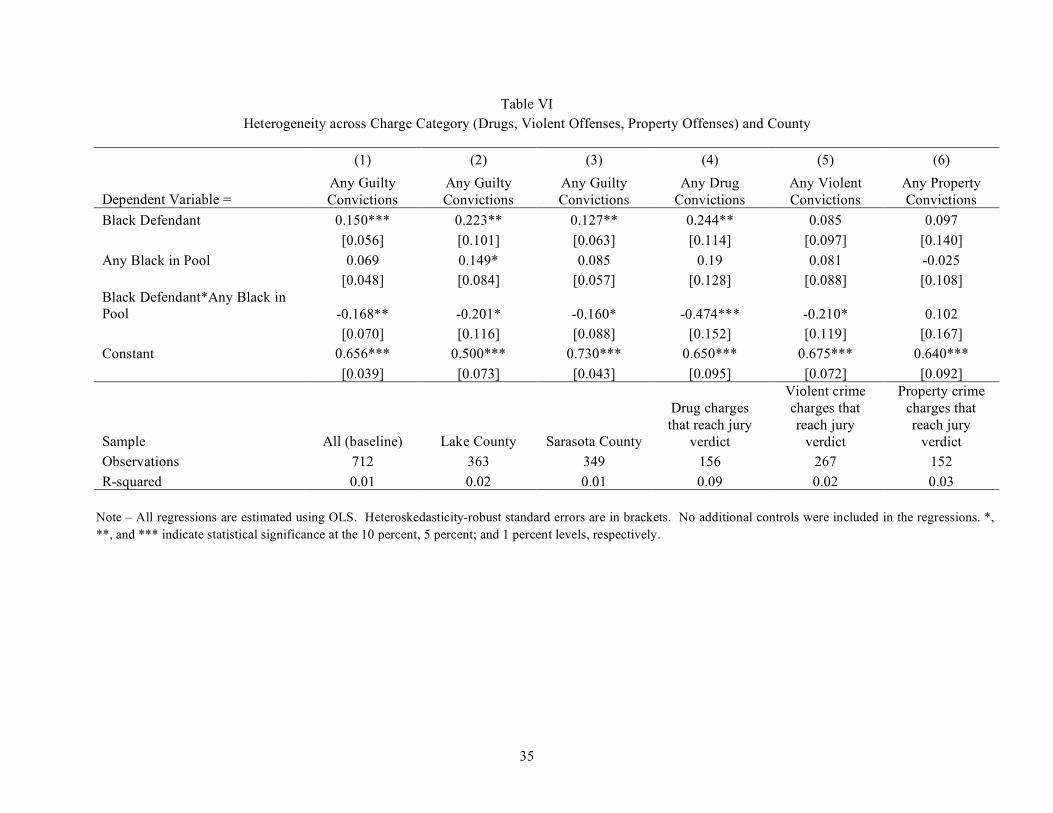
! 35!
Table VI
Heterogeneity across Charge Category (Drugs, Violent Offenses, Property Offenses) and County
(1) (2) (3) (4) (5) (6)
Dependent Variable =
Any Guilty
Convictions
Any Guilty
Convictions
Any Guilty
Convictions
Any Drug
Convictions
Any Violent
Convictions
Any Property
Convictions
Black Defendant 0.150*** 0.223** 0.127** 0.244** 0.085 0.097
[0.056] [0.101] [0.063] [0.114] [0.097] [0.140]
Any Black in Pool 0.069 0.149* 0.085 0.19 0.081 -0.025
[0.048] [0.084] [0.057] [0.128] [0.088] [0.108]
Black Defendant*Any Black in
Pool -0.168** -0.201* -0.160* -0.474*** -0.210* 0.102
[0.070] [0.116] [0.088] [0.152] [0.119] [0.167]
Constant 0.656*** 0.500*** 0.730*** 0.650*** 0.675*** 0.640***
[0.039] [0.073] [0.043] [0.095] [0.072] [0.092]
Sample All (baseline) Lake County Sarasota County
Drug charges
that reach jury
verdict
Violent crime
charges that
reach jury
verdict
Property crime
charges that
reach jury
verdict
Observations 712 363 349 156 267 152
R-squared 0.01 0.02 0.01 0.09 0.02 0.03
Note – All regressions are estimated using OLS. Heteroskedasticity-robust standard errors are in brackets. No additional controls were included in the regressions. *,
**, and *** indicate statistical significance at the 10 percent, 5 percent; and 1 percent levels, respectively.
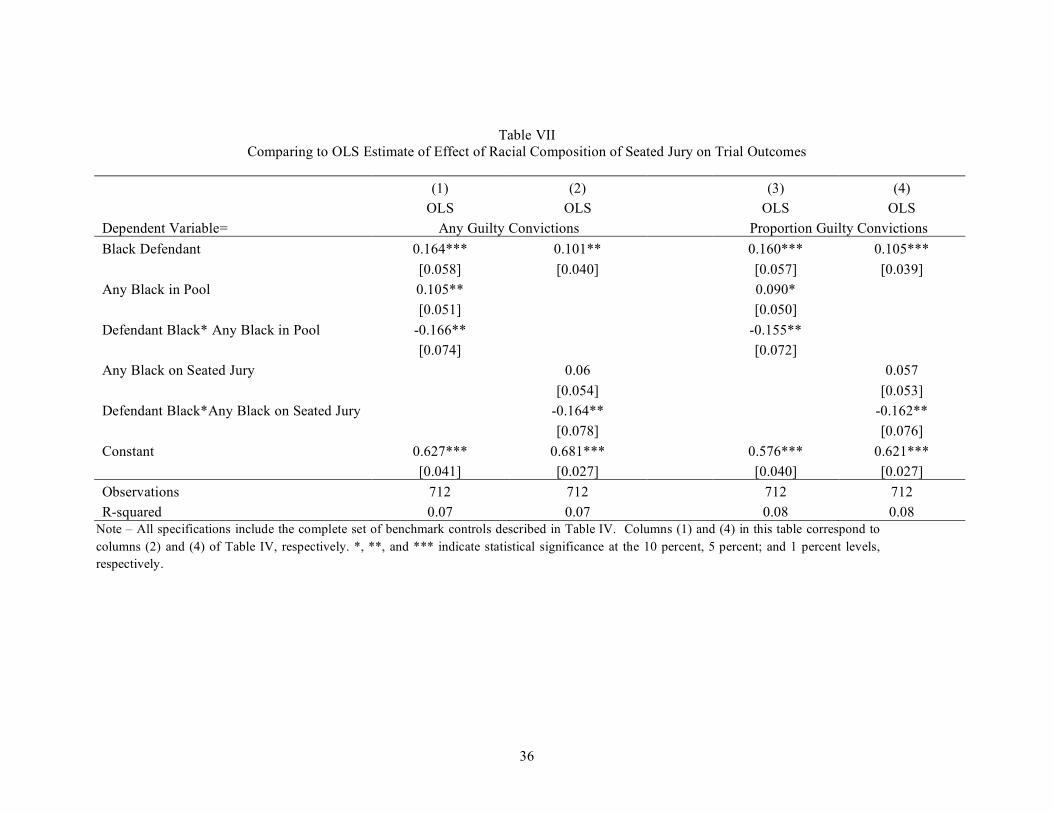
! 36!
Table VII
Comparing to OLS Estimate of Effect of Racial Composition of Seated Jury on Trial Outcomes
(1) (2) (3) (4)
OLS OLS OLS OLS
Dependent Variable= Any Guilty Convictions Proportion Guilty Convictions
Black Defendant 0.164*** 0.101** 0.160*** 0.105***
[0.058] [0.040] [0.057] [0.039]
Any Black in Pool 0.105** 0.090*
[0.051] [0.050]
Defendant Black* Any Black in Pool -0.166** -0.155**
[0.074] [0.072]
Any Black on Seated Jury 0.06 0.057
[0.054] [0.053]
Defendant Black*Any Black on Seated Jury -0.164** -0.162**
[0.078] [0.076]
Constant 0.627*** 0.681*** 0.576*** 0.621***
[0.041] [0.027] [0.040] [0.027]
Observations 712 712 712 712
R-squared 0.07 0.07 0.08 0.08
Note – All specifications include the complete set of benchmark controls described in Table IV. Columns (1) and (4) in this table correspond to
columns (2) and (4) of Table IV, respectively. *, **, and *** indicate statistical significance at the 10 percent, 5 percent; and 1 percent levels,
respectively.
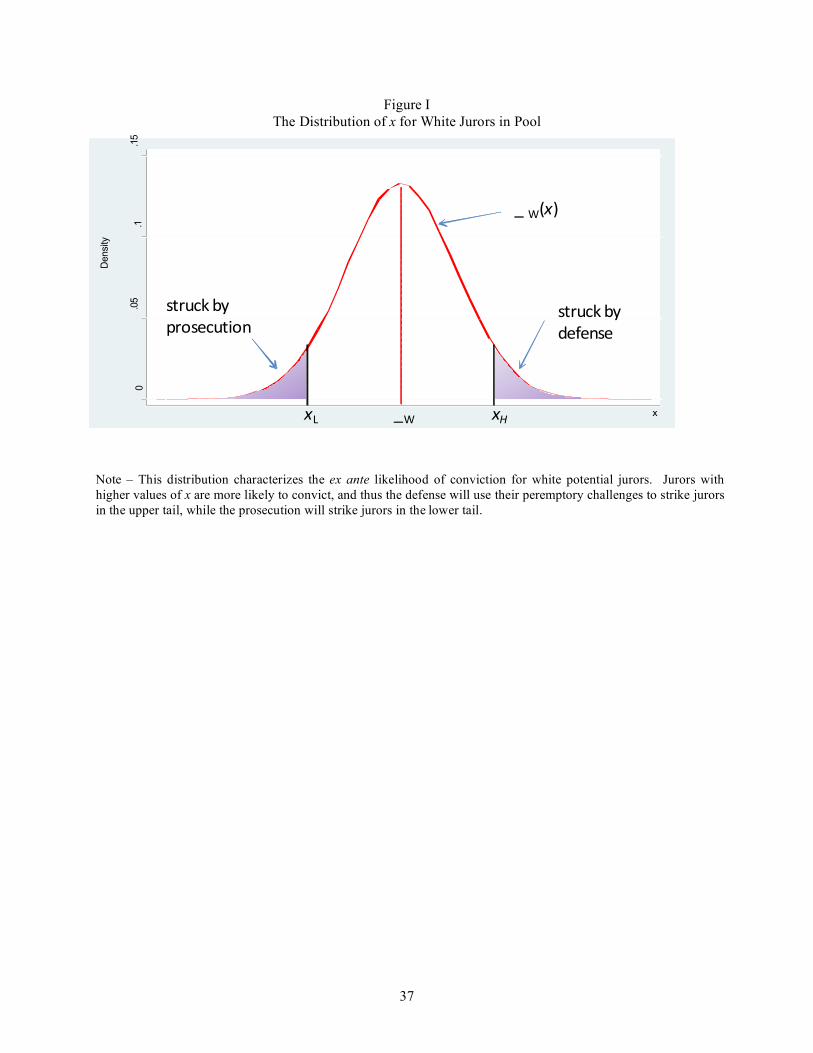
! 37!
Figure I
The Distribution of x for White Jurors in Pool 0
.05
.1.15
Density
x!"!# !"
! "$!%
&'()*+,-.,,,,
/0102&0
&'()*+,-.,
3(4&0*)'542
!
Note – This distribution characterizes the ex ante likelihood of conviction for white potential jurors. Jurors with
higher values of x are more likely to convict, and thus the defense will use their peremptory challenges to strike jurors
in the upper tail, while the prosecution will strike jurors in the lower tail.
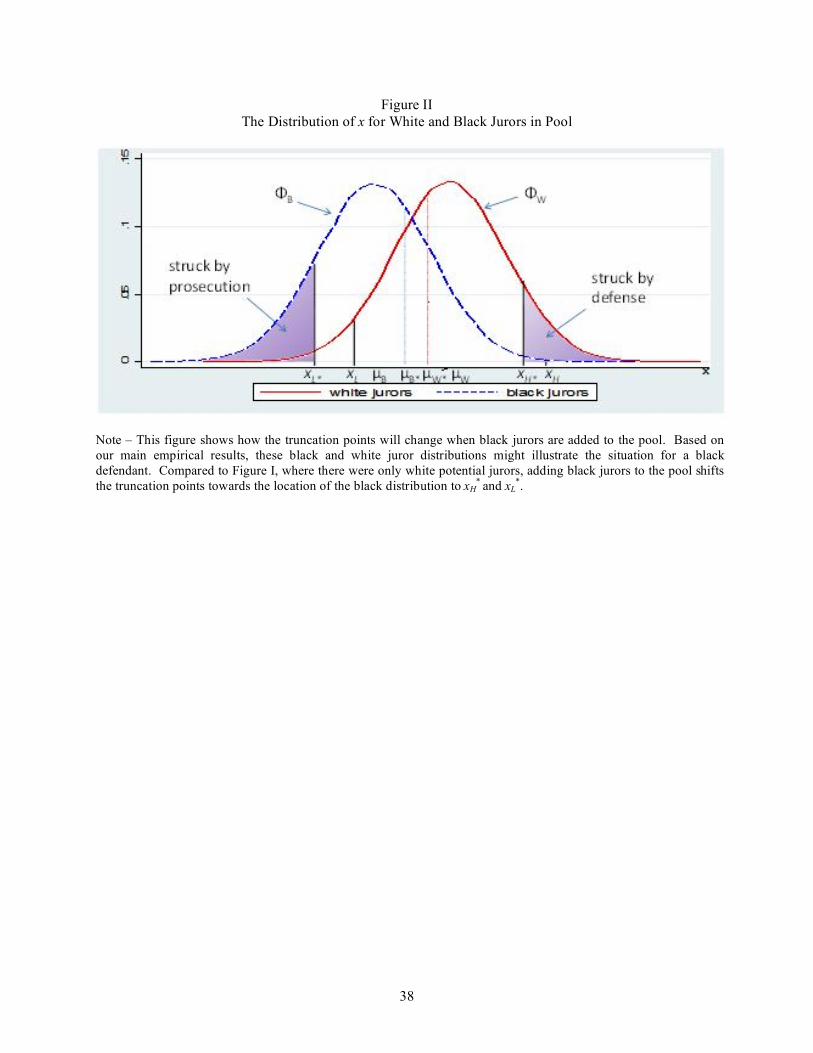
! 38!
Figure II
The Distribution of x for White and Black Jurors in Pool
!
Note – This figure shows how the truncation points will change when black jurors are added to the pool. Based on
our main empirical results, these black and white juror distributions might illustrate the situation for a black
defendant. Compared to Figure I, where there were only white potential jurors, adding black jurors to the pool shifts
the truncation points towards the location of the black distribution to xH*
and xL*.
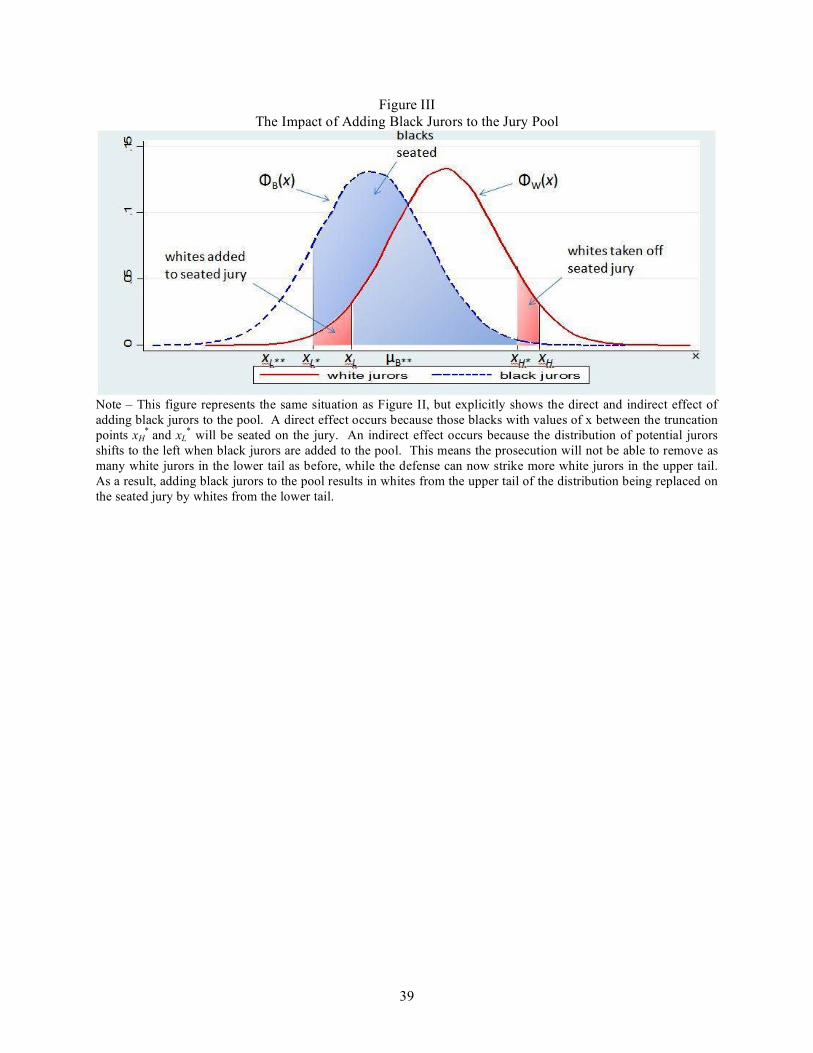
! 39!
Figure III
The Impact of Adding Black Jurors to the Jury Pool
Note – This figure represents the same situation as Figure II, but explicitly shows the direct and indirect effect of
adding black jurors to the pool. A direct effect occurs because those blacks with values of x between the truncation
points xH*
and xL* will be seated on the jury. An indirect effect occurs because the distribution of potential jurors
shifts to the left when black jurors are added to the pool. This means the prosecution will not be able to remove as
many white jurors in the lower tail as before, while the defense can now strike more white jurors in the upper tail.
As a result, adding black jurors to the pool results in whites from the upper tail of the distribution being replaced on
the seated jury by whites from the lower tail.
!
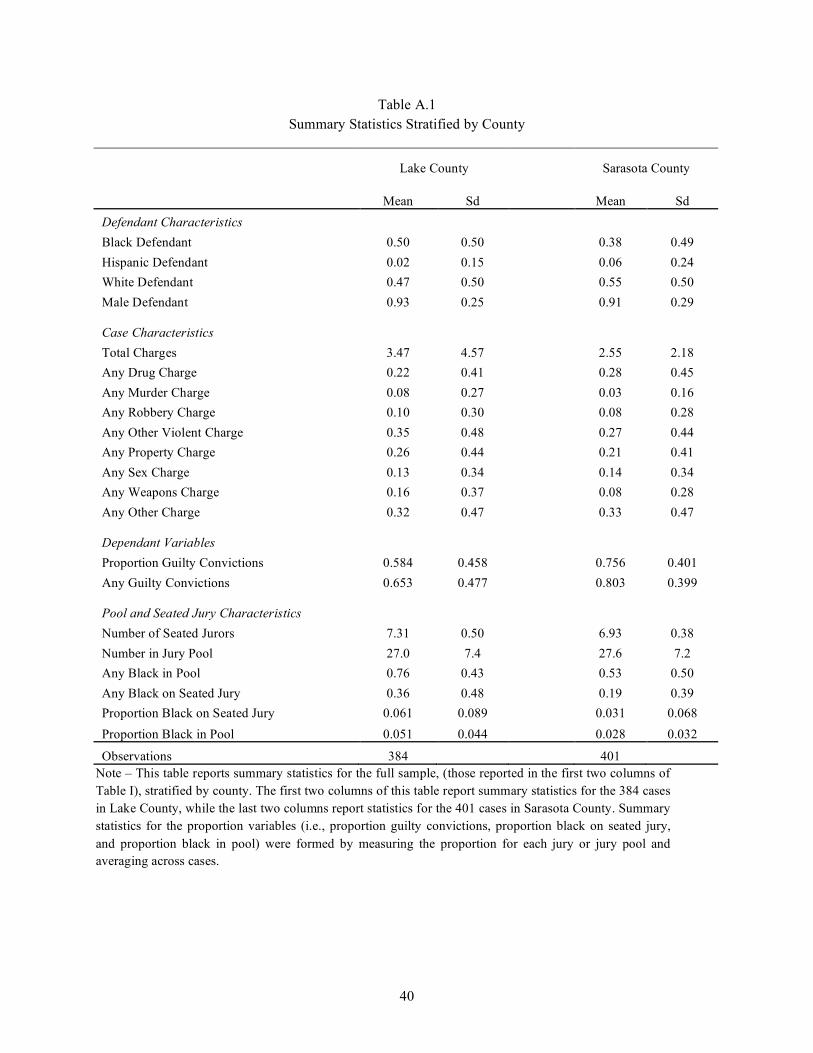
! 40!
Table A.1
Summary Statistics Stratified by County
Lake County Sarasota County
Mean Sd Mean Sd
Defendant Characteristics
Black Defendant 0.50 0.50 0.38 0.49
Hispanic Defendant 0.02 0.15 0.06 0.24
White Defendant 0.47 0.50 0.55 0.50
Male Defendant 0.93 0.25 0.91 0.29
Case Characteristics
Total Charges 3.47 4.57 2.55 2.18
Any Drug Charge 0.22 0.41 0.28 0.45
Any Murder Charge 0.08 0.27 0.03 0.16
Any Robbery Charge 0.10 0.30 0.08 0.28
Any Other Violent Charge 0.35 0.48 0.27 0.44
Any Property Charge 0.26 0.44 0.21 0.41
Any Sex Charge 0.13 0.34 0.14 0.34
Any Weapons Charge 0.16 0.37 0.08 0.28
Any Other Charge 0.32 0.47 0.33 0.47
Dependant Variables
Proportion Guilty Convictions 0.584 0.458 0.756 0.401
Any Guilty Convictions 0.653 0.477 0.803 0.399
Pool and Seated Jury Characteristics
Number of Seated Jurors 7.31 0.50 6.93 0.38
Number in Jury Pool 27.0 7.4 27.6 7.2
Any Black in Pool 0.76 0.43 0.53 0.50
Any Black on Seated Jury 0.36 0.48 0.19 0.39
Proportion Black on Seated Jury 0.061 0.089 0.031 0.068
Proportion Black in Pool 0.051 0.044 0.028 0.032
Observations 384 401
Note – This table reports summary statistics for the full sample, (those reported in the first two columns of
Table I), stratified by county. The first two columns of this table report summary statistics for the 384 cases
in Lake County, while the last two columns report statistics for the 401 cases in Sarasota County. Summary
statistics for the proportion variables (i.e., proportion guilty convictions, proportion black on seated jury,
and proportion black in pool) were formed by measuring the proportion for each jury or jury pool and
averaging across cases.
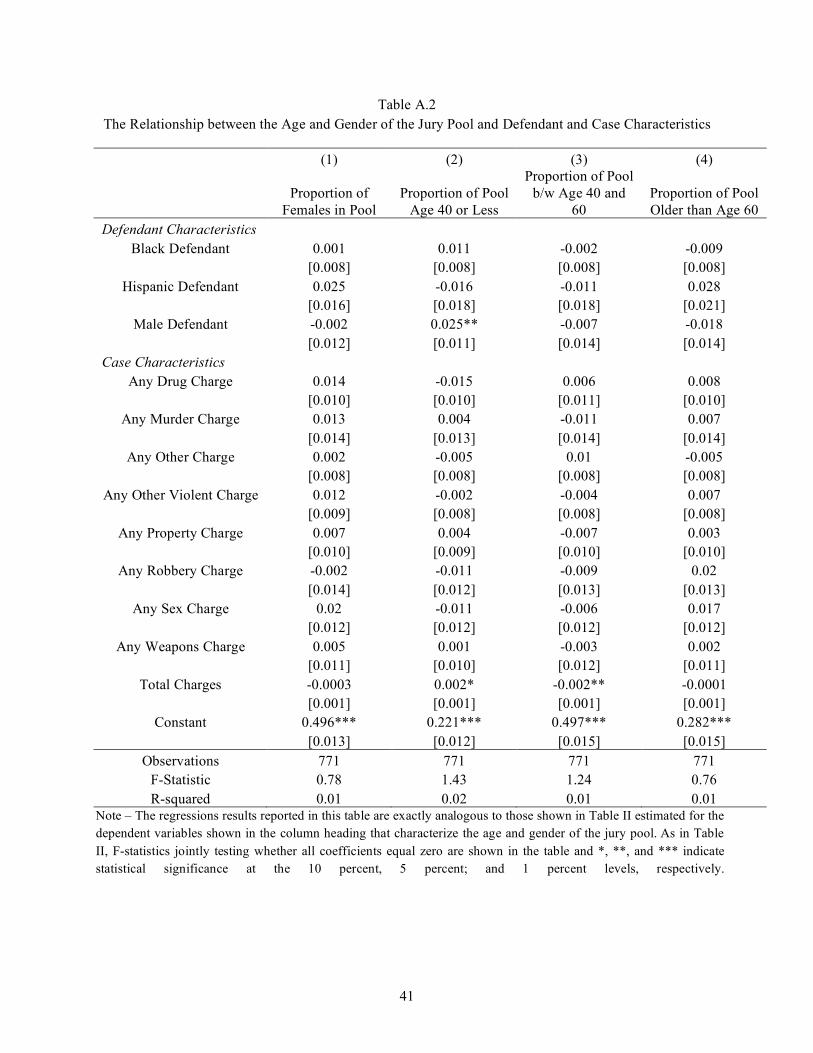
! 41!
Table A.2
The Relationship between the Age and Gender of the Jury Pool and Defendant and Case Characteristics
(1) (2) (3) (4)
Proportion of
Females in Pool
Proportion of Pool
Age 40 or Less
Proportion of Pool
b/w Age 40 and
60
Proportion of Pool
Older than Age 60
Defendant Characteristics
Black Defendant 0.001 0.011 -0.002 -0.009
[0.008] [0.008] [0.008] [0.008]
Hispanic Defendant 0.025 -0.016 -0.011 0.028
[0.016] [0.018] [0.018] [0.021]
Male Defendant -0.002 0.025** -0.007 -0.018
[0.012] [0.011] [0.014] [0.014]
Case Characteristics
Any Drug Charge 0.014 -0.015 0.006 0.008
[0.010] [0.010] [0.011] [0.010]
Any Murder Charge 0.013 0.004 -0.011 0.007
[0.014] [0.013] [0.014] [0.014]
Any Other Charge 0.002 -0.005 0.01 -0.005
[0.008] [0.008] [0.008] [0.008]
Any Other Violent Charge 0.012 -0.002 -0.004 0.007
[0.009] [0.008] [0.008] [0.008]
Any Property Charge 0.007 0.004 -0.007 0.003
[0.010] [0.009] [0.010] [0.010]
Any Robbery Charge -0.002 -0.011 -0.009 0.02
[0.014] [0.012] [0.013] [0.013]
Any Sex Charge 0.02 -0.011 -0.006 0.017
[0.012] [0.012] [0.012] [0.012]
Any Weapons Charge 0.005 0.001 -0.003 0.002
[0.011] [0.010] [0.012] [0.011]
Total Charges -0.0003 0.002* -0.002** -0.0001
[0.001] [0.001] [0.001] [0.001]
Constant 0.496*** 0.221*** 0.497*** 0.282***
[0.013] [0.012] [0.015] [0.015]
Observations 771 771 771 771
F-Statistic 0.78 1.43 1.24 0.76
R-squared 0.01 0.02 0.01 0.01 Note – The regressions results reported in this table are exactly analogous to those shown in Table II estimated for the
dependent variables shown in the column heading that characterize the age and gender of the jury pool. As in Table
II, F-statistics jointly testing whether all coefficients equal zero are shown in the table and *, **, and *** indicate
statistical significance at the 10 percent, 5 percent; and 1 percent levels, respectively.
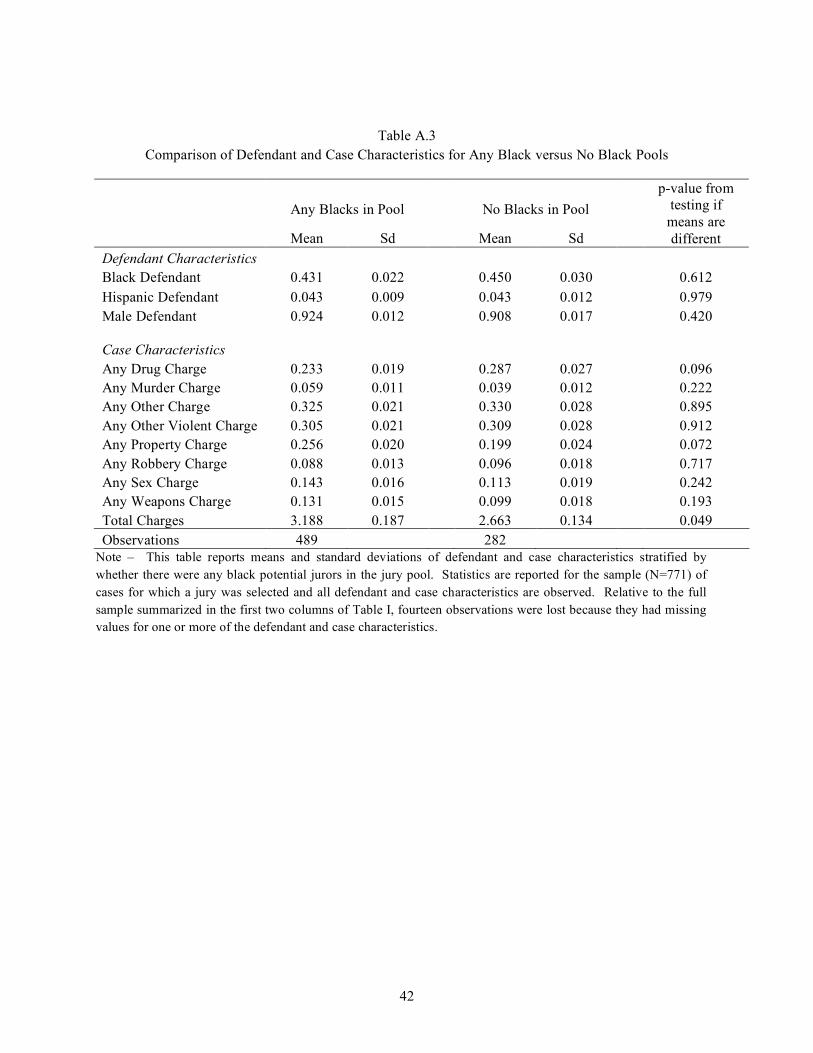
! 42!
Table A.3
Comparison of Defendant and Case Characteristics for Any Black versus No Black Pools
Any Blacks in Pool No Blacks in Pool
Mean Sd Mean Sd
p-value from
testing if
means are
different
Defendant Characteristics
Black Defendant 0.431 0.022 0.450 0.030 0.612
Hispanic Defendant 0.043 0.009 0.043 0.012 0.979
Male Defendant 0.924 0.012 0.908 0.017 0.420
Case Characteristics
Any Drug Charge 0.233 0.019 0.287 0.027 0.096
Any Murder Charge 0.059 0.011 0.039 0.012 0.222
Any Other Charge 0.325 0.021 0.330 0.028 0.895
Any Other Violent Charge 0.305 0.021 0.309 0.028 0.912
Any Property Charge 0.256 0.020 0.199 0.024 0.072
Any Robbery Charge 0.088 0.013 0.096 0.018 0.717
Any Sex Charge 0.143 0.016 0.113 0.019 0.242
Any Weapons Charge 0.131 0.015 0.099 0.018 0.193
Total Charges 3.188 0.187 2.663 0.134 0.049
Observations 489 282
Note – This table reports means and standard deviations of defendant and case characteristics stratified by
whether there were any black potential jurors in the jury pool. Statistics are reported for the sample (N=771) of
cases for which a jury was selected and all defendant and case characteristics are observed. Relative to the full
sample summarized in the first two columns of Table I, fourteen observations were lost because they had missing
values for one or more of the defendant and case characteristics.