Embed Size (px)
Citation preview
THE IMPACT OF LEAKAGES FROM 401(K)S AND IRAS
Alicia H. Munnell and Anthony Webb
CRR WP 2015-2 Submitted: December 2014
Released: February 2015
Center for Retirement Research at Boston College
Hovey House 140 Commonwealth Avenue
Chestnut Hill, MA 02467 Tel: 617-552-1762 Fax: 617-552-0191
http://crr.bc.edu
The research reported herein was performed pursuant to a grant from the U.S. Social Security Administration (SSA) funded as part of the Retirement Research Consortium. The preliminary research for this project also received some support from the Congressional Research Service (CRS). The opinions and conclusions expressed are solely those of the authors and do not represent the opinions or policy of SSA, any agency of the federal government, CRS, or Boston College. Neither the United States Government nor any agency thereof, nor any of their employees, makes any warranty, express or implied, or assumes any legal liability or responsibility for the accuracy, completeness, or usefulness of the contents of this report. Reference herein to any specific commercial product, process or service by trade name, trademark, manufacturer, or otherwise does not necessarily constitute or imply endorsement, recommendation or favoring by the United States Government or any agency thereof. The authors would like to thank Dina Bleckman and Wenliang Hou for able research assistance and Stephen Utkus and Jean Young of Vanguard for valuable comments. © 2015, Alicia H. Munnell and Anthony Webb. All rights reserved. Short sections of text, not to exceed two paragraphs, may be quoted without explicit permission provided that full credit, including © notice, is given to the source.
About the Center for Retirement Research The Center for Retirement Research at Boston College, part of a consortium that includes parallel centers at the University of Michigan and the National Bureau of Economic Research, was established in 1998 through a grant from the Social Security Administration. The Center’s mission is to produce first-class research and forge a strong link between the academic community and decision-makers in the public and private sectors around an issue of critical importance to the nation’s future. To achieve this mission, the Center sponsors a wide variety of research projects, transmits new findings to a broad audience, trains new scholars, and broadens access to valuable data sources.
Center for Retirement Research at Boston College Hovey House
140 Commonwealth Ave Chestnut Hill, MA 02467
Tel: 617-552-1762 Fax: 617-552-0191 http://crr.bc.edu
Affiliated Institutions: The Brookings Institution
Massachusetts Institute of Technology Syracuse University
Urban Institute
Abstract This paper summarizes what is known about leakages from existing studies and relates these results to detailed data on leakages in 2013 provided by Vanguard’s How America Saves. It then uses two data sets – the Survey of Consumer Finances (SCF) and the Survey of Income and Program Participation (SIPP) – to estimate the impact of leakages on wealth at retirement. The Vanguard data are a critical component because they provide a comprehensive picture of assets and participant flows, whereas the surveys on which earlier studies were based tended to focus on one component, such as loans. A key limitation is that Vanguard’s population is probably older and wealthier than the general population. The paper found that:
• About 1.5 percent of assets leak out of the 401(k)/IRA system each year. • Of the different forms of leakages, in-service withdrawals and cashouts appear to
represent the most significant source of leakages, while loans created a measurable but relatively small leakage.
• Based on our estimates, aggregate 401(k) and IRA retirement wealth is at least 20 percent lower than it would have been without current leakage rules.
The policy implications of the findings are: • Hardship withdrawals could be limited to serious, unpredictable hardships and the
amounts distributed not subject to the 10-percent penalty. • The age for non-penalized withdrawals from both 401(k) and IRAs could be raised to at
least Social Security’s Earliest Eligibility Age, which is currently 62. • The cash-out mechanism could be closed down entirely, by changing the law to prohibit
lump-sum distributions upon termination.
1
Introduction
Today employer-sponsored 401(k) plans are the primary mechanism through which
private sector workers put aside savings for retirement. The balances in these accounts, together
with 401(k) monies rolled over to Individual Retirement Accounts (IRAs), are expected to
provide the main source of retirement income other than Social Security in the future. Yet, the
Federal Reserve’s 2013 Survey of Consumer Finances shows that working households with a
401(k) approaching retirement (age 55-64) had median combined 401(k)/IRA assets of only
$111,000. High fees, moving in and out of coverage (a snapshot shows only half of the private
sector workforce is covered by any kind of employer-sponsored retirement plan), and the slow
maturation of the system contribute to the low balances, but leakages from 401(k)s and IRAs
also erode retirement savings. This paper summarizes what is known about the size of the
leakages and their impact on retirement wealth and presents some options designed to increase
balances in retirement accounts.
The discussion proceeds as follows. The first section describes the development of
401(k) accounts and IRAs, and their role in the retirement system. The second section provides
an overview of the existing sources of leakage – in-service withdrawals (which include hardship
withdrawals and withdrawals after age 59½, the age at which withdrawals are permitted without
restriction or penalty), cashouts at termination, and loans. The third section discusses the
evidence to date regarding leakages from both 401(k) plans and IRAs, which suggests that
roughly 1.5 percent of assets leak out each year. The fourth section estimates – based on a host
of simplifying assumptions – that such a leakage rate reduces aggregate age-60 retirement assets
by more than 20 percent, averaged over both individuals who access their balances before
retirement and those who do not. It then uses the Survey of Income and Program Participation
(SIPP), linked to W-2 earnings records, to show the relative impact of leakages, compared to
other factors, on reducing 401(k)/IRA balances.
The final section summarizes existing reform proposals, but also suggests that it is time
for a broad reassessment of current policy. While defined contribution accounts are intended for
retirement, leakages mean that they are also used to finance pre-retirement consumption. The
leakages may be spent in worthwhile ways, but they put retirements at risk. Recognizing the
tradeoff between allowing access to needed funds – and thereby encouraging participation and
contributions – and the risk to balances from leakages, this section presents a series of options to
2
improve outcomes in retirement accounts. These proposals include: 1) eliminating all cashouts
at termination; 2) reducing the list of hardship withdrawals to only true emergencies; make sure
the events are easily verifiable and consistent between 401(k)s and IRAs; and allow the money to
be withdrawn penalty free; 3) raising age 59½ to at least age 62; and 4) allowing loans to
continue to serve as a safety valve.
Background
Leakages, for the purposes of this study, are defined as any type of pre-retirement
withdrawal that permanently removes money from retirement saving accounts. When
considering the issue of leakages, two developments are important. The first is the shift from
defined benefit plans to 401(k)s in the private sector, which explains the significance of 401(k)s
as a mechanism for retirement saving. The second is the movement of retirement assets from
401(k) plans to Individual Retirement Accounts, which explains the need to look beyond 401(k)s
when considering options to reduce leakages.
The Growth of 401(k)s
In 1980, most workers covered by a pension participated in defined benefit plans, which
provide lifelong benefits based on years of service and final salary. For employees who remain
with one firm throughout their working lives, defined benefit plans can offer a predictable and
substantial stream of monthly benefits. Mobile employees, however, forfeit some pension
income when they change employers, which means that leakages also occur in defined benefit
plans, even though they are not observable or measurable.
401(k) plans owe their origins to the Revenue Act of 1978, which allowed elective
contributions to tax-favored retirement plans. Policymakers, however, wanted an arrangement
that benefited more just than the highly paid and so constructed Section 401(k) of the Internal
Revenue Code with a special nondiscrimination test to ensure that the plans with elective
contributions also benefited the rank and file. The need for broad participation explains why
matching contributions are a common feature of 401(k) plans. The Revenue Act of 1978 went
into effect in January 1980. In 1981 the Internal Revenue Service issued proposed regulations
that sanctioned the use of employee salary reduction plans for retirement contributions.
3
The 401(k) plan is a retirement savings account. The employee, and most often the
employer, contributes a percentage of earnings into the account.1 These contributions are
invested, generally at the direction of the employee, mostly in stock and bond mutual funds.
Contributions are excluded from taxable income. Interest, dividends, and capital gains within the
plan are untaxed. Withdrawals are taxed as income. Assuming a constant marginal tax rate, the
net effect is to enable participants to earn a tax-free rate of return on net-of-tax contributions.
401(k) plans have characteristics that clearly appeal to employees. In addition to the tax
benefits, these plans are portable, thus mobile workers are able to transfer their funds when they
change employers. Employees receive regular updates on the status of their accounts, and many
have immediate access to data on plan balances via sponsors’ websites. Likewise, plans permit
some investment choice, giving account holders a sense of control over their retirement funds.
The stock market boom of the 1980s and 1990s greatly enhanced the popularity of these plans.
Employers also found 401(k) plans very attractive. These plans are a tangible benefit,
which employees appreciate. Employers can use 401(k) plans (like defined benefit plans) to
attract workers who value saving and who, some economists argue, are more conscientious and
productive.2 Employers’ contributions are also controllable and, unlike contributions to defined
benefit plans, do not vary with interest rates and investment returns. When the stock market
plummets, the employee, not the employer, suffers the loss. When interest rates fall, rather than
the employer paying more for an annuity, the employee realizes a lower retirement income.
Moreover, 401(k) plans are fully funded by definition, eliminating the work and expense
associated with funding requirements and pension insurance.3
1 The following describes the conventional 401(k). Under a Roth 401(k), the individual contributes after-tax dollars, pays no tax on investment returns, and takes the money out tax-free, thus permitting the participant to earn a tax-free rate of return on the dollar amount contributed. Employers’ contributions may not be invested in a Roth 401(k). 2 Ippolito (1998). 3 Another attraction for employers is that, in contrast to defined benefit plans, the bulk of 401(k) contributions come from employees rather than from employers. (According to Vanguard (2013), 60 percent of 401(k) contributions comes from employees and 40 percent from employers, whereas in defined benefit plans the employer pays 100 percent.) The question is whether the shift in the party making the contribution actually represents a shift in burden. Economists would argue that employers decide on the total compensation they must pay their employees and divide that amount between cash wages and fringe benefits. Providing a pension benefit thus implies a cut in wages or a reduction in other benefits, and vice versa. If the economists are correct, similarly situated employees covered by 401(k) plans should have higher (pre-contribution) cash wages than those covered by defined benefit plans. In this case, the fact that the employee makes the payment does not imply an increased burden. An alternative hypothesis is that global competition has put downward pressure on wages in the United States and that employers have used the shift in coverage to 401(k) plans as a mechanism to slow wage growth. No empirical work has been done to sort out this issue.
4
When 401(k) plans began to spread rapidly in the early 1980s, they were viewed mainly
as supplements to employer-funded pension and profit-sharing plans.4 Since 401(k) participants
were presumed to have their basic retirement income security needs covered by an employer-
funded plan and Social Security, they were given substantial discretion over 401(k) choices,
including whether to participate, how much to contribute, how to invest, and when and in what
form to withdraw the funds. The flip side of such discretion was a significant transfer of risk to
participants, whose retirement saving outcomes now depended on their own decisions. While
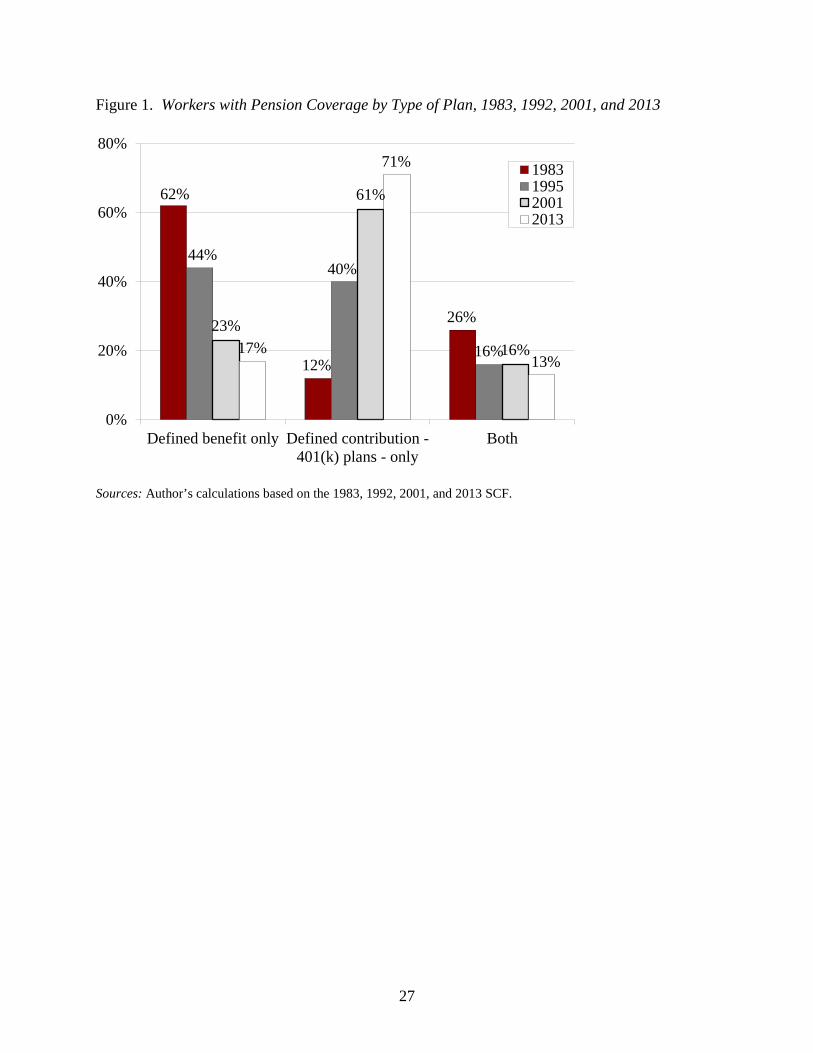
the nature of the pension landscape has changed dramatically since the early 1980s (see Figure
1), the freedom and corresponding risks associated with 401(k) plans have remained unchanged.
These include the numerous ways that individuals can withdraw their money before retirement.
The Shift from 401(k) Plans to IRAs
One little noticed change, which has major implications for leakages, is the movement of
money from 401(k) plans to IRAs. The increase in IRAs has occurred, in large part, because
many individuals roll over their balances when they shift jobs during their worklives and when
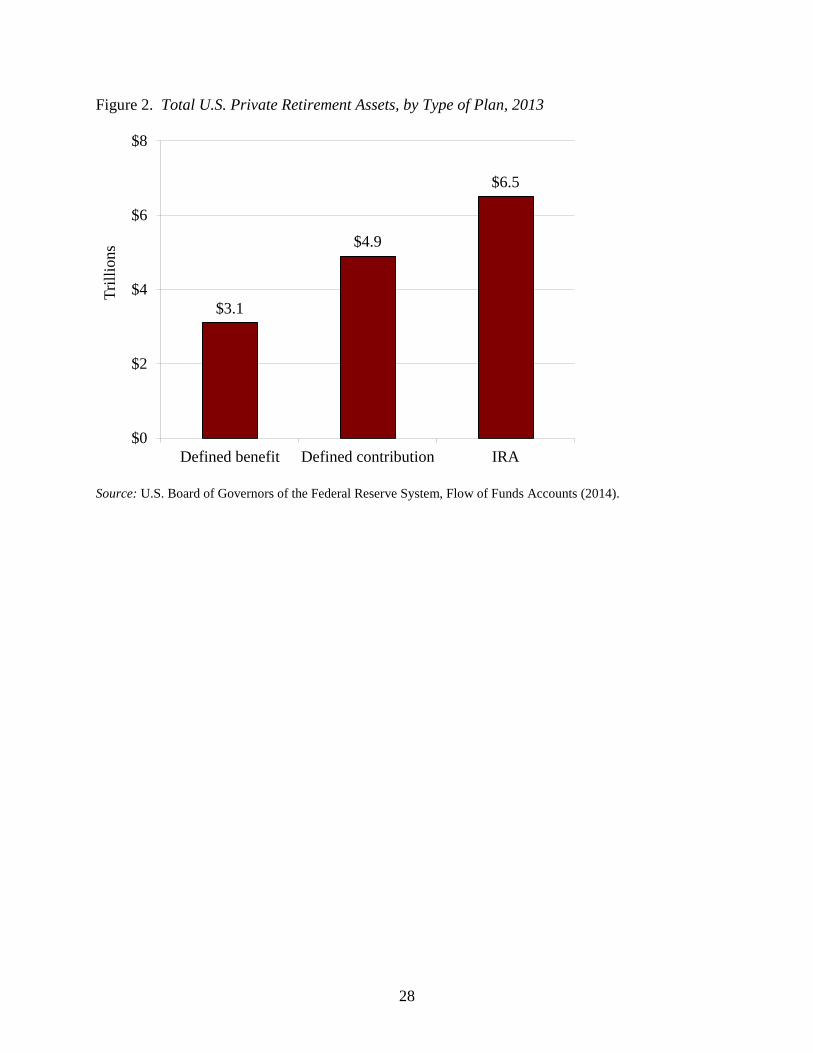
they retire. Total IRA assets now exceed the money in 401(k)s (see Figure 2).5
The rollover of balances from 401(k)s to IRAs is extraordinary given that participants are
typically passive in their interactions with their 401(k) plans. They rarely change their
contribution rate or rebalance their portfolios in response to market fluctuations or as they age.6
Thus, one would think that the force of inertia would lead participants to leave their balances in
their 401(k) accounts until they draw them down in retirement. The fact that participants
actually take the trouble to move their funds suggests a strong motivating force. Some
households may be attracted by the opportunity to obtain a wider menu of investment options or
to consolidate their account holdings. But others may be persuaded to move due to marketing or
sales efforts, whether or not the IRA offers better investment options or lower fees.7
The shift from 401(k)s to IRAs moves the employees’ money to a different regulatory
environment. 401(k) plans are covered by the Employee Retirement Income Security Act
4 At the time of ERISA, 20 percent of covered workers were in profit sharing defined contribution plans as a primary plan, and 80 percent were in defined benefit plans. 5 Data from the Federal Reserve’s Flow of Funds show that IRA assets first exceeded 401(k) assets in 1999. 6 Munnell and Sundén (2004); and Ameriks and Zeldes (2001). 7 Trade media survey research finds support for these and other influences on participant rollover decisions. See Warner (2014).
5
(ERISA) of 1974, which requires plan sponsors to operate as fiduciaries who act in the best
interest of plan participants. In contrast, the standard of conduct for broker dealers selling IRAs
is “suitability,” a much lower hurdle.8 In addition, in the 401(k) environment, much greater
emphasis is now placed on the disclosure of fees in an understandable format than in the case of
IRAs. And, most importantly for the purpose of this study, 401(k)s place much more emphasis
than IRAs on keeping the funds in the plan until retirement.9
Virtually all withdrawals from 401(k) plans and IRAs made prior to the employee
reaching the age of 59½ are subject to a 10-percent penalty tax (in addition to federal and state
income taxes).10 Exceptions include distributions for large health care expenditures (those that
exceed 10 percent of Adjusted Gross Income), in the event of permanent and total disability, and
for periodic payments over a lifetime. IRAs, however, offer three additional exemptions not
available in 401(k)s. These exemptions are for withdrawals to cover expenditures for post-
secondary education for any family member; up to $10,000 toward first home purchase or repair;
and expenditures on medical insurance for those unemployed for 12 or more weeks.
In addition to the exemptions from the 10-percent penalty tax, the barriers to accessing
funds are much lower in the case of IRAs than 401(k)s. As discussed below, 401(k) withdrawals
can be made only at job change or for reasons of hardship. IRA withdrawals can be made at any
time and without justification. Moreover, 401(k) hardship withdrawals involve interactions with
plan administrators, the filing of paperwork, and, at least in theory, a justification for the
withdrawal. The emotional and practical burden of this multi-stage process may discourage
withdrawals. In contrast, the providers of IRAs generally do not discourage withdrawals prior to
reaching retirement age. And finally, while in 1992 Congress imposed a 20-percent withholding
on monies taken out of a 401(k), no such withholding exists on IRA transactions.
8 IRAs sold/managed by investment advisers are subject to a fiduciary adviser standard under the Investment Advisers Act of 1940. 9 Another difference between 401(k)s and IRAs involves their treatment under personal bankruptcy proceedings. ERISA’s anti-alienation clause shields 401(k) assets from being seized by creditors during a bankruptcy proceeding. In contrast, the treatment of IRAs in such a proceeding is governed by the Bankruptcy Abuse Prevention and Consumer Protection Act of 2005; rollover IRAs are subject to an unlimited exemption, while contributory IRAs are subject to a $1 million exemption, indexed to inflation, unless the bankruptcy court determines otherwise. 10 See Chang (1996) for an early analysis of the sensitivity of rollovers to the imposition of the 10-percent penalty. The minimum age can be 55 if the 401(k) withdrawal is due to a job loss and the participant takes minimum distributions over his/her life expectancy.
6
Mechanisms for Withdrawal
Despite the mechanisms in place to preserve retirement savings in 401(k) plans, leakages
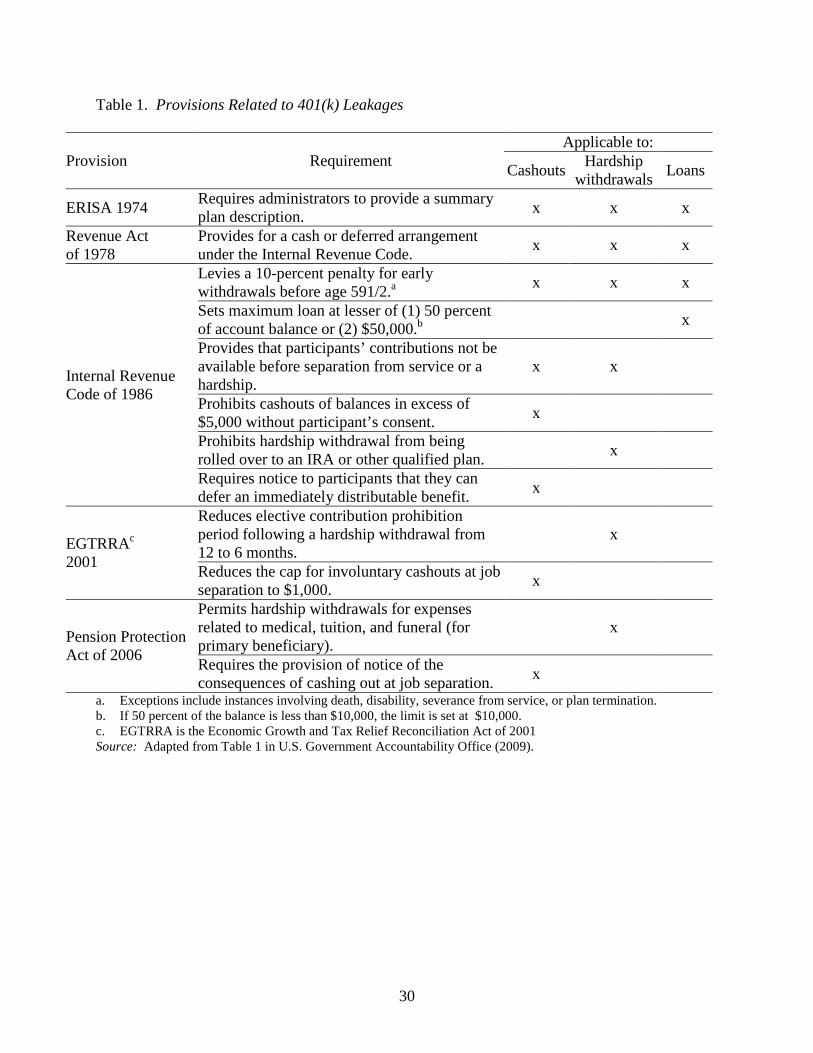
can occur in three ways – in-service withdrawals, cashouts, and loans. Table 1 summarizes
legislation applicable to these three approaches.
In-service Withdrawals
In-service withdrawals come in two forms: hardship withdrawals and withdrawals after age
59½.11 Hardship withdrawals allow plan participants to withdraw funds if they face an
“immediate and heavy financial need.” Under a safe harbor in IRS regulations, a person is
deemed to automatically have such a need if the distribution is to be used for one of the
following six purposes:
1. To cover medical care expenses;
2. To pay for funeral expenses;
3. To prevent the eviction from or foreclosure on the mortgage on the principal residence;
4. To cover certain expenses to repair damage to the principal residence.
5. To cover costs directly related to the purchase of a principal residence12; or
6. To pay for postsecondary education.
Hardship withdrawals generally are subject to income tax, the 10-percent penalty tax, and
20-percent withholding for income taxes.13 The amount available for a hardship withdrawal
includes the employee’s elective contributions and employer matching contributions; it does not
include the investment earnings on these amounts. In theory, participants must provide
documentation of their hardship. In addition, employees claiming a hardship must demonstrate
that they have already exhausted other means of obtaining funds, including 401(k) loans, to
qualify for a hardship withdrawal; may not roll over their withdrawal to an IRA; and face a 6-
month suspension of contributions to their account following a hardship withdrawal. In practice,
evidence suggests that some employers might be lax in enforcing some of these requirements.14
11 Certain plans, such as profit-sharing plans, allow the distribution of employer profit sharing contributions prior to 59½. 12 The exemption does not apply to mortgage payments. 13 The amount can be increased to include these taxes. For example, if the participant needs $10,000 for a tuition bill, he can withdraw more than that amount to cover the taxes. 14 U.S. Government Accountability Office (2009).
7
Withdrawals after age 59½, if the plan permits them, are an increasingly popular option.
The elimination of the penalty may serve as a signal to people that 59½ is an appropriate age at
which to withdraw funds. But in a world in which people need to be working until their mid- or
late-60s,15 such monies need to be kept in the plan and allowed to grow. Fortunately, recent data
show that participants taking post-59 ½ withdrawals roll over most of the money – perhaps
consolidating accounts in advance of retirement.16 Nevertheless, roughly 30 percent of post-59½
withdrawals should be added to the list of leakages.
Cashouts
Upon job separation, an employee can take a lump-sum distribution, or preserve the
balance by leaving it in the prior employer’s plan (if the employer permits), rolling over the plan
balance into an IRA, or transferring it to the new employer’s 401(k), provided the new plan
accepts rollovers or a combination of these options. Plan sponsors can only compel closure of
accounts with less than $5,000 but must deposit distributions between $1,000 and $5,000 in an
IRA or another employer plan, unless the participant elects otherwise.17 Distributions are subject
to a 10-percent early withdrawal penalty (if under age 59½), and a 20-percent withholding tax,
the latter being credited against the federal and state tax liability on the distribution. In addition,
the Pension Protection Act of 2006 requires plan sponsors to notify participants of the
consequences of the failure to preserve balances at job separation.
Loans
Many 401(k) plans allow participants to borrow from their accounts; the Internal
Revenue Code limits the borrowing to 50 percent of the account balance, up to $50,000. 401(k)
loans are not a credit instrument in the traditional sense; they are not subject to any credit
underwriting or credit reporting. Instead they are simply an arrangement whereby a participant
withdraws money from a tax-advantaged account and agrees to repay it later to avoid taxes and
penalties.18 The interest rate on the loan is usually 1 or 2 percentage points above the prime rate,
and many plans charge a one-time loan fee. Loans do not require approval but must be paid back 15 Munnell and Sass (2008). 16 Vanguard (2014) 17 To avoid the task of designating an IRA rollover provider, some employers have amended their plans to permit distributions in the $1,000-$5,000 range to remain in the plan. 18 For a complete discussion, see Lu et al (2014).
8
within one to five years.19 While the loan is outstanding, participants do not earn investment
returns on the liquidated funds. Instead, the loan interest is credited to the account.
The availability of loans depends on plan size. Large plans generally offer loans while
small plans do not. The explanation is that loans are expensive to administer, and loan
origination and maintenance fees are increasing.20 As a practical matter 90 percent of active
participants have access to a loan feature.21
A loan option appears to encourage individuals who value liquidity to participate in their
employer’s 401(k) plan and to contribute more than otherwise.22 But loans do come with risks.
Cash that has been borrowed earns a fixed return rather than the higher return possible with
equity investment. And if a loan is not repaid due to default or employee job loss, the remaining
balance on the loan is treated as a lump-sum distribution and is subject to income taxes and the
10-percent penalty tax.23
Evidence to Date
What we would like to know for each cohort is how much money is leaving the system
each year and how much their final wealth is reduced as a result of the leakages. Such a
calculation requires information about the percent of 401(k) participants each year who leave
their job and cash out, take hardship withdrawals, or take out loans and default, their typical age,
and how much is withdrawn through each leakage valve. Researchers have attempted to answer
these questions using the Federal Reserve’s Survey of Consumer Finances (SCF) and the Census
Bureau’s Survey of Income and Program Participation (SIPP), and, more recently, tax data.
Unfortunately, the surveys are not designed to answer these precise questions, so researchers
report what is available. The challenge is to translate the reported findings into a consistent
story.
Vanguard provides data each year on the flows into and out of the defined contribution
accounts that it administers. Vanguard administers only about 10 percent of the market and large
plans tend to be overrepresented in its data. Large plans – with higher-paid employees – may
have lower leakage rates, suggesting that Vanguard data may understate leakages. Nevertheless, 19 If the loan is used to finance the purchase of a primary residence, the repayment period can be up to 30 years. 20 Vanguard (2013). 21 Vanderhei et al (2012). 22 For example, see Munnell, Sundén, and Taylor (2002) and the literature cited therein. 23 No penalty is imposed if the borrower is older than 59 ½ .
9
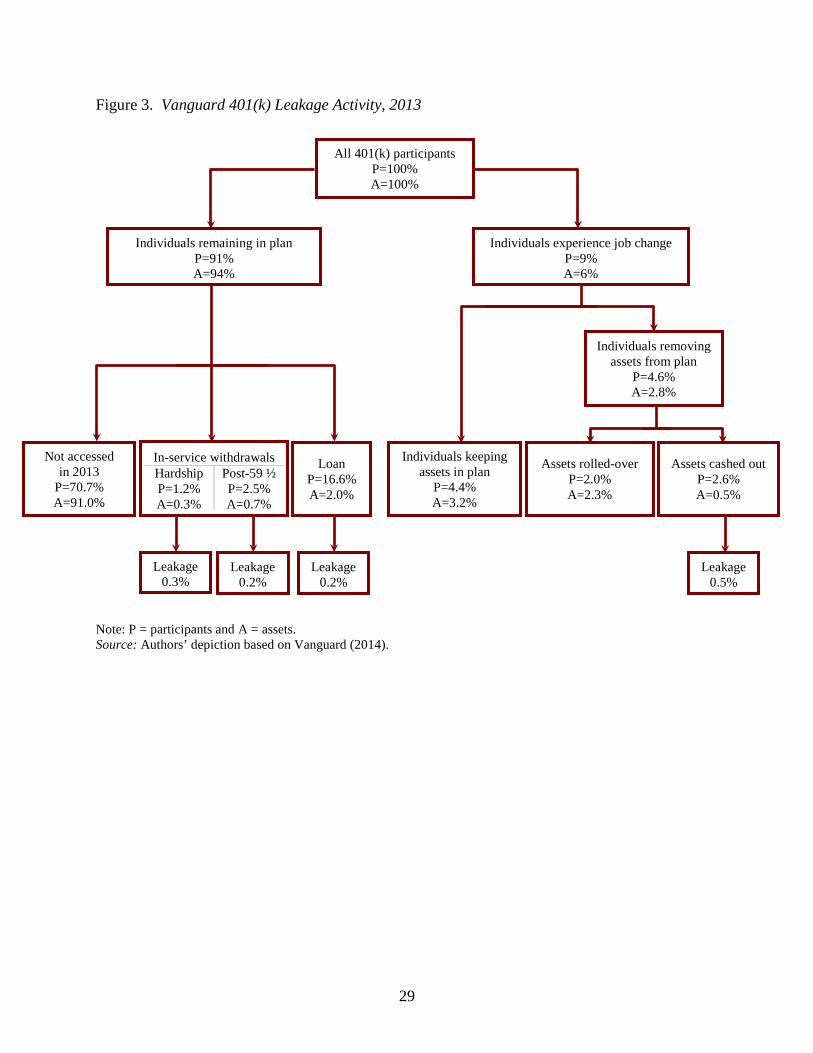
its report provides a useful anchor with respect to the magnitude of leakages. A flow chart is
shown in Figure 3 to identify the opportunities for money to leak out of the 401(k) system. The
figure suggests that 1.2 percent of Vanguard’s assets leaked out of the 401(k)/IRA system in
2013.
Evidence on Leakages from 401(k) Plans
The two major sources of leakages are in-service withdrawals and cashouts at job
changes. Considerable information is available about loans – who takes them, median amounts
outstanding, and how the proceeds are used – but loans result in relatively little loss of retirement
assets.
In-Service Withdrawals. Vanguard reports that in 2013 about 4 percent of participants in plans
offering in-service withdrawals used this feature. About one-third was for hardship and two-
thirds for non-hardship (i.e. post-59½) reasons. Together these withdrawals amounted to one
percent of total assets. Since only 30-percent of the post-59½ withdrawals are cashed out, only
half of the one percent of total in-service withdrawals is cashed out.
A 2009 report by the Government Accountability Office (GAO) reported leakages based
on SIPP data from 1998, 2003, and 2006. While the overall picture is quite different from that
presented by Vanguard, it is relatively consistent in the case of hardship withdrawals. Over the
three SIPP surveys, the share of participants (age 15 to 60) opting for a hardship withdrawal was
between 3 and 4 percent – a figure not that different from the Vanguard number for all in-service
withdrawals. The total amount lost in 2006 through leakages was estimated to amount to 0.3
percent of total 401(k) assets, similar to the number implied by Vanguard. As noted, Vanguard
reports some additional leakage due to post-59½ withdrawals.
Cashout at Job Change. Vanguard reports that 9 percent of 401(k) participants left their job in
2013 and were eligible for a distribution. Their assets equaled 6 percent of Vanguard’s
recordkeeping assets. In terms of participants, 71 percent of those terminating preserved their
assets by leaving them in their prior employer’s 401(k) plan, rolling them over to an IRA, or
rolling them over to a new employer’s plan. The other 29 percent of participants took a cash
distribution (see Table 2). In terms of assets, 91 percent of the assets of terminating participants
10
were preserved for retirement; 9 percent were cashed out. Since the assets of terminating
employees amounted to 6 percent of total assets, roughly 0.5 percent (.09 x .06) of total assets
was cashed out in 2012 upon job change.24 Younger participants were more likely to cash out
than older ones.25
The 2009 GAO study, using the SIPP, shows that about 5-7 percent of total 401(k)
participants cash out each year when they terminate employment. This percent is two to three
times the level reported by Vanguard in 2012.26 Vanguard reports that only 9 percent of 401(k)
participants leave their job in a given year. If that figure held nationwide in 2006, the GAO
estimate suggests that most job changers cash out, whereas Vanguard reports that only 29
percent do so.27 The discrepancy on the dollar front is even greater. The GAO estimates that
about 2.7 percent of assets are lost each year through cashouts; whereas Vanguard suggests 0.5
percent. The most likely reason for the discrepancy is that surveys like the SIPP tend to ask
participants what they did with their distribution from the plan. Indeed, of those receiving a
distribution, more participants cashed out than rolled over to an IRA or a new employer. What
gets lost is that half the participants and more than half the money remains in the old employer’s
plan. It seems clear that the GAO study ignores assets left in the old employer’s plan and
overstates the amount of plan assets cashed out by terminating employees.28
Loans. Most large plans offer loans; small plans generally do not. Most employers allow
participants to have only one loan. Vanguard reports that 18 percent of participants in plans
24 A number of studies have explored the disposition of funds cashed out; for example, see Munnell (2012) and Copeland (2013). Hurd, Lillard, and Panis (1998) analyzed the choice to cash out at job change. And Engelhardt (2003) found that pension assets were used to buffer economic shocks when workers changed jobs. 25 A 2009 study by the Congressional Research Service, also using the SIPP, focuses not on the overall leakage rate but on the decisions of the roughly 30 percent of terminating employees each year who took a distribution. The actual analysis was based on the SIPP question regarding whether the individual (under age 60) had received a distribution between 1980 and 2006. Of those who received a distribution, 45 percent of participants reported that they rolled over the whole amount, 41 percent saved some of the distribution, and 13 percent spent the entire distribution. The single most important explanatory variable was the size of the distributions; large amounts were rolled over and small amounts cashed out. Participants who changed jobs voluntarily (to retire, go to school, or take another job) were more likely to roll over their distribution than those who were forced to quit. 26 The SIPP does not allow for calculating the percentage of a distribution that was cashed out among those who only partially cashed out their distributions. Thus, it may over report the percentage of total 401(k) participants who cash out each year upon termination of employment. 27 The Vanguard figure for 2006 is 29 percent (Vanguard 2007). 28 Alternatively, the Vanguard population could be older and/or longer tenured and so its rates of job turnover are not representative.
11
offering loans had a loan outstanding in 2013 (see Table 3); about 11 percent took out a new loan
in that year. The average loan was about $9,500 and amounted to about 10 percent of the
account balance. Loans accounted for about 2 percent of aggregate plan assets; most of this
money is repaid and therefore involves little in plan leakages. Loans are sometimes criticized as
a source of revolving credit for the young, but in fact they are used more frequently by mid-
career participants.29
The GAO 2009 study presents data on loans from two sources. The SIPP reports 8 to 10
percent of participants have loans. This figure looks more like new loans than loans outstanding.
Data from three plan administrators show 16 to 20 percent of participants with loans, which
looks more like the loan outstanding figure. As noted above, loans have an adverse impact only
when they are not paid back, and the GAO reports that loan defaults from the Department of
Labor Form 5500 amount to only 0.02 percent – a trivial amount.30
A more recent study points out that loan defaults reported on the Form 5500 represent the
defaults only for active participants who constitute only about 10 percent of total loan defaults.31
Defaults that occur when the loan is not repaid upon termination are reported on the 5500 as
distributions. Adding the defaults of terminated employees raises loan leakage to 0.20 percent of
assets, ten times the GAO estimate but still relatively small.
Evidence on 401(k) and IRA Withdrawals Combined
The main evidence on combined IRA/401(k) withdrawals comes from tax data.
Researchers document flows out of retirement plans using a combination of the primary personal
income tax return (Form 1040), the information return for retirement account distributions (Form
1099-R), and the information return for IRAs (Form 5498). Although tax returns have less
information than household surveys, they do have age of primary and secondary taxpayers, the
possibility of inferring marital status and change in that status, and financial information to
classify taxpayers by income level and to identify major changes in income from one year to the
next.
29 Vanguard (2013). 30 Bryant, Holden, and Sabelhaus (2011) report an identical estimate – 0.02 percent – for 2007, also using Form 5500 data. 31 Lu et al. (2014).
12
The challenge is to distinguish leakages from other taxable withdrawals from retirement
plans. For example, regular payments from a defined benefit plan should not be classified as a
leakage. To distinguish between withdrawals and leakages, researchers have two levers. The
first is age. Withdrawals before a certain age are unlikely to be normal retirement payments.
Researchers have focused on withdrawals before 55. The age-55 cutoff is important because the
tax code permits non-penalized withdrawals after a job separation for workers 55 and older. An
alternative cutoff is age 60, since, as discussed above, after age 59½ workers can generally make
penalty-free withdrawals from 401(k)s and IRAs.
The other lever for separating retirement benefits from leakages is whether the
withdrawal is subject to the 10-percent penalty. This criteria is not as clear cut as one might
think, because both 401(k)s and particularly IRAs offer the possibility of penalty-free
withdrawals (see Table 4). Penalized distributions for those under age 55 in 2010 accounted for
only 45 percent of total taxable distributions.
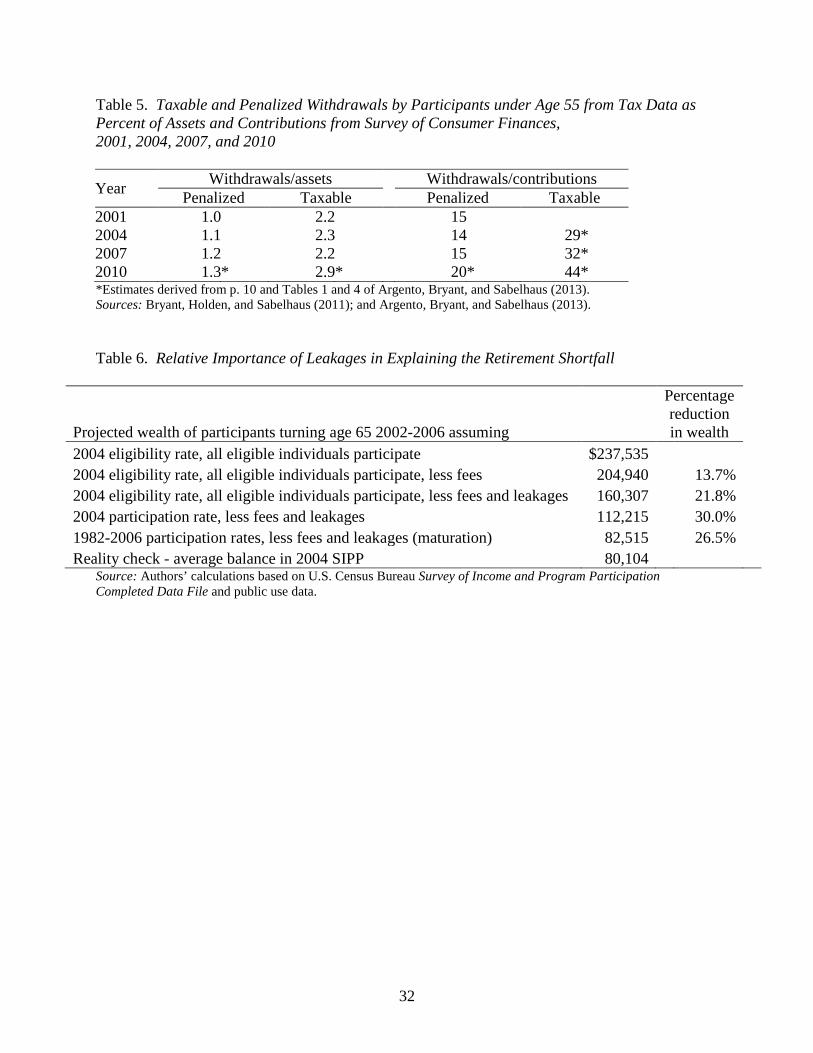
The results of the tax data analysis reported in two papers with overlapping authors and
similar methodology are reported in Table 5.32 The 2011 study focused on the period 1992-
2007;33 the 2013 study explored activity during the Great Recession by focusing on the period
2004-2010. The key question is whether to focus on all taxable distributions, on only penalized
distributions, or on something in between. Penalized distributions relative to assets – 1.3
percent in 2010 – is much closer to the numbers reported by Vanguard in Figure 3.34 However,
since some distributions from 401(k)s, which would be classified as leakages, are not subject to
penalty, the penalized distributions should be viewed as a minimum. The fact that the tax data
suggest larger leakages than the Vanguard study might be attributed to the fact that the Vanguard
data represent only about 10 percent of the 401(k) market and none of the IRA market. To the
extent that leakages are more prevalent in smaller plans than larger ones and from IRAs than
from 401(k)s, the Vanguard data would understate pre-retirement outflows from the system.
One final study covers both 401(k) and IRA withdrawals and relates withdrawals to life
events (Butrica, Zedlewski, and Issa 2000). The data come from the 2004 SIPP, following 32 Bryant, Holden, and Sabelhaus (2011); and Argento, Bryant, and Sabelhaus (2013). For other studies using tax data, see Amromin and Smith (2003); Bryant (2008); Sabelhaus (2000); and Sabelhaus and Weiner (1999). 33 Penalized withdrawals accounted for only 0.4 percent of total withdrawals, since those under 55 own less than half of all assets. 34 Penalized distributions in the tax studies, however, are limited to participants under 55 and therefore do not include post-59 ½ in-service withdrawals included in the Vanguard results, even the penalized withdrawals indicate more leakage than reported by Vanguard.
13
participants who were 25 to 58 in 2004 over 24 months. Consistent with the tax data and the
Vanguard data, withdrawals amounted to 1.5 percent of aggregate balances – 1.4 percent from
IRAs and 1.5 percent from 401(k)s. Adverse events, such as job loss and the onset of poor
health, accounted for about one quarter of retirement account leakage; another 10 percent
occurred when the worker changed jobs; and 8 percent was associated with home purchase. The
researchers could not account for about half the leakages but assumed some portion of the
unexplained amounts were associated with high medical expenses. The reasons why people
take out money will serve as an important backdrop for the discussion of policy options. But,
first, the next section discusses the impact of leakages on retirement security.
Effect of Leakages on Accumulations
The impact of leakages on retirement security requires an assessment of how much less
people will have in retirement accounts at the end of their work life than they would have had if
they had left all contributions in the plan. We first consider the impact of leakages on
hypothetical participants in 401(k)s and IRAs. Then, using data from the Survey of Income and
Program Participation (SIPP) Completed Data Files linked to administrative data on tax-
deferred earnings from the U.S. Social Security Administration (SSA), we quantify the relative
importance of leakages – compared to fees, interrupted contribution histories, and the immaturity
of the 401(k) system – in contributing to the retirement savings shortfall.
Impact of Leakages on 401(k) Wealth
The evaluation of the impact of 401(k) leakages focuses on the age-60 wealth of a
hypothetical participant who begins contributing at age 30. The contribution rate is 6 percent,
the employer match rate 50 percent, the participant’s initial salary of $40,000 increases at 1.1
percent a year in real terms, and investments earn a real 4.5 percent return.
As the previous discussion of the evidence has shown, the estimates of leakages differ
somewhat among Vanguard’s administrative data, survey data, and income tax returns.
Vanguard serves as the basis of the calculations but probably represents a minimum level of
leakage. We therefore assume that leakages average a slightly higher 1.5 percent of assets.
Retaining this assumption, we further assume a 75 percent linear decline in the leakage rate,
expressed as a percent of assets, from age 30 to 60.
14
Under the assumptions of the above model these leakage rates result in accumulated
wealth of $203,000 at age 60. Under the assumption of zero leakages, projected wealth at age-60
is $272,000, demonstrating that such leakage rates result in a 25-percent reduction in aggregate
retirement wealth.35 This estimate represents the overall impact for the whole population,
averaged across both those who tap their savings before retirement and those who do not.
Impact of Leakages on IRA Wealth
The calculation of the impact of leakages on IRA wealth focuses on the age-60 wealth of
a hypothetical individual who rolls over money from his 401(k) three times during his career, at
ages 30, 40, and 50, and who also earns a real 4.5 percent return on his investments.
The evaluation of the impact of IRA leakages assumes that the initial rollover into the
IRA, made at age 30, equals the median IRA balance of households aged 25-34 in the 2010
Survey of Consumer Finances (SCF). The annual withdrawal rate from the IRA from age 30-40
equals the median percentage withdrawn as reported by SCF households in that age range,
multiplied by the percentage of households taking a withdrawal. The amount rolled over into the
IRA at age 40 equals the median IRA balance of households aged 35-44 in the 2010 SCF, less
the projected amount that the age-30 investment would have increased to by age 40 at the
assumed 4.5 percent real rate of return, and net of withdrawals from age 30 to 40. The
withdrawal rates from age 40-50 and from 50-60 and the amount contributed at age 50 are
calculated in the same manner.
Under the above assumptions, these leakage rates result in accumulated IRA wealth of
$85,000 at age-60. Under the assumption of zero leakages, projected IRA wealth at age-60 is
$110,000, demonstrating that such leakage rates result in a 23-percent reduction in IRA wealth at
retirement.
Interestingly the effect of leakages from 401(k)s and IRAs on age-60 wealth are
relatively similar. This finding is consistent with the similar leakage rates reported in the SIPP.36
The explanation may be that whereas IRAs are easier to access and have more penalty-free
withdrawals, those who roll over to IRAs may be more savings oriented. In total, the estimates 35 Both these figures are considerably higher than earlier estimates from Engelhardt (2002) and Poterba, Venti, and Wise (2001). Poterba, Venti, and Wise (2001) assume much lower rates of job separation. This, together with the exclusion from their analysis of hardship withdrawals, loan defaults, and IRA withdrawals, leads them to conclude that leakages will only reduce retirement wealth by about five percent. 36 Butrica, Zedlewski, and Issa (2010).
15
suggest that in a mature system leakages reduce aggregate 401(k)/IRA wealth at retirement by at
least 20 percent.
The Relative Importance of Leakages in Explaining the Retirement Shortfall
Ideally, a calculation of the relative impact of leakages, fees, and periods of non-
participation would involve tracking cohorts of individuals from the inception of the 401(k)
system to retirement to see how much they contributed to and withdrew from their account
annually and earned on their investments. Although the SIPP Completed Data Files link to W-2
earnings records from 1982, the year after the Internal Revenue Service issued regulations that
sanctioned 401(k)s, these records are currently only available to 2006. We therefore focus on
individuals born 1937-41, who were age 41-45 in 1982 and attained age 65 between 2002 and
2006.37 Data on elective deferrals are only available from 1990, and the SIPP Completed Data
Files do not contain self-reported data on elective deferrals. We therefore impute elective
deferrals for 1982 to 1989 based on participation rates observed in 1984, 1986, and 1990 public
use SIPP data. The SIPP Completed Data Files also lack data on 401(k) and IRA withdrawals.
We therefore assume a 1.5 percent withdrawal rate and perform a reality check by comparing
sample statistics for projected net-of leakage 401(k) and IRA wealth with corresponding sample
statistics drawn from 2004 SIPP public use data.38
The analysis proceeds in five steps. The first is to estimate average age-65 retirement
wealth assuming 100 percent participation among eligible employees in a mature system, defined
as one in which the eligibility rate among W-2 earners was at 2004 levels.39 This is the baseline
against which we evaluate the effects of fees, leakages, intermittent contribution histories, and
the immaturity of the system. The 2004 SCF shows a participation rate of 43 percent among
workers age 40-59 and that around 21 percent of eligible employees do not participate. The
latter percentage is consistently lower than those provided by financial services companies.40
We therefore multiply the SCF participation rate by 100/70 to reflect an assumed a 30-percent
37 The analysis therefore pre-dates the stock market collapse and recovery and focuses on individuals who were first exposed to 401(k) plans in mid-career. We anticipate that W-2 data for 2007-2011 will be available shortly, and we plan to update our analysis on receipt, focusing on individuals who were first exposed to the 401(k) system at somewhat younger ages. 38 The data do not permit an individual- by-individual comparison of SIPP Completed Data Files with SIPP public use data. 39 SCF data show that there has been little trend in eligibility or participation rates subsequent to 2004. 40 Munnell and Bleckman (2014).
16
non-participation rate, yielding an estimated eligibility rate of about 60 percent. The calculation
further assumes zero fees or leakages, an asset allocation of 50 percent large capitalization stocks
and 50 percent high-grade corporate bonds with annual rebalancing, investment returns based on
Ibbotson (2013) data, a contribution rate of 6 percent of salary, and the typical 50-percent
match.
The second step is to incorporate fees. The study recalculates age-65 wealth, reducing
annual stock and bond returns by the asset-weighted stock and bond fund expense ratios reported
by the Investment Company Institute (2013, 2014).41
The third step is to incorporate leakages. As previously, we assume that annual leakages
average 1.5 percent of assets.
The fourth step is to adjust average account balances to reflect periods of non-
participation by eligible employees that one might expect in a mature system. This is
accomplished by substituting the 43-percent 2004 participation rate for the 61-percent 2004
eligibility rate in the calculations.
The fifth step is to calculate the impact on retirement wealth of the immaturity of the
system, the fact that eligibility and participation rates were historically much lower. Using W-2
data on elective deferrals, we calculate retirement wealth based on actual contribution rates for
1990 onwards. We impute participation rates for 1982-89, using SIPP public use data on
participation rates by age in 1984, 1986, and 1990.42
The sixth step is to convert these unconditional means to means conditional on having
positive retirement wealth accumulated through 401(k) contributions.43 Reported IRA balances
may include both 401(k) rollovers and direct contributions. By age 65, many individuals may
have retired and rolled over their 401(k) balances into IRAs. So estimates of coverage based on
having a non-zero 401(k) account balance may understate coverage while estimates that include
both 401(k) and IRA balances may overstate coverage. We therefore define an individual as
41 Figure 5.1 Investment Company Institute (2014) reports stock and bond fund expense ratios for 2000-2013, and Figure 5.1 Investment Company Institute (2013) contains data for 1990 and 1995. The study interpolates between 1990 and 200 and assumes pre-1990 fees were at 1990 levels. The data include both directly held funds and funds held through employer-sponsored plans. There is considerable heterogeneity in 401(k) plan fees, but the expense ratios are consistent with those in medium to large 4019k) plans (Kopcke, Vitagliano, and Muldoon, 2009). 42 We interpolate to obtain participation rates for other years. 43 In a mature system, the conditional mean account balance would be somewhat less than the numbers obtained from the above calculation because more people would enter retirement with a positive account balance. It is difficult to say by how much because we lack data on eligibility status over a lifetime.
17
having positive retirement wealth if he had a positive 401(k) balance at age 55-59, an age range
at which most individuals will still be working and making 401(k) contributions. In that age
range, 36.4 percent of individuals in the 2004 SIPP have a positive 401(k) balance.
Finally, we perform a reality check by comparing the mean retirement wealth of 401(k)
participants in the 2004 SIPP public use data with our calculations based on the SIPP Completed
Data Files.44
Table 6 shows the impact of the above factors on average age-65 wealth. The model
predicts average retirement wealth of $82,500, close to the average of $80,000 observed in the
2004 SIPP. The ability of our model to match the SIPP public use data corroborates our leakage
estimates; leakages reduce wealth by 22 percent. They are more significant than fees (14
percent) but less significant than the effects of non-participation among eligible employees and
the immaturity of the system (30 percent and 27 percent). In total, all these factors reduce
retirement wealth by two thirds.45
Policy Options
Leakages from 401(k) plans and IRAs are reducing aggregate retirement wealth by more
than 20 percent. This 20-percent reduction may be used in worthwhile ways – to support needed
consumption, to increase investment in education and housing, and even to serve as a form of
private unemployment insurance – but this reduction puts retirements at risk. So the question
becomes what to do. Policymakers face a major choice in deciding upon the optimal level of
illiquidity in the retirement income system. In addition, studies show that employees who know
that they can get access to their funds are more likely to participate and to contribute more once
they join the plan. The current provisions therefore reflect an effort to balance the conflicting
goals of: 1) keeping monies in the plan; and 2) allowing access to those who need their funds,
which in turn encourages participation and contributions. To achieve these conflicting goals, the
system has a penalty tax and withholding on the one hand and the availability of loans, the ability
to cash out at job termination, and in-service withdrawals on the other. Even considering this
somewhat delicate balance, however, the advantages of access could be structured more
efficiently.
44 Reflecting Employee Benefit Research Institute (2009) data (Figure 13), we assume that 47 percent of IRA balances has been rolled over from 401(k) plans and the other half is direct contributions. 45 (1-0.137)*(1-0.218)*(1-0.30)*(1-0.301) = 0.33
18
Many researchers and policy experts have suggested options aimed at reducing
leakages.46 These suggestions have ranged from providing better education for plan participants
to changing the penalties for withdrawals to tightening up access to the funds. As discussed
below, some of these ideas could help, but it may also be time to adopt a broad perspective when
developing reform proposals to clarify the basic policy goals and guiding principles behind any
reforms.
A recent paper considered the optimal degree of illiquidity in the retirement saving
system.47 If all households discount utility exponentially, then placing restrictions on 401(k)
withdrawals will reduce their lifetime utility by limiting the extent to which households are able
or willing to smooth consumption in response to unanticipated shocks. But if some households
exhibit present-biased preferences, they may value illiquidity because it prevents them from
acting on their preferences. On balance, the increase in the utility of households with present
biased preferences resulting from illiquidity are of an order of magnitude greater than the utility
losses suffered by households that discount utility exponentially. A model, in which penalties
are recycled to households, suggests that the optimal withdrawal penalty is close to 100 percent,
and certainly well in excess of the current 10-percent penalty. The following discussion,
consistent with the results of the optimal illiquidity model, assumes that the primary use of the
401(k) and IRA systems is to preserve money for retirement and suggests proposals for each
mechanism of withdrawal within this context.
In-Service Withdrawals
As noted, in-service withdrawals consist of two types – hardship withdrawals and post-
age-59½ withdrawals.
Hardship Withdrawals. Hardship withdrawals are a complex issue. In 2004, adverse events,
such as job loss and the onset of poor health, accounted for about one quarter of retirement
account leakage, and 2010 administrative data show that half of all hardship withdrawals were to
avoid a home eviction or foreclosure.48 These are certainly worthy reasons to tap one’s 401(k).
46 See Purcell (2009); AonHewitt (2011); U.S. Government Accountability Office (2009); Butrica, Zedlewski, and Issa (2010); and Fellowes and Willemin (2013). Burman et al. (2008) examine the interaction of public policies and behavioral influences. 47 Beshears et al (2014). 48 The 2004 figure is from Butrica, Zedlewski, and Issa (2010). The 2010 figure is from AonHewitt (2011).
19
It probably makes sense to keep hardship withdrawals as a safety valve for families in financial
trouble.
That said, one obvious change would be to align 401(k) and IRA provisions.
Distributions not subject to penalty could be made the same in 401(k)s and IRAs. Currently both
types of accounts allow non-penalized distributions in the case of total and permanent disability,
to cover very large medical expenditures (in excess of 10 percent of adjusted gross income), and
if the amounts are distributed in the form of lifetime payments. But, as discussed, IRA accounts
allow additional penalty-free withdrawals to cover post-secondary educational expenses for the
participant, spouse, children or grandchildren; up to $10,000 to buy, build, or rebuild a first
home; and expenditures on medical insurance for those unemployed for 12 weeks or more.
Having different provisions in the two accounts is confusing, benefits those who know the rules,
and encourages people to move money from 401(k)s to IRAs. Non-penalized distributions in
IRAs could be limited to those in 401(k)s, and any further changes could be designed to keep the
treatment of withdrawals the same under the two types of plans.
In terms of hardship withdrawals themselves, they could be limited to serious
unpredictable hardships and the amounts distributed not subject to the 10-percent penalty.49
The current “safe harbor” list includes predictable as well as unpredictable expenses. It is not an
efficient use of tax resources to subsidize retirement saving to cover routine medical expenses, to
buy a home, or to educate one’s children. Such predictable events can be planned for and
financed outside of retirement savings accounts. The list of potential reasons for hardship
withdrawals could be short, include only true emergencies, be easily verifiable, and consistent
between 401(k)s and IRAs. For example, the list could be limited to the following:
1. Total and permanent disability;
2. Health expenses in excess of 7.5 percent of AGI (as opposed to 10 percent under current
law);
3. Job loss, as documented by the receipt of unemployment benefits.
Clearly defining limited acceptable reasons for hardship withdrawals eliminates the need
for a disincentive in the form of a 10-percent tax penalty. Since people who take a hardship
withdrawal would be only those with severe financial problems, it makes little sense to punish
49 See AonHewitt (2011), which suggests limiting the reasons for hardship withdrawals; it does not mention repealing the tax penalty for hardship withdrawals.
20
them by levying additional taxes. In other words, the safe harbor criteria and the list of non-
penalized withdrawals could be shortened and combined.
Two possible changes could improve the retirement savings prospects for those taking
hardship withdrawals.50 The first would be to limit the balances available for any in-service
withdrawal to employee contributions; such a change would prevent severe depletion of
accounts. The other is to automatically restart savings after a hardship withdrawal. Plans
suspend employee contributions for six months after a hardship withdrawal, and many
participants fail to restart immediately after the six-month period is over. Hence, it would be
helpful to automatically default them into the plan and reinstate their pre-withdrawal deferral
rate.51
Post-59½ Withdrawals. As discussed, in-service withdrawals after 59 ½ from 401(k)
plans have grown dramatically. Although recent information suggests that the bulk of the money
is rolled over, roughly 30 percent leaks out.52 And post-59 ½ distributions must certainly
account for growing leakages from IRAs. Given the need to work longer as a result of increased
life expectancy and a contracting retirement income system, age 59 ½ is too early in most cases
to be withdrawing money from either a 401(k) plan or an IRA. One obvious option is to increase
the age for non-penalized withdrawals from both 401(k)s and IRAs to at least Social Security’s
Earliest Eligibility Age – currently 62.
Cashouts
While loans and hardship withdrawals can play a reasonable role in a voluntary system,
allowing participants to cash out when they change jobs is hard to defend. This leakage
mechanism could be closed down entirely, by changing the law to prohibit lump-sum
distributions upon termination.53 The allowable options could be limited to leaving the money in
the prior employer’s plan (even balances under $5,000), to transfer the money to the new
employer’s 401(k), or, for those leaving the labor force, to roll over the plan balance into an IRA.
Under such limitations, sponsors would no longer be able to compel cashouts of accounts with
50 AonHewitt (2011). 51An alternative for improving saving among those taking hardship withdrawals is to reduce the 6-month period (Government Accountability Office 2009). 52 Vanguard (2014). 53 Purcell (2009) suggests requiring at least part of the distribution to be rolled over.
21
less than $1,000.54 And the new employer would be compelled to accept the rollover. In
addition, the procedures for rolling over balances, which are now a cumbersome and paper-
intensive process, could be streamlined.55 If the option of cashing out – even with a 10-percent
penalty – is left open, participants will continue to withdraw money at termination instead of
keeping it intact until retirement.
Loans
Of the various ways to access funds, loans appear to offer the biggest bang for the buck in
terms of leakage. Loans accounted for about 2 percent of aggregate plan assets; most borrowers
continue to contribute to the plan while they have a loan; and most of the money is repaid. The
likely point of default arises when a terminating employee cannot repay the loan within 60 days,
causing the money to be treated as a taxable distribution and subject to penalties. But the GAO
estimates suggest that leakages from loan defaults amount to only 0.20 percent of assets. So,
given that the availability of loans encourages employees to participate and contribute, loans are
probably a low-leakage way to allow participants to access funds.
If plan sponsors are concerned about excessive loan usage, they could take a series of
steps to limit borrowing.56 They could restrict the number of loans allowed, which would
decrease the use of loans among the nearly one-third of borrowers with multiple loans. They
could restrict the available loan balance to employee contributions, which would reduce loan
amounts and signal that employer contributions are earmarked for retirement. They could
implement a waiting period so that a participant must have a loan fully repaid before taking out
another.
If the goal is to reduce defaults on loans, sponsors could be required to allow loan
repayment after termination.57 This change is somewhat cumbersome because loan payments
can no longer be made through payroll deduction. But it might reduce defaults.
54 Butrica, Zedlewski, and Issa (2010). 55 AonHewitt (2011). 56 These ideas for changes in loan policies were suggested by AonHewitt (2011). 57 According to Vanguard, approximately 10 percent of plan sponsors permit terminated plan participants to continue to repay their plan loans. These tend to be larger plans, so about 40 percent of participants terminating with an outstanding loan have this option. However, among Vanguard participants terminating with a loan in plans offering this feature, only 5 percent took advantage of this feature.
22
Conclusion
Leakages from 401(k) plans and IRAs should be a serious policy concern, given that the
balances in these accounts represent the only significant form of retirement saving outside of
Social Security for most workers. Leakages can take several forms, including in-service
withdrawals, cashouts, and loans. Of these, in-service withdrawals and cashouts appear to
represent the most significant source of leakages. Loans also create measurable – but relatively
small leakage. A key metric for determining the potential damage from leakages is the amount
by which leakages reduce an individual’s wealth at retirement. The results show that aggregate
401(k) and IRA retirement wealth is at least 20 percent lower than it would have been without
the current leakage rules.
Although many policy options for reducing specific leakages exist, it seems like a good
time to take a broad perspective that considers all forms of leakages. Policymakers should
consider making a choice between a system that is centered on retirement saving and one that
plays a dual role. If one adopts the notion that the goal is to protect all retirement saving from
leakages, leakage through cashouts could be closed down entirely. Hardship withdrawals could
be limited to health problems, job loss, or foreclosure, all of which are generally unpredictable.
In these cases, it may make sense to exempt withdrawals from the tax penalty. Finally, it may be
time to raise the age at which withdrawals are allowed without penalty or restriction to at least 62
to better align this age with when people will be retiring.
Applying these principles to restructuring access to retirement saving could significantly
improve outcomes for today’s workers at a time when more saving is needed for a secure
retirement.
23
References Ameriks, John and Stephen P. Zeldes. 2001. “How Do Household Portfolio Shares Vary by
Age?” Working Paper 6-120101. New York: TIAA-CREF Research Institute. Amromin, Gene and Paul Smith. 2003. “What Explains Early Withdrawals from Retirement
Account? Evidence from a Panel of Taxpayers.” National Tax Journal LVI(3): 595-612. AonHewitt. 2011. “Leakage of Participants’ DC Assets: How Loans, Withdrawals, and Cashouts
Are Eroding Retirement Income” Research Report. London, England. Argento, Roberto, Victoria L., Bryant, and John Sabelhaus. 2013. “Early Withdrawals from
Retirement Accounts.” Finance and Economics Discussion Series Paper 2013-22. Board of Governors of the Federal Reserve System.
Banerjee, Sudipto, IRA Withdrawals: How Much, When, and Other Savings Behavior, Employee
Benefits Research Institute, 2013, www.ebri.org. Beshears, James, James J. Choi, Christopher Clayton, Christopher Harris, David Laibson, and
Brigitte C. Madrian. 2014. Optimal Liquidity in the Retirement Income System.” Power Point for Meeting of the Retirement Research Consortium, Washington, DC. August.
Burman, Leonard E., Norma B. Coe, Michael Dworsky, and William G. Gale. 2008. “Effects of
Public Policies on the Disposition of Pre-Retirement Lump-Sum Distributions: Rational and Behavioral Influences.” CentER Discussion Paper Series No. 2008-94. The Netherlands: Tilburg University.
Butrica, Barbara A., Sheila R. Zedlewski, and Philip Issa. 2010. “Understanding Early
Withdrawals from Retirement Accounts” The Retirement Policy Program, Discussion Paper 10-02. Washington, DC: Urban Institute.
Bryant, Victoria L., Sarah Holden, and John Sabelhaus. 2011. “Qualified Retirement Plans:
Analysis of Distribution and Rollover Activity.” Working Paper WP2011-01. Philadelphia, PA: Pension Research Council.
Bryant, Victoria L. 2008. “Accumulation and Distribution of Individuals Retirement
Arrangements, 2004.” Statistics of Income Bulletin (Spring). Chang, Angela E. 1996. “Tax Policy, Lump-Sum Pension Distributions, and Household Saving.”
National Tax Journal 49(2). Copeland, Craig. 2013. Lump-Sum Distributions at Job Change, Distributions Through 2012.”
EBRI Notes 34(11). Washington, DC: Employee Benefit Research Institute.
24
Employee Benefit Research Institute. 2009. “Individual Account Retirement Plans: An Analysis of the 2007 Survey of Consumer Finances, with Market Adjustments to 2009” Issue Brief No. 333. www.ebri.org
Engelhardt, Gary V. 2003 “Reasons for Job Change and the Disposition of Pre-Retirement
Lump-Sum Pension Distributions.” Economic Letters 81. Engelhardt, Gary V. 2002. “Pre-Retirement Lump-Sum Pension Distributions and Retirement
Income Security: Evidence from the Health and Retirement Study.” National Tax Journal 55(4).
Fellowes, Matt, and Katy Willemin. 2013. “The Retirement Breach in Defined Contribution
Plans: Size, Causes, and Solutions.” Washington, DC: Hello Wallet. Holden, Sarah and Daniel Schrass. 2012. The Role of IRAs in U.S. Households’ Saving for
Retirement, 2012. Investment Company Institute. www.ici.org. Hurd, Michael, Lee Lillard, and Constantijn Panis. 1998. “An Analysis of the Choice to Cash
Out Pension Rights at Job Change or Retirement.” Report for the U.S. Department of Labor. Washington, DC.
Ibbotson. 2013. Ibbotson Stocks, Bonds, Bills, and Inflation (SBBI) Classic Yearbook. 2013.
“Long Term Government Bonds Total Monthly Returns.” Chicago, Illinois: Morningstar, Inc.
Internal Revenue Service. 2014a. Individual Retirement Arrangements. Publication 590.
Washington, DC: U.S. Department of the Treasury. Internal Revenue Service. 2014b. Topic 558 - Additional Tax on Early Distributions from
Retirement Plans, Other Than IRAs. Washington, DC: U.S. Department of the Treasury. Investment Company Institute. 2012. “The IRA Investor Profile: Traditional IRA Investors’
Withdrawal Activity, 2007 and 2008.” Washington, DC. Investment Company Institute. 2014. “2014 Investment Company Fact Book”
www.icifactbook.org Investment Company Institute. 2014. “2014 Investment Company Fact Book”
www.icifactbook.org Ippolito, Richard A. 1997. Pension Plans and Employee Performance: Evidence, Analysis, and
Policy. University of Chicago Press: Chicago, IL. Kopcke, Richard W., Francis Vitagliano, and Dan Muldoon. 2009. “The Structure of 401(k)
Fees” Center for Retirement Research Issue Brief No. 9-3.
25
Lu, Timothy (Jun), Olivia S. Mitchell, Stephen P. Utkus, and Jean A. Young. 2014. Borrowing from the Future: 401(k) Plan Loans and Defaults.” Working Paper PRC WP2014-01. Philadelphia, PA: Pension Research Council.
Munnell, Alicia H. 2012. “401(k) Plans in 2010: An Update from the SCF.” Issue in Brief 12-
13. Chestnut Hill, MA: Center for Retirement Research at Boston College. Munnell, Alicia H. and Dina Bleckman 2014. “Is Pension Coverage a Problem in the Private
Sector.” Issue in Brief 14-7. Chestnut Hill, MA: Center for Retirement Research at Boston College.
Munnell, Alicia H. and Steven A. Sass. 2008. Working Longer: The Solution to the Retirement
Income Challenge. Washington, DC: Brookings Institution Press. Munnell, Alicia H. and Annika Sundén. 2004. Coming Up Short: The Challenge of 401(k) Plans.
Washington, DC: The Brookings Institution Press. Munnell, Alicia H., Annika Sundén, and Catherine Taylor. 2002. What Determines 401(k)
Participation and Contributions? Social Security Bulletin 64. Poterba, James M, Steven F. Venti and David A. Wise. 2011. The Drawdown of Personal
Retirement Assets, National Bureau of Economic Research, 2011. Cambridge, MA: National Bureau of Economic Research.
Poterba, James M, Steven F. Venti and David A. Wise, 2001. “Preretirement Cashouts and
Foregone Retirement Saving: Implications for 401(k) Asset Accumulation” In Themes in the Economics of Aging Ed. Wise, David A. University of Chicago Press Pages 23-56.
Purcell, Patrick. 2009. “Pension Issues: Lump-Sum Distributions and Retirement Income
Security.” Report No. 7-5700. Washington, DC: Library of Congress, Congressional Research Service.
Sabelhaus, John. 2000. “Modeling IRA Accumulation and Withdrawals.” National Tax Journal
53(4). Sabelhaus, John and David Weiner. 1999. “Disposition of Lump-Sum Pension Distributions:
Evidence from Tax Returns.” National Tax Journal 52(3). U.S. Board of Governors of the Federal Reserve System. 2014. Financial Accounts of the United
States: Flow of Funds, Balance Sheets, and Integrated Macroeconomic Accounts. Washington, DC.
U.S. Board of Governors of the Federal Reserve System. Survey of Consumer Finances, 191995,
and 2010. Washington, DC.
26
U.S. Census Bureau. Survey of Income and Program Participation. Washington, DC U. S. Government Accountability Office. 2009. “401(k) Plans – Policy Changes Could Reduce
the Long-Term Effects of Leakage on Workers’ Retirement Savings” Washington, DC. Vanderhei, Jack, Sarah Holden, Craig Copeland and Luis Alonso. 2012. “401(k) Plan Asset
Allocation, Account Balances, and Loan Activity in 2011.” Employee Benefit Research Institute Issue Brief, No.380. Washington, DC.
Vanguard. 2014. “How America Saves 2014: A Report on Vanguard 2013 Defined Contribution
Plan Data.” Valley Forge, PA. Vanguard. 2007. “How America Saves: A Report on Vanguard 2006 Defined Contribution Plan
Data.” Valley Forge, PA. Warner, Joan. 2014. “Looking to Snag Rollover Assets? Here’s What Clients Want.” (January
16). Financial Advisor IQ.
27
Figure 1. Workers with Pension Coverage by Type of Plan, 1983, 1992, 2001, and 2013
Sources: Author’s calculations based on the 1983, 1992, 2001, and 2013 SCF.
62%
12%
26%
44% 40%
16% 23%
61%
16% 17%
71%
13%
0%
20%
40%
60%
80%
Defined benefit only Defined contribution -401(k) plans - only
Both
1983199520012013
28
Figure 2. Total U.S. Private Retirement Assets, by Type of Plan, 2013
Source: U.S. Board of Governors of the Federal Reserve System, Flow of Funds Accounts (2014).
$3.1
$4.9
$6.5
$0
$2
$4
$6
$8
Defined benefit Defined contribution IRA
Trill
ions
29
Figure 3. Vanguard 401(k) Leakage Activity, 2013 Note: P = participants and A = assets. Source: Authors’ depiction based on Vanguard (2014).
In-service withdrawals Hardship Post-59 ½ P=1.2% P=2.5% A=0.3% A=0.7%
Individuals experience job change P=9% A=6%
Individuals remaining in plan P=91% A=94%
All 401(k) participants P=100% A=100%
Individuals removing assets from plan
P=4.6% A=2.8%
Assets rolled-over P=2.0% A=2.3%
Assets cashed out P=2.6% A=0.5%
Individuals keeping assets in plan
P=4.4% A=3.2%
Not accessed in 2013
P=70.7% A=91.0%
Loan P=16.6% A=2.0%
Leakage 0.3%
Leakage 0.2%
Leakage 0.2%
Leakage 0.5%
30
Table 1. Provisions Related to 401(k) Leakages
Provision Requirement Applicable to:
Cashouts Hardship withdrawals Loans
ERISA 1974 Requires administrators to provide a summary plan description. x x x
Revenue Act of 1978
Provides for a cash or deferred arrangement under the Internal Revenue Code. x x x
Internal Revenue Code of 1986
Levies a 10-percent penalty for early withdrawals before age 591/2.a x x x
Sets maximum loan at lesser of (1) 50 percent of account balance or (2) $50,000.b x
Provides that participants’ contributions not be available before separation from service or a hardship.
x x
Prohibits cashouts of balances in excess of $5,000 without participant’s consent. x
Prohibits hardship withdrawal from being rolled over to an IRA or other qualified plan. x
Requires notice to participants that they can defer an immediately distributable benefit. x
EGTRRAc 2001
Reduces elective contribution prohibition period following a hardship withdrawal from 12 to 6 months.
x
Reduces the cap for involuntary cashouts at job separation to $1,000. x
Pension Protection Act of 2006
Permits hardship withdrawals for expenses related to medical, tuition, and funeral (for primary beneficiary).
x
Requires the provision of notice of the consequences of cashing out at job separation. x
a. Exceptions include instances involving death, disability, severance from service, or plan termination. b. If 50 percent of the balance is less than $10,000, the limit is set at $10,000. c. EGTRRA is the Economic Growth and Tax Relief Reconciliation Act of 2001 Source: Adapted from Table 1 in U.S. Government Accountability Office (2009).
31
Table 2. Cashing Out of 401(k) Balances at Job Change by Age, 2013
Age Percentage of participants cashing out
Percent of available dollars cashed out
20s 35 % 15 % 30s 32 11 40s 32 10 50s 24 7 60s 19 4 70s 26 6 All ages 29 7 Source: Vanguard (2014). Table 3. 401(k) Borrowing Activity, 2013
Age Percentage of participants with loans
Percentage of account balance in loans Average loan amount
Under 25 4 % 20 % $2,347 25-34 14 18 6,097 35-44 22 13 9,220 45-54 22 9 10,705 55-64 16 7 10,807 65 and over 5 6 9,619 All ages 18 10 9,456 Source: Vanguard (2014).
Table 4. Distributions from 401(k)s and IRAs Not Subject to 10-Percent Penalty
401(k) and IRAs
• In the event participant is totally and permanently disabled; • The distribution is part of a series of periodic payments; or • The distribution is to cover deductible medical expenses that
exceed 10 percent of adjusted gross income.
IRAs only
• The distribution is to cover post-secondary education expenses for participant, spouse, children, or grandchildren;
• The distribution (up to $10,000) is used to buy, build, or rebuild a first home; or
• The distribution is to cover the cost of medical insurance due to a period of unemployment of 12 or more weeks.
Note: Some types of distributions for 401(k)s and IRAs that are also exempt from the tax penalty are not included on this list. Sources: Internal Revenue Service (2014a, b).
32
Table 5. Taxable and Penalized Withdrawals by Participants under Age 55 from Tax Data as Percent of Assets and Contributions from Survey of Consumer Finances, 2001, 2004, 2007, and 2010
Year Withdrawals/assets Withdrawals/contributions Penalized Taxable Penalized Taxable
2001 1.0 2.2 15 2004 1.1 2.3 14 29 * 2007 1.2 2.2 15 32 * 2010 1.3 * 2.9 * 20 * 44 * *Estimates derived from p. 10 and Tables 1 and 4 of Argento, Bryant, and Sabelhaus (2013). Sources: Bryant, Holden, and Sabelhaus (2011); and Argento, Bryant, and Sabelhaus (2013). Table 6. Relative Importance of Leakages in Explaining the Retirement Shortfall
Projected wealth of participants turning age 65 2002-2006 assuming
Percentage reduction in wealth
2004 eligibility rate, all eligible individuals participate $237,535 2004 eligibility rate, all eligible individuals participate, less fees 204,940
13.7% 2004 eligibility rate, all eligible individuals participate, less fees and leakages 160,307
21.8%
2004 participation rate, less fees and leakages 112,215
30.0% 1982-2006 participation rates, less fees and leakages (maturation) 82,515
26.5%
Reality check - average balance in 2004 SIPP 80,104 Source: Authors’ calculations based on U.S. Census Bureau Survey of Income and Program Participation Completed Data File and public use data.
33
RECENT WORKING PAPERS FROM THE CENTER FOR RETIREMENT RESEARCH AT BOSTON COLLEGE
Recruiting and Retaining High-Quality State and Local Workers: Do Pensions Matter? Alicia H. Munnell, Jean-Pierre Aubry, and Geoffrey T. Sanzenbacher, January 2015 Do Tax Incentives Increase 401(k) Retirement Saving? Evidence from the Adoption of Catch-Up Contributions Matthew S. Rutledge, April Yanyuan Wu, and Francis M. Vitagliano, November 2014 Are Retirees Falling Short? Reconciling the Conflicting Evidence Alicia H. Munnell, Matthew S. Rutledge, and Anthony Webb, November 2014 Lifetime Job Demands, Work Capacity at Older Ages, and Social Security Benefit Claiming Decisions Lauren Hersch Nicholas, November 2014 Who Is Internationally Diversified? Evidence from 296 401(k) Plans Geert Bekaert, Kenton Hoyem, Wei-Yin Hu, and Enrichetta Ravina, November 2014
The Causes and Consequences of Financial Fraud Among Older Americans Keith Jacks Gamble, Patricia Boyle, Lei Yu, and David Bennett, November 2014
New Evidence on the Risk of Requiring Long-Term Care Leora Friedberg, Wenliang Hou, Wei Sun, Anthony Webb, and Zhenyu Li, November 2014
SSI at 62: Protecting the Vulnerable When Increasing Social Security’s Early Entitlement Age Norma B. Coe and April Yanyuan Wu, June 2014 Why Do SSI and SNAP Enrollments Rise in Good Economic Times and Bad? Matthew S. Rutledge and April Yanyuan Wu, June 2014 The Impact of Mandatory Coverage on State and Local Budgets Alicia H. Munnell, Jean-Pierre Aubry, and Anek Belbase, May 2014
Interest Rates and Economic Growth: Are They Related? Barry P. Bosworth, May 2014 The Tradeoff Between Health and Wealth in Retirement Decisions Kristine M. Brown, May 2014
All working papers are available on the Center for Retirement Research website (http://crr.bc.edu) and can be requested by e-mail ([email protected]) or phone (617-552-1762).