Embed Size (px)
Citation preview
1
The Impact of Leverage on the Delisting Decision
of AIM Companies
Eilnaz Kashefi Pour1 and Meziane Lasfer
Cass Business School, City University, 106 Bunhill Row, London EC1Y 8TZ
Abstract
We analyse the characteristics of firms that chose voluntarily to delist from the stock market
between 1995 and 2009. We find that, compared to matched firms that remained publicly
quoted, the delisted firms have significantly higher leverage and are unable to raise additional
capital. The results are strong after controlling for agency conflicts, liquidity, and asymmetric
information. On the announcement date, stock prices decrease by an average of 8% compared
to positive excess returns for firms that switch to a more regulated market, and firms that
increased their leverage in the year prior to the delisting decision generate significantly lower
excess returns than other firms.
Keywords: Small firms; AIM; London Stock Exchange; Leverage, and Delisting
JEL classification: G14, G32
1 Corresponding author. Tel. +44 20 7040 8634; Fax: +44 20 7040 8648 Email:Eilnaz.Kashefi-
[email protected], and [email protected] (Lasfer).
This paper was presented at Lancaster University and City University. We thank Professor Lambrecht and Dr.
Pawlina at Lancaster University and seminar participants at both universities for their useful comments. All
remaining errors are our own responsibility.
2
1 Introduction
Previous studies report that access to public markets for additional capital is the major
motivation for firms to undertake IPOs (e.g., Aslan and Kumar, 2011; Bharath and Dittmar,
2010; Kim and Weisbach, 2005 and Marosi and Massoud, 2007).2 For example, Kim and
Weisbach (2005) report that raising capital is the key determinant for going public as firms
raise substantial amount of new capital through IPOs in order to rebalance leverage.
Similarly, extensive studies analyse going private transactions especially through leverage
buyout (LBO), mainly in the US markets, focussing on how firms trade-off the costs and the
benefits of being a public in order to go private (e.g., Maupin et al., 1984; Kaplan, 1991; and
Bharath and Dittmar, 2010).
However, the literature has paid relatively less attention to the determinants and
consequences of the voluntary delisting decision, which is a situation where a company stops
trading in the market at its own request. Earlier studies suggest that the firms go private
substantially differ from those that decide to delist. Leuz et al. (2008) show that delisting-
companies are smaller and they have lower free cash flow compared to going private
companies. Marosi and Massoud (2007) and Leuz et al. (2008) investigate the voluntary
delisted firms referred to as dark companies. They suggest that firms decide to delist when
the costs of being a public firm exceed the benefits.
However, these studies do not focus on the impact of financing decision and they are
predominantly US, where the delisting transaction is different from other markets and firms
deregister with the SEC but remain publicly traded over-the-counter (OTC) on the Pink
Sheets (Marosi and Massoud, 2007), while, in the UK firms that delist, and do not to
change their market quotation, become private. In this circumstance, investors have two
options; either sell their shares before the delisting date or remain shareholders in what will
become a privately owned company. Moreover, those studies mainly look at the impact of the
corporate governance and the regulatory compliance of the Sarbanes-Oxley Act on July 31,
2002 on the going-dark decision using larger companies. Marosi and Massoud (2007) find
that the Sarbanes-Oxley Act (SOX) and the compliance cost are the major determinant of the
delisting decision. Leuz et al. (2008) find a large impact of the SOX but the free cash flow
problem associated with the agency cost is also highly significant. They also include leverage
as a control variable but they provide mixed evidence as leverage is only significant in the
2 However, Brau and Fawcett (2006) survey financial managers of IPOs and report that their main reason for
coming to the market is to create a currency to finance takeovers.
3
post-SOX period. Moreover, these two studies include financial companies for which
leverage is difficult to measure and may have different interpretation, as it is strongly affected
by capital requirements and investor insurance schemes, and, hence their level of leverage is
not comparable with that of non-financial companies (e.g., Rajan and Zingalas, 1995). Other
studies also investigate delisted companies in the US (Hensler et al., 1997; Jain and Kini,
1999, 2000; and Fama and French, 2004) but they do not distinguish between the types, as
they mainly assess the characteristics of companies which survive compared to those
companies that delist from the trading exchange for negative reasons.3
In this paper, we analyse the impact of debt financing on the voluntary decision to
delist. We focus on the delisting from the Alternative Investment Market (AIM) where
younger and high growth firms chose to be quoted to finance their growth opportunities.
Gerakos et al.(2011) find that AIM companies are less likely to generate positive returns in
the post-IPO period than companies listed on other markets, including the UK Main market,
and AIM is subject to higher asymmetric information and lower liquidity, suggesting that
AIM firms are more likely to fail than firms in other markets
Since its launch in 1995, it has been attracting a large number of companies, reaching
a peak in 2007 at 1,694 companies, including 394 international companies. Despite the
substantial attention of AIM in attracting listings, the reasons and consequences of the
delisting decision remains an open question. We identify a total of 445 non-financial IPOs
that delisted over the period 1995 to 2009. We exclude 137 takeovers, 119 involuntary
delisted firms (e.g., breach of market regulations), and those with missing data. Our final
sample includes 184 delisted companies, split into 158 that went private and 26 that
transferred to the Main market. We match each delisted firm (the test sample) with a control
firm on the basis of their IPO date and the firm’s size measured by market capitalisation at
the time of the IPO.
We first compare the characteristics of each test firm with its control peer at the time
of the IPO to predict whether firm’s initial characteristics impact its delisting decision. We
download all prospectuses to collect by hand data on debt, equity, market capitalisation, and
3Jain and Kini (2000) investigate the impact of VCs and underwriters’ prestige on the IPO survival. They find
that the post IPO survival time increases with the VC backing and with the prestige of investment bank. Fama and French (2004) focus on profitability and growth, as new listed companies have higher growth and lower
profitability. However, those characteristics change over the IPO life cycle and would result in a decrease in
survival rates of newly listed companies. Recently, Espenlaub et al. (2011) investigate the impact of the
regulation on the survival AIM IPOs. They compare survivors to companies that delist due to merger and
acquisition and other negative reasons, but they do not distinguish between voluntary delisting and delisting due
to market regulations, which is important to the propose of their study.
4
ownership structure at the IPO date. We find that the delisted companies have higher leverage
and lower growth opportunities, in line with the market access hypothesis. However, other
factors, such as insider ownership, under-pricing, and profitability, used to proxy for the
agency costs and information asymmetry effects, are not statistically different across the two
samples. We find similar results when we use a multivariate logit regression model.
We use the logit model to forecast the determinants of the delisting decision at the
exact time of the IPO. We find that firms with higher leverage and less growth opportunities
are more likely to delist supporting the market access hypothesis. In contrast, we do not find
evidence that agency costs and information asymmetry can predict delisting at the time of the
IPO. Therefore, given the results at the time of IPO, we could only predict that firms are more
likely to delist if they have high leverage and low growth opportunities.
We then use the Cox proportional hazard model to investigate the determinants of the
delisting decision given changes that happen to the firms’ characteristics over time. In line
with the logit regression results, we find that leverage and growth opportunities, as measured
by market-to-book ratio or capital expenditure explain significantly the decision to delist. We
also find that delisted firms are less likely to be from high-tech industries, and to raise
seasoned equity capital. The results of hazard rates, used to assess how much the hazard the
delisting event increases for a unit change in the explanatory variable, show that the marginal
effect of leverage is the most important factor among other determinants of the delisting
decision. Our results imply that firms that do not raise equity capital, as they have high debt
and low growth opportunities and capital expenditure, are more likely to delist.
However, our results may also indicate that delisted firms rely more on debt financing
because they are not able to raise equity capital, making the cost of listing higher than the
benefit. We assess this possibility by analysing other fundamental differences across firms in
our sample. We find that smaller firms with a great proportion of intangible assets are more
likely to delist, consistent with the prediction of asymmetric information. However, our
results do not support the liquidity hypothesis, as delisted firms do not have lower trading
volume. Moreover, our results provide mixed evidence for the impact of the agency conflict
as the free cash flow is not a key determinant of the delisting decision, but, consistent with
the agency hypothesis, closely held firms are more likely to delist. In particular, we find that
delisted firms have more concentrated ownership, but they do not have higher undistributed
cash flow and return on assets, used as alternative proxies for the free cash flow problem. Our
results suggest that the delisting decision is different from going private through leverage buy
outs (LBOs) where firms have high leverage and free cash flow (Lehn and Poulsen, 1989).
5
Overall, our results suggest that firms delist when they are not able to reduce their
leverage after going public. Pagano et al. (1998) and Aslan and Kumar (2011) find that
leverage has been decreasing in the post-IPO periods. However, these results are not likely to
apply to the delisted companies, as their leverage increases significantly since the second year
after the IPO, and they are not able to raise additional equity capital, questioning therefore,
the benefits of listing. We find that for the delisted companies, debt financing increases
during the first three years after the IPO. There is no considerable change in equity financing
except the second and the fourth year after the IPO, which shows that equity financing
declines significantly for the delisted companies.
Finally, we investigate the market reaction to the delisting announcement. We use the
event study methodology and compute the abnormal returns over the event window -20, +20
days relative to the announcement date. We use the market model with the coefficients α and
β computed over the -270, -21 days. We find that delisted firms experience cumulative
accumulative abnormal returns (CARs) of -7% on the announcement period [0, 2]. The
results are very similar to Leuz et al.(2008), who report CARs of -9% market reaction and
Marosi and Massoud (2007) who find -12% in the US. Interestingly, we show that these
excess returns depend on the firm’s post-delisting status. In particular, firms that switch their
quotation into the main market experience a positive announcement date excess returns of
about 1%, in line with Jenkinson and Ramadorai (2008), who find that the announcement of a
switch from AIM to the Main market generates a significant positive return about 5% on the
announcement date and positive returns in the following 6 months, suggesting that switching
to the Main market is associated with good news in the short and long-run. However, our
sample size is considerably smaller than theirs as they do not exclude financial companies
and they do not analyse voluntary delisting decision. In addition, we find that firms with
higher leverage generate significantly higher returns in the pre-delisting period, but, on the
announcement date, their abnormal returns are significantly lower, suggesting that the market
reaction depends on the severity of leverage, i.e., the inability of the firm to raise equity
capital.
The rest of the paper is structured as follows. Section 2 provides a review of the
literature and sets up the hypotheses. Section 3 presents the data and methodology. Section 4
discusses the results, and the conclusions are in Section 5.
6
2 Review of Literature and Hypotheses
2.1 IPOs
The IPO literature suggests several benefits of listing on a stock exchange including relaxing
borrowing constraints, greater liquidity, greater bargaining power with banks, and investor
recognition (e.g., Ritter, 1987 and Pagano et al., 1998). Despite those benefits, listing is
subject to substantial direct and indirect costs. Direct costs refer to administrative costs,
underwriting fees, registration fees, and indirect costs deal with adverse selection and agency
conflicts. Bharath and Dittmar (2010) argue that since as the nature of the decision on
whether to go public is affected by several factors and represents a trade-off between the
costs and the benefits of listing, the decision to go out of the public market is in the same
approach. Therefore, given the costs and the benefits, firms choose to delist when the costs of
listing exceed the benefits. However, Leuz et al., (2008) document that those firms, which
opt to delist, significantly differ from those go private in terms of determinants and economic
consequences. In this section, we discuss the theories of why firms go public and identify the
related hypotheses on the delisting-decision.
2.1.1 The Benefits of Listing/ The Costs of delisting
2.1.1.1 Access to Capital
Getting access to alternative sources of financing is the main benefit of an initial public
offering. Getting access to public markets and enhanced transparency would enable firms to
have a greater bargaining power with banks resulting in relaxing the borrowing constraint
(Pagano et al., 1998 and Bharath and Dittmar, 2006). More especially, Pegano et al. (1998)
conclude that firms go public to rebalance their leverage. However, other studies show that
financing is not the primary determinant of listing. Survey studies find that although capital
structure is one of the key motivations for going public, it is not rated the top. For example,
the survey conducted by Brau (2010) shows that companies go public primarily to create
public shares for use in future acquisitions, and debt financing is only mentioned as 5th
under
the minimisation of the cost of capital and 10th
under debt is becoming too expensive. Bancel
and Mittoo (2008) also suggest that those IPOs could enhance the bargaining power with
bankers are more likely to reduce their leverage after going public. While the firms that are
not able to rebalance their leverage would decide to abandon public life. This notion is in line
with Aslan and Kumar (2009) who find that leverage has a positive effect on the going-
7
private decision. Consequently, we expect that those IPOs that could not benefit of gaining
access to equity capital have greater level of leverage and hence they are more likely to opt to
delist.
Moreover, the benefits of going public are more likely to be important for firms with
high growth opportunities. Those companies would prefer to be public to overcome their
financial constrains as listing on a stock exchange provides an opportunity to get access to
low-cost external financing (e.g. Pagano et al., 1998, Fischer, 2000, and Bharath and Dittmar,
2006 (225). Recent empirical studies by Bharath and Dittmar (2006), Marosi and Massoud
(2007), and Aslan and Kumar (2009) find that firms with high growth opportunities prefer to
stay in the market to raise further capital. However, survey studies provide mixed evidence.
Bancel and Mittoo (2008) conduct a survey on CFOs of European firms, where their result
support that financing growth opportunities appears to be a significant determinant of the
going-public decision. In contrast, this result is not consistent with the survey findings of
Brau and Fawcett (2006). Those survey studies do not study directly the factors contributing
to the going-private decision4. Following by empirical studies, we expect that firms with low
growth opportunities are more likely to abandon public life and we use market-to-book to
measure growth opportunities.
2.1.1.2 Liquidity
Enhanced liquidity is an additional benefit for publicly listed companies. IPOs demand for
ownership dispersion and higher level of liquidity. Shares of public companies can be traded
on a stock exchange at cheaper costs resulting in greater liquidity (Pagano et al., 1998).
Similarly, the survey of Bancel and Mittoo (2008) document that share liquidity is an
important motivation for the going-public decision and its significance is greater in the
English system than their Continental European peers. With respect to the going-private
decision, Bharath and Dittmar (2010) find that those firms with less liquidity are more likely
to go private. This finding suggests that as the liquidity decreases in public markets, firms
may decide to abandon public life. We therefore, expect that the higher the liquidity is, the
less likely the firm is to go out of trading. Following by empirical studies, we use trading
volume as proxy for liquidity.
4 Brau and Fawsett (2006) also survey CFOs of companies that had filed a prospectus to go public but then
subsequently withdrew the offering and CFOs of private firms that were large enough to go public but chose not
to. They find that these firms chose to stay private to maintain decision making control. The financing (already
have enough capital) came only 6th in their preferences.
8
2.1.1.3 Control Considerations
Despite the predominant factors (access to capital markets, relaxing borrowing constraint,
and liquidity) that earlier studies have discussed in relation to the determinants of firms’
going-public decision, a recent study of Mehran and Peristiani (2010) tests the financial
visibility and investor interest as additional crucial factors that contribute to the listing
decision. They use analyst stock return, stock turnover, and stock volatility as proxies for
financial visibility. They find that IPOs that fail to attract investor interest with lack of
financial visibility are more likely to go private. They argue that firms with less financial
visibility tend to have higher stock price volatility. Their result shows that the significance of
financial visibility has been increased since the 1990s. This notion is not limited to empirical
studies, similarly the survey of European CFOs conducted by Bancel and Mittoo (2008)
confirms that investor recognition is a major factor affecting on the listing-decision. We
therefore expect that firms with greater stock volatility have less visibility in the public
market and thus are more likely to delist.
2.1.2 The Costs of Listing/ The Benefits of Delisting
2.1.2.1 Asymmetric Information
When a company is publicly traded, investors are less informed than insiders about the true
value of firms resulting in the adverse selection problem. This problem inversely affects
firms’ quality as well as their share prices. Therefore, firms with asymmetric information are
more likely to go private to avoid the cost of adverse selection (Bharath and Dittmar, 2010).
Empirical studies use size and the proportion of intangible assets over total assets as proxies
for the adverse selection problem. However, they provide mixed evidence. The results of
Pagano et al. (1998) and Bharath and Dittmar (2010) are consistent with this hypothesis, but
in contrast to Marosi and Massoud (2007). Marosi and Massoud (2007) find that the
estimated coefficients for intangible asset ratios are insignificant.
2.1.2.2 Agency Conflicts
Publicly listed companies potentially suffer from the agency conflict between managers and
shareholders that emanates from the free cash flow problem (Jensen and Meckling (1976)).
This problem is particularly large when firms do not have growth opportunities to reinvest the
free cash flow (Opler and Titman, 1993). The literature on the going-private decision
suggests that the agency conflict between managers and shareholders would be mitigated
9
through concentrating residual claims among management. Therefore, companies with
significant free cash flow as well as low growth opportunities are more likely to go private.
However, empirical studies report mixed results. Lehn and Poulsen (1989) find that free cash
flow is a significant factor for the going-private decision in contrast to Aslan and Kumar
(2009). Marosi and Massoud (2007) investigate delisted companies, where they find that free
cash flow is significant particularly for firms with high undistributed cash flow and low
growth opportunities. We expect that companies with higher free cash flow would suffer
from the agency conflict and thus they are more likely to delist. Following by empirical
studies, we use earnings before interest and tax over total assets and free cash flow over total
assets to test the free cash flow problem.
2.2 The Survival and Failure of IPOs
There are a large number of studies investigating the survival of IPOs in the US market
(Hensler et al., 1997; Jain and Kini, 1999, 2000; and Fama and French, 2004). However,
while comparing surviving companies relative to non-surviving in the post-IPO periods,
previous studies do not distinguish among the various reasons for delisting. Hensler et al.
(1997) assess the survivability of IPOs and compare surviving IPOs with those delisted from
NASDAQ for negative reasons. They control for a handful of firms’ characteristics: size, age,
initial return, risk, and insider ownership. They find that survival time increases with age,
size, and initial return while it decreases with risk factors. Jain and Kini (1999) access the
impact of VC and underwriters’ prestige on IPO survival. They find that survival increases
with VC backing and higher investment bank prestige. Fama and French (2004) consider
those companies entered on the NYSE, AMEX, and NASDAQ between 1973 and 1991. They
focus on profitability and growth, as newly listed companies have higher growth and lower
profitability. However, those characteristics would result in a decrease in the survival rates of
newly listed companies.
In another US study, Jain and Kini (2008), investigate the impact of strategic
investment at the time of IPO on post-IPO performance and survival probability. Examining
the newly listed companies during 1980 and 1997, they find that the extent of diversification
through an additional line of business decreases the probability of failure significantly. Their
results for the R&D effect on future operating performance are ambiguous and mixed,
depending on the choice of expectation model. For example, when they measure post-IPO
performance as the change in industry-adjusted operating returns on assets for the five years
after the IPO, the impact of R&D is positive and significant. But when the change in
10
industry-adjusted operating returns on assets for the year prior to the IPO is the criterion,
R&D is neither positive nor significant. In addition, they find no evidence to support the
relationship between post-IPO performance and firms’ advertising intensity.
With respect to other countries, to the best of our knowledge, two recent papers have
examined the Canadian market: Bradley et al.(2006) and Carpentier and Suret (2011).
Bradley et al.(2006) investigate initial returns of penny stock IPOs (those that are not listed
on a national exchange with an offer price below $5) versus ordinary IPOs, followed by the
long-run performance of those companies over the 1990–1998 period. They show that penny
stock IPOs experience higher initial returns than ordinary IPOs, but the long-run
underperformance of those is better than that of penny stock IPOs. They find that quality of
underwriters can support prediction of initial returns, and report mixed evidence for the
impact of VC on initial returns. Carpentier and Suret (2011) mainly look at the impact of the
listing requirements on the surviving IPOs during 1986 and 2003. They consider non-
surviving companies as those delisted by the exchange, by reserve takeovers, and by
company request. Therefore, they do not distinguish among different types of delisting. They
find that venture capitalists (VC) backed IPOs are more likely to survive, but the impact of
VC on the failure risk is not significant. They also suggest that the probability of survival in
the post-IPO period is significantly affected by the initial listing requirements, such as
prestigious underwriters and/or audit firms.
More recently, Espenlaub et al.(2011) have examined the probability of surviving
post-IPO in the period 1995–2004. However, their focus is limited to investigating the effect
of AIM regulations, as AIM is a lightly regulated market. They find that survival time is
increased by tightening the listing requirement. They compare surviving companies with non-
surviving companies that delist because of merger and acquisition or for other negative
reasons.
2.3 Delisting Procedures in the US versus the UK
In the US, the delisting process goes through two steps. Fist, companies need to delist from
the exchange (NYSE, AMEX, or NASDAQ), which may take about 21 days, depending on
the exchange. In this situation, they will trade over the counter or on the Pink Sheets. The
firm may then intend to deregister from the Securities and Exchange Commission (SEC). In
doing so, the company needs to file a Form 15 and this needs only the approval of the
company’s board of directors. In general, the process of deregistration takes up to 60 days
11
(Marosi and Massoud, 2007). Once they deregistered, they are not required to provide public
information. (see Macey et al., 2008 and Marosi and Massoud, 2007).
Unlike the US delisting process, in the UK, a firm that decides to delist should notify
the London Stock Exchange to cancel its trading on the exchange at least 20 days prior to
such date. In AIM, this circumstance should be conditional upon the approval of not less than
75% of votes cast by shareholders in the general meetings (see AIM publications in London
Stock Exchange).5The Main market, also, incorporates a somewhat equivalent transaction for
the delisting. The company advises the exchanges of the delisting intention at least 20 days in
advance. It also needs to announce its intention through a regulated information service. Once
the intention is agreed, “the exchange will announce the intention to cancel individual
securities through the reference data service and the intention to cancel issuers through a
regulated informationservice” (see Main publications in London Stock Exchange, p.
31).6Shareholders’ approval for the delisting decision depends on whether the company is a
premium or standard listed one, as the former needs 75% of shareholders’ approval in
contrast to the premium listed that is not subject to shareholders’ approval. Once the
company is delisted from the exchange, it becomes private and investors have two options;
either sell their shares before the delisting date or remain shareholders in what will become a
privately owned company.
3 Data and Methodology
3.1 Sample
We use five main databases to collect our data. We first collect all IPOs on AIM between
1995 and 2009. This data which includes 1,773 companies is collected from New Issues and
IPO Summary spreadsheet provided by the London Stock Exchange (LSE),
Londonstockexchange.co.uk. We also use this website to construct the sample of the delisted
firms and the reasons for such a decision. There are 1,666 companies delisted from AIM.
LSE classifies delisted companies into five main categories: merger and acquisition,
takeover, transfer to the Main market, company’s request, and market regulations. Figure 1
shows delisting reasons in percentage.
5AIM rules can be downloaded from London Stock Exchange,
http://www.londonstockexchange.com/companies-and-advisors/aim/advisers/rules/aim-rules-for-companies.pdf.
6Main rules can be found at the London Stock Exchange website:
http://www.londonstockexchange.com/companies-and-advisors/main-market/documents/brochures/admission-
and-disclosure-standards.pdf
12
M&A, takeover, and transfer to the Main market are specified directly in LSE. For the
purpose of our analysis, we consider “delisted at the request of the company” and “transfer to
the Main market” as voluntary reasons and other reasons such as market regulatory, M&A,
and takeover as involuntary reasons. We exclude companies that delist because of
involuntary reasons. For robustness, we screen all sample firms in DataStream to verify that
they are no longer listed. We then match IPOs with our delisted companies to find how many
IPOs delisted as well as the date of delisting. We also exclude financial companies. This
procedure results in 445 non-financial IPO companies of which 195 of those companies
delisted voluntarily. After excluding 11 firms with no data, our final sample includes 184
delisted companies. We also gather information on subsequent raising capital from the LSE,
and then match it with our sample to find how many of them raise capital over their IPO life
cycle.
Figure 2 shows the number of listed and delisted companies in AIM during the sample
period (1995-2009), suggesting that despite an increase in number of newly listed companies
in AIM, the number of delisted companies increased significantly since 2000.
In order to investigate the market reaction, we use two resources in order to find the
delisting announcements. First, we use investegate.co.uk website, which offers a large
archive for firms’ announcements to find the delisting announcements. We then use Factiva
database and hand-collect the delisting announcements for the firms that are not provided by
investegate.co.uk.
We use Thomson One Banker Database to collect the accounting data on balance
sheets and income statements during the sample period from 1995 to 2009. We extract the
stock market data, which includes daily stock prices and indices to compute the stock returns,
market capitalization, and market-to-book ratio from DataStream. In order to find the market
and accounting data at the time of IPO, we download the prospectuses from Perfect Filings
database and hand-collect all data including total debt, total assets, directors’ ownership,
venture capital, and market capitalisation.
Our dataset is different from recent studies, which examine why firms go private
(Mehran and Peristiani, 2010; Aslan and Kumar, 2011; and Bharath and Dittmar, 2010) rather
than deciding to delist. They use number of public companies that went private in leveraged
buyouts (LBOs). However, Marosi and Massoud (2007) and Leuz et al. (2008) study the
firms that have “gone dark”. Those companies opt to delist voluntarily in the US market,
13
where the delisting rules are different from the UK.7 They mainly assess the impact of SOX
and agency costs on the delisting decision. Recently Espenlaub et al. (2011) investigate the
impact of AIM’s regulatory on the survival IPOs. They assess the characteristics of
companies survive compared to those companies delist from the trading due to merger and
acquisition and other negative reasons. However, they do not distinguish between companies
that delist voluntarily and those that delist due to market regulations.
Table 1, Column 2 presents the year in which the companies decide to delist. Column
3 shows the year in which those companies went public. The table indicates that there is an
increase in the number of delisted firms since the 2000s.
3.2 Model
For the purpose of this chapter, we use a range of methodologies. First, we use a matched
logit model to predict the factors affecting firms’ delisting decision. The dependent variable
is binary, one if the company is delisted and zero otherwise. It forecasts the probability of the
event with respect to the related independent variables. The dependent variable is determined
by whether it exceeds a threshold value (Equation 1).
(1)
The logit estimation is given in Equation (2):
(2)
We match the delisted firms (test sample) with those that remained public (control
sample) using a clear starting point. We match the test sample with the control sample based
on two factors: the date of the IPO and the firm’s size measuring as market capitalisation at
the time of the IPO8.
Table 2, provides the details of independent variables with the expected sign in order
to test the hypotheses in terms of the delisting decision. We use all explanatory variables
7 In accordance with Rule 41, a firm should notify the London Stock Exchange to cancel its trading on the AIM
at least 20 days prior to such date. This is conditional upon the approval of a minimum of 75% of the votes cast
by shareholders at the general meetings. This transaction is very different from the delisting process in the US.
In the US, the delisting process would go through two steps; fist, the companies need to delist from the exchange (NYSE, AMEX, or NASDAQ), which may take about 21 days depending on the exchange. In this
situation, they would trade over the counter or on the Pink Sheets. Then they need to file a form 15 in order to
deregister from SEC and this step takes about 60 days. Once they deregistered, they are not required to provide
public information. (See Macey et al., 2008 and Marosi and Massoud, 2007). 8For those times what we have difficulties to match the date of the IPO, I consider 11 months around the date of
the IPO. The size of the company is matched within 15% range.
14
indicated in Table 2 in a year following the IPO. We also attempt to investigate the factors at
the time of the IPO in order to predict to what extent they affect the delisting decision.
However, at the exact time of the IPO, we could only find the information related to debt,
equity, insider ownership, and under-pricing. Therefore, a limited number of variables could
be used in order to test the hypotheses.
Table 2 shows the factors contributing to the delisting decision, in particular the
impact of leverage as well as other proxies to control for the agency, asymmetric information,
and financial visibility hypotheses. According to the market access hypothesis, previous
studies suggest that firms decide to go private to rebalance their capital structure, in particular
reducing leverage (Pagano et al., 1998). The literature also argues that the market access is an
important motivation for firms in order to finance their investment (Pagano et al., 1998;
Fischer, 2000; and Bharath and Dittmar, 2006). Therefore, we expect that firms with less
market access are more likely to delist voluntarily. In particular, firms that do not have
opportunity to issue equity have higher leverage and hence are more likely to go out of
trading. Firms with higher growth opportunities are more likely to stay in the market in order
to raise further capital to cover their investments. We use two alternative proxies for growth
opportunities, market-to-book and capital expenditure ratios.
With respect to the agency hypothesis, previous studies suggest that firms with higher
conflict between managers and shareholders have greater free cash flow problem and thus
they are more likely to go private (Lehn and Poulsen, 1989; and Aslan and Kumar, 2011).
Therefore, we expect that firms with greater free cash flows are more likely to go out of
trading. In addition, the conflict between managers and shareholders is greater in more
closely held firms and thus firms with higher insider ownership are more likely to delist.
Moreover, the degree of asymmetric information affects the decision of delisting.
Insiders are better informed about the true value of assets than outsiders and hence insiders
may take benefits of their private information by going private (Marosi and Massoud, 2007).
We use two proxies to control the asymmetric information, size of the firms and the ratio of
intangible assets to total assets. We expect that smaller firms and those firms with higher
intangible assets are more likely to delist.
Recent studies by Mehran and Peristiani (2010) and Bharath and Dittmar (2010) test
the financial visibility and investor interest as crucial factors over firms’ life cycle. They
suggest that those IPOs that fail to attract investor interest with lack of financial visibility are
more likely to go private. They argue that firms with less financial visibility tend to have
higher stock price volatility. However, the two existing empirical studies for the voluntary
15
delisting decision (Marosi and Massoud, 2007 and Leuz et al., 2008) have not investigated
the impact of financial visibility on such a decision. Therefore, we use stock turnover and
stock volatility to control for financial visibility to fill the existing gap in previous empirical
studies that investigate the voluntary delisting decision in the US. We expect that firms with
higher stock volatility and lower stock turnover have lower financial visibility and hence they
are more likely go out of public markets.
We then investigate the factors contributing to the delisting decision by using the
Cox’s Proportional hazard model, following Mehran and Prestiani (2009) and Bharath and
Dittmar (2010), to find the length of time it takes to delist controlling for the related
variables. The predictor variables are used to predict the event, which is the time of the
delisting. This model measures the duration to the even that we defined. Following the logit
model, in the hazard model, we control delisted companies with the remained public
companies by size and the date of IPO. The hazard model is (Equation 3):
h (t, X (t)) = h (t,0) exp(B X(t)) (3)
Where is h(t, X(t)) is the hazard rate at time t for a firm with covariates X(t). This
model controls for the effects of differences between firms as well as changes over time. The
hazard ratio (exp (B)) indicates the change in the hazard for a unit increase in the independent
variable. However, for continuous explanatory variables, the hazard ratio measures the
marginal effect of a unit increase in the independent variable. For discrete explanatory
variables, the hazard ratio indicates the marginal effect when the event occurs. The hazard
ratio greater than one means that the reference category (here 1) has a shorter time to event
and otherwise. If the hazard ratio is equal to one, it indicates that there is no difference
between the two groups.
In order to investigate the impact of delisting announcements on the market reaction,
an event study is used.9 This methodology includes several stages. First, the event should be
identified following by the event window.10
The event window is a period around the event, in
which the stock price reaction will be assessed. In the last empirical study, we use the event
methodology in order to test the market reaction to the delisting announcement. Therefore,
the delisting announcement is the event and the period of interest around such an
announcement is the event window. Depending on the purpose of the study, the event
window includes some days before and after the event to investigate the price reaction. The
9 In particular, it investigates the impact of a specific event on a firms’ stock price. A firms’ stock price could
respond to any announcement such as earnings, capital change, merger and acquisitions, dividends, initial public
offering, delisting, etc. 10 In this thesis, I focus on the market reaction to delisting announcements.
16
further stage is to clarify the estimation period. It is a period prior to the event window to
compute expected returns as well as standard deviation of the returns. Figure 3 illustrates the
event window and the estimation period. As this figure shows, t=0 is the event and [T- t, T+t]
is the event window. The parameter from the estimation period [T1, T-t] will be computed to
calculate the abnormal returns.
We use the market model to investigate the market reaction to the delisting
announcement. For this purpose, with daily data, the return on a stock would be calculated as
Equation (4):
Ri,t= αi+ βiRM,t + εi,t (4)
Where Ri,tis the return on the common stock of the ith company in the sample at day t; RM,t is
the return on market index, which is FTSE all share at time t, and εi,t is the error term.
The Equation (4) should be run for the security returns against the corresponding
market index returns, which is the Financial Times All Shares Index (in this chapter) to find
the α and β from the estimation period [T1, T-t]. Then Equation (5) will be computed to find
the abnormal returns over the event window [T-t, T+t] for each security (here we compute the
accumulative abnormal returns over the event window [-20, +20] and the estimation period is
[-270, -21] to find the α and β):
ARi,t= Ri,t – (α^i+ β
^iRM,t) (5)
Where ARi,tis the abnormal return on the common stock of the ith company in the sample
over the event window; RM,t is the return on the market index for the event period.
For the event period, the abnormal returns are cumulated (CAR) as Equation (6):
(6)
Finally, with respect to the number of companies (N) in the sample, cumulated
average abnormal returns (CAAR) will be calculated as Equation (7):
(7)
To test whether the cumulative abnormal returns are statistically significant over the
event period, the Equation (8) is used:
(8)
Where S is standard deviation and T is the event period [T-t, T+t].
17
5.4 Results
4.1 Descriptive Statistics
Table 3 describes the number of years that delisted firms were in AIM. On average,
the firms were in AIM for about 4 years. Interestingly, this result is significantly different
from the studies based on the going private decision. For example, Bharath and Dittmar
(2010) find that firms are in the public market for about 13 years before going private through
leveraged buyouts (LBOs). Our result suggests that firms delist much earlier than deciding to
go private (LBOs). This indicates the differences in the choice between delisting voluntary
and deciding to go private through LBOs.
Table 4, provides the characteristics of delisted companies over the public life. The
last column of this table reports the t-statistics and Wilcoxon-Mann-Whitney test for the
differences in means and medians between the test sample and the control sample,
respectively. Consistent with the access to capital markets hypothesis, the results show that
the delisted companies have higher leverage, indicating that they were less likely to raise
capital and hence they opt out of trading. They also have lower growth opportunities, as
measured by market-to-book ratio as well as lower capital expenditure. These findings imply
that either the test firms did not need to new capital as they do not have any growth
opportunities, or they were not able to invest because they could not raise equity capital.
Consistent with the agency conflict, the results show that delisted companies have
higher free cash flow and profitability as measured by return on assets, suggesting that firms
may delist to overcome their agency conflicts. However, these results are only significant in
medians. The result for insider ownership is not significant.
In order to test the asymmetric information problem, we use intangibility and size.
The proportion of intangible assets over total assets measures the degree of asymmetric
information between insiders and outsiders (Marosi and Massoud, 2007). Our results show
that the test sample has higher intangible assets than the control sample indicating a higher
probability of asymmetric information for delisted companies. This result is inconsistent with
Marosi and Massoud (2007), who examine US delisted companies. The results for size
measured by natural logarithm of market capitalisation show that delisted companies are
significantly smaller than the remained public companies. This indicates that delisted
companies are smaller companies with greater probability of asymmetric information and
thus are more likely to delist.
18
The results also show that delisted firms have lower liquidity and financial visibility
as measured by trade volume and stock turnover. Finally, this table shows that the delisted
companies are more volatile when we consider the stock volatility.
We then attempt to show firms’ characteristics of test and control samples at the same
point in time, which is the year after the IPO. This criterion is in line with Bharath and
Dittmare (2010), who use one year following the IPO in order to have a comprehensive data.
The results are reported in Table 5, Panel A. However, taken one year as a starting point is
subject to a problem as some firms possibly delist during the first year of the IPO. Therefore,
we compare the characteristics of both samples at the exact time of the IPO and the results
are reported in Panel B of Table 5. For this purpose, the data is collected by hand from
prospectuses and we could only collect the accounting data such as leverage, market-to-book,
insider ownership, return on assets, and size.
Table 5, Panel A, shows that the test sample firms have significantly higher leverage,
lower capital expenditure and growth opportunities, greater insider ownership, and more
excess free cash flow. Some of these results are portrayed in Figure 4. Interestingly, the first
panel (A) of Figure 4 shows for delisted firms, leverage carried on increasing in the post-IPO
period. In contrast for the control firms, leverage stayed relatively stable. This suggests that
delisted companies did not raise equity after their IPOs, and thus they use more debt in an
increase in leverage, while the public remained companies would benefit from raising capital
following IPOs and hence they have lower leverage. However, this may be also due to
differences in growth opportunities and profitability. In order to assess these factors, we
analyse also changes in market-to-book and profitably (ROA). The second panel (B) of
Figure 4 shows that growth opportunities as measured by the market-to-book ratio declines
for both test and control firms, but this ratio are lower for the delisted firms than for the
remained public firms. Taken in conjunction with the results from Tables 4 and 5, these
findings suggest that the delisted companies need less capital to invest and therefore they are
more likely to opt out of trading. Panel C of Figure 4 shows that control firms have
considerably lower excess free cash flow compared to the test firms. The last panel of Figure
4 describes the size of both the test and the control samples. It shows that remained public
companies are larger than delisted companies.
In Panel B of Table 5, consistent with Panel A, we provide strong support for the
impact of leverage, as market-to-book as a proxy for growth opportunities, on the decision to
delist. This Panel shows that the delisted companies are highly levered companies with less
19
growth opportunities in contrast to remained public companies. We predict that low growth
companies need less capital to finance and thus they are more likely to delist.
Furthermore, we examine how firms’ characteristics change over the IPO life cycle in
Table 6. Following Bharath and Dittmare (2010), we present the data for the year following
the IPO and the year prior to the delisting time. This table shows that firms have higher
leverage at the time of the delisting suggesting that they have lower probability of raising
capital and thus decide to delist. The results also report that firm have lower growth
opportunities at the time of the delisting. It indicates that they may have less opportunity to
invest and thus need less capital resulting in going out of trading. These results support the
hypothesis related to the market access that firms with lower market access are more likely to
delist. However, capital expenditure is not significant between the time of the IPO and the
time of the delisting.
Table 6 also presents the results for the agency hypothesis indicating that the higher
the conflict between managers and shareholders, the more likely the firms are to be delisted.
We find that firms have greater insider ownership at the time of delisting. It shows that firms
with more concentrated ownership are more likely to have the agency conflict between
managers and shareholders. We also use the proportion of free cash flow over total assets and
return on assets, as two alternative proxies for the free cash flow problem. We do not find
that the free cash flow problem has a significant impact of the delisting decision. These
results are not consistent with Lehn and Poulsen (1989), who study the going private
companies argue that firms benefit from going private to reduce the probability of the agency
conflict.
With respect to the asymmetric information, our results show that firms are smaller
and with higher intangible assets when they decide to delist. Finally, our results are not
consistent with the liquidity hypothesis, but they show that firms have higher stock volatility
when they delist.
4.2 Empirical Analysis
4.2.1 Logit Results
We use the data at the exact time of the IPO and estimate the logit regression in order to
investigate whether the inherent characteristics of the firm at the time of the IPO could
predict the ultimate delisting decision. The results are reported in Table 7, Panel A. We
20
download all prospectuses in order to collect those data. However, we could only find the
data related to leverage, return on assets, market capitalisation, insider ownership, and under-
pricing. The dependent variable is a dummy set to one if a firm is delisted and zero otherwise.
Panel A reports the results based on the hypotheses in four models, as models (1), (2), and (3)
presents the results based on the access to market, agency conflicts, and asymmetric
information hypotheses. The last model (4) includes the proxies for liquidity and financial
visibility as well as other explanatory variables in the last three models.
We then take the delisting year as the event and re-estimate the logit regression for
one year before the delisting year. We attempt to investigate whether firms’ characteristics
over the public life cycle are different between the delisted companies and the surviving
companies. If so, would those characteristics predict the delisting decision? Panel B presents
the results of the logit regression at the year prior to the delisting. Yet again, we report the
results based on four main hypotheses as explained in Panel A. However, in each model, we
try to use alternative proxies to have a robustness check.
Both panels also reports two goodness-of-fit tests: Hosmer and Lemeshow (1989) and
Andrews (1988). The idea underlying these tests is to compare the fitted expected values to
the actual valuesby group. If these differences are large, we reject the model as providing an
insufficient fit to the data.
Interestingly, the results only support the market access hypothesis in Panel A., since
leverage and market-to-book as a proxy for growth opportunities, are the only significant
coefficients in all four models. Therefore, our results provide strong support for the
importance of the market access hypothesis. This is consistent with Marosi and Massoud
(2007) and Leuz et al. (2008), who find that delisted companies in the US have significantly
higher leverage. However, the recent literature for going private firms report mixed evidence
for the impact of leverage. Mehran and Peristiani (2009) suggest a positive and significant
relationship between going private decision in contrast to Bharath and Dittmar (2010). In
addition, the results are not consistent with Witmer (2005), who does not support the impact
of leverage and growth opportunities on the voluntary cross-delisting decision. Alternatively,
he suggests that size and stock turnover are the key determinants of cross-delisting as smaller
firms with low stock turnover are more likely to delist. However, in contrast to their results,
We show that firms with higher leverage and lower growth opportunities are more likely to
delist. Perhaps the determinants of the voluntary delisting decision are different from the
determinants of voluntary cross-delisting decision.
21
The results in model (2) do not provide any support for the agency conflicts as insider
ownership and return on assets, as proxies for the agency conflict are not statistically
significant. Models (3) and (4) test the asymmetric information and liquidity hypotheses,
respectively. The results show that at the time of the IPO, these hypotheses cannot forecast
the determinants of the delisting decision.
We also attempt to control for a foreign company listed on AIM by a dummy variable
set to one if a firm is foreign company and zero otherwise. The results in Panel A of Table 7
do not report any significant effects of the overseas companies on the delisting decision. We
also control for high-tech industries, venture capitalists, and underwater prestigious, which do
not appear to have a significant impact on the delisting decision. Finally, the two goodness-
of-fit tests (H-L and Andrews statistics) reported in Panel A, support that the observed values
are very close to the expected value and thus this model is efficient. Accordingly, the results
of Panel A show that only leverage and firms’ growth opportunities could predict whether a
company opts to go out of the market. 11
In Panel B, we measure our variables one year prior to the delisting decision to assess
whether fundamental factors can predict this decision.The results also support the market
access hypothesis, as firms with lower growth opportunities and greater leverage are more
likely to delist (model 1.1). In model (1.2) of Panel B, we use the proportion of capital
expenditure as an alternative proxy for growth opportunities. Consistent with the market-to-
book ratio, we find that firms with greater capital expenditure need further capital and thus
they are less likely to delist. However, the two goodness-of-fit tests show that model 1.2 is
not efficient and hence we exclude the proportion of capital expenditure in other models.
Moreover, we provide mixed evidence for the agency conflict. Models 2.1 and 2.2
show that free cash flow and return on assets as proxies for free cash flow problem are not
significant. While the results present that closely held firms are more likely to delist. The
results for ownership structure are complementary to those of Amihud et al. (1990), who find
that firms controlled by major shareholders are reluctant to use equity. Therefore, as we
expected, more closely held firms are less likely to issue equity and thus are have higher
probability of delisting.
Model (3) controls for the asymmetric information and the results are not significant.
Models (4.1) and (4.2) do control for all hypotheses including the impact of the liquidity and
the financial visibility on the delisting decision in the year before the delisting. The results
11In order to overcome the restriction data, we use logit model at the year following the IPO, when the data
available to collect and the results are reported in Appendix A.
22
show that the last year CAAR is negative and significant, suggesting that delisted companies
with higher cumulative abnormal returns are less likely to go out of trading.
Our sample includes all delisted companies and those companies that transferred to
the Main market. In order to check whether the determinants of delisting are different across
these two sets of companies, we use the multinomial logit regression. The results are reported
in Panel (C). In this model, we use surviving companiesas a reference group. The model then
controls for delisted companies that go private versus the reference group (surviving-matched
companies) as well as the transferred companies (upgraded to the Main market) versus the
surviving-matched companies. The results for delisted companies that go private are in line
with results from the logit model in Panel A. In contrast, the results for transferred companies
show that only return on assets and underpricing are highly significant. Increases in return on
assets (ROA) result in an increase in the probability of upgrading to the Main market. These
findings are inconsistent with the agency conflict but in line with the argument of Arcot et al.
(2007) that AIM companies are encouraged to join to the Main market when they
demonstrate their profitability.12
Moreover, we find that underpricing has a negative but
insignificant effect on the delisting decision, whereas its effect is highly significant on the
upgrading decision to the Main market. In order to have a robustness check, we re-estimate
the regression by adding the explanatory variables and the results are consistent across all
four models. Therefore, we report the marginal effect of variables only for Model (4), which
includes all explanatory variables. The results show that among significant variables, a unit
increase in leverage will increase the probability of delisting by 1.40, which is higher than the
marginal effect of growth opportunities (0.96), but leverage and growth opportunities do not
determine the upgrading decision.
Panel D shows the results of multinomial logit model one year before delisting. Given
the survive-matched companies as the reference category, the findings show that the
determinants of delisting are relatively different across the other two categories (delisted
companies and upgraded to the Main market companies). Increases in leverage and decreases
in growth opportunities result in an increases in the probability of delisting. However,
leverage and growth opportunities measured by both the market-to-book ratio and the ratio of
capital expenditures have not significant effects on moving to the Main market. We find that
larger firms with more profitability are more likely to move to the Main market than survive
12
Arcot, S., Black, J. and Owen, G., (2007), From local to global: the rise of AIM as a stock market for growing
companies, Report commissioned by London Stock Exchange from The London School of Economics and
Political Science.
23
in AIM, suggesting that they might be able to meet the Main listing requirements. Moreover,
the results show that those companies that generate positive abnormal returns are more likely
to upgrade to the Main market than survive in AIM. While, companies with negative
abnormal returns are more likely to delist than survive in AIM. The results show that
companies with higher liquidity and lower risk measured by stock volatility and beta are
more likely to transfer to the Main market than stay in AIM. In contrast with the results for
upgraded companies, increases in issuing seasoned equity offerings and operating in high-
tech industries decrease the probability of delisting. These results are confirmed, as the
reported Deviance statistics support the goodness-fit of all models.
4.2.2. Hazard Regression Results
In this section, we use the Cox proportional hazard model to investigate the factors that
contribute to the delisting decision. Panel A in Table 8 presents the results of the hazard
model for all companies, including both delisted companies and those companies that
transferred to the Main market after controlling for the surviving-matched firms. We match
the surviving firms with the test sample based on the IPO date and the size at the time of the
IPO in order to compare the companies with the same characteristics. These companies are
publicly listed at the same time with the same size. The results are presented based on the
hypotheses in four main models. We repeat each specification in each subsequent model to
check the robustness of the results. Panel B show the results for delisted companies compared
to the matched surviving companies. Panel C reports the results for the upgraded companies
compared to their matched surviving companies. The hazard ratios of model (4.2) are also
reported in all panels.
Panel A of Table 8 shows that firms have a higher hazard rate of delisting if they have
greater leverage and lower growth opportunities measured by the market-to-book ratio. These
results are in line with the market access prediction (model 1.1). For robustness check, in
Panel A, we replace MB by the proportion of capital expenditures over total sales as an
additional proxy for growth opportunities (model 1.2). Consistent with the market
hypotheses, we find that firms with greater capital expenditures are less likely to delist.
Regarding the agency hypothesis, we use the proportion of free cash flow over total assets,
which is not statistically significant (model 2.1). Similarly, the coefficient on return on assets
as an alternative proxy for the free cash flow problem is not significant (model 2.2). This is in
contrast with the prediction of the agency conflict as firms with larger free cash flow are
24
more likely to delist. The regression results present a positive and significant relationship
between insider ownership and the probability of delisting, thus supporting the agency
conflict hypothesis, suggesting that the delisting decision is smoother for firms that are more
closely held. Firms also have a greater hazard rate of delisting if they are smaller with higher
intangible assets, supporting the asymmetric information hypothesis. These results are robust
across all models.
Model (4.1) includes stock volatility and stock turnover following by Mehran and
Peristiani (2009). However, we provide mixed evidence for the liquidity and financial
visibility predictions. The results show that the impact of stock turnover on the delisting
decision is not significant. In model (4.2), we use the log of trade volume as an additional
proxy for liquidity and similar to the stock turnover evidence, the result is not significant.
Moreover, in contrast with our hypotheses, the relationship between stock volatility and the
probability of the delisting decision is statistically negative. Mehran and Peristiani (2009)
also find the negative coefficient of stock volatility. They suggest that firms with higher
probability of failure are less likely to go private supporting the financial distress notion.
We control for seasoned equity offerings and high-tech industries in all specifications
and the results are robust. The effect of the firms’ ability to conduct a seasoned equity
offering is statistically significant indicating that the hazard rates of delisting decrease as
firms have a greater market access to issue equity. In addition, firms that operate in high-tech
industries are less likely to delist. The hazard ratio of model (4.2) is reported in Panel A. The
results are robust across all models in Panel A, therefore we report the hazard ratio only for
model (4.2). For continuous explanatory variables, the hazard ratio measures the marginal
effect of a unit increase in the independent variable. For discrete explanatory variables, the
hazard ratio indicates the marginal effect when the event occurs. A hazard ratio greater than
one means that the reference category (here 1) has a shorter time to event and otherwise. If
the hazard ratio in equal to one, it indicates that there is no difference between the two groups
of firms. As Panel A shows, leverage has the highest marginal effect on the delisting decision
of about 1.49, indicating that the hazard rate of the delisting increases about 1.49 times for a
unit increase in leverage.
Panel B and Panel C show the results for voluntary delisted companies that go private
and companies that transferred to the Main market, respectively. The results of Panel B are
consistent with those of reported in Panel A indicating that voluntary delisted companies
have higher leverage and lower growth opportunities measured by both the market-to-book
ratio and the proportion of capital expenditures over total sales. The coefficient on insider
25
ownership is positive and significant, further supporting the agency conflict as more closely
held firms are more likely to opt out of the market. While the results of Panel C show that the
coefficient on insider ownership is negative and significant indicating that more closely held
firms are less likely to transfer to the Main market. Consistent with the asymmetric
information hypothesis, the results of Panel B show that smaller companies with lower
tangible assets are more likely to delist voluntarily, suggesting that companies with higher
asymmetric information problems have greater hazard rates of delisting. The results of the
upgrading decision in Panel C show that tangibility has not a significant effect on the
decision to join the Main market but size has a positive and significant effect on such a
decision, indicating that firms with greater market capitalisations are more likely to join the
Main market. In contrast with the results of delisted companies in Panel B, the impact of
leverage is not significant on the upgrading decision to the Main market. The coefficient on
the market-to-book ratio is negative and significant, suggesting that high growth companies
are more likely to stay in AIM than upgrade to the Main market. The results also show that
firms are more likely to upgrade to the Main market if they have higher liquidity measured by
the logarithm of trade volume. We control for seasoned equity offerings and the results show
that conducting seasoned equity offerings has a negative and significant effect on the
probability of voluntary delisting, while it has an insignificant effect on the probability of
upgrading to the Main market. Finally, operating in high-tech industries has a negative and
significant impact on both the voluntary delisting and upgrading decision to the Main market.
4.2.3 Analysis of the Ex Post Market Access
In conjunction with the results from Panel B of Table 7, we provide strong support for the
market access hypothesis, indicating that leverage has a positive and significant effect on the
voluntary delisting decision to go private. Therefore, we attempt to investigate further
consequences of leverage and debt-equity financing over the IPO life cycle of the voluntary
delisted companies. We find that leverage is significantly greater for delisted companies than
for remained public companies. The results suggest that delisted companies would not able to
issue equity and thus they are more likely to delist. To investigate this expectation, we follow
Pegano et al.’s (1998) methodology of how leverage of the voluntary delisted and the
remained public companies evolve over the IPO life cycle (Equation 9). We use this
alternative specification in order to compare the ex post performance of the voluntary delisted
companies relative to those companies that remained public.
yit α+ β
j j 0 IPOt-j+ β5IPOt-n+ui+dt+eit (9)
26
Where ui, anddtare a firm specific and calendar year specific effect, respectively. IPOt-
j are dummy variables equal to one if year t-j was the IPO year, and IPOt-n is a dummy
variable set to one if the IPO took place more than 5 years before. This estimation is based on
the fixed-effects model, which controls for the effect of the IPO and the four subsequent
years by dummy variables.
Table 9 shows that the remained public companies deleverage after the IPO. This
finding is in line with Pagano et al.(1998) and Aslan and Kumar (2011), who find that
leverage decreases in the post-IPO period due to substantial equity issued. Table 9 shows that
for remained public companies, there is significant equity issuance over three years after the
IPO, but debt issuance is not significant for those companies. Our results for remained public
companies are consistent with those of Pagano et al.(1998), who find that equity issuance
increases significantly over three years after the IPO. However, Table 9 shows that these
results are not consistent with the voluntary delisted companies as leverage increases in the
second year after the IPO, suggesting that delisted companies may not raise equity capital
over their IPO life cycle This argument is supported in Table 9 which shows that for delisted
companies, debt financing increases following the first year after the IPO, while there is no
considerable change in the equity financing except the second and the fourth year after the
IPO, which shows that the equity financing declines significantly for those companies that
delist voluntarily.
4.2.3. Market Reaction
In this section, we attempt to investigate the market reaction to the delisting decision. We
collect stock prices from the DataStream for the period from January 1994 to December
2010. We then use the investegate.co.uk website, which offers a large archive for
announcements to find delisting announcements. In addition, we use the Factiva database and
hand-collect delisting announcements for the firms that are not provided by investegate.co.uk.
We analyse three different windows, [0, 1], [0, 2], and [0,5 ]. The event day (0) is the
delisting announcements and the numbers in brackets show the staring and closing date of
each window. We attempt to find the instantaneous market reaction to the delisting
announcements by computing the first window, [0, 1].
There is the possibility for voluntary delisted firms to transfer to other listing markets.
If so, we exclude 26 firms that delist in order to trade in the Main market. Panel A. of Table
10 reports the market reaction for all delisted companies while Panel B shows the result for
27
the voluntary delisted firms excluding those firms that transferred to the Main market. Panel
C shows the market reaction for the delisted companies which switch to the Main market.
Panel A of Table 10 shows that the cumulative abnormal return is -7% for the [0, 1]
and [0, 2] windows and -8% for the [0, 5] window. The results are very similar to the US
study of Leuz et al.(2008), who report -7.5% and -9% market reaction for the [0, 1] and [0, 2]
windows, respectively. Similarly, Marosi and Massoud (2007) find about -12% market
reaction for the [0, 1] and [0, 5] windows presenting a larger market reaction. In addition, Liu
(2004) finds that foreign companies that delist from the US stock exchange markets because
of involuntary reasons experience abnormal return of about -4.5%. His result is different from
Sanger and Peter (1990), who report market reaction of about -8.5% for domestic delisted
companies in the US. The results also support the differences between the companies who
delist voluntarily and those which go private trough leveraged buyouts (LBO, MBO, IBO).
The studies based on going private transactions find positive accumulative returns around
various event dates. Renneboog et al.(2007) report 11% for the [-5, 5] window in the UK
consistent with Leuz et al.(2008), who find 14% for both the [0, 1] and [0, 2] windows in the
US.
Interestingly, when we study the delisted firms that transferred to the Main market,
we find different results. Panel C. shows cumulative abnormal returns are 0%, 1%, and 1%
for the [0, 1], [0, 2], and [0, 5] windows, respectively, on the announcement of delisting in
order to switch to the Main market. The significant positive returns indicate that market
distinguishes between the voluntary delisting decision and the delisting decision associated
with transferring to the Main market. It suggests that switching to the Main market delivers
good news to the market. Our findings are consistent with Jenkinson and Ramadorai (2008),
who find that the announcement of a switch from AIM to the Main market generates a
significant positive return of about 5%. However, the sample size of this study is
considerably smaller than their sample size and perhaps it makes the magnitude of
accumulated average returns of our sample to be different from their sample. Jenkinson and
Ramadorai (2008) also find that companies that transferred to the Main market experience a
significant increase in performance, suggesting that switching to the Main market is
associated with good news and thus the market responds positively.
28
The results of Table 10 do not control for firm characteristics while our focus is to
investigate the leverage effects of the delisting decision, we distinguish between the delisted
firms that experience an increased leverage in the year prior to the delisting decision and
those with a decrease in leverage. The results are reported in Table 11, where Panel A shows
CAARs for the delisted companies with an increased leverage in the prior year of the
delisting. Panel B presents the results for those companies with a decreased leverage in the
year before the delisting.
Table 11 shows that companies with an increased leverage experience greater
negative abnormal returns in all three windows than those with a decreased leverage. The
results suggest that those companies with greater leverage are more likely to have financial
risk and thus inflate the market reaction.
5 Conclusions
This chapter presents evidence of the determinants of the delisting decision in AIM,
particularly the effects of debt-equity financing. Recently, the US literature distinguishes
between the going private decision, which happens mainly through leverage buyout and the
voluntary delisting decision (Leuz et al., 2008; and Marosi and Massoud, 2007). To the best
of our knowledge, there have been no previous studies investigating the determinants and the
consequences of the voluntary delisting decision in the UK, especially in AIM. In particular,
we attempt to focus on the effects of leverage on the delisting decision, as previous studies
suggest that access to capital markets is the main motivation for the going-public decision.
Going public in order to raise further capital would affect firms’ capital structure and thus we
expect a significant impact of leverage on the delisting decision. Probably, firms that would
fail to raise further equity capital are more likely to delist.
To investigate the choice of being a public company or deciding to delist, we match
the delisted companies with the remained public companies based on two criteria, the date of
the IPO and the firm’s size at the time of the IPO. We find that the delisted companies are
substantially different from the public remained companies. The delisted companies are those
with lower growth companies, greater leverage and capital expenditures.
To forecast the determinants of the delisting decision, we use the logit estimation at
the exact time of the IPO. The results of the logit regression provide strong support for the
market access hypothesis; delisting companies have higher leverage and lower growth
opportunities compared to those that remained public. We then use the Cox proportional
29
hazard model, which examines how changes in firms’ characteristics over the public life
could result in delisting from the market. Similarly, consistent with the market access
hypothesis, we find that firms with higher leverage and lower growth opportunities are more
likely to delist. We also find support for the importance of the asymmetric information and
liquidity hypotheses, but the results are not consistent with the agency conflict hypothesis.
The results show that companies with higher asymmetric information measured by the
proportion of intangible assets are more likely to delist. However, we do not provide any
evidence consistent with the agency hypothesis measuring by the excess cash flow. The
agency conflict predicts that those companies with higher excess cash flows are more likely
to delist but our results do not support such notions. Overall, we find strong support for the
impact of leverage on the delisting decision. The Cox proportional hazard model shows that
leverage has the highest marginal effect on such a decision.
In addition, when we investigate the ex-post performance of IPOs, we find that the
inability to issue equity is a major motivation for the delisting decision. The results suggest
that leverage has increased for the delisted firms in contrast to the publicly remained
companies. This is followed by increasing the debt financing for the delisted companies.
We further investigate the market reaction of delisting announcements. We use the
market model to compute abnormal returns around the announcement of delisting. We find
that abnormal returns are negative for different windows. However, there is the possibility
that the effect of delisting announcements due to transfer to the Main market would affect the
market reaction. To account for this issue, we split our sample into two groups, the delisted
companies excluding those that switched to the Main market and the delisted companies that
transferred to the Main market. Interestingly, when we exclude those companies that
switched to the Main market, we find that abnormal returns are negative. However, this is not
the case for the switched companies. The market reaction is positive when companies
announce their intention of transferring to the Main market. As far as we know, Jenkinson
and Rmadorai (2008) is the only study, which investigates the market reaction of switching
from AIM to the Main market. They also report similar results as firms that transferred to the
Main market experience positive abnormal returns. The results suggest that the market would
distinguish between the delisted companies and those companies that delist in order to switch
to the Main market. Transferring to the Main market may be considered as good news and
thus the market reacts positively.
In order to control for the leverage, we re-estimate the market reaction for two groups,
the delisted companies that experience an increased leverage in the year prior to the delisting
30
decision and the delisted companies that experience a decreased leverage in the year prior to
the delisting decision. The results suggest that companies with an increased leverage
experience substantial negative abnormal returns compared to those with a decreased
leverage.
The contribution of our study is to shed light on the voluntary delisted companies in
AIM as this issue has not been investigated. Recently, the delisting event attracts the attention
of the literature and so far two studies examine the delisting decision in the US (Marosi and
Massoud, 2007; and Leuz et al., 2008). However, the US delisting transaction is significantly
different from the UK and thus we contribute to previous studies by considering the costs and
the benefits of listing to explain why firms decide to delist voluntarily. Particularly, we am
interested on the impact of leverage on such a decision in AIM.
However, our study may suffer from some limitations. Since AIM is a less regulated
market, collecting data is relatively restricted. We do not have information related to the post-
delisting period as we need those data in order to investigate the impact of the delisting
decision on shareholders. Therefore, the extent to which other data will strengthen or alter our
results is challenging for future research. In addition, we find that the stock price of the
voluntary delisted companies decreases significantly on the announcement date and hence we
expect an abnormal insider trading before the delisting. This stage is also subject to future
research, particularly to analyse the trading activity of insiders and block holders, to assess
whether these investors pre-empt or react to the announcement of the delisting decision.
31
References
Andrews, D. W. K., 1998, Inference in nonlinear econometric models with structural
change, The Review of Economic Studies, 55, 615-639.
Aslan, H. and P. Kumar, 2009, Lemons and cherries? Growth opportunities and
market temptations in going public and private, Forthcoming in the Journal of Financial and
Quantitative Analysis.
URL: http://papers.ssrn.com/sol3/papers.cfm?abstract_id=1439755
Bancel, F. and U. Mittoo, 2008, Why European firms go public? Working Paper,
University of Manitoba
URL: http://papers.ssrn.com/sol3/papers.cfm?abstract_id=1034164
Bharath, S. T. and A. K. Dittmar, 2006, To be or not to be (public). Using going
private transactions to examine why firms go public, Working paper,
URL: http://papers.ssrn.com/sol3/papers.cfm?abstract_id=951710
Bharath, S. T. and A. K. Dittmar. 2010, Why do firms use private equity to opt out of
public markets?, The Review Of Financial Studies 23, 1772-1818.
Brau, C. J., 2010, Why do firms go public? Forthcoming in the Oxford Handbook of
Entrepreneurial Finance
URL: http://papers.ssrn.com/sol3/papers.cfm?abstract_id=1649008
Brau, J. and S. Fawcett, 2006, Initial public offerings: an analysis of theory and
practice, Journal of Finance 61, 399-436
Derrien, F., and A. Kecskes, 2007, The initial public offering of listed firms, Journal
of Finance 62, 447-479.
Espenlaub, S., A. Khurshed, and A. Mohamed, 2011, IPO survival in a reputational
market, Working paper.
Fama, F. and K. French, 2004, New lists: Fundamentals and survival rates, Journal of
Financial Economics 73, 229-269.
Fischer, C., 2000. Why do companies go public? Empirical evidence from Germany’s
Neuer Markt. Working Paper,
URL: http://papers.ssrn.com/sol3/papers.cfm?abstract_id=229529
Gerakos, J., M. Lang, and M. Maffett, 2011, Listing choices and self-regulation: The
experience of the AIM, Working paper, URL:
http://papers.ssrn.com/sol3/papers.cfm?abstract_id=1739137
Hensler, D., R. Rutherford, and T. Springer, 1997, The survival of initial public
offerings in the aftermarket, Journal of Financial Research 20, 93-110.
32
Hosmer, D. W. and S. Lemeshow, 1989, “Applied Logistic Regression”, New York:
John Wiley & Sons.
Jenkinson, T. and T. Ramadorai, 2008, Does one size fit all? The consequences of
switching markets with different regulatory standards, Working paper, URL:
http://papers.ssrn.com/sol3/papers.cfm?abstract_id=971699
Jensen, M. C. and W. H. Meckling, 1976, Theory of the firm: managerial behavior,
agency costs and ownership structure, Journal of Financial Economics 3, 305-360.
Jain, B. and O. Kini, 1999, The life cycle of initial public offerings, Journal of
Business Finance and Accounting 26, 1281-1307.
Jain, B. and O. Kini, 2000, Does the presence of venture capitalists improve the
survival profile of IPO firms?, Journal of Business Finance & Accounting 27, 1139-1176.
Kaplan, S. N., 1991, The staying power of leveraged buyouts. Journal of Financial
Economics 29, 287–314.
Kim, W. and M. Weisbach, 2005, Do firms go public to raise capital? Working paper,
URL: http://papers.ssrn.com/sol3/papers.cfm?abstract_id=610988
Lehn, K. and A. Poulsen, 1989, Free cash flow and stockholders gains in going
private transactions, The Journal of Finance 44, 771-787.
Leuz, C., A, Triantis, and T.Y. Wang, 2008, Why do firms go dark? Causes and
economic consequences of voluntary SEC deregistration. Journal of Accounting and
Economics 45, 181-28.
Liu, S., 2004, The impact of voluntary foreign delistings: An empirical analysis,
Working Paper,
URL:http://papers.ssrn.com/sol3/papers.cfm?abstract_id=680641
Macey, J., M., O’Hara, and D. Pompilio, (2008), Down and Out in the Stock Market:
The Law and Economics of the Delisting Process, Journal of Law and Economics 51, 683-
713.
Marosi, A. and N. Massoud, 2007, Why do firms go dark? Journal of Financial and
Quantitative Analysis 42, 421-442.
Maupin, R., C. Bidwell, and A. Ortegren. 1984, An empirical investigation of the
characteristics of publicly held corporations that change to private ownership via
management buy outs. Journal of Business Finance and Accounting 11:435–50.
Mehran, H. and S. Peristiani, 2010 Financial visibility and the decision to go private,
The Review of Financial Studies 23, 520-547.
Opler, T. and S. Titman, 1993, The Determinants of Leveraged Buyout Activity: Cash
flow vs. Financial Distress Costs, The Journal of Finance 48, 1985-1999.
33
Pagano, M., F. Panetta, and L. Zingales, 1998, Why do companies go public? An
empirical analysis, The Journal of Finance 53, 27-64.
Rajan, R. and L. Zingales, 1995, What do we know about capital structure: Some
evidence from international data, Journal of Finance 50, 1421-1460.
Rennboog, L., T. Simons, and M. Wright, 2007, Why do public firms go private in the
UK? The impact of private equity investors, incentive realignment and undervaluation,
Journal of Corporate Finance 13, 591-628.
Ritter, R. J. 1987, The Costs of Going Public, Journal of Financial Economics 19,
269-81.
Sanger, G. C., and J. D. Peterson, 1990, An empirical analysis of common stock
delistings, The Journal of Financial and Quantitative Analysis 25, 261-272.
Witmer, J., 2005, Why do firms cross-(de)list? An examination of the determinants
and effects of cross-delisting, Working paper,
URL: http://papers.ssrn.com/sol3/papers.cfm?abstract_id=885503
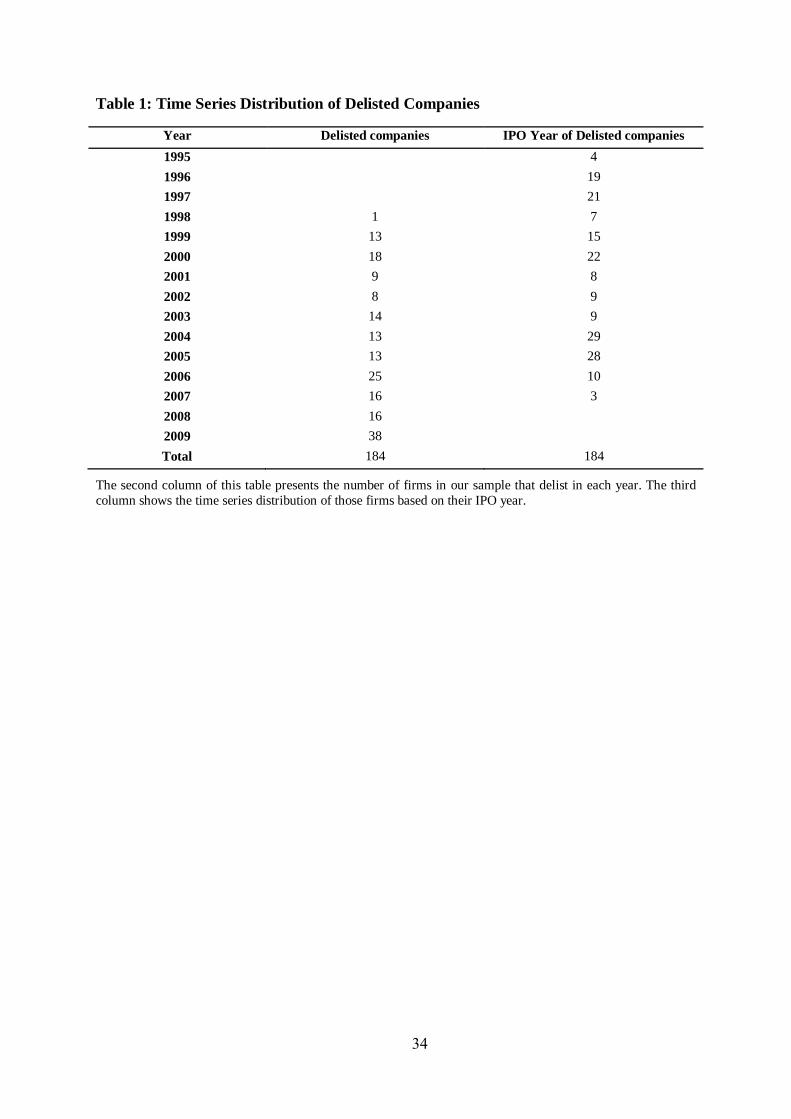
34
Table 1: Time Series Distribution of Delisted Companies
Year Delisted companies IPO Year of Delisted companies
1995 4
1996 19
1997 21
1998 1 7
1999 13 15
2000 18 22
2001 9 8
2002 8 9
2003 14 9
2004 13 29
2005 13 28
2006 25 10
2007 16 3
2008 16
2009 38
Total 184 184
The second column of this table presents the number of firms in our sample that delist in each year. The third
column shows the time series distribution of those firms based on their IPO year.
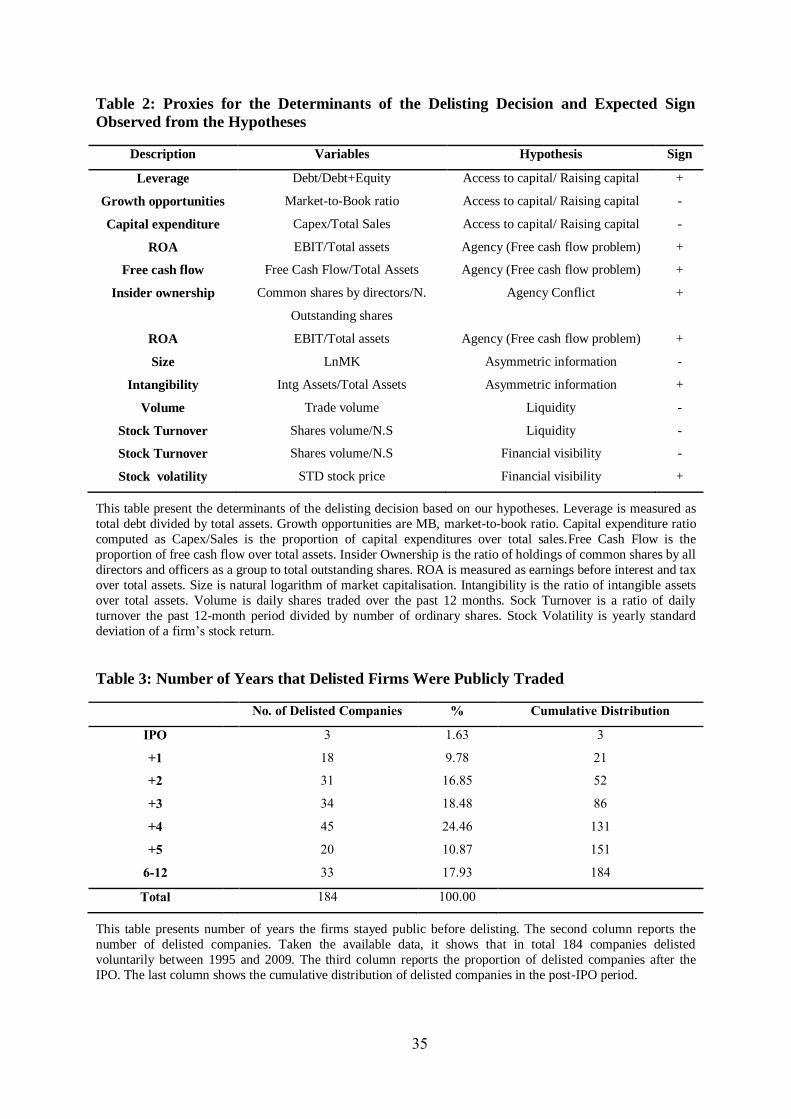
35
Table 2: Proxies for the Determinants of the Delisting Decision and Expected Sign
Observed from the Hypotheses
Description Variables Hypothesis Sign
Leverage
Growth opportunities
Capital expenditure
Debt/Debt+Equity
Market-to-Book ratio
Capex/Total Sales
Access to capital/ Raising capital
Access to capital/ Raising capital
Access to capital/ Raising capital
+
-
-
ROA EBIT/Total assets Agency (Free cash flow problem) +
Free cash flow Free Cash Flow/Total Assets Agency (Free cash flow problem) +
Insider ownership Common shares by directors/N.
Outstanding shares
Agency Conflict +
ROA EBIT/Total assets Agency (Free cash flow problem) +
Size
Intangibility
LnMK
Intg Assets/Total Assets
Asymmetric information
Asymmetric information
-
+
Volume
Stock Turnover
Trade volume
Shares volume/N.S
Liquidity
Liquidity
-
-
Stock Turnover
Stock volatility
Shares volume/N.S
STD stock price
Financial visibility
Financial visibility
-
+
This table present the determinants of the delisting decision based on our hypotheses. Leverage is measured as
total debt divided by total assets. Growth opportunities are MB, market-to-book ratio. Capital expenditure ratio
computed as Capex/Sales is the proportion of capital expenditures over total sales.Free Cash Flow is the
proportion of free cash flow over total assets. Insider Ownership is the ratio of holdings of common shares by all
directors and officers as a group to total outstanding shares. ROA is measured as earnings before interest and tax
over total assets. Size is natural logarithm of market capitalisation. Intangibility is the ratio of intangible assets
over total assets. Volume is daily shares traded over the past 12 months. Sock Turnover is a ratio of daily
turnover the past 12-month period divided by number of ordinary shares. Stock Volatility is yearly standard
deviation of a firm’s stock return.
Table 3: Number of Years that Delisted Firms Were Publicly Traded
No. of Delisted Companies % Cumulative Distribution
IPO 3 1.63 3
+1 18 9.78 21
+2 31 16.85 52
+3 34 18.48 86
+4 45 24.46 131
+5 20 10.87 151
6-12 33 17.93 184
Total 184 100.00
This table presents number of years the firms stayed public before delisting. The second column reports the
number of delisted companies. Taken the available data, it shows that in total 184 companies delisted
voluntarily between 1995 and 2009. The third column reports the proportion of delisted companies after the
IPO. The last column shows the cumulative distribution of delisted companies in the post-IPO period.
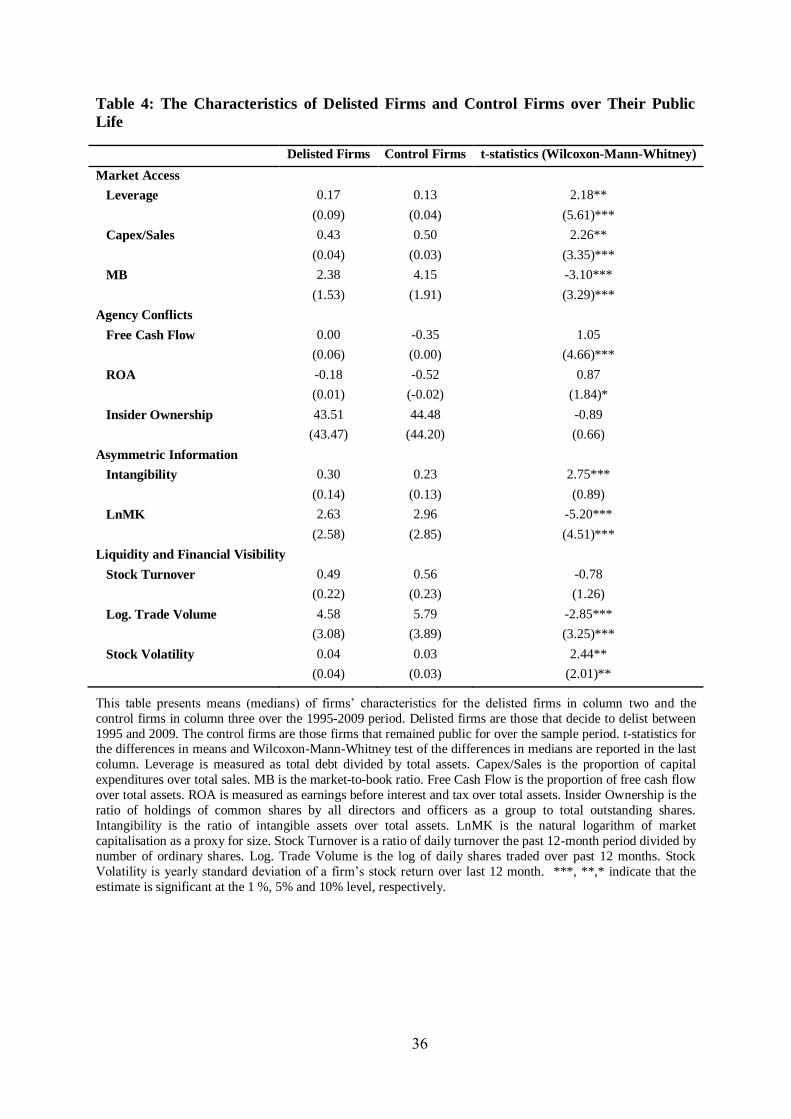
36
Table 4: The Characteristics of Delisted Firms and Control Firms over Their Public
Life
Delisted Firms Control Firms t-statistics (Wilcoxon-Mann-Whitney)
Market Access
Leverage 0.17 0.13 2.18**
(0.09) (0.04) (5.61)***
Capex/Sales 0.43 0.50 2.26**
(0.04) (0.03) (3.35)***
MB 2.38 4.15 -3.10***
(1.53) (1.91) (3.29)***
Agency Conflicts
Free Cash Flow 0.00 -0.35 1.05
(0.06) (0.00) (4.66)***
ROA -0.18 -0.52 0.87
(0.01) (-0.02) (1.84)*
Insider Ownership 43.51 44.48 -0.89
(43.47) (44.20) (0.66)
Asymmetric Information
Intangibility 0.30 0.23 2.75***
(0.14) (0.13) (0.89)
LnMK 2.63 2.96 -5.20***
(2.58) (2.85) (4.51)***
Liquidity and Financial Visibility
Stock Turnover 0.49 0.56 -0.78
(0.22) (0.23) (1.26)
Log. Trade Volume 4.58 5.79 -2.85***
(3.08) (3.89) (3.25)***
Stock Volatility 0.04 0.03 2.44**
(0.04) (0.03) (2.01)**
This table presents means (medians) of firms’ characteristics for the delisted firms in column two and the
control firms in column three over the 1995-2009 period. Delisted firms are those that decide to delist between
1995 and 2009. The control firms are those firms that remained public for over the sample period. t-statistics for the differences in means and Wilcoxon-Mann-Whitney test of the differences in medians are reported in the last
column. Leverage is measured as total debt divided by total assets. Capex/Sales is the proportion of capital
expenditures over total sales. MB is the market-to-book ratio. Free Cash Flow is the proportion of free cash flow
over total assets. ROA is measured as earnings before interest and tax over total assets. Insider Ownership is the
ratio of holdings of common shares by all directors and officers as a group to total outstanding shares.
Intangibility is the ratio of intangible assets over total assets. LnMK is the natural logarithm of market
capitalisation as a proxy for size. Stock Turnover is a ratio of daily turnover the past 12-month period divided by
number of ordinary shares. Log. Trade Volume is the log of daily shares traded over past 12 months. Stock
Volatility is yearly standard deviation of a firm’s stock return over last 12 month. ***, **,* indicate that the
estimate is significant at the 1 %, 5% and 10% level, respectively.
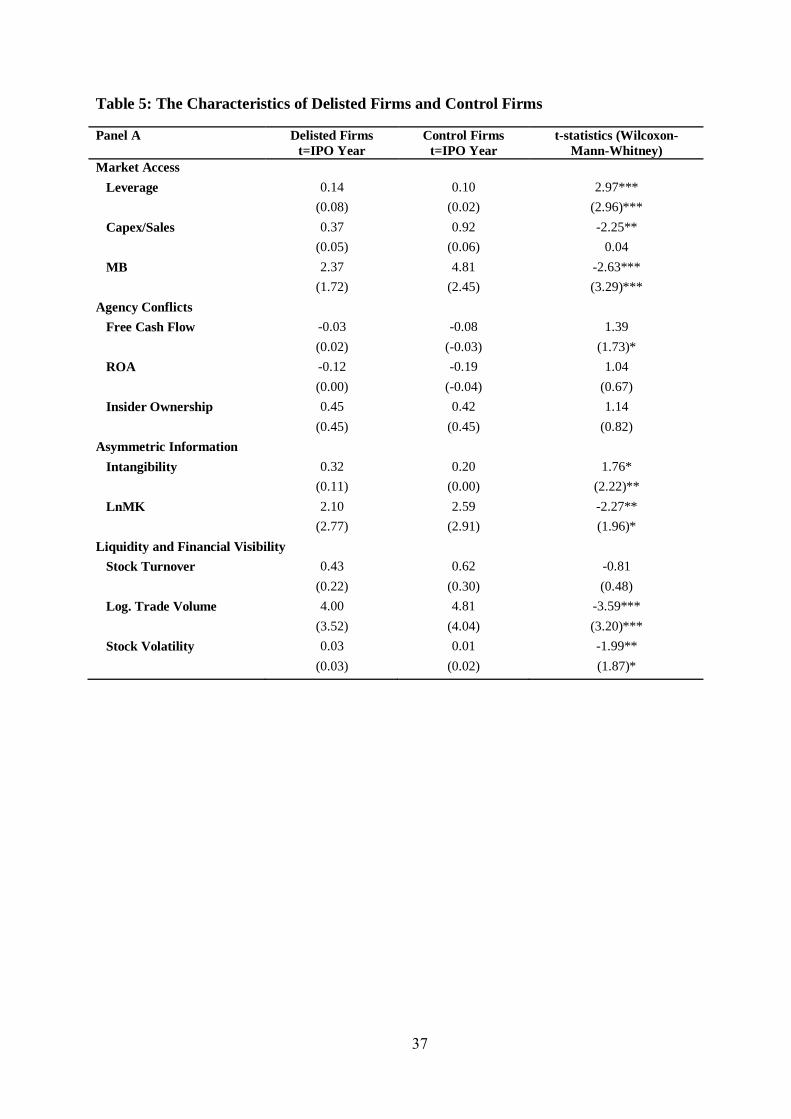
37
Table 5: The Characteristics of Delisted Firms and Control Firms
Panel A Delisted Firms
t=IPO Year
Control Firms
t=IPO Year
t-statistics (Wilcoxon-
Mann-Whitney)
Market Access
Leverage 0.14 0.10 2.97***
(0.08) (0.02) (2.96)***
Capex/Sales 0.37 0.92 -2.25**
(0.05) (0.06) 0.04
MB 2.37 4.81 -2.63***
(1.72) (2.45) (3.29)***
Agency Conflicts
Free Cash Flow -0.03 -0.08 1.39
(0.02) (-0.03) (1.73)*
ROA -0.12 -0.19 1.04
(0.00) (-0.04) (0.67)
Insider Ownership 0.45 0.42 1.14
(0.45) (0.45) (0.82)
Asymmetric Information
Intangibility 0.32 0.20 1.76*
(0.11) (0.00) (2.22)**
LnMK 2.10 2.59 -2.27**
(2.77) (2.91) (1.96)*
Liquidity and Financial Visibility
Stock Turnover 0.43 0.62 -0.81
(0.22) (0.30) (0.48)
Log. Trade Volume 4.00 4.81 -3.59***
(3.52) (4.04) (3.20)***
Stock Volatility 0.03 0.01 -1.99**
(0.03) (0.02) (1.87)*
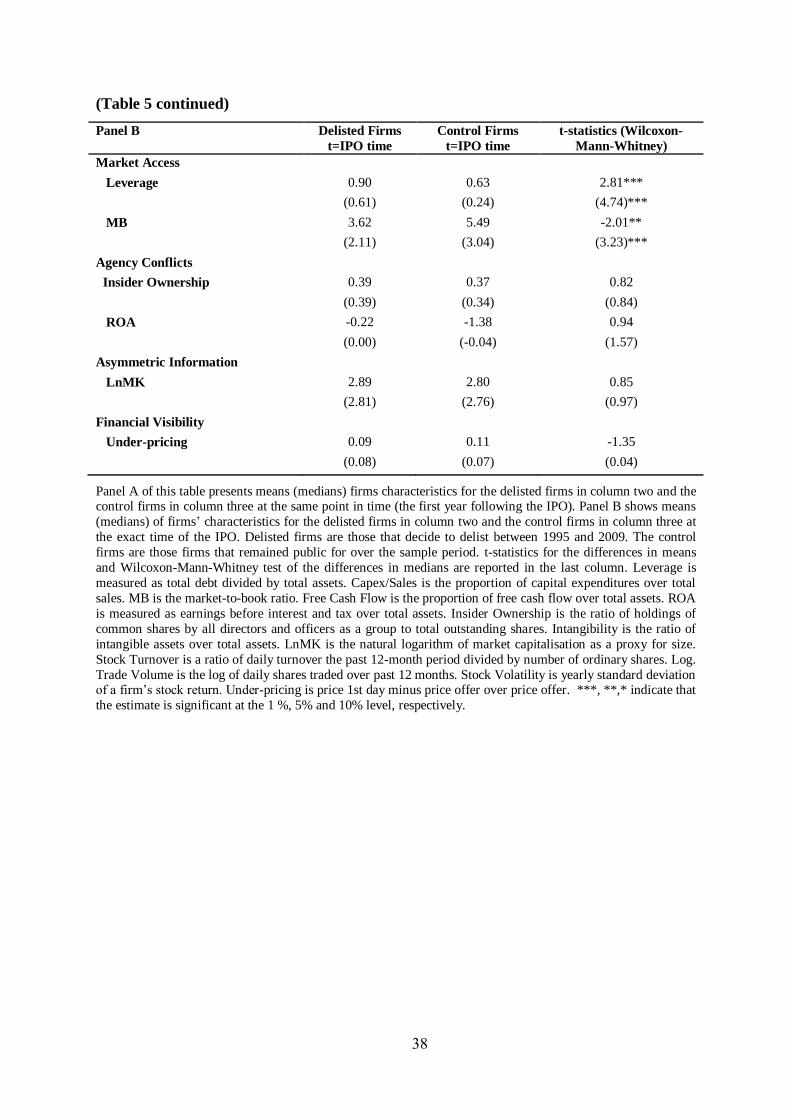
38
(Table 5 continued)
Panel B Delisted Firms
t=IPO time
Control Firms
t=IPO time
t-statistics (Wilcoxon-
Mann-Whitney)
Market Access
Leverage 0.90 0.63 2.81***
(0.61) (0.24) (4.74)***
MB 3.62 5.49 -2.01**
(2.11) (3.04) (3.23)***
Agency Conflicts
Insider Ownership 0.39 0.37 0.82
(0.39) (0.34) (0.84)
ROA -0.22 -1.38 0.94
(0.00) (-0.04) (1.57)
Asymmetric Information
LnMK 2.89 2.80 0.85
(2.81) (2.76) (0.97)
Financial Visibility
Under-pricing 0.09 0.11 -1.35
(0.08) (0.07) (0.04)
Panel A of this table presents means (medians) firms characteristics for the delisted firms in column two and the control firms in column three at the same point in time (the first year following the IPO). Panel B shows means
(medians) of firms’ characteristics for the delisted firms in column two and the control firms in column three at
the exact time of the IPO. Delisted firms are those that decide to delist between 1995 and 2009. The control
firms are those firms that remained public for over the sample period. t-statistics for the differences in means
and Wilcoxon-Mann-Whitney test of the differences in medians are reported in the last column. Leverage is
measured as total debt divided by total assets. Capex/Sales is the proportion of capital expenditures over total
sales. MB is the market-to-book ratio. Free Cash Flow is the proportion of free cash flow over total assets. ROA
is measured as earnings before interest and tax over total assets. Insider Ownership is the ratio of holdings of
common shares by all directors and officers as a group to total outstanding shares. Intangibility is the ratio of
intangible assets over total assets. LnMK is the natural logarithm of market capitalisation as a proxy for size.
Stock Turnover is a ratio of daily turnover the past 12-month period divided by number of ordinary shares. Log.
Trade Volume is the log of daily shares traded over past 12 months. Stock Volatility is yearly standard deviation of a firm’s stock return. Under-pricing is price 1st day minus price offer over price offer. ***, **,* indicate that
the estimate is significant at the 1 %, 5% and 10% level, respectively.
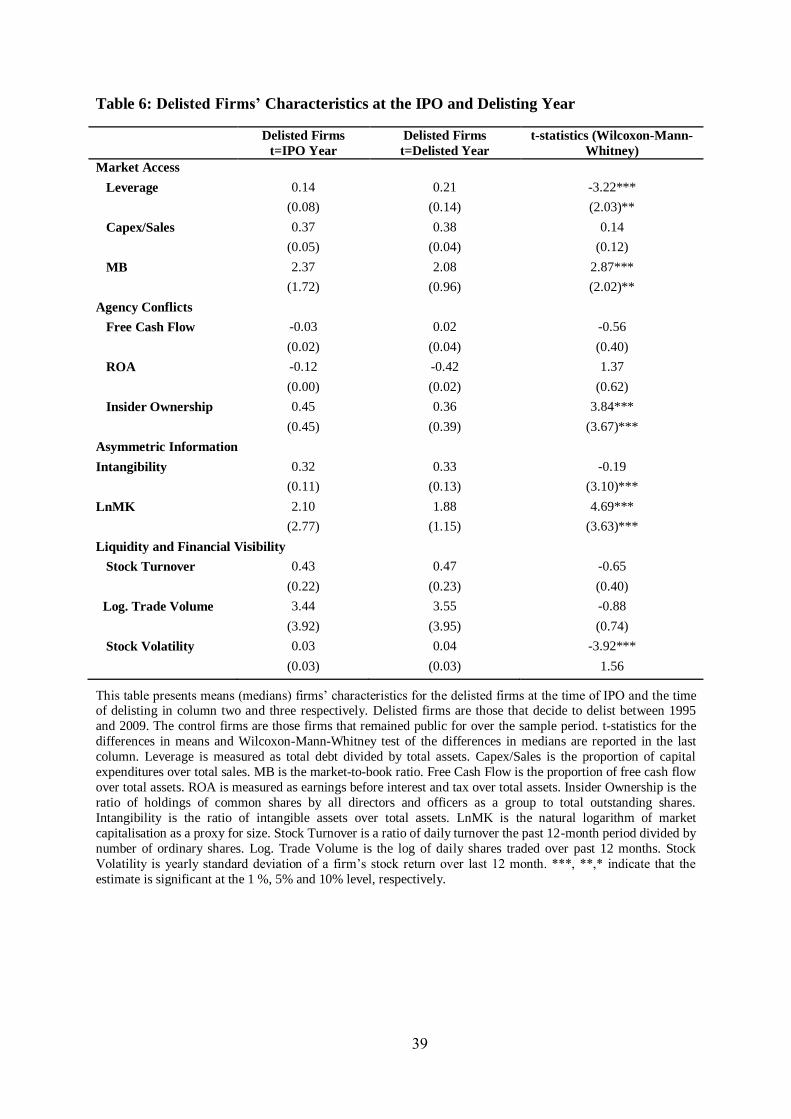
39
Table 6: Delisted Firms’ Characteristics at the IPO and Delisting Year
Delisted Firms
t=IPO Year
Delisted Firms
t=Delisted Year
t-statistics (Wilcoxon-Mann-
Whitney)
Market Access
Leverage 0.14 0.21 -3.22***
(0.08) (0.14) (2.03)**
Capex/Sales 0.37 0.38 0.14
(0.05) (0.04) (0.12)
MB 2.37 2.08 2.87***
(1.72) (0.96) (2.02)**
Agency Conflicts
Free Cash Flow -0.03 0.02 -0.56
(0.02) (0.04) (0.40)
ROA -0.12 -0.42 1.37
(0.00) (0.02) (0.62)
Insider Ownership 0.45 0.36 3.84***
(0.45) (0.39) (3.67)***
Asymmetric Information
Intangibility 0.32 0.33 -0.19
(0.11) (0.13) (3.10)***
LnMK 2.10 1.88 4.69***
(2.77) (1.15) (3.63)***
Liquidity and Financial Visibility
Stock Turnover 0.43 0.47 -0.65
(0.22) (0.23) (0.40)
Log. Trade Volume 3.44 3.55 -0.88
(3.92) (3.95) (0.74)
Stock Volatility 0.03 0.04 -3.92***
(0.03) (0.03) 1.56
This table presents means (medians) firms’ characteristics for the delisted firms at the time of IPO and the time of delisting in column two and three respectively. Delisted firms are those that decide to delist between 1995
and 2009. The control firms are those firms that remained public for over the sample period. t-statistics for the
differences in means and Wilcoxon-Mann-Whitney test of the differences in medians are reported in the last
column. Leverage is measured as total debt divided by total assets. Capex/Sales is the proportion of capital
expenditures over total sales. MB is the market-to-book ratio. Free Cash Flow is the proportion of free cash flow
over total assets. ROA is measured as earnings before interest and tax over total assets. Insider Ownership is the
ratio of holdings of common shares by all directors and officers as a group to total outstanding shares.
Intangibility is the ratio of intangible assets over total assets. LnMK is the natural logarithm of market
capitalisation as a proxy for size. Stock Turnover is a ratio of daily turnover the past 12-month period divided by
number of ordinary shares. Log. Trade Volume is the log of daily shares traded over past 12 months. Stock
Volatility is yearly standard deviation of a firm’s stock return over last 12 month. ***, **,* indicate that the
estimate is significant at the 1 %, 5% and 10% level, respectively.
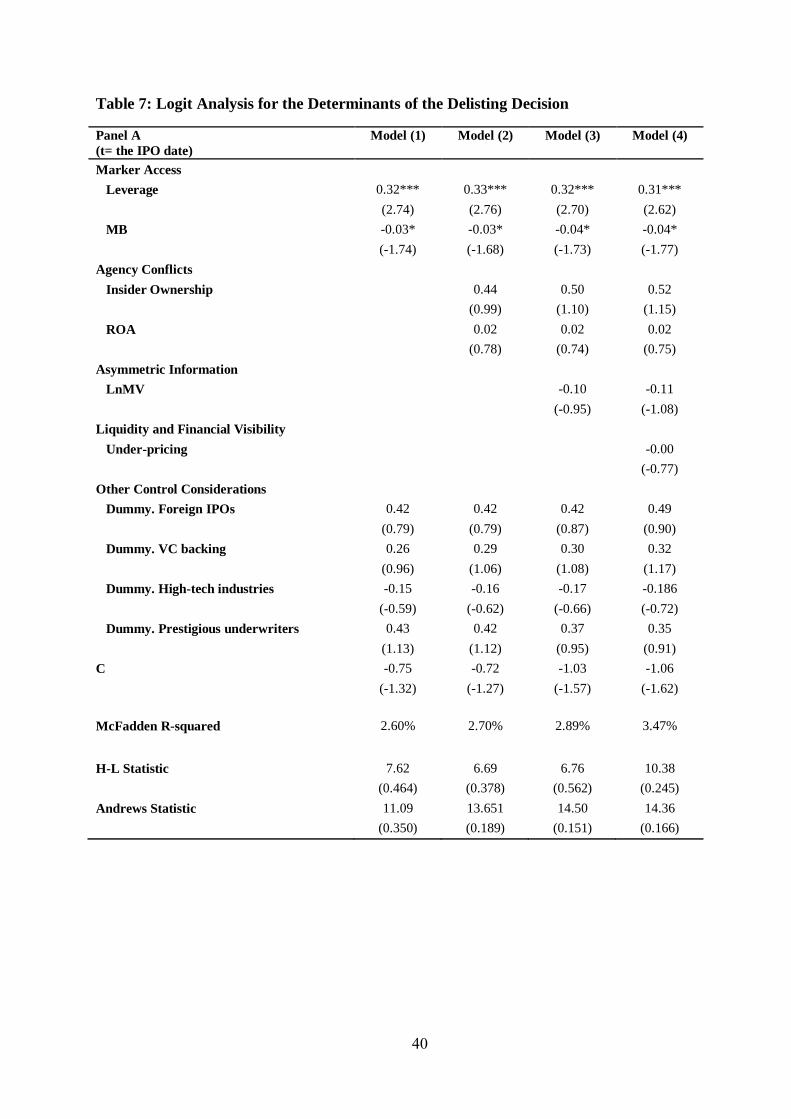
40
Table 7: Logit Analysis for the Determinants of the Delisting Decision
Panel A
(t= the IPO date)
Model (1) Model (2) Model (3) Model (4)
Marker Access
Leverage 0.32*** 0.33*** 0.32*** 0.31***
(2.74) (2.76) (2.70) (2.62)
MB -0.03* -0.03* -0.04* -0.04*
(-1.74) (-1.68) (-1.73) (-1.77)
Agency Conflicts
Insider Ownership 0.44 0.50 0.52
(0.99) (1.10) (1.15)
ROA 0.02 0.02 0.02
(0.78) (0.74) (0.75)
Asymmetric Information
LnMV -0.10 -0.11
(-0.95) (-1.08)
Liquidity and Financial Visibility
Under-pricing -0.00
(-0.77)
Other Control Considerations
Dummy. Foreign IPOs 0.42 0.42 0.42 0.49
(0.79) (0.79) (0.87) (0.90)
Dummy. VC backing 0.26 0.29 0.30 0.32
(0.96) (1.06) (1.08) (1.17)
Dummy. High-tech industries -0.15 -0.16 -0.17 -0.186
(-0.59) (-0.62) (-0.66) (-0.72)
Dummy. Prestigious underwriters 0.43 0.42 0.37 0.35
(1.13) (1.12) (0.95) (0.91)
C -0.75 -0.72 -1.03 -1.06
(-1.32) (-1.27) (-1.57) (-1.62)
McFadden R-squared 2.60% 2.70% 2.89% 3.47%
H-L Statistic 7.62 6.69 6.76 10.38
(0.464) (0.378) (0.562) (0.245)
Andrews Statistic 11.09 13.651 14.50 14.36
(0.350) (0.189) (0.151) (0.166)
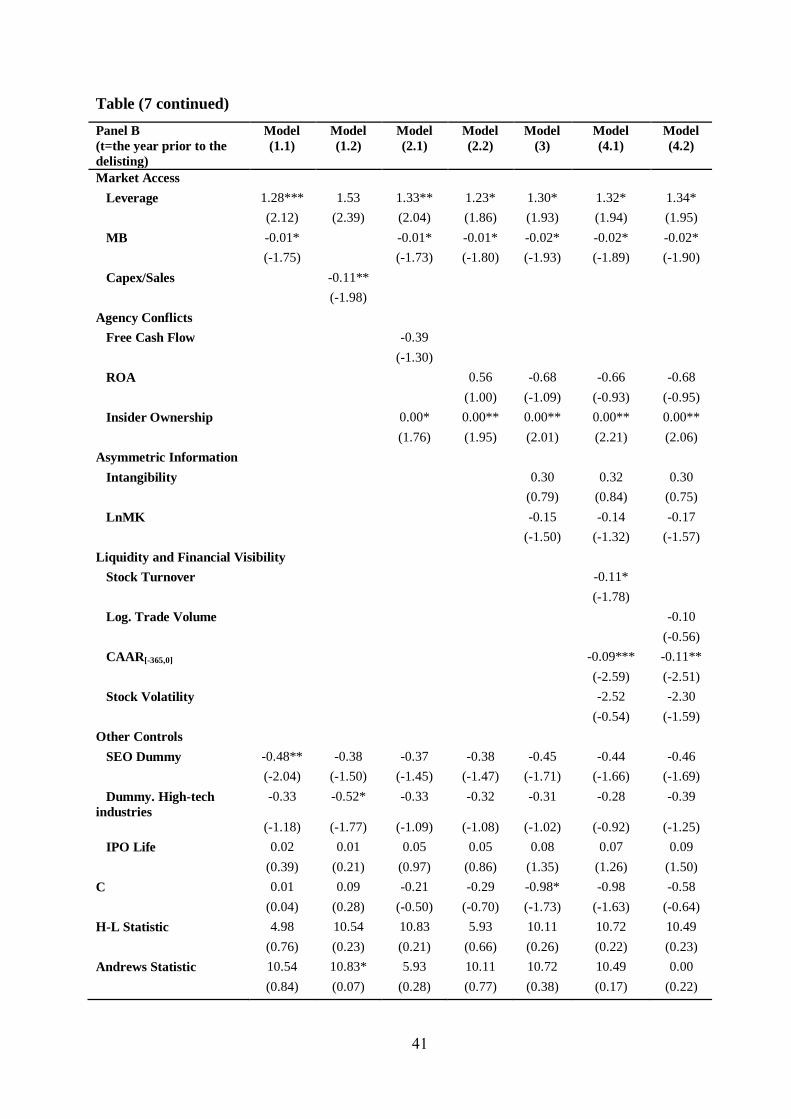
41
Table (7 continued)
Panel B
(t=the year prior to the
delisting)
Model
(1.1)
Model
(1.2)
Model
(2.1)
Model
(2.2)
Model
(3)
Model
(4.1)
Model
(4.2)
Market Access
Leverage 1.28*** 1.53 1.33** 1.23* 1.30* 1.32* 1.34*
(2.12) (2.39) (2.04) (1.86) (1.93) (1.94) (1.95)
MB -0.01* -0.01* -0.01* -0.02* -0.02* -0.02*
(-1.75) (-1.73) (-1.80) (-1.93) (-1.89) (-1.90)
Capex/Sales -0.11**
(-1.98)
Agency Conflicts
Free Cash Flow -0.39
(-1.30)
ROA 0.56 -0.68 -0.66 -0.68
(1.00) (-1.09) (-0.93) (-0.95)
Insider Ownership 0.00* 0.00** 0.00** 0.00** 0.00**
(1.76) (1.95) (2.01) (2.21) (2.06)
Asymmetric Information
Intangibility 0.30 0.32 0.30
(0.79) (0.84) (0.75)
LnMK -0.15 -0.14 -0.17
(-1.50) (-1.32) (-1.57)
Liquidity and Financial Visibility
Stock Turnover -0.11*
(-1.78)
Log. Trade Volume -0.10
(-0.56)
CAAR[-365,0] -0.09*** -0.11**
(-2.59) (-2.51)
Stock Volatility -2.52 -2.30
(-0.54) (-1.59)
Other Controls
SEO Dummy -0.48** -0.38 -0.37 -0.38 -0.45 -0.44 -0.46
(-2.04) (-1.50) (-1.45) (-1.47) (-1.71) (-1.66) (-1.69)
Dummy. High-tech
industries
-0.33 -0.52* -0.33 -0.32 -0.31 -0.28 -0.39
(-1.18) (-1.77) (-1.09) (-1.08) (-1.02) (-0.92) (-1.25)
IPO Life 0.02 0.01 0.05 0.05 0.08 0.07 0.09
(0.39) (0.21) (0.97) (0.86) (1.35) (1.26) (1.50)
C 0.01 0.09 -0.21 -0.29 -0.98* -0.98 -0.58
(0.04) (0.28) (-0.50) (-0.70) (-1.73) (-1.63) (-0.64)
H-L Statistic 4.98 10.54 10.83 5.93 10.11 10.72 10.49
(0.76) (0.23) (0.21) (0.66) (0.26) (0.22) (0.23)
Andrews Statistic 10.54 10.83* 5.93 10.11 10.72 10.49 0.00
(0.84) (0.07) (0.28) (0.77) (0.38) (0.17) (0.22)
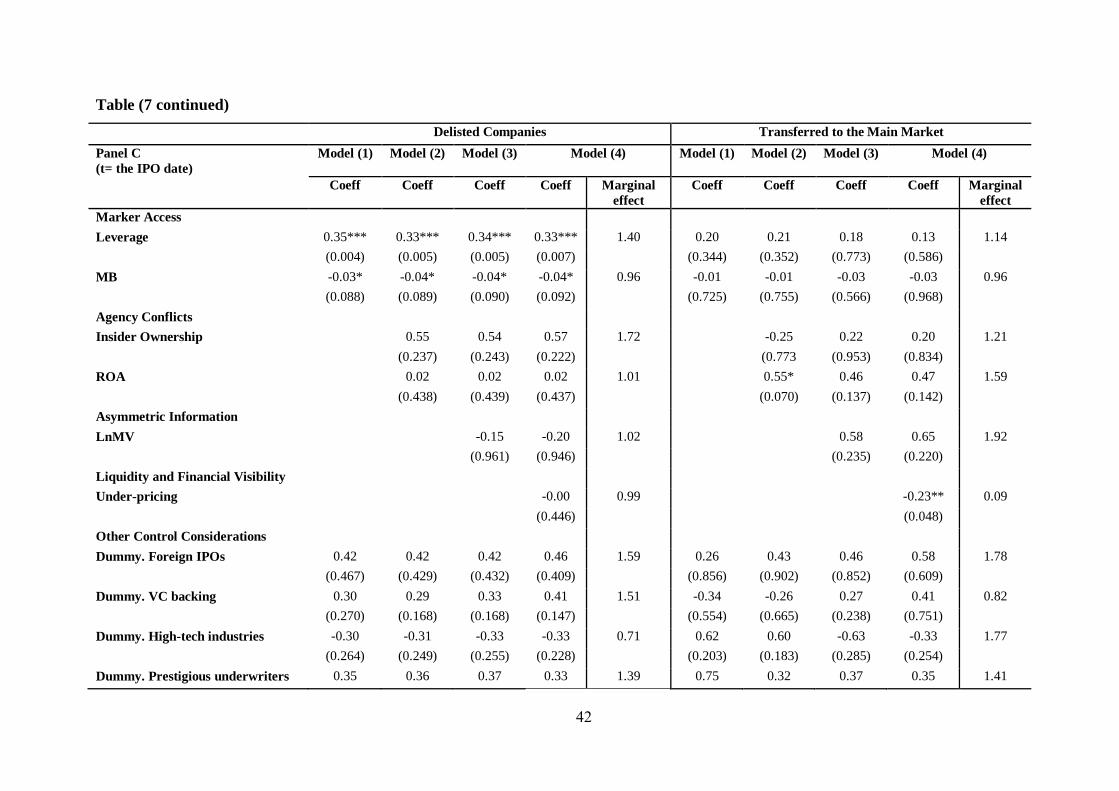
42
Table (7 continued)
Delisted Companies Transferred to the Main Market
Panel C
(t= the IPO date)
Model (1)
Model (2)
Model (3)
Model (4) Model (1) Model (2) Model (3) Model (4)
Coeff Coeff Coeff Coeff Marginal
effect
Coeff Coeff Coeff Coeff Marginal
effect
Marker Access
Leverage 0.35*** 0.33*** 0.34*** 0.33*** 1.40 0.20 0.21 0.18 0.13 1.14
(0.004) (0.005) (0.005) (0.007) (0.344) (0.352) (0.773) (0.586)
MB -0.03* -0.04* -0.04* -0.04* 0.96 -0.01 -0.01 -0.03 -0.03 0.96
(0.088) (0.089) (0.090) (0.092) (0.725) (0.755) (0.566) (0.968)
Agency Conflicts
Insider Ownership 0.55 0.54 0.57 1.72 -0.25 0.22 0.20 1.21
(0.237) (0.243) (0.222) (0.773 (0.953) (0.834)
ROA 0.02 0.02 0.02 1.01 0.55* 0.46 0.47 1.59
(0.438) (0.439) (0.437) (0.070) (0.137) (0.142)
Asymmetric Information
LnMV -0.15 -0.20 1.02 0.58 0.65 1.92
(0.961) (0.946) (0.235) (0.220)
Liquidity and Financial Visibility
Under-pricing -0.00 0.99 -0.23** 0.09
(0.446) (0.048)
Other Control Considerations
Dummy. Foreign IPOs 0.42 0.42 0.42 0.46 1.59 0.26 0.43 0.46 0.58 1.78
(0.467) (0.429) (0.432) (0.409) (0.856) (0.902) (0.852) (0.609)
Dummy. VC backing 0.30 0.29 0.33 0.41 1.51 -0.34 -0.26 0.27 0.41 0.82
(0.270) (0.168) (0.168) (0.147) (0.554) (0.665) (0.238) (0.751)
Dummy. High-tech industries -0.30 -0.31 -0.33 -0.33 0.71 0.62 0.60 -0.63 -0.33 1.77
(0.264) (0.249) (0.255) (0.228) (0.203) (0.183) (0.285) (0.254)
Dummy. Prestigious underwriters 0.35 0.36 0.37 0.33 1.39 0.75 0.32 0.37 0.35 1.41
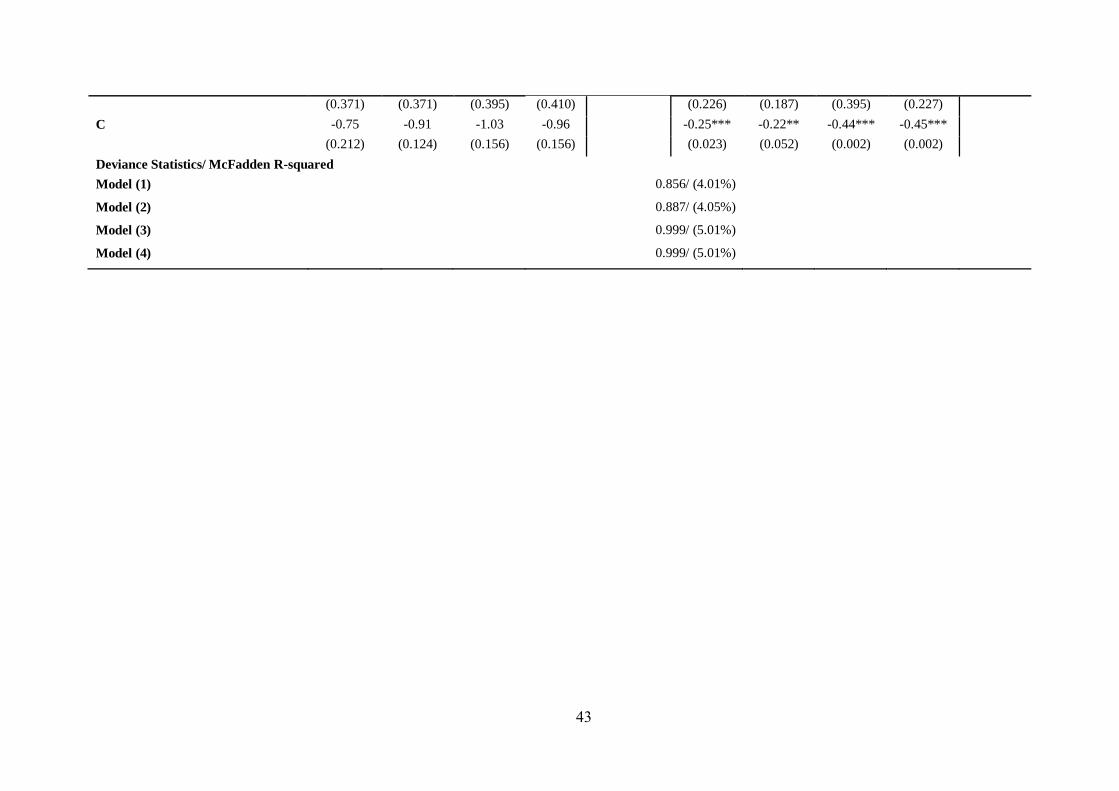
43
(0.371) (0.371) (0.395) (0.410) (0.226) (0.187) (0.395) (0.227)
C -0.75 -0.91 -1.03 -0.96 -0.25*** -0.22** -0.44*** -0.45***
(0.212) (0.124) (0.156) (0.156) (0.023) (0.052) (0.002) (0.002)
Deviance Statistics/ McFadden R-squared
Model (1) 0.856/ (4.01%)
Model (2) 0.887/ (4.05%)
Model (3) 0.999/ (5.01%)
Model (4) 0.999/ (5.01%)
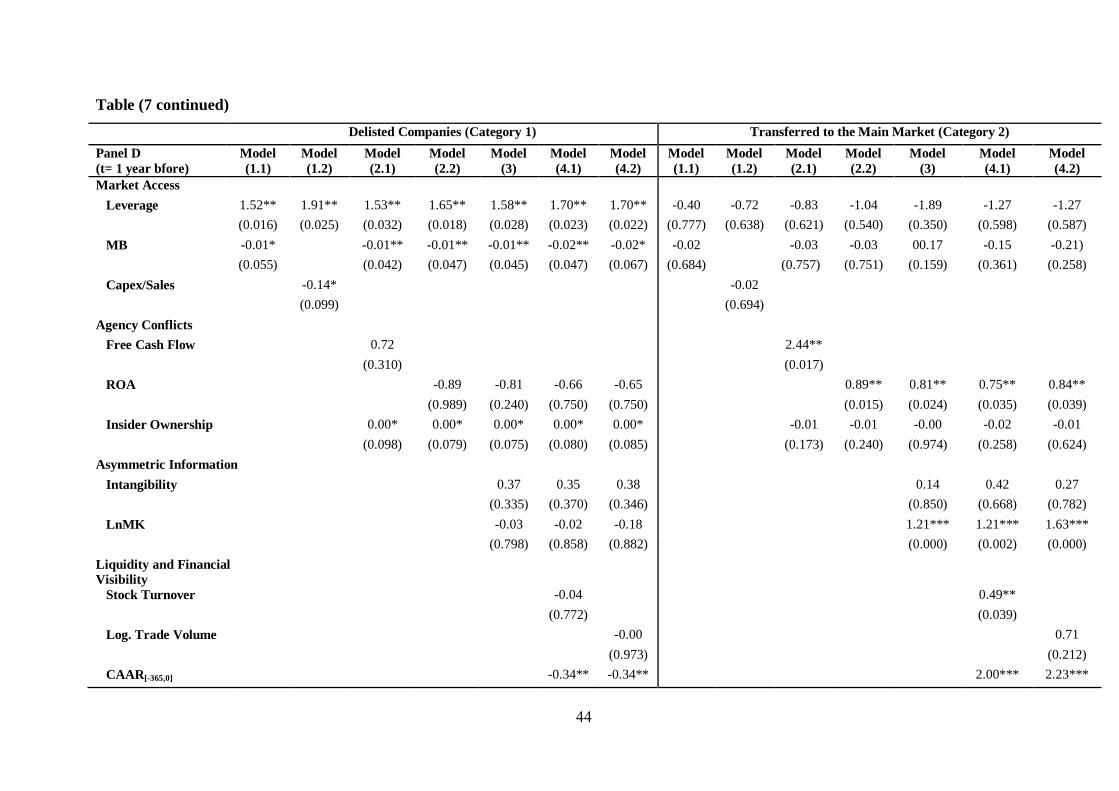
44
Table (7 continued)
Delisted Companies (Category 1) Transferred to the Main Market (Category 2)
Panel D
(t= 1 year bfore)
Model
(1.1)
Model
(1.2)
Model
(2.1)
Model
(2.2)
Model
(3)
Model
(4.1)
Model
(4.2)
Model
(1.1)
Model
(1.2)
Model
(2.1)
Model
(2.2)
Model
(3)
Model
(4.1)
Model
(4.2)
Market Access
Leverage 1.52** 1.91** 1.53** 1.65** 1.58** 1.70** 1.70** -0.40 -0.72 -0.83 -1.04 -1.89 -1.27 -1.27
(0.016) (0.025) (0.032) (0.018) (0.028) (0.023) (0.022) (0.777) (0.638) (0.621) (0.540) (0.350) (0.598) (0.587)
MB -0.01* -0.01** -0.01** -0.01** -0.02** -0.02* -0.02 -0.03 -0.03 00.17 -0.15 -0.21)
(0.055) (0.042) (0.047) (0.045) (0.047) (0.067) (0.684) (0.757) (0.751) (0.159) (0.361) (0.258)
Capex/Sales -0.14* -0.02
(0.099) (0.694)
Agency Conflicts
Free Cash Flow 0.72 2.44**
(0.310) (0.017)
ROA -0.89 -0.81 -0.66 -0.65 0.89** 0.81** 0.75** 0.84**
(0.989) (0.240) (0.750) (0.750) (0.015) (0.024) (0.035) (0.039)
Insider Ownership 0.00* 0.00* 0.00* 0.00* 0.00* -0.01 -0.01 -0.00 -0.02 -0.01
(0.098) (0.079) (0.075) (0.080) (0.085) (0.173) (0.240) (0.974) (0.258) (0.624)
Asymmetric Information
Intangibility 0.37 0.35 0.38 0.14 0.42 0.27
(0.335) (0.370) (0.346) (0.850) (0.668) (0.782)
LnMK -0.03 -0.02 -0.18 1.21*** 1.21*** 1.63***
(0.798) (0.858) (0.882) (0.000) (0.002) (0.000)
Liquidity and Financial
Visibility
Stock Turnover -0.04 0.49**
(0.772) (0.039)
Log. Trade Volume -0.00 0.71
(0.973) (0.212)
CAAR[-365,0] -0.34** -0.34** 2.00*** 2.23***
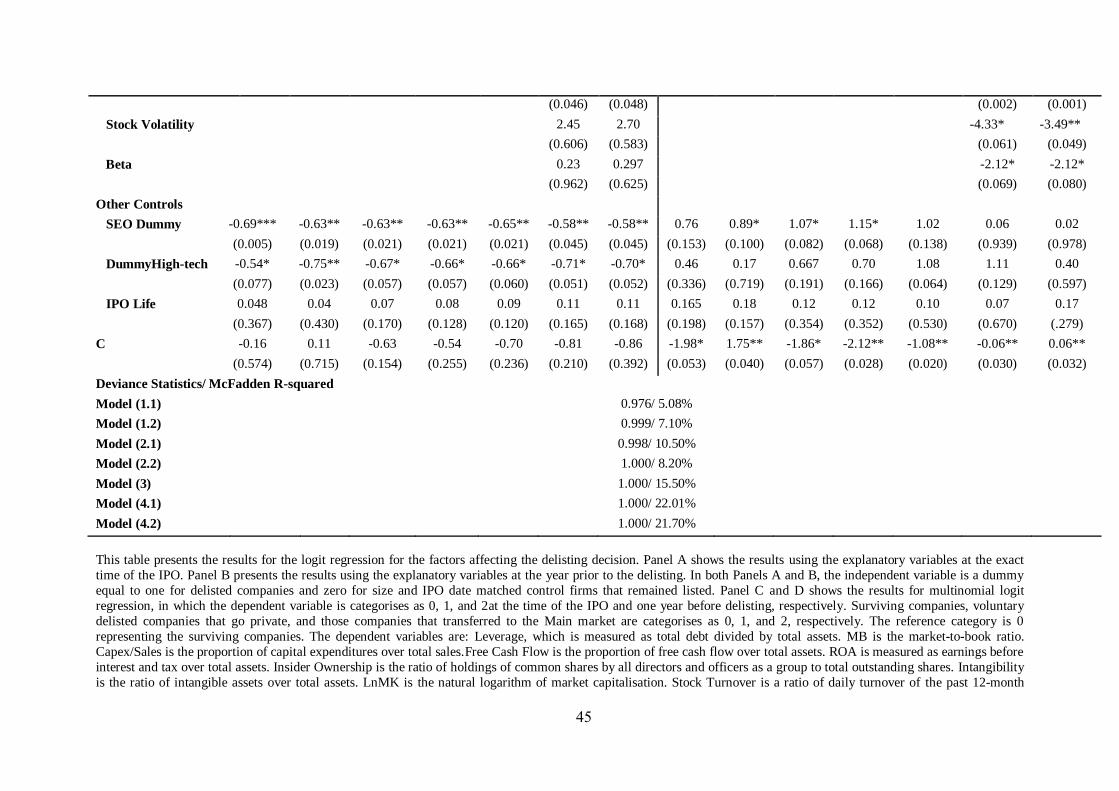
45
(0.046) (0.048) (0.002) (0.001)
Stock Volatility 2.45 2.70 -4.33* -3.49**
(0.606) (0.583) (0.061) (0.049)
Beta 0.23 0.297 -2.12* -2.12*
(0.962) (0.625) (0.069) (0.080)
Other Controls
SEO Dummy -0.69*** -0.63** -0.63** -0.63** -0.65** -0.58** -0.58** 0.76 0.89* 1.07* 1.15* 1.02 0.06 0.02
(0.005) (0.019) (0.021) (0.021) (0.021) (0.045) (0.045) (0.153) (0.100) (0.082) (0.068) (0.138) (0.939) (0.978)
DummyHigh-tech -0.54* -0.75** -0.67* -0.66* -0.66* -0.71* -0.70* 0.46 0.17 0.667 0.70 1.08 1.11 0.40
(0.077) (0.023) (0.057) (0.057) (0.060) (0.051) (0.052) (0.336) (0.719) (0.191) (0.166) (0.064) (0.129) (0.597)
IPO Life 0.048 0.04 0.07 0.08 0.09 0.11 0.11 0.165 0.18 0.12 0.12 0.10 0.07 0.17
(0.367) (0.430) (0.170) (0.128) (0.120) (0.165) (0.168) (0.198) (0.157) (0.354) (0.352) (0.530) (0.670) (.279)
C -0.16 0.11 -0.63 -0.54 -0.70 -0.81 -0.86 -1.98* 1.75** -1.86* -2.12** -1.08** -0.06** 0.06**
(0.574) (0.715) (0.154) (0.255) (0.236) (0.210) (0.392) (0.053) (0.040) (0.057) (0.028) (0.020) (0.030) (0.032)
Deviance Statistics/ McFadden R-squared
Model (1.1) 0.976/ 5.08%
Model (1.2) 0.999/ 7.10%
Model (2.1) 0.998/ 10.50%
Model (2.2) 1.000/ 8.20%
Model (3) 1.000/ 15.50%
Model (4.1) 1.000/ 22.01%
Model (4.2) 1.000/ 21.70%
This table presents the results for the logit regression for the factors affecting the delisting decision. Panel A shows the results using the explanatory variables at the exact
time of the IPO. Panel B presents the results using the explanatory variables at the year prior to the delisting. In both Panels A and B, the independent variable is a dummy
equal to one for delisted companies and zero for size and IPO date matched control firms that remained listed. Panel C and D shows the results for multinomial logit
regression, in which the dependent variable is categorises as 0, 1, and 2at the time of the IPO and one year before delisting, respectively. Surviving companies, voluntary
delisted companies that go private, and those companies that transferred to the Main market are categorises as 0, 1, and 2, respectively. The reference category is 0
representing the surviving companies. The dependent variables are: Leverage, which is measured as total debt divided by total assets. MB is the market-to-book ratio.
Capex/Sales is the proportion of capital expenditures over total sales.Free Cash Flow is the proportion of free cash flow over total assets. ROA is measured as earnings before
interest and tax over total assets. Insider Ownership is the ratio of holdings of common shares by all directors and officers as a group to total outstanding shares. Intangibility
is the ratio of intangible assets over total assets. LnMK is the natural logarithm of market capitalisation. Stock Turnover is a ratio of daily turnover of the past 12-month
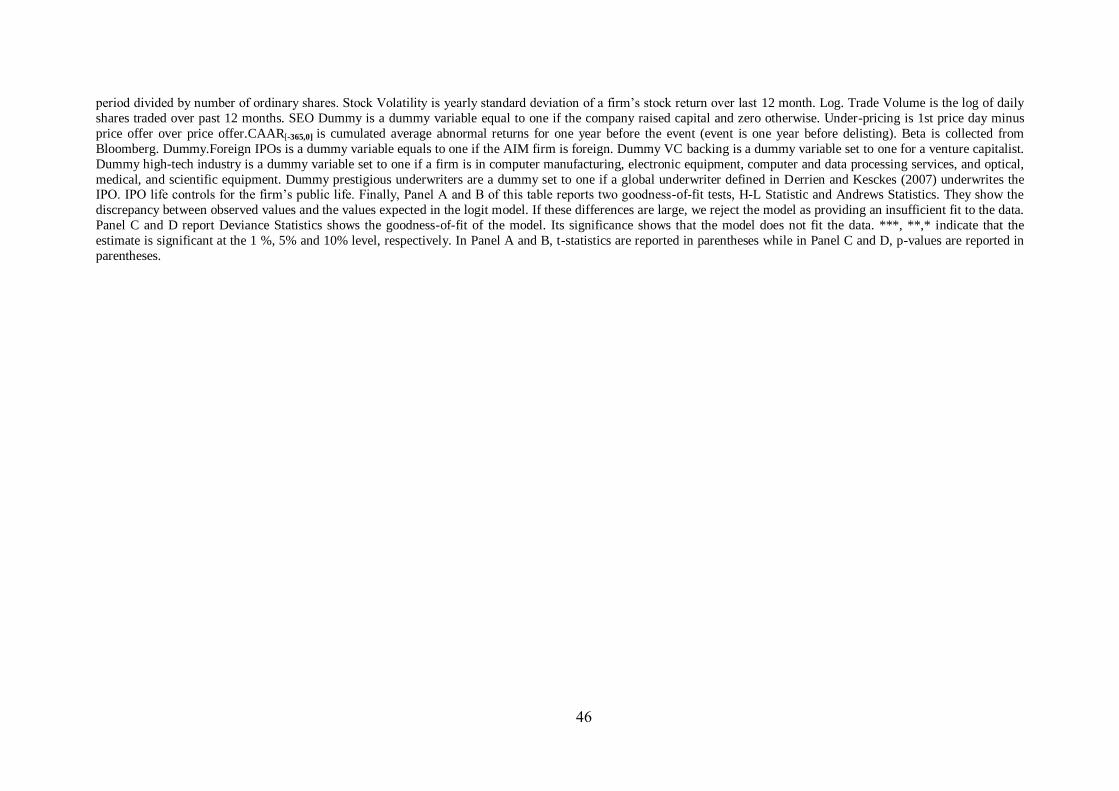
46
period divided by number of ordinary shares. Stock Volatility is yearly standard deviation of a firm’s stock return over last 12 month. Log. Trade Volume is the log of daily
shares traded over past 12 months. SEO Dummy is a dummy variable equal to one if the company raised capital and zero otherwise. Under-pricing is 1st price day minus
price offer over price offer.CAAR[-365,0] is cumulated average abnormal returns for one year before the event (event is one year before delisting). Beta is collected from
Bloomberg. Dummy.Foreign IPOs is a dummy variable equals to one if the AIM firm is foreign. Dummy VC backing is a dummy variable set to one for a venture capitalist.
Dummy high-tech industry is a dummy variable set to one if a firm is in computer manufacturing, electronic equipment, computer and data processing services, and optical,
medical, and scientific equipment. Dummy prestigious underwriters are a dummy set to one if a global underwriter defined in Derrien and Kesckes (2007) underwrites the IPO. IPO life controls for the firm’s public life. Finally, Panel A and B of this table reports two goodness-of-fit tests, H-L Statistic and Andrews Statistics. They show the
discrepancy between observed values and the values expected in the logit model. If these differences are large, we reject the model as providing an insufficient fit to the data.
Panel C and D report Deviance Statistics shows the goodness-of-fit of the model. Its significance shows that the model does not fit the data. ***, **,* indicate that the
estimate is significant at the 1 %, 5% and 10% level, respectively. In Panel A and B, t-statistics are reported in parentheses while in Panel C and D, p-values are reported in
parentheses.
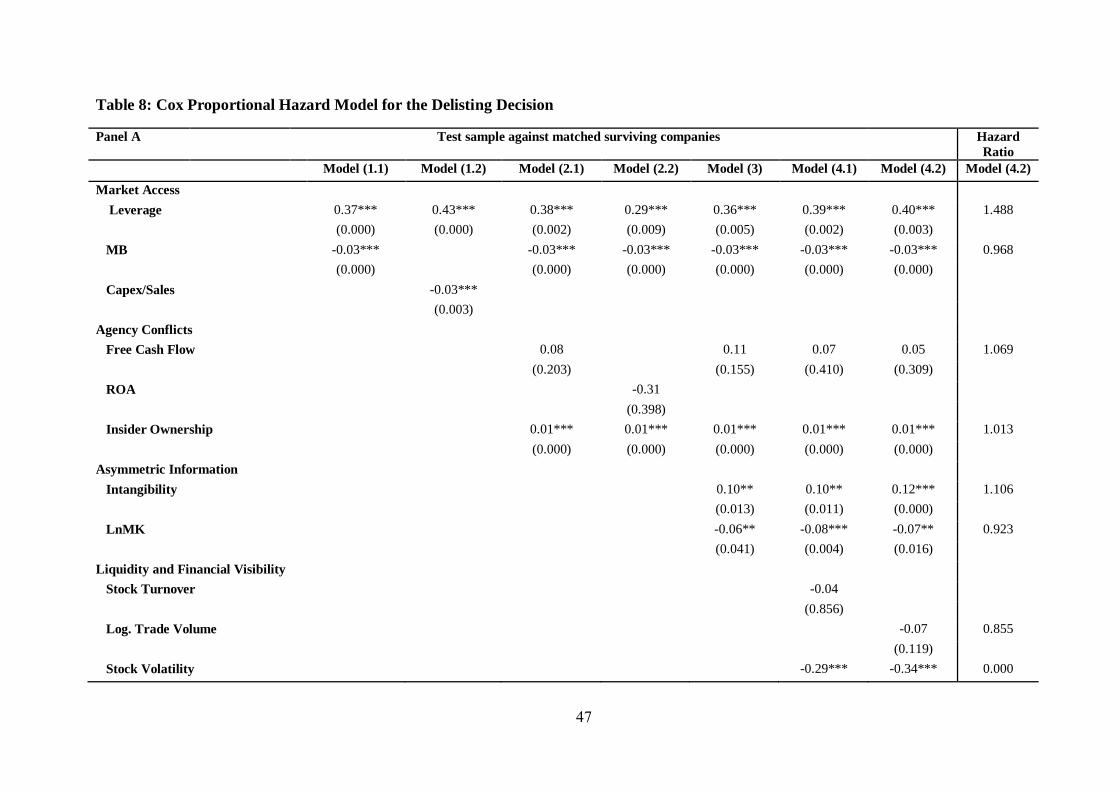
47
Table 8: Cox Proportional Hazard Model for the Delisting Decision
Panel A Test sample against matched surviving companies Hazard
Ratio
Model (1.1) Model (1.2) Model (2.1) Model (2.2) Model (3) Model (4.1) Model (4.2) Model (4.2)
Market Access
Leverage 0.37*** 0.43*** 0.38*** 0.29*** 0.36*** 0.39*** 0.40*** 1.488
(0.000) (0.000) (0.002) (0.009) (0.005) (0.002) (0.003)
MB -0.03*** -0.03*** -0.03*** -0.03*** -0.03*** -0.03*** 0.968
(0.000) (0.000) (0.000) (0.000) (0.000) (0.000)
Capex/Sales -0.03***
(0.003)
Agency Conflicts
Free Cash Flow 0.08 0.11 0.07 0.05 1.069
(0.203) (0.155) (0.410) (0.309)
ROA -0.31
(0.398)
Insider Ownership 0.01*** 0.01*** 0.01*** 0.01*** 0.01*** 1.013
(0.000) (0.000) (0.000) (0.000) (0.000)
Asymmetric Information
Intangibility 0.10** 0.10** 0.12*** 1.106
(0.013) (0.011) (0.000)
LnMK -0.06** -0.08*** -0.07** 0.923
(0.041) (0.004) (0.016)
Liquidity and Financial Visibility
Stock Turnover -0.04
(0.856)
Log. Trade Volume -0.07 0.855
(0.119)
Stock Volatility -0.29*** -0.34*** 0.000

48
(0.000) (0.000)
Beta -0.40 -0.38 1.053
(0.102) (1.110)
Other Control Considerations
SEO Dummy -0.64*** -0.66*** -0.60*** -0.65*** -0.60*** -0.61*** -0.62*** 0.545
(0.000) (0.000) (0.000) (0.000) (0.000) (0.000) (0.000)
Dummy. High-tech industries -0.21*** -0.40*** -0.22*** -0.24*** -0.20** -0.19** -0.20** 0.830
(0.005) (0.000) (0.008) (0.004) (0.020) (0.028) (0.023)
Delisted Firms 184 184 184 184 184 184 184
Control Firms 184 184 184 184 184 184 184
N.Obs 1895 1899 2116 2094 2073 2059 1996
Likelihood Ratio Test 1169.228*** 10477.158*** 1162.228*** 1159.803*** 1079.240*** 1072.190*** 9994.204***
(0.000) (0.000) (0.000) (0.000) (0.000) (0.000) (0.000)
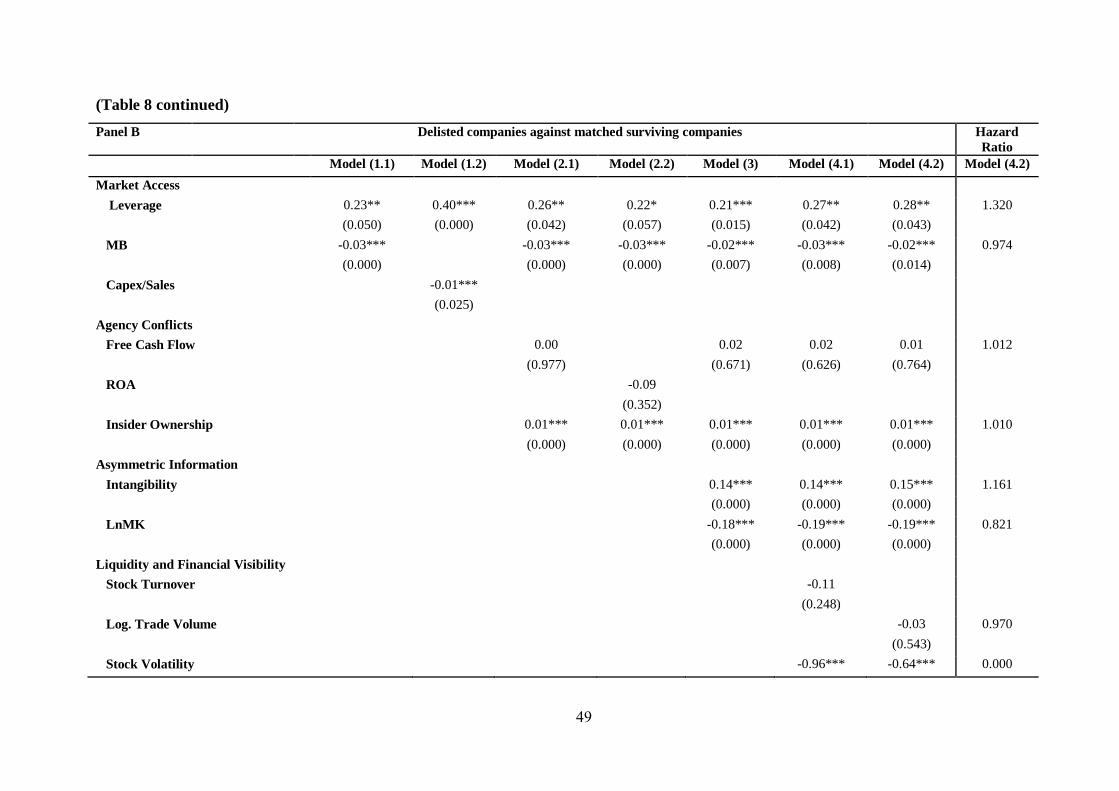
49
(Table 8 continued)
Panel B Delisted companies against matched surviving companies Hazard
Ratio
Model (1.1) Model (1.2) Model (2.1) Model (2.2) Model (3) Model (4.1) Model (4.2) Model (4.2)
Market Access
Leverage 0.23** 0.40*** 0.26** 0.22* 0.21*** 0.27** 0.28** 1.320
(0.050) (0.000) (0.042) (0.057) (0.015) (0.042) (0.043)
MB -0.03*** -0.03*** -0.03*** -0.02*** -0.03*** -0.02*** 0.974
(0.000) (0.000) (0.000) (0.007) (0.008) (0.014)
Capex/Sales -0.01***
(0.025)
Agency Conflicts
Free Cash Flow 0.00 0.02 0.02 0.01 1.012
(0.977) (0.671) (0.626) (0.764)
ROA -0.09
(0.352)
Insider Ownership 0.01*** 0.01*** 0.01*** 0.01*** 0.01*** 1.010
(0.000) (0.000) (0.000) (0.000) (0.000)
Asymmetric Information
Intangibility 0.14*** 0.14*** 0.15*** 1.161
(0.000) (0.000) (0.000)
LnMK -0.18*** -0.19*** -0.19*** 0.821
(0.000) (0.000) (0.000)
Liquidity and Financial Visibility
Stock Turnover -0.11
(0.248)
Log. Trade Volume -0.03 0.970
(0.543)
Stock Volatility -0.96*** -0.64*** 0.000
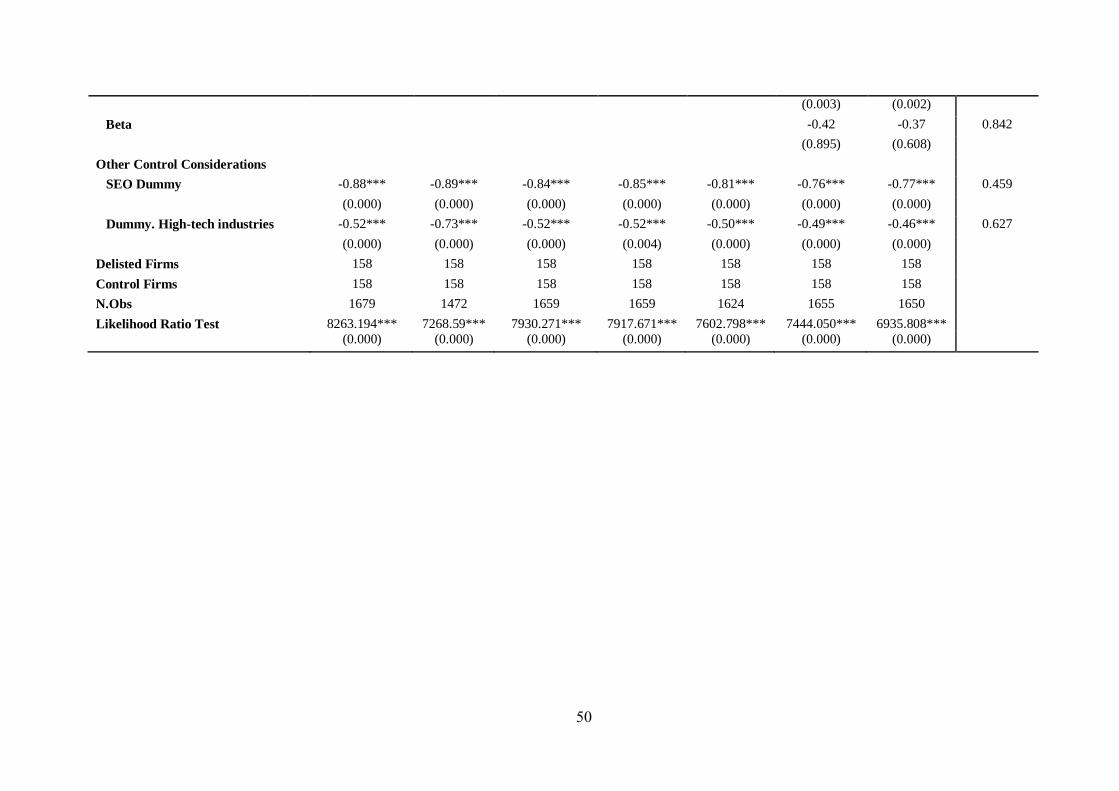
50
(0.003) (0.002)
Beta -0.42 -0.37 0.842
(0.895) (0.608)
Other Control Considerations
SEO Dummy -0.88*** -0.89*** -0.84*** -0.85*** -0.81*** -0.76*** -0.77*** 0.459
(0.000) (0.000) (0.000) (0.000) (0.000) (0.000) (0.000)
Dummy. High-tech industries -0.52*** -0.73*** -0.52*** -0.52*** -0.50*** -0.49*** -0.46*** 0.627
(0.000) (0.000) (0.000) (0.004) (0.000) (0.000) (0.000)
Delisted Firms 158 158 158 158 158 158 158
Control Firms 158 158 158 158 158 158 158
N.Obs 1679 1472 1659 1659 1624 1655 1650
Likelihood Ratio Test 8263.194*** 7268.59*** 7930.271*** 7917.671*** 7602.798*** 7444.050*** 6935.808***
(0.000) (0.000) (0.000) (0.000) (0.000) (0.000) (0.000)
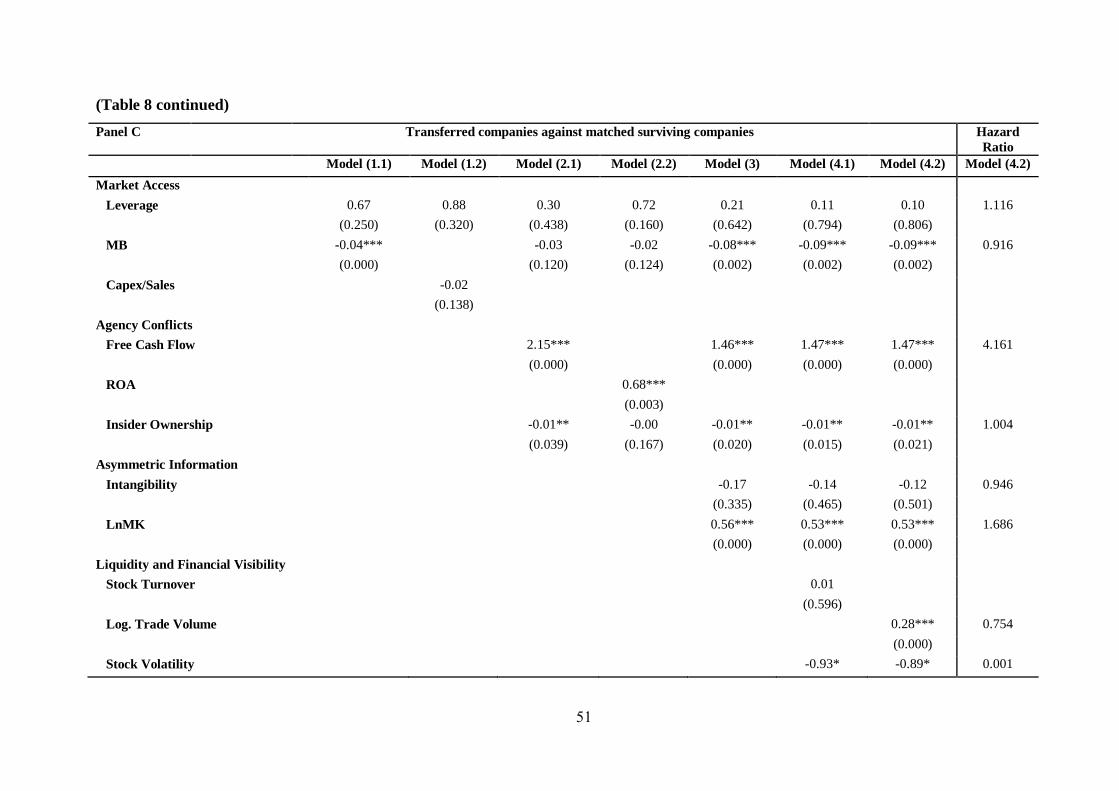
51
(Table 8 continued)
Panel C Transferred companies against matched surviving companies Hazard
Ratio
Model (1.1) Model (1.2) Model (2.1) Model (2.2) Model (3) Model (4.1) Model (4.2) Model (4.2)
Market Access
Leverage 0.67 0.88 0.30 0.72 0.21 0.11 0.10 1.116
(0.250) (0.320) (0.438) (0.160) (0.642) (0.794) (0.806)
MB -0.04*** -0.03 -0.02 -0.08*** -0.09*** -0.09*** 0.916
(0.000) (0.120) (0.124) (0.002) (0.002) (0.002)
Capex/Sales -0.02
(0.138)
Agency Conflicts
Free Cash Flow 2.15*** 1.46*** 1.47*** 1.47*** 4.161
(0.000) (0.000) (0.000) (0.000)
ROA 0.68***
(0.003)
Insider Ownership -0.01** -0.00 -0.01** -0.01** -0.01** 1.004
(0.039) (0.167) (0.020) (0.015) (0.021)
Asymmetric Information
Intangibility -0.17 -0.14 -0.12 0.946
(0.335) (0.465) (0.501)
LnMK 0.56*** 0.53*** 0.53*** 1.686
(0.000) (0.000) (0.000)
Liquidity and Financial Visibility
Stock Turnover 0.01
(0.596)
Log. Trade Volume 0.28*** 0.754
(0.000)
Stock Volatility -0.93* -0.89* 0.001
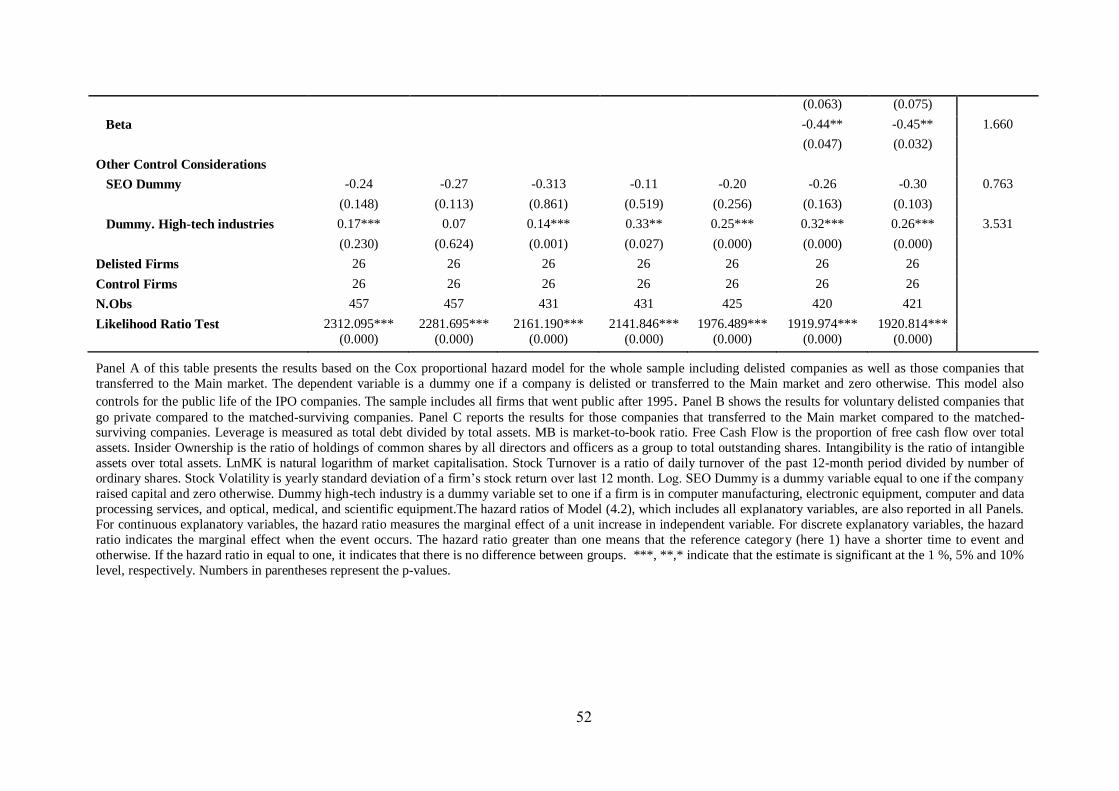
52
(0.063) (0.075)
Beta -0.44** -0.45** 1.660
(0.047) (0.032)
Other Control Considerations
SEO Dummy -0.24 -0.27 -0.313 -0.11 -0.20 -0.26 -0.30 0.763
(0.148) (0.113) (0.861) (0.519) (0.256) (0.163) (0.103)
Dummy. High-tech industries 0.17*** 0.07 0.14*** 0.33** 0.25*** 0.32*** 0.26*** 3.531
(0.230) (0.624) (0.001) (0.027) (0.000) (0.000) (0.000)
Delisted Firms 26 26 26 26 26 26 26
Control Firms 26 26 26 26 26 26 26
N.Obs 457 457 431 431 425 420 421
Likelihood Ratio Test 2312.095*** 2281.695*** 2161.190*** 2141.846*** 1976.489*** 1919.974*** 1920.814***
(0.000) (0.000) (0.000) (0.000) (0.000) (0.000) (0.000)
Panel A of this table presents the results based on the Cox proportional hazard model for the whole sample including delisted companies as well as those companies that
transferred to the Main market. The dependent variable is a dummy one if a company is delisted or transferred to the Main market and zero otherwise. This model also
controls for the public life of the IPO companies. The sample includes all firms that went public after 1995. Panel B shows the results for voluntary delisted companies that
go private compared to the matched-surviving companies. Panel C reports the results for those companies that transferred to the Main market compared to the matched-surviving companies. Leverage is measured as total debt divided by total assets. MB is market-to-book ratio. Free Cash Flow is the proportion of free cash flow over total
assets. Insider Ownership is the ratio of holdings of common shares by all directors and officers as a group to total outstanding shares. Intangibility is the ratio of intangible
assets over total assets. LnMK is natural logarithm of market capitalisation. Stock Turnover is a ratio of daily turnover of the past 12-month period divided by number of
ordinary shares. Stock Volatility is yearly standard deviation of a firm’s stock return over last 12 month. Log. SEO Dummy is a dummy variable equal to one if the company
raised capital and zero otherwise. Dummy high-tech industry is a dummy variable set to one if a firm is in computer manufacturing, electronic equipment, computer and data
processing services, and optical, medical, and scientific equipment.The hazard ratios of Model (4.2), which includes all explanatory variables, are also reported in all Panels.
For continuous explanatory variables, the hazard ratio measures the marginal effect of a unit increase in independent variable. For discrete explanatory variables, the hazard
ratio indicates the marginal effect when the event occurs. The hazard ratio greater than one means that the reference category (here 1) have a shorter time to event and
otherwise. If the hazard ratio in equal to one, it indicates that there is no difference between groups. ***, **,* indicate that the estimate is significant at the 1 %, 5% and 10%
level, respectively. Numbers in parentheses represent the p-values.
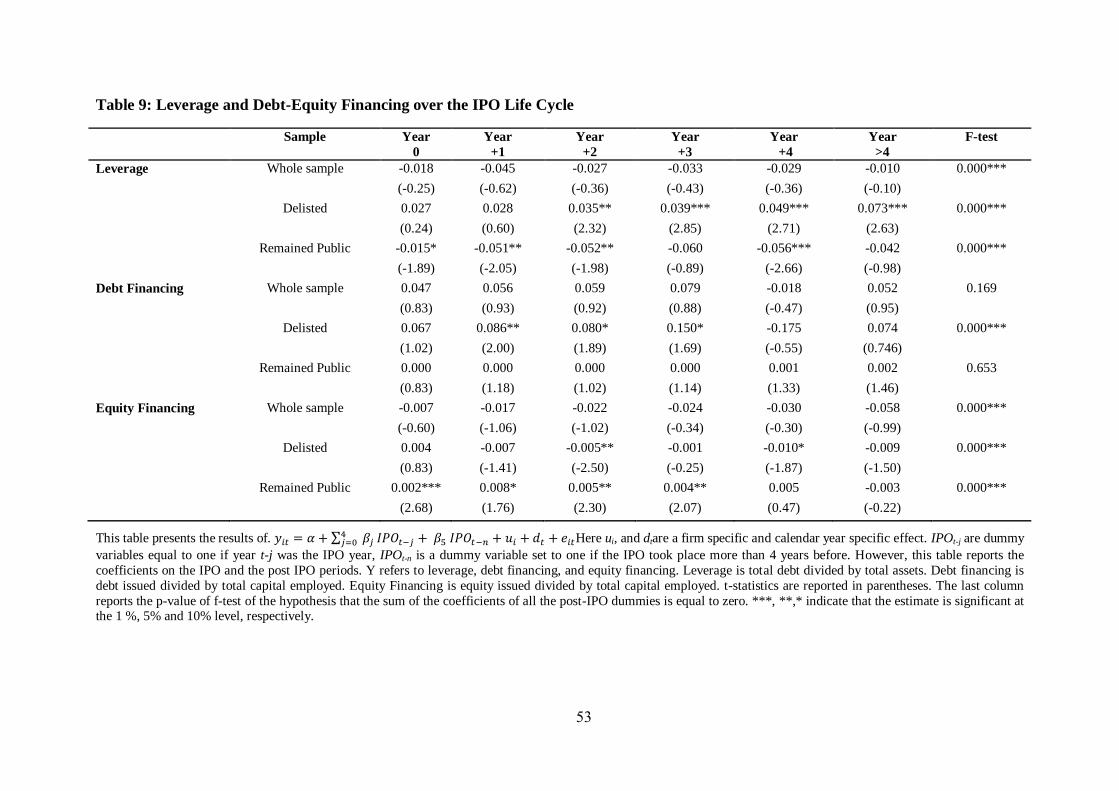
53
Table 9: Leverage and Debt-Equity Financing over the IPO Life Cycle
Sample Year
0
Year
+1
Year
+2
Year
+3
Year
+4
Year
>4
F-test
Leverage Whole sample -0.018 -0.045 -0.027 -0.033 -0.029 -0.010 0.000***
(-0.25) (-0.62) (-0.36) (-0.43) (-0.36) (-0.10)
Delisted 0.027 0.028 0.035** 0.039*** 0.049*** 0.073*** 0.000***
(0.24) (0.60) (2.32) (2.85) (2.71) (2.63)
Remained Public -0.015* -0.051** -0.052** -0.060 -0.056*** -0.042 0.000***
(-1.89) (-2.05) (-1.98) (-0.89) (-2.66) (-0.98)
Debt Financing Whole sample 0.047 0.056 0.059 0.079 -0.018 0.052 0.169
(0.83) (0.93) (0.92) (0.88) (-0.47) (0.95)
Delisted 0.067 0.086** 0.080* 0.150* -0.175 0.074 0.000***
(1.02) (2.00) (1.89) (1.69) (-0.55) (0.746)
Remained Public 0.000 0.000 0.000 0.000 0.001 0.002 0.653
(0.83) (1.18) (1.02) (1.14) (1.33) (1.46)
Equity Financing Whole sample -0.007 -0.017 -0.022 -0.024 -0.030 -0.058 0.000***
(-0.60) (-1.06) (-1.02) (-0.34) (-0.30) (-0.99)
Delisted 0.004 -0.007 -0.005** -0.001 -0.010* -0.009 0.000***
(0.83) (-1.41) (-2.50) (-0.25) (-1.87) (-1.50)
Remained Public 0.002*** 0.008* 0.005** 0.004** 0.005 -0.003 0.000***
(2.68) (1.76) (2.30) (2.07) (0.47) (-0.22)
This table presents the results of. Here ui, and dtare a firm specific and calendar year specific effect. IPOt-j are dummy
variables equal to one if year t-j was the IPO year, IPOt-n is a dummy variable set to one if the IPO took place more than 4 years before. However, this table reports the
coefficients on the IPO and the post IPO periods. Y refers to leverage, debt financing, and equity financing. Leverage is total debt divided by total assets. Debt financing is
debt issued divided by total capital employed. Equity Financing is equity issued divided by total capital employed. t-statistics are reported in parentheses. The last column
reports the p-value of f-test of the hypothesis that the sum of the coefficients of all the post-IPO dummies is equal to zero. ***, **,* indicate that the estimate is significant at the 1 %, 5% and 10% level, respectively.
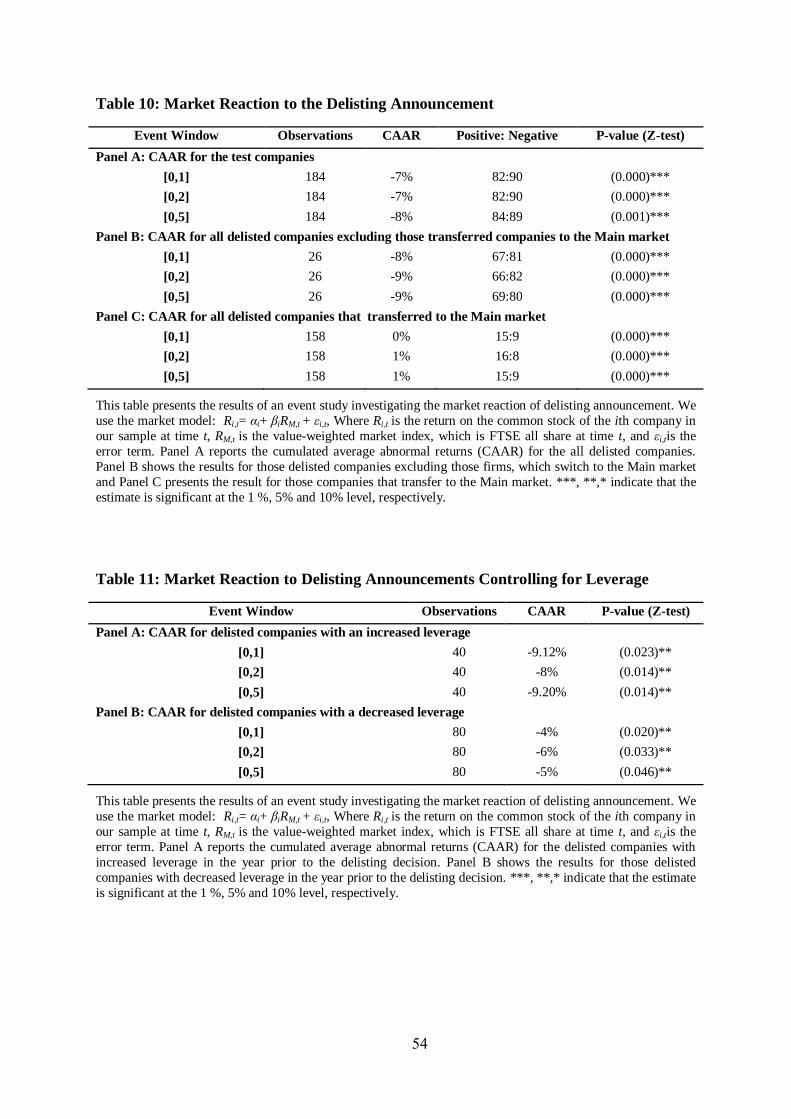
54
Table 10: Market Reaction to the Delisting Announcement
Event Window Observations CAAR Positive: Negative P-value (Z-test)
Panel A: CAAR for the test companies
[0,1] 184 -7% 82:90 (0.000)***
[0,2] 184 -7% 82:90 (0.000)***
[0,5] 184 -8% 84:89 (0.001)***
Panel B: CAAR for all delisted companies excluding those transferred companies to the Main market
[0,1] 26 -8% 67:81 (0.000)***
[0,2] 26 -9% 66:82 (0.000)***
[0,5] 26 -9% 69:80 (0.000)***
Panel C: CAAR for all delisted companies that transferred to the Main market
[0,1] 158 0% 15:9 (0.000)***
[0,2] 158 1% 16:8 (0.000)***
[0,5] 158 1% 15:9 (0.000)***
This table presents the results of an event study investigating the market reaction of delisting announcement. We
use the market model: Ri,t= αi+ βiRM,t + εi,t, Where Ri,t is the return on the common stock of the ith company in
our sample at time t, RM,t is the value-weighted market index, which is FTSE all share at time t, and εi,tis the
error term. Panel A reports the cumulated average abnormal returns (CAAR) for the all delisted companies.
Panel B shows the results for those delisted companies excluding those firms, which switch to the Main market
and Panel C presents the result for those companies that transfer to the Main market. ***, **,* indicate that the
estimate is significant at the 1 %, 5% and 10% level, respectively.
Table 11: Market Reaction to Delisting Announcements Controlling for Leverage
Event Window Observations CAAR P-value (Z-test)
Panel A: CAAR for delisted companies with an increased leverage
[0,1] 40 -9.12% (0.023)**
[0,2] 40 -8% (0.014)**
[0,5] 40 -9.20% (0.014)**
Panel B: CAAR for delisted companies with a decreased leverage
[0,1] 80 -4% (0.020)**
[0,2] 80 -6% (0.033)**
[0,5] 80 -5% (0.046)**
This table presents the results of an event study investigating the market reaction of delisting announcement. We
use the market model: Ri,t= αi+ βiRM,t + εi,t, Where Ri,t is the return on the common stock of the ith company in
our sample at time t, RM,t is the value-weighted market index, which is FTSE all share at time t, and εi,tis the
error term. Panel A reports the cumulated average abnormal returns (CAAR) for the delisted companies with
increased leverage in the year prior to the delisting decision. Panel B shows the results for those delisted
companies with decreased leverage in the year prior to the delisting decision. ***, **,* indicate that the estimate
is significant at the 1 %, 5% and 10% level, respectively.
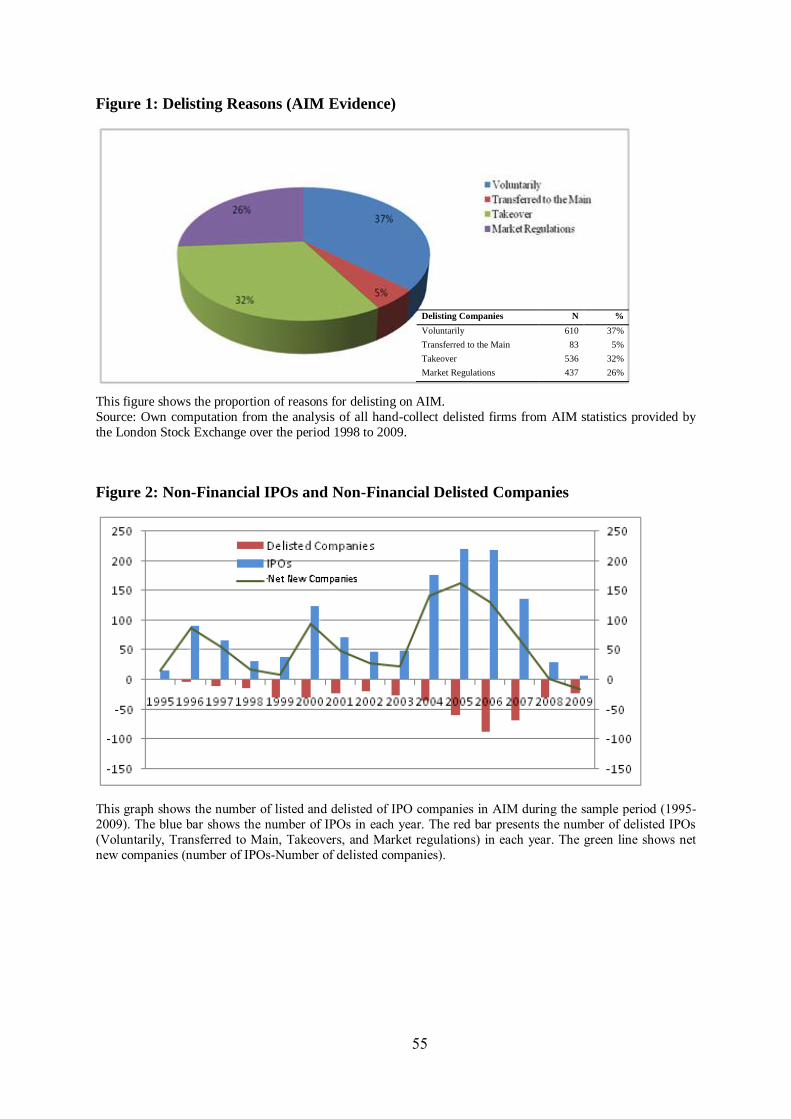
55
Figure 1: Delisting Reasons (AIM Evidence)
This figure shows the proportion of reasons for delisting on AIM.
Source: Own computation from the analysis of all hand-collect delisted firms from AIM statistics provided by
the London Stock Exchange over the period 1998 to 2009.
Figure 2: Non-Financial IPOs and Non-Financial Delisted Companies
This graph shows the number of listed and delisted of IPO companies in AIM during the sample period (1995-
2009). The blue bar shows the number of IPOs in each year. The red bar presents the number of delisted IPOs
(Voluntarily, Transferred to Main, Takeovers, and Market regulations) in each year. The green line shows net
new companies (number of IPOs-Number of delisted companies).
Delisting Companies N %
Voluntarily 610 37%
Transferred to the Main 83 5%
Takeover 536 32%
Market Regulations 437 26%
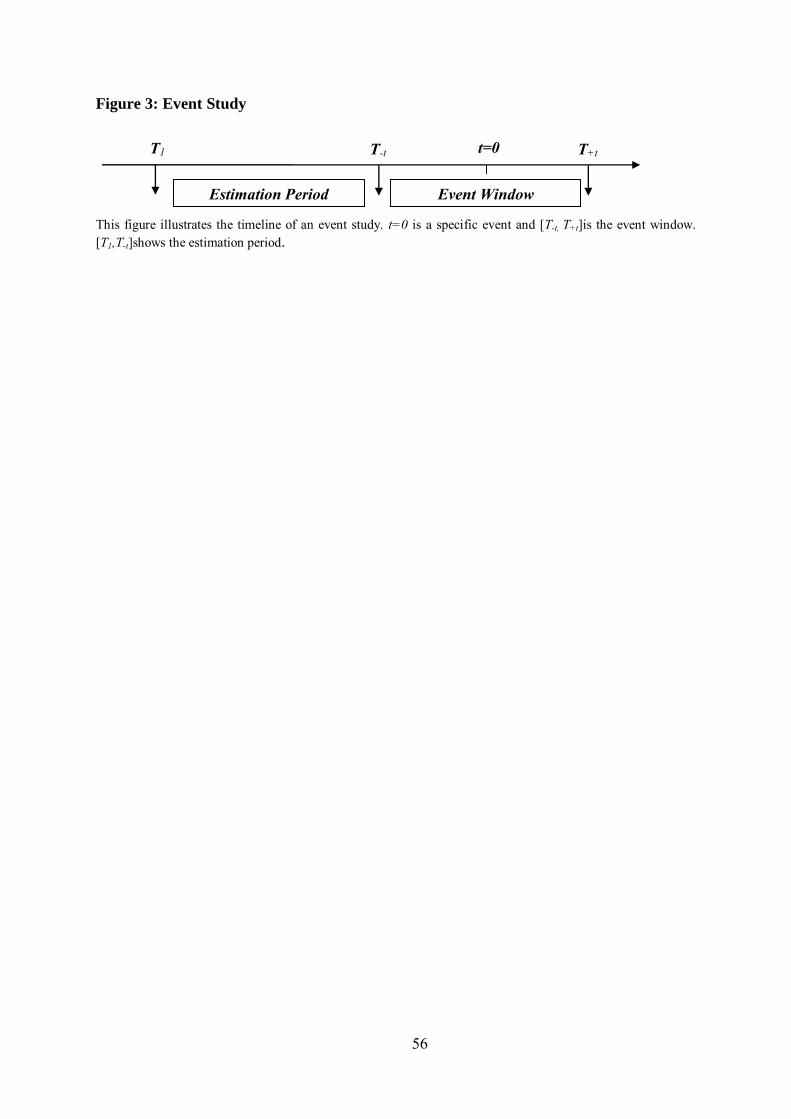
56
Figure 3: Event Study
This figure illustrates the timeline of an event study. t=0 is a specific event and [T-t, T+t]is the event window.
[T1,T-t]shows the estimation period.
Event Window Estimation Period
T1
T+t t=0 T-t T-t t=0
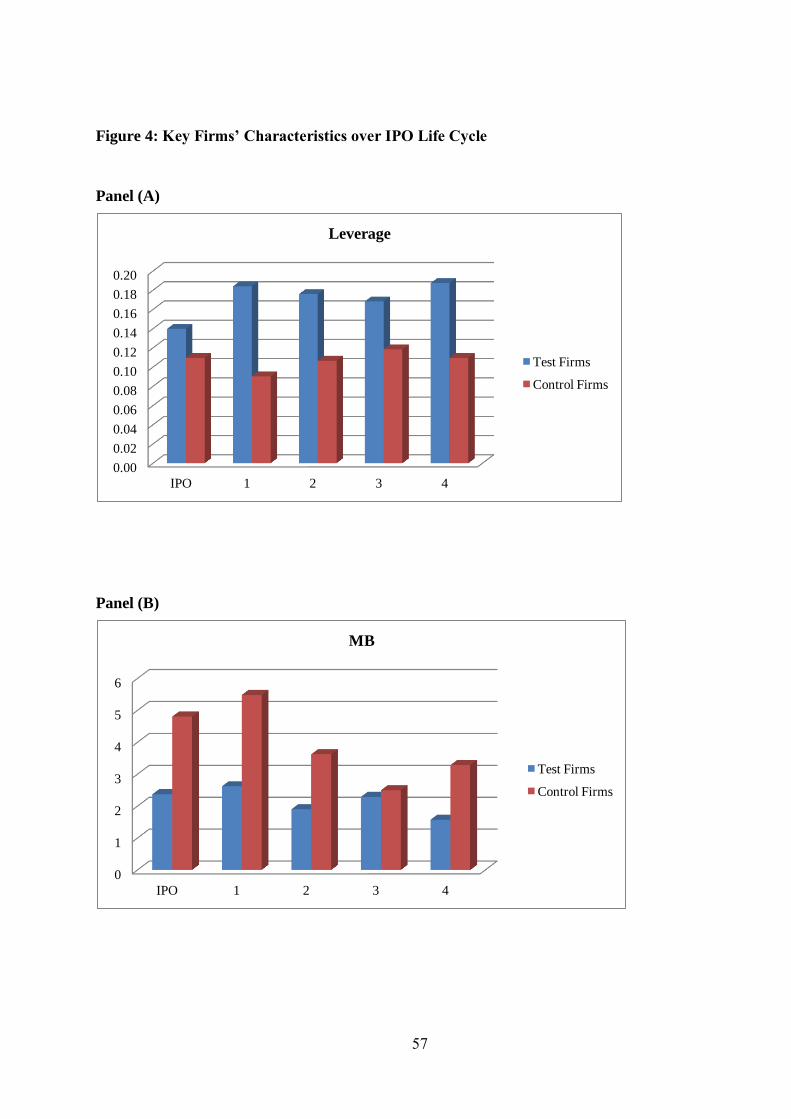
57
Figure 4: Key Firms’ Characteristics over IPO Life Cycle
Panel (A)
Panel (B)
0.00
0.02
0.04
0.06
0.08
0.10
0.12
0.14
0.16
0.18
0.20
IPO 1 2 3 4
Leverage
Test Firms
Control Firms
0
1
2
3
4
5
6
IPO 1 2 3 4
MB
Test Firms
Control Firms
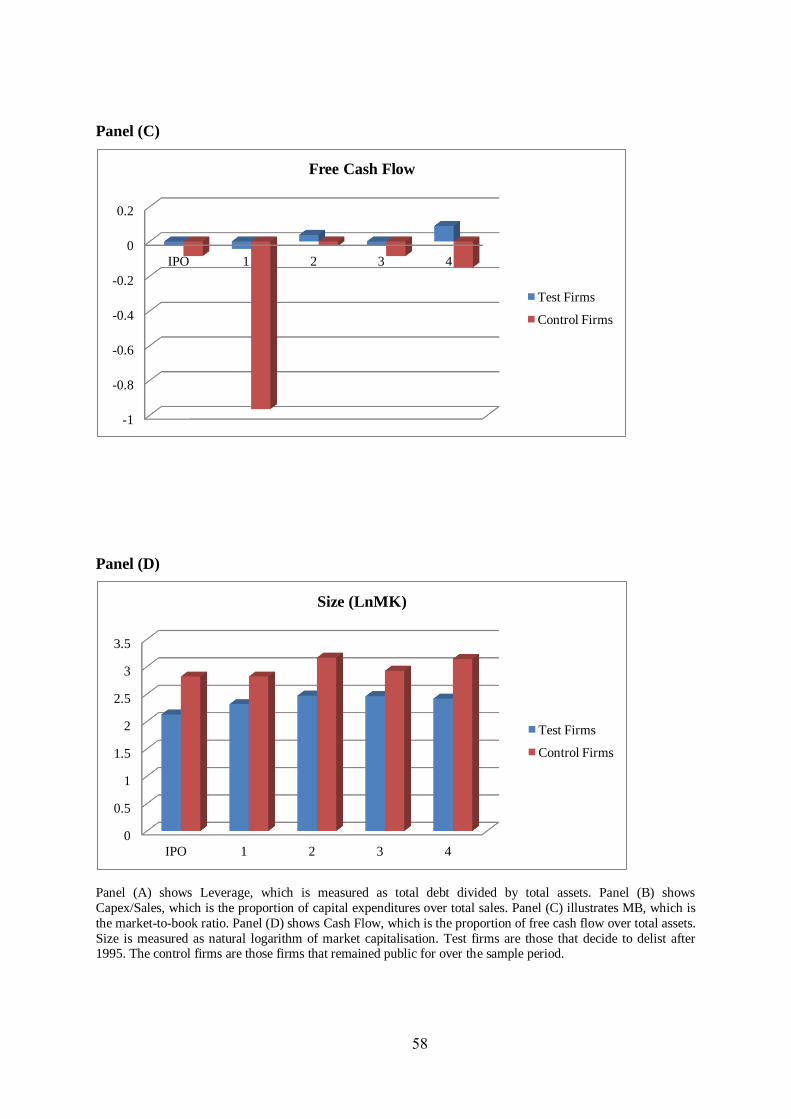
58
Panel (C)
Panel (D)
Panel (A) shows Leverage, which is measured as total debt divided by total assets. Panel (B) shows
Capex/Sales, which is the proportion of capital expenditures over total sales. Panel (C) illustrates MB, which is
the market-to-book ratio. Panel (D) shows Cash Flow, which is the proportion of free cash flow over total assets.
Size is measured as natural logarithm of market capitalisation. Test firms are those that decide to delist after 1995. The control firms are those firms that remained public for over the sample period.
-1
-0.8
-0.6
-0.4
-0.2
0
0.2
IPO 1 2 3 4
Free Cash Flow
Test Firms
Control Firms
0
0.5
1
1.5
2
2.5
3
3.5
IPO 1 2 3 4
Size (LnMK)
Test Firms
Control Firms
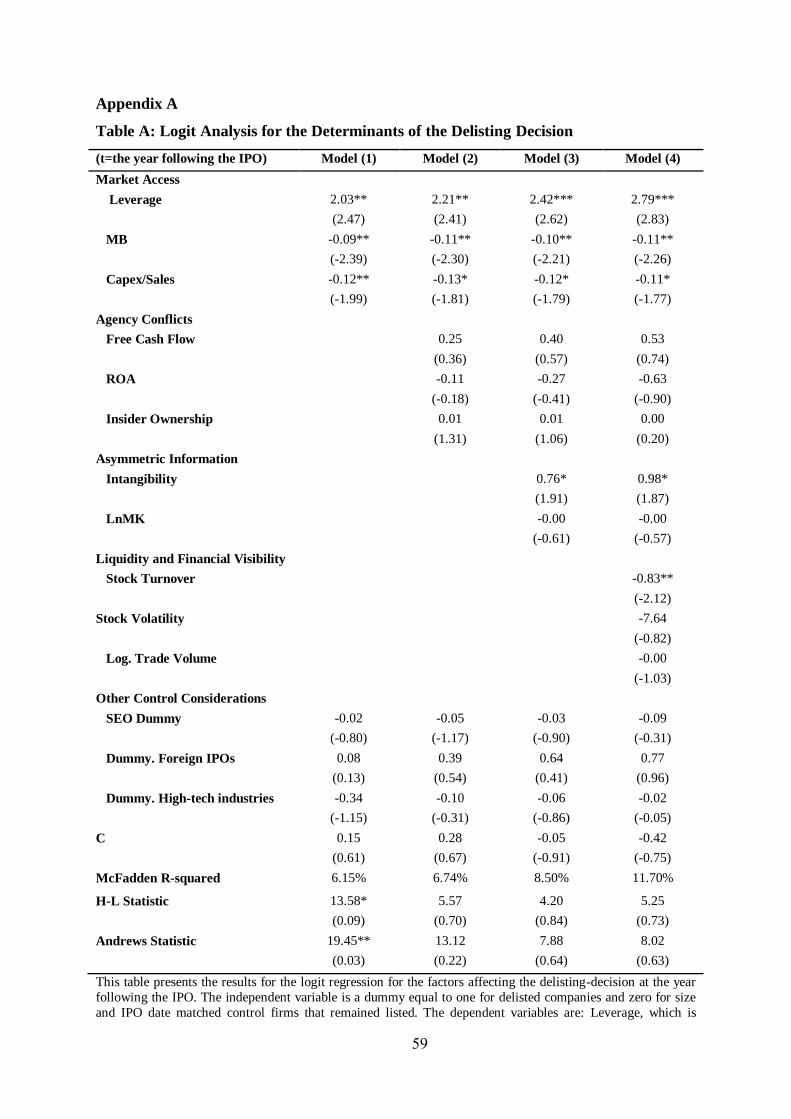
59
Appendix A
Table A: Logit Analysis for the Determinants of the Delisting Decision
(t=the year following the IPO) Model (1) Model (2) Model (3) Model (4)
Market Access
Leverage 2.03** 2.21** 2.42*** 2.79***
(2.47) (2.41) (2.62) (2.83)
MB -0.09** -0.11** -0.10** -0.11**
(-2.39) (-2.30) (-2.21) (-2.26)
Capex/Sales -0.12** -0.13* -0.12* -0.11*
(-1.99) (-1.81) (-1.79) (-1.77)
Agency Conflicts
Free Cash Flow 0.25 0.40 0.53
(0.36) (0.57) (0.74)
ROA -0.11 -0.27 -0.63
(-0.18) (-0.41) (-0.90)
Insider Ownership 0.01 0.01 0.00
(1.31) (1.06) (0.20)
Asymmetric Information
Intangibility 0.76* 0.98*
(1.91) (1.87)
LnMK -0.00 -0.00
(-0.61) (-0.57)
Liquidity and Financial Visibility
Stock Turnover -0.83**
(-2.12)
Stock Volatility -7.64
(-0.82)
Log. Trade Volume -0.00
(-1.03)
Other Control Considerations
SEO Dummy -0.02 -0.05 -0.03 -0.09
(-0.80) (-1.17) (-0.90) (-0.31)
Dummy. Foreign IPOs 0.08 0.39 0.64 0.77
(0.13) (0.54) (0.41) (0.96)
Dummy. High-tech industries -0.34 -0.10 -0.06 -0.02
(-1.15) (-0.31) (-0.86) (-0.05)
C 0.15 0.28 -0.05 -0.42
(0.61) (0.67) (-0.91) (-0.75)
McFadden R-squared 6.15% 6.74% 8.50% 11.70%
H-L Statistic 13.58* 5.57 4.20 5.25
(0.09) (0.70) (0.84) (0.73)
Andrews Statistic 19.45** 13.12 7.88 8.02
(0.03) (0.22) (0.64) (0.63)
This table presents the results for the logit regression for the factors affecting the delisting-decision at the year
following the IPO. The independent variable is a dummy equal to one for delisted companies and zero for size
and IPO date matched control firms that remained listed. The dependent variables are: Leverage, which is

60
measured by total debt divided by total assets. MB is the market-to-book ratio.Capex/Sales isthe proportion of
capital expenditures over total sales.Free Cash Flow is the proportion of free cash flow over total assets. ROA is
measured by earnings before interest and tax over total assets. Insider Ownership is the ratio of holdings of
common shares by all directors and officers as a group to total outstanding shares. Intangibility is the ratio of
intangible assets over total assets. LnMK is the natural logarithm of market capitalisations. Stock Turnover is a
ratio of daily turnover of the past 12-month period divided by number of ordinary shares. Stock Volatility is yearly standard deviation of a firm’s stock return over last 12 month. Log. Trade Volume is the log of daily
shares traded over past 12 months. SEO Dummy is a dummy variable equal to one if the company raised capital
and zero otherwise. Dummy.Foreign IPOs is a dummy variable equals to one if the AIM firm is foreign.
Dummy VC backing is a dummy variable sets to one for a venture capitalist. Dummy high-tech industry is a
dummy variable sets to one if a firm is in computer manufacturing, electronic equipment, computer and data
processing services, and optical, medical, and scientific equipment. Finally, this table reports two goodness-of-
fit tests, H-L Statistic and Andrews Statistics. They show the discrepancy between observed values and the
values expected in the logit model. If these differences are large, I reject the model as providing an insufficient
fit to the data.***, **,* indicate that the estimate is significant at the 1 %, 5% and 10% level, respectively.


![What How When DELISTING. IN. SEBI(DELISTING OF EQUITY SHARES) REGULATIONS, 2009 SCRA[ SECURITIES CONTRACT( REGULATION ACT) 1956] LISTING AGREEMENT COMPANIES](https://img.pdfslide.net/doc/110x75/56649daf5503460f94a9d128/what-how-when-delisting-in-sebidelisting-of-equity-shares-regulations.jpg)


![Updates on Delisting Offer [Company Update]](https://img.pdfslide.net/doc/110x75/577ca5dc1a28abea748bae1f/updates-on-delisting-offer-company-update.jpg)