Embed Size (px)
Citation preview

The impact of location on housing prices: applying the Artificial Neural Network Model as an analytical tool.
ABSTRACT
The location of a residential property in a city directly affects its market price. Each
location represents different values in variables such as accessibility, neighbourhood, traffic,
socioeconomic level and proximity to green areas, among others. In addition, location has an
influence on the choice and on the offer price of each residential property. The development
of artificial intelligence, allows us to use alternative tools to the traditional methods of
econometric modelling. This has led us to conduct a study of the residential property market
in the city of Valencia, Spain. In this study, we will explain the factors that determine the
demand for housing and the behaviour of prices in the urban space. We used an artificial
neural network as a price forecasting tool since this system shows a considerable
improvement in the accuracy of ratings over traditional models. With the help of this system,
we attempted to quantify the impact on residential property values of issues such as
accessibility, quality standards of public facilities, quality of urban planning, environment and
other aspects.
Key words: Housing Market, Artificial neural network, accessibility, neighbourhood,
market price.
1. INTRODUCTION
Housing prices have been of interest to researchers since the second half of the 20th
century. The first models, which determine the impact of accessibility on the value of urban
property, are inspired by Von Thünen’s Model (1826) and focus on analyzing in what manner
accessibility influences housing prices. The studies of Alonso (1964), Mills (1972), Muth and
Wingo are worth mentioning. These studies examine the residential patterns which derive
from urban agents’ decisions and they also analyze the value of urban real estate properties
including housing. They evaluate how accessibility, in terms of transport cost, has in impact
on residential property value. The transport cost is defined in a broad sense and includes not
only the monetary and time costs, but also other inconveniences which generate disutility.
Households allocate part of their budget to housing and transport. The remainder of the
budget is spent on other goods. According to Alonso (1964), a household located further from
the CBD will bear higher disutility derived from the cost of transport than one which is closer.

This disutility will have a reflection on the lower prices of residential property locations
which are further from the CBD or whose accessibility to the CBD is lower. These residential
properties, which bear higher transportation costs, will need to be offered at a lower price in
order to offset the higher costs arising from poor accessibility.
Compensation models focus on analyzing the influence of accessibility (defined as the
distance to the CBD) on decisions related to residential location and on residential property
value. Different aspects affect residential property demand. These can be related to either the
property’s physical characteristics such as quality standards, layout and installations or to
many other variables attached to location, which, since they affect the residents’ wellbeing,
also have an influence on the residential property value. These are what we refer to as
“locational aspects” where we must differentiate between aspects related to accessibility and
neighbourhood aspects.
Property value cannot be explained based on the above models since they do not take
into consideration other aspects which also have significant influence on the residential
property value. However, compensation models, also known as accessibility models, can
explain the fact, more and more common in many cities, that as distance to the CBD
increases, the value of the property decreases.
The development of the hedonic method, especially since Rosen’s work (1974),
allowed the incorporation in the analysis of residential property value of attributes such as
environment, amenities or neighbourhood facilities, i.e. schools, health centres, recreation
areas and sports centres among others.
The impact of the neighbourhood socioeconomic status and immigration levels has
also been evaluated. Hedonic methods are still very much used to explain in what manner the
external and internal attributes of residential properties influence residential property value.
The issue that must be addressed is which aspects increase value and by how much, i.e.,
which aspects are rewarded by home seekers willingness to pay a higher price for the
property.
Artificial Neural Networks (ANN) have recently been incorporated in the analysis of
residential property value. This paper develops an ANN-based model, whose goal is to
measure the incidence of locational aspects on residential property value in Valencia, Spain.
Our study examines the impact on residential property value of aspects such as accessibility,
environment and the quality standards of the neighbourhood facilities.
We first reviewed the related literature and we established the state of the question.
Then, we examined the influence of different factors on residential property value and
analyzed the related research data. We went on to determine the impact and the potential of
ANN in the study of the property market and then presented the model resulting from the
definition of the study variables and their application in the neuronal network. Finally, we
analyzed the results obtained.
2. LITERATURE REVIEW
The value of residential property depends on many characteristics which are related to
both the physical aspects of the property and its location. Location incorporates employment
possibilities as well as other leisure and recreational advantages. The characteristics of the
neighbourhood, which include amenities such as views, parks, schools, community services,
etc., are attributes that influence residential property value. Other attributes which also affect
residential property value are those related with the surroundings, such as environmental
factors, safety levels and existing urban infrastructures, including sewing drainage systems,
roads, public transport, health centres, education centres and other community services.
(Pollakowski, 1982). Therefore, it can be stated that residential property value depends on the
property’s location, since location incorporates attributes which result in benefits and
satisfaction of the residents.
The following are the results found in the existing literature:
Accessibility and transport
The location and land use theory suggests that accessibility is an essential factor in the
value of residential land and in changes in this value. We are going to review the studies
which analyze the impact of accessibility on residential property value.
The studies analyzing the role of accessibility in the real estate market have followed,
according to Hwang (2009) three strategic lines. The first group of studies analyzes how the
accessibility improvements resulting from transportation investment are capitalized into the
value of residential property. These studies usually try to demonstrate these effects based on
regressions between changes in property prices and changes in accessibility derived from
transport improvements, controlling the rest of the factors considered. The empiric results are
heterogeneous, Huang (1996), Ryan (1999) and Gibbons and Machin (2008). As Hwang
(2009) points out, scale and timing of transportation investment, local economic conditions
and land use policy are found to influence how land and housing markets respond to increase
in accessibility. A second group of studies uses the hedonic price models to analyze the
relationship between the accessibility improvements and residential property prices. Studies

have frequently focused on determining the role of the demand for job accessibility in the real
estate market. Hwang, (2009) carried out a study for metropolitan areas of Buffalo and Seattle
and found that job accessibility is a significant determinant of housing price. Sites accessible
to job opportunities are considered more desirable, so good job accessibility increases
residential property value. The results are the same in both metropolitan areas. Finally, a third
line of research focuses on determining the relative importance of accessibility as a factor
which influences residential location decisions. A utility function for housing which
incorporates a few attributes has been defined: agents choose between different location
alternatives and maximize the utility derived from the multiple attributes which characterize
the set of choice alternatives available. Several empiric studies have found that accessibility is
of less significance to residential location decision than other factors such as the property’s
characteristics and the characteristics of the neighbourhood. (Timmermans, 2003). However,
in low income areas accessibility ranks among the most significant residential choice factors,
(Quigley 1985; Thill and Van de Vyvere 1989)
Thériault, M. et al (2005) carried out a study in order to assess accessibility as
perceived by households in the city of Québec based on travel time from home to service
areas. To this end, they adopt “objective” indices which rely on actual trips and “subjective”
indices which rest on fuzzy logic criteria. This study found that the objective measure of
accessibility yields good results, it indicates that residential property value increases with
good accessibility. Nevertheless, with the use of subjective measures the results are not clear.
Research reveals that there are statistically significant differences in the way accessibility is
structured depending on the purpose of the trip and on the household profile.
The results relating to the relationship between job accessibility and residential
property value are inconsistent, they vary depending on the measures used. Ryan (1999)
studies the relationship between residential property value and accessibility measured on
travel time and concludes that accessibility is negatively associated with the residential
property value. However, several studies which measured accessibility based on travel
distances obtained opposite results, that is, the existence of a direct relationship between
accessibility and residential property value, Franklin and Waddell (2003). According to
Hwang (2009), there are multi-collinearity problems, since accessibility is highly correlated
with other explanatory variables. Golledge and Stimson (1997) point out that the travel time
variable reflects what accessibility involves more accurately than distance measures.
Furthermore, accessibility to different types of activities such as shopping, education and

training or recreation has been proven to have a different impact on residential property value,
depending on which activity people wish to access.
Additionally, other studies find that the impact of job accessibility on housing prices is
not constant over the urban space. Adair et al. (2000) show that job accessibility has a
minimal impact on housing prices when we take the study area as a whole, but it has varying
influence across different sub-regions. Therefore, in low income areas, accessibility seems to
have a significant influence on housing prices.
Munroe (2007) found residential property value to decrease significantly with distance
to the CBD and to major employment areas.
Hedonic price methods (HPM) have been widely used to measure the impact of
transportation investments based on distance to train stops and traffic lanes, (Hennebery,
1998; Gatzlaff and Smith, 1993). Al-Mosaind et al. (1993) used HPM to study the
relationship between proximity to light-rail transit and housing prices and found that two
forces operate in this case: a positive one and a negative one. The positive one includes
improvements in the accessibility to the CBD and to the rest of the urban areas due to
proximity to LRT stations. This can help close residents save on transport costs. The negative
force rests on the fact that LRT may generate externalities affecting nearby properties, which
would result in a decrease in the value of those properties.
This study was carried out based on selling prices in the metropolitan area of Portland,
Oregon. Results indicated that proximity to LRT has a positive effect on residential property
value. The study shows a positive capitalization for properties within 500 metres to LRT
stations.
According to urban economics, a relative improvement of accessibility originating in
transportation equipment and infrastructure can lead to an increase in residential property
value, since demand for more accessible locations will be higher. This will also result in
higher bids for those locations, Mills and Hamilton (1994). However, earlier studies show
different results concerning the manner in which transport infrastructure influences property
value. Firstly, some studies find that proximity to rail transport has positive impact on
residential property value, Gatzlaff and Smith, (1993); Haider and Miller, (2000); Lewis-
Workmand and Brod, (1997); Voith, (1991) and Sarandi et al. (2001). Sarandi’s work, which
focused on the residential property market in Oslo, used HPM and models based on the utility
function. This study finds that transport lines also generate negative environmental effects on
people, the most relevant being noise and train vibrations.
There is no agreement regarding the effect of proximity to train stations on property
value. While some researchers find that this factor has a positive impact on housing prices
(Chen et al., 1997; So et al., 1997; Laakso, 1992), others cannot find a positive relationship
between the two (Hennebery, 1998; Forrest et al., 1996). In the existing literature, empiric
studies take place mostly in developed countries, especially in North American cities:
Cambridge Systematic Inc., 1998; Los Angeles, (Cerveró and Duncan, 2002); Atlanta,
(Cerveró, 1994, Bollinger and Ihlandfeldt, 1997); Washington D.C. (Cerveró, 1994); Toronto
(Dewees, 1976) and Hong Kong (So et al., 1997).
Environmental amenities, green urban areas and landscape
Green urban areas have important amenity values which include provision of leisure
opportunities and aesthetic enjoyment, Kong et al. (2007). Previous studies have analyzed the
impact of green urban areas on residential property value, among them Wyatt, 1996; Can and
Megbolugbe, 1997; Geoghegan et al., 1997; Lake et al., 2000;Brasington and Hite, 2005 and
Kong, 2007. In general, these studies state that access to green areas has a reflection on
housing prices.
As Miller (1997) and Tyrväinen and Miettinen, (2000) point out, the development of
environmental awareness has led to a strong demand by urban residents for green space for
various purposes including recreation, access to clean air and to a quiet environment.
However, these aspects do not have a market price, so it is difficult to assess the benefits
which they generate. (Robinette, 1972; Grey and Deneke, 1978; Miller, 1997; Tyrväinen and
Miettinen, 1998; More et al., 1988 and Sengupta and Osgood, 2003).
Bengochea, 2003 used HPM to analyze the relationship between housing prices and
green urban area facilities. He introduced the following three variables for the study of the
environment: views of public parks or gardens, distance of the property to the closest green
area and the size of the green area. The work was carried out for the city of Castellón, Spain.
Bengochea found that there is an inverse relationship between housing price and distance to
urban green areas. Sirman (1994) analyzed the sales of 194 residential properties in Fairfax
County, Virginia between 1985 and 1991 and concluded that houses with good views sell at
prices 8% higher than houses without good views.
With regard to air quality, studies based on HPM found a positive relationship
between this variable and residential property value (Ridker and Henning, 1967).

Boyle et al. (2001) made a comprehensive analysis of existing studies which have
examined the effects on housing prices of air and water quality and distance from unwanted
installations or activities and dangerous sites.
Neighborhood facilities
So et al (1997) find that shopping centres and sports facilities are important factors for
the determination of housing prices. The study was carried out for the housing market in
Hong Kong.
With regard to education facilities, Hayes and Taylor (1996) argue that the impact of
school quality on house values derives from the marginal effect of schools on educational
outcomes; that is, the value-added of a school. Los resultados que arrojan diversos trabajos
sobre la cuestión son los siguientes: Dubin and Goodman (1982) studied the impact of
education and crime on house prices in Baltimore (USA). A partir de un HPM , they find that
neither value-added measure significantly affects city house prices; Goodman and Thibodeau
(1998), find that the impact on house prices of the test’s pass rate is positive, significant, and
large; Black (1999) finds a positive relationship between house prices and the average of
fourth grade, and Brasington (2000) finds for Ohio and Sieg et al. (1999) for California that
find that proficiency test scores are positively related to the price of housing. Finally,
Brasington et al (2005), based on transaction data for 1991 for six urban areas in Ohio, their
results reject the hypothesis that the market price of housing reflects the value added to
student achievement by a school district. They find evidence that households value the
quality of peer group influences in a school district; however, the impact is small.
Immigration: segregation and racial discrimination
In this section, we review the literature which analyzes the effects of immigration,
segregation and racial discrimination on housing prices. The results are not conclusive.
Cerveró et al. (2004) studied the influence of racial composition on land value in Tierra Santa
County, California and found that the factor of racial diversity tends to decrease residential
property value, even when controlled by factors like median household income. Myers (2004)
states that housing prices decline in neighbourhoods as the the percentage of whites decreases.
There are two widely-known models which show that private preferences for racial
composition can create price differentials between neighbourhoods. Bailey’s “border model”
demonstrates that white people and black people are segregated as follows: black people
inhabit central areas and white people inhabit suburban areas. It also assumes that both black
and white people prefer to live in white neighbourhoods.

Competition ensures that the prices that blacks and whites pay for housing in the
border areas of their neighbourhood will be equal since whites prefer to live as far as possible
from blacks and therefore are readier to pay higher prices for houses located in interior areas
than in border areas. As blacks prefer to live in white neighbourhoods, they will pay less for
houses in the black interior than in the border area. Combining these results, in the absence of
discrimination, the model predicts that prices in the interior of black neighborhoods will be
lower than prices in the interior of white neighborhoods and that prices in border areas will be
intermediate. This model can help us estimate in which manner ethnic concentration in city
areas influences housing prices. Yinger carried out a study in this same line.
Artificial Intelligence and Artificial Neural Networks
Since their beginnings, computational techniques constituted a new paradigm in
information processing techniques. They opened the possibility of carrying out more
experiments due to the important increase in data processing capacity. Nowadays, the
applications of these techniques embrace such diverse areas as the game industry and
production chains. Throughout the second half of the 20th century, computational techniques
have created different fields in which to develop multiple techniques. In this study, we will
focus on the techniques related to Artificial Intelligence: fuzzy logic, genetic algorithms and
artificial neural networks.
Artificial Intelligence can be defined as the development of methods and algorithms
which allow computers to function in an intelligent manner. Artificial Intelligence involves
the fact that the processes which take place in the brain can be analyzed, at a given abstraction
level, as computational processes of a particular type. We would like to quote the following
definitions of Artificial Intelligence:
«…the science of making machines do things that would require intelligence if done
by humans» Minsky
« AI is the part of computer science concerned with designing intelligent computer
systems» Feigenbaum
«Systems that can demonstrate human-like reasoning capability to enhance the quality
of life and improve business competitiveness», Japan-S’pore AI Centre.
This study applies AI in order to develop a model which allows us to increase our
knowledge of the formation of housing prices based on an ANN model. ANN can be defined
as a system of programs and data structures that approximates the operation of the human

brain. An ANN usually involves a large number of processors operating in parallel, each with
its own small sphere of knowledge and access to data in its local memory. Typically, a neural
network is initially "trained" or fed large amounts of data and rules.
In the neuronal network, each processing element (neuron) is represented as a node.
These connections establish a hierarchical structure which, trying to emulate brain
physiology, searches for new processing models that will help us solve real life problems. The
important aspect of the development of ANN techniques is its usefulness in understanding,
recognizing and applying relationships between real life objects and structures. Thus, ANN
are used as possible tools for the resolution of difficult problems, Freman and Skapura (...).
In the 50s, there existed big expectations concerning research using AI, especially
ANNs. Rosenblatt’s studies (The perceptron: A probabilistic model for information storage
and Organization in the brain published in 1958 and Principles of Neurodynamic:
Perceptrons and the Theory of Brain Mechanisms in 1962) open new perspectives in this
field. Some years later, Minsky and Papert’s study (1969), Preceptrons, invalidates the
theories developed in the 50s period. Both researchers criticize neural models for the sterility
of research based on them. In the 1980s, new discoveries showed that the prognostics in the
book were wrong. Currently, ANNs are used in different fields, which Deboeck groups as
follows: financial and economic modelling, market profiles, applications in medical science,
knowledge management and data discovery, industrial process optimization and quality
control, and scientific research. Table X shows a more comprehensive classification.
Attempts to apply neural network technology to the valuation of residential property
date from the early 1990s. Frequently, these studies are in the form of comparative analysis,
with researchers contrasting the findings and perceived efficiency of neural network models
with more tried and tested statistical methods, like ANN models. Do and Grudnitski (1992),
Tay and Ho (1991) in a comparable study in Singapore, Evans et al (1992) and Rossini
(1997a, 1997b) concluded that a neural network model performs better than a multiple
regression model for estimating value, Worzala et al. (1995) adopt a contrary position and
cast some doubt upon the role of neural networks compared with traditional regression
analysis models, suggesting that caution is needed when working with neural networks. In
undertaking analysis at varying levels of investigation and utilising different neural network
shells, the error magnitude for individual properties was found in some cases to be very
significant (up to 70 per cent) and clearly not acceptable for a professional appraisal. In
Gallego’s opinion (2008) ANNs are capable of reproducing variable joint behaviour in the
real estate market, even in a wide geographical area, where products are more varied and

relationships between variables are more complex. Tay (1992) appreciated that property
appraisal is essentially a problem of “pattern recognition” and noted that ANN should be able
to learn from historical sales and apply the sale prices to the respective ‘pattern’ identified.
Biology- Widen our knowledge about
the brain and other systems. Aprender más acerca del cerebro y otros sistemas.
- Obtaining retine models.
Environment
- Analysis of trends and patterns.
- Weather forecast.
Companies- Hand-written character
recognition.
- Identification of candidates for specific positions.
- Optimization of seats and timetables in airlines.
- Database exploitation .
- Evaluation of the probability of geologic and petroleum formations.
- Text-to-speech synthesis.
Finance
- Price evolution forcasting.- Credit risk evaluation.- Fake identification.- Signature interpretation.
Manufacturación
- Automated robots and control systems (artificial visión and sensors of pressure, temperature, gas,etc.)
- Production control in process lines..
- Quality inspection.
- Signal filtering.
Military activities
- Clasification of radar signals.
- Intelligent weapon creation.- Optimization of scarce
resources.
Medical science
- Speech analysis for profoundly deaf people.
- Diagnostic and treatment based on symptoms and/or analytic data (encepha-logram, etc.)
- Surgery monitoring.
- Forecasting of adverse drug reaction.
- X-ray readers.
- Understanding the causes of epileptic attacks.
-
Source:
Table 1. Main research fields and lines based on ANN.
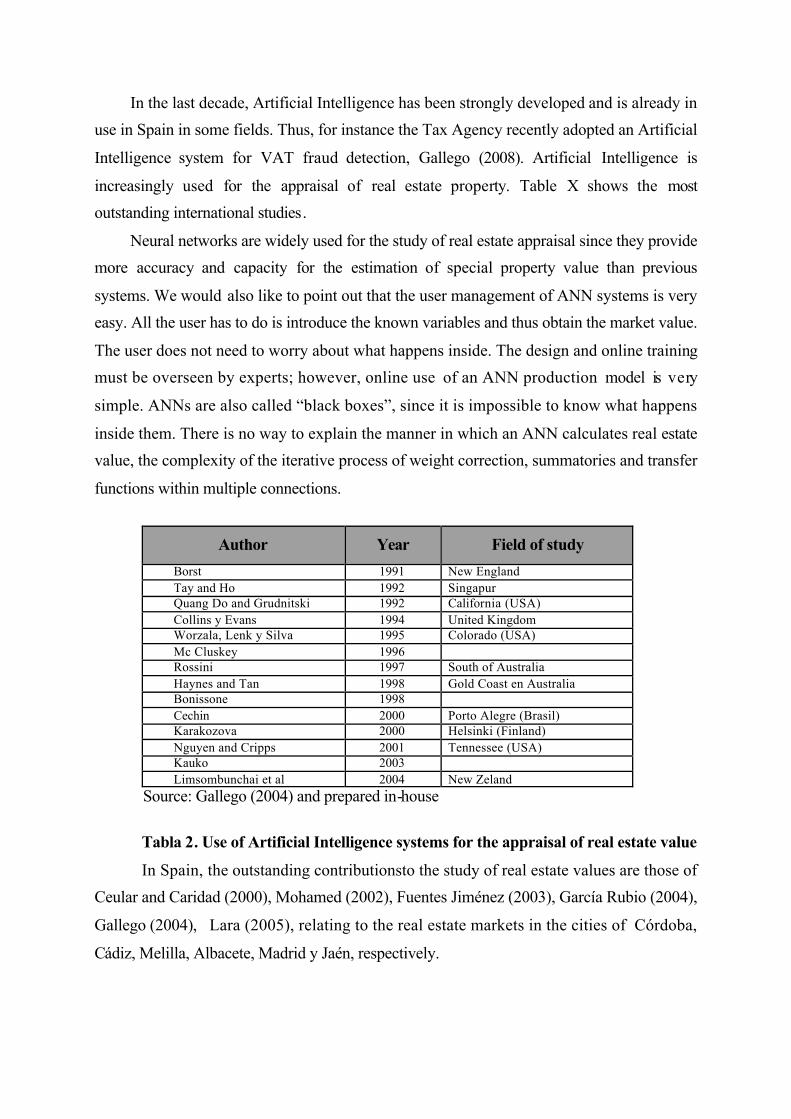
In the last decade, Artificial Intelligence has been strongly developed and is already in
use in Spain in some fields. Thus, for instance the Tax Agency recently adopted an Artificial
Intelligence system for VAT fraud detection, Gallego (2008). Artificial Intelligence is
increasingly used for the appraisal of real estate property. Table X shows the most
outstanding international studies.
Neural networks are widely used for the study of real estate appraisal since they provide
more accuracy and capacity for the estimation of special property value than previous
systems. We would also like to point out that the user management of ANN systems is very
easy. All the user has to do is introduce the known variables and thus obtain the market value.
The user does not need to worry about what happens inside. The design and online training
must be overseen by experts; however, online use of an ANN production model is very
simple. ANNs are also called “black boxes”, since it is impossible to know what happens
inside them. There is no way to explain the manner in which an ANN calculates real estate
value, the complexity of the iterative process of weight correction, summatories and transfer
functions within multiple connections.
Author Year Field of study
Borst 1991 New England
Tay and Ho 1992 SingapurQuang Do and Grudnitski 1992 California (USA)
Collins y Evans 1994 United KingdomWorzala, Lenk y Silva 1995 Colorado (USA)
Mc Cluskey 1996Rossini 1997 South of Australia
Haynes and Tan 1998 Gold Coast en AustraliaBonissone 1998
Cechin 2000 Porto Alegre (Brasil)Karakozova 2000 Helsinki (Finland)
Nguyen and Cripps 2001 Tennessee (USA)Kauko 2003
Limsombunchai et al 2004 New Zeland
Source: Gallego (2004) and prepared in-house
Tabla 2. Use of Artificial Intelligence systems for the appraisal of real estate value
In Spain, the outstanding contributionsto the study of real estate values are those of
Ceular and Caridad (2000), Mohamed (2002), Fuentes Jiménez (2003), García Rubio (2004),
Gallego (2004), Lara (2005), relating to the real estate markets in the cities of Córdoba,
Cádiz, Melilla, Albacete, Madrid y Jaén, respectively.

Quang Do and Grudnitski (1993) use an ANN to re-examine the effect of age on
housing value. They find a negative relationship between property´s age and its market value
only for the first sixteen to twenty years of the life of property. Subsequently, the relationship
between age and value becomes positive, and appreciation in housing values is found, this
relationship is consistent with Sabella (1974) who theorizes that the value of a property rises
in later years due in part to the increase in value of the land portion of a property
3. DEFINITION OF STUDY VARIABLES
As stated before, the aim of this paper is to determine to what extent location aspects
influence housing prices. Our study was conducted using a sample of offer prices for 1,442
residential properties in the city of Valencia, Spain. Figure 1 shows the number of sample
properties under study. The sample contains offers for both new and pre-owned properties.
The data were gathered during the last quarter of 2009 and the first two quarters of 2010.
(85)
(101)
(65)
(111)
(113)
(131)(64)
(92)
(123)
(101)
(56)
(139)
(96)
(5)
(76)
(83)
(1)
Source: www.valencia.es/ayuntamiento/stadistica.nsf and prepared in-house
Figure 1. City of Valencia, distribution of the sample in/by districts
The information provided in the sample is based on offer prices and not on transaction
prices since it was not possible to access the information about actual transaction prices. The
price of each property along with its position are necessary data for the implementation of our
model. Taking into account the fact that position is a fundamental factor in the goal of this

paper, we opted for basing our study on offer prices, which is the variable that we know. The
impact on price of aspects such as distance to the CBD, metropolitan transport or quality
standards of neighbourhood facilities were analyzed using our ANN.
The output variable of our model reflects the price per square metre. Data were
gathered for a total of 43 variables, which included the internal and external attributes of the
property (Tables 1 and 2).
A model which interfaces property prices with a large number of variables with the
use of the application of ANN requires a large amount of input data. The number of samples
we gathered (1442) is relatively small, consequently we had to reduce the number of input
variables so as to lose the smallest amount of information possible. In order to simplify the
model, some variables were grouped and indexed. Since the factor that we intended to analyze
was the impact of location and environment on house pricing, we resolved to focus on these
two aspects and reduced all the characteristics to only one category which represents the “type
of residential property”.
INTERNAL VARIABLES
Property Building where the property is Common areas
Housing price Lift Green zone
Square footage Natural gas installation Swimming pool
Height Central heating Sports facilities
Penthouse and similar (air conditioning) Playground
Age Other installations Other
Condition
Parking space
Number of bedrooms
Number bathrooms
Views aspect
Table 3. Internal characteristics of the properties included in the sample
Table 3 shows the internal characteristics of the properties which have been indexed
and converted to a single variable with 9 categories. The categories have been determined as
follows:

Residential property has been classified based on size: smaller than 90M², between 90
and 150M² and bigger than 150M². Size does not include common areas. Within each size, we
have included a category for quality: low, medium and high. Low quality properties are those
with no lift, in poor condition, older than 50 years, with no central heating or air conditioning,
with no views, not including penthouses or similar, no common recreational facilities, such as
swimming pools, grassy areas or other. Medium quality properties include those built in the
last 50 years, with a lift, in good condition. Included here are low quality properties which
have a characteristic specific to the other two groups, that is, good views, a penthouse,
common recreational areas, very good condition, central heating and air conditioning. High
quality properties include those which are new or in very good condition, with air
conditioning, central heating and other features, such as common recreational areas, have
penthouses or similar, good views, etc.
EXTERNAL VARIABLES
URBAN
INFRASTRUCTURE ACCESSIBILITY NEIGHBOURHOOD
SOCIOECONOMIC
LEVEL
Street widthDistancia al centro
ciudadEducation centres
Socioeconomic
status
Pavement widthProximidad al
metro/tranvíaHealth centres
Immigration level in
the neighbourhood
Quality of urban
infrastructure
Proximidad a vías
rápidasCultural centres
Street pattern
regularity
Proximidad a
cinturonesSports centres
Density Green zones (M²)
Traffic density
Special buildings
Unwanted
equipment
Distance to green
areas verdes
Table 4. External characteristics of the properties included in the sample
The external variables shown in table 4 have been indexed and grouped into one
variable, which includes public facilities such as education centres, health centres, cultural
centres and sports centres. This variable has four values depending on the characteristics of
the neighbourhood where the property is located:
Value 4: the neighbourhood enjoys all types of public facilities.
Value 3: the neighbourhood does not have o has few public facilities.
Value 2: the neighbourhood has only 2 of the 4 types of facilities.
Value 1: the neighbourhood has many public facilities belonging to one of the
four types, but lacks the other three.
Value 0: the neighbourhood does not have any public facilities.
Since our aim is to relate residential property value with location, we have not grouped
the following external characteristics of the property:
Distance to parks: the number of this variable indicates the distance in metres
between the property and parks or green zones.
Distance to the CBD: by CBD we understand a location with high accessibility.
The train station (Estación del Norte), connects Valencia with the areas that
constitute the metropolitan area and with other towns in the region through an
extensive rail network. This station is also connected to the city’s metropolitan
transport network and is located in the CBD, where business services
companies, financial companies and specialized commerce concentrate
Distance of the property in metres to the closest underground/tram stop.
Socioeconomic status.- In order to measure this variable, we used an indicator
from a study conducted by the Research Office of the Valencia City Council,
which was published under the name of Update of the income level indicator of
the different districts and areas in Valencia for the year 2001. The income
level was calculated based on the following variables:
1. MITSUP: percentage of population older than 24, with higher education
levels
2. PRIMAR: percentage of population older than 17 with only primary
studies.
3. ATURAT: percentage of unemployed working age population.
4. TURHAB: Cars per hundred people.
5. TURI16: percentage of cars with higher than 16 taxable horsepower
Immigration levels: with the use of this variable we determined if immigration
levels have an impact on residential property value. In order to give this
variable a value, we used the percentage of immigrant population in
neighbourhoods. We obtained this information from the statistics sources of
the Valencia City Council.
4. ANN ARTIFICIAL NEURAL NETWORK MODEL OF HOUSING PRICES
In this work, Artificial neural networks (ANNs) have been employed to obtain a model
capable of approximate the prize per square meter of a house, considering as input
parameters: internal characteristics of the house, neighborhood equipment , distance to parks,
distance to city town, tram or underground proximity, socio-economical level and immigrants
degree in the neighborhood .
ANNs are composed of a number of simple interconnected computing units, named as
neurons. These computing algorithms are based on the working principle of the animal
nervous system. Concretely, ANNs are composed of several neurons, which can be arranged
in different architectures, their architectures being their so-called topology. Each different
structure could be appropriate in a different way for the problem under consideration
(Freeman, 1992). ANNs are able to supply fast predictions to a given problem, providing
acceptable results for unknown patterns. In this way, they need to learn about the problem
being studied (training process), considering this process in a kind of fitting using a set of
samples belonging to the problem domain. After that, ANNs establish mathematical
correlations between the data (Ripley, 1996).
Artificial neural networks (ANN) (Bishop, 1996; Ripley, 1996) are high-performance,
non-linear analytical tools, that are capable of establishing the relationship between
input/output data without prior knowledge of the correlation between the variables involved in
the system. They consist of a number of simple interconnected computing units, named as
neurons. These artificial neurons are inter-connected together by synaptic weights to form a
network, analogous to biological neurons. Networks can be arranged following different
architectures or topologies. Each different topology could be appropriate in a different way
depending on the problem under consideration (Freeman, 1992).
Two important features of neural networks are the ability to supply fast answers to a
problem and the capability of inferring answers for unknown patterns comprised in the input
domain. Thus, they need to learn about the problem under study and this learning is
commonly referred to as “training process”. In supervised learning, neural networks are

supplied with a set of samples belonging to the problem domain (inputs and outputs) during
this training process, and they establish mathematical correlations between those samples
(Ripley, 1996). A large amount of information and time are required for analysis and
processing in order obtain precise models.
One of the most well-known structures of neuronal networks for supervised learning is
the multi-layer perceptron (Rosenblatt, 1962), which is generally used for classification and
prediction problems. In the multi-layer perceptron, neurons are grouped into layers or levels,
so each input of a neuron is composed of the outputs of the neurons of the previous level,
except for the neurons in the input layer, which have values belonging to the problem domain
as input. The number of nodes in the input and output layers are determined by the problem
features. However, the number of hidden layers, and even the number of nodes in each of
these layers, is unpredictable, so it is necessary to evaluate different structures to establish the
neuronal network topology that seems most suitable for the problem under study (Bishop,
1996; Ripley, 1996).
Setting up the ANN Model
Using supervised learning, an incremental method was applied, testing different neural
network topologies based on the multi-layer perceptron. Starting with one single layer and
few neurons, the topology was modified by increasing the number of neurons and the number
of hidden layers.
Different experiments were also carried out with those training algorithms that turned
out to be more suitable for the multi- layer perceptron according to the literature (Bishop,
1996). Specifically, neural networks were trained with back-propagation and back-
propagation with momentum, with different parameters (learning factor η and momentum µ).
In table xx, all the combinations studied are shown.
The number of samples was small (1440) for the training process. For this reason,
cross-validation on the training dataset was used (Bishop,1996). In k-fold cross-validation, the
original sample set is partitioned into k subsets. Of the k subsets, a single subset is retained as
the validation data for testing the model, and the remaining K-1 subtests are used as training
data. The cross-validation process is then repeated k times (the folds), with each of the K
subsamples used exactly once as the validation data. Thus, the training set was randomly
divided into ten subsets (k=10) of training (90%) and testing (10%) samples. Thus, each

training process was carried out ten times with different combinations of training and testing
subsets, considering the media square error obtained.
As a result of the topology and training algorithm study, it was observed that the best
results were obtained using an ANN with seven input nodes, fourteen nodes in its first layer,
fourteen nodes in its second layer and one output layer (Figure XX), combined with back-
propagation with momentum as training algorithm (η=0.2, µ=0.6). This combination reached
a mean absolute error of 22.23% predicting prizes in the test phase.
Perceptron topology Training algorithm
Input
layer
nodes
1st
layer
nodes
2nd layer
nodes
Output
layer
nodes
NameLearning
factor ηMomentum µ
7
[1,14],
steps of
one
node
[1,14],
steps of
one node
1
Backpropagation[0.2, 0.9], steps
of 0.1--
Backpropagation with
momentum
[0.2, 0.8], steps
of 0.2
[0.2,0.8] steps of
0.2
Table 5. Topologies, training algorithms and learning parameters values studied in the setting up process realized to get a suitable ANN model.
Px m2
Inter. Char.
Neig. Equip.
Park. Dist.
Dist. City Town
Dist. Under/Tram
SocioEcon. Level
Inmi. Degree
Figure 2. ANN topology selected.

5. RESULTS AND CONCLUSIONS
It has been chosen at random, one residential property from each category. With this
selection, they have been analyzed the distance to the CBD, distance to the underground,
distance to the park, inmigration rate, socioeconomic level and neighborhood levels. The
network has provided an estimate of the housing price of values of each of the different
variables. The results can see in the following figures:
1500
2000
2500
3000
3500
4000
4500
5000
0 1000 2000 3000 4000 5000 6000
Distance of CBD (m)
Ho
usin
g p
rice
(€
/m2) Housing A
Housing B
Housing C
Housing D
Housing E
Housing F
Housing G
Housing H
Housing I
Figure 3. Forecasting Housing price and distance of CBD
1700
2200
2700
3200
3700
4200
0 200 400 600 800 1000
Distance underground (m)
Ho
us
ing
pri
ce
(€
/m2 )
Housing A
Housing B
Housing C
Housing D
Housing E
Housing F
Housing G
Housing H
Housing I
Figure 4. Forecasting Housing price and distance of the underground

1700
2200
2700
3200
3700
4200
0 100 200 300 400 500 600 700
Distance parks
Ho
us
ing
pri
ce
Housing A
Housing B
Housing C
Housing D
Housing E
Housing F
Housing G
Housing H
Housing I
Figure 5. Forecasting housing price and distance parks
1500
2000
2500
3000
3500
4000
4500
5000
0% 10% 20% 30% 40%
Inmigration %
Ho
us
ing
pric
e (
€/m
2)
Housing A
Housing B
Housing C
Housing D
Housing E
Housing F
Housing G
Housing H
Housing I
Figure 6. Forecasting housing price and Inmigration rate
1300
1800
2300
2800
3300
3800
4300
0 1 2 3 4 5
Socioeconomic level
Ho
us
ing
pri
ce (
€/m
2)
Housing A
Housing B
Housing C
Housing D
Housing E
Housing F
Housing G
Housing H
Housing I
Figure 7. Forecasting housing price and Socioeconomic level

1500
2000
2500
3000
3500
4000
4500
0,0 0,5 1,0 1,5 2,0 2,5 3,0 3,5 4,0
neighborhood
hou
sin
g p
rice
(€/m
2)
Housing A
Housing B
Housing C
Housing D
Housing E
Housing F
Housing G
Housing H
Housing I
Figure 8. Forecasting housing price and neighborhood level
With these results we obtain the following conclusions:
To compare the housing price with the distance to the Central Business Distrit,
the network gives us output prices lower bigger is the distance. This happens in
all categories of housing but not with the same slope. Applies more to the
higher category.
From the distance of the underground, the neural network does not get
anything conclusive, as with the variable neighborhood and distance to the
park.
The rate of immigration, offers strong results in which trend line reflects a
lower bid prices when there is a high rate immigration. Can be seen as the
slope is more marked in senior housing. Is posible, that offered housing
category, are already in areas of high immigration.
Finally, you can see in the results obtained from the network a more greater
socio-economic level is the housing price This variable shows the same impact
for all categories of housing.
To get minor error in the neural network, we must expand the number of data,
debugging them and analyse those variables that have not received conclusive
results.

REFERENCES
Adair, A.; McGreal; S.,Smyth; J. Cooper, J. and Ryley,T. (2000): House Prices and
Accessibility: The Testing of Relationships within the Belfast Urban Area,
Housing Studies, vol. 15, nº5, pages 699 - 716
Al-Mosaind, M. A.; Dueker, K. J. y Strathman, J. G. (1993): Light-Rail Transit
stations and property values: a hedonic price approach. Transportation Research Borrad of
the Nacional Academy, nº 1400, p. 90-94
Alonso W., 1964, Location and Land Use: Toward a General Theory of Land Rent,
Harvard University Press, Cambridge, MA.
Bajic V., 1983, The Effects of a New Subway Line on Housing Prices in Metropolitan
Toronto, Urban Studies, 20: 147-158.
Bengochea, A. (2003): A hedonic valuation of urban green areas. Landscape and
Urban Planning 66 (2003) 35–41.
Bishop, C. (1996). Neural networks for pattern recognition. Oxford: Oxford
Clarendon Press.
Brasington, D.M., Hite, D., (2005). Demand for environmental quality: a spatial
hedonic analysis. Regional Sci. Urban Econ. 35, 57–82.
Bollinger R. C. and Ihlanfeldt, (1997), The Impact of Rapid Rail Transit on Economic
Development: The Case of Atlanta’s MARTA, Journal of Urban Economics, 42: 179-204.
Boyle, M. and Kiel, K.A. (2001): A Survey of House Price Hedonic Studies of the
Impact of Environmental Externalities. Journal of Real Estate Literature vol. 9, n 2,
Can, A., Megbolugbe, I., (1997). Spatial dependence and house price index
construction. Real Estate Finance Econ. 14, 203–222.
Cambridge Systematics Inc., 1998, “TCRP Report 35: Economic Impact Analysis of
Transit Investment: Guidebook for Practitioners”, National Academy Press, Washington, D.C.
Cervero R., (1994), Rail Transit and Joint Development: Land Impacts in Washington,
D.C. and Atlanta, APA Journal, Winter: 83-93.

Cervero R. and Duncan, 2002, Land Value Impacts of Rail Transit Services in Los
Angles County, Report prepared for National Association of Realtors Urban Land Institute.
Cervero, R. and Landis, J. (1997): Twenty years of the Bay Area Rapid Transit System:
Land Use and Development Impacts, Transportation Research A, 31:4, 1997.
Chen, H., Rufulo, A., and Dueker, K. (1998). Measuring the impact of light rail
systems on single-familyhome values: A hedonic approach with geographic information
system application. TransportationResearch Record, 1617, 38-43.
Chen H., Rufolo A. and Dueker K. J., (1997), Measuring the Impact of Light Rail
Systems on Single Family Home Values: A Hedonic Approach with GIS Application
Discussion Paper 97-3, Center for Urban Studies, Portland State University, Portland, Oregon.
Dewees, D. N., 1976, “The Effect of a Subway on Residential Property Values in
Toronto”, Journal of Urban Economics, 3: 357-369.
Gatzlaff, D.H. and Smith, M.T. (1993). The impact of the Miami Metrorail on the
values of residences near station locations. Land Economics, 69, 54-66.
Dubin, R. A. and Goodman. A. C. (1982): Valuation of Education and Crime
Neighborhood Characteristics Through Hedonic Housing Prices, Population and
Environment, 5, 166-181.
Forrest D., Glen J. and Ward R., 1996, “The Impact of a Light Rail System on the
Structure of House Prices”, Journal of Transport Economics and Policy, 30(1): 15-29.
Franklin, J.P. and Waddell, P. (2003). A hedonic regression of home prices in King
County, Washington, using activity-specific accessibility measures. Paper presented at
Transportation Research Board Meeting.
Freeman, J.A., Skapura, D.M., Neural Networks: Algorithms, Applications and
Programming Techniques, Addison-Wesley, Boston, MA, 1992.
Geoghegan, J.,Wainger, L.A., Bockstael, N.E., (1997): Analysis spatial landscape
indices in a hedonic framework: an ecological economics analysis using GIS. Ecol. Econ. 23,
251–264.
Gibbons, S. and Machin, S. (2008). Valuing school quality, better transport and lower
crime: evidence from house prices. Oxford Review of Economic Policy, 24(1), 99-119

Golledge, R.G. & Stimson, R.J. (1997). Spatial behavior. A geographic perspective.
(New York: Guilford Press)
Goodman, A. C. and. Thibodeau, T.G. (1998). Housing Market Segmentation, Journal
of Housing Economics, 7, 121-143.
Haider, M. and Miller, E.J. (2000). Effects of transportation infrastructure and
location on residential real estate values: Application of spatial autoregressive techniques.
Transportation Research Record, 1722, 1-8.
Hayes, K J. and Lori L. Taylor, L.L. (1996): Neighborhood School Characteristics:
What Signals Quality to Homebuyers? Federal Reserve Bank of Dallas Economic Review.
Henneberry J. (1998), Transport Investment and House Prices, Journal of Property
Valuation and Investment, 16(2): 144-158.
Huang, H. (1996). The land-use impacts of urban rail transit systems. Journal of
Planning Literature, 11(1), 17-30.
Hwang, S. (2009): Willingness to Pay for Job Accessibility: Evidences Revealed from
Neighborhood Scale Analyses in Buffalo and Seattle Housing Market. Prepared for 2009
Transport Chicago Conference.
Jin, Y. (January 2005). A comprehensive survey of fitness approximation in
evolutionary computation soft computing—A Fusion of foundations. Methodologies and
Applications, 9(1), 3–12.
Kong, F., Haiwei, Y. y Nakagoski, N. (2007): Using GIS and landscape metrics in the
hedonic price modeling of the amenity value of urban green space: A case study in Jinan City,
China Landscape and Urban Planning 79, 240–252
Laakso S., (1992), Public Transport Investment and Residential Property Values in
Helsinki, Scandinavian Housing and Planning Research, 9: 217-229.
Lake, I., Lovett, A.A., Bateman, I., Day, B., (2000). Using GIS and large-scale digital
data to implement hedonic pricing studies. Int. J. Geograph. Inform. Sci. 14 (6), 521–541.
Lewis-Workman, S. and Brod, D. (1997). Measuring the neighborhood benefits of rail
transit accessibility. Transportation Research Record, 1576, 147-153.

Mills, E. and Hamilton, B. (1994). Urban Economics, 5th edition. New York: Harper
Collins College Publishers.
Miller, R.W., 1997. Urban Forestry: Planning and Managing Urban GreenSpaces,
2nd ed. Prentice-Hall, Englewood Cliffs, NJ, p. 502.
Mills. E. S., (1972): Studies in the Structure of the Urban Economy, Johns Hopkins
University Press, Baltimore.
Mills, E. S. (1967): An Aggregative Model of Resource Allocation in a Metropolitan
Area. American Economic Review, Vol. 57, No. 2, , pp. 197-210.
Minsky, M. y Papert (1969): Perceptrons. Ed. MIT press.
More, T.A., Stevens, T., Allen, P.G., (1988). Valuation of urban parks. Landsc. Urban
Plann. 15, 139–152.
Munroe, D.K. (2007). Exploring the determinants of spatial pattern in residential land
markets: Amenities and disamenities in Charlotte, NC, USA. Environment and Planning A,
34, 336-354
Muth R., (1969): Cities and Housing, University of Chicago Press, Chicago, IL.
Pollakowski, H.O., (1982), Urban Housing Markets and Residential Location, D.C.
Heath and Company, Lexington, MA.
Quigley, J. (1985). Consumer choice of dwelling, neighborhood and public services.
Regional Science and Urban Economics, 15,41-63
Ridker, R.G., Henning, J.A., (1967). The determinants of residential property values
with special reference to air pollution. Rev. Econ. Stat. 49 (2), 246–257.
Ripley, B. (1996). Pattern recognition and neural networks. Cambridge: Cambridge
University Press.
Rosen S., (1974), Hedonic Prices and Implicit Markets: Product Differentiation in
Pure Competition, Journal of Political Economy, 82(1): 34-55.
Rosenblatt (1962). Principles of Neurodynamics: Perceptrons and the Theory of Brain
Mechanisms. Spartan Books.

Ryan, S. (1999). Property values and transportation facilities: finding the
transportation-land use connection. Journal of Planning Literature, 13(4), 412-427
So, H.M., R.Y.C. Tse, R. Y. C and Ganesan, S. (1997): Estimating the influence of
transport on house prices: Evidence from Hong Kong. The Journal of Property Investment
and Finance, 15(1): 40-47.
Thériault, M. Des Rosiers, F., and Joerin, F. (2005) Modelling accessibility to urban
services using fuzzy logic: A comparative analysis of two methods, Journal of Property
Investment & Finance, Vol. 23 Iss: 1, pp.22 – 54
Tiebout,C. (1956). A pure theory of local expenditures. Journal of Political Economy,
64, 415-424
Thill, J.C., & Van de Vyvere Y. (1989). Workplace and locational choice of residence:
a hierarchical approach. Sistemi Urbani, 3, 339-365
Voith, Richard (1991). Transportation, sorting, and house values. AREUEA, 19, 117-
137.
Wyatt, P., 1996. The development of a property information system for valuation
using a geographical information system (GIS). J. Prop. Res. 13, 317– 336.