Embed Size (px)
Citation preview
THE IMPACT OF LOOPING ON STUDENTS’ ACADEMIC
PERFORMANCE AND SOCIAL SKILLS IN A
FOURTH GRADE CLASS
MASTER’S THESIS
Submitted to the School of Education
University of Dayton, in Partial Fulfillment
of the Requirements for the Degree
Master of Science in Education
By
Carol Ann Clune
School of Education
UNIVERSITY OF DAYTON
Dayton, Ohio
August, 1999
UNIVERSITY OF DAYTON ROESCH LIBRARY
Approved by:
Official Advisor
ACKNOWLEDGEMENTS
I would like to thank Dr. Talbert-Johnson for her patience and great leadership in
assisting me with my Master’s project.
I would also like to thank the following people:
My friend Karen Eylon, for encouraging me to change careers, and teach My
family, especially my sister Debi LaFrankie, for their support in my decision. Lisa
Boulter for her help with the technical part of the project; and a special thanks to my dear
friends Catherine and Jim Sprauer and their beautiful children who inspire me everyday
to be a better person and teacher.
iii
DEDICATION
This project is dedicated to my first Looping class. Thanks for making teaching such a
j°y-
iv
TABLE OF CONTENTS
ACKNOWLEDGEMENTS......................................................................................iii
DEDICATION............................................................................................................iv
Chapter:
I. INTRODUCTION................................................................................1
Problem Statement..............................................................................4
Research Questions.......................................................................... 4
Assumptions....................................................................................... 4
Limitations...........................................................................................5
Definition of Terms............................................................................5
n. REVIEW OF THE LITERATURE..................................................6
Current Climate in Education.......................................................... 6
At Risk................................................................................................ 7
Multi-Cultural Education.................................................................11
Looping-Influences on Learning.....................................................17
Advantages of Looping....................................................................21
Disadvantages of Looping............................................................... 23
III. METHODOLOGY.............................................................................27
Subjects........................................................................................... 27
Settings............................................................................................27
V
Procedures........................................................................................27
IV. RESULTS........................................................................................32
V. SUMMARY, CONCLUSIONS, RECOMMENDATIONS... .47
REFERENCES............................................................................................ 51
APPENDICES............................................................................................. 55
vi
CHAPTER I
INTRODUCTION
Our student population is becoming more and more complex. Families are more mobile,
often due to the break down of the family. Student activities are abundant causing education to
become less of a priority. Parent schedules are conflicting, leaving students with many challenges
and few ways to cope. These situations can contribute to the “at risk” population.
The “at risk” population consists of students who are prone to fail in school. Some
examples of “at risk” students include children from broken homes or dysfunctional families. The
current divorce rate is over fifty percent leaving students tom between two homes. Immigrant
students are considered “at risk” because they have a tendency to move from their homes
frequently.
An estimated 44% of school aged children live in families where people are controlled
by destructive drugs and alcohol (O’Rourke, 1988), which is also a contributing factor for
children becoming at-risk of school failure. Counselors are becoming increasingly aware of the
long-range effects of children growing up in an alcoholic family. Health professionals are looking
to teachers for help in aiding students with coping.
Teenage pregnancy is another contributor to the “at risk” population. One out of every ten
teenage women in the United States becomes pregnant (Kenney, 1987). Factors affecting teen
pregnancy include the individual teen’s values, goals, and aspirations in life, as well as the family
environment in which she was raised. Statistics show there is a correlation between early
parenthood and academic ability (Kenney, 1987).
I
2
Other examples of students who are “at risk” include students with learning disabilities.
Learning disability is a generic term that refers to a group of disorders manifested by significant
difficulties with listening, speaking, reading, writing, reasoning, or mathematical abilities (Lewis &.
Doorlag, 1991). These students have trouble with basic skills despite adequate intellectual ability.
Students who have a learning disability have a discrepancy between expected and actual
achievement. Most learning disabled students are mainstreamed into the traditional classroom for
at least part of the day. Therefore, educators need to identify these “at risk” students and adapt
programs in their schools to meet the needs of these students.
One program being used across the country is Multi-Year Education, also known as
Looping. Looping takes place when both the teacher and the students go on to the next grade
together. The benefits of Looping include: stability for students, time-management for teachers,
and increased continuity. Looping saves time at the beginning of the school year because it is not
necessary to assess student abilities or establish class rules. Fewer transitions at the beginning of
the school year allow teachers to start the curriculum right away.
Students in a Looping class form bonds with both teachers and fellow classmates. This is
especially important for students with special needs or students whose home life is unstable. The
class tends to function as a family, which can address needs that are not being met at home. The
extra year helps teachers identify students with special needs and enables teachers to modify
curriculum when necessary (Grant, Johnson, & Richardson, 1996). When the researcher looped
from third to fourth grade, she was able to start the year continuing with modifications put in
place the previous year with a student that was identified as processed delayed. According to his
parents, he started the year much less anxious because he was familiar with the class, the
procedures, and my expectations.
3
Programs such as Looping are very effective in establishing student/teacher relationships,
enhancing self-esteem, and maximizing student learning. Many other affective programs can stem
from Looping because teachers have a better understanding of what works with their students.
The results can be greater attendance rates, higher test scores, and improved self-esteem. The
most important aspect of looping is the student/teacher relationship. When students are
comfortable with their teacher and classmates they are less likely to miss school. The class
functions like a family looking out for the best interest of everyone. Students are more willing to
take risks such as asking questions or taking on challenges because they know they will be
supported. When students feel cared for it builds their self-esteem, which can affect their
academic success as well as their social behaviors.
Looping teachers also have the opportunity to get to know parents better. This makes
conference time more relaxing and productive. Parents and teachers are usually on a first name
basis and become a team focused on the future goals for the student and strategies to meet those
goals. In addition, parents are more willing to help in the classroom, which benefits the whole
class.
Looping offers improved student achievement because students know the expectations of
their teacher and they have increased time on task rather than on procedures. In addition, there is
potential for summer learning after the first year, which decreases the number of skills lost in the
summer months. Looping can reduce retention rates because at risk students have extra time to
learn basic skills and teachers have learned how to modify lessons for those with special needs.
The purpose of this study is to identify and describe the influences of Looping, its impact
on the academic performance of students, including students at-risk of school failure, and its
impact on appropriate behavioral and social interactions of students.
4
Statement of the Problem
Children are growing up in a volatile society where interpersonal relationships seem to be
weakening with the deterioration of the family unit. Looping offers an extended, meaningful, and
positive interpersonal relationship because teachers have more time to get to know their students.
The extra time enhances a cooperative spirit between the class and the teacher. There is an
increased sense of stability for students as a result of classroom routine and consistency. This is
especially important for the “at risk” population because they may not have that consistency
outside of school Positive interpersonal relationships contribute to increased self-esteem, which
motivates students to improve both academically and socially.
Research Questions
1. Does looping impact fourth grade students, academic performance in math, science,
and spelling?
2. Does looping increase appropriate behavioral and social interactions of students within
the learning context?
Assumptions
In order to conduct this study, I am making the following assumptions. The first
assumption is that the students’ parents will respond to surveys in an honest manner. I am
assuming that the school year is enough time to accurately assess the affect Looping has on the
students.
5
Limitations
The study is limited to one class in a suburban school in southwest Ohio. This may not be
a sufficient number of students to reveal a true correlation for the broader student population.
Another limitation may be that the researcher is also the students’ teacher. Other teachers will be
involved with observations, as well as the students’ parents.
Definitions ofTerms
Multi-Year Educat io nZLo oping is a practice, which allows teachers to remain with their
class for two or more years (Grant, Johnson, & Richardson, 1996).
Pupil Performance Objectives are means of evaluating student’s knowledge of the
curriculum.
Learning Disability is a delayed development in one or more of the processes of speech,
language, reading, writing, or arithmetic in a child of average, near average, or above average
ability(Lewis & Doorlag, 1991).
Auditory Process-Delay is a learning disability, which causes difficulty receiving,
integrating, and responding to auditory information(Leisman, 1976).
At Risk Students are students who are prone to school failure due to learning disabilities
or social behaviors.
Abbreviations
ADA is an abbreviation for average daily attendance.
PPQ is an abbreviation for Pupil Performance Objectives.
CHAPTER II
REVIEW OF RELATED LITERATURE
This chapter will provide information relevant to the current climate in education, the
definition of looping, its influences on the academic performance of students, its impact on
behavioral performance and social interactions of students, and the advantages and disadvantages
of looping.
Current Climate in Education
According to the United States Department of Education, the United States is in an
educational crisis. Policy makers and educators have long been concerned about the declining
SAT scores, and the weak standing of the United States in international assessments when
compared to the highest scoring nations and the international average. A series of National
Assessments for Educational Progress (NAEP) has shown that U.S. high school students lack
basic knowledge in history, literature, civic, and geography. They struggle with seventh grade
math, and have weak reading and writing skills (Stedman, 1997).
A Second International Mathematics Study (SIMS) indicated that the U.S. fell 10 to 18
percentage points below average and 20-28 points behind the highest scoring countries with
similar enrollments. In science U.S. students scored about the international average for developed
countries at age 10, but were a distance below it at age 14 (Stedman, 1997). These studies
suggest that U.S. students are losing ground as they go through school. According to the
international reading achievement study of reading Eteracy, the U.S. made the least reading
“progress” between ages 9 and 14 (Stedman, 1997). Such low achievement is an unimpressive
result of 12 years of school. The test measures much of what our schools are teaching and show
that they are not succeeding, leaving educators to wonder why.
6
7
Social critics often blame the decline of excellence on the 1960s liberalism and educational
romanticism, but student achievement and general knowledge were low even in the 1940s and
1950s, suggesting that traditional practices never were very successful. These same critics have
suggested that children are growing up in a toxic environment. A toxic environment is one filled
with abuse, neglect, or chemical dependency by one or more parents. The social context in which
they grow up has become poisonous to their development (Garbarino, 1997). According to the
index of social health for the United States, the overall well being of the U.S. has decreased
significantly. The index ranges from 0 to 100 (with 100 being best). From 1970 to 1992 the index
showed a decline from 74 to 41 (MiringofiE, 1994).
Children from toxic environments often have academic and behavioral problems,
characterized by fighting with peers, temper tantrums, disruptive classroom behaviors, poor
academic performance, truancy, delinquency and/or abuse of alcohol and drugs. They often have
emotional difficulties such as depression or low self-esteem Physical problems such as ulcers,
obesity, chronic stomachaches, and asthma are also common. Many of these students are
identified as at risk. .
At-Risk
There are a growing number of students who are considered to be at-risk. They
consistently show a lack of the necessary intellectual, emotional and/or social skills to take full
advantage of the educational opportunities available to them The factors that place them at-risk
include substance abuse, delinquency, and an abusive caregiver. These factors interfere with their
ability to benefit from the school experience (Lewis & Doorlag, 1991).
Many educators agree that there are a growing number of students at risk, but there are
various opinions about what is considered at risk. Some educators only consider dropouts as
8
at risk students, whereas others include adverse social and economic conditions such as substance
abuse, teen pregnancy, delinquency and poverty, as at risk factors. As many as 40% of the K-12
population can be considered at risk (Lewis & Doorlag, 1991). High numbers of at risk students
can be found in schools in urban, suburban, and rural communities. The potential for being
identified as at risk is higher for students raised in disadvantaged or impoverished home settings.
These students are often not able to meet academic demands because of their physical or
psychological development (Lewis & Doorlag, 1991).
The current national dropout rate is reported to be 14% (Woodring, 1989). The U.S.
Census Bureau considers a student to be a dropout if they are over the age of 18 and no longer
enrolled in school, and has not graduated. The dropout rates in inner-city schools are often over
50% and as high as 80% (Lewis & Doorlag, 1991). Many of these dropouts are functionally
illiterate and have great difficulty succeeding in the work force. It is estimated that the cost to the
nation resulting from dropouts alone is at least $60 billion annually in welfare, crime prevention,
unemployment, and lost tax revenues. These figures suggest that educational reform concerning at
risk students is needed.
Substance abuse
A recent survey of students in junior high and high school revealed that drug use in all
categories including alcohol, cocaine, marijuana, hallucinogens and inhalants is on the rise (Smith,
1995). In 1995, 39% of seniors reported they had used an illicit drug at least once, whereas in
1991, 29.4% reported using an illicit drug. This increase in use is coupled with a decrease in the
belief that drugs are harmful. For example, in 1991, 79% of seniors thought that regular marijuana
users were at greater risk for harm, but only 61% felt that way in 1995 (Bosworth, 1997). Some
factors that contribute to drug use in children include drug use by parents, parent’s attitudes
9
toward drugs, and parent/child communication patterns.
The literature indicates that in any elementary classroom of 25 students, 4 to 6 are Young
Children of Alcoholics (YOCA). Many of these children are at risk of school failure. Researchers
have estimated that as many as 60% of YCOA eventually fall into chemical abuse or some other
form of compulsive behavior (O’Rourke, 1990). Until recently, professionals felt that YCOA
were the least effected by parental alcoholism because of their immaturity. However research has
indicated that the younger the child is during alcoholic disturbances, the more severe the resulting
effects. Experts estimate that fewer than 5% of these children receive the help they need. Many
professionals have focused on the schools for help because all children attend school.
Some researchers have suggested that the traditional scare tactics are ineffective because
substance abuse is often a symptom of a greater problem. Providing information about drug abuse
is not enough. Educators need to incorporate prevention programs in their curriculum. Prevention
activities must start in elementary school and be periodically reinforced as students encounter new
social situations and pressures to use substances.
Teen pregnancy
Teen pregnancy has also been a result of the changing environment in which children are
raised. Forty percent of young women in the United States become pregnant before the age of
twenty (Kenney, 1987). Teen mothers are less likely to graduate from school and more likely to
suffer from educational deficits. Teen parents are more likely than those who delay childbearing to
have low paying, low status jobs or to be unemployed. Because education is associated with
parenting skills and child development, the children of teen parents also suffer. They tend to score
lower than the children of older parents on standardized intelligence tests, and they perform less
well in school.
10
The likelihood of a teenager becoming sexually active or becoming pregnant prematurely
has less to do with socioeconomic status than with individual values, goals, aspirations, and family
environment. Teenagers who see a future for themselves are less likely to become sexually
involved at an early age and use more effective contraception, therefore they are less likely to bear
a child. Postponement of pregnancy and childbearing are associated with young people’s goals
and aspirations in life and with their academic performance. Therefore, the ability of the school
and family to build a teenager’s sense of self and of the future will have a major impact.
Behavioral patterns and delinquency
Juvenile delinquency often results in school failure. It is highly correlated with substance
abuse and more prevalent among poor students from single parent homes than those with
adequate income, or two parent households (Smith, 1994). At present, about one in five of all
U.S. children age 6 and under, live below the officially defined poverty line (Garbarino, 1997).
More than 14 million children currently live in poverty, twenty percent of white children and as
many as 40% of minority children. This number is higher than any other developed country
(Smith, 1995). The percentage of children living in a home with only one parent went from 11.9%
in 1971 to 26.7% in 1993. More than 31% of Hispanic children and as many as 57% of African
American children live in a home with only one parent.
Abuse is another factor that contributes to deviant behaviors among children. Child abuse
occurs in every race, religion and socioeconomic background. Children are often abused
physically, sexually, and emotionally. In 1991, there were more than 2.7 million cases of reported
child abuse, 1300 of which resulted in death (Smith, 1995). Child abuse puts children at risk
because abused children often have difficulty with peer relationships, they show aggressive
11
behaviors, and they lack self -esteem, and often become substance abusers. Although no single
factor leads children to delinquent behaviors, certain factors such as lack of self-esteem, abuse and
neglect can indicate high risk. Examples of delinquent behaviors include robbery, assault, sexual
offenses, and even murder. Many children who are sexually abused become abusers themselves,
preying on younger more vulnerable children. These children lack self worth and therefore do not
see a future for themselves. They often regard school as pointless. Many of these students drop
out at an early age and therefore lack the skills necessary to be a contributing member of society.
It is import that educators improve their understanding of the unique problems and special
needs of children who live in a socially toxic environment. Teachers can make an enormous
difference in a student’s life when they are sensitive to the distress many of these children
experience. It is essential that we identify these children at an early age because the risk of school
failure is overwhelming.
Multicultural Education
Multicultural education originated in the 1960s as a response to a long standing policy of
assimilating immigrants into the melting pot of our dominant American culture (Sobol, 1990).
Generally, multicultural education has focused on two broad goals: increasing academic
achievement and promoting greater sensitivity to cultural differences (Dunn, 1997). Increasing
academic achievement of multicultural groups included programs that focus on culturally based
learning styles as a step toward determining which teaching styles or methods to use with a
particular group of students. The second goal focuses on bilingual or bicultural approaches, such
as building on language and culture of African or Hispanic American students, and emphasizing
math and science specifically for minority or female students (Dunn, 1997).
12
Cultural Diversity
America is culturally diverse, represented by many different cultures and languages. There
are five major components that define a culture. First is a common pattern of communication,
sound system, or language. Second is a common basic diet or method of preparing food. A third
is a type of dress or common costuming. The fourth criteria is if there are predictable relationships
within the group, such as man-woman, mother-child, or common socialization patterns within the
group. The final criteria is if the group subscribes to a certain set of values and beliefs or ethics
(Aragon, 1973).
There have been some misconceptions about multicultural education. For instance the
assumption that there is one single learning style suitable for members of any cultural, national,
racial, or religious group. A single learning style does not exist even within a family of four or five
(Dunn and Grigg, 1995). Another misconception is that minorities and females are the only ones
in need of extra help with math and science. That ignores the fact that minority students and
female students all learn differently from one another and differently from their counterparts
whether they are high or low achievers.
According to Dunn (1997) what determines whether students master the content is how
the content is taught, not the content itself. Drew, Dunn, and colleagues (1994) tested how well
38 Cajun students and 29 Louisiana Indian students, all poor achievers, could recall story content
and vocabulary immediately and after a delay. Their recall differed significantly when they were
instructed with (1) traditional versus multi-sensory instructional resources and (2) stories in which
cultural relevance matched and mismatched students’ identified cultural backgrounds. Each
subject was presented with four story treatments (two culturally sensitive and two dominant
American) and tested for recall immediately afterward and again one week later. The findings for
13
both Cajun and Louisiana Indian subjects indicated significant differences between instructional
treatments, with greater recall in each multi-sensory instructional condition. Recall scores were
even higher when they used multi-sensory materials for American stories. These results suggest
that culturally sensitive curriculum did not produce significantly higher achievement for these two
poorly achieving cultural groups, the methods that were used did (Dunn, 1997).
English as a second language
Language is another important consideration in the education of culturally diverse
students. Many American students enter school speaking little or no English. Frequently parents
are more comfortable with their native language and do not speak English at home. This can put a
student at a distinct disadvantage, not only to speak English, but also to acquire other school
skills.
Attention to cultural and language differences can be done appropriately or
inappropriately. Bilingualism in our increasingly interdependent world is valuable, and should be
required of all students at an early age. An emphasis on bilingualism for only non-English
speaking students denies English speaking students skills required for successful interactions
internationally (Dunn, 1997). According to Dunn another problem arises in those classrooms in
which bilingual teachers speak English ungrammatically and haltingly. Such teachers provide a
poor model for non-English speaking children, who may remain in bilingual programs for years,
unable to make the transition into English speaking classes.
Some multicultural education programs are designed to increase cultural and racial
tolerance and reduce bias. They emphasize human relationships through cooperative learning and
incorporate curricular revisions to emphasize positive contributions of ethnic and culturally
diverse groups. Although these changes are needed to promote equity in American society, using
14
learning styles that complement individual needs is the most effective way to enhance academic
achievement.
Individuals with disabilities
Students with learning disabilities are often average, or bright learners who struggle with
specific subjects. They often have difficulty processing information. Learning disabled students
may have difficulty receiving information because of attention or perception problems, or a poor
memory. Some students have learning disabilities that make oral expression difficult. Learning
disabled students often have inconsistent achievements. They may excel in one area and have
great difficulty in others.
The researcher had a student who was auditory process delayed. He was very successful
with memorizing basic math facts and spelling, but had great difficulty with multi-step instructions
and oral expression. Having had him for a second year enabled the researcher to continue with
modifications immediately. He sometimes needed a second explanation with multi-step directions,
and the buddy system was used to help him with prioritizing activities. He was often given extra
time to complete tasks. Many times it takes an entire grading period to know what works best for
a student. Looping enabled the teacher to start these modifications from day one.
Students with behavior disorders are another area of concern. These students can have
special needs in several areas, such as classroom behavior, social skills, and academic instruction.
Children with poor conduct may disregard class rules or disrupt instructional activities; those with
poor study skills may not pay attention to classroom instructions, or fail to complete assignments.
A student is considered to have a disorder if their behavior deviates from the range of behaviors
for the child’s age that adults consider normal (Lewis & Doorlag, 1991). Some common
characteristics include hyperactivity, distractibility and impulsiveness. When all of these
15
characteristics occur together the student is often labeled Attention Deficit Hyperactivity Disorder
(ADHD), or Attention Deficit Disorder (ADD). These children often have difficulty with
teacher-centered, work sheet-textbook driven models of education, but often excel at project
based activities. It is important to evaluate these children based on their strengths and inner
capabilities.
Most students identified as behavior disordered remain in the regular classroom for at least
a portion of the day. According to Nelson (1985) boys are overrepresented in programs for
behaviorally disordered children as much as ten to one. The recent literature on behavior disorders
suggests that 3 to 6% of school aged students are considered to have a behavior disorder, but less
than 1% are being served. This suggests that classroom teachers be equipped to handle behavior
disorders in the classroom.
Mental retardation is another disability found in the classroom. Students with mental
retardation are able to learn, but their learning proceeds at a slower rate than that of students with
average ability (Lewis & Doorlag, 1991). Educational programs for students with retardation
focus on functional skills required for the satisfactory performance of everyday life tasks.
Therefore modifications in the traditional classroom are necessary for students to reach their
goals. It is also important to set up structured programs that facilitate the building of relationships
between handicapped and non-handicapped students.
Cyril K. Brennan Middle School in Attleboro, Massachusetts practices full inclusion for
their special needs students. They do not use pullout programs, instead students with special
needs are dealt with primarily by the classroom teachers, one of whom is always special education
certified within the classroom setting (Grant, 1996). The two or three person teaching team is
made up of teachers with different strengths to bring to the partnership. One advantage of the
16
team structure at Brennan is that the teams are able to use various grouping strategies throughout
the day as their students’ needs necessitate. Teachers design cooperative learning strategies for
part of the day, and skill-based, small group sessions at other times of the day. Teachers at Cyril
K. Brennan believe students become more flexible and better problem solvers under those
conditions.
According to Salisbury (1995), positive social relations influence elementary age student’s
intellectual, communicative, interpersonal, and emotional development. She and her colleagues
used qualitative research methods to study strategies that general education classroom teachers
use to promote the development of positive relationships between children with and without
moderate to severe disabilities in inclusive classrooms. Observations and interviews with teachers,
specialists, and administrators were used to develop five strategies. The first is active facilitation
of social interactions which enables all children to participate. Cooperative grouping is another
strategy that allows children with disabilities to be physically included. Collaborative problem
solving capitalizes on discussions of interpersonal issues, which strengthens the likelihood that
positive social interactions will occur. Peer tutoring often helps promote equity and concern for
others. The final strategy is structuring time and opportunity for students to work together and to
achieve their goals.
Other studies of teaching methods revealed dramatic results. Before being taught with
methods that responded to their learning styles, only 25 percent of special education high school
students in a suburban New York school district had passed the required local examination and
state competency tests to receive diplomas (Dunn, 1997). In the first year of the district’s learning
styles program that number increased to 66 percent. During the second year 91 percent of the
district’s special education students were successful and in the third year, the results remained
17
constant at 90 percent with a greater ratio of “ handicapped” students passing state competency
exams than regular education students (Brunner & Majewski, 1990).
Two North Carolina elementary principals reported similarly impressive gains as a result
of their learning styles programs. In an impoverished, largely minority school, Andrews (1990)
brought student scores that had consistently been in the 30th percentile on the California
Achievement Tests to the 83rd percentile over a three-year period by responding to students’
learning styles. Many professional journals have reported statistically higher scores on
standardized achievement and attitude tests as a result of learning style teaching with
underachieving and special education students (Dunn, 1997).
Franklin Township Middle School in Indiana feels so strongly about learning styles that
they designed a program called Progress Under Learning Styles or PLUS. PLUS targets students
who have failed two or more subjects during the previous semester and guides them toward
identifying their learning style. Once they have discovered what works they use students’
strengths to study, do homework, and take tests (Dunn, 1988). PLUS was initiated during the last
nine week grading period and the students’ grades improved in 60 percent of their classes. The
following year 66 percent of the previously failing students achieved higher grades.
Research documents that underachieving students whether they are from other cultures or
from the dominant U.S. culture, tend to learn differently from students who perform well in our
schools (Dunn & Grigg, 1995). As indicated in the examples cited, schools can reverse academic
failures when they focus on the child’s learning strengths and style from which they learn.
Looping- Influences on Learning
Looping is a practice, which allows single grade teachers to remain with the same class for
a period of two or more years. It generally requires a partnership of two teachers in contiguous
18
grades; a fourth grade teacher, for instance, decides to progress with her students to grade five,
while the fifth grade teacher moves to fourth grade and begins a new cycle. The concept of
Looping is not new. In 1913, the Department of the Interior recommended this same practice, but
referred to it as “teacher retention.” Since then, other terms have been used to describe Looping,
including teacher/student progression, two cycle teaching, multiyear teaching, and the twenty-
month classroom (Grant, Johnson, & Richardson, 1996).
Looping is a very simple concept. It is based on the teacher/student relationship and
knowing the learner. Many students today are on the fast track along with their families, moving
from home to school, day care, after school activities, and adapting to numerous schedules.
Additionally, many children come from single parent homes. Children lack continuity and stability
in their lives. Keeping children with the same caring, concerned teacher over a two year period
provides a stable foundation that many children need (Grant, Johnson, & Richardson, 1996).
These students benefit from strong student/teacher relationships. Looping allows students
to connect with their teacher and fellow classmates. For some students this may be their most
significant relationship. When students spend a second year with the same teacher it can reduce
anxiety for the student about the new school year. The student will be more likely to participate in
classroom discussion or small group activities (Hanson, 1995).
The Looping class has an opportunity to build a bond and work as a family to reach goals.
These relationships can influence student’s self-worth. Teachers at Langley Park Elementary
School attribute increased attendance and enhanced learning to Looping. Their students come
from 37 different countries and speak 25 different languages. The majority of the parents are
recent immigrants, most of which have lived in poverty. These immigrant students have a
tendency to move from their homes frequently. Therefore, having the same teacher and classmates
19
provides students with stability and enables them to build relationships (Haslinger, 1996).
The students at Langley Park Elementary build continuity by sharing stories and customs which
teachers feel results in global understanding and respect among all students. This gives students a
sense of security and stability. Many Looping teachers have noticed camaraderie among students
especially in times of tragedy or sadness. A fifth grade teacher at Clearcreek Elementary noted
that when one of his students experienced a major tragedy in his family the class rallied around
him in support. This same student only the year before had difficulty making friends. The
researcher has observed similar behaviors within her class. The students act like siblings,
sometimes arguing, but usually helping each other succeed. When one student was hospitalized
for minor surgery his classmates volunteered to help him. They checked on him when he was
home recovering, sent him cards and gifts, and assisted him with his work when he returned to
school. The students also took turns carrying his backpack and books to lighten his load. The
class typically played together on recess. The friendships that formed the previous year remained
constant. Many parents noticed that their children felt very secure which they attributed to the
sense of community the children shared. One parent noted that her daughter felt relaxed and
comfortable with her class and teacher and she felt that it made for a better learning environment.
Students learn best when they have a positive attitude toward themselves and their
classmates, and when they enjoy what they are learning. Cooperative learning provides students
that opportunity; it requires that all students have input and all students participate. Cooperative
learning allows students to work together to solve problems, leam academic content, and practice
social skills. There has been consensus among researchers that cooperative learning is an effective
means of increasing achievement, but group goals and individual accountability must be
incorporated into the methods (Slavin, 1989).
20
Johnson and Johnson (1987) report that there are five basic elements that must be included
within each cooperative learning lesson. The first is positive interdependence which requires
students to be responsible for both their own learning and the learning of the other members of
their group. Face to lace promotive interaction is the second element which ensures that all
students in the group have the opportunity to explain what they are learning. The third element,
individual accountability, ensures that all students demonstrate mastery of the assigned work.
Social skills are the fourth element in a cooperative learning lesson. Students must communicate
effectively, resolve conflicts, and provide leadership. The fifth element is group processing. The
groups must stop to assess how well they are doing.
According to Kagan (1990), cooperative learning can improve racial relations. He
conducted a survey using 50 student teachers and 2000 pupils to assess the impact of cooperative
learning on self-esteem and racial relations. He found a tremendous improvement in racial
relations among students as a result of cooperative learning. Students were more intimate with
their teammates regardless of race, therefore there was less self-segregation among students
compared to those classes where traditional teaching methods were used. This suggests that
cooperative learning is true integration because students become friends with their teammates.
Peer relationships are a critical element in the development and socialization of children
and adolescents (Johnson, 1987). Looping is a great tool to foster peer relations. Students who
loop form friendships within the classroom that carry over into lunch, recess, and often to the next
school year.
21
Advantages of Looping
When teachers take their class for a second year they get the opportunity to get to know
their students better. Teacher student relationships are a major factor affecting exceptional
teaching (Wubbel, Levy, & Brekemans, 1997). Teachers are able to identify strengths and
weaknesses, and can make the necessary modifications to instruction, to better meet the needs of
their students.
Looping also allows teachers extra time to evaluate students for referral. Sometimes it
can take an entire year to identify a learning problem. Other academic advantages include a gain
of almost a month at the beginning of the school year, and more opportunities available to tailor
the curriculum to individual student needs. Teachers can use the summer for extended activities
such as reading and problem solving (Grant, 1996).
According to Jan Jubert a first and second grade teacher at Lac Du Flambeau Public
Schools in Lac Du Flambeau, Wl, “ Looping enables you to cover more material, offer hands-on
activities, and design activities using multiple intelligence’s theories that will help children leant
the way they leant best.’’(Rasmussen, 1998). In fact according to Rita Dunn (1997), using
personal learning styles for students is the only way to improve academics. In order to provide
personal learning styles one must know the learner. Looping provides that time for teachers.
A survey given to a group of teachers who have participated in looping indicated the
following:
70% percent of teachers (N=40) feel they use a more positive approach to teaching;
92% believe they knew more about their students the second year;
69% felt their students were more willing to participate voluntarily in class;
85% reported an increase in school pride in general; and
22
84% of teachers felt they had established a more positive relationship with parents. The
teachers also indicated that parental involvement increased in the second year.
The following are the results of a survey given to a group of parents whose children
participated in the Looping Program at Clearcreek Elementary School in Springboro, Ohio.
96% of parents said they would place their child in a Looping Program again;
89% of parents believed their child felt more comfortable about school in general;
79% of parents felt their child benefited academically because of looping.;
65% of parents liked having their child with the same group of students for two years; and
90% of parents believed their child enjoyed being with the same group of students for two
years.
Students looped from third to fourth grade and took the Ohio Proficiency Test during
March of the second year. The scores for looping students were favorable when compared to non
looping students in 4 out of 5 areas and equal in the fifth area. Ninety-three percent of looping
students passed the writing section compared to 86% of non-looping. The reading scores were
close with 88% of looping and 87% of non-looping students passing. The math scores had the
greatest variance with 75% of looping students and 64% of non-looping students passing.
Citizenship had a small variance with 95% of looping and 93% of non-looping students passing.
Science remained constant with 73% of all students passing the section.
Looping is a low risk innovation. It does not greatly alter a school’s organization or
require a large investment of money (Grant, Johnson, & Richardson, 1996). Looping does not
require a great deal of training and it can easily be piloted in a school with few or many teachers.
23
Disadvantages of Looping.
Some parents might be concerned about a teacher/student clash. These concerns should be
addressed early in the first year. If they absolutely cannot be resolved, both parents and teachers
should have the option of removing the child from the class (Grant, 1996). At Clearcreek
Elementary School 95% of students and parents who were given the opportunity to loop choose
to remain with the same teacher. Research studies have demonstrated that the most powerful
force on student learning is a small, intimate, persisting group that provides stability. The size of
the group is not as important as their continuity.
Sometimes teachers are faced with a totally dysfunctional class. This may be due to
immaturity, personality clashes among students, or high numbers of students with special needs in
the same class. Reassignment of students during the second year should be an option for the
teacher if she/he does not see an improvement by November of the first year. Often removing one
or two students can change the chemistry of the entire class.
According to Grant, Johnson, & Richardson (1996), teachers should not be forced to
Loop. When teachers are not enthusiastic about a program they are less likely to see positive
results. Looping is not for every teacher, nor is it for every student. Some teachers prefer to start
with a new class every year, but many of those teachers have not tried looping. A hundred percent
of looping teachers at Clearcreek Elementary said they would loop again. In addition, those
teachers who have looped more than once, report that it becomes easier to loop each time. Most
people don’t like change because they become comfortable with patterns. It is necessary for
administrators to educate their staff about effective school reform.
24
One of the more ambitious models of multiyear teacher-student relationships can be found
in Attleboro, Massachusetts, a K-12 district serving 6,000 students. When they started a pilot
program in 1993 superintendent Joseph Rappa asked 26 elementary and middle school teachers to
stay with a group of students for two years as an experiment. By fall of 1994 the two-year
(Burke, 1996) teacher-student relationship model in Attleboro had 100 percent staff participation
in grades 1-8, and district officials began phasing in a similar arrangement in grades 9 through 12.
Teachers may be concerned about learning a new curriculum This can be offset by team
teaching. Students would have a new teacher for half the day, but still have the security from the
Looping teacher. Teachers would only have half the curriculum and therefore more time to
concentrate on the student’s needs. Some Looping teachers would argue that it is more difficult
to know the learner than the curriculum. Jacoby (1994) notes, some teachers report that after
more than a year together, familiarity with instructional practices, leads to boredom for some
students. Unfortunately, this sentiment can be contagious in such a cohesive group setting, so a
change in the instructor and /or learning environment may benefit the class. Other teachers,
however, find that their students prefer the comfort of the same routines and resist any new
routines that the teacher attempts to introduce in their second year together. Accordingly Hanson
(1995) suggests a group problem arises when student’s ability to cope with change and make
smooth transitions is reduced due to the length of the students’ relationships with one teacher.
Teachers report that students sometimes become excessively attached to them, making it even
more difficult when ultimately there is a change in instructor. In addition, some schools are
concerned that the larger sense of school spirit may be diminished by the multiyear approach, with
its encouragement of a strong feeling of class or team membership. These strong feelings are also
a reason that teachers often advise a looping student to be extra sensitive to new students in the
25
class.
A Looping class tends to be more social because of the familiarity of the class and their
own comfort zone. Many of the special education teachers such as Art, Music, and Gym
sometimes find this a disruption. It is something that needs to be addressed with the class, but it is
possible the benefits far out-weigh the concerns.
The Impact of Looping on Academic Performance
Looping can have a significant impact on students. Many Looping schools have reported
an increase in average daily attendance, a decrease in retention rates, and a decrease in discipline
problems. Programs such as Looping are very effective in establishing student/teacher
relationships, enhancing self-esteem, and maximizing student learning. Many effective programs
can stem from looping because teachers have a better understanding of what works with their
students.
Looping is popular in West Germany schools. The Koln-Holweide system has been
adopted in twenty West Germany schools with great success. Only one percent of the school’s
2,000 students drop out annually as opposed to a national West German average of 14 percent. In
addition, 60 percent, versus 27 percent nationally, score well enough on a high school exit exam
to go on to a four-year college (www.teachnet.com/looping).
Looping allows teachers to put off high stakes decisions such as retention until they get to
know the learner better. Often by the second year the academic concerns have been reduced
because the teacher has discovered the child’s needs and invests the extra time needed to meet
them. The researcher started the second year of the loop knowing who needed a buddy to assist
with organizational skills, which children functioned better in the front of the classroom, who
needed an early conference, and who was ready for extended work.
26
A strong teacher/student relationship is at the heart of Looping and is especially import for
at risk students. A recent study in East Cleveland, Ohio, in an inner-city community described as
an “exaggerated microcosm of urban America’s worst problems,” found that Looping produced
striking achievement test gains for primary grade children (Hampton, Mumford & Bond, 1997).
The researcher concluded that a stable, long-term relationship with one teacher was especially
beneficial for children who lacked stability in their home lives.
More time for teaching translates into a richer curriculum. Having students a second year
allows teachers to expand on concepts taught the first year. One elementary teacher in Golden,
Colorado put off teaching money concepts to her first grade class until the end of the year so
parents and children could practice during the summer. Then re-teaching of the concept at the
beginning of the second year was provided.
Our student population has become more diverse and complex, with many children
coming from single parent homes. Some children come from homes where one or both parents are
chemically dependent, while others come from great poverty. A great number of children struggle
with learning and behavioral disabilities. All these factors affect the way children learn and
succeed in school, therefore a strategy such as Looping may be a viable alternative to traditional
methods.
CHAPTER III
METHODOLOGY
This chapter will provide information concerning the subjects, setting, procedures, and
data collection methods employed during the information gathering stage of the research
investigation.
Subjects
The students in the study were fourth graders, who looped from third to fourth grade with
the researcher. There were 11 females and 9 males between the ages of 9 and 11 years. The
students were all Caucasian, and they ranged from a lower middle class economic background to
upper middle class (See Table 1).
Setting
The study was conducted in a school district located in a small suburb in southwestern
Ohio. The elementary school represents third, fourth, and fifth graders, and a student population
of 740 students. The population is 98% white, I % African American, % % Asian American, and
% % Indian.
Procedure
During the second semester of the academic year the researcher began to monitor
student’s performance and social interactions in the classroom. Since looping was a popular topic
at Clearcreek Elementary it was strongly supported by the principal. Six teachers had already tried
looping and four others, including the researcher, were considering looping from the third to the
fourth grade. Fourth grade is a very important year for students because they are required to take
27
28
the Ohio Proficiency Test. The four third grade teachers decided to loop with their class, and two
fifth grade teachers moved down to fourth grade in order to loop the following year.
A third of the regular classroom teachers were looping or preparing themselves to loop.
At that time the researcher investigated whether there were academic advantages to looping. The
researcher also wanted to know how students behaved in the second year with the same teacher
and classmates.
The researcher used her own class to monitor test scores in three subjects. She also
surveyed the students about their perception of their own behavior and progress in fourth grade.
In addition, students’ parents were surveyed about their feelings about looping.
Although the class had 26 students only 20 remained from the previous year due to
transitional students and the enormous growth in the district. Test scores for the twenty students
were monitored from September to April of their fourth grade year. The tests were in math,
science, and spelling.
The class was quite sociable, since the students were familiar with each other. This
basically set the tone for the year. They started the first day of school like it was the first day back
from a holiday break. Students were happy to see each other and comfortable with the teacher.
Six of the students had above average ability across the curriculum, another eight ranged in
average abilities, and six functioned lower than average in all subject areas.
Data Collection
The researcher taught math, science, and spelling twice a day. She taught her partner’s
class first thing in the morning and her own class starting at 11:00 and continuing until the end of
the school day. In addition to the subjects students also attended lunch, recess and specials, such
as gym, during that portion of the day.
29
Mathematics was taught at 2:15 which was the last subject of the day. During math the
researcher started the day with a problem solving activity, then continued with direct instruction,
and finished with whole group problem solving. Students were assigned homework daily, and
tests were given about twice a grading period. Addison Wesley Textbooks, by Scott Foresman,
were used in class, and standardized tests were provided. There were four different forms of the
test provided by the publisher. Forms A and B were identical in format and included matching,
comprehension, and problem solving. Form A was provided as a study-guide, and form B was
used to assess student’s knowledge of the math concepts. Each chapter took about a three to four
week period. Students were tested after all concepts were taught and a review day was provided.
The researcher provided instructions concerning the test and answered questions pertaining to the
test before the students started. Students were provided with as much time as needed to complete
the test. The test consisted of twenty-five questions worth four points each (See Appendix D).
Partial points and bonus points were also given. Six test were reported.
Science was taught at 11:00 which was the first subject the looping class had with their
own teacher. Lessons in science varied based on the topic. Different textbooks, called Science
Anytime by Harcourt Brace, were provided for each subject. Science curriculum included fossils,
rocks, matter, simple machines, magnetism and electricity, and weather. Each lesson typically
started with a small group activity. When the activity was completed the class read and discussed
follow-up questions in a packet provided by the teacher. Students were required to keep all
information on the current topic in a green folder. At the end of each unit students designed a
cover and collated all materials as a study guide. All science tests were teacher made because of
the variety of teaching materials used during the lessons (See Appendix E). Most tests consisted
of vocabulary and comprehension questions. Points on the test were assessed based on the
30
number of questions or the degree of difficulty. For example vocabulary might be worth five
points each and comprehension worth ten points each. Six tests were giving over the three
grading periods.
The spelling lessons were often taught at 12:45, immediately after lunch recess. Students
were provided with a paragraph, which was developed by the teacher. The paragraph included
fifteen spelling words from the student’s spelling workbook (See Appendix F). During the week
students completed workbook pages from their spelling workbook by McDougal and LittelL
Students were expected to study the entire paragraph. On Friday the researcher dictated the same
paragraph out loud to the students and they were to write it on a piece of paper. Students were
responsible for spelling the entire paragraph correctly, and using the appropriate grammar. Each
spelling word from the spelling workbook was worth four points and all other words were worth
one point each. The words in bold print were from the spelling workbook. Twenty tests were
reported.
A survey was also used so students could reflect on their academic and social progress
compared to their previous school experiences (See Appendix A). In addition parents were
surveyed on their opinion of the looping program and whether they saw academic and social
advantages (See Appendix C).
During April of the second year of the student’s loop, the class was given a questionnaire
to complete in class at 8:30 in the morning. The class was told the survey was for the purpose of
understanding their feelings and thoughts about looping. They were asked to circle ‘‘yes”, “no”, or
“same” to questions comparing that year’s school experience to previous year’s experiences.
Questions 4,5,6,8,10 and 11 were used to interpret student’s perception of their behaviors with
their teacher, and other staff members in the building. Students’ perceptions of their academic
31
progress were assessed by questions 1,2,3,7,13 and 14. Questions 9 and 15 were designed to
assess student’s social skills, and question twelve was used to identify any changes in attendance
patterns.
The entire class was asked to complete the survey. They were not required to put their
name on the paper, but did need to indicate whether they had looped. They were told not to
discuss their responses. The process took about five minutes for all students to finish the survey.
Every student completed the survey(N=20). One student asked for a further explanation of
question one. He was told that “independently” meant on your own.
Students took home a parent survey with a cover letter attached (See Appendix B).
Parents (N~20) were asked to answer four questions in detail concerning their opinion on their
child’s looping experience. The researcher wanted to find out whether parents would loop again,
if they felt the looping program was academically beneficial and if they noticed any changes in
social behaviors that they attributed to looping.
CHAPTER IV
RESULTS
This chapter reports the results of the study. The data include student’s academic
performance in math, science, and spelling, as well as an attitude survey for students, and
an opinion survey for parents.
During the study students were assessed 6 times, an average of twice a grading
period. Academic performance in math increased 10% over time going from an 86%
average on Test / to a 96% average on Test 6. In addition, the minimum test score
increased 30% over that same time, and the gap between high and low scores narrowed
from 42% on the first test to 17% on the sixth test.
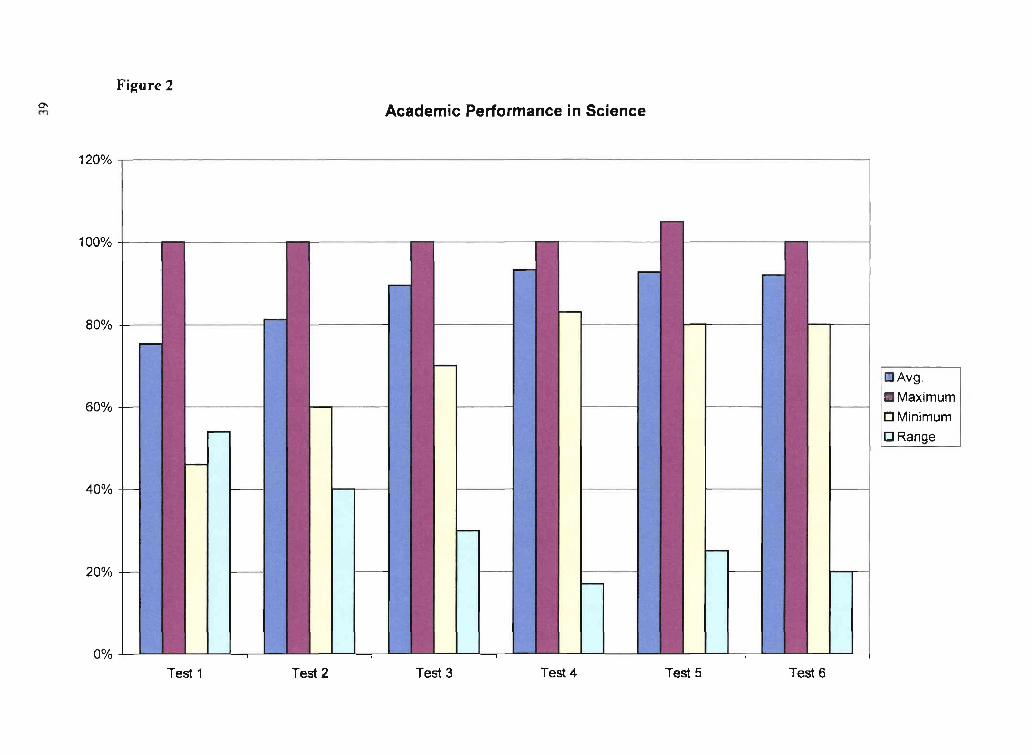
The results for science were similar. Six test were given, an average of two a
grading period. The average scores from Test 1 through Test 6 increased 17% from 75%
to 92%. The minimum score increased 34% over the three grading periods from 46% to
80%. The range varied, taking a sharp decline from 54% on the Test 1 to 17%on Test 4,
and then leveling off at 20%on Test 6.
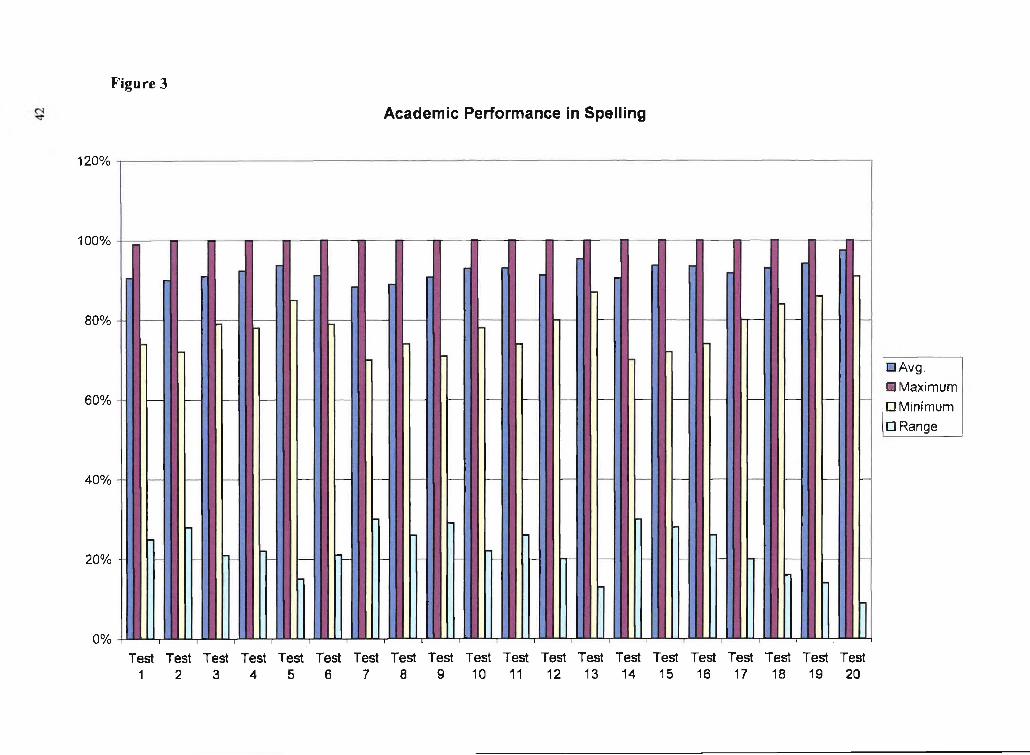
The results for academic performance in spelling, fluctuated through out the three
grading periods. Twenty tests were given during that time, an average of six per grading
period. Students maintained a 90% or better on the first six tests. Test 7 and Test 8
decreased 3% from the first six tests. It should be noted that disruptions in schedules
often negatively impact student’s academic performance. Test 7 was given before a field
trip and Test 8 was on the day of the Halloween Party. Test scores on Test 9 through Test
16 fluctuated 3% from 91% to 94% and gradually increased from 92% to 97% on the last
four tests. Test scores decreased slightly when tests from other subjects were given on the
32
33
same day, for example during the month of March, a spelling and math test were given on
the same day.
After the data was collected the researcher constructed a table to record the
students number, age, sex, average test scores in math, science, and spelling, and
cumulative average (See Table 1).
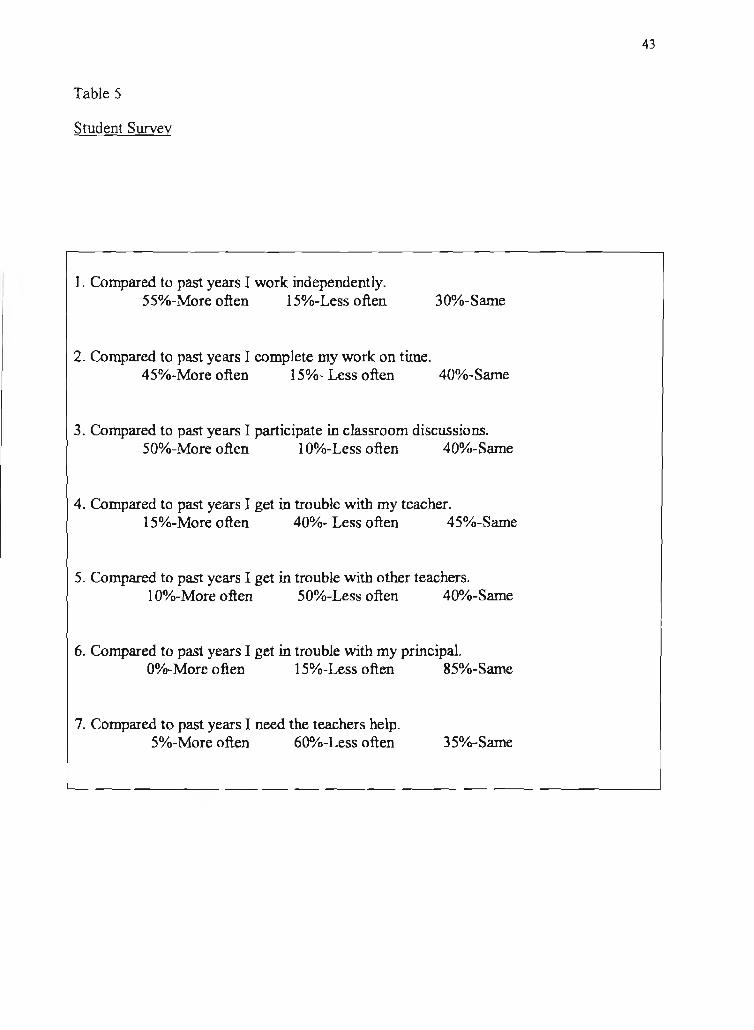
The attitude survey for students (See Table 5) was used to assess student’s
attitudes toward their academic performance and behavior. The survey suggests that the
majority of students felt they benefited academically from looping. For example, 55% of
students felt they worked more independently compared to previous years and 60% felt
they needed the teacher’s help less often. In addition, 45% of students felt they completed
their work on time more frequently, 40% indicated that they studied more often, and 50%
felt they participated in classroom discussions more frequently.
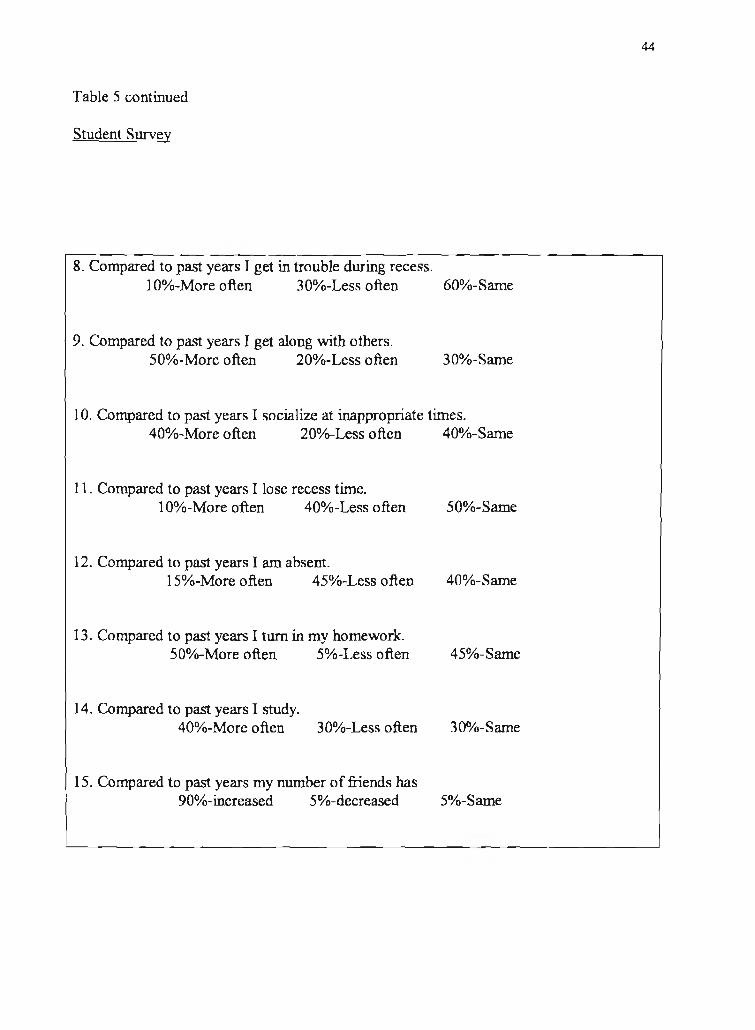
The survey indicated that the students had the same or less disciplinary problems.
Those who did not have discipline problems in the past marked same on the survey. Forty
percent of students indicated they got in trouble with their teacher less often, and another
50% were disciplined by other teachers less often when compared to other school years.
The majority of students had never been disciplined by the principal. However, 15% of
those who had been disciplined by the principal felt it occurred less often compared to
other school years.
An overwhelming majority, 90% felt their number of friends increased, and
another 50% felt they got along better with others compared to previous years. However
40% of students felt they socialized more often at inappropriate times. These numbers
34
seem to suggest that students felt they worked more independently, were disciplined less,
had more friends, but socialized at inappropriate times.
Behavioral concerns were not a major concern during the study. Students
frequently worked with partners or small cooperative groups which assisted in a team
effort, thus reducing individual opportunities for acting inappropriate. If students were off
task, the team members were able to redirect the student back to the task.
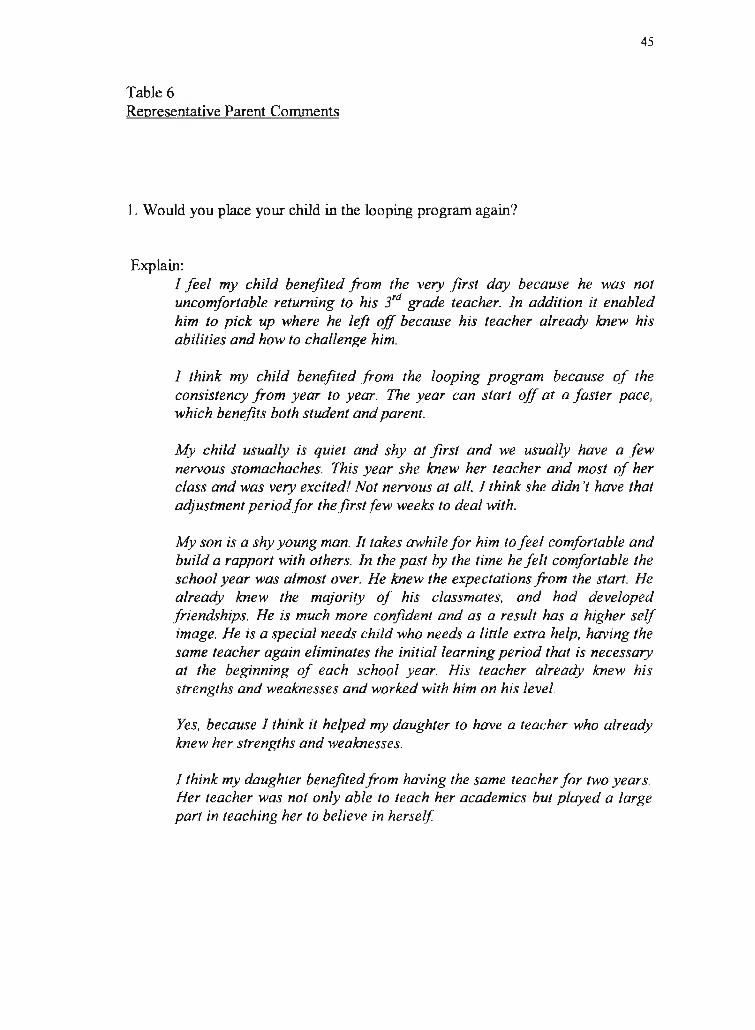
Parents seemed to agree with these results. They indicated an improvement in
organizational skills and daily disciplines. In addition, parents felt that the secure
environment enhanced confidence and self-esteem creating a better learning environment.
Many parents noted less anxiety at the beginning of the school year from their child.
Others felt their child approached the second year with more confidence, and more
willing to take risks.
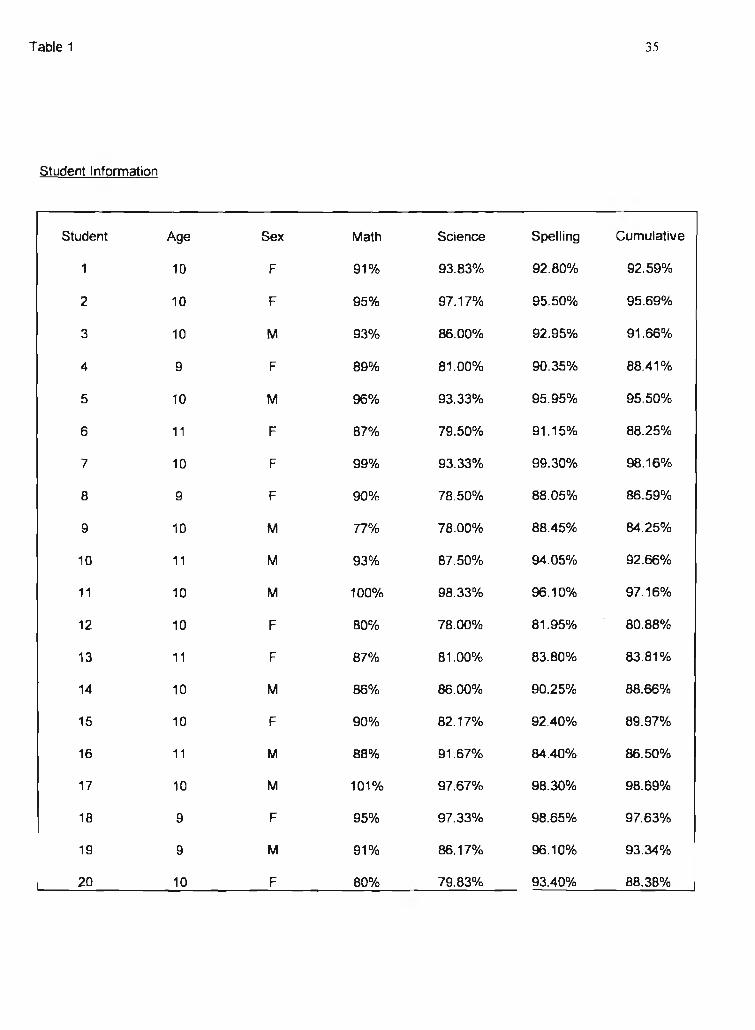
Table 1 35
Student Information
Student Age Sex Math Science Spelling Cumulative
1 10 F 91% 93.83% 92.80% 92.59%
2 10 F 95% 97.17% 95.50% 95.69%
3 10 M 93% 86.00% 92.95% 91.66%
4 9 F 89% 81.00% 90.35% 88.41%
5 10 M 96% 93.33% 95.95% 95.50%
6 11 F 87% 79.50% 91.15% 88.25%
7 10 F 99% 93.33% 99.30% 98.16%
8 9 F 90% 78.50% 88.05% 86.59%
9 10 M 77% 78.00% 88.45% 84.25%
10 11 M 93% 87.50% 94.05% 92.66%
11 10 M 100% 98.33% 96.10% 97.16%
12 10 F 80% 78.00% 81.95% 80.88%
13 11 F 87% 81.00% 83.80% 83.81%
14 10 M 86% 86.00% 90.25% 88.66%
15 10 F 90% 82.17% 92.40% 89.97%
16 11 M 88% 91.67% 84.40% 86.50%
17 10 M 101% 97.67% 98.30% 98.69%
18 9 F 95% 97.33% 98.65% 97.63%
19 9 M 91% 86.17% 96.10% 93.34%
20 10 F 80% 79.83% 93.40% 88.38%
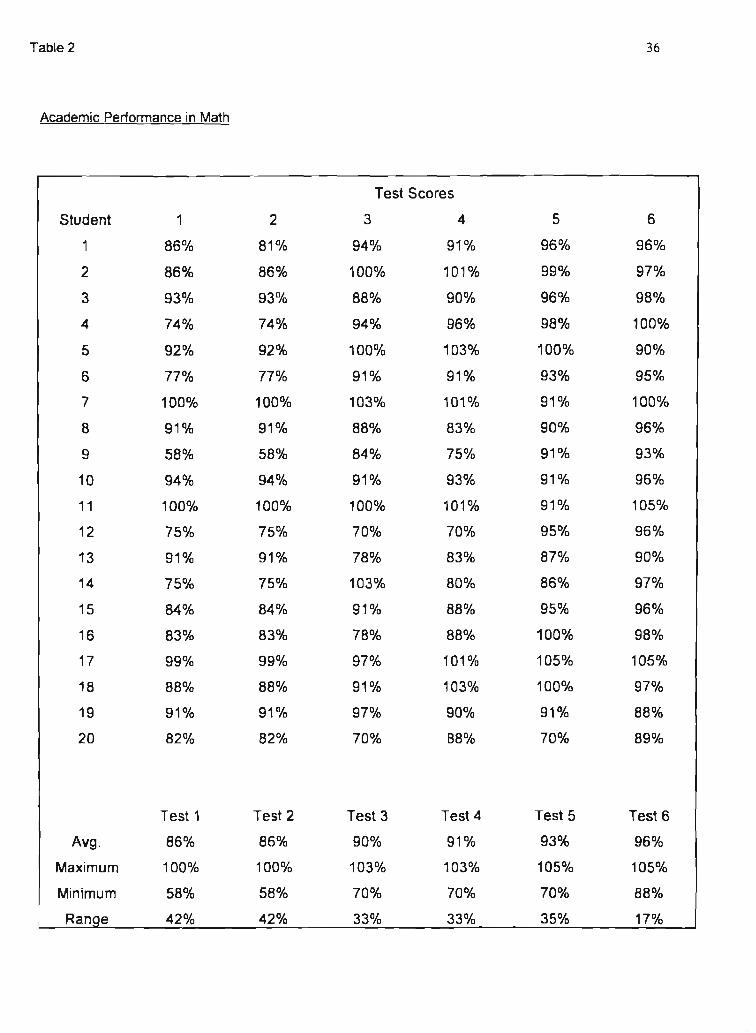
Table 2 36
Academic Performance in Math
Student 1 2
Test Scores
3 4 5 6
1 86% 81% 94% 91% 96% 96%
2 86% 86% 100% 101% 99% 97%
3 93% 93% 88% 90% 96% 98%
4 74% 74% 94% 96% 98% 100%
5 92% 92% 100% 103% 100% 90%
6 77% 77% 91% 91% 93% 95%
7 100% 100% 103% 101% 91% 100%
8 91% 91% 88% 83% 90% 96%
9 58% 58% 84% 75% 91% 93%
10 94% 94% 91% 93% 91% 96%
11 100% 100% 100% 101% 91% 105%
12 75% 75% 70% 70% 95% 96%
13 91% 91% 78% 83% 87% 90%
14 75% 75% 103% 80% 86% 97%
15 84% 84% 91% 88% 95% 96%
16 83% 83% 78% 88% 100% 98%
17 99% 99% 97% 101% 105% 105%
18 88% 88% 91% 103% 100% 97%
19 91% 91% 97% 90% 91% 88%
20 82% 82% 70% B8% 70% 89%
Test 1 Test 2 Test 3 Test 4 Test 5 Test 6
Avg. 86% 86% 90% 91% 93% 96%
Maximum 100% 100% 103% 103% 105% 105%
Minimum 58% 58% 70% 70% 70% 88%
Range 42% 42% 33% 33% 35% 17%
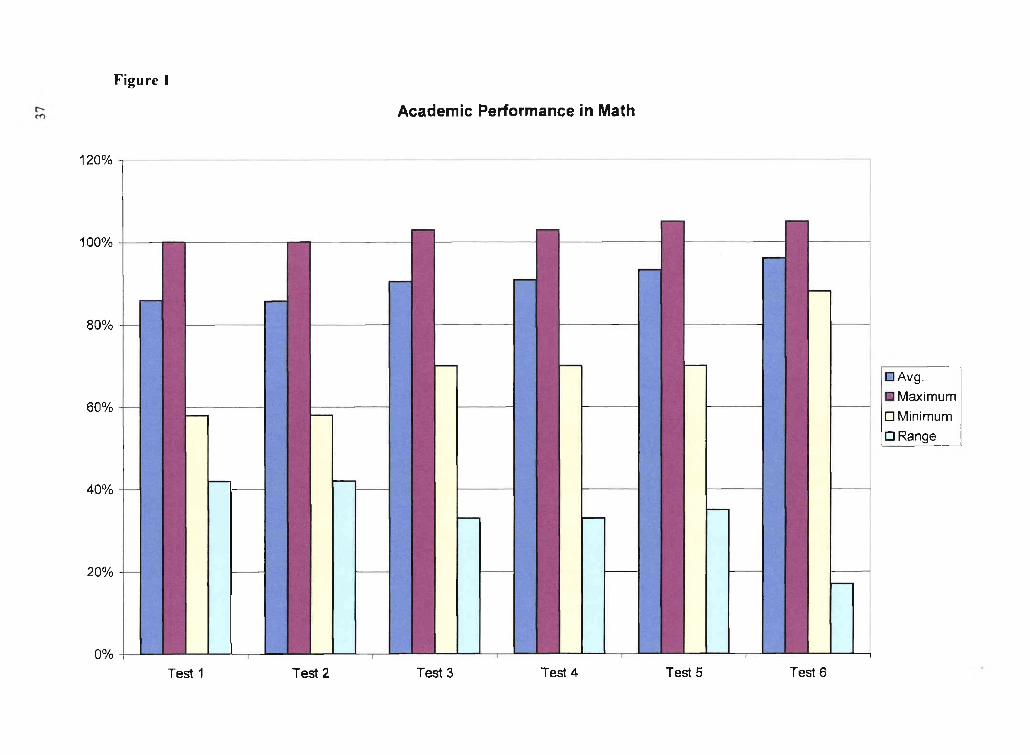
Academic Performance in Math
Figure 1
□ Avg.□ Maximum□ Minimum□ Range
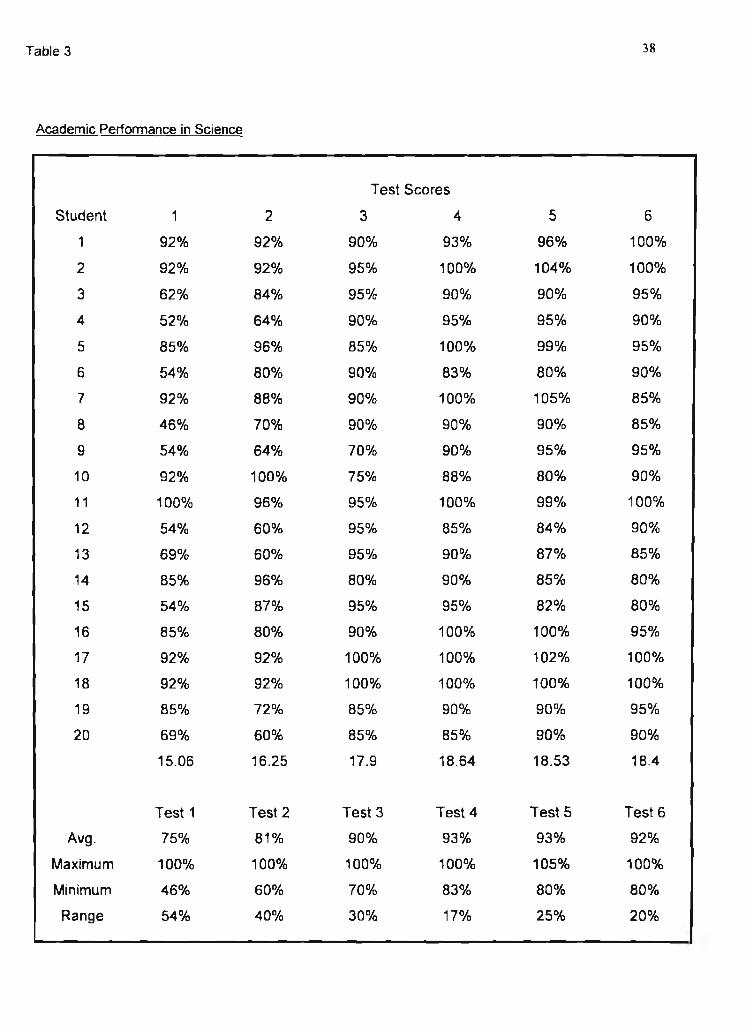
Table 3 38
Academic Performance in Science
Student 1 2
Test Scores
3 4 5 6
1 92% 92% 90% 93% 96% 100%
2 92% 92% 95% 100% 104% 100%
3 62% 84% 95% 90% 90% 95%
4 52% 64% 90% 95% 95% 90%
5 85% 96% 85% 100% 99% 95%
6 54% 80% 90% 83% 80% 90%
7 92% 88% 90% 100% 105% 85%
8 46% 70% 90% 90% 90% 85%
9 54% 64% 70% 90% 95% 95%
10 92% 100% 75% 88% 80% 90%
11 100% 96% 95% 100% 99% 100%
12 54% 60% 95% 85% 84% 90%
13 69% 60% 95% 90% 87% 85%
14 85% 96% 80% 90% 85% 80%
15 54% 87% 95% 95% 82% 80%
16 85% 80% 90% 100% 100% 95%
17 92% 92% 100% 100% 102% 100%
18 92% 92% 100% 100% 100% 100%
19 85% 72% 85% 90% 90% 95%
20 69% 60% 85% 85% 90% 90%
15.06 16.25 17.9 18.64 18.53 18.4
Test 1 Test 2 Test 3 Test 4 Test 5 Test 6
Avg. 75% 81% 90% 93% 93% 92%
Maximum 100% 100% 100% 100% 105% 100%
Minimum 46% 60% 70% 83% 80% 80%
Range 54% 40% 30% 17% 25% 20%
O\Figure 2
Academic Performance in Science
□ Avg.■ Maximum□ Minimum□ Range
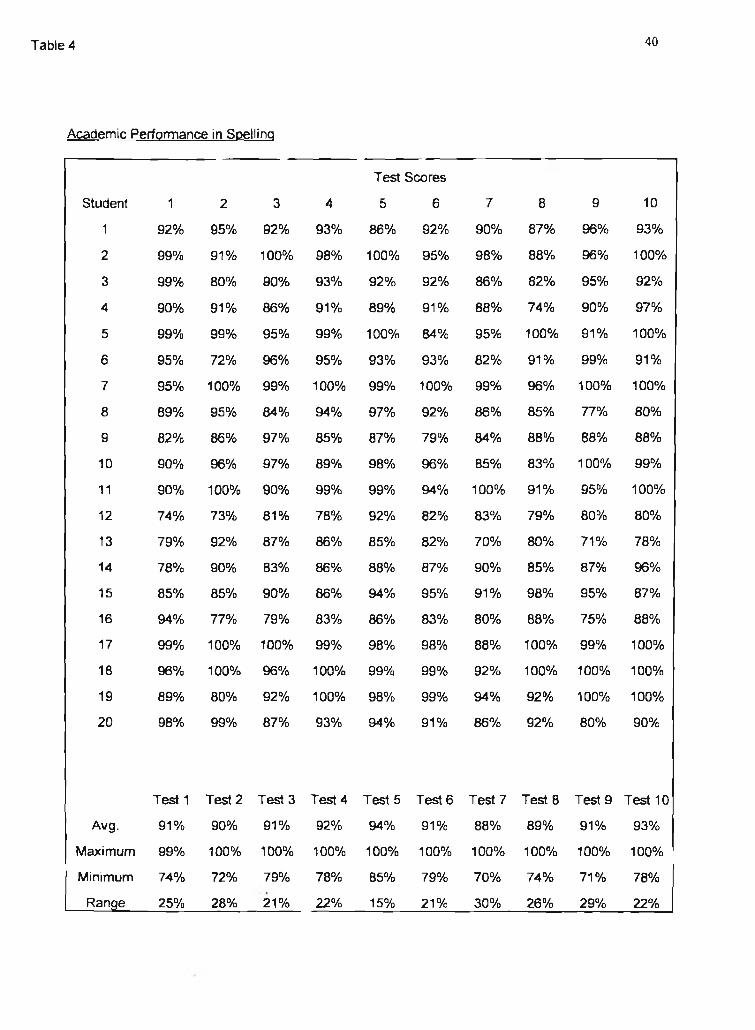
Table 4 40
Academic Performance in Spelling
Test Scores
Student 1 2 3 4 5 6 7 8 9 10
1 92% 95% 92% 93% 86% 92% 90% 87% 96% 93%
2 99% 91% 100% 98% 100% 95% 98% 88% 96% 100%
3 99% 80% 90% 93% 92% 92% 86% 82% 95% 92%
4 90% 91% 86% 91% 89% 91% 88% 74% 90% 97%
5 99% 99% 95% 99% 100% 84% 95% 100% 91% 100%
6 95% 72% 96% 95% 93% 93% 82% 91% 99% 91%
7 95% 100% 99% 100% 99% 100% 99% 96% 100% 100%
8 89% 95% 84% 94% 97% 92% 86% 85% 77% 80%
9 82% 86% 97% 85% 87% 79% 84% 88% 88% 88%
10 90% 96% 97% 89% 98% 96% 85% 83% 100% 99%
11 90% 100% 90% 99% 99% 94% 100% 91% 95% 100%
12 74% 73% 81% 78% 92% 82% 83% 79% 80% 80%
13 79% 92% 87% 86% 85% 82% 70% 80% 71% 78%
14 78% 90% 83% 86% 88% 87% 90% 85% 87% 96%
15 85% 85% 90% 86% 94% 95% 91% 98% 95% 87%
16 94% 77% 79% 83% 86% 83% 80% 88% 75% 88%
17 99% 100% 100% 99% 98% 98% 88% 100% 99% 100%
18 96% 100% 96% 100% 99% 99% 92% 100% 100% 100%
19 89% 80% 92% 100% 98% 99% 94% 92% 100% 100%
20 98% 99% 87% 93% 94% 91% 86% 92% 80% 90%
Test 1 Test 2 Test 3 Test 4 Test 5 Test 6 Test 7 Test 8 Test 9 Test 10
Avg. 91% 90% 91% 92% 94% 91% 88% 89% 91% 93%
Maximum 99% 100% 100% 100% 100% 100% 100% 100% 100% 100%
Minimum 74% 72% 79% 78% 85% 79% 70% 74% 71% 78%
Range 25% 28% 21% 22% 15% 21% 30% 26% 29% 22%
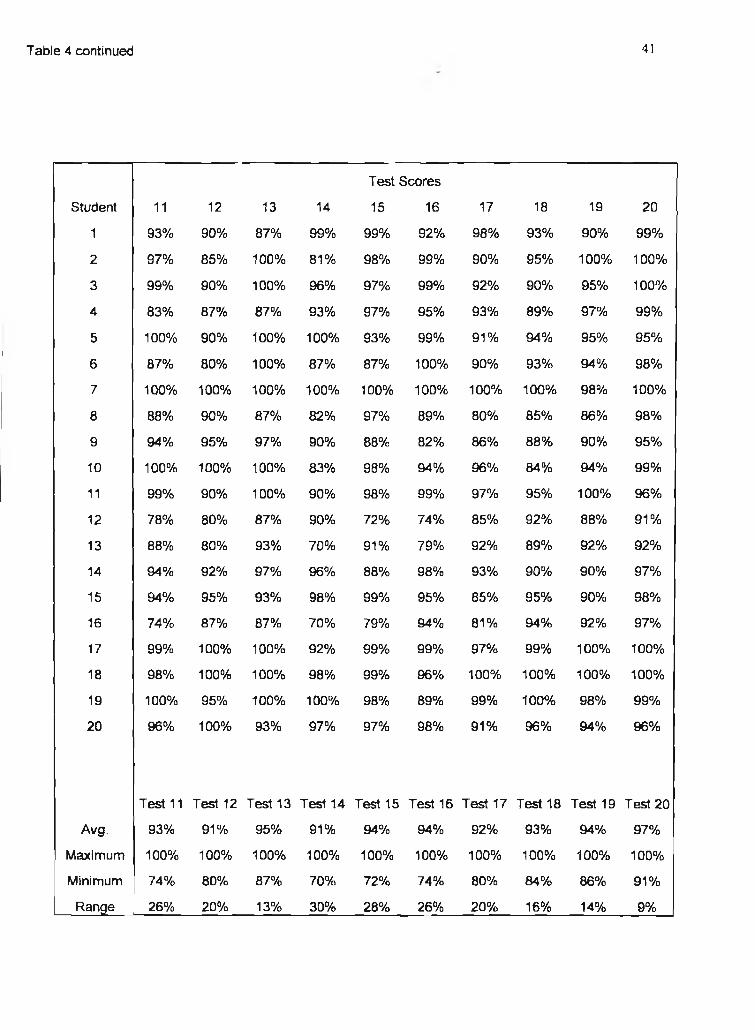
Table 4 continued 41
Student 11 12 13 14
Test Scores
15 16 17 18 19 20
1 93% 90% 87% 99% 99% 92% 98% 93% 90% 99%
2 97% 85% 100% 81% 98% 99% 90% 95% 100% 100%
3 99% 90% 100% 96% 97% 99% 92% 90% 95% 100%
4 83% 87% 87% 93% 97% 95% 93% 89% 97% 99%
5 100% 90% 100% 100% 93% 99% 91% 94% 95% 95%
6 87% 80% 100% 87% 87% 100% 90% 93% 94% 98%
7 100% 100% 100% 100% 100% 100% 100% 100% 98% 100%
8 88% 90% 87% 82% 97% 89% 80% 85% 86% 98%
9 94% 95% 97% 90% 88% 82% 86% 88% 90% 95%
10 100% 100% 100% 83% 98% 94% 96% 84% 94% 99%
11 99% 90% 100% 90% 98% 99% 97% 95% 100% 96%
12 78% 80% 87% 90% 72% 74% 85% 92% 88% 91%
13 88% 80% 93% 70% 91% 79% 92% 89% 92% 92%
14 94% 92% 97% 96% 88% 98% 93% 90% 90% 97%
15 94% 95% 93% 98% 99% 95% 85% 95% 90% 98%
16 74% 87% 87% 70% 79% 94% 81% 94% 92% 97%
17 99% 100% 100% 92% 99% 99% 97% 99% 100% 100%
18 98% 100% 100% 98% 99% 96% 100% 100% 100% 100%
19 100% 95% 100% 100% 98% 89% 99% 100% 98% 99%
20 96% 100% 93% 97% 97% 98% 91% 96% 94% 96%
Test 11 Test 12 Test 13 Test 14 Test 15 Test 16 Test 17 Test 18 Test 19 Test 20
Avg. 93% 91% 95% 91% 94% 94% 92% 93% 94% 97%
Maximum 100% 100% 100% 100% 100% 100% 100% 100% 100% 100%
Minimum 74% 80% 87% 70% 72% 74% 80% 84% 86% 91%
Range 26% 20% 13% 30% 28% 26% 20% 16% 14% 9%
Academic Performance in Spelling
Figure 3
□ Avg.■ Maximum□ Minimum□ Range
43
Table 5
Student Survey
1. Compared to past years I work independently.55%-More often 15%-Less often 30%-Same
2. Compared to past years I complete my work on time.45%-More often 15%-Less often 40%-Same
3. Compared to past years I participate in classroom discussions.50%-More often 10%-Less often 40%-Same
4. Compared to past years I get in trouble with my teacher.15%-More often 40%- Less often 45%-Same
5. Compared to past years I get in trouble with other teachers.10%-More often 50%-Less often 40%-Same
6. Compared to past years I get in trouble with my principal.0%-More often 15%-Less often 85%-Same
7. Compared to past years I need the teachers help.5%-More often 60%-Less often 35%-Same
44
Table 5 continued
Student Survey
8. Compared to past years I get in trouble during recess.10%-More often 30%-Less often 60%-Same
9. Compared to past years I get along with others.50%-More often 20%-Less often 30%-Same
10. Compared to past years I socialize at inappropriate times.40%-More often 20%-Less often 40%-Same
11. Compared to past years I lose recess time.10%-More often 40%-Less often 50%-Same
12. Compared to past years I am absent.15%-More often 45%-Less often 40%-Same
13. Compared to past years I turn in my homework.50%-More often 5%-Less often 45%-Same
14. Compared to past years X study.40%-More often 30%-Less often 30%-Same
15. Compared to past years my number of friends has 90%-increased 5%-decreased 5%-Same
45
Table 6Representative Parent Comments
1. Would you place your child in the looping program again?
Explain:I feel my child benefited from the very first day because he was not uncomfortable returning to his 3rd grade teacher. In addition it enabled him to pick up where he left off because his teacher already knew his abilities and how to challenge him.
I think my child benefited from the looping program because of the consistency from year to year. The year can start off at a faster pace, which benefits both student and parent.
My child usually is quiet and shy at first and we usually have a few nervous stomachaches. This year she knew her teacher and most of her class and was very excited! Not nervous at all. J think she didn’t have that adjustment period for the first few weeks to deal with.
My son is a shy young man. It takes awhile for him to feel comfortable and build a rapport with others. In the past by the time he felt comfortable the school year was almost over. He knew the expectations from the start. He already knew the majority of his classmates, and had developed friendships. He is much more confident and as a result has a higher self image. He is a special needs child who needs a little extra help, having the same teacher again eliminates the initial learning period that is necessary at the beginning of each school year. His teacher already knew his strengths and weaknesses and worked with him on his level.
Yes, because 1 think it helped my daughter to have a teacher who already knew her strengths and weaknesses.
I think my daughter benefited from having the same teacher for two years. Her teacher was not only able to teach her academics but played a large part in teaching her to believe in herself.
46
Table 6 continued
Representative Parent Comments
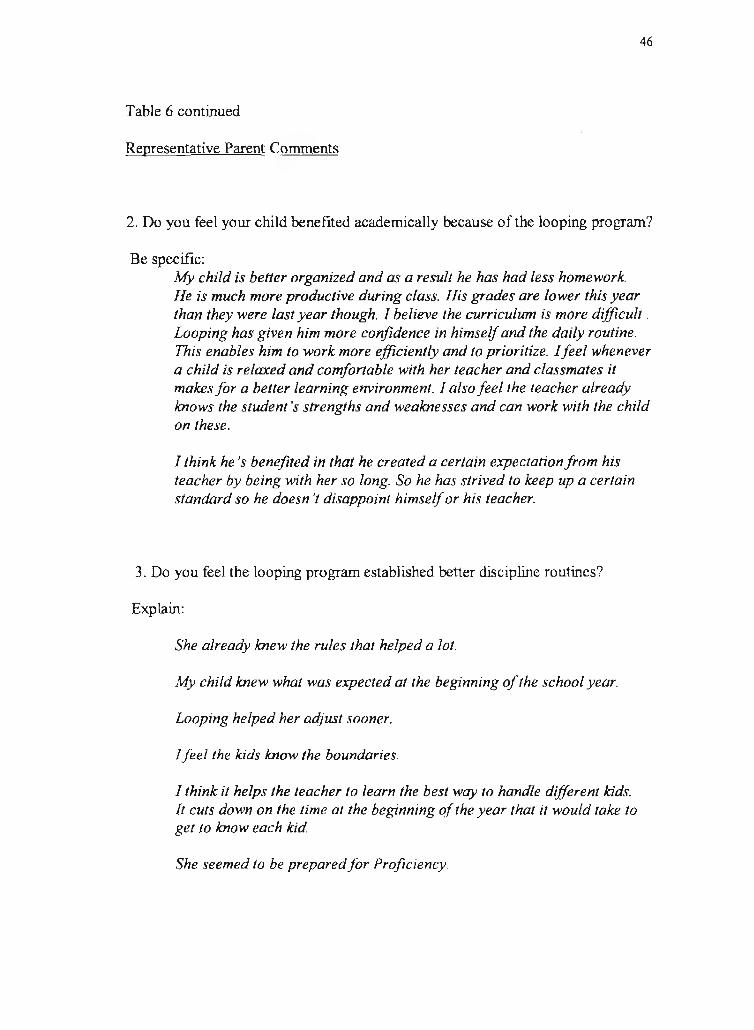
2. Do you feel your child benefited academically because of the looping program?
Be specific:My child is better organized and as a result he has had less homework.He is much more productive during class. His grades are lower this year than they were last year though. 1 believe the curriculum is more difficult. Looping has given him more confidence in himself and the daily routine. This enables him to work more efficiently and to prioritize. Ifeel whenever a child is relaxed and comfortable with her teacher and classmates it makes for a better learning environment. J also feel the teacher already knows the student’s strengths and weaknesses and can work with the child on these.
J think he’s benefited in that he created a certain expectation from his teacher by being with her so long. So he has strived to keep up a certain standard so he doesn’t disappoint himself or his teacher.
3. Do you feel the looping program established better discipline routines?
Explain:
She already knew the rules that helped a lot.
My child knew what was expected at the beginning of the school year.
Looping helped her adjust sooner.
I feel the kids know the boundaries.
J think it helps the teacher to learn the best way to handle different kids. It cuts down on the time at the beginning of the year that it would take to get to know each kid.
She seemed to be prepared for Proficiency.
CHAPTER V
SUMMARY, CONCLUSIONS, RECOMMENDATIONS
This chapter will compare documented research to the findings of this study. The
research questions will be discussed, as well as the limitations of the study, implications
for classroom practice, and suggestions for the future.
Looping has a positive impact on student’s academic progress and social skills
(Grant, Johnson, & Richardson, 1996). Looping provides teachers with more time to get
to know the learner. The research suggests that knowing the learner is the most important
factor affecting academic progress. According to Wubbel, Levy, and Brekemans (1997),
the teacher/student relationship is a major factor affecting exceptional teaching. Salisbury
(1995) found that positive, social relations influence elementary age student’s
intellectual, interpersonal, and emotional development.
Teachers who loop with their class have the opportunity to thoroughly assess
student’s strengths and weaknesses. Looping provides time for teachers to develop
lessons that match their students individual learning styles. Dunn (1997) suggests
curriculum revisions, although necessary, will not improve learning. Neither will
beginning education earlier, expanding academic requirements, increasing teachers
salaries, lengthening the school day, or assigning more homework. The author notes our
system is ineffective because it does not respond to the many different ways in which
healthy, normal, motivated students absorb, process, and retain difficult information and
skills.
47
48
The purpose of this study was to determine the impact of Looping on the
academic and behavioral impact of students. The research questions were.
1. Does looping impact fourth grade students academic performance in math,
science, and spelling?
2. Does looping increase appropriate behavioral and social interactions of students
within the learning context?
The limitations of this study include time and experience. This was the first year
the researcher looped with her class. More experienced with both looping and the fourth
grade curriculum would have enhanced this study. The study was limited to one, fourth
grade class over three grading periods which may not be enough time to thoroughly
assess the impact of looping.
Summary of the results
Extensive research documents that statistically higher test scores, improved
attitudes toward school and learning, and reduced number of discipline problems result
when students are taught through their personal learning strengths (Dunn, 1997;
Salisbury, 1995; Grant, Johnson & Richardson, 1996). Many we 11-documented
experimental studies demonstrate how well the same youngsters learn when they are
taught correctly for them and how poorly they learn when they are taught through
methods that do not complement their styles (Dunn, 1997).
This study showed a positive relationship between looping and academic
progress. Student’s mean test scores increased over the first three grading periods in
math, science, and spelling during their second year with the same teacher. In addition,
student’s behaviors, although social, were less disruptive compared to previous years.
49
Students worked more independently and completed tasks on time more often. The
majority of students believe they have more friends compared to previous years and they
get along with others more often.
Conclusions
This study is important because our student population is becoming more
complex and diverse. International test scores indicate that students in the United States
lack basic knowledge in many core subjects. The at risk population is growing, and our
population is becoming more diverse. Looping is an inexpensive reform, which is simple
to facilitate. It provides students with a sense of security and an opportunity to develop
close relationships. Forming close bonds enhances self-esteem The research suggests
that when students feel good about themselves, they are more willing to take risks and
challenges, which affect their academic success.
To obtain this information the researcher tracked students’ test scores in math,
science, and spelling over three grading periods during the second year with the same
teacher. The test scores gradually increased in both math and science and were sporadic
in spelling. In addition students were given a survey to assess their perception of their
academic progress and behaviors. The majority of students felt they had better study
habits, worked more independently, and got along better with others. Parents were also
surveyed. They felt their children were comfortable in the class and more confident
students, which they felt enhanced the learning environment.
In conclusion, this data suggest that looping enhances academic progress over
time. In addition, students who loop perceive themselves as better prepared academically.
They feel that they have more friends and get along well with others. The researcher
50
believes that if students, teachers, and parents see benefits with looping then educators
everywhere should consider this low risk reform.
Recommendations
The results of this study show that educators, students, and parents regard
Looping as an effective strategy for academic and social development.
The following recommendations are suggested:
1. Looping assists all students in the learning process and it should be introduced
in the early elementary years. .
2. Since Looping appears to have positive impact on educators and students, all
teachers should be trained to Loop. Looping also facilitates collaboration
among educators.
3. Future research should address Looping across populations and environments
(e.g., rural, suburban, and urban) and its impact on learning. Due to the
paucity of research on this topic, it is evident that more investigations are
warranted. Educators are challenged to provide the best educational
opportunities for their students; Looping may be a viable option
REFERENCES
Aragon, J. (1973). Cultural conflict and cultural diversity in education. Cultural
Diversity and the Exceptional Child, 24-31.
Amstrong, T. (1996). A holistic approach to attention deficit disorder.
Educational Leadership 53, 34.
Bosworth, K. (1997). Drug abuse prevention: School-based strategies that work.
ERIC Digest.
Brunner,C.E.& Majewski,W.S.(1990). Mildly handicapped students can succeed
with learning styles. Educational Leadership, 48 (2), 21-23.
Burke, D.L. Looping: Adding time, strengthening relationships. ERIC Digest.
Burke, D.L. (1996). Multi-year teacher/student relationships are a long overdue
arrangement. Phi Delta Kappan, 360-361
Checkley, K. (1995). Multiyear education: Reaping the benefits of “Looping.”
Education Update, 37 (8), 2-4.
Dunn, R. (1997). The goals and track record of multicultural education.
Educational Leadership, 54, 74-77.
Garbarino, J. (1997). Educating children in a socially toxic environment.
Educational Leadership, 54, 12-16.
Grant, J., Johnson, B., & Richardson, I. (1996). The Looping handbook.
Peterborough, New Hampshire: Springs Books.
Grant, J., Johnson, B., & Richardson, I. (1996). Multiage Q&A: 101 practical
51
52
Hampton, F.M., Mumford, D.A., & Bond, L. (1997). Enhancing urban student
achievement through multi-year assignment and family oriented school practice. Spectrum,
15 (2), 7-15
Hanson, B.J. (1995). Getting to know your multiyear teaching. Educational
Leadership, 54, 42-43.
Haslinger, J., Patricia, K., and O’Lare, L. (1996). Countering absenteeism,
anonymity, and apathy. Educational Leadership, 47-49.
Jacoby, D. (1994). Twice the learning and twice the love. Teaching Pre K-8, 24
(6), 58-59.
Johnson, D.W., & Johnson, R. (1987). Learning together and alone: Cooperative,
competitive, and individualistic learning. Englewood Cliffs, NJ: Prentice-Hall.
Johnson, D.W., & Johnson, R. (1989). Toward a cooperative effort: A response to
Slavin Educational Leadership 47 (7), 80-81.
Kagan, S. (1990). The structural approach to cooperative learning. Educational
Leadership 47, 12-15
Kenney, A. (1987). Teen pregnancy: An issue for schools. Phi Delta Kappan, 728
736.
Leisman, G., (1976). Basic visual process and learning disability. Springfield,
Illinois: Charles C.Thomas.
Lewis, C.C., Schaps, E., & Watson, M.S. (1996). The caring classroom academic
edge. Educational Leadership 54, 16-21.
Lewis, R. & Doorlag, D.H.(1991). Teaching special students in the mainstream
(3rd ed.) New York: Merrill.
53
Miringoff, M. (1994). Monitoring the social well being of the nation: The Index of
Social Health. Tarrytown, N.y.: Fordham Institute for Social Policy.
Nelson, C.M. (1985). An introduction to special educations (2nd ed.) Boston:
Little Brown.
O’Rourke,R. (1990). Recapturing hope: Elementary school support groups for
children of alcoholics. Elementary School Guidance and Counseling, 25 (2), 107-115.
Rasmussen, K. (1996). Looping: Discovering the benefits of multiyear teaching.
Education Update, 40 (2), 2-4.
Rimm, S.B. (1997). An underachievement epidemic. Educational Leadership, 54.
18-32.
Sagor, IL (1996). Building resiliency in students. Educational Leadership, 54, 38
43.
Salisbury, C. (1995). Strategies that promote social relations among elementary
students with and without severe disabilities in inclusive schools. Exceptional Children, 62
(2) 125-137.
Slavin, R.E. (1989). Cooperative learning and student achievement. Educational
Leadership, 45 (21,31-33.
Smith, P. (1995). Diversity and the at risk student. Boston: Allyn Bacon.
Sobol, T. (1990). Understanding diversity. Educational Leadership, 48, (3), 27-30.
Stedman, L.C. (1997). International achievement differences: An assessment of a
new perspective. Educational Researcher, 26 (3), 4-13.
Woodring, P. (1987). A new approach to the drop out problem. Phi Delta Kappan,
70, 468-469
54
Wubbels, T., Levy, J., & Brekemans, M. (1997). Paying attention to
relationships. Educational leadership 54, 82-86.
APPENDICES
55

APPENDIX A
56
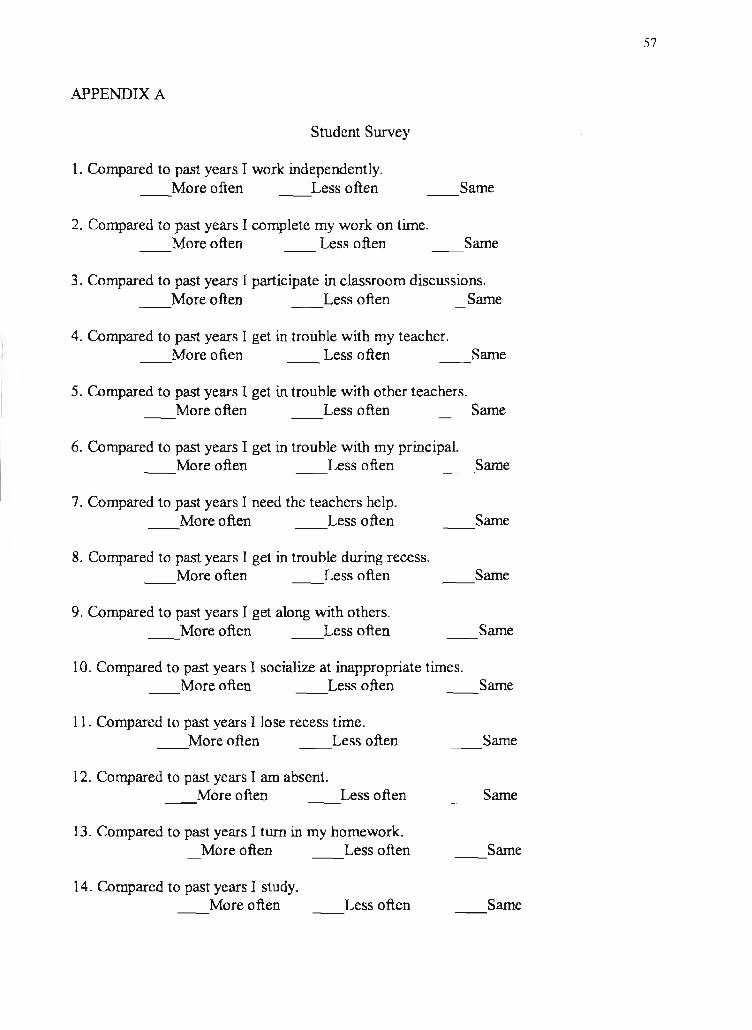
57
APPENDIX A
Student Survey
1. Compared to past years I work independently.____ More often ____ Less often ____ Same
2. Compared to past years I complete my work on time.____ More often ____ Less often ____ Same
3. Compared to past years I participate in classroom discussions.____ More often ____ Less often ____ Same
4. Compared to past years I get in trouble with my teacher.____ More often ____ Less often ____ Same
5. Compared to past years I get in trouble with other teachers.____ More often ____ Less often ____ Same
6. Compared to past years I get in trouble with my principal.____ More often Less often ____ Same
7. Compared to past years I need the teachers help.____ More often ____ Less often ____ Same
8. Compared to past years I get in trouble during recess.____ More often ____ Less often ____ Same
9. Compared to past years I get along with others.____ More often ____ Less often ____ Same
10. Compared to past years I socialize at inappropriate times.____ More often ____ Less often ____ Same
11. Compared to past years I lose recess time.____ More often____ Less often ____ Same
12. Compared to past years I am absent.____ More often ____ Less often ____ Same
13. Compared to past years I turn in my homework.____ More often ____ Less often ____ Same
14. Compared to past years I study.More often Less often Same
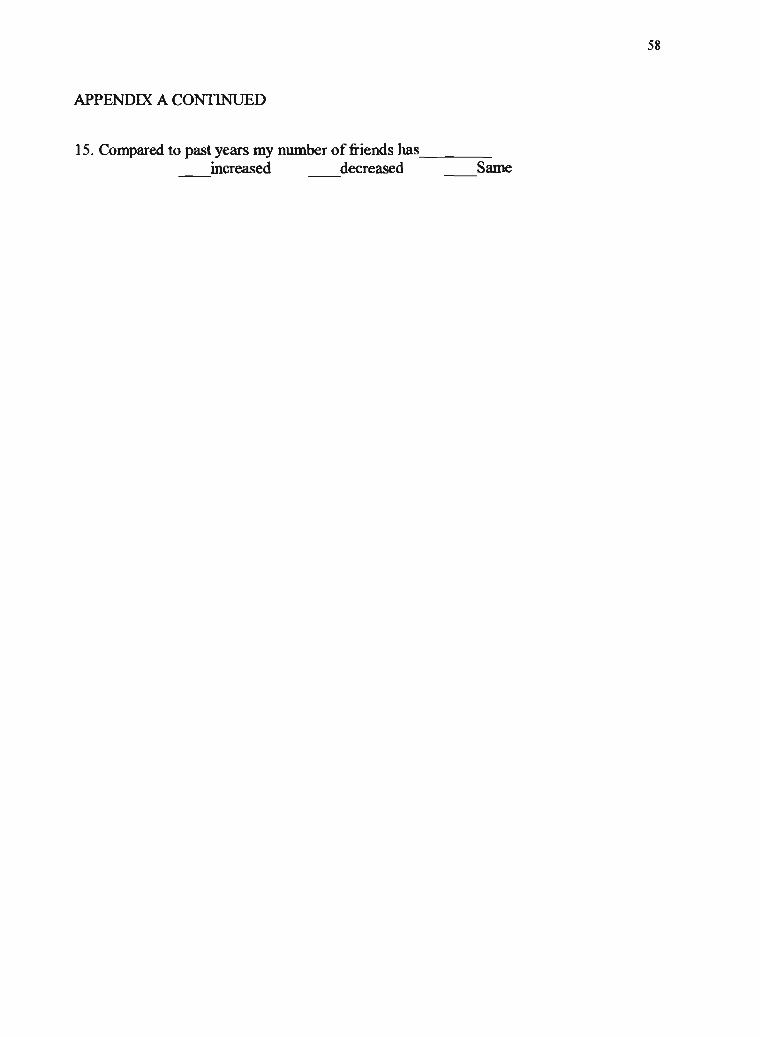
58
APPENDIX A CONTINUED
15. Compared to past years my number of friends has increased decreased Same

APPENDIX B
59
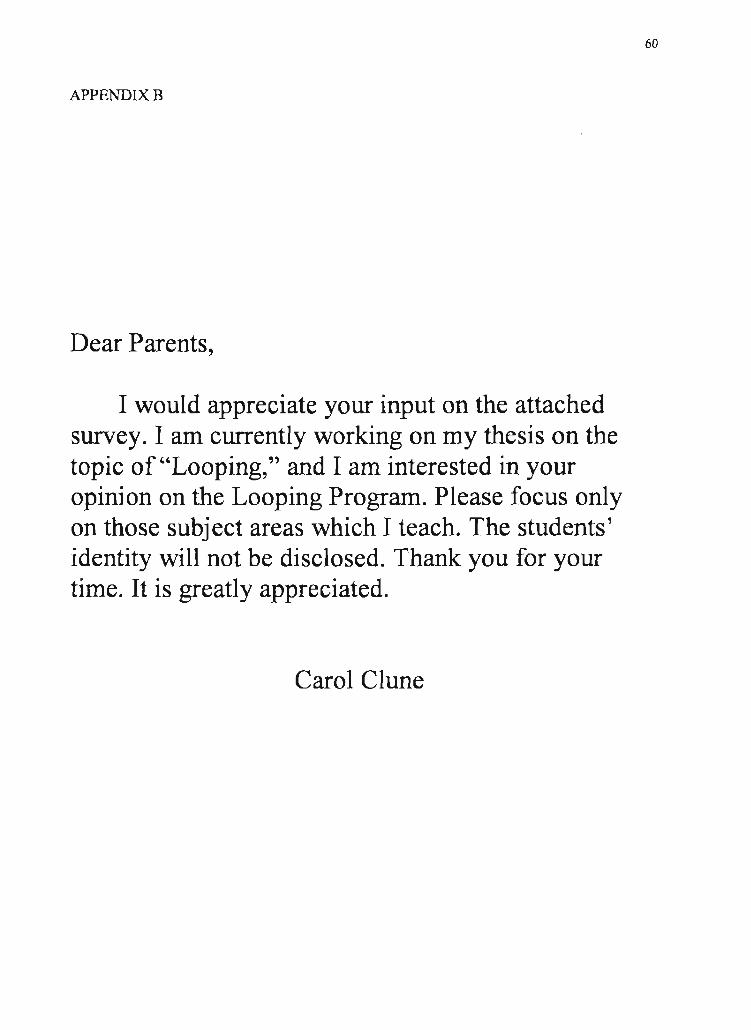
60
APPENDIX B
Dear Parents,
I would appreciate your input on the attached survey. I am currently working on my thesis on the topic of “Looping,” and I am interested in your opinion on the Looping Program. Please focus only on those subject areas which I teach. The students’ identity will not be disclosed. Thank you for your time. It is greatly appreciated.
Carol Clune

APPENDIX C
61
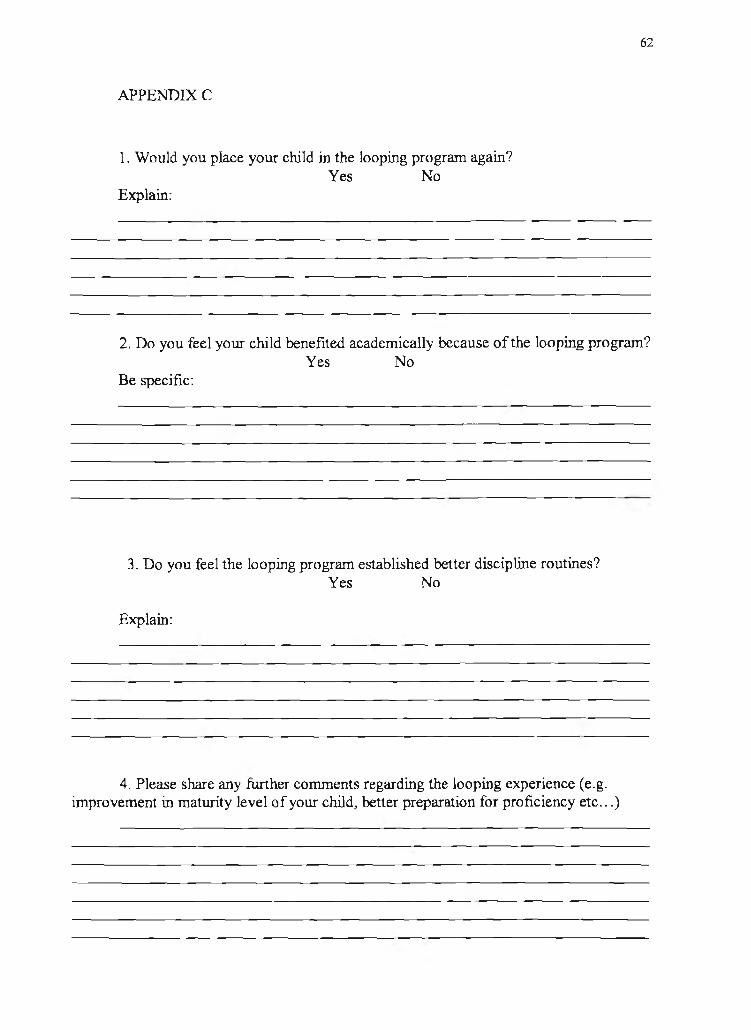
62
APPENDIX C
1. Would you place your child in the looping program again?Yes No
Explain:
2. Do you feel your child benefited academically because of the looping program? Yes No
Be specific:
3. Do you feel the looping program established better discipline routines? Yes No
Explain:
4. Please share any further comments regarding the looping experience (e.g. improvement in maturity level of your child, better preparation for proficiency etc...)

APPENDIX D
63
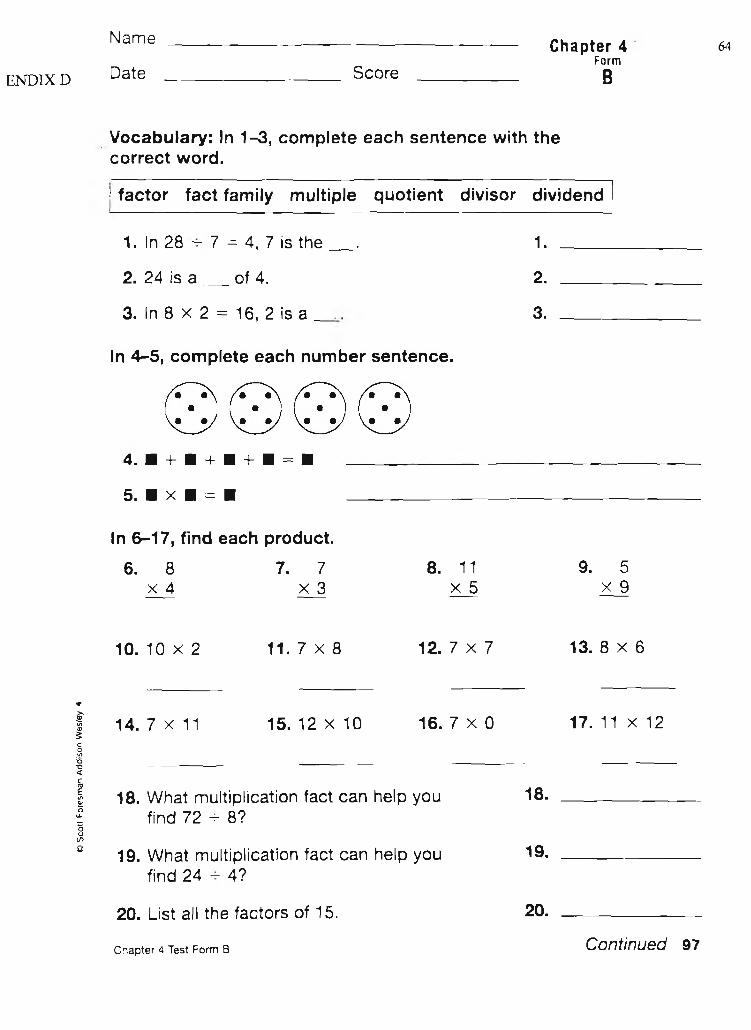
64
ENDIXD
Name ____________________________________
Date __________________ Score __________Chapter 4
FormB
Vocabulary: In 1-3, complete each sentence with the correct word.
! factor fact family multiple quotient divisor dividend
1. In 28 -7- 7 = 4, 7 is the__ . 1. ________________
2. 24 is a ___ of 4. 2. ________________
3. In 8 x 2 = 16, 2 is a__3. ______________________________________
5. ■ x ■ = ■
In 6-17, find each product.
6. 8 7. 7 8.x 4 X 3
© S
cot I F
ores
man
Add
ison
Wes
/ey 4
10.
14.
18.
19.
10x2 11.7X8 12.
7x11 15. 12 x 10 16.
What multiplication fact can help you find 72 - 8?
What multiplication fact can help youfind 24 4?
20. List all the factors of 15.
11 x 5
7x7
7x0
18.
19.
20.
9. 5x 9
13. 8 x 6
17. 11 x 12
Chapter 4 Test Form B Continued 97

APPENDIX E
65
J
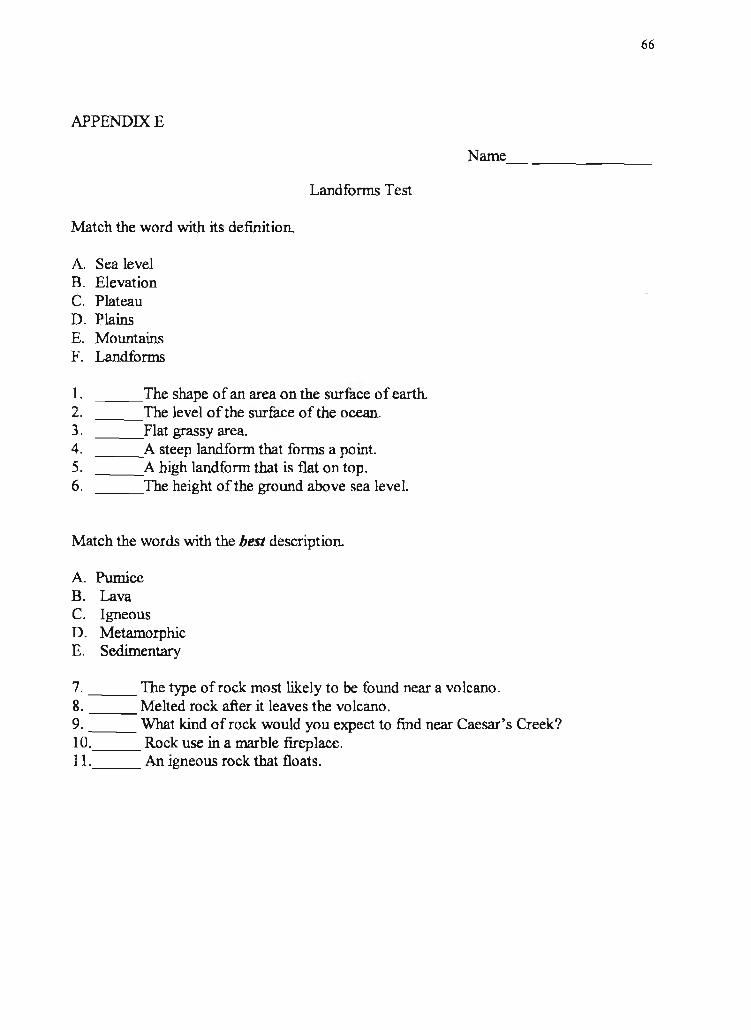
66
APPENDIX E
Name___________________
Land forms Test
Match the word with its definition.
A. Sea levelB. ElevationC. PlateauD. PlainsE. MountainsF. Landforms
1. ______ The shape of an area on the surface of earth.2. ______ The level of the surface of the ocean.3. ______ Flat grassy area.4. ______ A steep landform that forms a point.5. ______ A high landform that is flat on top.6. ______ The height of the ground above sea level.
Match the words with the best description.
A. PumiceB. LavaC. IgneousD. MetamorphicE. Sedimentary
7. ______ The type of rock most likely to be found near a volcano.8. ______ Melted rock after it leaves the volcano.9. ______ What kind of rock would you expect to find near Caesar’s Creek?10. ______ Rock use in a marble fireplace.11. ______ An igneous rock that floats.

APPENDIX F
67
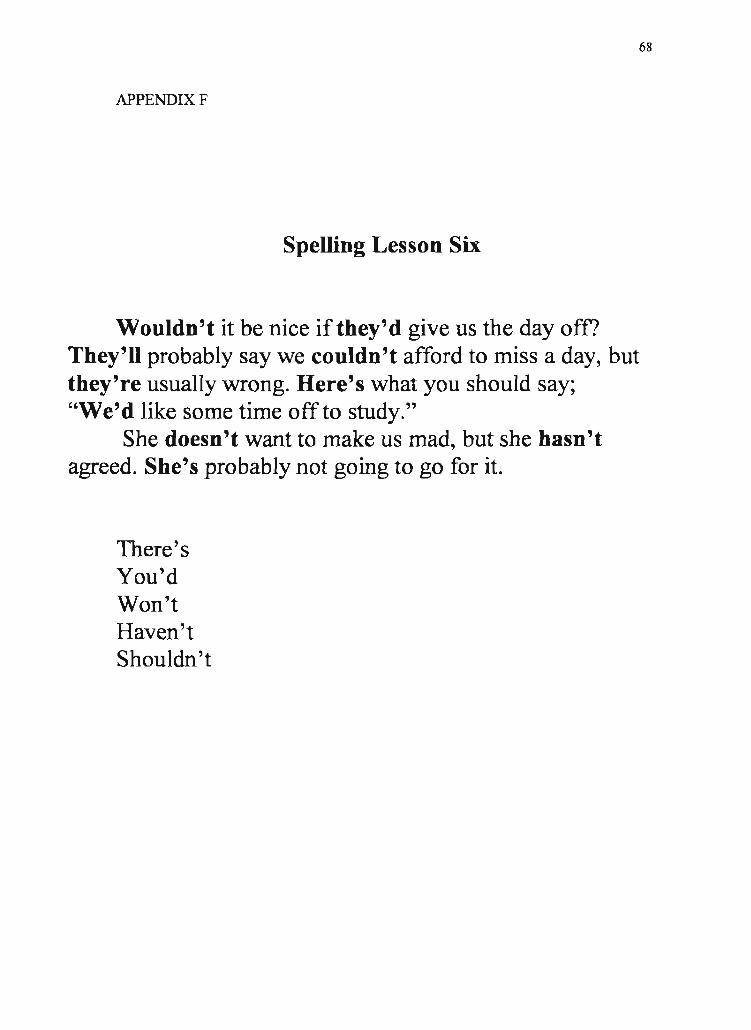
68
APPENDIX F
Spelling Lesson Six
Wouldn’t it be nice if they’d give us the day off? They’ll probably say we couldn’t afford to miss a day, but they’re usually wrong. Here’s what you should say; “We’d like some time off to study.”
She doesn’t want to make us mad, but she hasn’t agreed. She’s probably not going to go for it.
There’sYou’dWon’tHaven’tShouldn’t