Embed Size (px)
Citation preview

1 MARCH 2003 849R O W E L L
The Impact of Mediterranean SSTs on the Sahelian Rainfall Season
DAVID P. ROWELL
Met Office, Hadley Centre for Climate Prediction and Research, Bracknell, Berkshire, United Kingdom
(Manuscript received 18 September 2001, in final form 7 August 2002)
ABSTRACT
A variety of regional and global sea surface temperature (SST) patterns are known to affect interannual todecadal variations of summer rainfall over the Sahel, and for most of these patterns considerable progress hasbeen made towards understanding their influence. However, a possible link between Mediterranean SSTs andSahelian rainfall has yet to be studied, and so the aim of this paper is to use observational and atmosphericgeneral circulation model (AGCM) data to confirm and understand this relationship.
In years when the Mediterranean is warmer than average, it is shown that the Sahel tends to be wetter thannormal, whereas in cool Mediterranean years it tends to be drier. The observed data also demonstrate that duringthe last five decades (1947–96) the strength of this impact has been roughly equal to that of Pacific SSTs, anda little less than that of the tropical Atlantic. Moreover it is most apparent on timescales of a decade or more,although it does also exert some influence at shorter timescales. It is also speculated that the Mediterranean maypartly explain the impact of an interhemispheric pattern of SST anomalies found in earlier studies.
Analysis of the AGCM data provides the most convincing evidence that the observed relationship is indeeddue to an influence of the Mediterranean on the Sahel. In particular, a pair of idealized experiments forced bywarmer (colder) than average SSTs in the Mediterranean, and climatological SSTs elsewhere, produce a clearand significant summer rainfall response over the Sahel. Data from these experiments are then used to explainthis impact. If SSTs in the Mediterranean are warmer than average, then local evaporation is enhanced, and themoisture content of the lower troposphere increases. This additional moisture is advected southward across theeastern Sahara by the mean flow, leading to enhanced low-level moisture convergence over the Sahel, whichfeeds enhanced rainfall. This is then amplified by four positive feedback mechanisms: a more rapid influx ofmoisture from the tropical Atlantic triggered by enhanced convective heating, a reduced outflow of moisturefrom the midlevel African easterly jet, an enhanced hydrological cycle, and a larger rainfall contribution fromAfrican easterly waves.
1. Introduction
It is well known that interannual and decadal fluc-tuations of seasonal rainfall over the semiarid Sahel arelargely affected by variations of global and regional seasurface temperature (SST) patterns. It has also been sug-gested that these may be amplified by land surface feed-backs, although the magnitude and mechanistic time-scales involved (from days to decades) remain a topicof some debate. The underlying SST variations includeanomalies in the tropical Atlantic (e.g., Lamb 1978;Hastenrath 1990; Vizy and Cook 2001); the central andeast Pacific (e.g., Folland et al. 1991; Janicot et al. 1996;Rowell 2001, hereafter R01); the Indian Ocean (e.g.,Palmer 1986; Shinoda and Kawamura 1994), particu-larly its gradient to the west Pacific (R01); the Medi-terranean (Ward 1994; Rowell et al. 1995; R01); and aninterhemispheric contrast of SST anomalies (e.g., Fol-
Corresponding author address: Dr. David P. Rowell, Met Office,Hadley Center for Climate Prediction and Research, London Road,Bracknell, Berkshire RG12 2SY, United Kingdom.E-mail: [email protected]
land et al. 1986, 1991; Rowell et al. 1995) that mayinclude some of the foregoing regional anomalies. Formany of these SST patterns, the cited studies, and manyothers, have proposed plausible mechanisms by whichthey may affect seasonal rainfall over the Sahel. How-ever, for the Mediterranean link and the interhemispher-ic link, such detailed analyses have yet to be performed.
The purpose of this paper is to examine the associ-ation between Mediterranean SSTs and Sahelian rain-fall. Two key issues, among others, are addressed. Oneis whether their observed correlation actually representsan influence of the Mediterranean on the Sahel, ratherthan merely some external influence on both regions,or even a Sahelian impact on Mediterranean climate.Since this Mediterranean impact will in fact be con-firmed, a second issue then is to determine the mech-anism for this regional teleconnection. These are im-portant questions for a region that is highly sensitive tothe vagaries of the climate system; for example, theanswers should increase our understanding of seasonalprediction for the Sahel and also feed into studies offuture climate change over the region.
The paper is arranged as follows. In section 2 ob-
850 VOLUME 16J O U R N A L O F C L I M A T E
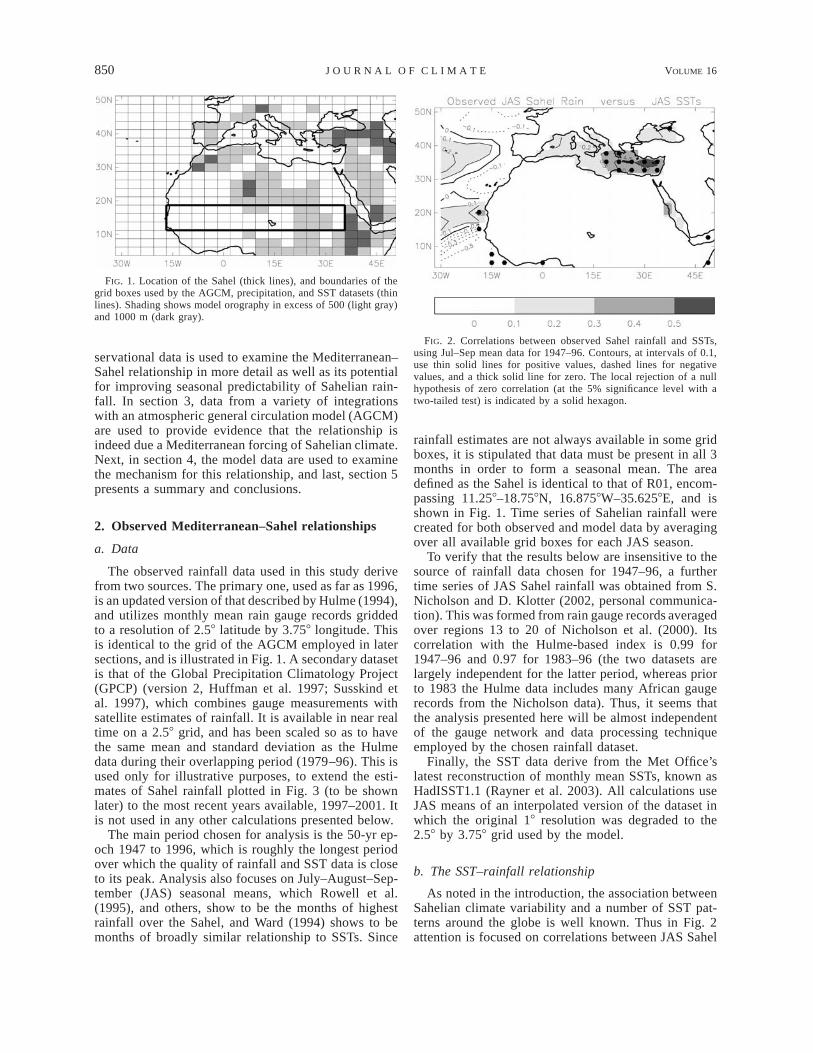
FIG. 1. Location of the Sahel (thick lines), and boundaries of thegrid boxes used by the AGCM, precipitation, and SST datasets (thinlines). Shading shows model orography in excess of 500 (light gray)and 1000 m (dark gray).
FIG. 2. Correlations between observed Sahel rainfall and SSTs,using Jul–Sep mean data for 1947–96. Contours, at intervals of 0.1,use thin solid lines for positive values, dashed lines for negativevalues, and a thick solid line for zero. The local rejection of a nullhypothesis of zero correlation (at the 5% significance level with atwo-tailed test) is indicated by a solid hexagon.
servational data is used to examine the Mediterranean–Sahel relationship in more detail as well as its potentialfor improving seasonal predictability of Sahelian rain-fall. In section 3, data from a variety of integrationswith an atmospheric general circulation model (AGCM)are used to provide evidence that the relationship isindeed due a Mediterranean forcing of Sahelian climate.Next, in section 4, the model data are used to examinethe mechanism for this relationship, and last, section 5presents a summary and conclusions.
2. Observed Mediterranean–Sahel relationships
a. Data
The observed rainfall data used in this study derivefrom two sources. The primary one, used as far as 1996,is an updated version of that described by Hulme (1994),and utilizes monthly mean rain gauge records griddedto a resolution of 2.58 latitude by 3.758 longitude. Thisis identical to the grid of the AGCM employed in latersections, and is illustrated in Fig. 1. A secondary datasetis that of the Global Precipitation Climatology Project(GPCP) (version 2, Huffman et al. 1997; Susskind etal. 1997), which combines gauge measurements withsatellite estimates of rainfall. It is available in near realtime on a 2.58 grid, and has been scaled so as to havethe same mean and standard deviation as the Hulmedata during their overlapping period (1979–96). This isused only for illustrative purposes, to extend the esti-mates of Sahel rainfall plotted in Fig. 3 (to be shownlater) to the most recent years available, 1997–2001. Itis not used in any other calculations presented below.
The main period chosen for analysis is the 50-yr ep-och 1947 to 1996, which is roughly the longest periodover which the quality of rainfall and SST data is closeto its peak. Analysis also focuses on July–August–Sep-tember (JAS) seasonal means, which Rowell et al.(1995), and others, show to be the months of highestrainfall over the Sahel, and Ward (1994) shows to bemonths of broadly similar relationship to SSTs. Since
rainfall estimates are not always available in some gridboxes, it is stipulated that data must be present in all 3months in order to form a seasonal mean. The areadefined as the Sahel is identical to that of R01, encom-passing 11.258–18.758N, 16.8758W–35.6258E, and isshown in Fig. 1. Time series of Sahelian rainfall werecreated for both observed and model data by averagingover all available grid boxes for each JAS season.
To verify that the results below are insensitive to thesource of rainfall data chosen for 1947–96, a furthertime series of JAS Sahel rainfall was obtained from S.Nicholson and D. Klotter (2002, personal communica-tion). This was formed from rain gauge records averagedover regions 13 to 20 of Nicholson et al. (2000). Itscorrelation with the Hulme-based index is 0.99 for1947–96 and 0.97 for 1983–96 (the two datasets arelargely independent for the latter period, whereas priorto 1983 the Hulme data includes many African gaugerecords from the Nicholson data). Thus, it seems thatthe analysis presented here will be almost independentof the gauge network and data processing techniqueemployed by the chosen rainfall dataset.
Finally, the SST data derive from the Met Office’slatest reconstruction of monthly mean SSTs, known asHadISST1.1 (Rayner et al. 2003). All calculations useJAS means of an interpolated version of the dataset inwhich the original 18 resolution was degraded to the2.58 by 3.758 grid used by the model.
b. The SST–rainfall relationship
As noted in the introduction, the association betweenSahelian climate variability and a number of SST pat-terns around the globe is well known. Thus in Fig. 2attention is focused on correlations between JAS Sahel

1 MARCH 2003 851R O W E L L
FIG. 3. Time series of rainfall averaged over the Sahel for 1947–2001 (black bars) and the Mediterranean SST index definedin section 2b for 1947–99 (gray bars). All data are Jul–Sep means, and are standardized with respect to 1947–96. Rainfall dataare from the Hulme dataset for 1947–96 and the GPCP dataset for 1997–2001.
rainfall and JAS SSTs in the Mediterranean region; localsignificance is assessed following von Storch andZwiers (1999), for example, and taking account of serialcorrelation (Folland et al. 1991). Positive values appearthroughout the Mediterranean, and in the east achievelocal significance, peaking at r 5 0.57. Thus a warmingof the Mediterranean is often (but not always) associatedwith enhanced Sahel rainfall.
In order to examine this relationship in more detail,we define an index of those aspects of the Mediterraneanthat seem most important from a Sahelian point of view.This is achieved by simply averaging each year’s JASSST data over the Mediterranean grid boxes shown tobe significant in Fig. 2.
First, we assess the strength of the Mediterranean–Sahel relationship relative to that of other SST–Sahelrelationships. This is determined from the correlationbetween the Mediterranean SST index and JAS Sahelrainfall, which is found to be 0.47 during 1947–96 (sig-nificant at the 1% level). Thus this Mediterranean in-fluence on the Sahel is of a similar magnitude to thatof the east Pacific or of the west Pacific/Indian OceanSST gradient, and a little less than that of the tropicalAtlantic (R01).
In terms of the timescales of Sahelian rainfall that areaffected, the Mediterranean appears to be comparativelymore important at explaining part of the recent decadalvariability. This is shown qualitatively by Fig. 3, whereit seen that during the wet Sahelian decade of the 1950smost years are warmer than average in the Mediterra-nean, whereas during the drought of the 1970s and1980s most years have below-average SSTs. Further-more, this can be quantified by correlating filtered Sa-helian and Mediterranean indices: at timescales greaterthan 8 yr r 5 0.62 (during 1947–96), whereas at time-
scales less than 8 yr r 5 0.31 (a second-order recursiveChebychev filter with 50% amplitude cutoff at 8 yr wasused). Assuming these correlations arise because theMediterranean forces changes over the Sahel, this spec-tral dependence can be explained by the nature of theMediterranean SST variability itself, which contains41% of its variance on timescales more than 8 yr, com-pared to about 23% expected from a white noise process,resulting in a larger signal-to-noise ratio at decadal time-scales.
Next, following the methodology of R01, it can beshown that there have been no significant nonstation-arities in the Mediterranean–Sahel correlation through-out the twentieth century (1900–96), based on a 30-yrmoving window. In other words, multidecadal variationsin the strength of this relationship have been no greaterthan those expected from the effects of ‘‘weather noise’’or from the effects of random variations in the com-peting influence of other SST patterns.
Finally, it is important to know whether this rela-tionship is independent of other SST–Sahel relation-ships, and so correlations between the Mediterraneanindex and the other regional and global SST patternsknown to affect the Sahel have been computed. For thethree indices defined by R01, representing the tropicalAtlantic, the east Pacific, and the west Pacific/IndianOcean SST gradient, these each had negligible corre-lation with the Mediterranean index during JAS 1947–96 (r 5 20.02 to 0.08). Thus it seems the Mediterraneanprovides an association with the Sahel that is additionalto, and statistically independent of, these other regionalSST patterns. However, the correlation between the JASMediterranean index and the JAS interhemispheric ther-mal contrast (ITC) pattern (defined here by the thirdcovariance eigenvector of 1901–80 global SSTs, from

852 VOLUME 16J O U R N A L O F C L I M A T E
FIG. 4. Correlations between observed Jul–Sep Sahel rainfall and(a) Mar–Apr SSTs, and (b) May–Jun SSTs, both using data for 1947–96. Shading, contours, and identification of local significance are asin Fig. 2.
Colman et al. 1997) is slightly stronger at 0.29. At de-cadal timescales, using low-pass filtered time series, thisrises to 0.54. Although neither correlation is statisticallysignificant (at the 5% level, accounting for serial cor-relation), this nevertheless suggests the possibility thatpart of the relationship between the ITC and the Sahelmay be due to the relationship between the Mediter-ranean and the Sahel.
c. Predictability of Sahel rainfall usingMediterranean SSTs
Given that the Mediterranean appears to affect Sa-helian climate variability to roughly the same extent asthe more established predictors, and that its impact islargely statistically independent of these predictors, itmay itself be an additional candidate predictor of Sahelrainfall. (Note again our assumption that the underlyingcause of the Mediterranean–Sahel link is an influenceof the former on the latter; this is addressed in section4.)
If Mediterranean SSTs are to have genuine utilitywithin a predictive system, they must, however, have alead relationship over JAS Sahel rainfall, as well as asimultaneous relationship. At the Met Office two ex-perimental seasonal forecasts are issued for the Saheleach year, one based on March to April SSTs, and theother on May to June SSTs (Ward et al. 1993; Colmanet al. 1997). Hence, Fig. 4 illustrates the relationshipbetween JAS Sahel rainfall and SSTs averaged over eachof these two lead seasons. Not surprisingly, correlationsare rather less than those of the simultaneous analysis(Fig. 2), although statistical significance is achieved inparts of the western Mediterranean at both leads. Thisfalloff in preseason potential skill is, however, largerthan for other ocean basins affecting the Sahel, and isdue to weaker persistence of Mediterranean SST anom-alies from spring to summer. This is typical of the sub-tropics, compared to the Tropics, and may reflect a largerinfluence of chaotic atmospheric dynamics on a shallowmixed layer. Further research is now required to assessthe precise extent to which inclusion of a Mediterraneanpredictor into empirical seasonal forecasts of Sahel rain-fall could enhance their skill.
The aim of this paper now is twofold. First, it is toclarify that the correlation between the Mediterraneanand the Sahel is indeed due to an impact of the formeron the later. Second, it is to understand the mechanismsby which the Mediterranean may have contributed topast climate anomalies over the Sahel, and thus how itmay also contribute to future climate anomalies. Boththese aims are achieved through the analysis of AGCMdata.
3. Simulated Mediterranean–Sahel relationships
The AGCM used in this study is the HadAM3 versionof the Met Office climate model. It has a horizontal
resolution of 2.58 latitude by 3.758 longitude, 19 levelsin the vertical, and an atmospheric and land surfacephysics package outlined by Pope et al. (2000) and ref-erences therein.
The model’s JAS rainfall climatology over North Af-rica is illustrated in Fig. 5, which shows this to be mod-erately well simulated, though a little too wet over theSahel, and a little too dry further south. Averaging overthe Sahelian box of Fig. 1, the model climatology is 3.9mm day21, slightly higher than the observed climatol-ogy of 3.5 mm day21.
Two types of simulation data are described here,which are used first to support the observational analysisof a link between Mediterranean SSTs and Sahelian rain-fall variability, and second to understand the mecha-nisms for this regional teleconnection. All model dataare treated in the same way as the observational data;see section 2a.

1 MARCH 2003 853R O W E L L
FIG. 5. Simulated Jul–Sep rainfall climatology, using ensemblemean data for 1961–90. Units are mm day21. Dark gray shows wherevalues exceed the equivalent observed climatology by more than 1mm day21, and light gray shows where it underestimates the observedclimatology by more than 1 mm day21. FIG. 6. As in Fig. 2 except using simulated ensemble mean Sahel
rainfall.
a. Global SST experiments
The first set of experiments consists of an ensembleof integrations forced primarily by the observed historyof global SSTs and sea-ice extents, which aim to sim-ulate past climate variations with maximal skill. Sixintegrations were carried out, each for the period 1 Feb-ruary 1870 to 30 December 1999. All were forced bythe HadISST1.1 data (processed to preserve monthlymeans; Taylor et al. 2000), and also by variations intotal solar irradiance (Lean et al. 1995), and by a rep-resentation of the impact of volcanic stratospheric aero-sols on optical depth (Sato et al. 1993). The ensemblemembers differ only in their initial atmospheric con-ditions, which were taken from an earlier HadAM3 sim-ulation.
The link between the simulated ensemble mean timeseries of Sahel rainfall and Mediterranean SSTs during1947–96 is shown in Fig. 6. This is broadly similar tothe observed pattern of Fig. 2, showing a tendency forwarmer than average SSTs throughout the Mediterra-nean to be associated with enhanced rainfall over theSahel. Although the highest values now appear in thewestern (rather than eastern) Mediterranean, local dif-ferences of the correlations between Figs. 2 and 6 arenot statistically significant, and are thus within the var-iability expected from random sampling.
Therefore, given the model’s ability to reproduce theobserved rainfall–SST correlations when forced only byobserved SSTs, we can now discard the conceivableexplanation that this relationship might be due to animpact of Sahelian rainfall on Mediterranean climate(rather than vice versa). Thus, of the three possible ex-planations for the Mediterranean–Sahel link raised inthe introduction, two remain: one is that some externalSST feature may affect both regions, and the second isthat Mediterranean SSTs may indeed affect Sahelianrainfall variability. The following section addressesthese possibilities.
b. Idealized SST experiments
The second type of experimental data consists of apair of integrations forced by idealized SST patternsrestricted to the Mediterranean basin, with forcings fromall other ocean basins being absent. This provides aneffective tool to address two critical issues. First, it willenable us to understand whether the Mediterranean–Sa-hel correlation is indeed due to an influence of the Med-iterranean on the Sahel, rather than merely due to astatistical link arising from a third-party influence onboth regions. Second, these experiments will provide a‘‘clean’’ source of data with which to identify the mech-anism for this regional teleconnection, without the con-founding influence of circulation changes arising fromother forcings.
The experiments are forced by the anomalous SSTsshown in Fig. 7, which depict opposite signs of a singlepattern, whereby one experiment broadly represents awarming of the Mediterranean, and the other a cooling.This pattern is designed to be of maximal relevance tothe Sahel, and so is directly proportional to a map ofthe regression coefficients of observed JAS Sahel rain-fall onto JAS SSTs in the Mediterranean. The amplitudeof this pattern is then made to vary throughout the an-nual cycle, such that its size in each month equates totwo interannual standard deviations of anomalous SST.(This was achieved by projecting the preceding regres-sion pattern onto monthly mean SSTs for 1961–90, thencomputing the interannual standard deviation of thistime series for each calendar month, next smoothingthis 12-point annual cycle with a 1-2-1 filter, and finallymultiplying the regression pattern by double these stan-dard deviations to obtain an annual cycle of forcings inunits of SST.) This produces a forcing that has strongbut realistic amplitude, and plausible seasonality. These12 monthly anomaly patterns were then added to (orsubtracted from) a seasonally evolving 1961–90 SSTclimatology, and this single year repeated 20 times. Thus

854 VOLUME 16J O U R N A L O F C L I M A T E
FIG. 7. Forcing patterns used in the idealized SST experiments: (a)warm Mediterranean expt, and (b) cold Mediterranean expt. Averagesfrom Jul–Sep are shown, and units are 8C.
FIG. 8. Composite difference of Jul–Sep rainfall, computed as theaverage of 20 warm-expt years minus 20 cold-expt years. Units aremm day21, and the local rejection of a null hypothesis of zero dif-ference (at the 5% significance level with a two-tailed test) is indicatedby a solid hexagon. Sahel location is marked by rectangular box.
two continuous 20-yr integrations were carried out withanomalous forcing in the Mediterranean and climato-logical SSTs elsewhere, in effect creating a pair of 20-member ensembles.
Figure 8 shows the regional impact of these Medi-terranean SST anomalies on rainfall, using a compositedifference analysis along with a t test to assess localsignificance. A small, but not surprisingly significant,impact is seen over the Mediterranean, with the warmerSSTs producing more rainfall over the west and centralMediterranean, but drier conditions at its easternmostpart. To the south, the diminutive climatological rainfallover the arid Sahara is significantly enhanced, and cru-cially for this study, the wet season over the Sahel issignificantly more abundant. Averaged over the Sahelas a whole, JAS mean rainfall is 1.2 interannual standarddeviations higher in the warm Mediterranean experi-ment than in the cold experiment.
Thus, this provides further and convincing evidence
that SST variability in the Mediterranean does indeedaffect seasonal rainfall totals over the Sahel. Further-more, this analysis and that of section 3a suggest thatthe model can now be used to deduce a mechanism forthis link.
4. A mechanism linking the Mediterranean to theSahel
a. Seasonal mean analysis
The approach taken here to understand the mechanismfor this regional teleconnection is to first determine thesource of the additional moisture required to feed theenhanced rainfall over the Sahel in warm Mediterraneanyears. There are two possibilities: one is increased evap-oration, and the other is additional moisture conver-gence in the atmosphere above the Sahel. Presumablyboth may play a role, and must then be triggered ormaintained externally (this will form the next step ofthe investigation; to be discussed later).
Figure 9 shows the impact of Mediterranean SSTs onthe model’s surface evaporation using data from theidealized SST experiments. Not surprisingly the largestimpact is over the Mediterranean itself, where a con-siderable increase is seen when SSTs are warmer thanaverage. A smaller (but statistically significant) increasein evaporation is apparent over much of the Sahel, andalso an even smaller rise over the Sahara. Farther south,evaporation is actually reduced, which is because oflarger increases in cloud cover, leading to reduced sur-face heating (not shown). Over the Sahel, rainfall eventsare sufficiently frequent (almost daily in the model, andevery 2–3 days in reality; Le Barbe et al. 2002) thatsome of the additional moisture evaporating from thewetter surface remains within the Sahelian atmosphere

1 MARCH 2003 855R O W E L L
FIG. 9. Composite difference of Jul–Sep evaporation, computed asthe average of 20 warm expt years minus 20 cold expt years. Unitsare mm day21, contours are plotted as shown on bar, and the localrejection of a null hypothesis of zero difference (at the 5% significancelevel with a two-tailed test) is indicated by a solid hexagon.
FIG. 10. (a) Cross section of average moisture divergence, com-puted over all 20 yr of both warm and cold expts. (b) Cross sectionof the composite difference of moisture divergence, computed as theaverage of 20 warm-expt years minus 20 cold-expt years. In both (a)and (b), data are Jul–Sep means averaged over 158W–37.58E, unitsare g kg21 s21, contours are plotted as shown on bar, and Sahellocation is marked by a solid rectangle beneath the x axis.
before being returned to the ground by a further rainfallevent. However, a significant proportion must also beadvected out of the Sahel, that is, that which is evap-orated too long before the next rainfall event or hasexperienced mainly meridional advection. Thus, thecomponent remaining within the Sahelian atmospherebecomes available to help feed subsequent rainfall here,and the whole process can be viewed as a small en-hancement of the regional hydrological cycle, so pro-viding a positive feedback effect on the total Sahelianrainfall increase.
Although changes in evaporation contribute to theadditional moisture that feeds greater rainfall over theSahel, the primary source must be an increase in at-mospheric moisture convergence above this region. Tostudy this further, Fig. 10a shows the north–south profileof mean moisture divergence in the lower troposphereover North Africa, using data from the idealized SSTexperiments at 1200 UTC. First, it is important to ex-plain the relevance of analyzing only midday data. Trop-ical rainfall exhibits a large diurnal cycle, and this in-teracts strongly with local atmospheric dynamics; Row-ell (1990) illustrates this for the North African region.In order to gain a clear and consistent picture of thecirculation changes that induce seasonal rainfall anom-alies, the atmospheric data must thus be averaged overonly that part of the diurnal cycle when the majority ofrain falls. For HadAM3, this is during daylight hours,mainly when the sun is at its highest, and for this thesimplest technical solution is to average only those fieldsproduced at 1200 UTC. (Note that in the real world,rainfall extends into the evening and nighttime hoursdue to the self-sustaining thermodynamics of the squalllines. Like all GCMs, the Met Office model has toocoarse a resolution to represent these systems, but sincethe model’s seasonal mean response to SSTs is similar
to that observed, we surmise that its error in diurnalphasing does not negate the results of this paper.)
Consider now the pattern of mean moisture diver-gence shown in Fig. 10a. The intertropical convergencezone (ITCZ) is clearly apparent, centered on 108N, withthe strongest convergence of moisture occurring belowabout 800 hPa. To the north, is a region of moisturedivergence associated with both the African easterly jet(AEJ; see later) and subsidence over the southern Sa-hara. The composite difference of moisture divergencebetween warm and cold experiments is shown in Fig.10b. As anticipated earlier, this shows a substantial in-crease in moisture convergence over the Sahel whenwarm SSTs in the Mediterranean are applied. Thisanomaly is largest from about 850 to 700 hPa, and bycomparison with Fig. 10a represents both an intensifi-cation of the ITCZ and a northward shift of its northernedge.
856 VOLUME 16J O U R N A L O F C L I M A T E
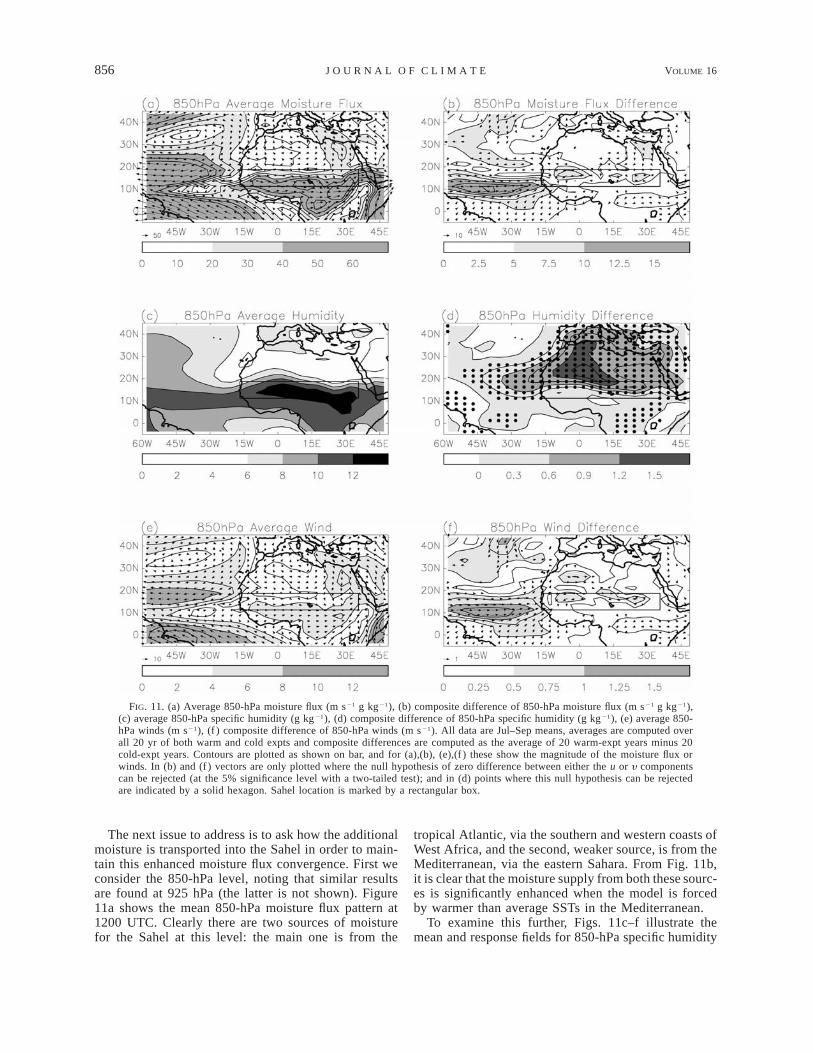
FIG. 11. (a) Average 850-hPa moisture flux (m s21 g kg21), (b) composite difference of 850-hPa moisture flux (m s21 g kg21),(c) average 850-hPa specific humidity (g kg21), (d) composite difference of 850-hPa specific humidity (g kg21), (e) average 850-hPa winds (m s21), (f ) composite difference of 850-hPa winds (m s21). All data are Jul–Sep means, averages are computed overall 20 yr of both warm and cold expts and composite differences are computed as the average of 20 warm-expt years minus 20cold-expt years. Contours are plotted as shown on bar, and for (a),(b), (e),(f ) these show the magnitude of the moisture flux orwinds. In (b) and (f ) vectors are only plotted where the null hypothesis of zero difference between either the u or y componentscan be rejected (at the 5% significance level with a two-tailed test); and in (d) points where this null hypothesis can be rejectedare indicated by a solid hexagon. Sahel location is marked by a rectangular box.
The next issue to address is to ask how the additionalmoisture is transported into the Sahel in order to main-tain this enhanced moisture flux convergence. First weconsider the 850-hPa level, noting that similar resultsare found at 925 hPa (the latter is not shown). Figure11a shows the mean 850-hPa moisture flux pattern at1200 UTC. Clearly there are two sources of moisturefor the Sahel at this level: the main one is from the
tropical Atlantic, via the southern and western coasts ofWest Africa, and the second, weaker source, is from theMediterranean, via the eastern Sahara. From Fig. 11b,it is clear that the moisture supply from both these sourc-es is significantly enhanced when the model is forcedby warmer than average SSTs in the Mediterranean.
To examine this further, Figs. 11c–f illustrate themean and response fields for 850-hPa specific humidity

1 MARCH 2003 857R O W E L L
and winds. From these, the following mechanism forthe enhancement of Sahelian rainfall may be proposed.Warmer than average SSTs in the Mediterranean leadto enhanced local evaporation (Fig. 9), and hence toenhanced lower-tropospheric humidity here (Fig. 11d).This additional moisture is then advected across the arideastern Sahara (Fig. 11c) by the mean flow (Fig. 11e),which feeds enhanced moisture convergence over theSahel, and hence enhanced rainfall. Note that the windfield itself is not significantly altered over the desert(Fig. 11f), but that the anomalous moisture transport(Fig. 11b) arises only through increased moisture avail-ability. However, this probably accounts for only a partof the rainfall increase: a positive feedback mechanismis also proposed, whereby the additional convectiveheating over the Sahel (Fig. 8) causes more moisture tobe drawn in from the tropical Atlantic (Fig. 11b). Thissupposition of a secondary dynamical response, is sup-ported by Fig. 11, which shows that the enhanced mois-ture flux from the Atlantic is almost entirely due to asignificant change in circulation (Fig. 11f), drawingmoisture into the Sahel more rapidly, with the humidityfield being relatively unaltered (Fig. 11d).
Now consider the role played by moisture conver-gence anomalies at 700 hPa (Fig. 10b). The mechanismby which these are maintained is rather different fromthat at the lower levels, and is examined with the aidof Fig. 12. Figure 12a shows that on average the Sahelreceives a weak supply of moisture from the Mediter-ranean at this level, but experiences a strong export ofmoisture to the west due to the AEJ. This leads to thenet divergence of moisture shown by Fig. 10a. In theidealized experiment with warm SSTs, the influx ofmoisture from the Mediterranean is enhanced, and theexport of moisture by the AEJ is reduced (Fig. 12b).Thus the net export of moisture at this level is reduced,so contributing to the rainfall increase. This can be ex-plained by two distinct mechanisms. First, the enhancedMediterranean evaporation also leads to higher localhumidity at this level, which increases the moisture con-tent of the mean 700-hPa flow across the eastern Sahara(Figs. 12b,d,e). This provides an additional (but weak)moisture source that helps feed enhanced rainfall overthe Sahel. The more important mechanism, however, isa positive feedback resulting from the Sahelian rainfallincrease. It is well known that in these wetter years overthe Sahel the strength of the AEJ is diminished (Newelland Kidson 1984; Fontaine et al. 1995). This probablyoccurs partly because the north–south gradient of soilwetness becomes weaker, which leads to reduced gra-dients of evaporation (Fig. 9) and surface temperature,so reducing low-level baroclinicity which is a primecause of the AEJ (e.g., Hastenrath 1991; Cook 1999),and also because anomalous upward convective trans-port of low-level westerly momentum weakens the east-erlies above (e.g., Kershaw and Gregory 1997). Thisweakening of the AEJ is clearly seen in the warm SSTexperiment (Figs. 12e,f), and leads to a fall in the 700-
hPa moisture divergence over the Sahel. This then leadsto a further increase of Sahelian rainfall. Such a feed-back mechanism has also been proposed by Cook(1999), involving the AEJ, midlevel moisture diver-gence and surface wetness, and by Rowell et al. (1992)but involving the latitude, rather than intensity, of theAEJ.
In conclusion, these idealized experiments have il-luminated a number of mechanisms by which the Med-iterranean impacts the Sahel, each of which can be seenin the seasonal mean data. First, a ‘‘direct’’ mechanismis advection by the mean flow of moister air from theMediterranean, across the Sahara into the Sahel, pri-marily at 850 and 925 hPa and more weakly at 700 hPa.Second, this leads to three positive feedback mecha-nisms in the model, one involving a more rapid influxof moisture from the tropical Atlantic, another involvinga weaker export of moisture by the AEJ, and the thirdinvolving a greater recycling of moisture through sur-face evaporation.
b. Subseasonal analysis
In addition to the Mediterranean–Sahel mechanismsalready discussed, it is possible that other mechanismsmay operate on subseasonal timescales, which could behidden by the above analysis of seasonal means. Theaim of this section is to reveal any such mechanisms.
To examine whether the Mediterranean has any im-pact on subseasonal rainfall variations over the Sahel,information is required on the amplitude of such vari-ations for a range of timescales and longitudes, in orderto facilitate a comparison with the known modes ofvariability affecting the Sahel (note that the latitude,158N, is already specified by the scope of the study).Thus, a helpful way to provide such information is tocompute spectra of daily precipitation data from the twoidealized SST experiments, and display these as con-tours of spectral density on a longitude–frequency plot.So, first, for each longitude along the length of the Sahel(and for longitudes 158 beyond the Sahel) rainfall totalsfor the 3 grid boxes spanning the Sahel (12.58, 158, and17.58N) were averaged for each day in each of the twoMediterranean experiments. Periodograms were thenderived from this daily data, separately for each lon-gitude, for each JAS season, and for each experiment.These were then averaged over the 20 available years,and the resulting longitude–frequency matrices (one foreach experiment) smoothed in the frequency domainwith a three-point running mean.
Figure 13a shows the estimated climatological rainfallspectrum at each longitude, computed by averaging theperiodograms of the two experiments. The first-orderimpression across the entire Sahel is broadly that of ared noise process. However, in the western Sahel, aspectral peak of around 4 days is superimposed on thisvariability (seen by the tilting of contours towards highspectral density as periods increase from 4 to 7 days).

858 VOLUME 16J O U R N A L O F C L I M A T E
FIG. 12. As in Fig. 11 but at 700 hPa. Note that contour and shading intervals are identical, apart from additional and morewidely spaced contours in (f ).
This geographic and spectral location matches that ex-pected from African easterly waves (AEWs), whichhave their strongest amplitude towards the coast of WestAfrica (e.g., Albignat and Reed 1980; Thorncroft andRowell 1998) and an observed timescale of about 3 to5 days (e.g., Burpee 1974; Albignat and Reed 1980).
To demonstrate the impact of the Mediterranean onsimulated subseasonal variability, Fig. 13b shows theratio of spectral densities in warm years to cold years,highlighting points that are significantly different fromunity using an F test. Two particular features are ap-parent. One is that variability increases at all frequencies(and all longitudes), indicating a larger-amplitude red
noise process, consistent with increased seasonal rainfallin warm Mediterranean years. The second effect is thatthis enhancement of variability is much stronger at thetimescale and longitude of the AEWs, indicating thatthey make a proportionally larger contribution to the netrainfall increase than that of other convective events.Thus, although a part of the enhancement of AEW rain-fall must be due to the general enhancement at all time-scales, it appears that the amplitude or structure of theseweather systems also alters in such a way that furtheramplifies their contribution to rainfall in warm Medi-terranean years. This could either be due to dynamic orthermodynamic feedbacks within the AEWs, or due to

1 MARCH 2003 859R O W E L L
FIG. 13. (a) Longitude–frequency cross section of the average spectral density of daily rainfall for the warm and cold Medi-terranean experiments. Data are from Jul–Sep and averaged over 11.258–18.758N. Units of spectral density are 1022 mm2 day22,and contours are plotted at values shown on bar. (b) Longitude–frequency cross section of the ratio of spectral density of dailyrainfall for the warm to cold Mediterranean experiments. The local rejection of a null hypothesis of equal variances (at the 5%significance level with a two-tailed test) is indicated by a solid circle. (c) Averaged spectra of daily Sahel rainfall, from 158Wto 37.58E, for the warm and cold Mediterranean experiments. Units are 1022 mm2 day22, and the shaded area estimates thecomponent of additional rainfall variability in the warm expt due to African easterly waves.
the impact of other atmospheric features to which AEWsare more sensitive. Further work is now required toestablish whether this additional AEW-rainfall increaseis unique to HadAM3 (requiring similar experimentswith other AGCMs and idealized models), and to iden-tify more precisely the mechanisms involved (requiringobserved and model-based process studies).
Finally, to estimate the relative importance of thisAEW contribution to the seasonal mean response, Fig.13c compares the average Sahel rainfall spectra betweenwarm and cold Mediterranean experiments. The shadedarea represents a rough estimate of the component ofadditional subseasonal rainfall variability in the warmexperiment due to the increase in AEW rainfall (ex-cluding that merely due to the enhanced red noise pro-cess). Clearly this represents a small but notable portionof the total change in subseasonal variability (the latterbeing the total area between the two curves), indicatingthat this AEW contribution to the model’s Sahel rainfallresponse to Mediterranean SSTs is also small but no-table.
c. Verification issues
The regional teleconnection mechanisms described inthe preceding have been entirely based on an analysisof HadAM3 data. Ideally these should be supported (orrefuted) by an analysis of independent datasets. In par-ticular, the proposed mechanisms involve a number offeedbacks, not all of which are necessary to sustain theconclusion of a Mediterranean influence on the Sahel(although the reality of this underlying influence, bywhatever mechanism, seems assured from the combi-nation of observed and model evidence). For example,it is possible that one or more of these feedbacks maydiffer between models, or between HadAM3 and reality,due to the formulation of the convection scheme (andits impact on the large-scale flow), the formulation ofthe boundary layer scheme (which determines evapo-ration over ocean and land surfaces), or the model’sresolution (which may affect AEW dynamics and oro-graphic influences on the flow).
One potential source of support may lie in the re-
860 VOLUME 16J O U R N A L O F C L I M A T E
analysis of observational data, particularly that carriedout by the National Centers for Environmental Predic-tion (NCEP) and the National Center for AtmosphericResearch (NCAR) (e.g., Kistler et al. 2001), which intheory covers a sufficiently lengthy period to obtainstatistically robust results. However, there are a numberof complicating factors with this approach: (a) the read-ily available monthly mean data are averaged over fourtime points in the diurnal cycle, rather than only 1200UTC as used here; (b) SST forcing is present in all oceanbasins, rather than only in the Mediterranean as above(this would add a further source of noise to a mecha-nistic analysis, due to the additional influence of non-Mediterranean SST anomalies on the regional circula-tion); (c) Janicot et al. (2001) recommend that NCEP–NCAR reanalysis data prior to 1968 be discarded forclimate variability studies over and around the Saheldue to an apparent impact of unreliable and undersam-pled observational input (this would further enhance thenoise due to sampling error, through the use of only 30yr of data, compared to 50 yr, or the 2 3 20 AGCMyears above); (d) Janicot et al. (2001) state that evenfor the 1968–97 period the reanalysis data are not suf-ficiently accurate for investigating decadal variabilityover this region, and thus recommend restricting anal-ysis to high-pass filtered data (this would further weakenthe signal-to-noise ratio, since section 2b showed thatthe Mediterranean–Sahel relationship is weaker at sub-decadal timescales); and (e) other observational networkinhomogeneities and model dependencies also exist inthe reanalysis data.
To assess the sensitivity of a verification using re-analysis data to these issues, the available HadAM3 datawas used within a self-consistent framework to test theimpact of items a–d. This was achieved by creatingversions of Figs. 10–12 using the following data to ad-dress, in turn, items a–d above: (i) data from the ide-alized SST experiments averaged over all time steps;(ii) data from the experiments forced by global SSTsaveraged over all time steps, and compositing years withthe strongest anomalous Mediterranean SST index (17warm yr and 17 cold yr from 1947–96); (iii) data fromthe global SST experiments for 1968–97 only (com-positing 10 warm years and 10 cold years); and (iv)high-pass filtered data from the global SST experimentsfor 1968–97 (using the same 8-yr filter as section 2b,and again compositing 10 warm years and 10 coldyears). The combined impact of all these changes, re-vealed by analysis (iv), was unfortunately such that ev-idence for many of the mechanisms described in section4a was overwhelmed by other sources of regional var-iability. The remaining statistically significant resultswere a slight increase in humidity at 925–700 hPa overmuch of North Africa and a slight strengthening of thelow-level moisture flux from the Mediterranean intonorthern Libya and Egypt (not shown). For the moisturedivergence analysis (Fig. 10), aliasing of the diurnalcycle (item a) was the critical problem, whereas for the
circulation analysis (Figs. 11–12), items b–d had a cu-mulative negative impact on signal-to-noise levels. Evenso, high-pass filtered NCEP–NCAR reanalysis data for1968–97 were also analyzed, using the same compos-iting technique. Given the results from global SST ex-periments, and the particular difficulties associated withmoisture-related aspects of the reanalysis data (e.g.,Trenberth and Guillemot 1998), it is not surprising, how-ever, that these data were also unable to properly re-produce the regional teleconnection mechanisms of theidealized SST experiments. Finally, it is noted that sim-ilar results can be expected if the daily precipitationanalysis (Fig. 13) were computed from global simula-tion or reanalysis data, although this was not undertakendue to the substantial data processing required.
In summary, this section illustrates the difficulties inevaluating the mechanisms of a particular teleconnec-tion whose influence competes with that of other tele-connections, using only a short data record. With re-analysis data, these problems are compounded if theteleconnection is most apparent at decadal timescales.This demonstrates the value of idealized SST experi-ments, in which the forcing under investigation is iso-lated from all other forcings. It must be emphasizedhowever that an inability to verify the proposed feed-back mechanisms using 30 yr of globally forced high-pass filtered data in no way undermines the importanceof this teleconnection. The relative (and notable) con-tribution of Mediterranean SST anomalies to JAS Sahelrainfall totals was discussed in section 2b. Nevertheless,more work is now needed to corroborate the mecha-nisms suggested here, in particular an analysis of severallong homogeneous time series of midday radiosondedata, and of idealized Mediterranean SST experimentsperformed with different AGCMs that are also realisticover the North African region.
5. Summary and conclusions
The possibility of a link between the Mediterraneanand the Sahel has been investigated here, and a varietyof data used to show that anomalies of MediterraneanSSTs have a clear and significant impact on wet season(July to September) rainfall totals over the Sahel. Thisis such that years with warmer then average SSTs areoften wetter over the Sahel, whereas years with coolerthan average SSTs tend to be drier. Observational anal-ysis showed that the strength of this impact is as greatas that of ENSO, and only a little less than that of thetropical Atlantic. The Mediterranean’s influence isstrongest on decadal timescales, due to the ‘‘redness’’of its own spectrum (though it does also affect inter-annual timescales), and may also explain some of thelink between an interhemispheric SST pattern and theSahel. It seems that the Mediterranean may be a part ofthis pattern, although further experimentation is clearlyrequired to assess the degree to which these global-scale
1 MARCH 2003 861R O W E L L
SST variations affect the Sahel via the Mediterraneanand via other ocean regions.
Analysis of AGCM data has been a key aspect of thisstudy. First, it has provided convincing evidence thatthe observed statistical link between the Mediterraneanand the Sahel is indeed due to an influence of the formeron the latter. Notably, idealized experiments in whichthe model was only forced by anomalous SSTs in theMediterranean (with climatological SSTs elsewhere)produced a strong and significant response in seasonalrainfall over the Sahel. Second, because of the similaritybetween observed and model responses to the observedhistory of global SSTs, the AGCM data could be usedto understand the mechanism of this regional telecon-nection. It was shown that in years when SSTs in theMediterranean are warmer than average (using the ide-alized SST experiments), increased evaporation leads toan enhanced moisture content of the air that is advectedsouthwards by the low-level mean flow across the east-ern Sahara into the Sahel. This then feeds increasedmoisture convergence in the lower troposphere over theSahel, leading to increased rainfall. This initial responseis then further enhanced by four positive feedbackmechanisms. The first is that the additional convectiveheating over the Sahel induces a stronger low-level in-flow from the tropical Atlantic, which draws moisturein more rapidly, feeding further convection. A secondfeedback is that enhanced rainfall leads to a weakermidlevel African easterly jet, either via weaker surfacetemperature gradients southwards from the Sahel, or viaenhanced convective transport of low-level momentum.This reduces the 700-hPa export of moisture from theSahel, again leading to enhanced moisture availabilityto feed a further rainfall increase. Another feedbackoperates simply through an enhancement of the hydro-logical cycle, whereby increased evaporation over theSahel feeds increased rainfall. The final mechanism isthat the component of rainfall due to African easterlywaves is enhanced to a greater extent than that due toother convective activity. Each of these responses tendsto be reversed in years when the Mediterranean is coolerthan average. Further work is now required to investi-gate whether all these mechanisms occur in reality andin other AGCMs, and to understand their action in great-er detail.
Finally, the results of this paper are also relevant tothe predictability of Sahel rainfall. On seasonal time-scales, the persistence of Mediterranean SST anomaliesis weaker than that of other SSTs affecting the Sahel,but even so their preseason correlation with the Sahelremains statistically significant in some parts of theMediterranean. One issue for further study is the extentto which they are already included in empirical seasonalforecasts by using the interhemispheric SST pattern; thisrequires a detailed assessment using longer data periods,independent training, and model experimentation. An-other important issue is whether additional predictiveskill could be obtained by understanding the preseason
evolution of the Mediterranean SST anomalies them-selves. In particular, it would be useful to determinewhether their more rapid evolution is mainly due tochaotic atmospheric dynamics, or whether it is also part-ly due to teleconnections that could perhaps be pre-dicted. On multidecadal timescales, ‘‘global warming’’is likely to be the dominant factor, and here a warmerMediterranean may contribute additional moisture to theSahelian wet season. However, it remains to be seenwhether the net impact (i.e., including that of other SSTregions) will be a more or less abundant rainy seasonover the Sahel.
Acknowledgments. I am very grateful to Ian Macadamwho ran the model experiments, with assistance fromDavid Sexton. This study was supported by the UKPublic Meteorological Service Research and Develop-ment Programme (Contract MSG-2/00), and the EU‘‘PROMISE’’ Project (Contract EVK2-CT-1999-00022). Rainfall data were kindly supplied by MikeHulme (with support from the UK DETR, ContractEPG-1/1/85) and by Sharon Nicholson, and the ITC SSTtime series was provided by Andrew Colman. I havealso benefited from comments on an earlier version ofthe manuscript by Serge Janicot, Chris Thorncroft, andRichard Jones.
REFERENCES
Albignat, J. P., and R. J. Reed, 1980: The origin of African wavedisturbances during Phase III of GATE. Mon. Wea. Rev., 108,1827–1839.
Burpee, R. W., 1974: Characteristics of North African easterly wavesduring the summers of 1968 and 1969. J. Atmos. Sci., 31, 1556–1570.
Colman, A. W., M. D. Davey, M. Harrison, A. Evans, and R. Evans,1997: Multiple regression and discriminant analysis predictionsof Jul–Aug–Sep 1997 rainfall in the Sahel and other tropicalNorth African regions. Experimental Long-Lead Bulletin, Vol.6, No. 2, 33–35.
Cook, K. H., 1999: Generation of the African easterly jet and its rolein determining West African precipitation. J. Climate, 12, 1165–1184.
Folland, C. K., T. N. Palmer, and D. E. Parker, 1986: Sahel rainfalland worldwide sea temperatures, 1901–85. Nature, 320, 602–607.
——, J. Owen, M. N. Ward, and A. Colman, 1991: Prediction ofseasonal rainfall in the Sahel region using empirical and dynam-ical methods. J. Forecasting, 10, 21–56.
Fontaine, B., S. Janicot, and V. Moron, 1995: Rainfall anomaly pat-terns and wind field signals over West Africa in August (1958–1989). J. Climate, 8, 1503–1510.
Hastenrath, S., 1990: Decadal-scale changes of the circulation in thetropical Atlantic sector associated with Sahel drought Int. J.Climatol., 10, 459–472.
——, 1991: Climate Dynamics of the Tropics. Kluwer Academic,488 pp.
Huffman, J., and Coauthors, 1997: The Global Precipitation Clima-tology Project (GPCP) Combined Precipitation Dataset. Bull.Amer. Meteor. Soc., 78, 5–20.
Hulme, M., 1994: Validation of large-scale precipitation fields ingeneral circulation models. Global Precipitation and ClimateChange, M. Debois and F. Desalmand, Eds., NATO ASI Series,Vol. 126, Springer-Verlag, 387–405.

862 VOLUME 16J O U R N A L O F C L I M A T E
Janicot, S., V. Moron, and B. Fontaine, 1996: Sahel droughts andENSO dynamics. Geophys. Res. Lett., 23, 515–518.
——, S. Trzaska, and I. Poccard, 2001: Summer Sahel–ENSO tele-connection and decadal time scale SST variations. Climate Dyn.,18, 303–320.
Kershaw, R., and D. Gregory, 1997: Parametrization of momentumtransport by convection. I: Theory and cloud modelling results.Quart. J. Roy. Meteor. Soc., 123, 1133–1151.
Kistler, R., and Coauthors, 2001: The NCEP–NCAR 50-year reanal-ysis: Monthly means CD-ROM and documentation. Bull. Amer.Meteor. Soc., 82, 247–268.
Lamb, P. J., 1978: Large-scale tropical Atlantic surface circulationpatterns associated with sub-Saharan weather anomalies. Tellus,30, 240–251.
Lean, J., J. Beer, and R. Bradley, 1995: Reconstruction of solar ir-radiances since 1610: Implications for climate change. Geophys.Res. Lett., 22, 3195–3198.
Le Barbe, L., T. Lebel, and D. Tasoba, 2002: Rainfall in West Africaduring the years 1950–90. J. Climate, 15, 187–202.
Newell, R. E., and J. W. Kidson, 1984: African mean wind changesbetween Sahelian wet and dry periods. J. Climatol., 4, 27–33.
Nicholson, S. E., B. Some, and B. Kone, 2000: An analysis of recentrainfall conditions in West Africa, including the rainy seasonsof the 1997 El Nino and the 1998 La Nina years. J. Climate,13, 2628–2640.
Palmer, T. N., 1986: Influence of Atlantic, Pacific and Indian Oceanson Sahel rainfall. Nature, 322, 251–253.
Pope, V. D., M. Gallani, P. R. Rowntree, and R. A. Stratton, 2000:The impact of new physical parametrizations in the Hadley Cen-tre climate model—HadAM3. Climate Dyn., 16, 123–146.
Rayner, N. A., D. E. Parker, E. B. Horton, C. K. Folland, L. V.Alexander, D. P. Rowell, E. C. Kent, and A. Kaplan, 2003: Globalanalyses of SST, sea ice and night marine air temperature sincethe late nineteenth century. J. Geophys. Res., in press.
Rowell, D. P., 1990: Simulation of the tropical diurnal cycle in aclimate model. Climate Research Tech. Note 3, Hadley Centre,Met Office, United Kingdom, 22 pp.
——, 2001: Teleconnections between the tropical Pacific and theSahel. Quart. J. Roy. Meteor. Soc., 127, 1683–1706.
——, C. K. Folland, K. Maskell, J. A. Owen, and M. N. Ward, 1992:Modelling the influence of global sea surface temperatures onthe variability and predictability of seasonal Sahel rainfall. Geo-phys. Res. Lett, 19, 905–908.
——, C. K. Folland, K. Maskell, and M. N. Ward, 1995: Variabilityof summer rainfall over tropical North Africa (1906–92): Ob-servations and modelling. Quart. J. Roy. Meteor. Soc., 121, 669–704.
Sato, M., J. E. Hansen, M. P. McCormick, and J. B. Pollack, 1993:Stratospheric aerosol optical depths, 1850–1990. J. Geophys.Res., 98, 22 987–22 994.
Shinoda, M., and R. Kawamura, 1994: Tropical rainbelt, circulation,and sea surface temperatures associated with the Sahelian rainfalltrend. J. Meteor. Soc. Japan, 72, 341–357.
Susskind, J., P. Piraino, L. Rokke, L. Iredell, and A. Mehta, 1997:Characteristics of the TOVS Pathfinder Path A dataset. Bull.Amer. Meteor. Soc., 78, 1449–1472.
Taylor, K. E., D. Williamson, and F. Zwiers, 2000: The sea surfacetemperature and sea-ice concentration boundary conditions forAMIP II simulations. PCMDI Rep. 60, Lawrence Livermore Na-tional Laboratory, Livermore, CA, 25 pp.
Thorncroft, C. D., and D. P. Rowell, 1998: Interannual variability ofAfrican wave activity in a GCM. Int. J. Climatol., 18, 1305–1323.
Trenberth, K. E., and C. J. Guillemot, 1998: Evaluation of the at-mospheric moisture and hydrological cycle in the NCEP/NCARreanalyses. Climate Dyn., 14, 213–231.
Vizy, E. K., and K. H. Cook, 2001: Mechanisms by which Gulf ofGuinea and eastern North Atlantic sea surface temperature anom-alies can influence African rainfall. J. Climate, 14, 795–821.
von Storch, H., and F. W. Zwiers, 1999: Statistical Analysis in ClimateResearch. Cambridge University Press, 484 pp.
Ward, M. N., 1994: Tropical North-African rainfall and worldwidemonthly to multi-decadal climate variations. Ph.D. thesis, Uni-versity of Reading, 313 pp.
——, C. K. Folland, K. Maskell, A. Colman, D. P. Rowell, and K.Lane, 1993: Experimental seasonal forecasting of tropical rain-fall at the U.K. Meteorological Office. Prediction of InterannualClimate Variations, J. Shukla, Ed., NATO ASI Series, Vol. 16,Springer-Verlag, 197–216.