Embed Size (px)
Citation preview
Student Research 201Impact of Mollusks
Directions for Teachers
The Impact of Mollusks on Water Quality
Note to Teachers: Information is given for the Core Experiment below. Additionalinformation needed for each variation of the Core Experiment may be found beginningon page 215. For a specific variation, check the At-A-Glance Map.
GETTING READY
See sidebars for additional information regarding preparation of the lab.
OBJECTIVES FOR CORE EXPERIMENT
At the end of this lab, students will be able to:• Describe the ecological role of filter-feeding mollusks in fresh and/or saltwater
ecosystems.• Identify the major anatomical structures and functions of a filter-feeding mol-
lusk.• Describe how turbidity and salinity affect the behavior of a filter-feeding mol-
lusk.• Explain how a population of oysters, clams, or mussels impacts water quality.
MATERIALS NEEDED
For the teacher-led demonstration, you will need the following for a class of 24:• 1 can of dead oysters or oysters in the shell from the fish market or store• 1 live bivalve• 1 algal culture• carmine powder• 1 eyedropper• 1 handheld magnifying glass• 1 light• 1 video microscope (optional)• 1 dissecting microscope (optional)
You will need the following for each group of four students in a class of 24:5 live freshwater clams, such as the asiatic clam Corbicula fluminea or saltwaterhardshell clams Mercenaria mercenaria, marine blue mussels Mytilus edulis oroysters, such as Crassostrea virginica
SCIENTIST PARTNERRoger NewellHorn Point LaboratoryUniversity of MD Centerfor Environmental SciencePO Box 775Cambridge, MD 21613
VARIATIONS 1 TO 9TEACHER PARTNERBlair BuckEpiscopal High School1200 Quaker LaneAlexandria, VA 22302
SCIENTIST PARTNERJoe CarterUniversity of NorthCarolina at Chapel Hill
Geology DepartmentCB3315Mitchell HallChapel Hill, NC 27599-3315
SYNOPSISStudents will determine how a filter-feedingmollusk, such as an oyster, clam, or mussel, re-sponds to changes in its immediate environ-ment. Students will design experiments to testhypotheses about the effects of environmentalvariables on filter feeding and identify anatomi-cal structures of a mollusk.
APPROPRIATE BIOLOGY LEVELIntroductory, advanced, ecology
LENGTH OF LABA suggested time allotment is as follows:
Day 1 (45 minutes)
• Demonstrate filtration and designexperiment.
Day 2 (45 minutes)
• Set up experiment. Place animals intotreatment aquaria.
Day 3 (20 minutes)
• Move animals from treatment tanksto collection containers.
Day 5 (45 minutes)
• Collect and discuss data.
PREPARATION TIMEREQUIRED
Two weeks before lab:
60 minutes:
• Set up algal cultures and maintenanceaquaria.
15 minutes:
• Set up the video camera (optional)and a shallow tray of water for theintroductory demonstration.
CORE EXPERIMENTTEACHERPARTNERSKathy Dunnavantand Cyndi LoudenCary High SchoolWalnut StreetCary, NC 27511
202 Student Research Impact of Mollusks
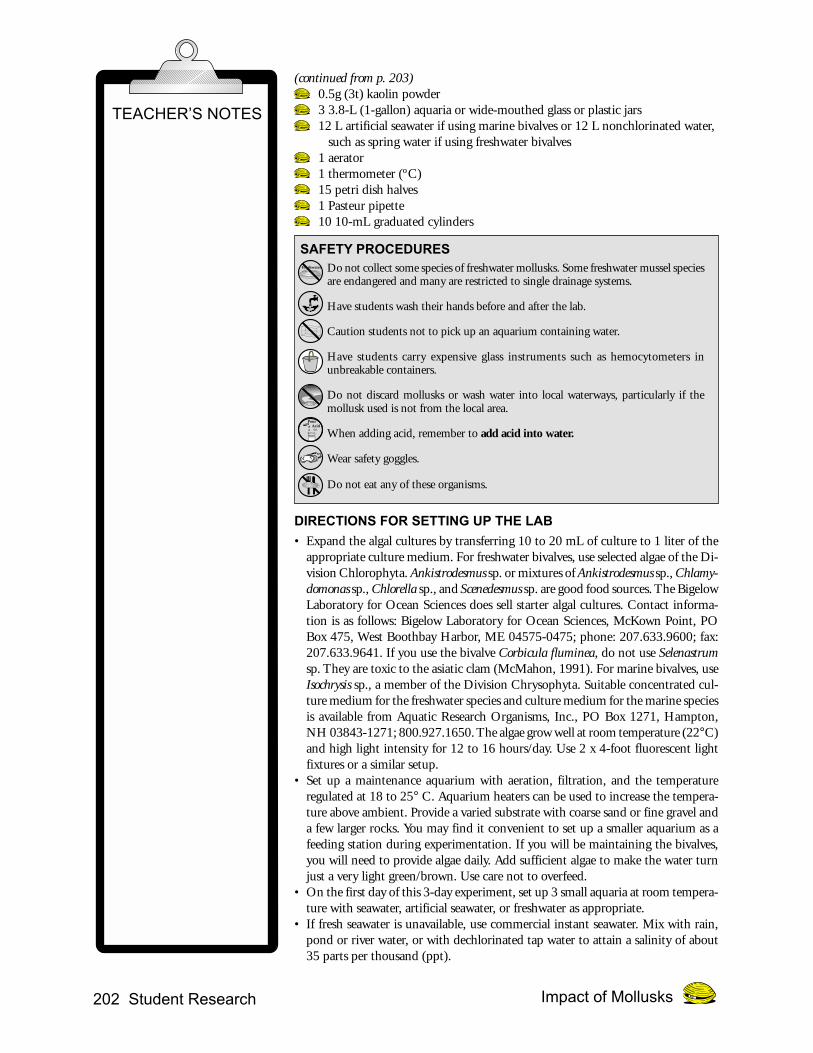
(continued from p. 203)0.5g (3t) kaolin powder3 3.8-L (1-gallon) aquaria or wide-mouthed glass or plastic jars12 L artificial seawater if using marine bivalves or 12 L nonchlorinated water, such as spring water if using freshwater bivalves1 aerator1 thermometer (ºC)15 petri dish halves1 Pasteur pipette10 10-mL graduated cylinders
SAFETY PROCEDURESDo not collect some species of freshwater mollusks. Some freshwater mussel speciesare endangered and many are restricted to single drainage systems.
Have students wash their hands before and after the lab.
Caution students not to pick up an aquarium containing water.
Have students carry expensive glass instruments such as hemocytometers inunbreakable containers.
Do not discard mollusks or wash water into local waterways, particularly if themollusk used is not from the local area.
When adding acid, remember to add acid into water.
Wear safety goggles.
Do not eat any of these organisms.
DIRECTIONS FOR SETTING UP THE LAB
• Expand the algal cultures by transferring 10 to 20 mL of culture to 1 liter of theappropriate culture medium. For freshwater bivalves, use selected algae of the Di-vision Chlorophyta. Ankistrodesmus sp. or mixtures of Ankistrodesmus sp., Chlamy-domonas sp., Chlorella sp., and Scenedesmus sp. are good food sources. The BigelowLaboratory for Ocean Sciences does sell starter algal cultures. Contact informa-tion is as follows: Bigelow Laboratory for Ocean Sciences, McKown Point, POBox 475, West Boothbay Harbor, ME 04575-0475; phone: 207.633.9600; fax:207.633.9641. If you use the bivalve Corbicula fluminea, do not use Selenastrumsp. They are toxic to the asiatic clam (McMahon, 1991). For marine bivalves, useIsochrysis sp., a member of the Division Chrysophyta. Suitable concentrated cul-ture medium for the freshwater species and culture medium for the marine speciesis available from Aquatic Research Organisms, Inc., PO Box 1271, Hampton,NH 03843-1271; 800.927.1650. The algae grow well at room temperature (22°C)and high light intensity for 12 to 16 hours/day. Use 2 x 4-foot fluorescent lightfixtures or a similar setup.
• Set up a maintenance aquarium with aeration, filtration, and the temperatureregulated at 18 to 25° C. Aquarium heaters can be used to increase the tempera-ture above ambient. Provide a varied substrate with coarse sand or fine gravel anda few larger rocks. You may find it convenient to set up a smaller aquarium as afeeding station during experimentation. If you will be maintaining the bivalves,you will need to provide algae daily. Add sufficient algae to make the water turnjust a very light green/brown. Use care not to overfeed.
• On the first day of this 3-day experiment, set up 3 small aquaria at room tempera-ture with seawater, artificial seawater, or freshwater as appropriate.
• If fresh seawater is unavailable, use commercial instant seawater. Mix with rain,pond or river water, or with dechlorinated tap water to attain a salinity of about35 parts per thousand (ppt).
TEACHER’S NOTES
Freshwater
AcidPour
to
Water
Student Research 203Impact of Mollusks
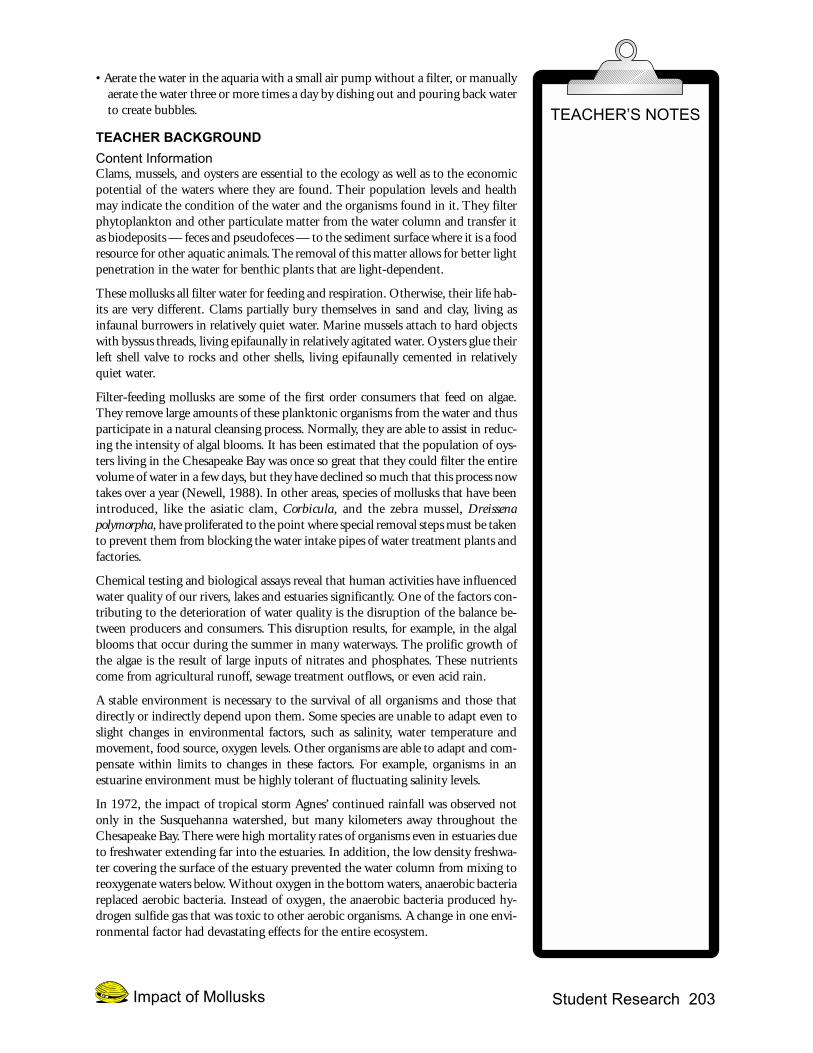
• Aerate the water in the aquaria with a small air pump without a filter, or manuallyaerate the water three or more times a day by dishing out and pouring back waterto create bubbles.
TEACHER BACKGROUND
Content InformationClams, mussels, and oysters are essential to the ecology as well as to the economicpotential of the waters where they are found. Their population levels and healthmay indicate the condition of the water and the organisms found in it. They filterphytoplankton and other particulate matter from the water column and transfer itas biodeposits — feces and pseudofeces — to the sediment surface where it is a foodresource for other aquatic animals. The removal of this matter allows for better lightpenetration in the water for benthic plants that are light-dependent.
These mollusks all filter water for feeding and respiration. Otherwise, their life hab-its are very different. Clams partially bury themselves in sand and clay, living asinfaunal burrowers in relatively quiet water. Marine mussels attach to hard objectswith byssus threads, living epifaunally in relatively agitated water. Oysters glue theirleft shell valve to rocks and other shells, living epifaunally cemented in relativelyquiet water.
Filter-feeding mollusks are some of the first order consumers that feed on algae.They remove large amounts of these planktonic organisms from the water and thusparticipate in a natural cleansing process. Normally, they are able to assist in reduc-ing the intensity of algal blooms. It has been estimated that the population of oys-ters living in the Chesapeake Bay was once so great that they could filter the entirevolume of water in a few days, but they have declined so much that this process nowtakes over a year (Newell, 1988). In other areas, species of mollusks that have beenintroduced, like the asiatic clam, Corbicula, and the zebra mussel, Dreissenapolymorpha, have proliferated to the point where special removal steps must be takento prevent them from blocking the water intake pipes of water treatment plants andfactories.
Chemical testing and biological assays reveal that human activities have influencedwater quality of our rivers, lakes and estuaries significantly. One of the factors con-tributing to the deterioration of water quality is the disruption of the balance be-tween producers and consumers. This disruption results, for example, in the algalblooms that occur during the summer in many waterways. The prolific growth ofthe algae is the result of large inputs of nitrates and phosphates. These nutrientscome from agricultural runoff, sewage treatment outflows, or even acid rain.
A stable environment is necessary to the survival of all organisms and those thatdirectly or indirectly depend upon them. Some species are unable to adapt even toslight changes in environmental factors, such as salinity, water temperature andmovement, food source, oxygen levels. Other organisms are able to adapt and com-pensate within limits to changes in these factors. For example, organisms in anestuarine environment must be highly tolerant of fluctuating salinity levels.
In 1972, the impact of tropical storm Agnes’ continued rainfall was observed notonly in the Susquehanna watershed, but many kilometers away throughout theChesapeake Bay. There were high mortality rates of organisms even in estuaries dueto freshwater extending far into the estuaries. In addition, the low density freshwa-ter covering the surface of the estuary prevented the water column from mixing toreoxygenate waters below. Without oxygen in the bottom waters, anaerobic bacteriareplaced aerobic bacteria. Instead of oxygen, the anaerobic bacteria produced hy-drogen sulfide gas that was toxic to other aerobic organisms. A change in one envi-ronmental factor had devastating effects for the entire ecosystem.
TEACHER’S NOTES

204 Student Research Impact of Mollusks
In addition to creating nutrient fluxes, rain and irrigation produce periodic changesin turbidity as the runoff carries a heavy sediment load. Where fires rage becausesmaller natural fires have been reduced or where lands have been cleared for develop-ment, the sediment load can be extremely high. Filter-feeding mollusks have a mecha-nism to clear some of the excess particulates, but when the concentration of sus-pended particles becomes high, the filtration rate slows and some species starve todeath or suffocate.
Dorsala.
Right gill Mouth
Labialpalps
Anterior
VentralValve(flap)
Inhalantsiphon
Posterior
Exhalantsiphon
Mercenaria mercenaria (hardshell clam) left valve Mytilus edulis (blue mussel) left valveByssus Foot
Mouth
Labialpalps
Right gill
Exhalantsiphon
Inhalantregion
Ventral
Dorsal
Posterior Anterior
b.
Anterior
c.Mouth
Labialpalps
Gill
Mantle
Ventral
PosteriorCrassostrea virginica (eastern oyster) left valve
Dorsal
Exhalantregion
Anus
Adductormuscle Heart
Inhalant region
Adductormuscles
Adductormuscle
Figure 1. a. Mercenaria mercenaria (hardshell clam). b. Mytilus edulis (blue mussel). c.Crassostrea virginica (eastern oyster).
Bivalves create a current of water through their bodies by the beating of microscopiccilia on the surface of their gills and labial palps. See Figure 1. As water moves overthe gills, inorganic and organic particles, which are their source of food, are caughtby the gill cilia. They also may filter out the organisms responsible for paralyticshellfish poisoning. Particles larger than 2.0 to 3.0 µm are removed, but zebra mus-sels and asiatic clams are able to filter even smaller particles (1.0 µm). Non-nutri-tious particles are discarded as pseudofeces, while food particles are taken into thedigestive tract. Pseudofeces are discarded by valve clapping. Indigestible fecal matteris bound together by mucus, released into a cavity near the exhalant siphon, andexpelled on exhalant currents.
Many forms of pollutants are detrimental to the health of bivalves. These includeorganic sewage effluents, chlorine, and industrial effluents. Many times the health ofthe adult animal is not affected directly but their reproductive capacity is, and anunhealthy population results. Heavy metals may accumulate in their flesh. Whenthe flesh is eaten by a predator such as a bird, a starfish, or even a human, the toxinsare transferred to the predator. Many oyster beds have been closed to commercialharvesting due to potential fecal contamination. This has no adverse effects on shell-fish, but may be a human health risk.
TEACHER’S NOTES

Student Research 205Impact of Mollusks
Phytoplankton and bacteria are major sources of food for oysters. One particularspecies of algae, Isochrysis galbana, recommended here as a lab food source, is amember of the Chrysophyta phylum. This species has two flagella at its anterior endand is a unicellular, motile sphere approximately 5 µm in diameter. The normalconcentration of algae in natural waters may be in the range of several thousand permilliliter. In this lab, concentrations may reach 107 cells per milliliter.
Figure 2. Isochrysis sp. (Newell & Newell, 1967).
Pedagogical Information
The following is a chart of some concepts related to this lab and some studentmisconceptions of these concepts:
INSTRUCTIONAL PROCEDURES FOR THE CORE EXPERIMENT
IntroductionObtain several live bivalves and demonstrate with carmine powder how water flowsthrough the organisms. This can be done by using an eyedropper to transfer a dropof carmine powder mixed in a few milliliters of water to the water around the mol-lusk. Ask students what the organisms may add or remove from the water. Refer toFigure 1 to orient students to ventral and dorsal aspects. Bivalves produce two typesof biodeposits — feces and pseudofeces — that in oysters are expelled on oppositesides of the organism. In bivalves with siphons, i.e. all clams and mussels, pseudofecesare ejected through the inhalant siphon and feces are expelled through the exhalantsiphon. Identify the posterior and anterior ends of the specimen. Siphons or inhal-ant apertures are at the posterior end and labial palps are at the anterior end.
TEACHING TIPS• Keep the list of hypotheses your
students generate in class discussion.They may be helpful in the studentdesign phase if a group is havingdifficulty.
• These data for this variation arepresented as a scatter graph. Theyalso could be presented as a bar graphof total deposits.
• A cross-curriculum project could bedeveloped with the home economicsor cooking courses.
• Living oysters and mussels areavailable from biological supplyhouses or seafood markets.
• If oysters are unavailable, hardshellclams or blue mussels may besubstituted. If freshwater mollusksare used, set up freshwater instead ofsaltwater aquaria.
• If it is not convenient to have bothclams and oysters, use one bivalveand study the filtering effect ofincreased numbers of bivalves. Forexample, place 3 bivalves inAquarium 1 and 6 bivalves inAquarium 2. Sample Data would beas follows:
InterpretationThe greater the number of bivalves, themore material filtered from the water.
• Try to use different individualorganisms for each variation.
• Feeding varies by body size. Try toreduce variation between treatmentsby matching animal sizes intreatment aquaria.
• Remove dead animals promptlybecause as they decay they foul thewater quickly. If an animal’s shell ismore than 1 mm open, touch theanimal lightly. If it does not respondby closing, attempt to pull open thevalves. If they open easily, the animalis dead.
• Freshly collected animals can survivefor weeks without eating. It ispreferable to feed them before youbegin the experiments. The best dietis mixed algae.
Misconception
• Good water quality means that thewater is clear without concern forother parameters.
• Turbidity in aquatic ecosystems isreduced only by settling of particu-late matter.
Correct Concept
• Clear water is not a sufficient indi-cator of water quality. Other indi-cators such as chemical, bacterial,and pollutant counts provide muchmore useful information regardingthe safety of water.
• Filter-feeding mollusks play a ma-jor role in reducing turbidity inaquatic ecosystems.
Condition Evidence Biodeposit Biodepositsof filtering volume (mL) per bivalve
3 Bivalves A little 0 to 1 0.033
6 Bivalves A lot 0 to 2 0.033
Unstocked No 0 to 0 0.0
206 Student Research Impact of Mollusks
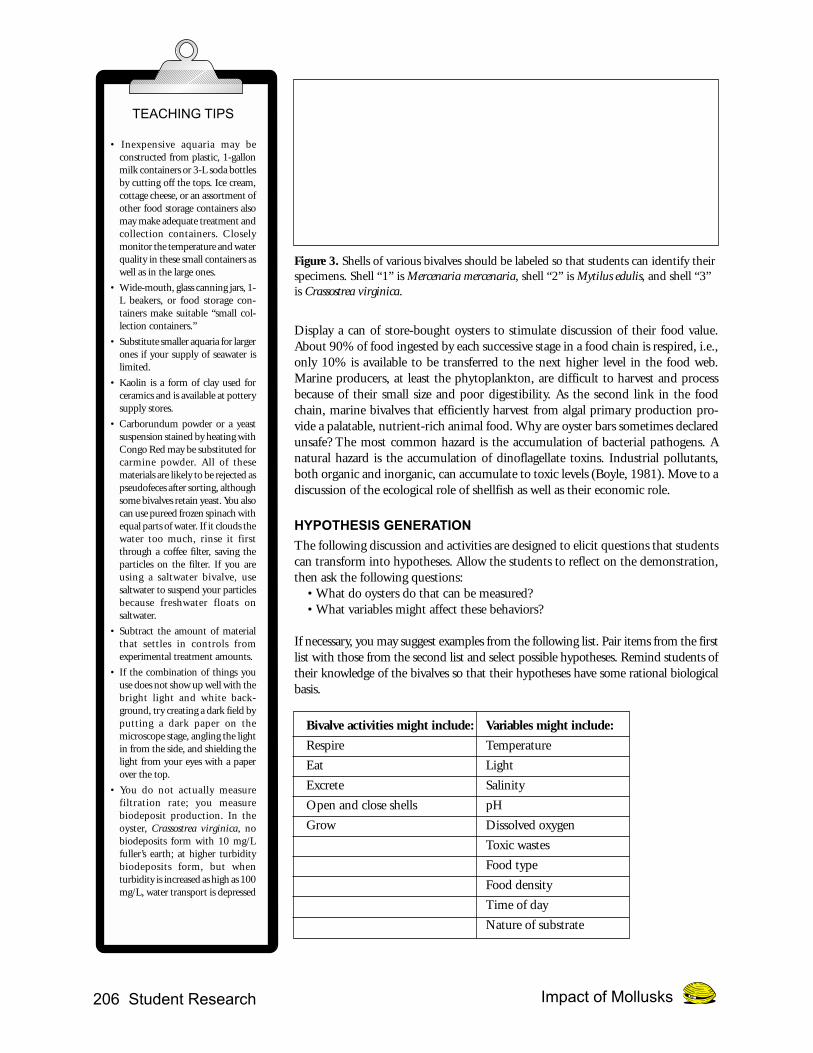
Figure 3. Shells of various bivalves should be labeled so that students can identify theirspecimens. Shell “1” is Mercenaria mercenaria, shell “2” is Mytilus edulis, and shell “3”is Crassostrea virginica.
Display a can of store-bought oysters to stimulate discussion of their food value.About 90% of food ingested by each successive stage in a food chain is respired, i.e.,only 10% is available to be transferred to the next higher level in the food web.Marine producers, at least the phytoplankton, are difficult to harvest and processbecause of their small size and poor digestibility. As the second link in the foodchain, marine bivalves that efficiently harvest from algal primary production pro-vide a palatable, nutrient-rich animal food. Why are oyster bars sometimes declaredunsafe? The most common hazard is the accumulation of bacterial pathogens. Anatural hazard is the accumulation of dinoflagellate toxins. Industrial pollutants,both organic and inorganic, can accumulate to toxic levels (Boyle, 1981). Move to adiscussion of the ecological role of shellfish as well as their economic role.
HYPOTHESIS GENERATION
The following discussion and activities are designed to elicit questions that studentscan transform into hypotheses. Allow the students to reflect on the demonstration,then ask the following questions: • What do oysters do that can be measured? • What variables might affect these behaviors?
If necessary, you may suggest examples from the following list. Pair items from the firstlist with those from the second list and select possible hypotheses. Remind students oftheir knowledge of the bivalves so that their hypotheses have some rational biologicalbasis.
Bivalve activities might include: Variables might include:
Respire Temperature
Eat Light
Excrete Salinity
Open and close shells pH
Grow Dissolved oxygen
Toxic wastes
Food type
Food density
Time of day
Nature of substrate
TEACHING TIPS
• Inexpensive aquaria may beconstructed from plastic, 1-gallonmilk containers or 3-L soda bottlesby cutting off the tops. Ice cream,cottage cheese, or an assortment ofother food storage containers alsomay make adequate treatment andcollection containers. Closelymonitor the temperature and waterquality in these small containers aswell as in the large ones.
• Wide-mouth, glass canning jars, 1-L beakers, or food storage con-tainers make suitable “small col-lection containers.”
• Substitute smaller aquaria for largerones if your supply of seawater islimited.
• Kaolin is a form of clay used forceramics and is available at potterysupply stores.
• Carborundum powder or a yeastsuspension stained by heating withCongo Red may be substituted forcarmine powder. All of thesematerials are likely to be rejected aspseudofeces after sorting, althoughsome bivalves retain yeast. You alsocan use pureed frozen spinach withequal parts of water. If it clouds thewater too much, rinse it firstthrough a coffee filter, saving theparticles on the filter. If you areusing a saltwater bivalve, usesaltwater to suspend your particlesbecause freshwater floats onsaltwater.
• Subtract the amount of materialthat settles in controls fromexperimental treatment amounts.
• If the combination of things youuse does not show up well with thebright light and white back-ground, try creating a dark field byputting a dark paper on themicroscope stage, angling the lightin from the side, and shielding thelight from your eyes with a paperover the top.
• You do not actually measurefiltration rate; you measurebiodeposit production. In theoyster, Crassostrea virginica, nobiodeposits form with 10 mg/Lfuller’s earth; at higher turbiditybiodeposits form, but whenturbidity is increased as high as 100mg/L, water transport is depressed
Student Research 207Impact of Mollusks
SAMPLE HYPOTHESES
• Oyster feeding rates will remain constant within a fixed range of salinities.• Feeding rates will be greater in the dark than in the light.• Heart rates will increase with a decrease in oxygen concentration.
On the following pages are a sample hypothesis, procedure, and data analysis set withinterpretation that students might develop for the Core Experiment. It is followed by arelated test question and answer for teacher evaluation. This example has been includedas a potential outcome of the activity and should not be given to the students. Studentsshould develop their own hypotheses and procedures. Make sure they understand thatthere is not just one correct hypothesis, procedure, or data set. The Variations of the CoreExperiment will give each team of students the opportunity to expand on the Core Hy-pothesis. Additional test questions are found on page 214.
QuestionWhat role does filtering play in the life of a mollusk?
HypothesisBoth oysters and clams actively remove algae from the water.
RationaleBivalves feed by filtering particulate matter from water. When exposed to increasedturbidity, their filtering rate declines although the total amount of particles removedfrom the water will increase. However, when a mollusk takes in too much inedibleparticulate matter, it will impact negatively on the life functions of the mollusk. Theresult will depend on the relative weight and size of the oysters and clams.
ProcedureDay 11. Place 3 small marine aquaria with artificial seawater in a dark, quiet place.2. Aerate the water in the aquaria manually by dishing out and pouring back water
to create bubbles, 5 or more times daily. Include when you first arrive in themorning and before you leave school each day.
Day 21. Place 1 each of 5 small, healthy clams in one half of a petri dish. Place the petri
dishes in 1 aquarium. Repeat this procedure with 5 small, healthy oysters in asecond aquarium, and with 5 empty clam or oyster shells for the control in athird aquarium. See Figure 4.
2. Acclimate to room temperature for 1 to 2 weeks.
by 50%. Some oysters can tolerateup to 700 mg/L silt (Jørgensen,1966).
• If only small amounts of biodepositsare produced, a measuring devicemay be made from a tuberculin (1-mL) syringe. Plug the attachmentpoint for a needle with a piece of pipecleaner or cotton. The syringe canbe cleaned and reused. A serologicalpipette graduated to the tip alsomakes a good substitute for a smallgraduated cylinder.
TEACHING TIPS

208 Student Research Impact of Mollusks
Figure 4. Experimental design setup.
One week later1. Add a mixture of 0.5 g of kaolin mixed in 0.25 L of seawater to each of the 3
aquaria. Stir the water gently to homogenize.2. Keep all 3 aquaria in a dark, quiet place and allow the bivalves to filter the water,
undisturbed, for 24 hours.
Next day1. After the 24-hour period, examine the water in each of the petri dishes in the 3
aquaria for evidence of filtering to determine the presence of fecal and pseudofecalpellets.
2. Measure the biodeposits produced by each clam and oyster using the followingprocedure:a. With a Pasteur pipette, remove the biodeposits produced by each organism
from the petri dish.b. Transfer the biodeposits produced to separate 10-mL graduated cylinders.c. Allow the biodeposits to settle and read the number of milliliters on the cylin-
TEACHER’S NOTES
Student Research 209Impact of Mollusks
der. This number gives a crude measure of biodeposits produced that is anindirect measure of filtration and feeding rate.
DATA ANALYSIS AND INTERPRETATION
Sample Data
Condition Evidence of filtering Biodeposit volume
Clams Only a little > 0.1-mL
Oysters Yes 0.2-mL
Unstocked No 0.0-mL
TEST QUESTION
Why would you expect extremely high concentrations of suspended particles toreduce filtration rates? Do your data support a reduction in rates at high concentra-tions?
STUDENT DESIGN OF THE NEXT EXPERIMENT
After students have collected and analyzed these data from their experiments andshared results and conclusions with the class, encourage them to brainstorm ideasfor additional experiments. They should think of questions that occurred to them asthey conducted their first experiment. Ask them what quantifiable experiments couldbe done based on observations they have made.
Have students return to their experimental lab groups to share ideas before writingtheir proposals. Questions students may suggest include the following: • How will factors such as temperature, pH, or salinity affect biodeposition rates? • Do the rates of biodeposit production differ among oysters, clams, and mussels?
SUGGESTED MODIFICATIONS FOR STUDENTS WHO ARE
EXCEPTIONAL
These are possible ways to modify this specific activity for students who have specialneeds, if they have not already developed their own adaptations. General sugges-tions for modification of activities for students with disabilities are found in theAAAS Barrier-Free in Brief publications. Refer to p. 15 of the introduction of thisbook for information on ordering FREE copies of these publications. Some of thesebooklets have addresses of agencies that can provide information about obtainingassistive technology, such as Assistive Listening Devices (ALDs); light probes; andtalking thermometers, calculators, and clocks.
Blind or Visually Impaired• Have the student who is visually impaired do library research on a scientist, such
as Dr. Geerat Vermeij. Dr. Vermeij has been blind since the age of 3 and is wellknown for his ability to identify mollusks simply by the use of touch (Vermeij,1996b). Sighted students may wish to identify different species of mollusks pro-vided by the instructor by using just the sense of touch.
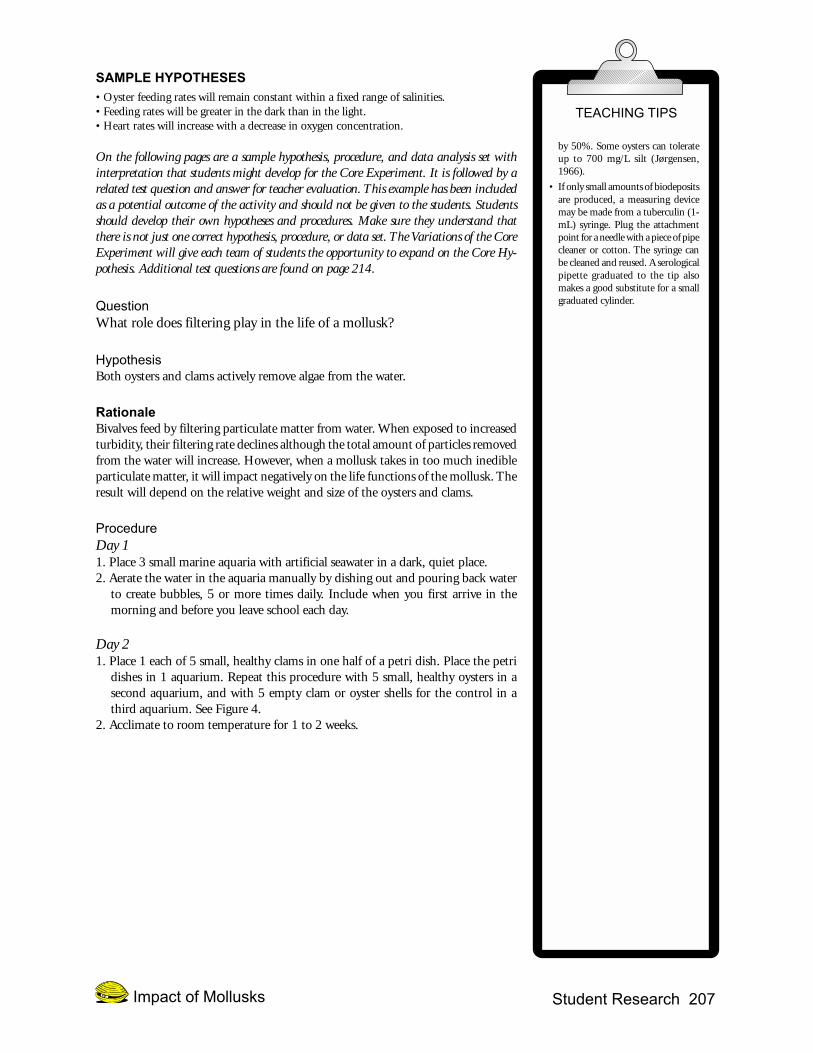
• Prepare raised-line drawings or braille paintings of the cross section of the mussel,clam, and oyster shown in Figure 1 of the Core Experiment. Enlarge each mol-lusk to the size of a sheet of braille paper. See Figure 5.
InterpretationOysters are more productive atfiltering particulate matter from thewater.
Answer to Test QuestionFilter-feeding bivalves depend onciliary filtering and sorting. If thefiltering mechanism is overwhelmedby sediment, the organism will beunable to obtain adequate oxygen oradequate nutrients. Shutting down thefiltration system while suspendedparticle density is high could be moreefficient than continuing to cleandebris from the gills. Many bivalvesare unable to survive in waters withhigh silt. These data do not supportthe hypothesis that there is a reductionin filtration rate at high concentrationsof suspended particles because onlyone particle concentration was tested.At least two concentrations are neededto test this hypothesis.
210 Student Research Impact of Mollusks
Figure 5. Making a raised-line drawing with a stylus on braille graph paper.
• Transfer a drop of carmine powder in solution to the water around the mollusk.Visually impaired students may be able to detect the path of the carmine in thegills with a light sensor.
• Provide students who are blind with a variety of mollusks to understand the differ-ences in the animals used in this activity.
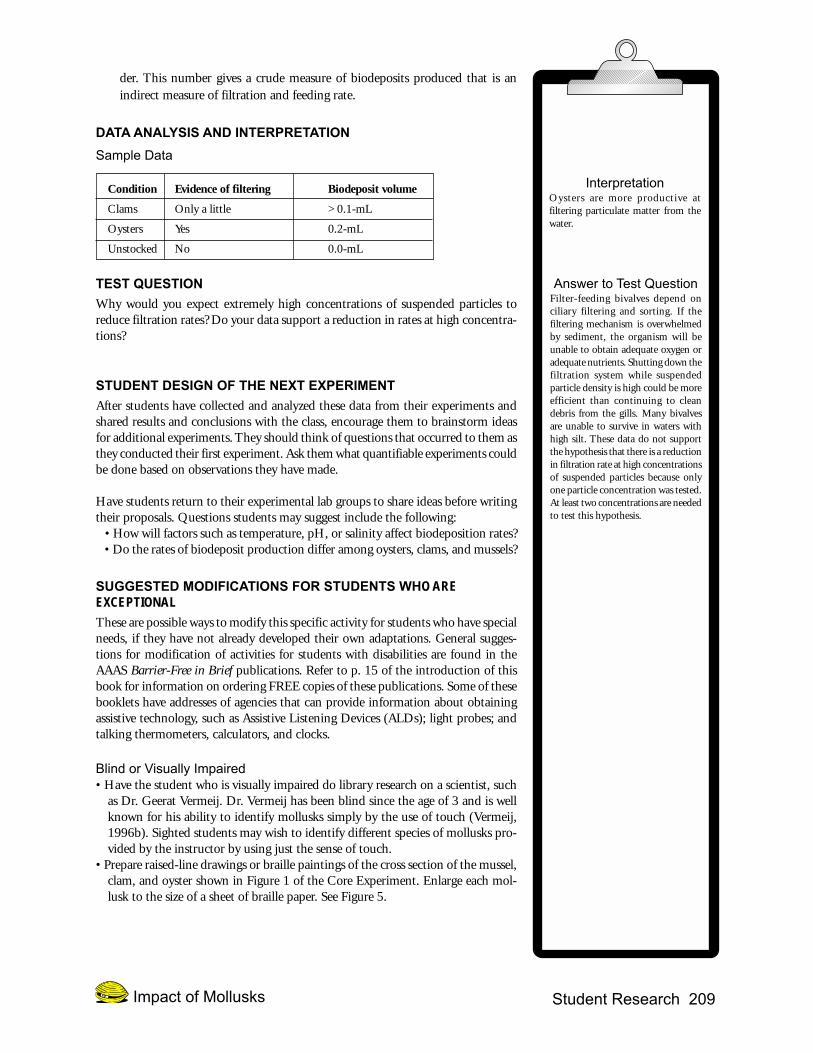
• Have a sighted lab partner remove the biodeposits produced by each mollusk witha pipette and place them in a 10-mL plastic graduated cylinder with raised linesfor volume amounts. The student who is visually impaired can use a thumbnail orplastic card to determine the number of spaces indicating volume. With a lightsensor, the student can determine the amount of pseudofeces produced by locat-ing the line that separates the pseudofeces from the liquid. See Figure 6.
Figure 6. Using the light probe to determine liquid level in a plastic graduated cylinderwith raised lines for volume amounts. Accuracy from ± 1 or 2 mL varies with theexperience of the operator and the type of probe used.
Deaf or Hard-of-HearingThere are no specific concerns related to this investigation for the hearing impaired.Evaluate the communication skills within the groups containing members who aredeaf.
TEACHER’S NOTES
Student Research 211Impact of Mollusks
GiftedHave the students who are gifted do independent research on the local mollusks,gathering information for a class report on the population, habitat characteristics,life cycle, and ecology of the organisms. They could contact mentors from localuniversities, museums, or shell-collecting clubs and work on ways to use computer-ized data collection methods both in the lab and in the field.
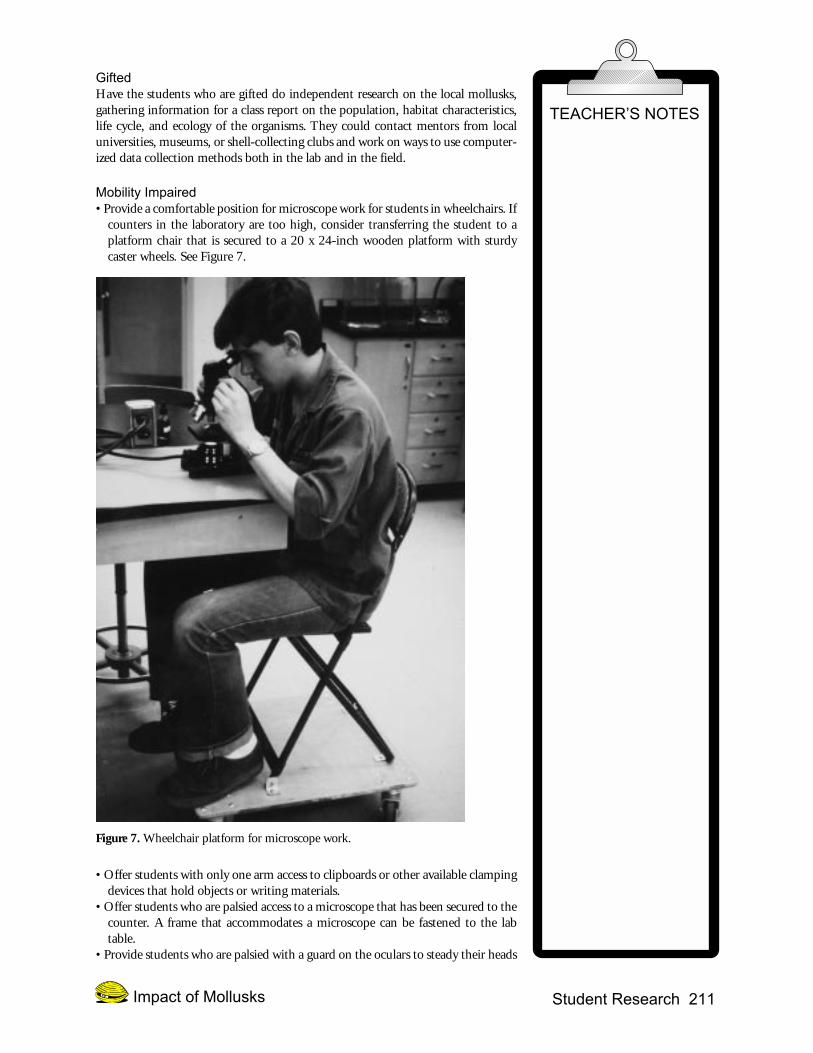
Mobility Impaired• Provide a comfortable position for microscope work for students in wheelchairs. If
counters in the laboratory are too high, consider transferring the student to aplatform chair that is secured to a 20 x 24-inch wooden platform with sturdycaster wheels. See Figure 7.
Figure 7. Wheelchair platform for microscope work.
• Offer students with only one arm access to clipboards or other available clampingdevices that hold objects or writing materials.
• Offer students who are palsied access to a microscope that has been secured to thecounter. A frame that accommodates a microscope can be fastened to the labtable.
• Provide students who are palsied with a guard on the oculars to steady their heads
TEACHER’S NOTES
212 Student Research Impact of Mollusks
while using a microscope. The small, inexpensive rubber shields such as thoseused on cameras to keep out stray light work well.
• Provide a bar on the microscope’s fine and course adjustments that will allow themto be turned easily.
ADDITIONAL TEST QUESTIONS
Test questions for the Core Experiment may include the following:1. Identify the independent and dependent variables in this experiment.2. Identify the limitations in this experiment in terms of number of trials and ex-
plain how the experiment could be improved.3. Design an experiment to determine the effect of temperature on the ability of
oysters to remove particles from the water.
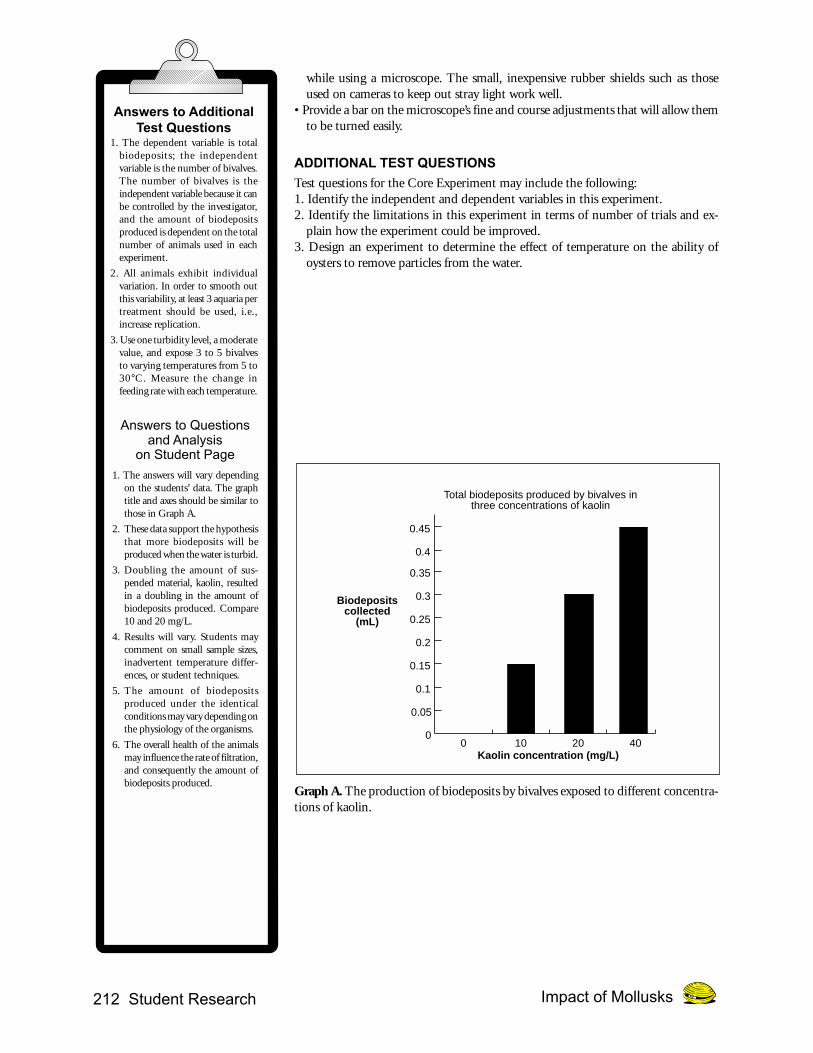
Graph A. The production of biodeposits by bivalves exposed to different concentra-tions of kaolin.
Answers to AdditionalTest Questions
1. The dependent variable is totalbiodeposits; the independentvariable is the number of bivalves.The number of bivalves is theindependent variable because it canbe controlled by the investigator,and the amount of biodepositsproduced is dependent on the totalnumber of animals used in eachexperiment.
2. All animals exhibit individualvariation. In order to smooth outthis variability, at least 3 aquaria pertreatment should be used, i.e.,increase replication.
3. Use one turbidity level, a moderatevalue, and expose 3 to 5 bivalvesto varying temperatures from 5 to30°C. Measure the change infeeding rate with each temperature.
Answers to Questionsand Analysis
on Student Page
1. The answers will vary dependingon the students’ data. The graphtitle and axes should be similar tothose in Graph A.
2. These data support the hypothesisthat more biodeposits will beproduced when the water is turbid.
3. Doubling the amount of sus-pended material, kaolin, resultedin a doubling in the amount ofbiodeposits produced. Compare10 and 20 mg/L.
4. Results will vary. Students maycomment on small sample sizes,inadvertent temperature differ-ences, or student techniques.
5. The amount of biodepositsproduced under the identicalconditions may vary depending onthe physiology of the organisms.
6. The overall health of the animalsmay influence the rate of filtration,and consequently the amount ofbiodeposits produced.
0 10 20 400
0.05
0.1
0.15
0.2
0.25
0.3
0.35
Biodepositscollected
(mL)
Kaolin concentration (mg/L)
Total biodeposits produced by bivalves inthree concentrations of kaolin
0.4
0.45
Student Research 213Impact of Mollusks
REFERENCES AND SUGGESTED READINGS
Anonymous. (1996). Zebra mussels–the bright side. Discover, 17(8), 18-19.Baptist, G., Meritt, D. & Webster, D. (1993). Growing Microalgae to Feed Bivalve
Larvae. Northeastern Regional Aquaculture Center Fact Sheet No. 160.Boyle, P.R. (1981). Molluscs and Man. London: Edward Arnold Limited.Cummings, K. & Mayer, C. (1996). The decline of freshwater mussels in Illinois.
Illinois Natural History Survey Reports, 339, 3.Dietz, T.H., Wilcox, S. J., Byrne, R.A., Lynn, J.W. & Silverman, H. (1996). Os-
motic and ionic regulation of North American zebra mussels (Dreissenapolymorpha). American Zoologist, 36, 364-372.
Hill, R.B. & Welsh, J.H. (1966). Heart, circulation, and blood cells. In K. M.Wilbur & C.M. Yonge (Eds.), Physiology of Mollusca, Vol. II. New York: AcademicPress, Inc., 125-174.
Holden, C. (1998). Leveling the playing field for scientists with disabilities. Science(282), October 2, 36-37.
Jørgensen, C.B. (1966). Biology of Suspension Feeding. London: Pergamon Press.Kennedy, V.S., Newell, R.E. & Eble, A.F. (Eds.). (1997). The Eastern Oyster Crassostrea
virginica. College Park, MD: A Maryland Sea Grant Book.Luoma, J.R. (1996). Biography of a lake. Audubon, 98(5), 66-101.McMahon, R.F. (1991). Mollusca: Bivalvia. In J. H. Thorp & A.P. Covich (Eds.),
Ecology and Classification of North American Freshwater Invertebrates. San Diego,CA: Academic Press, Inc., 315-400.
Newell, R.E. (1988). Ecological changes in Chesapeake Bay: Are they the result ofoverharvesting the American oyster, Crassostrea virginica? In Understanding theEstuary: Advances in Chesapeake Bay Research. Proceedings of a Conference. Balti-more: Chesapeake Research Consortium Publication 129, 536-546.
Newell, R.E. & Newell, R. C. (1967). Marine Plankton. London: Hutchinson Edu-cational.
Pollack, S. (1996). Holding the world at bay–Two men, one goal: Saving the Chesa-peake. Sierra, 81(3), 50-85.
Ram, J. L. & McMahon, R.F. (Eds.). (1996). The biology, ecology, and physiologyof zebra mussels [Special issue]. American Zoologist, 36(3), 239-243.
Selcraig, B. (1996). What is a wetland? Sierra, 81(3), 44-49.Vermeij, G. (1996a). Privileged Hands: A Scientific Life. New York: W.H. Freeman
and Company.Vermeij, G. (1996b). The touch of a shell, Discover, (17)8, 76-81.
POSSIBLE SOURCES OF MENTORS
National Marine Fisheries Service, Milford, CT 06460Access shellfish groups on the Internet and ask for a response from a nearby scien-tist.
VARIATIONS ON THE CORE EXPERIMENT
After completing the Core Experiment, students should use the results to develop avariation on that experiment. The following directions are meant only as a guide forthe teacher. They suggest possible hypotheses students may develop and data thatmay result.
Note to Teachers: Only information that is unique to each Variation of the Core Experi-ment is found in this section. Unless otherwise noted, teacher information not listed foreach variation is the same as that found in the Core Experiment. Materials listed in thissection are needed in addition to the materials listed for the Core Experiment.
TEACHER’S NOTES
214 Student Research Impact of Mollusks
VA
RIA
TIO
N 1
VARIATION 1The Effect of Turbidity on Bivalve Filtering Rates
Note to Teachers: In addition to the information found in the Core Experiment, thefollowing material has been provided for Variation 1.
SYNOPSIS
Students will compare the effects of increased turbidity on bivalve filtering rates.
ADDITIONAL MATERIALS NEEDED
You will need the following for a class of 24:12 live bivalves, such as eastern oysters (Crassostrea virginica), mussels (Mytilus edulis), or asiatic clams (Corbicula fluminea)1 permanent marker1 scrub brush5 treatment aquaria20 L natural or artificial seawater or 20 L freshwater12 small collection containers2 g kaolin1 thermometer (ºC)5 air lines5 air stones1 aquarium pump1 Pasteur pipette with bulb or transfer pipette4 10-mL graduated cylinders
HYPOTHESIS GENERATION
QuestionHow does the influence of particle concentration on feeding rate differ betweendifferent species of bivalves?
Sample HypothesisBivalve filtering rates will increase as the turbidity increases within a fixed range.
RationaleThere is an optimum filtering rate with increasing turbidity. At some level “x,” thebivalve will not be able to filter at a capacity that will maintain a healthy state, andthe organism may suffocate.
Sample Experimental Procedure1. On the first day of the experiment, set up 4 treatment aquaria with water like that
in the maintenance aquarium described in the Core Experiment.2. Aerate and heat the water to the same temperature as the maintenance aquarium.
Set the treatment aquaria in a place to maintain temperatures.3. Add kaolin to the containers to produce the concentrations shown in Table 1.
Make sure students know that kaolin is not a food source for the mollusks. Kaolinmust be added to a few milliliters of tap water to produce a slurry before dissolv-ing it in a larger volume of water. Remember to use dechlorinated water as thebase for freshwater organisms and seawater as the base for marine organisms. Ifsupplies of lab materials are limited, each group of students can set up the experi-ment with a different container. Class data may be pooled.
TEACHER’S NOTES
Student Research 215Impact of Mollusks
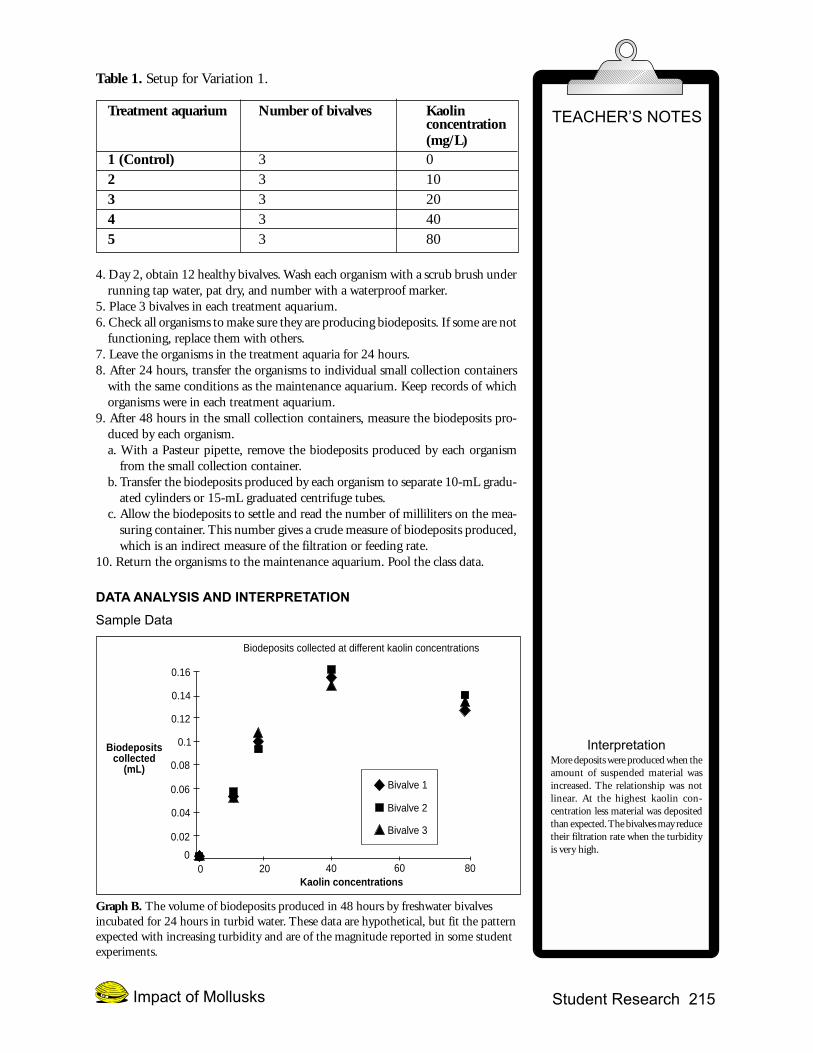
Table 1. Setup for Variation 1.
Treatment aquarium Number of bivalves Kaolinconcentration(mg/L)
1 (Control) 3 02 3 103 3 204 3 405 3 80
4. Day 2, obtain 12 healthy bivalves. Wash each organism with a scrub brush underrunning tap water, pat dry, and number with a waterproof marker.
5. Place 3 bivalves in each treatment aquarium.6. Check all organisms to make sure they are producing biodeposits. If some are not
functioning, replace them with others.7. Leave the organisms in the treatment aquaria for 24 hours.8. After 24 hours, transfer the organisms to individual small collection containers
with the same conditions as the maintenance aquarium. Keep records of whichorganisms were in each treatment aquarium.
9. After 48 hours in the small collection containers, measure the biodeposits pro-duced by each organism.a. With a Pasteur pipette, remove the biodeposits produced by each organism
from the small collection container.b. Transfer the biodeposits produced by each organism to separate 10-mL gradu-
ated cylinders or 15-mL graduated centrifuge tubes.c. Allow the biodeposits to settle and read the number of milliliters on the mea-
suring container. This number gives a crude measure of biodeposits produced,which is an indirect measure of the filtration or feeding rate.
10. Return the organisms to the maintenance aquarium. Pool the class data.
DATA ANALYSIS AND INTERPRETATION
Sample Data
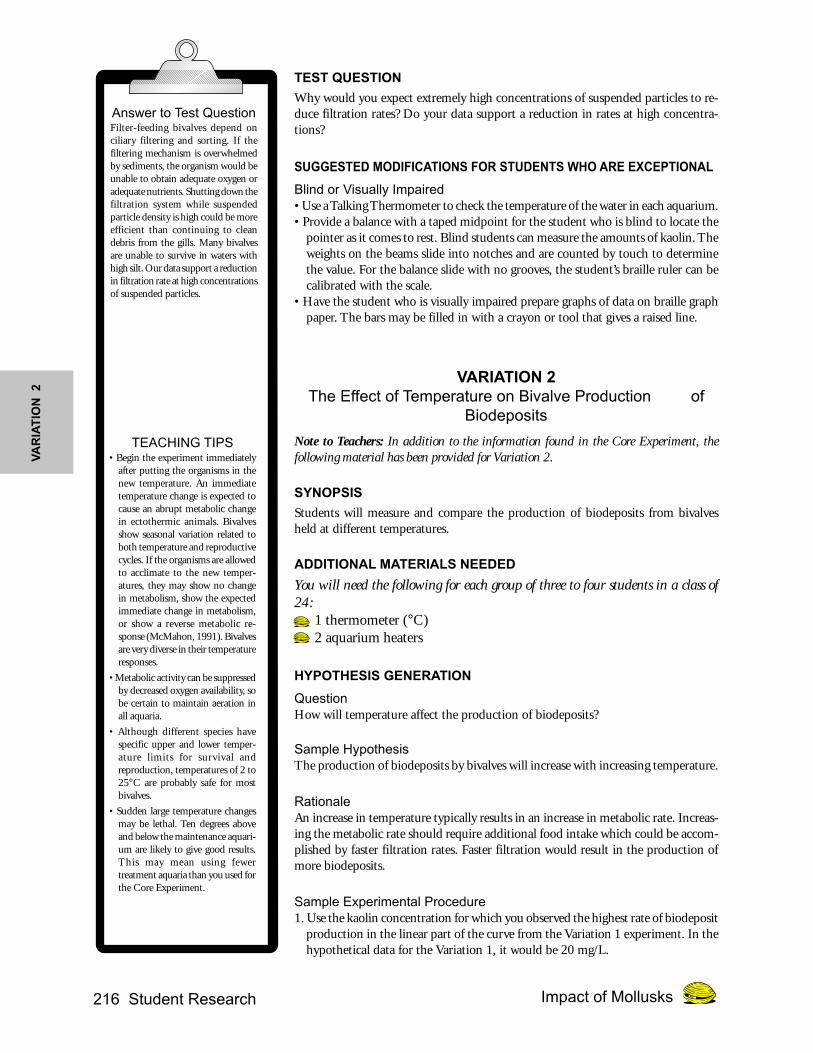
Graph B. The volume of biodeposits produced in 48 hours by freshwater bivalvesincubated for 24 hours in turbid water. These data are hypothetical, but fit the patternexpected with increasing turbidity and are of the magnitude reported in some studentexperiments.
TEACHER’S NOTES
InterpretationMore deposits were produced when theamount of suspended material wasincreased. The relationship was notlinear. At the highest kaolin con-centration less material was depositedthan expected. The bivalves may reducetheir filtration rate when the turbidityis very high.
0 20 40 600
0.02
0.04
0.06
0.08
0.1
0.12
Biodepositscollected
(mL)
Kaolin concentrations
Biodeposits collected at different kaolin concentrations
0.14
0.16
80
Bivalve 1
Bivalve 2
Bivalve 3
216 Student Research Impact of Mollusks
VA
RIA
TIO
N 2
TEST QUESTION
Why would you expect extremely high concentrations of suspended particles to re-duce filtration rates? Do your data support a reduction in rates at high concentra-tions?
SUGGESTED MODIFICATIONS FOR STUDENTS WHO ARE EXCEPTIONAL
Blind or Visually Impaired• Use a Talking Thermometer to check the temperature of the water in each aquarium.• Provide a balance with a taped midpoint for the student who is blind to locate the
pointer as it comes to rest. Blind students can measure the amounts of kaolin. Theweights on the beams slide into notches and are counted by touch to determinethe value. For the balance slide with no grooves, the student’s braille ruler can becalibrated with the scale.
• Have the student who is visually impaired prepare graphs of data on braille graphpaper. The bars may be filled in with a crayon or tool that gives a raised line.
VARIATION 2The Effect of Temperature on Bivalve Production of
Biodeposits
Note to Teachers: In addition to the information found in the Core Experiment, thefollowing material has been provided for Variation 2.
SYNOPSIS
Students will measure and compare the production of biodeposits from bivalvesheld at different temperatures.
ADDITIONAL MATERIALS NEEDED
You will need the following for each group of three to four students in a class of24:• 1 thermometer (°C)• 2 aquarium heaters
HYPOTHESIS GENERATION
QuestionHow will temperature affect the production of biodeposits?
Sample HypothesisThe production of biodeposits by bivalves will increase with increasing temperature.
RationaleAn increase in temperature typically results in an increase in metabolic rate. Increas-ing the metabolic rate should require additional food intake which could be accom-plished by faster filtration rates. Faster filtration would result in the production ofmore biodeposits.
Sample Experimental Procedure1. Use the kaolin concentration for which you observed the highest rate of biodeposit
production in the linear part of the curve from the Variation 1 experiment. In thehypothetical data for the Variation 1, it would be 20 mg/L.
Answer to Test QuestionFilter-feeding bivalves depend onciliary filtering and sorting. If thefiltering mechanism is overwhelmedby sediments, the organism would beunable to obtain adequate oxygen oradequate nutrients. Shutting down thefiltration system while suspendedparticle density is high could be moreefficient than continuing to cleandebris from the gills. Many bivalvesare unable to survive in waters withhigh silt. Our data support a reductionin filtration rate at high concentrationsof suspended particles.
TEACHING TIPS• Begin the experiment immediately
after putting the organisms in thenew temperature. An immediatetemperature change is expected tocause an abrupt metabolic changein ectothermic animals. Bivalvesshow seasonal variation related toboth temperature and reproductivecycles. If the organisms are allowedto acclimate to the new temper-atures, they may show no changein metabolism, show the expectedimmediate change in metabolism,or show a reverse metabolic re-sponse (McMahon, 1991). Bivalvesare very diverse in their temperatureresponses.
• Metabolic activity can be suppressedby decreased oxygen availability, sobe certain to maintain aeration inall aquaria.
• Although different species havespecific upper and lower temper-ature limits for survival andreproduction, temperatures of 2 to25°C are probably safe for mostbivalves.
• Sudden large temperature changesmay be lethal. Ten degrees aboveand below the maintenance aquari-um are likely to give good results.This may mean using fewertreatment aquaria than you used forthe Core Experiment.

Student Research 217Impact of Mollusks
2. Maintain the temperature of 1 aquarium and the control aquarium, i.e., shellsonly to account for the passive settling of the kaolin, at the same temperatureused in the maintenance aquarium.
3. Maintain constant temperatures 5 to 10°C different than the maintenanceaquarium in each of the other 2 aquaria.
4. Repeat the incubation and data collection procedure of Variation 1.
DATA ANALYSIS AND INTERPRETATION
Sample Data
Graph C. Relationship between biodeposit production and temperature. Note that at20°C, there is no kaolin.
TEST QUESTION
A student hypothesizes that bivalve filtration rates will increase with increasing tem-perature. Do the following data support that hypothesis? What biological explana-tion might account for these data?
Table 2. Biodeposit production at two temperatures.
Replicate Biodeposits (mL) collected at10°C 20°C
1 1.5 2.22 1.7 2.03 1.4 1.9Mean 1.53 2.03
• Some freshwater clams of the generaSphaerium, Musculium, and Corbi-cula do not show significant correla-tion between filtering rate andtemperature (McMahon, 1991).
• To maintain a temperature of 5°C,put the aquarium in a cooler on ice.
• In the oyster, Crassostrea virginica,optimum temperature for watertransport is around 20°C.
• The control in this experimentshould be dead bivalves, i.e., shellsonly, to account for the passivesettling of the kaolin.
TEACHING TIPS
InterpretationAccept the hypothesis if morebiodeposits are collected at hightemperatures than at low temper-atures. This would suggest thatmetabolic activities associated withfiltration are sensitive to environ-mental temperature as you wouldexpect in a ectotherm. Reject thehypothesis if there are fewer or thesame amount of biodeposits collectedat higher temperatures than at lowertemperatures. This would suggest thatsome other factor controls the rate offiltration.
Answer to Test QuestionThese data support the hypothesis thatthe filtration rate will be greater at ahigher temperature because 0.5 mLmore biodeposits were produced at thehigher temperature. Metabolic rateusually increases with increasingtemperature. The increase could berelated partly to the increased rate ofenzymatic functions at highertemperatures. This rate is less than anexpected doubling, but still supportsthe hypothesis.
20°C 10°C 15°C 20°C0
0.05
0.10
0.15
0.20
0.25
0.30
0.35
Biodepositscollected
(mL)
Temperature
Amount of biodeposits collected (mL) in various treatment conditions(includes 20 mg/L kaolin, except where noted)
0.40
0.45
0.50
No bivalves25°C
218 Student Research Impact of Mollusks
VA
RIA
TIO
N 3
SUGGESTED MODIFICATIONS FOR STUDENTS WHO ARE EXCEPTIONAL
Blind or Visually Impaired
• See the Core Experiment and Variation 1.
VARIATION 3The Effect of Water Salinity on Oyster Biodeposit
Production
Note to Teachers: In addition to the information found in the Core Experiment, thefollowing material has been provided for Variation 3.
SYNOPSIS
Students will measure and compare the biodeposit production of oysters or othermarine mollusks held at different levels of water salinity.
ADDITIONAL MATERIALS NEEDED
You will need the following for each group of three to four students in a class of 24:• Instant Ocean™
• 1 balance• 1 weigh boat• 1 scoop• 1 1-L graduated cylinder
HYPOTHESIS GENERATION
QuestionAre oysters adaptable to a range of salinities?
Sample HypothesisWithin a range of salinities, oyster feeding behavior will be constant.
RationaleLiving in an estuarine environment requires the ability to adapt to ever-changingconditions of salinity.
Sample Experimental Procedure1. Use the kaolin concentration for which you observed the highest rate of biodeposit
production in the linear part of the curve from the Variation 1 experiment. In thehypothetical data for Variation 1, this is 20 mg/L.
2. Maintain the salinity of 1 aquarium and the control aquarium with only bivalveshells at the same salinity used in the Core Experiment. In each of the other 3aquaria, use 10 to 35 ppt.
3. Allow the bivalves to acclimate to their saline environments for 24 hours beforeadding the kaolin. Incubate and collect data as in Variation 1.
TEACHING TIPS• For the oyster, Crassostrea virginica,
salinities from 25 to 39 ppt resultedin normal pumping activity, 20 pptin slower pumping, and below 13ppt no pumping (Jørgensen,1966).
• Use artificial seawater salts ratherthan sodium chloride, because ionimbalances with sodium chloridemay result in the death of animals(Dietz et al., 1996).
• Provide background on estuarinecommunities if students have notobserved this community pre-viously.
• Salts to make seawater of differentconcentrations, such as InstantOcean™, are available from mostpet stores.
• Note that only marine bivalves canbe used in this variation.
• The control in this experimentshould be just shells to account forthe passive settling of the kaolin.
Student Research 219Impact of Mollusks
DATA ANALYSIS AND INTERPRETATION
Sample Data
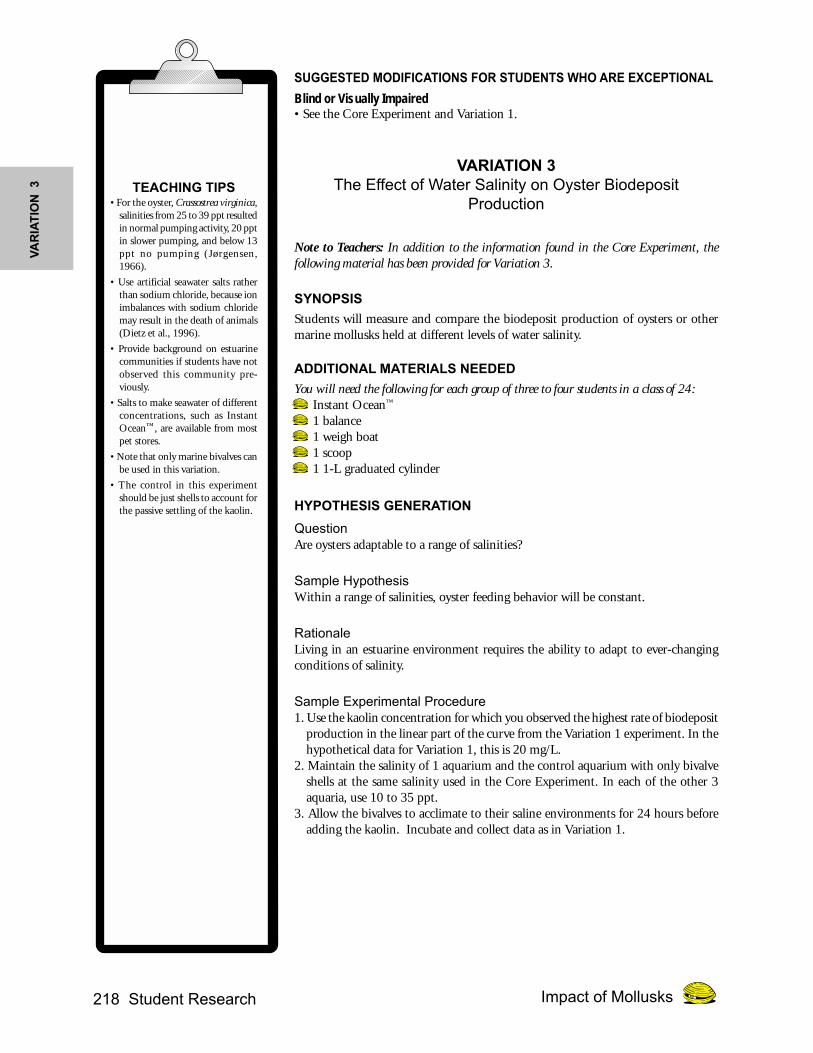
Graph D. Relationship between salinity and biodeposit production. Note that at 30ppt, there are no bivalves and no kaolin. The control in this experiment is just shellsto account for the passive settling of the kaolin.
TEST QUESTION
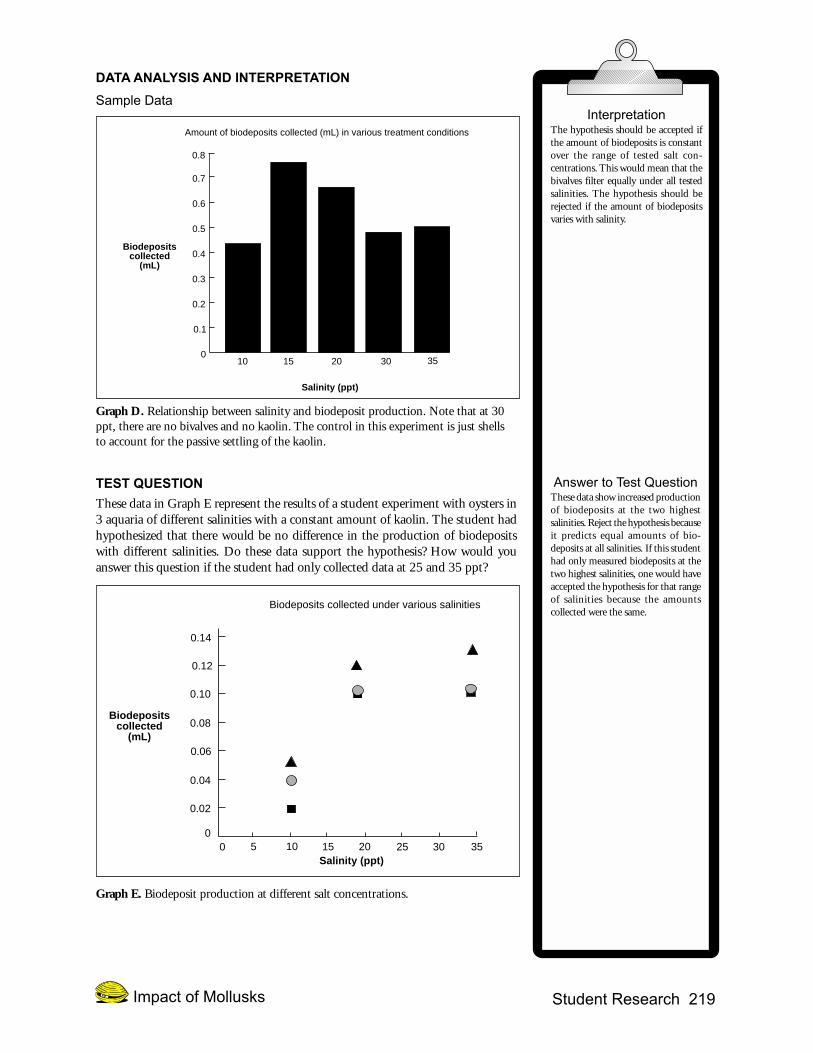
These data in Graph E represent the results of a student experiment with oysters in3 aquaria of different salinities with a constant amount of kaolin. The student hadhypothesized that there would be no difference in the production of biodepositswith different salinities. Do these data support the hypothesis? How would youanswer this question if the student had only collected data at 25 and 35 ppt?
Graph E. Biodeposit production at different salt concentrations.
InterpretationThe hypothesis should be accepted ifthe amount of biodeposits is constantover the range of tested salt con-centrations. This would mean that thebivalves filter equally under all testedsalinities. The hypothesis should berejected if the amount of biodepositsvaries with salinity.
10 15 20 300
0.1
0.2
0.3
0.4
0.5
0.6
0.7
Biodepositscollected
(mL)
Salinity (ppt)
Amount of biodeposits collected (mL) in various treatment conditions
0.8
35
Answer to Test QuestionThese data show increased productionof biodeposits at the two highestsalinities. Reject the hypothesis becauseit predicts equal amounts of bio-deposits at all salinities. If this studenthad only measured biodeposits at thetwo highest salinities, one would haveaccepted the hypothesis for that rangeof salinities because the amountscollected were the same.
0 10 20 300
0.02
0.04
0.06
0.08
0.10
0.12
0.14
Salinity (ppt)
Biodeposits collected under various salinities
5 15 3525
Biodepositscollected
(mL)
220 Student Research Impact of Mollusks
VA
RIA
TIO
N 4
SUGGESTED MODIFICATIONS FOR STUDENTS WHO ARE EXCEPTIONAL
Blind or Visually Impaired• See Variation 1.
VARIATION 4The Effects of Light on Feeding Activity
Note to Teachers: In addition to the information found in Variation 1, the fol-lowing material has been provided for Variation 4.
SYNOPSIS
Students will compare the disappearance of algae in the aquarium water in the lightand the dark.
ADDITIONAL MATERIALS NEEDED
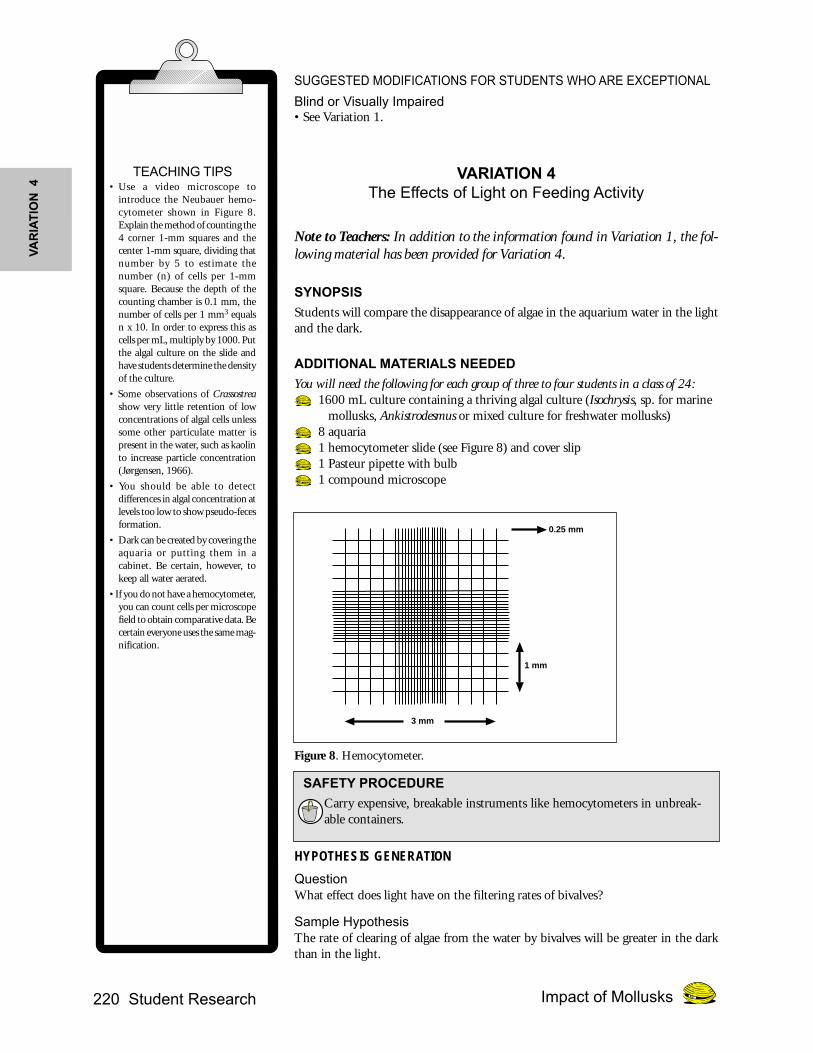
You will need the following for each group of three to four students in a class of 24:1600 mL culture containing a thriving algal culture (Isochrysis, sp. for marine mollusks, Ankistrodesmus or mixed culture for freshwater mollusks)8 aquaria1 hemocytometer slide (see Figure 8) and cover slip1 Pasteur pipette with bulb1 compound microscope
Figure 8. Hemocytometer.
SAFETY PROCEDURE
Carry expensive, breakable instruments like hemocytometers in unbreak-able containers.
HYPOTHESIS GENERATION
QuestionWhat effect does light have on the filtering rates of bivalves?
Sample HypothesisThe rate of clearing of algae from the water by bivalves will be greater in the darkthan in the light.
TEACHING TIPS• Use a video microscope to
introduce the Neubauer hemo-cytometer shown in Figure 8.Explain the method of counting the4 corner 1-mm squares and thecenter 1-mm square, dividing thatnumber by 5 to estimate thenumber (n) of cells per 1-mmsquare. Because the depth of thecounting chamber is 0.1 mm, thenumber of cells per 1 mm3 equalsn x 10. In order to express this ascells per mL, multiply by 1000. Putthe algal culture on the slide andhave students determine the densityof the culture.
• Some observations of Crassostreashow very little retention of lowconcentrations of algal cells unlesssome other particulate matter ispresent in the water, such as kaolinto increase particle concentration(Jørgensen, 1966).
• You should be able to detectdifferences in algal concentration atlevels too low to show pseudo-fecesformation.
• Dark can be created by covering theaquaria or putting them in acabinet. Be certain, however, tokeep all water aerated.
• If you do not have a hemocytometer,you can count cells per microscopefield to obtain comparative data. Becertain everyone uses the same mag-nification.
3 mm
0.25 mm
1 mm
Student Research 221Impact of Mollusks
RationalePhytoplankton, while abundant at the surface during the day, often sink to greaterdepths at night. Feeding at night may be more efficient than feeding during the day.
Sample Experimental Procedure
1. Set up 8 treatment aquaria with 1 L of water each. The water should be atthe temperature of the maintenance aquarium.
2. Place 3 bivalves in each of the 6 aquaria.3. One hour later, add 200 mL of algal culture to each treatment aquarium
and take a sample from one to estimate the initial cell concentration.4. Place 3 aquaria with bivalves and 1 control aquarium without bivalves in
the light. Place the other 3 treatment and 1 control aquaria in the dark.5. After 30 minutes, sample approximately 1 mL from each aquarium and
estimate the cell density with a hemocytometer.6. Repeat Step 5 at 2, 4, 6, 24, and 48 hours.7. Correct the density values for any algal growth or disappearance unre-
lated to the presence of bivalves with data from the light and dark controlaquaria maintained without bivalves.
DATA ANALYSIS AND INTERPRETATION
Sample Data
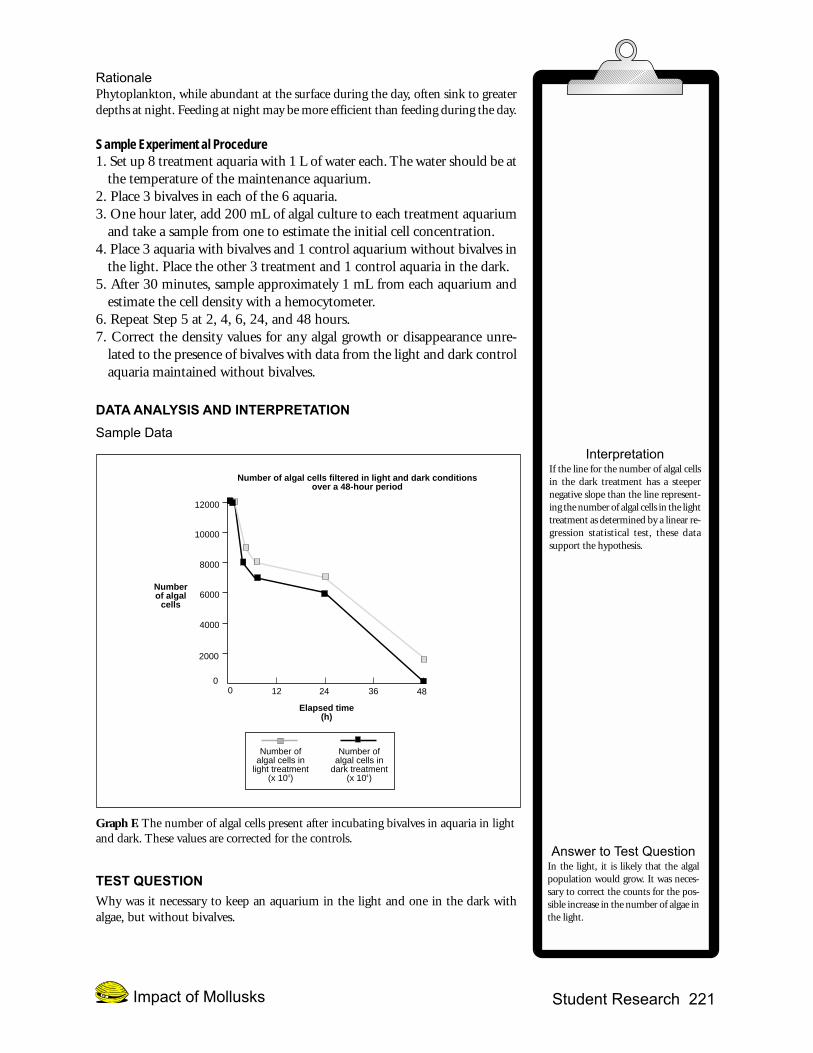
Graph F. The number of algal cells present after incubating bivalves in aquaria in lightand dark. These values are corrected for the controls.
TEST QUESTION
Why was it necessary to keep an aquarium in the light and one in the dark withalgae, but without bivalves.
InterpretationIf the line for the number of algal cellsin the dark treatment has a steepernegative slope than the line represent-ing the number of algal cells in the lighttreatment as determined by a linear re-gression statistical test, these datasupport the hypothesis.
Answer to Test QuestionIn the light, it is likely that the algalpopulation would grow. It was neces-sary to correct the counts for the pos-sible increase in the number of algae inthe light.
Number ofalgal cells in
light treatment(x 10 )
12 24 36 480
2000
4000
6000
8000
10000
12000
Numberof algal
cells
Elapsed time(h)
Number of algal cells filtered in light and dark conditionsover a 48-hour period
0
4
Number ofalgal cells in
dark treatment(x 10 )4
222 Student Research Impact of Mollusks
VA
RIA
TIO
N 5
SUGGESTED MODIFICATIONS FOR STUDENTS WHO ARE EXCEPTIONAL
Blind or Visually Impaired
• Use a light sensor to find changes in cultures due to algal growth. For more accu-rate measurement of single-cell green algae growth, use a spectrophotometer.
VARIATION 5The Effect of pH on Food Uptake
Note to Teachers: In addition to the information found in Variation 1, the followingmaterial has been provided for Variation 5.
SYNOPSIS
Students will compare biodeposit production of oysters exposed to vinegar withthose not exposed to vinegar.
ADDITIONAL MATERIALS NEEDED
You will need the following for each group of three to four students in a class of 24:• 10 mL undiluted 5.0% distilled vinegar• pH test papers or pH meter (optional)
HYPOTHESIS GENERATION
QuestionIs biodeposit production affected by acidic conditions?
Sample HypothesisThe production of biodeposits will decrease if bivalves are exposed to acidic condi-tions.
RationaleBivalves respond to adverse environmental conditions, such as poor water quality, byclosing the valves of their shells. When bivalves sense a reduction in pH, they re-spond by closing their valves and consequently their feeding activity also declines.
Sample Experimental Procedure1. Do not add vinegar to 1 aquarium; it will be the control.2. Amend each of 3 other treatment aquaria with different concentrations of vinegar
to obtain pH values from 4 to 7.3. Incubate and collect data as in Variation 1.
TEACHING TIPS• Acid rain or other sources of low
pH, such as mine effluents, can ad-versely affect freshwater bivalve pop-ulations by eroding shells (McMah-on, 1991).
• Low pH decreases the availabilityof calcium.
• Use a pH meter or pH test papersto determine the acidity of thetreatment aquaria.
• For Crassostrea virginica, loweringthe pH slightly from the normal7.75 produced a transient increasein pumping rate and later a decreasebelow the normal rate. At pH 6.5,activity always was reduced. At pH4.25, it was reduced to 10% of therate measured at a normal pH(Loosanoff & Tommers, 1947 inJørgensen, 1966).
• Most freshwater bivalves preferwater with pH greater than 7. Somespecies are relatively insensitive topH and can be found at a pH of4.7 to 8.3 (McMahon, 1991).
Student Research 223Impact of Mollusks
VA
RIA
TIO
N 6
DATA ANALYSIS AND INTERPRETATION
Sample Data
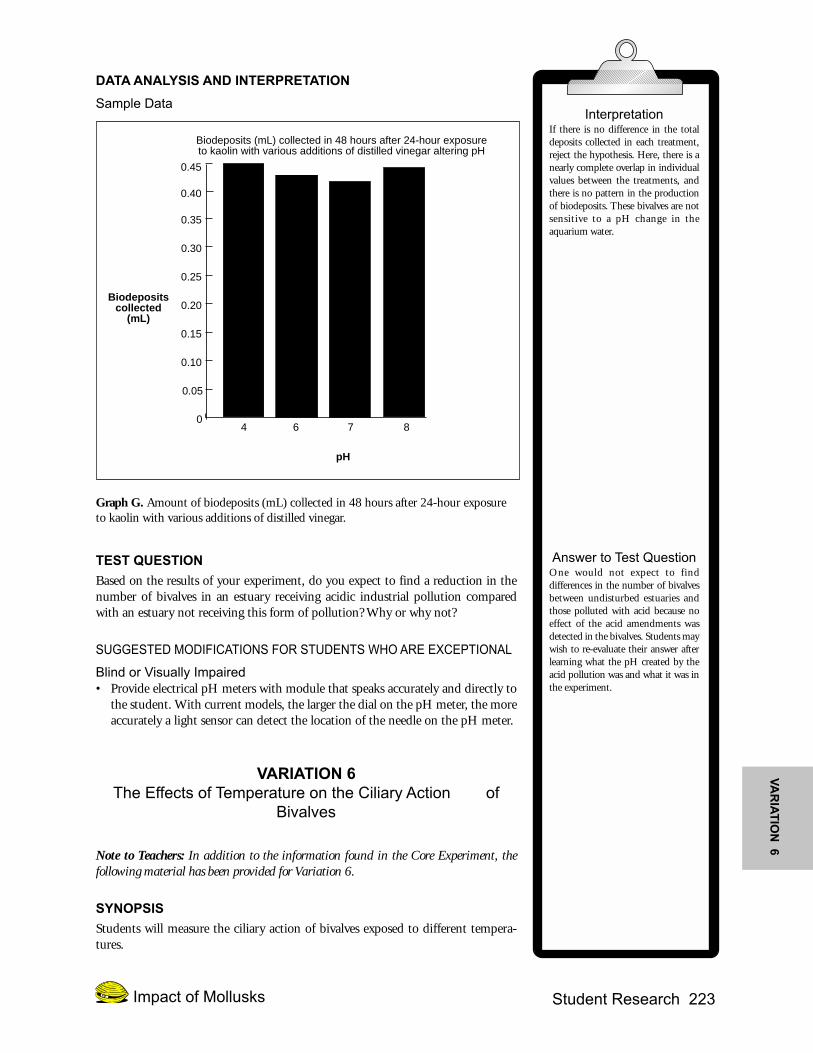
Graph G. Amount of biodeposits (mL) collected in 48 hours after 24-hour exposureto kaolin with various additions of distilled vinegar.
TEST QUESTION
Based on the results of your experiment, do you expect to find a reduction in thenumber of bivalves in an estuary receiving acidic industrial pollution comparedwith an estuary not receiving this form of pollution? Why or why not?
SUGGESTED MODIFICATIONS FOR STUDENTS WHO ARE EXCEPTIONAL
Blind or Visually Impaired• Provide electrical pH meters with module that speaks accurately and directly to
the student. With current models, the larger the dial on the pH meter, the moreaccurately a light sensor can detect the location of the needle on the pH meter.
VARIATION 6The Effects of Temperature on the Ciliary Action of
Bivalves
Note to Teachers: In addition to the information found in the Core Experiment, thefollowing material has been provided for Variation 6.
SYNOPSIS
Students will measure the ciliary action of bivalves exposed to different tempera-tures.
InterpretationIf there is no difference in the totaldeposits collected in each treatment,reject the hypothesis. Here, there is anearly complete overlap in individualvalues between the treatments, andthere is no pattern in the productionof biodeposits. These bivalves are notsensitive to a pH change in theaquarium water.
Answer to Test QuestionOne would not expect to finddifferences in the number of bivalvesbetween undisturbed estuaries andthose polluted with acid because noeffect of the acid amendments wasdetected in the bivalves. Students maywish to re-evaluate their answer afterlearning what the pH created by theacid pollution was and what it was inthe experiment.
4 6 7 80
0.05
0.10
0.15
0.20
0.25
0.30
0.35
Biodepositscollected
(mL)
pH
Biodeposits (mL) collected in 48 hours after 24-hour exposureto kaolin with various additions of distilled vinegar altering pH
0.40
0.45

224 Student Research Impact of Mollusks
ADDITIONAL MATERIALS NEEDED
You will need the following for each group of three to four students in a class of 24:1 dissecting microscope1 screwdriver1 pair heavy gloves1 metal kitchen knife or scalpelcarmine powder1 stopwatch1 metric ruler1 flat toothpick1 dissecting tray
SAFETY PROCEDURESIt is highly recommended that only the instructor open the mollusk shells anduse the following precautions:
Wear a heavy glove and use a screwdriver in a direction away from the body topry open the hinge of the oyster. Other species of bivalves are easier to open.
Exercise extreme caution when using the knife or scalpel. Cut in a direction awayfrom the body. An accident is less likely to happen if the scalpel is very sharp andcan cut the mollusk muscle easily. A dull scalpel may require force to open the shell.
HYPOTHESIS GENERATION
QuestionWhat effect will temperature have upon the ciliary action of bivalves?
Sample HypothesisThe higher the temperature is, the faster the ciliary action of bivalves.
RationaleMetabolic rates are usually higher at higher temperatures in cold-blooded or ecto-thermic animals, such as mollusks. It seems likely that oysters will process particlesfaster. Faster processing would make more food available to support their highermetabolic rate.
Sample Experimental Procedure1. Set up live bivalves in aquaria held at different temperatures. Allow them to accli-
mate 10 minutes before cutting open the valves.2. Measure the effects of temperature on bivalve ciliary action in this way:
a. Carefully separate the 2 halves of the shell that your instructor has openedpreviously.
b. Immerse the bivalve in water at the same temperature as the aquarium fromwhich it was taken.
c. Use a dissecting microscope to focus on the gills.d. Apply the carmine powder by touching the water above the gill surface with the
toothpick. See Figure 1. Watch the movement of the darkly colored particlesalong the surface of the gills. You will notice several particles making a streak.Time one end of the streak as it moves across the gills.
e. Measure the distance the particle moved by putting a metric ruler on the micro-scope stage.
TEACHING TIPOnly a small amount of carminepowder is needed. Dip the small endof the toothpick in the powder andtap off the excess.
Caution
Student Research 225Impact of Mollusks
DATA ANALYSIS AND INTERPRETATION
Sample Data
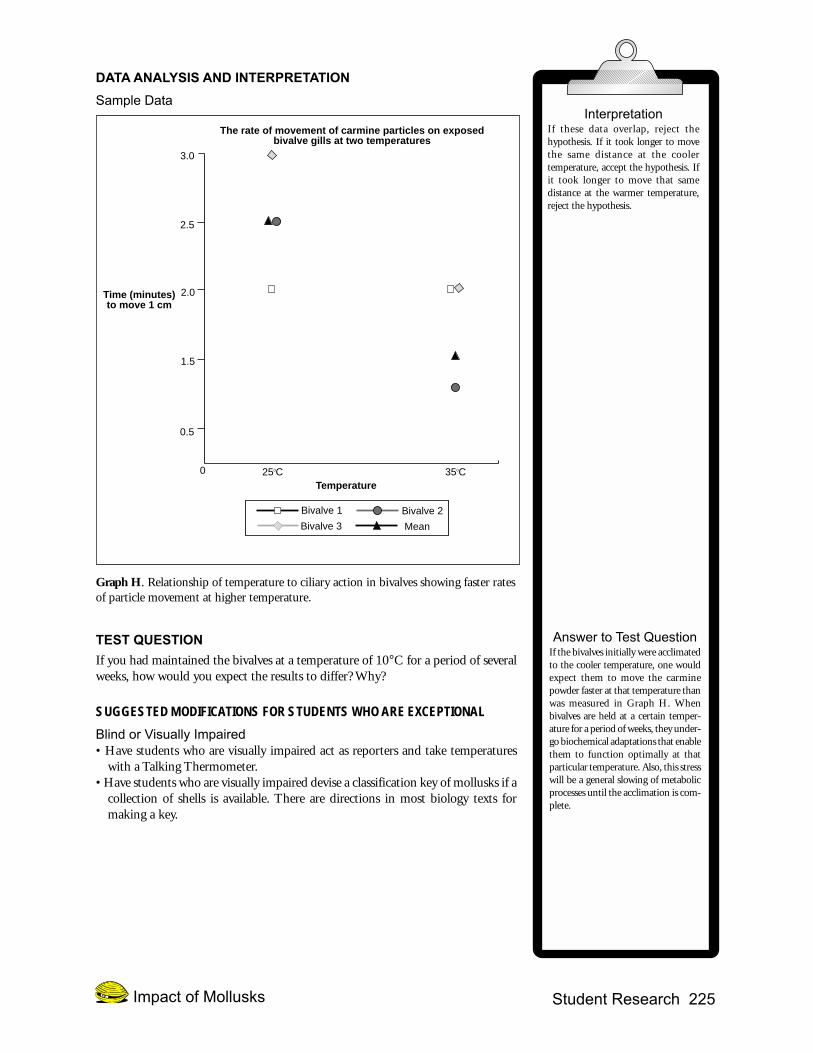
Graph H. Relationship of temperature to ciliary action in bivalves showing faster ratesof particle movement at higher temperature.
TEST QUESTION
If you had maintained the bivalves at a temperature of 10°C for a period of severalweeks, how would you expect the results to differ? Why?
SUGGESTED MODIFICATIONS FOR STUDENTS WHO ARE EXCEPTIONAL
Blind or Visually Impaired• Have students who are visually impaired act as reporters and take temperatures
with a Talking Thermometer.• Have students who are visually impaired devise a classification key of mollusks if a
collection of shells is available. There are directions in most biology texts formaking a key.
InterpretationIf these data overlap, reject thehypothesis. If it took longer to movethe same distance at the coolertemperature, accept the hypothesis. Ifit took longer to move that samedistance at the warmer temperature,reject the hypothesis.
Answer to Test QuestionIf the bivalves initially were acclimatedto the cooler temperature, one wouldexpect them to move the carminepowder faster at that temperature thanwas measured in Graph H. Whenbivalves are held at a certain temper-ature for a period of weeks, they under-go biochemical adaptations that enablethem to function optimally at thatparticular temperature. Also, this stresswill be a general slowing of metabolicprocesses until the acclimation is com-plete.
Bivalve 1
250C 350C
0.5
1.5
2.0Time (minutes)to move 1 cm
Temperature
The rate of movement of carmine particles on exposedbivalve gills at two temperatures
0
Bivalve 3
Bivalve 2
Mean
2.5
3.0
226 Student Research Impact of Mollusks
VA
RIA
TIO
N 7
VARIATION 7The Effects of Salinity Level on the Ciliary Action of Bivalves
Note to Teachers: In addition to the information found in Variation 6, the followingmaterial has been provided for Variation 7.
SYNOPSIS
Students will measure the ciliary action of bivalves exposed to different levels ofwater salinity.
HYPOTHESIS GENERATION
QuestionWill salinity affect ciliary action in bivalves?
Sample HypothesisThe ciliary action of bivalves will not vary within a range of salinities.
RationaleLiving in an estuarine environment requires the ability to adapt to changing condi-tions of salinity.
Sample Experimental Procedure1. Set up bivalves in aquaria held at 2 different salinities with one at the same salinity
as the maintenance aquarium.2. Proceed with Step 2 in Variation 6 measuring the effects of salinity and not tem-
perature on ciliary action.
TEACHING TIPS• For the oyster, Crassostrea virginica,
salinities from 25 to 39 ppt resultedin normal pumping activity; 20 pptresulted in slower pumping; andbelow 13 ppt resulted in nopumping (Jørgensen, 1966).
• Use artificial seawater salts ratherthan sodium chloride, because ionimbalances with sodium chloridemay result in the death of animals(Dietz et al., 1996).
• Provide background on estuarinecommunities if students have notobserved this community pre-viously.

Student Research 227Impact of Mollusks
DATA ANALYSIS AND INTERPRETATION
Sample Data
Graph I. Relationship of ciliary action and salinity concentration showing fasterparticle transport at higher salinities.
TEST QUESTION
If you obtained results like those shown in Graph J, how would you interpret them?
Graph J. The movement of carmine particles over bivalve gills at 2 salt concentrations.
Bivalve
10 30
15.5
16.0
16.5
17.0
17.5
18.0
18.5
Time (sec) tomove 4 mm
Salinity (ppt)
The rate of movement of carmine particles on bivalve gillsat two salt concentrations
0
Bivalve
Bivalve
Mean
19.0
19.5
20.0
15.0
InterpretationIf these data overlap, accept thehypothesis. If it took longer tomove the same distance at thelower salinity, reject the hypoth-esis. If it took longer to move thatsame distance at the higher salin-ity, reject the hypothesis.
Answer to Test QuestionThere is more variability in the rate ofparticle movement at the lowersalinity. There is no difference in therate of movement at the high and lowsalinities because these data overlapcompletely. These oysters are notsensitive to the differences in salinitythat were tested.
0 10 20 300
2
4
6
8
10
12
14
Time (sec) tomove 4 cm
Salinity (ppt)
Movement of carmine particles across oyster gills
16
18
5 15 25
228 Student Research Impact of Mollusks
VA
RIA
TIO
N 8
SUGGESTED MODIFICATIONS FOR STUDENTS WHO ARE EXCEPTIONAL
Blind or Visually Impaired• See Variation 6.
VARIATION 8The Effect of Heavy Metal on Bivalve Biodeposit Production
Note to Teachers: In addition to the information found in Variation 6, the followingmaterial has been provided for Variation 8.
SYNOPSIS
Students will measure and compare the biodeposits produced by bivalves exposed toa heavy metal with those not exposed.
ADDITIONAL MATERIALS NEEDEDYou will need the following for each group of three to four students in a class of 24:
• CuSO4•5H
2O
DIRECTIONS FOR SETTING UP THE LAB
Add all amendments to the treatment aquaria before adding the bivalves.
SAFETY PROCEDURESCupric sulfate is a skin and respiratory irritant, and is toxic by ingestion andinhalation. It is strongly recommended that CuSO
4 solutions be purchased and
that CuSO4 powder not be used. If the powdered form is used to make solutions,
the teacher should be the only individual who works with CuSO4. Wear a mask,
gloves, and lab apron.
Students should avoid contact with CuSO4 solutions.
Wash hands after using the solutions.
Do not ingest the solutions.
Wear gloves and a lab apron.
Check your local safety guidelines for additional information about the safe use ofCuSO
4, including storage and disposal.
HYPOTHESIS GENERATION
QuestionDo heavy metals affect the filtering rate of bivalves?
Sample HypothesisThe filtering rate of oysters exposed to a heavy metal will decrease as the concentra-tion of the heavy metal increases.
RationaleHeavy metals in large concentrations are toxic to bivalves.
TEACHING TIPCopper sulfate concentrations greaterthan 0.1 g/L are likely to be lethalafter several days.
Do notingest
solutions
CuSO4
LAW
Student Research 229Impact of Mollusks
VA
RIA
TIO
N 9
Sample Experimental Procedure1. Use the kaolin concentration when the highest rate of biodeposit production in
the linear part of the curve in all treatment aquaria was observed. Hypotheticaldata for the Core Experiment would be 20 mg/L.
2. Set up 4 treatment aquaria as follows:Aquarium 1 Control with no cupric sulfateAquarium 2 0.001 g/LAquarium 3 0.01 g/LAquarium 4 0.1 g/L
3. Incubate and collect data as in the Core Experiment.
DATA ANALYSIS AND INTERPRETATION
Sample Data
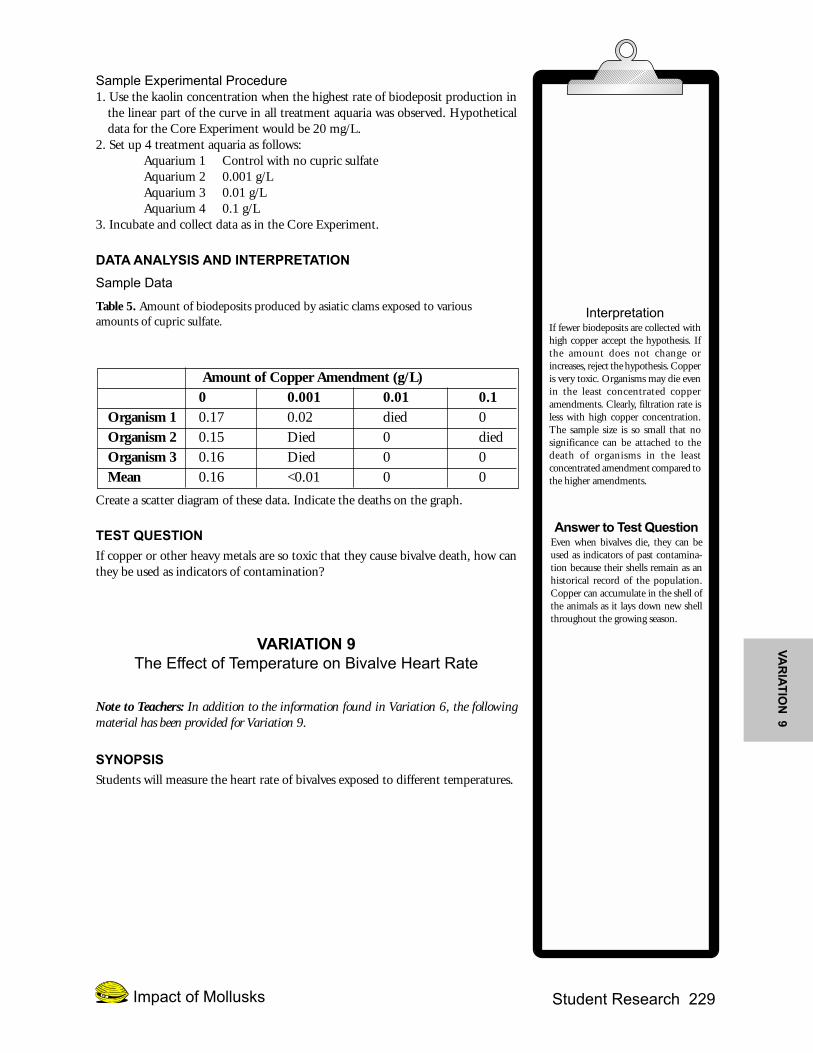
Table 5. Amount of biodeposits produced by asiatic clams exposed to variousamounts of cupric sulfate.
Amount of Copper Amendment (g/L)0 0.001 0.01 0.1
Organism 1 0.17 0.02 died 0Organism 2 0.15 Died 0 diedOrganism 3 0.16 Died 0 0Mean 0.16 <0.01 0 0
Create a scatter diagram of these data. Indicate the deaths on the graph.
TEST QUESTION
If copper or other heavy metals are so toxic that they cause bivalve death, how canthey be used as indicators of contamination?
VARIATION 9The Effect of Temperature on Bivalve Heart Rate
Note to Teachers: In addition to the information found in Variation 6, the followingmaterial has been provided for Variation 9.
SYNOPSIS
Students will measure the heart rate of bivalves exposed to different temperatures.
InterpretationIf fewer biodeposits are collected withhigh copper accept the hypothesis. Ifthe amount does not change orincreases, reject the hypothesis. Copperis very toxic. Organisms may die evenin the least concentrated copperamendments. Clearly, filtration rate isless with high copper concentration.The sample size is so small that nosignificance can be attached to thedeath of organisms in the leastconcentrated amendment compared tothe higher amendments.
Answer to Test QuestionEven when bivalves die, they can beused as indicators of past contamina-tion because their shells remain as anhistorical record of the population.Copper can accumulate in the shell ofthe animals as it lays down new shellthroughout the growing season.
230 Student Research Impact of Mollusks
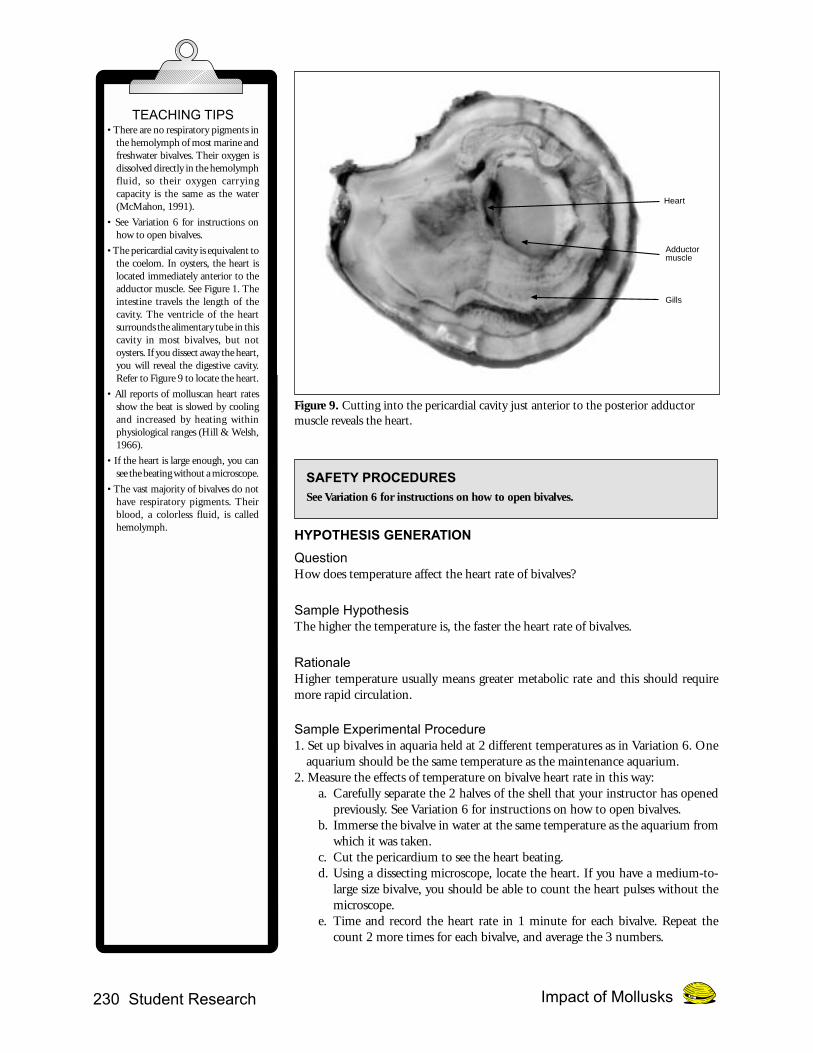
Figure 9. Cutting into the pericardial cavity just anterior to the posterior adductormuscle reveals the heart.
SAFETY PROCEDURES
See Variation 6 for instructions on how to open bivalves.
HYPOTHESIS GENERATION
QuestionHow does temperature affect the heart rate of bivalves?
Sample HypothesisThe higher the temperature is, the faster the heart rate of bivalves.
RationaleHigher temperature usually means greater metabolic rate and this should requiremore rapid circulation.
Sample Experimental Procedure1. Set up bivalves in aquaria held at 2 different temperatures as in Variation 6. One
aquarium should be the same temperature as the maintenance aquarium.2. Measure the effects of temperature on bivalve heart rate in this way:
a. Carefully separate the 2 halves of the shell that your instructor has openedpreviously. See Variation 6 for instructions on how to open bivalves.
b. Immerse the bivalve in water at the same temperature as the aquarium fromwhich it was taken.
c. Cut the pericardium to see the heart beating.d. Using a dissecting microscope, locate the heart. If you have a medium-to-
large size bivalve, you should be able to count the heart pulses without themicroscope.
e. Time and record the heart rate in 1 minute for each bivalve. Repeat thecount 2 more times for each bivalve, and average the 3 numbers.
TEACHING TIPS• There are no respiratory pigments in
the hemolymph of most marine andfreshwater bivalves. Their oxygen isdissolved directly in the hemolymphfluid, so their oxygen carryingcapacity is the same as the water(McMahon, 1991).
• See Variation 6 for instructions onhow to open bivalves.
• The pericardial cavity is equivalent tothe coelom. In oysters, the heart islocated immediately anterior to theadductor muscle. See Figure 1. Theintestine travels the length of thecavity. The ventricle of the heartsurrounds the alimentary tube in thiscavity in most bivalves, but notoysters. If you dissect away the heart,you will reveal the digestive cavity.Refer to Figure 9 to locate the heart.
• All reports of molluscan heart ratesshow the beat is slowed by coolingand increased by heating withinphysiological ranges (Hill & Welsh,1966).
• If the heart is large enough, you cansee the beating without a microscope.
• The vast majority of bivalves do nothave respiratory pigments. Theirblood, a colorless fluid, is calledhemolymph.
Gills
Adductormuscle
Heart

Student Research 231Impact of Mollusks
DATA ANALYSIS AND INTERPRETATION
Sample Data
Graph K. Effect of temperature on bivalve heart rate.
TEST QUESTION
If you had maintained the bivalves at a temperature of 10°C rather than at 25°C,how would you expect the results to differ? Why do you expect this difference?
SUGGESTED MODIFICATIONS FOR STUDENTS WHO ARE EXCEPTIONAL
Blind or Visually Impaired• Provide students who are visually impaired with large oysters so they will be able
to count the heart beat without the use of a microscope. A raised-line drawing ofthe cross section of the heart plus graphs of heartbeats should be included withthis investigation.
• Record temperatures with a Talking Thermometer.
InterpretationIf these data overlap, reject thehypothesis. If there were fewer heart-beats at the lower temperature, acceptthe hypothesis. These data were quitevariable at the higher temperature, butthere was very little overlap. If therewere more heartbeats at the highertemperature, the hypothesis can beaccepted.
Answer to Test QuestionIf the bivalves were maintained at thecooler temperature, one would haveexpected them to have a lowerheartbeat at the cooler temperature.Until they fully acclimate, all metabolicprocesses will be slow.
Bivalve 1
100C 250C24
26
28
30
32
34
36
Number ofheartbeatsin 1 minute
Temperature
Effect of temperature on bivalve heart rate
0
Bivalve 2
Bivalve 3
Mean
38
40
42

232 Student Research Impact of Mollusks
Directions for Students
INTRODUCTION
FLAMING RIVER! The headlines of mid-1969 proclaimed. Indeed, pollution had created a combustible mess of theCuyahoga River, a tributary to Lake Erie. All it took to ignite the river was a spark from a steel-mill rail car to create theabsurd situation that alerted many complacent Americans to the damage we had done to our waterways. The first Earth Daywas celebrated the following year, and we were made aware of extreme pollution in many waterways. Lake Erie looked likepea soup (Luoma, 1996). The Chesapeake Bay where oysters were once so abundant that they filtered the entire volume ofthe bay in just a few days, now had so few oysters that it required a year to filter the same volume of water (Newell, 1988).Filter-feeding mollusks are among the losses attributed to pollution. These creatures and many other endangered aquaticorganisms are less charismatic than the familiar endangered wolves or otters. In Illinois alone, 67% of all state-listed endan-gered animals and 22% of all threatened and endangered species are aquatic (Cummings & Mayer, 1996).
Clams, oysters, and mussels can be forms of natural pollution, too. See Figure 1 for representative mollusks.
Figure 1. a. Mercenaria mercenaria (hardshell clam). b. Mytilus edulis (blue mussel). c. Crassostrea virginica (eastern oyster).
The Impact of Mollusks on Water Quality
Dorsala.
Right gill Mouth
Labialpalps
Anterior
VentralValve(flap)
Inhalantsiphon
Posterior
Exhalantsiphon
Mercenaria mercenaria (hardshell clam) left valve Mytilus edulis (blue mussel) left valveByssus Foot
Mouth
Labialpalps
Right gill
Exhalantsiphon
Inhalantregion
Ventral
Dorsal
Posterior Anterior
b.
Anterior
c.Mouth
Labialpalps
Gill
Mantle
Ventral
PosteriorCrassostrea virginica (eastern oyster) left valve
Dorsal
Exhalantregion
Anus
Adductormuscle Heart
Inhalant region
Adductormuscles
Adductormuscle
Student Research 233Impact of Mollusks
For example in 1988, zebra mussels arrived in the Great Lakes probably in the ballast water of a ship from Europe. Sincethey reproduce so quickly and have few natural predators, they quickly clogged water-intake pipes, coated boat hulls, andcontributed to extensive mortality or complete elimination of some native bivalves. By the end of 1995, 20 of the 38 stateseast of the Rocky Mountains had been invaded by zebra mussels (Ram & McMahon, 1996). The news about zebra musselsis not all bad. They have done such a terrific job of filtering that light now penetrates deep into Lake Erie and eight nativespecies of plants have returned after an absence of 30 to 50 years (Anonymous, 1996).
When planktonic algae containing a powerful nerve-toxin are abundant, shellfish concentrate the poisons. They also accu-mulate other toxins including heavy metals, like copper and mercury, and bacterial pathogens from human sewage (Boyle,1981).
In this exercise you will investigate some of the behavior of bivalves that makes them good news and bad news for theenvironment.
OBJECTIVES
At the end of this lab, you should be able to:• Describe the ecological role of filter-feeding mollusks in fresh and/or saltwater ecosystems.• Identify the major anatomical structures and functions of a filter-feeding mollusk.• Describe how turbidity and salinity affect the behavior of a filter-feeding mollusk.• Explain how a population of oysters, clams, or mussels impacts water quality.• Maintain strict procedures needed to support the organisms’ health and basic functions.
SAFETY NOTES
Wash your hands before and after the lab.
Do not pick up an aquarium containing water.
Carry expensive glass instruments like hemocytometers in unbreakable containers.
Do not discard mollusks or wash water into local waterways.
Do not eat any of these organisms.
Do not open any shellfish using a sharp instrument, such as a scalpel. Your instructor will do this.
Wear safety goggles and lab apron.
MATERIALS NEEDED
For each team of four students, you will need the following:5 live freshwater clams, such as Corbicula fluminea or saltwater hardshell clams Mercenaria mercenaria, marine blue mussels Mytilus edulis; 5 live oysters, such as Crassostrea virginica0.5g (3t) kaolin powder3 3.8-L (1-gallon) aquaria or wide-mouthed glass or plastic jars12 L artificial seawater1 aerator1 thermometer (ºC)15 petri dish halves1 Pasteur pipette10 10-mL graduated cylinders
STUDENT LITERATURE SEARCH SUMMARY WITH REFERENCES
Do a literature or web search on the topic of filter-feeding bivalves and pollution. Summarize your findings and cite yourreferences. Your teacher may be able to suggest some references.
Caution

234 Student Research Impact of Mollusks
HYPOTHESIS GENERATION
From the information you have on this topic, develop a hypothesis that could be tested in a controlled experiment thatgathers quantitative data. Explain the reasoning behind your hypothesis. Answer the following questions:1. What is the question you are investigating?2. What makes this question an interesting or important topic for investigation?3. Why is it important to control variables?4. What is the variable in your experiment?5. What will you measure?6. How will you control other potential variables?
PLAN OF INVESTIGATION
Make a numbered list of the steps you will use to investigate your topic. Answer the following questions:1. How many samples have you included?2. What will you measure?3. How can you show your results in a graph?
Design an experiment to test your hypothesis. Be sure that you include an experimental control and enough replicates toprovide reliable data. Consider how you will analyze and present your results. Write the procedures you will follow.
QUESTIONS AND ANALYSIS
Once you have collected and analyzed your data and graphed your results, answer the following questions:1. Construct a bar graph showing the total amount of biodeposits collected for bivalves in each treatment.2. Do your data support or refute your hypothesis?3. Using your specific data, explain your answer to Question 2.4. Compare your data with that of other groups. Are these data the same or different? Why or why not?5. Will the amount of biodeposits always be the same under the conditions you used?6. What could cause differences? Be specific.
DESIGN OF VARIATIONS OF CORE EXPERIMENT
• How do filtering rates compare for different species of bivalves?• How will temperature affect the production of biodeposits?• Are oysters adaptable to a range of salinities?• What effect does light have on the filtering rates of bivalves?• Is biodeposit production affected by acidic conditions?• What effect will temperature have upon the ciliary action of bivalves?• Will salinity affect ciliary action in bivalves?• Do heavy metals affect the filtering rate of bivalves?• How does temperature affect the heart rate of bivalves?
You must have your teacher approve this protocol before you begin this experiment.