Embed Size (px)
Citation preview

The impact of monsoon intraseasonal variability on renewable power generation in India Article
Published Version
Creative Commons: Attribution 3.0 (CCBY)
Open Access
Dunning, C. M., Turner, A. G. and Brayshaw, D. J. (2015) The impact of monsoon intraseasonal variability on renewable power generation in India. Environmental Research Letters, 10 (6). 064002. ISSN 17489326 doi: https://doi.org/10.1088/17489326/10/6/064002 Available at http://centaur.reading.ac.uk/39364/
It is advisable to refer to the publisher’s version if you intend to cite from the work.
To link to this article DOI: http://dx.doi.org/10.1088/17489326/10/6/064002
Publisher: Institute of Physics
All outputs in CentAUR are protected by Intellectual Property Rights law, including copyright law. Copyright and IPR is retained by the creators or other copyright holders. Terms and conditions for use of this material are defined in the End User Agreement .
www.reading.ac.uk/centaur

CentAUR
Central Archive at the University of Reading
Reading’s research outputs online

This content has been downloaded from IOPscience. Please scroll down to see the full text.
Download details:
IP Address: 134.225.100.34
This content was downloaded on 03/06/2015 at 08:43
Please note that terms and conditions apply.
The impact of monsoon intraseasonal variability on renewable power generation in India
View the table of contents for this issue, or go to the journal homepage for more
2015 Environ. Res. Lett. 10 064002
(http://iopscience.iop.org/1748-9326/10/6/064002)
Home Search Collections Journals About Contact us My IOPscience

Environ. Res. Lett. 10 (2015) 064002 doi:10.1088/1748-9326/10/6/064002
LETTER
The impact of monsoon intraseasonal variability on renewable powergeneration in India
CMDunning1, AGTurner1,2 andD JBrayshaw1,2
1 Department ofMeteorology, University of Reading, UK2 NCAS-Climate, University of Reading, UK
E-mail: [email protected]
Keywords: Indianmonsoon, intraseasonal climate variability, renewable (wind) power, energy system resilience, energymeteorology
AbstractIndia is increasingly investing in renewable technology tomeet rising energy demands, withhydropower and other renewables comprising one-third of current installed capacity. Installedwind-power is projected to increase 5-fold by 2035 (to nearly 100GW)under the International EnergyAgencyʼsNewPolicies scenario.However, renewable electricity generation is dependent upon theprevailingmeteorology, which is strongly influenced bymonsoon variability. Prosperity andwidespread electrification are increasing the demand for air conditioning, especially during thewarmsummer. This study usesmulti-decadal observations andmeteorological reanalysis data to assess theimpact of intraseasonalmonsoon variability on the balance of electricity supply fromwind-power andtemperature-related demand in India. Activemonsoon phases are characterized by vigorousconvection and heavy rainfall over central India. This results in lower temperatures giving lowercooling energy demand, while strongwesterly winds yield highwind-power output. In contrast,monsoon breaks are characterized by suppressed precipitation, with higher temperatures and hencegreater demand for cooling, and lowerwind-power output acrossmuch of India. The opposingrelationship betweenwind-power supply and cooling demand during active phases (low demand,high supply) and breaks (high demand, low supply) suggests thatmonsoon variability will tend toexacerbate fluctuations in the so-called demand-net-wind (i.e., electrical demand thatmust besupplied fromnon-wind sources). This studymay have important implications for the design ofpower systems and for investment decisions in conventional schedulable generation facilities (such ascoal and gas) that are used tomaintain the supply/demand balance. In particular, if it is assumed (as iscommon) that the generatedwind-power operates as a price-taker (i.e., wind farmoperators alwayswish to sell their power, irrespective of price) then investors in conventional facilities will faceadditional weather-volatility through themonsoonal impact on the length and frequency ofproduction periods (i.e. their load-duration curves).
1. Introduction
Economic growth, rising prosperity, rapid urbaniza-tion and increasing electrification are all acting toincrease the global electrical energy demand (Interna-tional Energy Agency (IEA) 2012), especially incountries that are rapidly developing. Indiaʼs totalpower capacity more than doubled from 1998 to 2013in order to meet rising demand (Ernst andYoung 2013). Increasing demand for energy for cool-ing purposes is a significant factor driving this
increase; the number of households with temperaturecontrol devices in urban Delhi increased from 32.9%in 1993 to 60% in 2009 (Gupta 2012).
A proportion of the rising demand for electricity ismet by renewable sources, and India aims tomeet 15%of its electricity requirements through renewables by2020 (Ernst and Young 2013).Wind and hydro-powerare already large contributors in the Indian Power Sec-tor, with shares of 8.4% and 17.7% respectively (ErnstandYoung 2013). India is the world’s fifth largest windenergy producer, with 19.1GW of installed capacity;
OPEN ACCESS
RECEIVED
17March 2015
REVISED
5May 2015
ACCEPTED FOR PUBLICATION
8May 2015
PUBLISHED
2 June 2015
Content from this workmay be used under theterms of theCreativeCommonsAttribution 3.0licence.
Any further distribution ofthis workmustmaintainattribution to theauthor(s) and the title ofthework, journal citationandDOI.
© 2015 IOPPublishing Ltd
however, this represents less than one-fifth of the esti-mated wind-power potential for India, and increasingwind-power production, both on- and offshore, is akey component of India’s future energy strategy (ErnstandYoung 2013).
The production of electricity from renewables ishighly dependent upon the prevailing meteorology.The seasonal cycle in India is dominated by the SouthAsian monsoon. Stronger solar irradiance during theboreal spring and summer heats the Asian landmassand leads to the formation of a heat low and reversedpole-to-equator temperature gradient. This influencesthe circulation patterns over the Indian Ocean, divert-ing winds north across the equator, bringing strongwesterly winds and heavy rain over India (Turner andAnnamalai 2012).Weakening of the solar insolation inthe boreal autumn, and movement of the region ofmaximum solar heating south of the equator, con-cludes themonsoon season.
The monsoon circulation is not consistentthroughout the entire season. Over India there are twopreferred locations for convection during the mon-soon: the so-called continental tropical convergencezone (TCZ) over the Indian subcontinent and theoceanic TCZ over the equatorial Indian Ocean. Varia-tion between these two centres gives large changes inrainfall and wind patterns (Annamalai and Sper-ber 2005, Lau et al 2012), resulting in active phasesbringing heavy rainfall over India and break phaseswith stronger rainfall near the equator and centralIndia features increased surface pressure, a weakerlow-level westerly jet and reduced precipitation(Krishnan et al 2000, Ramesh Kumar and PrabhuDes-sai 2004, Annamalai and Sperber 2005, Rajeevanet al 2010, Lau et al 2012). In 2002 and 2009 significantbreak phases during July and August led to low mon-soon rainfall totals with profound socio-economicimplications (Goswami and Xavier 2003, Munot andKothawale 2014). Forecasting active and break periodswithin the South Asian monsoon has been a focus ofresearch for many years due to the impact of such var-iations on agriculture, and various methods to do sohave been proposed (Goswami andXavier 2003, Chat-topadhyay et al 2008, Krishnamurthy andShukla 2007, Borah et al 2013). If these methods canever become skilful out to lead times of two weeks ormore then they may be useful for predicting a varietyof environmental impacts and, as we will show, suchforecasts would also be very relevant to the power sec-tor. Furthermore, irrespective of the ability to producesuccessful meteorological forecasts of individual mon-soon events, an understanding of the climatologicalpossibility for such events occuring and their impacton the power system is likely to be of value to bothlong-term planning for power system resilience andthe wider contextualization of day-to-day operationaldecisionmaking.
Meteorological variability often leads to variabilityin the power sector, particularly where renewable
sources are included. Ely et al (2013) examined theimpact of the North Atlantic Oscillation (NAO) onwind-power and electricity demand in Norway andthe UK during periods of low hydropower capacity.It was found that during NAO-negative states, coldcalm conditions resulted in simultaneous increaseddemand and lowwind-power, and could result in pro-blems for a combinedNorway-UKpower system. San-tos-Alamillos et al (2012) studied the production ofwind and solar power over the Iberian peninsula withthe aim of finding the optimal distribution of windand solar plants to minimize the variability in the out-put from these non-controllable power supplies.It was found that, for the most part, combiningthe power production from wind and solar sourcesreduces the variability in the power supply due to bal-ancing between meteorological variables. The presentstudy adopts a simpler ‘integrated weather impacts’approach to the power sector in India.
The potential for wind-power has been studiedover the Indian subcontinent and was found to be aviable source of power in many regions (Khanet al 2004, Khadem and Hussain 2006, Mondal andDenich 2010). BothGupta (2012) and Ranjan and Jain(1999) found a relationship between temperature anddemand in Delhi, with elevated temperatures duringthe monsoon giving rise to increased energy demand.However, the relationship between intraseasonalvariability within the monsoon and energy demandand supply has not been studied. High temperatureshave resulted in power outages in recent years(Zhong and Chaturvedi 2014), as supply has not metthe high energy demand. It is crucial that the balancebetween supply and demand is properly understood,given the rising demand for cooling energy andincreasing use of non-schedulable, highly variablepower generation resources with limited storagecapacity. In this paper we examine the impact ofintraseasonal variability within the Asian monsoonon two components of the Indian power sector: windpower supply and cooling energy demand. We parti-cularly focus on the core monsoon season where,although the seasonal-mean temperature has typi-cally dropped below that of the pre-monsoonmonths, intraseasonal variations in temperature (andhence cooling demand) are particularly marked andmust be anticipated.
The remainder of the paper is structured as fol-lows: section 2 contains a description of the methodsused to study wind-power, cooling energy demandand intraseasonal variability within the monsoon.Sections 3 and 4 discuss the impacts of intraseasonalvariability on wind-power supply and cooling energydemand respectively. Finally section 5 discusses theimplications of these results for the Indian power sec-tor, highlighting the main conclusions and areasrequiring further research.
2
Environ. Res. Lett. 10 (2015) 064002 CMDunning et al
2.Method
In this section the methods used to estimate wind-power production and temperature-related demandfrom meteorological data are described. The categor-ization of monsoon intraseasonal variability is alsoexplained.
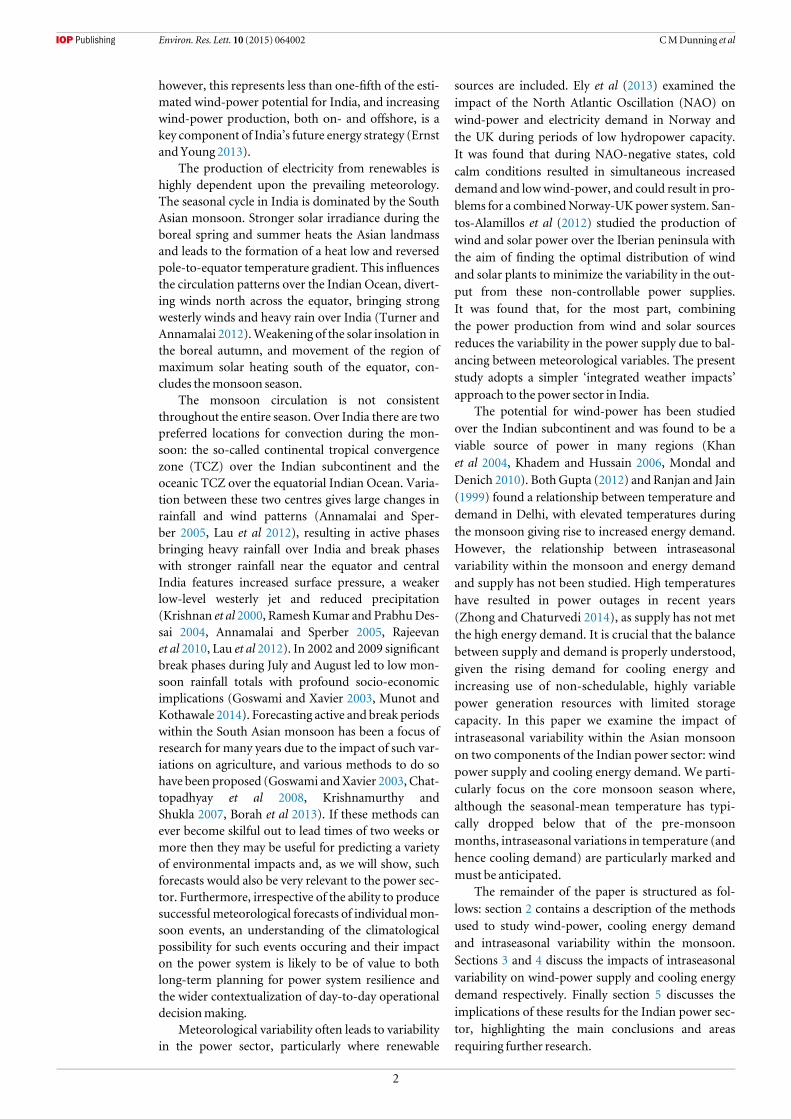
2.1.Wind powerWind-power produced in a wind turbine is estimatedusing a simple idealized power curve, e.g. as in Pryorand Barthelmie (2010), Ruiz-Arias et al (2012) andCannon et al (2015). This is shown in figure 1 andequation 1. The wind-power output (left axis) isnormalized by dividing by the maximum poweroutput to give the capacity factor (right axis); thusequation 1 makes no assumptions regarding thedimensions or efficiency of the turbine. Capacityfactor is given by:
u
A u
Au
u
u
Capacity factor
0 if 3.5 ms1
21
215
if 3.5 15 ms
1 if 15 25 ms
0 if 25 ms ,
(1)
1
3
3
1
1
1
⎧
⎨
⎪⎪⎪⎪
⎩
⎪⎪⎪⎪
ηρ
ηρ=
<
⩽ <
⩽ <⩾
−
−
−
−
whereA is the circular area swept by the blades, η is theefficiency of the turbine, ρ is the air density and u is theobserved wind speed at the height of the turbine hub.We use cut-in and cut-out speeds of 3.5 ms 1− and25 ms 1− respectively, common with other studies(British Wind Energy Association 2005, Brayshawet al 2011,Wind Power Programme 2013).
The nonlinear transformation from wind speed towind-power and highly fluctuating nature of windmeans it is important to use data with high temporalresolution. HereMERRA reanalysis wind speed data at50 m above ground were used, which is available at an
hourly temporal resolution and spatial resolution of2
3
◦by 1
2
◦(longitude by latitude) over 1979–2004 (Rie-
necker et al 2011). Although 50 m above the ground isbelow the height of many modern wind turbines(50–120 m, British Wind Energy Association 2005),this choice is consistent with previous wind-powerassessments for India (Ramachandra and Shru-thi 2005, Mondal and Denich 2010) and the overallresults are robust to the application of simple logarith-mic or power-law boundary layer wind scaling (resultsnot shown). Overall, the approach adopted hereresembles that of Cannon et al (2015) who foundMERRA-derived wind-power estimates to be highlycorrelated with recorded wind-power data overtheUK.
2.2. Cooling energy demandTemperature-related-demand is a U-shaped functionof temperature; temperature increases result in moredemand for cooling energy and temperature decreasesraise the demand for heating energy. The base orthreshold temperature is where temperature-relateddemand is at it’s minimum (Sailor & Munoz, 1997,Ruth and Lin 2006, Isaac and van Vuuren 2009,Gupta 2012). The absence of any available dailydemand data for this study forces us instead to use awell-known proxy for demand. Cooling degree days(CDDs) indicate the level of demand, which isassumed to be a linear function of the deviation of thedaily mean temperature above a threshold and thelength of time the threshold is surpassed. Degree dayshave been widely used as a proxy for demand (Sailor &Munoz, 1997, Ruth and Lin 2006, Sivak 2009). We arethus counting the cumulative number of degree-daysover a threshold temperature, above which we assumecooling systems are required in homes and offices.
In this study we focus on cooling needs only andset the base or threshold temperature at 22 °C. This isconsistent with a recent study of Delhi electricitydemand by Gupta (2012) but somewhat higher than
Figure 1. Idealizedwind-power transformation curve relatingwind speed to power output and capacity factor (the fraction ofmaximumpower produced). Units areWm−2 for power output.
3
Environ. Res. Lett. 10 (2015) 064002 CMDunning et al

might be expected in many other global cities (typi-cally 18–22 °C, see e.g., Schaeffer et al 2012). The rele-vant threshold value may, of course, change with timeor location but the qualitative relationships to be dis-cussed in this paper are robust to changes in thethreshold value across a threshold temperature rangeof several °C. CDD are estimated using dailymean sur-face (1.5 m) air temperature data produced by theIndian Meteorological Department based on observa-tions from 395 stations and distributed as a 1° griddedproduct for June–August 1969–2005 (Srivastavaet al 2009).
Electricity transmission from generation source toconsumer is achieved using an electricity grid. In Indiathere is very limited grid structure— the southern gridis entirely separate from the main grid (Ernst andYoung 2013), so therefore electricity generation needsto be close to areas of demand. In this study the focushas been upon 3 major cities: Bangalore, Mumbai andDelhi. Temperature-related demand was examined ineach city, and wind-power generation was examinedover regions surrounding each city. These three citieswere chosen as they cover different parts of the coun-try featuring different climates and the regions containsome of the current wind turbine network. Theregions used aremarked as white boxes infigure 3(b).
2.3. Categorisation ofmonsoon intraseasonalvariabilityFigure 2 shows the impact of monsoon intraseasonalvariability on precipitation over India. The climatolo-gical distribution ofmean daily rainfall during JJA (themonsoon season) is shown in figure 2(b). The highrainfall amounts, especially over central India and thewest coast are clear. In order to assess the impact ofintraseasonal monsoon variability on the Indianpower sector, active and break phases are definedusing
a method based on that of Rajeevan et al (2010) asfollows.
The box in figure 2(b) represents the ‘core mon-soon zone’ (71.5–86.5 ◦E, 18.5–26.5 ◦N). The dailymean rainfall in that zone is normalized by subtractingthe daily long term mean rainfall and dividing by itsdaily standard deviation to remove the effects of theseasonal cycle. Days when the normalized rainfallanomaly is less than −1 are defined as break days, dayswhen the normalized rainfall anomaly is greater than 1are defined as active days. Neutral phases are definedwhen the normalized rainfall anomaly is between -1and 1. Gridded daily rainfall data produced by theIndian Meteorological Department based on observa-tions from 1803 rain gauges was used from 1951–2004(Rajeevan et al 2006).
Figures 2(a) and (c) show the rainfall anomalyduring the break and active phases respectively. Overcentral India and theWestern Ghats mountains on thewest coast rainfall is higher during active phases andlower during break phases. Ramamurthy (1969) notedthat during break phases the monsoon trough shiftsnorthwards towards the Himalayan foothills. Thepositive rainfall anomaly associated with this shift isclearly seen in figure 2(a) implying that this index iscapturing the general behaviour of the active andbreak phases. The features of the rainfall anomaly pat-terns in figures 2(a) and (c) closely resemble those inKrishnamurthy and Shukla (2007); in particular, thenegative anomalies over NE and SE India and positiveanomalies in central-west India and along the westerncoast during active phases arewell captured.
To verify the robustness of the results, the categor-isation was compared to other active/break indices.Active and break phases are also associated with varia-tions in the monsoon circulation. Wang and Fan(1999) defined a monsoon index based on the
Figure 2.Precipitation distribution during themonsoon season (JJA) over 1969–2004. (a) And (c) show the precipitation anomalyduring the break and active phases respectively, relative to neutral periods; (b) shows themean JJA daily rainfall. Themonsoon indexused is based on rainfall over the coremonsoon zonemarked in (b). Units aremmper day.
4
Environ. Res. Lett. 10 (2015) 064002 CMDunning et al

horizontal zonal wind shear between the southern tipof India and north of the monsoon trough that cap-tures the dynamical signal of intraseasonal variability.Comparison of this index with the one defined aboverevealed that less than 1% of days were defined asactive by one index and break by the other. Therefore,the strong agreement found between our results andthe active/break rainfall composites of Krishnamurthyand Shukla (2007), and alternatively our own compar-ison using the circulation index method of Wang andFan (1999), confirms that the normalized rainfallanomaly over the core monsoon zone shown is a sui-table indicator ofmonsoon intraseasonal variability.
3.Wind-energy supply
Firstly we investigate the impact of active and breakphases on potential electricity generation by windturbines. The wind patterns during the monsoon andimpacts of monsoon intraseasonal variability on windover India are shown infigure 3.
Figure 3(b) shows the climatological wind vectorsand speed during the monsoon at the 50 m level. Thestrongwesterly winds across the Arabian Sea, southernIndia and the Bay of Bengal are apparent, with weakerwinds across northern India. Figures 3(a) and (c) showthe wind anomalies during break and active phasesrespectively as defined by the precipitation index fromthe core monsoon region. During active periods thewesterly winds across southern India strengthen,whereas break periods are associated with a weakeningof the low-level westerly jet and the absence of low-level easterlies over north India (Ramesh Kumar andPrabhu Dessai 2004, Annamalai and Sperber 2005,Rajeevan et al 2010, Lau et al 2012). Another featureduring active events is the strengthening of easterly
winds and absolute wind speed in the north east of thepeninsula, associated with strengthening of the mon-soon trough.
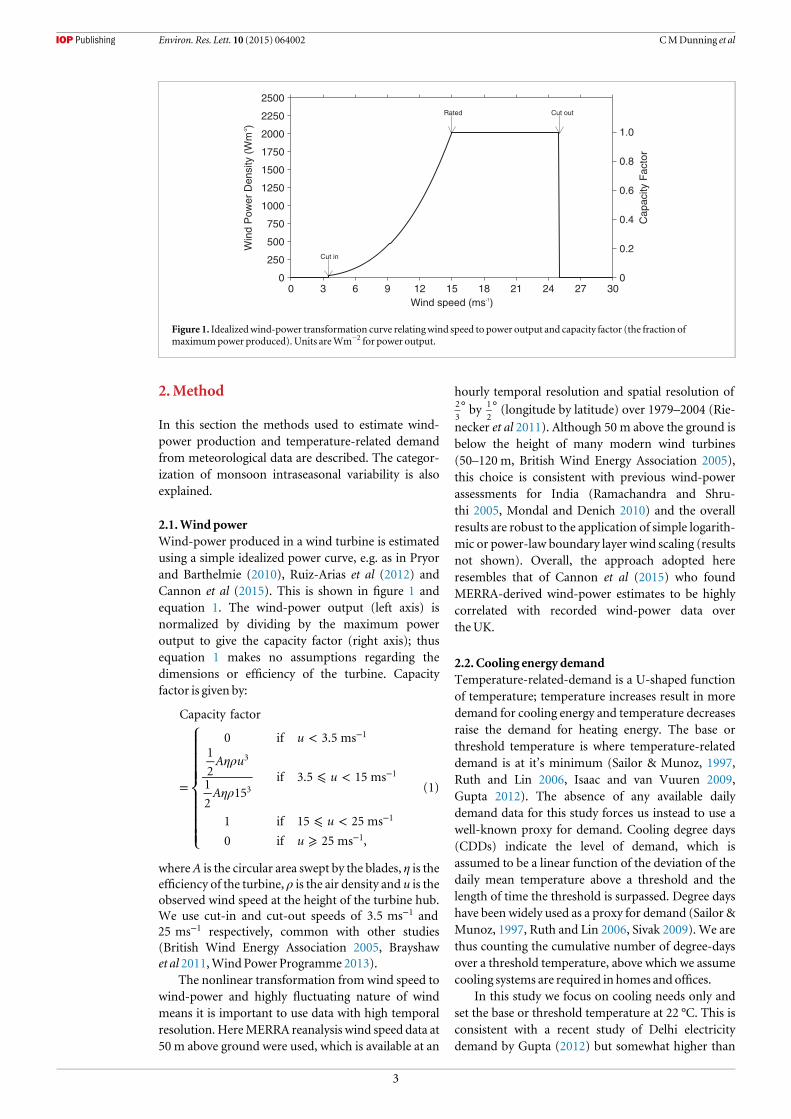
We next transform the wind speeds in the mon-soon phases of figure 3 via equation (1) into capacityfactor (a measure of the wind-turbine power output),as shown in figure 4. As shown in figure 4(b), in theclimatological capacity factor for JJA is highest overthe Arabian Sea, southern India and the Bay of Bengal,and hence the highest potential for wind-power gen-eration is in these regions. However, figure 4(a) showsthat the capacity factor in these regions is typicallystrongly reduced over these ‘high potential’ regionsduring break phases (and increased in the northernArabian Sea and Gujarat where the climatological-mean wind-power is weakest, figure 4(b)). The reversechange is seen during active periods (figure 4(c)), withhigher capacity factor over the Arabian Sea, southernIndia and the Bay of Bengal. The magnitude of themaximum mean increase during active phases (0.22)is typically greater than the magnitude of the max-imummean decrease during break phases (–0.13).
In order to gain a more focused understanding inselected regions, the wind speed and capacity factorwere then considered over the 3 regions shown infigure 3(b). Figure 5 shows the frequency distributionof different wind speeds and capacity factors duringthe active, break and neutral conditions of the mon-soon over regions surrounding Bangalore, Mumbaiand Delhi. Figures 5(a) and (b) demonstrates a cleardistinction between wind speeds under active andbreak phases in both Bangalore andMumbai as expec-ted from the maps shown earlier. Modal wind speedsare 1-2 ms−1 higher during active phases than duringbreak phases, translating into more frequent highcapacity factors during active phases (figures 5(d) and
Figure 3. 50 mwind speed and direction during themonsoon season; (a) and (c) show the anomaly during break and active phasesrespectively, relative to neutral periods; (b) shows themeanwind during themonsoon season. Thewhite boxes and dots on (b)indicate the locations of Bangalore,Mumbai andDelhi and the surrounding regions used for wind speed analysis. Colourationindicates thewind speed inms−1 and the arrows indicate the velocity.
5
Environ. Res. Lett. 10 (2015) 064002 CMDunning et al
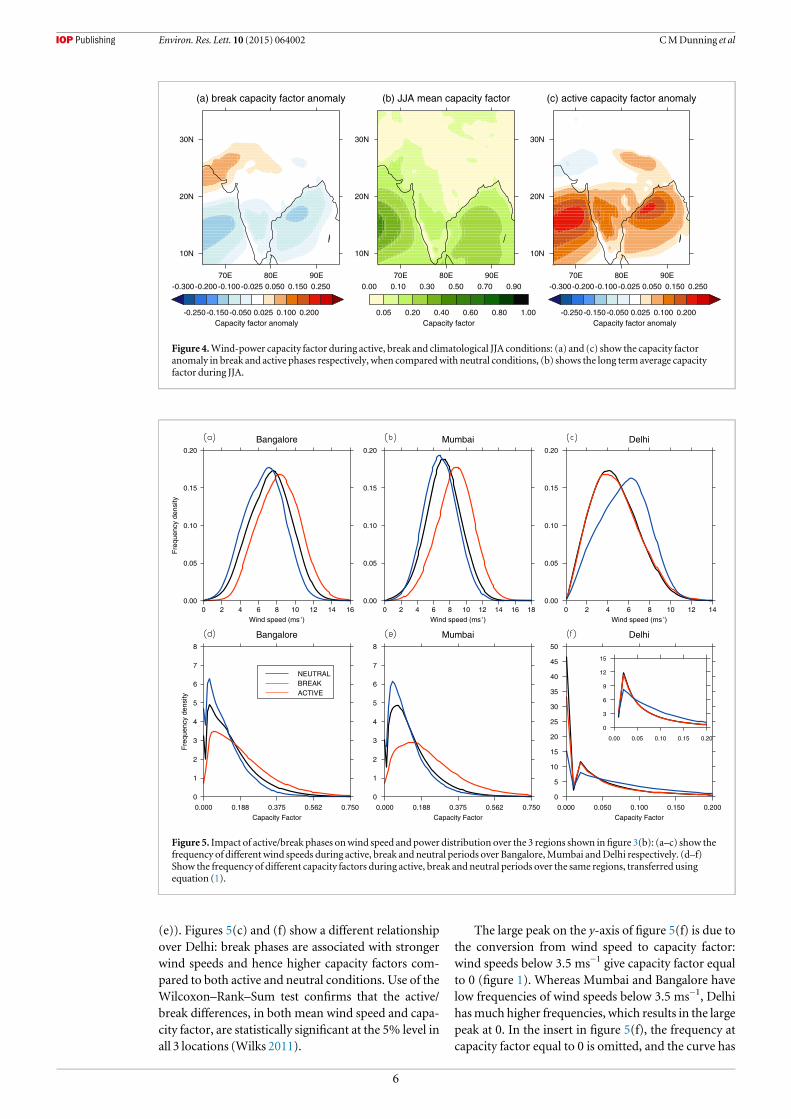
(e)). Figures 5(c) and (f) show a different relationshipover Delhi: break phases are associated with strongerwind speeds and hence higher capacity factors com-pared to both active and neutral conditions. Use of theWilcoxon–Rank–Sum test confirms that the active/break differences, in both mean wind speed and capa-city factor, are statistically significant at the 5% level inall 3 locations (Wilks 2011).
The large peak on the y-axis of figure 5(f) is due tothe conversion from wind speed to capacity factor:wind speeds below 3.5 ms−1 give capacity factor equalto 0 (figure 1). Whereas Mumbai and Bangalore havelow frequencies of wind speeds below 3.5 ms−1, Delhihasmuch higher frequencies, which results in the largepeak at 0. In the insert in figure 5(f), the frequency atcapacity factor equal to 0 is omitted, and the curve has
Figure 4.Wind-power capacity factor during active, break and climatological JJA conditions: (a) and (c) show the capacity factoranomaly in break and active phases respectively, when comparedwith neutral conditions, (b) shows the long term average capacityfactor during JJA.
Figure 5. Impact of active/break phases onwind speed and power distribution over the 3 regions shown infigure 3(b): (a–c) show thefrequency of different wind speeds during active, break and neutral periods over Bangalore,Mumbai andDelhi respectively. (d–f)Show the frequency of different capacity factors during active, break andneutral periods over the same regions, transferred usingequation (1).
6
Environ. Res. Lett. 10 (2015) 064002 CMDunning et al

the same characteristics as those forMumbai and Ban-galore, with the peak in capacity factor due to the peakinwind speed distribution.
In summary, active and break phases of the SouthAsian monsoon lead to a dipole of wind-poweranomalies between north-west and southern India.During active phases vigorous convection across cen-tral India is associated with strong winds across south-ern India, including the cities of Mumbai andBangalore, suggesting high wind-power capacity inSouthern India, whereas there are lower wind speeds(and therefore wind-power output) in north-westIndia. During break phases the movement of the mainregions of convection brings lower wind speeds acrosssouthern India but higher wind speeds and hencehigher wind-power capacity factors across north-westIndia, includingDelhi, and the northernArabian Sea.
4.Demand for cooling onhot days
In order to understand the impact of monsoonintraseasonal variability on a measure of energydemand, we use our core zone rainfall index toexamine the effect of active and break phases ontemperature and CDDs. Figure 6 shows the impact ofintraseasonal variability within the monsoon on dailymean surface temperature over India.
Figure 6(b) shows the mean temperature distribu-tion across India during the monsoon. Higher tem-peratures are found in north India (particularly in thenorth-west over the Thar Desert region) and in south-east India with lower temperatures along the westerncoast. The conditions are consistent and inversely cor-related with the mean rainfall pattern shown infigure 2(b). Figures 6(a) and (c) show the mean tem-perature anomaly during break and active phasesrespectively. During active phases the temperature is
much lower across much of the country, except in thenorth-east, where temperatures are higher, consistentwith the effects of reduced rainfall on surface cooling(figure 2(c)). The pattern during break phases is morecomplex, with higher temperatures in central and eastIndia, and lower temperatures in north east and northwest India. Unlike the wind, the temperature patternin break phases is not an exact reversal of the pattern inactive phases.
CDDs, a proxy for temperature-related electricitydemand, were calculated for Bangalore, Mumbai andDelhi. Probability distribution functions of CDDs inactive, neutral and break phases are shown in figure 7.Figure 7 shows that there are higher frequencies ofdays with high CDD during break phases than duringactive and neutral phases over Bangalore, Mumbai,and Delhi. Using the Wilcoxon–Rank–Sum test it wasfound that these differences are statistically significantat the 5% level (Wilks 2011). Figure 7(c) suggests thatthe differences in CDD distribution between differentphases of monsoon rainfall are less pronounced overDelhi than they are for Mumbai and Bangalore, butthis is likely due to the higher mean-state temperatureconditions in Delhi (30.6 C° ), versus 26.5 C° and24.0 C° in Mumbai and Bangalore respectively. Thismeans it is more difficult for active/wet days to taketemperature below the 22 C° threshold.
Overall, higher temperatures are present acrossIndia during break phases of the South Asian mon-soonwhich is likely to lead to higher temperature-rela-ted electricity demand, including in the cities ofBangalore,Mumbai andDelhi.
5.Discussion and conclusions
The impact of intraseasonal variability of the SouthAsian monsoon on two components of the Indian
Figure 6. Surfacemean temperature during active, break and climatological JJA conditions: (a) and (c) show the temperature anomalyin break and active phases respectively, when comparedwith neutral conditions, (b) shows the long term average surface temperatureduring JJA.
7
Environ. Res. Lett. 10 (2015) 064002 CMDunning et al

power sector was examined. By transforming reanaly-sis wind speeds at approximate turbine height (50 m)into wind-power capacity factor, and transformingtemperatures into CDDs, meteorological data wasused to assess the impact of active and break phases onthe balance of electricity supply and demand in India.The active and break phases of the monsoon rainfallform the dominant mode of intraseasonal variabilityover India. Break phases are characterized by sup-pressed precipitation across central India, increasedincoming solar radiation and higher temperatureswhich are associated with greater demand for coolingenergy (measured by CDD). The movement of themain convection centres and monsoon trough duringbreaks results in lowerwind-power output acrossmostof India (although with some small areas of increase innorth-west India due to stronger winds in this region,as seen in Krishnan et al 2000). In contrast, duringactive phases there is vigorous convection acrosscentral India and heavy rainfall. This is consistent withlower temperatures giving low cooling energy demand(CDD) and strong westerly winds giving high wind-power output. The opposing sense of the relationshipbetween the monsoon phase and each of wind-powersupply, and demand for cooling energy potentially hasseveral important consequences for the large-scaledevelopment of wind-power in the Indian powersystem.
Firstly, the monsoon variability exacerbates thevolatility of the residual demand that must be met bygeneration sources other than wind (i.e., the so called‘demand-net-wind’ or DNW). As demand and supplyfor power must maintain approximate balance at alltime-scales, at least some of this is likely to take theform of schedulable conventional plant (e.g., gas orcoal fired power stations). During break phases wehave high electricity demand for cooling needs as wellas a shortage of available power fromwind generation.Thus a significant amount of alternative generation byschedulable plants is likely to be necessary tomeet high
levels of DNWduring break phases, yet the same sche-dulable plant may be needed much less frequently inneutral or active monsoon conditions. Solar powerwas not investigated here due to lack of available high-quality observations but may offer greater opportu-nities for supply-demand compensation at the intra-seasonal timescale.
Secondly, given the significant role that hydro-power plays in the Indian power system (approxi-mately 20% of the total; Ernst and Young 2013), it isworth noting the additional relationship between themonsoon phase and precipitation. Precipitation isreduced during the high DNW break phases andenhanced in low DNW active phases. While a directlink between hydropower and precipitation has notbeen investigated in this present study, qualitativelythis suggests that hydropower availability may also belower during periods of increased DNW. Furtherresearch will, however, be necessary to quantitativelyunderstand these relationships as the time scales con-necting precipitation to hydropower are likely to besignificantly longer than those linking wind-powerand demand to meteorological drivers, due to integra-tion of rainwater over the river catchment scale.
Thirdly, at the present time the majority of thewind turbines in India are in the southern part of thecountry and along the western coast. The results pre-sented here suggest that an over-reliance on windenergy from this region could lead to problems duringbreak periods due to high levels of DNW. Currently allIndian turbines are onshore but proposed offshorewind turbines in the north-east Arabian Sea (ManiMurali et al 2014) may allow greater dependence onwind-power without risking tight error margins dur-ing break phases, since that offshore region experi-ences increasedwind speeds during break phases.
In summary, this study identifies how the domi-nant mode of monsoon variability may act toqualitatively exacerbate the problems facing wind-power integration over India. In particular, it is
Figure 7.Probability distribution functions of cooling degree days in each city split bymonsoon phase for (a) Bangalore, (b)Mumbaiand (c)Delhi. DailymeanCDDswere calculated by subtracting the threshold of 22 °C from the dailymean observed surfacetemperature data; the PDFs show the frequency of the departure of the dailymean temperature above 22 °C.Note that the x-axis rangeis different in each plot.
8
Environ. Res. Lett. 10 (2015) 064002 CMDunning et al

demonstrated that the impact of the monsoon varia-bility can be enhanced by its simultaneous impact onboth the demand for and supply of power. This illus-trates firstly the need to consider the compoundimpact of weather on power systems (in addition to itsisolated impacts on individual power system compo-nents); and, secondly, the need to understand thetime-varying climate as an inherently ‘dynamic’ driverof the power system rather than as a static climatologi-cal input. Recent studies have begun to explore someof these issues (e.g., IRENA 2015 in the context of thewater-food-energy nexus) butmuchwork remains.
In the immediate context of this study, furtherresearch is required to quantify the effects of monsoonvariability on the individual components of the Indianpower sector, including their interaction with sub-daily variations in human and meteorological beha-viour, and to extend it to include an assessment ofother renewable sources, such as solar power andhydropower. Ongoing efforts to improve the forecastskill of monsoon intraseasonal variability (active andbreak events; e.g. Fu et al 2013)will therefore be rewar-ded through economic impacts felt in the Indianpower sector. Moreover, the uncertain outlook pro-jected for monsoon variability under future warmerclimate conditions (Turner and Annamalai 2012) willalso present challenges to the power industry andtherefore warrants further investigation.
References
AnnamalaiH and Sperber K 2005Regional heat sources and theactive and break phases of boreal summer intraseasonal(30–50 day) variability J. Atmos. Sci. 62 2726–48
BorahN, Sahai A, Chattopadhyay R, Joseph S, Abhilash S andGoswami B 2013A self-organizingmap-based ensembleforecast system for extended range prediction of active/breakcycles of Indian summermonsoon J. Geophys. Res.: Atmos.118 9022–34
BrayshawD J, Troccoli A, FordhamR andMethven J 2011Theimpact of large scale atmospheric circulation patterns onwind power generation and its potential predictability: a casestudy over theUKRenew. Energy 36 2087–96
BritishWind EnergyAssociation 2005Briefing Sheet:WindTurbineTechnology (BritishWind EnergyAssociation)
CannonD, BrayshawD,Methven J, Coker P and LenaghanD2015Using reanalysis data to quantify extremewind powergeneration statistics: a 33 year case study inGreat BritainRenew. Energy 75 767–78
Chattopadhyay R, Sahai A andGoswami BN2008Objectiveidentification of nonlinear convectively coupled phases ofmonsoon intraseasonal oscillation: implications forprediction J. Atmos. Sci. 65 1549–69
ElyCR, BrayshawD J,Methven J, Cox J and PearceO 2013Implications of theNorthAtlantic Oscillation for aUK-NorwayRenewable power system Energy Policy 62 1420–7
Ernst andYoung 2013Mapping Indiaʼs renewable energy growthpotential: status andOutlook 2013 (http://ey.com/Publication/vwLUAssets/Mapping_Indias_Renewable_Energy_growth_potential/$FILE/EY-Mapping-Indias-Renewable-Energy-growth-potential.pdf)
FuX, Lee J-Y,WangB,WangWandVitart F 2013 Intraseasonalforecasting of the Asian summermonsoon in fouroperational and researchmodels J. Clim. 26 4186–203
Goswami BNandXavier PK 2003 Potential predictability andextended range prediction of Indian summermonsoonbreaks Geophys. Res. Lett. 30 1966
Gupta E 2012Global warming and electricity demand in the rapidlygrowing city ofDelhi: a semi-parametric variable coefficientapproachEnergy Econ. 34 1407–21
International EnergyAgency (IEA) 2012WorldEnergyOutlook 2012:Renewable EnergyOutlook (International EnergyAgency (IEA))
IRENA2015Renewable Energy in theWater, Energy& FoodNexus(http://irena.org/menu/index.aspx?mnu=Subcat&PriMenuID=36&CatID=141&SubcatID=496)
IsaacMand vanVuurenDP 2009Modeling global residential sectorenergy demand for heating and air conditioning in thecontext of climate changeEnergy Policy 37 507 – 521
KhademSK andHussainM2006Apre-feasibility study ofwindresources in Kutubdia Island, BangladeshRenew. Energy 312329–41
KhanM, IqbalM andMahboob S 2004Awindmap of BangladeshRenew. Energy 29 643–60
KrishnamurthyV and Shukla J 2007 Intraseasonal and seasonallypersisting patterns of Indianmonsoon rainfall J. Clim. 203–20
KrishnanR, ZhangC and SugiM2000Dynamics of breaks in theIndian summermonsoon J. Atmos. Sci. 57 1354–72
LauWK,Waliser D andGoswami B 2012 SouthAsianmonsoonIntraseasonal Variability in the Atmosphere-OceanClimateSystem (Berlin: Springer) pp 21–72 (www.worldenergyoutlook.org/publications/weo-2012)
ManiMurali R, Vidya P J,Modi P andKumar S J 2014 Site selectionfor offshore wind farms along the Indian coast Indian J.Mar.Sci. 43 7
MondalMAHandDenichM2010Assessment of renewable energyresources potential for electricity generation in BangladeshRenew. Sustainable Energy Rev. 14 2401–13
Munot A andKothawaleD 2014 Interannual Variations of IndianSummerMonsoon (http://tropmet.res.in/~kolli/MOL/)
Pryor S andBarthelmie R 2010Climate change impacts onwindenergy: a reviewRenew. Sustainable Energy Rev. 14 430–7
RajeevanM, Bhate J, Kale J D andLal B 2006High resolution dailygridded rainfall data for the Indian region: analysis of breakand activemonsoon spellsCurr. Sci. 91 296–306
RajeevanM,Gadgil S and Bhate J 2010Active and break spells of theIndian summermonsoon J. Earth Syst. Sci. 119 229–47
Ramachandra T and Shruthi B 2005Wind energy potentialmapping inKarnataka, India, usingGIS Energy Convers.Manage. 46 1561–78
RamamurthyK 1969 Some aspects of the ‘Break’ in the Indiansouthwestmonsoon during July andAugust FMURep.No.IV-1813, January
RameshKumarMandPrabhuDessai UR 2004Anew criterion foridentifying breaks inmonsoon conditions over the IndiansubcontinentGeophys. Res. Lett. 31 L18201
RanjanMand JainV 1999Modelling of electrical energyconsumption inDelhi Energy 24 351–61
RieneckerMM et al 2011MERRA:NASAʼsmodern-eraretrospective analysis for research and applications J. Clim. 243624–48
Ruiz-Arias J A, Terrados J, Perez-Higueras P, Pozo-VazquezD andAlmonacidG2012Assessment of the renewable energiespotential for intensive electricity production in the provinceof Jaen, southern SpainRenew. Sustainable Energy Rev. 162994–3001
RuthMand Lin A-C 2006Regional energy demand and adaptationsto climate change:methodology and application to the stateofMaryland, USA Energy Policy 34 2820–33
SailorD J andMunoz J 1997 Sensitivity of electricity and natural gasconsumption to climate in theU.S.A.methodology andresults for eight states Energy 22 987–98
Santos-Alamillos F, Pozo-VázquezD, Ruiz-Arias J,Lara-FanegoV andTovar-Pescador J 2012Analysis ofspatiotemporal balancing betweenwind and solar energyresources in the southern Iberian Peninsula J. Appl.Meteorol.Climatol. 51 2005–24
9
Environ. Res. Lett. 10 (2015) 064002 CMDunning et al

Schaeffer R, Szklo A S, de Lucena AF P, Borba B SMC,Nogueira L P P, Fleming F P, Troccoli A,HarrisonMandBoulahyaMS 2012 Energy sector vulnerability to climatechange: a review Energy 38 1–12
SivakM2009Potential energy demand for cooling in the 50 largestmetropolitan areas of theworld: implications for developingcountriesEnergy Policy 37 1382–4
Srivastava A, RajeevanMandKshirsagar S 2009Development of ahigh resolution daily gridded temperature data set(1969–2005) for the Indian regionAtmos. Sci. Lett. 10 249–54
Turner AG andAnnamalai H 2012Climate change and the SouthAsian summermonsoonNat. Clim. Change 2 587–95
WangB and FanZ 1999Choice of SouthAsian summermonsoonindicesBull. Am.Meteorol. Soc. 80 629–38
WilksD S 2011 StatisticalMethods in the Atmospheric Sciences vol100 (NewYork: Academic) (www.nottingham.ac.uk/renewableenergyproject/documents/windturbinetechnology.pdf)
Wind Power Programme 2013Wind turbine power ouput variationwith steadywind speed (http://wind-power-program.com/turbine_characteristics.html)
ZhongR andChaturvedi S 2014Outages Reveal Extent of IndiaPowerWoes (http://online.wsj.com/news/articles/SB20001424052702303642704579617960152036716)
10
Environ. Res. Lett. 10 (2015) 064002 CMDunning et al