Embed Size (px)
Citation preview
e
Prepared for:
February 27, 2018
The Impact of NAFTA on U.S. Dairy Exports to Mexico

i
This Page Intentionally Left Blank

ii
Table of Contents EXECUTIVE SUMMARY ........................................................................................................ 1
A. IMPORTANCE OF MEXICO DAIRY IMPORT MARKET ............................................................................. 1
B. MEXICO IS A DEFICIT PRODUCER OF DAIRY PRODUCTS ........................................................................ 1
C. IMPORTANCE OF NAFTA TO U.S. DAIRY EXPORTS ............................................................................. 2 D. POTENTIAL MEXICO TRADE AGREEMENTS CAN INCREASE EXPORT COMPETITION ..................................... 2
E. U.S. LOGISTICS ADVANTAGE .......................................................................................................... 3 F. ECONOMIC CONTRIBUTIONS OF U.S. DAIRY EXPORTS THREATENED BY THE U.S. LEAVING NAFTA .............. 3
G. CONCLUSIONS ............................................................................................................................. 4
INTRODUCTION ................................................................................................................. 5
U.S. EXPORTS TO MEXICO ARE VITAL................................................................................ 6
A. U.S. EXPORT TRENDS .................................................................................................................. 6 B. TAKEAWAYS ................................................................................................................................ 7
C. IMPORT TRENDS .......................................................................................................................... 7
D. TAKEAWAYS ............................................................................................................................. 11
MEXICO, A DEFICIT PRODUCER ....................................................................................... 12
A. FLUID MILK .............................................................................................................................. 12 B. SKIM MILK POWDER .................................................................................................................. 12
C. CHEESE .................................................................................................................................... 13 D. BUTTER ................................................................................................................................... 14
E. DRY WHOLE MILK POWDER ......................................................................................................... 14
F. TAKEAWAYS .............................................................................................................................. 14
MEXICO’S DOMESTIC USE OF DAIRY PRODUCTS ............................................................... 15
A. FLUID MILK .............................................................................................................................. 15 1. Processors ......................................................................................................................... 15
B. SMP ....................................................................................................................................... 15
C. CHEESE .................................................................................................................................... 16 D. BUTTER ................................................................................................................................... 16
E. TAKEAWAYS .............................................................................................................................. 17
MARKET ACCESS TO MEXICO .......................................................................................... 18
A. U.S. MARKET ACCESS TO MEXICO WITHOUT NAFTA ..................................................................... 18
iii
1. MFN Tariffs ........................................................................................................................ 18
2. MFN Tariff Rate Quotas .................................................................................................... 20 B. OTHER TRADE AGREEMENTS ........................................................................................................ 20
1. EU-Mexico FTA Update Negotiations ................................................................................ 20 2. TPP Re-negotiations .......................................................................................................... 20
3. Mexico-Argentina FTA ....................................................................................................... 22
C. TAKEAWAYS .............................................................................................................................. 23
US TRANSPORTATION ADVANTAGES ............................................................................. 24
A. SHIPPING DRY MILK POWDER ...................................................................................................... 24 B. SHIPPING CHEESE & BUTTER ........................................................................................................ 25
C. TAKEAWAYS .............................................................................................................................. 26
ECONOMIC CONTRIBUTION OF DAIRY EXPORTS TO MEXICO TO THE OVERALL U.S. ECONOMY ........................................................................................................................... 27
A. INPUT-OUTPUT MODELING AND IMPLAN METHODOLOGY .............................................................. 27 B. CONTRIBUTION TO THE OVERALL U.S. ECONOMY ............................................................................ 28
1. Aggregate Contribution Over the Last Five Years ............................................................. 28 2. Detailed Contribution of 2016 ........................................................................................... 29
CONCLUSIONS ................................................................................................................ 33

iv
List of Exhibits Exhibit 1: U.S. Dairy Product Exports to World and Mexico .......................................................... 6 Exhibit 2: Mexico Dairy Product Imports ........................................................................................ 8
Exhibit 3: Mexico Dairy Product Imports ........................................................................................ 8
Exhibit 4: Mexico Dry Skim Milk Powder (DSMP) Imports ............................................................. 8 Exhibit 5: Mexico Whey Product Imports ....................................................................................... 9
Exhibit 6: Mexico Cheese Imports .................................................................................................. 9 Exhibit 7: Mexico Cheese Imports .................................................................................................. 9
Exhibit 8: Mexico Blue-Veined Cheese Imports ............................................................................ 10
Exhibit 9: Top 25 Mexico Total Cheese Imports by Type, Metric Tons ....................................... 10 Exhibit 10: Mexico Total Cheese Imports by Type ....................................................................... 11
Exhibit 11: Mexico Fluid Milk Supply and Demand, 1,000 MT .................................................... 12 Exhibit 12: Mexico SMP Supply and Demand, 1,000 MT ............................................................. 13
Exhibit 13: Mexico Cheese Supply and Demand, 1,000 MT ........................................................ 13
Exhibit 14: Mexico Butter Supply and Demand, 1,000 MT .......................................................... 14 Exhibit 15: Mexico Whole Milk Powder Supply and Demand, 1,000 MT .................................... 14
Exhibit 16: Dairy Products Classification, Mexico MFN Rates for 2017 ........................................ 18 Exhibit 17: Current Mexico Tariff Schedule .................................................................................. 19
Exhibit 18: Mexico MFN Tariff Schedule ....................................................................................... 19 Exhibit 19: Projected New Tariff Schedule for TPP Members ...................................................... 21
Exhibit 20: TPP Country Specific Quota (CSQ) .............................................................................. 22
Exhibit 21: Freight Comparison, Dry Products ............................................................................. 25 Exhibit 22: Freight Comparison, Refrigerated Products .............................................................. 26
Exhibit 23: Example of Backward Linkages/Upstream Industries Applied to Dairy Production .. 28 Exhibit 24: Aggregate Economic Contributions Associated with U.S. Dairy Exports: 2012-2016 29
Exhibit 25: Economic Contributions Associated with U.S. Dairy Exports in 2016 ....................... 30
Exhibit 26: Top 15 U.S. Industries Ranked by Contribution to Output/Business Sales (Mil $) ..... 31 Exhibit 27: Top 15 U.S. Industries Ranked by Contribution to GDP (Mil $) .................................. 31
Exhibit 28: Top 15 U.S. Industries Ranked by Contribution to FTE Jobs ....................................... 32

v
Disclaimer This report was produced for the U.S. Dairy Export Council (USDEC). Informa Agribusiness Consulting (“Informa”) has used the best and most accurate information available to complete this study. Informa is not in the business of soliciting or recommending specific investments. The reader of this report should consider the market risks inherent in any financial investment opportunity. Furthermore, while Informa has extended its best professional efforts in completing this analysis, the liability of Informa to the extent permitted by law, is limited to the professional fees received in connection with this project.
1
EXECUTIVE SUMMARY
This study evaluates the importance and role that U.S. dairy exports to Mexico play as an economic value for rural America as well as a complementary supplier of dairy products within Mexico’s total dairy product demand. A. Importance of Mexico Dairy Import Market
Mexico is the world’s fifth largest importer of dairy products in terms of value. The U.S. is by far the largest supplier of dairy products to Mexico accounting for 77 percent of Mexico’s total dairy imports in terms of volume. In terms of value the U.S. accounted for two-thirds of Mexico’s dairy product imports in 2016 followed by New Zealand with under 16 percent and the European Union under 14 percent. In terms of select dairy products the U.S. accounted for:
93 percent of Mexico’s dry skim milk powder imports, 84 percent of whey product imports and 75 percent of cheese imports.
In terms of volume the U.S. accounted for 77 percent of Mexico’s dairy product imports in 2016 followed by New Zealand with 11 percent and the European Union under 7 percent. In terms of select dairy products the U.S. accounted for:
94 percent of dry skim milk powder imports, 93 percent of whey product imports and over 70 percent of cheese imports.
B. Mexico is a Deficit Producer of Dairy Products
Dairy product imports are vital to Mexico because it is a deficit producer of dairy products. Mexico’s milk production does not meet processing sector demand for high quality milk and is limited by cold chain constraints in various subsectors.
Mexico’s production of non-fat dry milk has been relatively flat since 2012 and only meets about 16 percent of its domestic use. At the same time domestic use of non-fat dry milk is growing 3.8 percent annually.
Mexico’s production of cheese meets about 70 percent of domestic consumption, but consumption is growing at a faster rate. Since 2012 production has been growing at an annual rate of 2.6 percent while consumption is growing 4.0 percent annually.
2
Mexico’s production of dried whey only meets about 9 percent of domestic use and production has been relatively flat in recent years.
Mexico’s consumer demand for cheese, skim milk powder and other dairy products are expected to continue to grow. It is important to note that according to a World Bank report more than 40 percent of Mexico’s population lives in poverty, and although economic mobility is slow, as this group transitions into middle income status, domestic consumption of dairy products will accelerate. C. Importance of NAFTA to U.S. Dairy Exports
Under NAFTA, U.S. exports of dairy products to Mexico are duty free. This provides a huge advantage to the U.S. because export competitors shipping to Mexico are subject to MFN tariff rates of 20 to 45 percent on cheese, 45 percent on skim milk powder and 10 percent on whey products. If the U.S. withdraws from NAFTA, the U.S. would be subject to the same MFN rates as its competitors. Mexico is the number one export destination for U.S. dairy products with a value of $1.2 billion in 2016, accounting for 25 percent of all U.S. exports and double the level of the second largest U.S. export market, Canada. Mexico is also the fastest growing U.S. export market with an annual growth rate of 13.7 percent (from 2002-2016). Mexico also accounts for 45 percent of total U.S. skim milk exports and 30 percent of total U.S. cheese exports. If the U.S. leaves NAFTA and loses its tariff advantage U.S. exports to Mexico will be at risk. D. Potential Mexico Trade Agreements Can Increase Export Competition
Mexico is renegotiating its EU-Mexico Free Trade Agreement and is part of the Comprehensive and Progressive Agreement for Trans-Pacific Partnership (TPP-11) negotiations which could improve market access for competitor dairy product exports to Mexico. EU-Mexico FTA renegotiations could provide greater access for EU cheese exports to Mexico. The EU is requesting direct recognition of a list of GI terms regarding cheese such as Asiago, Feta, Gorgonzola, Mozarella di Bufalo Campana and other cheeses. If the EU is granted GI status for those cheeses, U.S. exports of these name cheeses could be restricted because Mexico could only import those cheeses from the EU.
3
TPP-11 negotiations could provide greater market access for New Zealand and Australia cheese and milk powder exports to Mexico. Duty free tariff rate quotas for cheese and milk powder are proposed in the current negotiations. The duty free quota for milk powder for all countries combined would start at 25,000 tons and increased to 42,000 tons by the 11th year and remain at that level in following years. The duty free quota for cheese for all countries combined would start at 4,250 tons and increased to 6,500 tons by the 11th year and remain at that level in following years. If the TPP-11 agreement is finalized the U.S. would lose additional Mexico market share.
E. U.S. Logistics Advantage
The U.S. has a major transportation advantage in shipping dairy products to Mexico in terms of freight costs and transit times as compared with competitors. In addition, U.S. trans modal investments involving shipping between the U.S. and Mexico are important to both countries. These transportation advantages will continue with or without NAFTA. However, these logistics advantages at best would only partially offset economic losses for the U.S. from leaving NAFTA.
F. Economic Contributions of U.S. Dairy Exports Threatened by the U.S. LeavingNAFTA
From 2012 through 2016, the U.S. dairy industry exported in aggregate $6.7 billion of dairy products to Mexico. However, the impact that dairy exports have on the economy does not stop there; as dairy product manufacturers purchase inputs from other industries, these industries will in turn make their own input purchases and pay wages to their employees. This will continue as these “ripple effects” churn through the economy generating support to business sales, GDP, and employment for many other industries.
Results from the IMPLAN model examining the contributions of dairy exports to Mexico confirm the importance of these industries to the U.S. national economy. The total economic contributions (direct, indirect, and induced contributions) created by dairy exports to Mexico show the true importance of these exports to the overall U.S. economy. By including the impacts to industries that are linked (either by indirect or induced spending) to dairy exports the aggregate 2012-2016 output value of $6.7 billion is magnified to a figure of $23.3 billion in economic output. That is, the economic “ripple effects” of the dairy exports are 3.5 times as large as the value of the dairy exports. Another way to think of these effects is that for every $1 of sales associated with dairy exports to Mexico, an additional $2.50 in output (industry sales) is

4
supported elsewhere the United States economy. U.S. dairy exports to Mexico also employed 16,492 full time equivalent (FTE) jobs while directly generating an aggregate GDP of $8.4 billion over that five-year period. G. Conclusions
NAFTA is a major driving force behind growing U.S. dairy product exports to Mexico. The Mexico market accounts for:
25 percent of U.S. exports to all destinations.
More than 25 percent of the growth in U.S. exports to all destinations since 2002.
3.5 percent of total U.S. dairy cash receipts. U.S. export losses are likely to be greater if export competitors such as the EU, Australia and New Zealand are successful in renegotiating or negotiating trade agreements with Mexico to provide greater access to the Mexican market. If the U.S. leaves NAFTA, the growth in U.S. dairy product exports will be adversely impacted and it will be difficult to find new markets to offset those export losses. The economic impacts of U.S. dairy product exports are even more substantial for the U.S. economy. NAFTA and U.S. dairy product exports benefitted the U.S. economy over the last five years (2012-2016) by contributing: $23.3 billion in economic output. $8.4 billion in GDP. Nearly 16,500 jobs across the entire economy. If the U.S. withdraws from NAFTA, the above economic impacts will be in jeopardy and result in substantial losses for the U.S. economy. The above macro-economic impacts are on top of an almost certain negative impacts on farmer prices for milk and resulting negative impacts on farmer incomes. While not the focus of this study, these additional impacts need to be considered with respect to the overall adverse impacts from the U.S. leaving NAFTA.
5
INTRODUCTION
Under NAFTA, US Dairy exports to Mexico have grown from $124 million in 1995 to $1.2 billion in 2016. The US Dairy Export Council (USDEC) commissioned Informa Agribusiness Consulting (Informa) to evaluate the potential economic impact on the U.S. dairy industry if the US withdraws from NAFTA. If the US withdraws from NAFTA, the duty-free access that US companies enjoy to Mexico would be replaced by WTO most-favored nation (MFN) tariff levels. MFN tariff levels are as high as 45 percent depending on the dairy product. At the same time, Mexico is negotiating with the EU on preferential access to the Mexican market, and discussing with New Zealand and Australia on how to move forward with the Trans-Pacific Partnership (TPP). Higher tariffs for U.S. exports without NAFTA and improved access to Mexican markets for other competitors through revised or new trade agreements would U.S. exports to Mexico in jeopardy. The purpose of this study is to evaluate the potential economic impact on the U.S. dairy industry and the rest of the economy if the U.S. withdraws from NAFTA. The study will also demonstrate to both Mexico and the U.S. governments the importance and role that U.S. dairy exports play as an economic value for rural America as well as a complementary supplier of dairy products within the total demand by the Mexican consumer.

6
U.S. EXPORTS TO MEXICO ARE VITAL
A. U.S. Export Trends
Mexico is the number one export destination for U.S. dairy products with a value of $1.2 billion in 2016, accounting for one-fourth of U.S. dairy product exports to the world in terms of both value and quantity1.
Exhibit 1: U.S. Dairy Product Exports to World and Mexico
Source: FAS GATS
Mexico accounted for about 45 percent of U.S. dry skim milk powder or SMP (non-fat dry milk) exports to the world in 2016 in terms of both value and volume.
The value of U.S. SMP exports to Mexico were $555 million in 2016 with an annual growth rate of 16.7 percent from 2002 to 2016.
The volume of U.S. SMP exports to Mexico were 280,675 tonnes in 2016 with an annual growth rate of 14.1 percent from 2002 to 2016.
Mexico accounted for 30 percent of U.S. cheese exports to the world in 2016 in terms of both value and volume.
1 Source FAS/USDA GATS
MT $1,000 MT $1,000 Quantity Value2002 605,876 945,477 115,057 201,484 19.0 21.32003 655,488 997,450 140,196 258,457 21.4 25.92004 908,002 1,452,904 207,903 385,873 22.9 26.62005 989,880 1,628,928 241,056 507,580 24.4 31.22006 1,115,264 1,832,038 212,484 436,951 19.1 23.92007 1,214,726 2,978,228 280,953 853,310 23.1 28.72008 1,374,613 3,752,732 290,749 935,220 21.2 24.92009 1,153,884 2,235,082 277,270 637,371 24.0 28.52010 1,601,717 3,689,267 313,811 836,361 19.6 22.72011 1,734,380 4,786,243 370,705 1,166,445 21.4 24.42012 1,795,110 5,123,122 403,511 1,226,701 22.5 23.92013 2,133,127 6,714,510 415,545 1,429,215 19.5 21.32014 2,147,582 7,095,901 452,352 1,643,942 21.1 23.22015 1,970,885 5,239,801 480,260 1,280,058 24.4 24.42016 2,022,113 4,699,980 502,251 1,217,797 24.8 25.9
% Ann Gwth 9.0 12.1 11.1 13.7
MexicoWorld % Mexico ShareYear

7
The value of U.S. cheese exports to Mexico were $362 million in 2016 with an annual growth rate of 16.7 percent from 2002 to 2016.
The volume of U.S. exports of cheese to Mexico were 89,982 tonnes in 2016 with an annual growth rate of 13.7 percent from 2002 to 2016.
Mexico accounted for around 8 percent of U.S. exports of whey products to the world in 2016 in terms of both value and volume.
The value of U.S. exports of whey products to Mexico were $285 million in 2016 with an annual growth rate of 8 percent from 2002 to 2016.
The volume of U.S. exports of whey products to Mexico were 40,741 tonnes2 in 2016 with an annual growth rate of 8.7 percent from 2002 to 2016.
Mexico accounted for around 10 percent of the value and 12 percent of the volume of U.S. butter exports to the world in 2016 in terms of both value and volume.
The value of U.S. exports of butter to Mexico were $6.7 million in 2016 with an annual growth rate of nearly 20 percent from 2002 to 2016.
The volume of U.S. exports of butter to Mexico were 1,841 tonnes in 2016 with an annual growth rate of 8.7 percent from 2002 to 2016.
B. Takeaways
Mexico accounts for about 25 percent of U.S. dairy products exports and is one of the main reasons U.D. dairy exports have been growing. Just as important, Mexico accounts for 45 percent of U.S. skim milk powder exports and 30 percent of U.S. cheese exports. These shares of U.S. exports are primarily the result of NAFTA, which gives the U.S. an advantage over other competitors in terms of tariffs, to be discussed later in this report Mexico Reliance on Imports from U.S.
C. Import Trends
The U.S. is the top supplier to Mexico of dairy products. In terms of value the U.S. accounted for two-thirds of Mexico’s dairy product imports in 2016, followed by New Zealand with 15.7 percent and the European Union with 13.6 percent. In terms of volume the U.S. accounted for
2 Excludes fluid whey.
8
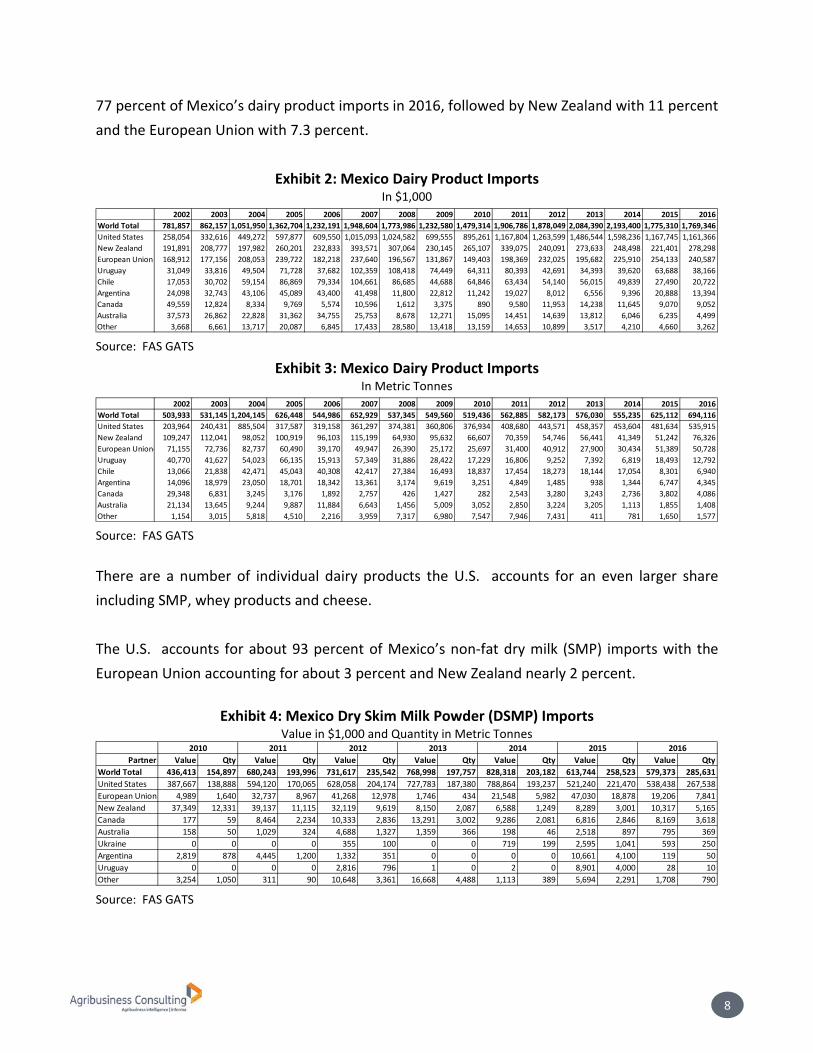
77 percent of Mexico’s dairy product imports in 2016, followed by New Zealand with 11 percent and the European Union with 7.3 percent.
Exhibit 2: Mexico Dairy Product Imports In $1,000
Source: FAS GATS
Exhibit 3: Mexico Dairy Product Imports In Metric Tonnes
Source: FAS GATS
There are a number of individual dairy products the U.S. accounts for an even larger share including SMP, whey products and cheese. The U.S. accounts for about 93 percent of Mexico’s non-fat dry milk (SMP) imports with the European Union accounting for about 3 percent and New Zealand nearly 2 percent.
Exhibit 4: Mexico Dry Skim Milk Powder (DSMP) Imports Value in $1,000 and Quantity in Metric Tonnes
Source: FAS GATS
2002 2003 2004 2005 2006 2007 2008 2009 2010 2011 2012 2013 2014 2015 2016World Total 781,857 862,157 1,051,950 1,362,704 1,232,191 1,948,604 1,773,986 1,232,580 1,479,314 1,906,786 1,878,049 2,084,390 2,193,400 1,775,310 1,769,346United States 258,054 332,616 449,272 597,877 609,550 1,015,093 1,024,582 699,555 895,261 1,167,804 1,263,599 1,486,544 1,598,236 1,167,745 1,161,366New Zealand 191,891 208,777 197,982 260,201 232,833 393,571 307,064 230,145 265,107 339,075 240,091 273,633 248,498 221,401 278,298European Union 168,912 177,156 208,053 239,722 182,218 237,640 196,567 131,867 149,403 198,369 232,025 195,682 225,910 254,133 240,587Uruguay 31,049 33,816 49,504 71,728 37,682 102,359 108,418 74,449 64,311 80,393 42,691 34,393 39,620 63,688 38,166Chile 17,053 30,702 59,154 86,869 79,334 104,661 86,685 44,688 64,846 63,434 54,140 56,015 49,839 27,490 20,722Argentina 24,098 32,743 43,106 45,089 43,400 41,498 11,800 22,812 11,242 19,027 8,012 6,556 9,396 20,888 13,394Canada 49,559 12,824 8,334 9,769 5,574 10,596 1,612 3,375 890 9,580 11,953 14,238 11,645 9,070 9,052Australia 37,573 26,862 22,828 31,362 34,755 25,753 8,678 12,271 15,095 14,451 14,639 13,812 6,046 6,235 4,499Other 3,668 6,661 13,717 20,087 6,845 17,433 28,580 13,418 13,159 14,653 10,899 3,517 4,210 4,660 3,262
2002 2003 2004 2005 2006 2007 2008 2009 2010 2011 2012 2013 2014 2015 2016World Total 503,933 531,145 1,204,145 626,448 544,986 652,929 537,345 549,560 519,436 562,885 582,173 576,030 555,235 625,112 694,116United States 203,964 240,431 885,504 317,587 319,158 361,297 374,381 360,806 376,934 408,680 443,571 458,357 453,604 481,634 535,915New Zealand 109,247 112,041 98,052 100,919 96,103 115,199 64,930 95,632 66,607 70,359 54,746 56,441 41,349 51,242 76,326European Union- 71,155 72,736 82,737 60,490 39,170 49,947 26,390 25,172 25,697 31,400 40,912 27,900 30,434 51,389 50,728Uruguay 40,770 41,627 54,023 66,135 15,913 57,349 31,886 28,422 17,229 16,806 9,252 7,392 6,819 18,493 12,792Chile 13,066 21,838 42,471 45,043 40,308 42,417 27,384 16,493 18,837 17,454 18,273 18,144 17,054 8,301 6,940Argentina 14,096 18,979 23,050 18,701 18,342 13,361 3,174 9,619 3,251 4,849 1,485 938 1,344 6,747 4,345Canada 29,348 6,831 3,245 3,176 1,892 2,757 426 1,427 282 2,543 3,280 3,243 2,736 3,802 4,086Australia 21,134 13,645 9,244 9,887 11,884 6,643 1,456 5,009 3,052 2,850 3,224 3,205 1,113 1,855 1,408Other 1,154 3,015 5,818 4,510 2,216 3,959 7,317 6,980 7,547 7,946 7,431 411 781 1,650 1,577
Partner Value Qty Value Qty Value Qty Value Qty Value Qty Value Qty Value QtyWorld Total 436,413 154,897 680,243 193,996 731,617 235,542 768,998 197,757 828,318 203,182 613,744 258,523 579,373 285,631United States 387,667 138,888 594,120 170,065 628,058 204,174 727,783 187,380 788,864 193,237 521,240 221,470 538,438 267,538European Union 4,989 1,640 32,737 8,967 41,268 12,978 1,746 434 21,548 5,982 47,030 18,878 19,206 7,841New Zealand 37,349 12,331 39,137 11,115 32,119 9,619 8,150 2,087 6,588 1,249 8,289 3,001 10,317 5,165Canada 177 59 8,464 2,234 10,333 2,836 13,291 3,002 9,286 2,081 6,816 2,846 8,169 3,618Australia 158 50 1,029 324 4,688 1,327 1,359 366 198 46 2,518 897 795 369Ukraine 0 0 0 0 355 100 0 0 719 199 2,595 1,041 593 250Argentina 2,819 878 4,445 1,200 1,332 351 0 0 0 0 10,661 4,100 119 50Uruguay 0 0 0 0 2,816 796 1 0 2 0 8,901 4,000 28 10Other 3,254 1,050 311 90 10,648 3,361 16,668 4,488 1,113 389 5,694 2,291 1,708 790
2010 2011 2012 2013 2014 2015 2016
9
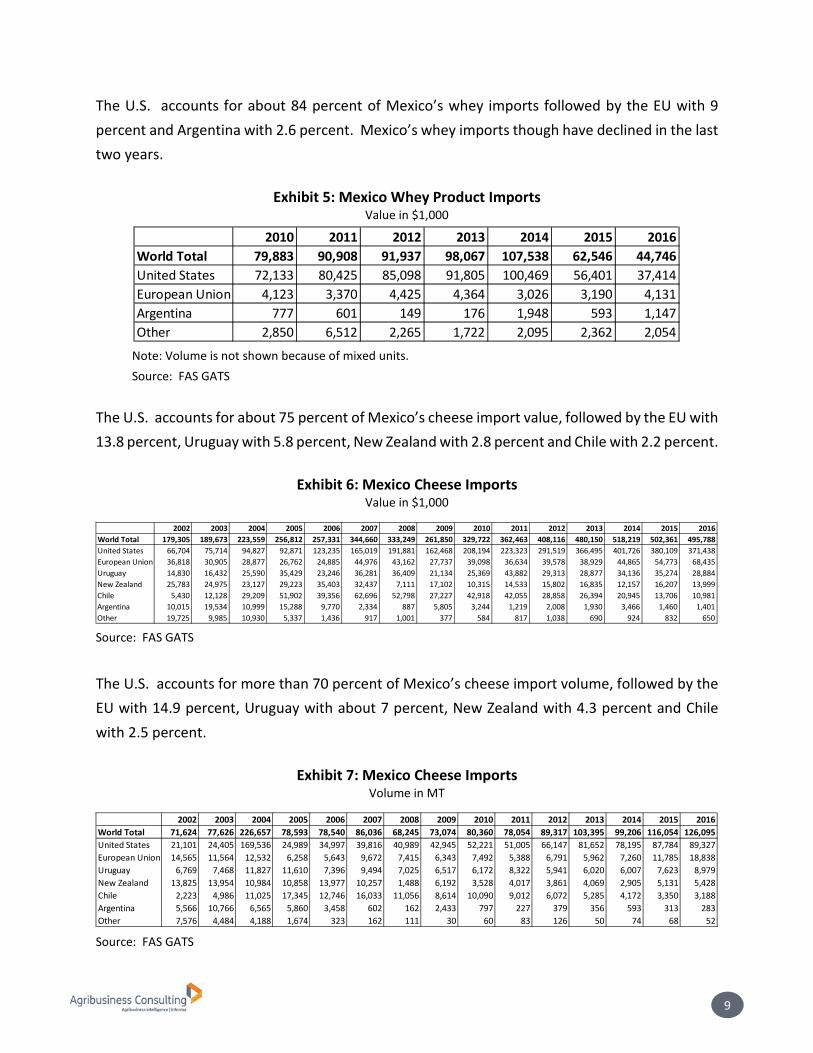
The U.S. accounts for about 84 percent of Mexico’s whey imports followed by the EU with 9 percent and Argentina with 2.6 percent. Mexico’s whey imports though have declined in the last two years.
Exhibit 5: Mexico Whey Product Imports Value in $1,000
Note: Volume is not shown because of mixed units. Source: FAS GATS
The U.S. accounts for about 75 percent of Mexico’s cheese import value, followed by the EU with 13.8 percent, Uruguay with 5.8 percent, New Zealand with 2.8 percent and Chile with 2.2 percent.
Exhibit 6: Mexico Cheese Imports Value in $1,000
Source: FAS GATS
The U.S. accounts for more than 70 percent of Mexico’s cheese import volume, followed by the EU with 14.9 percent, Uruguay with about 7 percent, New Zealand with 4.3 percent and Chile with 2.5 percent.
Exhibit 7: Mexico Cheese Imports Volume in MT
Source: FAS GATS
2010 2011 2012 2013 2014 2015 2016World Total 79,883 90,908 91,937 98,067 107,538 62,546 44,746United States 72,133 80,425 85,098 91,805 100,469 56,401 37,414European Union 4,123 3,370 4,425 4,364 3,026 3,190 4,131Argentina 777 601 149 176 1,948 593 1,147Other 2,850 6,512 2,265 1,722 2,095 2,362 2,054
2002 2003 2004 2005 2006 2007 2008 2009 2010 2011 2012 2013 2014 2015 2016World Total 179,305 189,673 223,559 256,812 257,331 344,660 333,249 261,850 329,722 362,463 408,116 480,150 518,219 502,361 495,788United States 66,704 75,714 94,827 92,871 123,235 165,019 191,881 162,468 208,194 223,323 291,519 366,495 401,726 380,109 371,438European Union 36,818 30,905 28,877 26,762 24,885 44,976 43,162 27,737 39,098 36,634 39,578 38,929 44,865 54,773 68,435Uruguay 14,830 16,432 25,590 35,429 23,246 36,281 36,409 21,134 25,369 43,882 29,313 28,877 34,136 35,274 28,884New Zealand 25,783 24,975 23,127 29,223 35,403 32,437 7,111 17,102 10,315 14,533 15,802 16,835 12,157 16,207 13,999Chile 5,430 12,128 29,209 51,902 39,356 62,696 52,798 27,227 42,918 42,055 28,858 26,394 20,945 13,706 10,981Argentina 10,015 19,534 10,999 15,288 9,770 2,334 887 5,805 3,244 1,219 2,008 1,930 3,466 1,460 1,401Other 19,725 9,985 10,930 5,337 1,436 917 1,001 377 584 817 1,038 690 924 832 650
2002 2003 2004 2005 2006 2007 2008 2009 2010 2011 2012 2013 2014 2015 2016World Total 71,624 77,626 226,657 78,593 78,540 86,036 68,245 73,074 80,360 78,054 89,317 103,395 99,206 116,054 126,095United States 21,101 24,405 169,536 24,989 34,997 39,816 40,989 42,945 52,221 51,005 66,147 81,652 78,195 87,784 89,327European Union 14,565 11,564 12,532 6,258 5,643 9,672 7,415 6,343 7,492 5,388 6,791 5,962 7,260 11,785 18,838Uruguay 6,769 7,468 11,827 11,610 7,396 9,494 7,025 6,517 6,172 8,322 5,941 6,020 6,007 7,623 8,979New Zealand 13,825 13,954 10,984 10,858 13,977 10,257 1,488 6,192 3,528 4,017 3,861 4,069 2,905 5,131 5,428Chile 2,223 4,986 11,025 17,345 12,746 16,033 11,056 8,614 10,090 9,012 6,072 5,285 4,172 3,350 3,188Argentina 5,566 10,766 6,565 5,860 3,458 602 162 2,433 797 227 379 356 593 313 283Other 7,576 4,484 4,188 1,674 323 162 111 30 60 83 126 50 74 68 52

10
Mexico imports a number of different types of cheeses. In terms of different cheeses, GATS data only shows blue-veined cheese, which includes gorgonzola cheese. The U.S. accounts for between 37 and 39 percent of Mexico’s blue-veined cheese imports with the EU the largest supplier accounting for about 60 percent of Mexico’s blue-veined cheese imports.
Exhibit 8: Mexico Blue-Veined Cheese Imports Value in $1,000 and Quantity in Metric Tonnes
Source: FAS GATS
As indicated above, it is difficult to break out Mexico’s cheese imports by specific types of cheese as countries have different interpretations of HS codes. The imports are classified by the HS code descriptions resulting in cheeses entering under a generic code for other cheese or grouped into a large category. A best estimation of Mexico’s total cheese imports by specific type is found in Exhibit 9. Gouda has been the most imported type of cheese by Mexico, growing from 31,200 tonnes in 2012 to a forecasted 56,800 tonnes in 2017.
Exhibit 9: Top 25 Mexico Total Cheese Imports by Type, Metric Tons
Source: USDEC
2010 2010 2011 2011 2012 2012 2013 2013 2014 2014 2015 2015 2016 2016Partner Value Qty Value Qty Value Qty Value Qty Value Qty Value Qty Value QtyWorld Total 3,568 419 3,915 428 4,121 489 3,952 475 4,485 506 4,001 473 3,991 521United States 1,423 207 1,599 212 1,721 232 1,561 203 1,874 223 1,458 191 1,465 200European Union 1,859 199 1,989 204 2,014 239 2,039 258 2,215 266 2,248 265 2,401 311
2012 2013 2014 2015 2016 2017f TrendGouda 31,200 36,700 38,445 43,058 50,320 56,811Other non-specified 18,248 24,393 15,582 25,427 24,878 17,935Pizza mozzarella 7,882 8,204 8,541 8,649 10,104 10,403Regular cream cheese 7,544 8,124 8,820 9,421 8,479 9,577Monterey Jack 5,144 5,607 6,100 6,489 7,125 7,558Fresh mozzarella 4,871 5,145 5,419 5,678 6,530 6,945Cheddar for processing 4,478 4,851 5,235 5,937 6,289 6,802Edam 2,791 2,845 2,700 2,840 3,578 3,674Parmesan-type 2,214 2,433 3,524 3,574 3,578 3,674Emmental/Swiss 1,370 1,402 1,390 1,445 1,582 1,908Provolone (other) 706 728 757 785 803 825Muenster/Munster 542 561 575 592 609 622Processed cheese other 698 704 782 789 592 748Neufchatel (US) 226 259 288 324 366 394Processed cream cheese 188 206 225 244 263 277Parmigiano Reggiano 110 125 152 153 218 285Brie & Camembert 152 161 179 181 177 183Feta (other) 105 112 120 129 139 145Ricotta 85 91 96 106 116 121Grana Padano 55 62 74 73 104 134Processed cheese slices 59 65 71 76 71 85Fontina (other) 36 43 45 48 53 58Gorgonzola (other) 18 22 27 29 36 42Havarti 11 12 14 17 32 39Cheddar for consumption 11 10 15 17 20 26

11
The following table also shows Mexico’s total cheese imports by type based on Mexico Customs data. Based on this data Gouda, Romano and Mozzarella cheese are the most imported cheeses.
Exhibit 10: Mexico Total Cheese Imports by Type
Source: Mexico Customs data through USDEC D. Takeaways
The U.S. is a very important business and trading partner of Mexico in terms of dairy products. The U.S. accounts for 77 percent of Mexico’s dairy product imports. The U.S. accounts for 93 percent of Mexico’s SMP imports, 84 percent of whey product imports, and 70 percent of cheese imports. This U.S. market share is directly the result of NAFTA and the duty free status U.S. exports have under NAFTA. These shares would be in jeopardy if the U.S. withdraws from NAFTA.
MT $1,000 MT $1,000Gouda 35,880 136,344 57,868 219,898Romano 27 216,000 36 288,000Mozzarella 22,216 77,756 27,547 96,099Parmesan 4,690 37,520 3,149 25,192Edam 2,791 12,595 3,578 16,101Emmental/Gruyere/Swiss 1,370 10,960 1,977 15,816Muenster 677 2,369 1,093 5,292Provolone 811 4,460 923 5,076Camembert 205 2,460 256 3,072Feta 105 840 189 1,512Gorgonzola 52 920 78 1,380Neufchatel 226 678 457 1,371Asiago 36 468 90 1,170Fontina 40 300 74 555
2012 2016Type of Cheese

12
MEXICO, A DEFICIT PRODUCER
A. Fluid Milk
Domestic milk production does not currently meet demand by the processing sector for high quality milk. There is not sufficient cold chain for transport to market after processing, or lack of infrastructure to cool milk, and maintaining a lower temperature in the post-milking phase. The limited cold chain constrains growth in various subsectors. As a result, Mexico is a deficit producer of dairy products and imports play a major role in meeting domestic demand.
Exhibit 11: Mexico Fluid Milk Supply and Demand, 1,000 MT
Source: FAS/USDA
Mexico’s food industry has been the primary market demand driver contributing to U.S. dairy exports. The processing sector fuels demand for fluid milk and dairy products, such as powdered milk, with the gap between production and demand filled by imports.
B. Skim Milk Powder
Mexico is a deficit producer of non-fat dry milk with production only meeting about 15 percent of its domestic demand. As a result, Mexico is highly dependent on non-fat dry milk imports. Import demand is growing and is expected to continue strong with an annual consumption growth rate of 5.3 percent since 2001 (Exhibit 12).
Attribute 2001 2002 2003 2004 2005 2006 2007 2008 2009 2010 2011 2012 2013 2014 2015 2016 2017Cows In Milk 6,133 6,800 6,800 6,800 6,850 6,875 6,010 6,204 6,400 6,480 6,400 6,350 6,300 6,350 6,400 6,450 6,500Production 9,900 9,700 9,924 10,029 10,016 10,214 10,829 11,077 11,036 11,201 11,213 11,434 11,451 11,624 11,900 12,121 12,377Cows Milk Production 9,756 9,560 9,784 9,874 9,855 10,051 10,657 10,907 10,866 11,033 11,046 11,274 11,294 11,464 11,736 11,956 12,200Other Milk Production 144 140 140 155 161 163 172 170 170 168 167 160 157 160 164 165 177Imports 41 20 58 70 77 43 95 63 45 41 38 39 41 35 41 48 50Total Supply 9,941 9,720 9,982 10,099 10,093 10,257 10,924 11,140 11,081 11,242 11,251 11,473 11,492 11,659 11,941 12,169 12,427Exports 0 0 0 0 0 0 2 5 5 9 10 13 10 11 11 12 14Domestic Consumption 9,941 9,720 9,982 10,099 10,093 10,257 10,922 11,135 11,076 11,233 11,241 11,460 11,482 11,648 11,930 12,157 12,413Fluid Use Dom. Consum. 4,184 4,080 4,352 4,349 4,266 4,305 4,275 4,263 5,206 5,167 4,100 4,168 4,160 4,180 4,185 4,183 4,186Factory Use Consum. 5,757 5,640 5,630 5,750 5,827 5,952 6,647 6,872 5,870 6,066 7,141 7,292 7,322 7,468 7,745 7,974 8,227Total Distribution 9,941 9,720 9,982 10,099 10,093 10,257 10,924 11,140 11,081 11,242 11,251 11,473 11,492 11,659 11,941 12,169 12,427Feed Use Dom. Consum. 0 0 0 0 0 0 0 0 0 0 0 0 0 0 0 0 0

13
Exhibit 12: Mexico SMP Supply and Demand, 1,000 MT
Source: FAS/USDA
C. Cheese
Production of cheese in Mexico is almost exclusively for domestic consumption, and supplemented by imports to meet demand. Mexico is also a deficit producer of cheese, with domestic production meeting about 70 percent of its domestic needs. In addition, production growth has slowed in recent years. Domestic use is growing at a faster rate than domestic production (Exhibit 13). The annual growth rate in domestic use is 3.6 percent compared with the growth rate for production of 3.4 percent and is expected to continue to grow. While cheese production is increasing, this growth faces a constraint in the availability of domestic high quality fluid milk as an input. Cheese is a staple food for all income levels of Mexican households, providing fat and protein in quesadillas, toppings on tacos, and sandwiches. As previously reported, Mexico produces one of the widest varieties of cheeses in Latin America with around 60 varieties.
Exhibit 13: Mexico Cheese Supply and Demand, 1,000 MT
Source: FAS/USDA
Attribute 2001 2002 2003 2004 2005 2006 2007 2008 2009 2010 2011 2012 2013 2014 2015 2016 2017Beginning Stocks 0 0 0 0 0 0 0 0 0 0 0 0 0 0 0 0 0Production 14 13 13 6 10 18 18 24 25 13 26 55 55 55 55 55 55Imports 140 132 129 141 155 111 121 152 165 155 194 236 198 203 259 286 300Total Supply 154 145 142 147 165 129 139 176 190 168 220 291 253 258 314 341 355Exports 1 0 0 0 0 0 0 0 0 0 0 0 0 0 0 3 5Domestic Consumption 153 145 142 147 165 129 139 176 190 168 220 291 253 258 314 338 350 Prod % Consump 9.15 8.97 9.15 4.08 6.06 13.95 12.95 13.64 13.16 7.74 11.82 18.90 21.74 21.32 17.52 16.27 15.71Per Capita Consump lbs 3.34 3.12 3.01 3.08 3.41 2.64 2.80 3.50 3.73 3.25 4.19 5.47 4.69 4.73 5.69 6.05 6.19Total Use 154 145 142 147 165 129 139 176 190 168 220 291 253 258 314 341 355Ending Stocks 0 0 0 0 0 0 0 0 0 0 0 0 0 0 0 0 0Total Distribution 154 145 142 147 165 129 139 176 190 168 220 291 253 258 314 341 355
Attribute 2001 2002 2003 2004 2005 2006 2007 2008 2009 2010 2011 2012 2013 2014 2015 2016 2017Beginning Stocks 0 0 0 0 0 0 0 0 0 0 0 0 0 0 0 0 0Production 175 138 126 134 143 145 184 188 242 264 270 264 270 275 280 285 300Imports 66 71 78 82 89 86 86 68 73 80 78 89 103 99 116 123 130Total Supply 241 209 204 216 232 231 270 256 315 344 348 353 373 374 396 408 430Exports 0 0 0 2 2 2 4 5 4 6 4 4 5 4 5 5 5Domestic Consumption 241 209 204 214 230 229 266 251 311 338 344 349 368 370 391 403 425 Prod % Consump 72.6 66.0 61.8 62.6 62.2 63.3 69.2 74.9 77.8 78.1 78.5 75.6 73.4 74.3 71.6 70.7 70.6Per Capita Consump lbs 5.25 4.50 4.33 4.48 4.76 4.68 5.36 4.99 6.10 6.53 6.55 6.56 6.83 6.78 7.08 7.21 7.52Total Use 241 209 204 216 232 231 270 256 315 344 348 353 373 374 396 408 430Ending Stocks 0 0 0 0 0 0 0 0 0 0 0 0 0 0 0 0 0Total Distribution 241 209 204 216 232 231 270 256 315 344 348 353 373 374 396 408 430

14
D. Butter
Mexico butter production meets about 77 percent of its domestic demand with the residual needing to be imported. Domestic production is also only growing slowing. Domestic butter production though has a higher annual growth rate than domestic use at 4.4 percent compared with 4.0 percent.
Exhibit 14: Mexico Butter Supply and Demand, 1,000 MT
Source: FAS/USDA
E. Dry Whole Milk Powder
Mexico produces almost all of its dry whole milk powder domestic needs. Mexico’s imports account for only about 8 percent of its domestic use.
Exhibit 15: Mexico Whole Milk Powder Supply and Demand, 1,000 MT
Source: FAS/USDA
F. Takeaways
Dairy product imports are vital to Mexico because its domestic production cannot meet its growing demand for dairy products. Mexico currently only produces 15 percent of its skim milk powder domestic use and 70 percent of its cheese needs.
Attribute 2001 2002 2003 2004 2005 2006 2007 2008 2009 2010 2011 2012 2013 2014 2015 2016 2017Beginning Stocks 0 0 0 0 0 0 0 0 0 0 0 0 0 0 0 0 0Production 105 78 74 88 93 109 214 180 171 182 187 190 190 192 195 205 210Imports 35 37 40 53 51 60 72 49 74 49 36 37 50 37 43 65 62Total Supply 140 115 114 141 144 169 286 229 245 231 223 227 240 229 238 270 272Exports 0 0 0 0 0 0 2 0 0 0 0 1 6 8 10 15 10Domestic Consumption 140 115 114 141 144 169 284 229 245 231 223 226 234 221 228 255 262Total Use 140 115 114 141 144 169 286 229 245 231 223 227 240 229 238 270 272Ending Stocks 0 0 0 0 0 0 0 0 0 0 0 0 0 0 0 0 0Total Distribution 140 115 114 141 144 169 286 229 245 231 223 227 240 229 238 270 272
Attribute 2001 2002 2003 2004 2005 2006 2007 2008 2009 2010 2011 2012 2013 2014 2015 2016 2017Beginning Stocks 0 0 0 0 0 0 0 0 0 0 0 0 0 0 0 0 0Production 138 142 145 160 166 174 182 168 164 173 168 150 150 150 155 156 157Imports 55 43 44 34 44 43 46 23 27 15 30 9 11 7 7 12 13Total Supply 193 185 189 194 210 217 228 191 191 188 198 159 161 157 162 168 170Exports 12 12 11 8 11 6 6 6 6 7 8 5 5 6 11 20 22Domestic Consumption 181 173 178 186 199 211 222 185 185 181 190 154 156 151 151 148 148Total Use 193 185 189 194 210 217 228 191 191 188 198 159 161 157 162 168 170Ending Stocks 0 0 0 0 0 0 0 0 0 0 0 0 0 0 0 0 0Total Distribution 193 185 189 194 210 217 228 191 191 188 198 159 161 157 162 168 170

15
MEXICO’S DOMESTIC USE OF DAIRY PRODUCTS
A. Fluid Milk
For 2018, fluid use for domestic consumption is forecast flat at 4.2 million tonnes. Demand currently remains stable, while demand for other specialized dairy products has increased. Industry believes that this consumption level could be greatly expanded. 1. Processors
Factory usage is forecast for 2018 at 8.3 million tonnes, or almost double fluid use for domestic consumption. Consumers are demanding more and more specialty-processed milk products, and processors are responding. This includes conversion into powdered milk, use in products such as UHT milk (ultra-high pasteurization for shelf stable milk), and cheese. Milk is also used in the production of yogurt, cream, butter, and anhydrous milk fat production. Many of these processed products do not require refrigeration and therefore are popular among both retailers and consumers. Several sources report that industrial production of dairy value-added products is growing at a significantly faster rate than production of fluid milk. B. SMP
Growth in SMP use is constrained by the competition for raw material (fluid milk) with other value-added products processors. The industry is seeking to expand production through two new drying facilities, which have been discussed in previous reports, but are not yet in operation (they are currently on hold for recognition as TIF facilities). Overall, in Mexico there are only around 10 drying facilities, so the addition of two more will significantly increase capacity. These facilities will principally produce whole milk powder (WMP), but any surpluses of fluid milk will most likely go to SMP. These facilities will face challenges making their product competitive, as production costs in Mexico are higher than prices on the international market. SMP consumption is continuing to grow as dairy processors (the primary users of SMP) continue to demand inputs for their processed products or to be reconstituted into specialty milk. For example, SMP from the United States or Canada might be imported as an input for reconstituted UHT.

16
C. Cheese
Consumption of both fresh and hard or aged cheese will continue to be defined by income and inflation, with fresh cheeses consumed by all income levels, but aged cheese principally consumed by the middle and upper income population. While the low-income consumer purchases fresh cheese varieties in traditional wet markets, a small but growing segment of the population with higher incomes are purchasing fine (aged), and often, imported cheeses, at supermarkets, price clubs (Sam’s Club and Costco), and specialized stores. Middle and high-income consumers are able to refine their consumption patterns through their purchasing power, moving through the “tasting wheel” from soft white cheeses to harder whites and yellows, eventually developing a taste for hard or mature cheeses (blue cheese, gorgonzola). High-end restaurants and resorts also cater to this growing demand. Lower income groups can play an important role in developing this market as well through purchases of less expensive cheeses in similar styles. As a general trend, millennials are entering the work force with higher educational levels than the previous generation, with greater purchasing power, including young women who are moving away from traditional roles. These types of consumers are customary clients of new restaurant franchises where various dishes are served with a variety of cheeses. For example, many sushi restaurants in middle and high-income areas use “queso Philadelphia,” or rather, cream cheese, in many sushi rolls.
D. Butter
As in recent years, butter processors continue to compete for inputs (fluid milk) with other dairy processors. Given the sustained demand from the bakery and confectionary sectors, the hotel, restaurant, and institutional (HRI) sector continues to demand high volumes for baking and direct consumption at restaurants and resorts. Smaller demand comes directly from consumers who purchase butter at grocery stores and retail chains. Consumption is increasing overall, particularly in the HRI processing sector (processed foods, baked goods, etc.), and in Mexico’s largest cities (Mexico City, Guadalajara, and Monterrey).

17
E. Takeaways
Mexico’s consumer demand for cheeses, SMP and whey products is expected to continue to grow. Although currently there is growth in the domestic market for dairy products among middle and higher income groups, according to the World Bank, more than 40 percent of Mexico’s population lives in poverty. Although economic mobility is low, as this group transitions into middle-income status, there will be an opportunity for domestic use of dairy products to grow even more.
18
MARKET ACCESS TO MEXICO
Under NAFTA, the U.S. can export dairy products to Mexico duty free. NAFTA provides a huge advantage to the U.S. because export competitors shipping to Mexico are subject to MFN tariff rates ranging from 20 to 45 percent and a tariff rate quota for SMP. Currently negotiations are taking place to modernize NAFTA. If the U.S. withdraws from NAFTA, the U.S. would be subject to the same MFN rates as its competitors. In addition, some competitors are negotiating trade agreements such as TPP-11 and updating the EU-Mexico trade agreement that would allow them greater access to the U.S. market. This section evaluates potential changes in the U.S. export competitive position to Mexico that could occur from these trade negotiations.
A. U.S. Market Access to Mexico Without NAFTA
1. MFN Tariffs
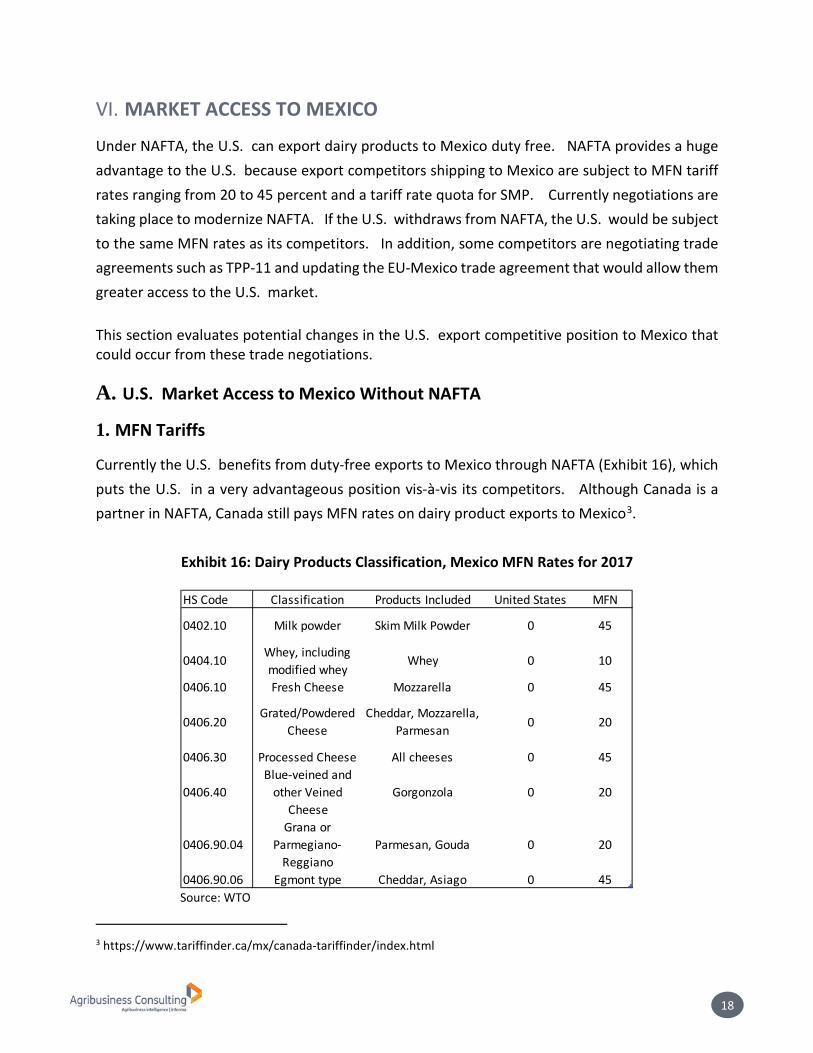
Currently the U.S. benefits from duty-free exports to Mexico through NAFTA (Exhibit 16), which puts the U.S. in a very advantageous position vis-à-vis its competitors. Although Canada is a partner in NAFTA, Canada still pays MFN rates on dairy product exports to Mexico3.
Exhibit 16: Dairy Products Classification, Mexico MFN Rates for 2017
Source: WTO
3 https://www.tariffinder.ca/mx/canada-tariffinder/index.html
HS Code Classification Products Included United States MFN
0402.10 Milk powder Skim Milk Powder 0 45
0404.10 Whey, including modified whey
Whey 0 10
0406.10 Fresh Cheese Mozzarella 0 45
0406.20Grated/Powdered
CheeseCheddar, Mozzarella,
Parmesan 0 20
0406.30 Processed Cheese All cheeses 0 45
0406.40Blue-veined and
other Veined Cheese
Gorgonzola 0 20
0406.90.04Grana or
Parmegiano-Reggiano
Parmesan, Gouda 0 20
0406.90.06 Egmont type Cheddar, Asiago 0 45

19
In comparison, major competitor cheese exporters to Mexico pay MFN tariffs ranging from 20 to 45 percent depending on how the cheese is classified (Exhibit 17). Competitors also pay a tariff of 10 percent on exports of whey products to Mexico, and a tariff of 45 percent on skim milk powder.
Exhibit 17: Current Mexico Tariff Schedule
Source: USTR, WTO4 If the United States were to exit from NAFTA, cheese, whey, skim milk powder and other dairy product exports would be subject to Mexico’s MFN rates for imports, eliminating the competitive tariff advantage the U.S. has held over other competitors. Under this scenario, the U.S. would pay the same tariffs as their competitors in the Mexico dairy market (Exhibit 18).
Exhibit 18: Mexico MFN Tariff Schedule
Source: USTR, WTO5 4 http://tariffdata.wto.org/ReportersAndProducts.aspx 5 http://tariffdata.wto.org/ReportersAndProducts.aspx
HS Code Classification United States Canada New Zealand Australia EU
0402.10 Milk powder 0 45 45 45 45
0404.10 Whey, including modified whey
0 10 10 10 10
0406.10 Fresh Cheese 0 45 45 45 45
0406.20Grated/Powdered
Cheese 0 20 20 20 20
0406.30 Processed Cheese 0 45 45 45 45
0406.40Blue-veined and other
Veined Cheese 0 20 20 20 20
0406.90.04Grana or Parmegiano-
Reggiano 0 20 20 20 20
0406.90.06 Egmont type 0 45 45 45 45
HS Code Classification United States Canada New Zealand Australia EU0402.10 Milk powder 45 45 45 45 45
0404.10 Whey, including modified whey
10 10 10 10 10
0406.10 Fresh Cheese 45 45 45 45 45
0406.20 Grated/Powdered Cheese
20 20 20 20 20
0406.30 Processed Cheese 45 45 45 45 45
0406.40 Blue-veined and other Veined Cheese
20 20 20 20 20
0406.90.04 Grana or Parmegiano-Reggiano
20 20 20 20 20
0406.90.06 Egmont type 45 45 45 45 45

20
2. MFN Tariff Rate Quotas
Currently Mexico has a tariff rate quota (TRQ) for imported powder milk under HTS 0402.10.01 (SMP) and 0402.21.01 (WMP) from WTO countries of 80,000 tonnes. Current imports from US are duty-free under NAFTA. If the U.S. withdraws from NAFTA it will have to compete for the TRQ and pay an MFN rate of 45 percent outside the TRQ.
B. Other Trade Agreements
Negotiations to update the EU-Mexico FTA and negotiations to finalize the TPP-11 are two agreements that could make U.S. exports even less competitive to Mexico. 1. EU-Mexico FTA Update Negotiations
Dairy products are not included in the current EU-Mexico FTA and EU dairy product exports to Mexico and are subject to MFN tariff rates. However, under current negotiations to update the FTA, the EU has requested direct recognition of a list of GI terms regarding cheese such as Asiago, Feta, Gorgonzola, Mozzarella di Bufala Campana, and others. If the EU was granted GI status those cheeses, that would restrict competition in those products because Mexico could only import cheeses with those names from the EU. GI status for the EU would be a defacto barrier to trade and reduce market access opportunities for U.S. exports to Mexico. So far Mexico opposes including geographical indications in the agreement.
2. TPP Re-negotiations
Headed by the Japanese leadership, the remaining TPP countries from the original delegation have begun meeting to discuss the future of the trade pact, now called the Comprehensive and Progressive Agreement for Trans-Pacific Partnership (TPP-11). The Japanese strategy is to keep as much of the current deal as intact as possible. The primary adjustments that have been made include removing many of the elements agreed to as a means to satisfy the United States requests during negotiations, including many provisions on intellectual property. At the APEC summit in November, the remaining 11 countries agreed to most of the elements in the agreement. Despite the failure to sign the agreement in its entirety, primarily due to Canada’s position on cultural exemption, there appears to be a clear path forward toward a new revamped agreement. Most of the original language is expected to remain, it has been reported that new language will be included to allow the trade deal to move forward without the United States.

21
As indicated earlier, Australia and New Zealand are subject to Mexico MFN rates; but, under the TPP-11 currently being negotiated, some dairy product import duties into Mexico would be zero under country specific quotas (CSQ). The quantities for the CSQs would increase over eleven years and remain capped in perpetuity after that. Members of TPP will compete for the Mexico tariff rate quota amounts through auctions in the first three years and on a first come serve basis after that. Exhibit 19 shows what the Mexico tariff schedule would be in a TPP final draft. Milk powder and cheese imports from Australia, New Zealand and Canada will immediately enter Mexico duty-free6, but would be subject to country specific quotas (CSQs). Exhibit 20 shows the CSQ schedule as detailed in Mexican tariff elimination section of the TPP. Whey will not have a CSQ and duties for this product will continue at 10 percent for all imports. Although the tariff rate quota quantities are not huge, if granted, they potentially could take the place of U.S. exports.
Exhibit 19: Projected New Tariff Schedule for TPP Members
Source: USTR7 *Subject to CSQ
6 https://ustr.gov/sites/default/files/TPP-Final-Text-Mexico-Tariff-Elimination-Schedule.pdf 7 https://ustr.gov/sites/default/files/TPP-Final-Text-Mexico-Tariff-Elimination-Schedule.pdf
HS Code Classification Canada New Zealand Australia
0402.10 Milk powder CSQ CSQ CSQ
0404.10Whey, including modified whey
10 10 10
0406.10 Fresh Cheese CSQ CSQ CSQ
0406.20Grated/Powdered
CheeseCSQ CSQ CSQ
0406.30 Processed Cheese CSQ CSQ CSQ
0406.40Blue-veined and other
Veined CheeseCSQ CSQ CSQ
0406.90.04Grana or Parmegiano-
ReggianoCSQ CSQ CSQ
0406.90.06 Egmont type CSQ CSQ CSQ

22
Exhibit 20: TPP Country Specific Quota (CSQ)
Source: USTR8
3. Mexico-Argentina FTA
Mexico is currently in negotiations with Argentina, however much of the short-term future of any free trade agreement between the two countries depends on the efficacy of NAFTA re-negotiations. Mexico, the world’s biggest buyer of U.S. corn, is considering offering duty-free access to Brazilian and Argentine maize as an alternative to American imports in a move that could have big consequences for U.S. farmers worried about President Trump’s trade and tax agenda. Under the deal, Argentina could gain part of the grains market in Mexico, the second largest Latin American economy. While there has been progress made towards expanding Argentina and Brazil access to the Mexican markets, most movement has been centered around Mexico’s grains market. The U.S. dairy industry is not expected to experience significant impact from any future pact between Argentina and Mexico, particularly as Argentina dairy industry is currently recovering from one
8 https://ustr.gov/sites/default/files/TPP-Final-Text-Mexico-Appendix-A-1-Tariff-Rate-Quotas-and-Appendix-A-2-Country-Specific-Allocation-for-Sugar-of-Mexico.pdf
Quota YearAnnual Aggregate
Quantity (MT)Quota Year
Annual AggregateQuantity (MT)
1 4,250 1 25,000
2 4,475 2 26,700
3 4,700 3 28,400
4 4,925 4 30,100
5 5,150 5 31,800
6 5,375 6 33,500
7 5,600 7 35,200 8 5,825 8 36,900 9 6,050 9 38,600
10 6,275 10 40,300
11+ 6,500 11+ 42,000
Cheese Milk Powder

23
of the worst crises in over 20 years, as exchange rates have made it increasingly difficult for Argentina dairy producers to be competitive in the international market. C. Takeaways
Withdrawing of the U.S. from NAFTA will eliminate current U.S. tariff advantages in exporting to Mexico and the EU-Mexico FTA and TPP-11 agreements could put the U.S. at a competitive disadvantage. This would place about one-fourth of U.S. dairy exports that currently go to Mexico in jeopardy and put the whole U.S. industry at risk. The U.S. government needs to take these considerations into account while renegotiating NAFTA. The benefits for the dairy sector from NAFTA highly outweigh the negative impacts that could occur if the U.S. leaves NAFTA.

24
US TRANSPORTATION ADVANTAGES
The U.S. has a significant advantage in terms of shipping dairy products to Mexico. The proximity of the U.S. to Mexico and shorter transit time, lower the transportation costs in moving product to Mexico because of the proximity and mode of transportation used (rail/truck versus ship), and the current close business relations in the two countries put the U.S. in a very favorable position vis-à-vis other export competitors. In addition, cross-border intermodal business is likely to expand over the next few years. Transport capacity to serve cross-border trade, especially southbound to Mexico is supported by U.S. investment. This section compares the U.S. and competitor transportation costs for shipping dairy products to Mexico. The freight rates and time of shipping the product used in this section should be used only as a comparison between exporting origin locations as they assume optimal operating conditions, without risk of negative impacts from external influences. Competing locations in Australia and New Zealand were assumed to use the west coast port of Lazaro Cardenas, whereas product coming in from the European Union and South America were assumed to use the Port of Veracruz on the Gulf of Mexico. All product being imported into Mexico from counties outside of North America is expected to move via shipping 40-foot standard container (dry milk powder) or 40-foot refrigerated container for (cheese & butter).
A. Shipping Dry Milk Powder
Based on interviews, the majority of dry dairy product that is moved directly into Mexico from the US is by rail. The United States has a significant advantage with respect to shipping time compared to competing countries on other continents. Besides the US, only Canada has a shorter freight time under 3 weeks. One risk in transport that is particular to the upper mid-west and movements from Ontario is the requirement to move through Chicago. Chicago has a history of causing delays from rail congestion in the area. The United States also has a shipping rate advantage. Only Brazil has a combined freight total that approaches those from the US. Brazil may maintain a freight advantage in eastern areas near the Gulf of Mexico, specifically the Yucatan Peninsula. Tulare, CA is competitiveness is limited by the fact that it requires multiple rail carriers to make its way to Mexico City.

25
Exhibit 21 shows the significant freight and time advantage the U.S. has in shipping dry product to Mexico compared with its competitors. This is a major reason why the U.S. accounts for a very large share of dry dairy products shipped to Mexico.
Exhibit 21: Freight Comparison, Dry Products
Sources: CN Railroad – Web Freight Tool; Union Pacific – Web Freight Tool; Searate – Website; World Freight Rate – Website; and Informa
B. Shipping Cheese & Butter
Cheese and butter both require refrigerated freight. While butter and some types of cheese can be shipped frozen, the majority of the cheeses exported by the United States to Mexico will be varieties that cannot be frozen. Both rail and truck rates are shown from locations in the United States in Exhibit 22. Rail provides the most cost-effective solution, but also limits the shipper’s ability to control product moves in the event issues arise. One interviewee commented that when shipping by truck, there is always someone with the cargo from origin to destination, while in-transit issues can be more difficult to solve with rail. The United States has an advantage in shipping duration as well as with freight. The only relevant competitive threat to the U.S. in terms of transportation is from Brazil, which has the lowest non-U.S. freight cost. But, Brazil still has a long freight movement duration of 25 days compared to under a week with product shipped from US origins.
TotalDry Milk Powder Days Rate / MT Days Rate / MT Days Rate / MT
Tulare, CA Rail 6 103.24$ Mexico City 6 103.24$
Dalhart, TX Rail 4 66.53$ Mexico City 4 66.53$
Minneapolis Rail 4 47.76$ Laredo Rail 2 9.33$ Mexico City 6 57.09$
Ontario Rail 7 114.23$ Mexico City 7 114.23$
Quebec Rail 9 149.72$ Mexico City 9 149.72$
Wellington New Zealand 26 120.09$ Lazaro Carde Mexico 1 74.27$ Mexico City 27 194.36$
Sydney Austrailia 29 86.89$ Lazaro Carde Mexico 1 74.27$ Mexico City 30 161.16$
Rotterdam EU 23 104.07$ Veracruz Mexico 1 45.68$ Mexico City 24 149.75$
Buenos AiresArgentina 27 87.42$ Veracruz Mexico 1 45.68$ Mexico City 28 133.10$
Santos Brazil 24 56.68$ Veracruz Mexico 1 45.68$ Mexico City 25 102.36$

26
Exhibit 22: Freight Comparison, Refrigerated Products
Sources: CN Railroad – Web Freight Tool; Union Pacific – Web Freight Tool; Union Pacific – Circular 2037 Eff. 10/7/07; Searate – Website; and Informa
C. Takeaways
The U.S. has a major transportation advantage in shipping product to Mexico in terms of freight costs and transit times as compared with competitors. In addition, U.S. trans modal investments involving shipping between the U.S. and Mexico are important to both countries. These transportation advantages will continue with or without NAFTA. Thus even if the U.S. withdraws from NAFTA, the government of Mexico should still consider continuing to not only import dairy products from the U.S. but also increase imports from the U.S. Interviews indicated that Mexican importers base their dairy product decisions not only on cost but also on ease of transport.
Total
Cheese / Butter Days Rate / MT Days Rate / MT Days Rate / MT
Tulare, CA Rail 6 113.49$ Mexico City 6 113.49$
Dalhart, TX Rail 4 74.92$ Mexico City 4 74.92$
Minneapolis Rail 3 113.73$ Mexico City 3 113.73$
Tulare, CA Truck 3 243.94$ Mexico City 3 243.94$
Dalhart, TX Truck 2 157.20$ Mexico City 2 157.20$
Minneapolis Truck 3 244.60$ Mexico City 3 244.60$
Wellington New Zealand 26 243.82$ Lazaro Carde Mexico 1 78.59$ Mexico City 27 322.41$
Sydney Austrailia 29 176.36$ Lazaro Carde Mexico 1 78.59$ Mexico City 30 254.95$
Rotterdam EU 23 211.25$ Veracruz Mexico 1 51.59$ Mexico City 24 262.84$
Buenos AiresArgentina 27 177.45$ Veracruz Mexico 1 51.59$ Mexico City 28 229.05$
Santos Brazil 24 115.07$ Veracruz Mexico 1 51.59$ Mexico City 25 166.66$

27
ECONOMIC CONTRIBUTION OF DAIRY EXPORTS TO MEXICO TO THE OVERALL U.S. ECONOMY
A. Input-Output Modeling and IMPLAN Methodology
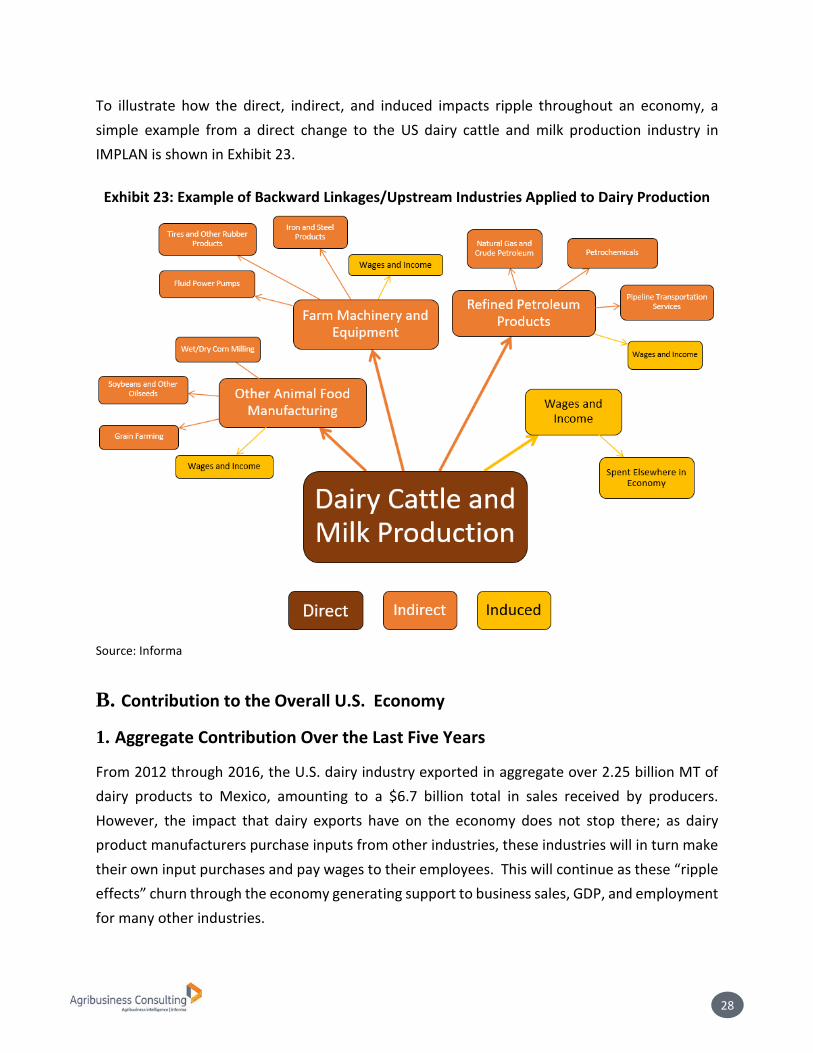
Input-output modeling was utilized to estimate the “ripple effects” that the dairy exports to Mexico have on the broader economy and key countries. The input-output tables and models allow determination of the impact of exogenous changes in final demand on output, while taking account of the interdependencies between different industries and regions, and accounting for leakages out of the economy through items such as imports and taxes. For this analysis, IMPLAN Pro software was used. This IMPLAN model uses historical data to construct a fixed pricing model for 536 pre-defined sectors within the economy. This allows for a detailed examination of how various industries are impacted individually. Informa used a customized approach to IMPLAN to estimate impacts on jobs, value added (essentially gross domestic product, or GDP) and output (industry sales). There are three different types of impacts incorporated into the analysis: direct, indirect and induced.
Direct impacts reflect the economic activity that occurs in the industry(ies) in which investments are made or other changes occur. In this analysis, the direct impacts occur primarily at the dairy manufacturing level, or the industries that export their dairy products to Mexico. The direct impact to a country/region is the amount of added economic output or sales; IMPLAN also provides a measure of GDP added, along with full time equivalent (FTE) jobs.
Indirect impacts are the additional economic impacts that occur to upstream industries, as participants in the directly impacted industry purchase inputs and services in order to produce their commodity or product. For example, increased cheese production resulting from exports to Mexico creates indirect impacts on upstream industries such as support activities for agriculture and dairy farming.
Induced impacts are those impacts created by changes in the spending of labor income and profits generated by the direct and indirect impacts. In this analysis, wages for the jobs directly and indirectly supported by dairy product manufacturing are spent on goods and services such as housing, medical treatments and groceries. The spending creates induced impacts in these industries.
28
To illustrate how the direct, indirect, and induced impacts ripple throughout an economy, a simple example from a direct change to the US dairy cattle and milk production industry in IMPLAN is shown in Exhibit 23.
Exhibit 23: Example of Backward Linkages/Upstream Industries Applied to Dairy Production
Source: Informa
B. Contribution to the Overall U.S. Economy
1. Aggregate Contribution Over the Last Five Years
From 2012 through 2016, the U.S. dairy industry exported in aggregate over 2.25 billion MT of dairy products to Mexico, amounting to a $6.7 billion total in sales received by producers. However, the impact that dairy exports have on the economy does not stop there; as dairy product manufacturers purchase inputs from other industries, these industries will in turn make their own input purchases and pay wages to their employees. This will continue as these “ripple effects” churn through the economy generating support to business sales, GDP, and employment for many other industries.

29
Results from the IMPLAN model examining the contributions of dairy exports to Mexico confirm the importance of these industries to the U.S. national economy. In total, from 2012-2016, U.S. dairy exports to Mexico directly employed over nearly 1,300 full time equivalent (FTE) jobs (in peak year 2014) while directly generating an aggregate GDP of nearly $800 million and business sales of nearly $6.7 billion. Exhibit 24: Aggregate Economic Contributions Associated with U.S. Dairy Exports: 2012-2016
Source: USDA, IMPLAN, and Informa Note: Employment is not aggregated, selected from peak year 2014
The total economic contributions (direct, indirect, and induced contributions) created by dairy exports to Mexico show the true importance of these exports to the overall U.S. economy. By including the impacts to industries that are linked (either by indirect or induced spending) to dairy exports the aggregate 2012-2016 output value of $6.7 billion is magnified to a figure of $23.3 billion in economic output. That is, the economic “ripple effects” of the dairy exports are 3.5 times as large as the value of the dairy exports. Another way to think of these effects is that for every $1 of sales associated with dairy exports to Mexico, an additional $2.50 in output (industry sales) is supported elsewhere the United States economy.
2. Detailed Contribution of 2016
In 2016, the U.S. dairy industry exported over 500,000 MT of dairy products to Mexico, totaling over $1.2 billion in sales received by producers. Results from the IMPLAN model examining the 2016 contributions of dairy exports to Mexico confirm the importance of these industries to the U.S. national economy. In 2016, U.S. dairy exports to Mexico directly employed over nearly 1,000 full time equivalent (FTE) jobs while directly generating GDP of $141 million and business sales of nearly $1.2 billion.
Impact Type Employment Labor Income Value Added OutputDirect Effect 1,286 430.6$ 794.8$ 6,658.3$ Indirect Effect 8,978 2,780.0$ 5,084.4$ 11,975.3$ Induced Effect 6,228 1,441.8$ 2,529.4$ 4,632.7$ Total Effect 16,492 4,652.3$ 8,408.5$ 23,266.3$
30
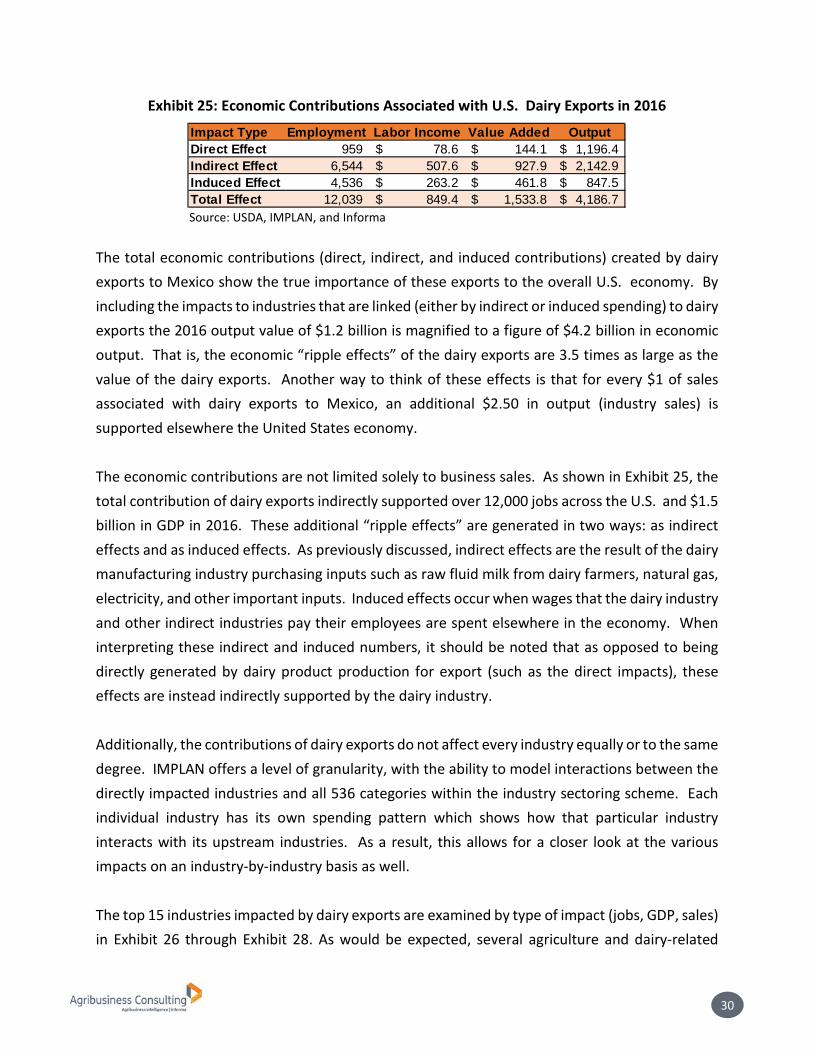
Exhibit 25: Economic Contributions Associated with U.S. Dairy Exports in 2016
Source: USDA, IMPLAN, and Informa
The total economic contributions (direct, indirect, and induced contributions) created by dairy exports to Mexico show the true importance of these exports to the overall U.S. economy. By including the impacts to industries that are linked (either by indirect or induced spending) to dairy exports the 2016 output value of $1.2 billion is magnified to a figure of $4.2 billion in economic output. That is, the economic “ripple effects” of the dairy exports are 3.5 times as large as the value of the dairy exports. Another way to think of these effects is that for every $1 of sales associated with dairy exports to Mexico, an additional $2.50 in output (industry sales) is supported elsewhere the United States economy. The economic contributions are not limited solely to business sales. As shown in Exhibit 25, the total contribution of dairy exports indirectly supported over 12,000 jobs across the U.S. and $1.5 billion in GDP in 2016. These additional “ripple effects” are generated in two ways: as indirect effects and as induced effects. As previously discussed, indirect effects are the result of the dairy manufacturing industry purchasing inputs such as raw fluid milk from dairy farmers, natural gas, electricity, and other important inputs. Induced effects occur when wages that the dairy industry and other indirect industries pay their employees are spent elsewhere in the economy. When interpreting these indirect and induced numbers, it should be noted that as opposed to being directly generated by dairy product production for export (such as the direct impacts), these effects are instead indirectly supported by the dairy industry. Additionally, the contributions of dairy exports do not affect every industry equally or to the same degree. IMPLAN offers a level of granularity, with the ability to model interactions between the directly impacted industries and all 536 categories within the industry sectoring scheme. Each individual industry has its own spending pattern which shows how that particular industry interacts with its upstream industries. As a result, this allows for a closer look at the various impacts on an industry-by-industry basis as well. The top 15 industries impacted by dairy exports are examined by type of impact (jobs, GDP, sales) in Exhibit 26 through Exhibit 28. As would be expected, several agriculture and dairy-related
Impact Type Employment Labor Income Value Added OutputDirect Effect 959 78.6$ 144.1$ 1,196.4$ Indirect Effect 6,544 507.6$ 927.9$ 2,142.9$ Induced Effect 4,536 263.2$ 461.8$ 847.5$ Total Effect 12,039 849.4$ 1,533.8$ 4,186.7$

31
industries, such as support activities for agriculture and real estate, are ranked among the most impacted. Still, several non-agricultural industries, such as hospitals, restaurants, and petroleum refineries, are also among the top ones affected. In including these non-agricultural impacts, input-output analysis provides a more holistic view of the impacts to the greater economy.
Exhibit 26: Top 15 U.S. Industries Ranked by Contribution to Output/Business Sales (Mil $)
Source: IMPLAN, and Informa
Exhibit 27: Top 15 U.S. Industries Ranked by Contribution to GDP (Mil $)
Source: IMPLAN, and Informa
Total Output/Business Sales (Mil $) $ 4,187 Dry, condensed, and evaporated dairy product manufacturing
$ 741
Dairy cattle and milk production $ 519 Cheese manufacturing $ 491 Wholesale trade $ 257 Fluid milk manufacturing $ 170 Other animal food manufacturing $ 97 Truck transportation $ 89 Real estate $ 73 Owner-occupied dwellings $ 66 Management of companies and enterprises $ 51 Petroleum refineries $ 49 Ice cream and frozen dessert manufacturing $ 42 Creamery butter manufacturing $ 40 Soybean and other oilseed processing $ 40 Support activities for agriculture and forestry $ 35
Total GDP (Mil $) $ 1,534 Dairy cattle and milk production $ 300 Wholesale trade $ 170 Dry, condensed, and evaporated dairy product manufacturing
$ 87
Real estate $ 53 Cheese manufacturing $ 51 Owner-occupied dwellings $ 43 Truck transportation $ 39 Management of companies and enterprises $ 32 Support activities for agriculture and forestry $ 27 Fluid milk manufacturing $ 26 Monetary authorities and depository credit intermediation
$ 24
Hospitals $ 19 Insurance carriers $ 18 Extraction of natural gas and crude petroleum $ 16 Beef cattle ranching and farming, including feedlots and dual-purpose ranching and farming
$ 15
32
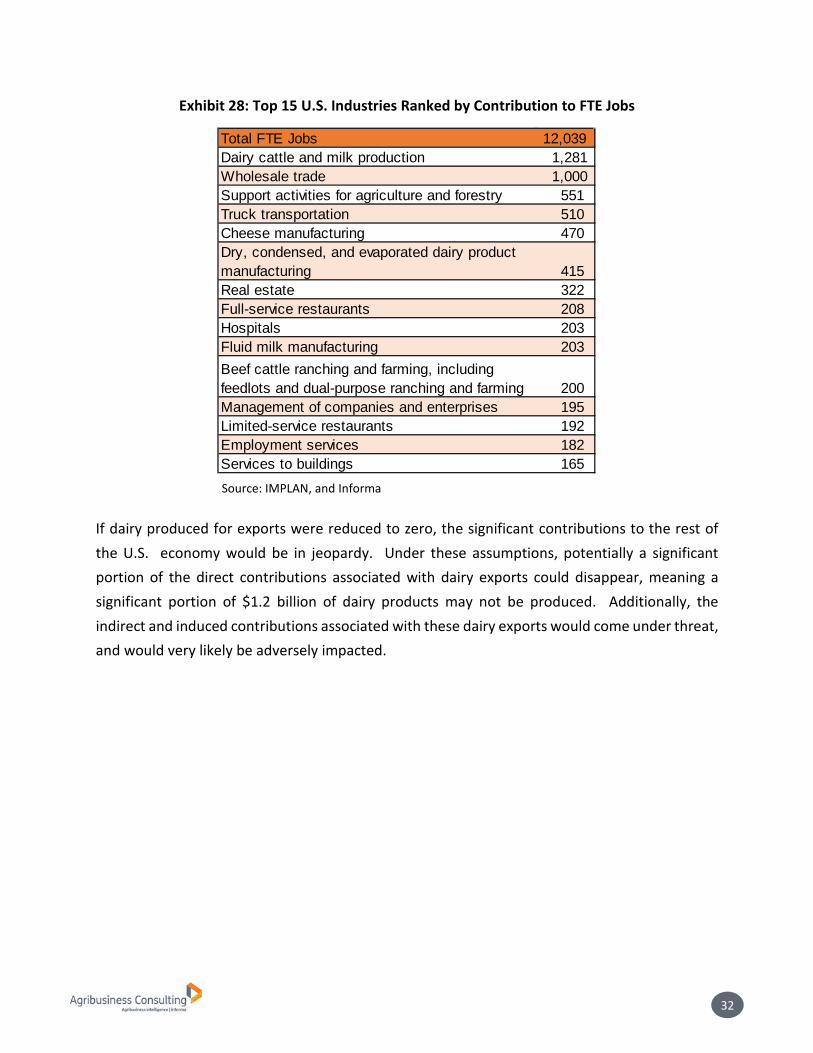
Exhibit 28: Top 15 U.S. Industries Ranked by Contribution to FTE Jobs
Source: IMPLAN, and Informa
If dairy produced for exports were reduced to zero, the significant contributions to the rest of the U.S. economy would be in jeopardy. Under these assumptions, potentially a significant portion of the direct contributions associated with dairy exports could disappear, meaning a significant portion of $1.2 billion of dairy products may not be produced. Additionally, the indirect and induced contributions associated with these dairy exports would come under threat, and would very likely be adversely impacted.
Total FTE Jobs 12,039 Dairy cattle and milk production 1,281 Wholesale trade 1,000 Support activities for agriculture and forestry 551 Truck transportation 510 Cheese manufacturing 470 Dry, condensed, and evaporated dairy product manufacturing 415 Real estate 322 Full-service restaurants 208 Hospitals 203 Fluid milk manufacturing 203 Beef cattle ranching and farming, including feedlots and dual-purpose ranching and farming 200 Management of companies and enterprises 195 Limited-service restaurants 192 Employment services 182 Services to buildings 165

33
CONCLUSIONS
Mexico is the number one market for U.S. dairy product exports accounting for one fourth of total U.S. exports. In 2016 the U.S. shipped $$1.2 billion worth of dairy products to Mexico, up from $201 million in 2002. In 2016, Mexico accounted for 45 percent of total U.S. skim milk powder exports to all destinations, 30 percent of cheese exports, 10 percent of butter exports and 8 percent of whey exports. The U.S. is vital supplier of dairy products to Mexico, accounting for two-thirds of Mexico’s total dairy product imports, 93 percent of Mexico’s skim milk imports, 84 percent of Mexico’s whey product imports and 75 percent of Mexico’s total cheese imports. NAFTA is a major driving force behind growing U.S. dairy product exports to Mexico, as import tariffs are zero for imports from the U.S. and the U.S. is not subject to any tariff rate quotas. Export competitors in Mexico such as the EU, New Zealand, Australia, Canada and South America (Uruguay, Chile and Argentina) all pay MFN tariff rates ranging from 20 percent to 45 percent on their exports to Mexico and are subject to a tariff rate quota on milk powder. However, the Mexico market could be in jeopardy for the U.S. If the U.S. withdraws from NAFTA it will lose its current duty free access to Mexico. This would significantly undermine one of the U.S. core advantages in exporting to Mexico. Without NAFTA, the U.S. would be paying higher tariffs in terms of MFN tariff rates of 20 to 45 percent, or the same levels as its competitors. In addition, some competitors are negotiating trade agreements with Mexico that could make their exports more competitive in the Mexico market.
The EU and Mexico are renegotiating an expansion of their current free trade agreement. Under the original Mexico-EU FTA, dairy products were not included and the EU pays MFN tariff rates to export to Mexico. But, under the current negotiations, the EU is requesting direct recognition of Geographic Indications (GI) regarding a number of cheeses (Asiago, Feta, Gorgonzola and others), which if agreed to, would impose de facto barriers on Mexico cheese imports from other competitors such as the U.S. Under that scenario, the U.S. would not be able to export GI cheeses to Mexico if their GI names were included in a new agreement.
The TPP countries Mexico, New Zealand, Australia, Canada, Chile and other potential members are negotiating their own agreement (excluding the U.S.) called the Comprehensive and Progressive Agreement for the Trans-Pacific Partnership (CPATPP). Dairy products are included in these negotiations where duty free quotas would be established for cheese and

34
skim milk powder under tariff rate quotas. These country specific quotas will start at 4,250 tonnes for cheese and 25,000 tonnes for skim milk powder in the first year and rise to 6,500 tonnes for cheese and 42,000 tonnes for skim milk into the eleventh year. Although these quotas are not huge, they would take market share away from the U.S.
U.S. dairy product exports are becoming more and more important for the U.S. dairy industry and 25 percent of U.S. dairy product exports would be in jeopardy if the U.S. leaves NAFTA. The dry skim milk industry would potentially take the biggest hits since Mexico accounts for 45 percent of U.S. exports of that product. The total economic contributions (direct, indirect, and induced contributions) created by dairy exports to Mexico show the true importance of these exports to the overall U.S. economy. By including the impacts to industries that are linked (either by indirect or induced spending) to dairy exports the aggregate 2012-2016 output value of $6.7 billion is magnified to a figure of $23.3 billion in economic output. That is, the economic “ripple effects” of the dairy exports are 3.5 times as large as the value of the dairy exports. Another way to think of these effects is that for every $1 of sales associated with dairy exports to Mexico, an additional $2.50 in output (industry sales) is supported elsewhere the United States economy. U.S. dairy exports to Mexico also employed 16,492 full time equivalent (FTE) jobs while directly generating an aggregate GDP of $8.4 billion over that five-year period. The U.S. has a major transportation advantage in shipping product to Mexico in terms of freight costs and transit times as compared with competitors. In addition, U.S. trans modal investments involving shipping between the U.S. and Mexico are important to both countries. These transportation advantages will continue with or without NAFTA. Thus, even if the U.S. withdraws from NAFTA, the government of Mexico should still consider continuing to import dairy products from the U.S. However, these logistics advantages would at best only partially offset economic losses in terms of business sales, GDP and jobs for the U.S. from leaving NAFTA. In conclusion, NAFTA is a major driving force behind growing U.S. dairy product exports to Mexico. The Mexico market accounts for:
25 percent of U.S. exports to all destinations.
More than 25 percent of the growth in U.S. exports to all destinations since 2002.
3.5 percent of total U.S. dairy cash receipts.

35
U.S. export losses are likely to be greater if export competitors such as the EU, Australia and New Zealand are successful in renegotiating or negotiating trade agreements with Mexico to provide greater access to the Mexican market. If the U.S. leaves NAFTA, the growth in U.S. dairy product exports will be adversely impacted and it will be difficult to find new markets to offset losses in exports to Mexico. The economic impacts of U.S. dairy product exports are even more substantial for the U.S. economy. As indicated earlier, NAFTA and U.S. dairy product exports benefitted the U.S. economy over the last five years (2012-2016) by contributing: $23.3 billion in economic output. $8.4 billion in GDP annually. Nearly 16,500 jobs across the entire economy. If the U.S. withdraws from NAFTA, the above economic impacts will be in jeopardy and result in substantial losses for the U.S. economy. The above macro-economic impacts are on top of an almost certain negative impacts on farmer prices for milk and resulting negative impacts on farmer incomes. While not the focus of this study, these additional impacts need to be considered with respect to the overall adverse impacts from the U.S. leaving NAFTA.

Informa Agribusiness Consulting
2121 K Street, NW Suite 300
Washington, D.C. 20037 +1 202 899 6937 [email protected] www.agribusinessintelligence.com