Embed Size (px)
Citation preview

THE OBESITY EPIDEMIC: CAUSES AND CONSEQUENCES (A PEETERS AND A CAMERON, SECTION EDITORS)
The Impact of Obesity in the Workplace: a Reviewof Contributing Factors, Consequences and Potential Solutions
Nipun Shrestha1 & Zeljko Pedisic1 & Sarah Neil-Sztramko2 &
Katriina T. Kukkonen-Harjula3 & Veerle Hermans4
Published online: 22 July 2016# Springer Science+Business Media New York 2016
Abstract This narrative review summarized findings fromprevious reviews and the most recently published studies, re-garding the following: (1) the association between two occu-pational risk factors—shift work and sedentary work—andobesity, (2) the effects of obesity on workplace productivityand (3) the effectiveness of workplace interventions aimed atpreventing or reducing obesity. Despite some inconsistenciesin findings, there is convincing evidence that shift work in-creases the risk of obesity, while most studies did not show asignificant association between sedentary work and obesity.Overweight and obesity were found to be associated withabsenteeism, disability pension and overall work impairment,whilst evidence of their relationship with presenteeism, unem-ployment and early retirement was not consistent. Due to thevast heterogeneity in the types of workplace-based interven-tions to prevent or treat obesity, no sound conclusions can asyet be drawn about their overall effectiveness and best practicerecommendations for their implementation.
Keywords Obesity .Work productivity . Sedentary work .
Shift work . Indirect costs . Absenteeism . Presenteeism
Introduction
Obesity is a condition in which the amount of accumulatedexcess body adipose tissue is so great that it may adverselyaffect health [1, 2]. It is most commonly defined using bodymass index (BMI). BMI is calculated as an individual’s bodyweight in kilograms divided by height inmeters squared and isa simple measure of excess weight for use both in the clinicalsetting and in population health research. An individual with aBMI equal to or greater than 30 kg/m2 is classified as ‘obese’and between 25 and 30 kg/m2 as ‘overweight’. Based on asecondary data analysis including more than 19 million adultparticipants, the global age-standardized prevalence of obesityin 2014 was 11 % in men and 15 % in women [3]. The prev-alence was greater than 30 % for both men and women inhigh-income English-speaking countries and for women onlyin the Middle East and in southern and northern Africa. By2025, the global prevalence of obesity was estimated to be18 % in men and over 21 % in women, with over 6 % ofmen and 9 % of women in the ‘severely obese’ category(≥35 kg/m2) [3].
The high prevalence of obesity is particularly concerningbecause of its strong association with a range of adverse healthoutcomes. The most important obesity-related comorbiditiesinclude cardiovascular disease, type 2 diabetes, several typesof cancers, osteoarthritis, sleep apnoea and psychologicalproblems [2]. The severity of these health risks highlightsthe importance of primary prevention and early managementof obesity and overweight.
A number of factors may contribute to one’s risk of obesity,including behavioural, psychological, environmental, genetic,
This article is part of the Topical Collection on The Obesity Epidemic:Causes and Consequences
* Nipun [email protected]
1 Active Living & Public Health Group, Institute of Sport, Exerciseand Active Living (ISEAL), Victoria University,Melbourne, Australia
2 Faculty of Health Sciences, McMaster University, Hamilton, Canada3 Rehabilitation, South Karelia Social and Health Care District Eksote,
Lappeenranta, Finland4 Faculty of Psychology &Educational Sciences, Faculty of Medicine
& Pharmacy, Vrije Universiteit Brussel, Brussels, Belgium
Curr Obes Rep (2016) 5:344–360DOI 10.1007/s13679-016-0227-6

societal, cultural and economic factors [4]. Recent evidencesuggests that working conditions may also impact one’s like-lihood of weight gain [5]. The risk of obesity seems to increaseamong workers in high-demand and low-control job settingsand among those working long hours and in various shiftschedules [5]. Recently, another important work-related riskfactor for obesity has been proposed, namely excessive sed-entary behaviour (sitting) at work. Technological innovationshave decreased physical strain and energy expenditure,resulting in jobs that are more sedentary [6]. As many individ-uals spend a great deal of their waking hours in the workplace,reducing sitting at work may need to be given specialattention.
Obesity may pose an economic burden to the workplacethrough direct costs (healthcare costs) and indirect costs, suchas increased absenteeism from work due to health problemsand reduced productivity [7, 8]. Because of these impacts,workplaces may be particularly motivated to conduct inter-ventions to reduce the risk of obesity and/or to encourageweight loss among overweight or obese workers.
The purpose of this narrative review was to summarizefindings from previous reviews and the most recently pub-lished studies, regarding the following: (1) the associationbetween occupational factors—specifically, shift work andsedentary work—and obesity; (2) the effects of obesity onworkplace productivity, namely indirect costs, including ab-senteeism, presenteeism, disability, early retirement and pre-mature mortality-related costs; and (3) the effectiveness ofworkplace interventions aimed at preventing or reducingobesity.
Shift Work and Obesity
The number of people working in shifts has grown with theincrease in demand of services around the clock and compet-itiveness of the market [9]. It is estimated that approximately20% of European andNorth Americanworkforce are exposedto shift work schedules including night shifts [10, 11]. Shiftwork typically refers to an arrangement of working hours sothat services can be provided over 24 h. Shift work includesevening or night schedules, rotating shifts, split shifts, on-callor casual shifts, 24-h shifts and other irregular schedules ornon-day schedules [12]. Shift work and night work are mostcommon in the healthcare, transportation, industrialmanufacturing, communication, mining, leisure or recreationand hospitality sectors [13].
A 2011 review by Van Drongelen et al. [14] concluded thatthere was strong evidence for an association between expo-sure to shift work and subsequent increase in body weight.However, when adjusted for potential confounders (e.g., gen-der, body weight at baseline and physical activity at work orduring leisure), the findings were inconsistent. In a 2013
review of cross-sectional and prospective studies, Amaniet al. [15•] found that BMI was greater among shift workerscompared to non-shift workers. Shift workers have also beenfound to consume meals more frequently and have poorereating habits compared to non-shift workers [15•]. In a 2016review of exclusively longitudinal studies, Proper et al. [16•]found strong evidence for an association between shift workand increased BMI and limited evidence for an associationbetween shift work and increased waist circumference.
Since the publication of the reviews above, several otherstudies have been published examining the association be-tween shift work and obesity (Table 1). These studies arepredominantly cross-sectional [17, 19, 21–28, 30–33], whilstsome used prospective cohort [18, 29] and retrospective co-hort [20] study designs.
Most cross-sectional studies reported that shift work wassignificantly and positively associated with higher BMI [17,19, 21, 24–28, 30–33]. For example, Ko et al. [24] found thatsleep quality was poor in night shift workers, and this poorsleep quality was associated with increased risk of obesity,suggesting that sleep quality may be the causal factor thatlinks night shift work to obesity. However, other studies foundno association between shift work and BMI [22, 23]. Kim etal. found a significant association between shift work andobesity in unadjusted analysis but no association in a multi-variate model adjusted for age, current smoking status, regulardrinking habit, breakfast skipping, regular exercise, maritalstatus, family income, education, sleep problem and self-perceived health status [23]. Overall, the risk of obesity seemsto increase with the number of years of working in shifts [28].
A 2012 retrospective cohort study by Gholami et al. [20]found no significant difference in BMI between shift workersand day workers. Another prospective cohort study found thatalthough there was increase in weight in normal-weightworkers who changed from regular days to shift work, therewas no difference in weight gain between night/shift workerscompared to day workers throughout the study period [18].Some cohort studies also found that there was an increasedprevalence of metabolic risk factors (especially impaired glu-cose tolerance) in shift workers compared to day workers [16•,34]. The evidence presented here (Table 1) and in the previousreviews [14, 15•] supports the widely hypothesized associa-tion between shift work and obesity, although longitudinalfindings were not completely consistent.
While the precise mechanism linking shift work and obe-sity is not entirely understood, differences in dietary intakebetween shift workers and non-shift workers, as well as hor-monal and physiological changes that result from circadiandisruption, are suggested to be important contributors [35].Shift workers seem to eat more incomplete meals and snacksthan complete meals. Such ‘incomplete’ meals are less likelyto include fruit and vegetables and are more likely to besandwich-type meals [15•]. There is a clear change in the
Curr Obes Rep (2016) 5:344–360 345

Table 1 Studies on the association between shift work and obesity (studies published from January 2011 to May 2016)
Study Sample Study design Type of shift schedule Weight-related measures Main findings
Barbadoroet al.[17]
Participants in anoccupationalsurveillanceprogram in2008 (n = 339)
Cross-sectional Rotating shift work BMI calculated based onself-reported heightand weight
Compared to daytime workers(n = 229), rotating shiftworkers (n = 110) displayedhigher BMI (mean BMI was27.6 ± 3.9 and 26.7 ±3.6 kg/m2 for shift workersand daytime workers,respectively; p < 0.05)
Bekkerset al.[18]
Participants in theNetherlandsWorking ConditionsCohort Study(n = 5951)
Prospectivecohort study
Evening shifts, nightshifts, rotatingshifts
BMI calculated based onself-reported heightand weight
A larger weight increase wasseen in normal-weightworkers changing from dayto shift work (β = 0.93 %;95 % CI 0.01–1.85) comparedwith stable non-shift workers.No further associations were,however, found to support thehypothesis that people workingduring nights or in shifts overa period are at increased riskof gaining extra weightcompared with people onlyworking daytimes.
Buchvoldet al. [19]
Randomly selectedsample (n = 6000)of registeredmembers of theNorwegian NursesOrganization
Cross-sectional Evening only, day andevening, three-shiftrotation, night onlyor another scheduleincluding nightwork.
BMI calculated based onself-reported heightand weight
Number of night shifts workedprevious year was significantlyand positively associated withBMI, both against BMI as acontinuous variable (β = 0.055,p < 0.05) and against obesity(OR = 1.01, 95 % CI 1.00–1.01).
Gholamiet al. [20]
Annual observationfrom workers whoworked at Isfahan’sMobarakeh SteelFactory (n = 6713)
Retrospectivecohort
Routine shift: 2-daymorning at work,2-day afternoon atwork, 2-day night atwork and 2-day off
Weekly shift: 3-daymorning at work,3-day afternoon atwork and alternatively1-day off within a2-week-long work.
BMI calculated frommeasured height andweight
No statistically significantdifference was observedbetween BMIs of routine shiftworkers and day workers.Weekly shift workers hadlower BMI (on average by0.781) in comparison with dayworkers.
Griep et al.[21]
2372 registered nurses(2100 women)from 18 largestpublic hospitals inRio de Janeiro,Brazil.
Cross-sectional Working at night atleast once a week orfour times a monthin 12-h shifts.
BMI calculated based onself-reported heightand weight
Association between years ofexposure to night work andBMI was statisticallysignificant for both womenand men after adjusting forall covariates (β = 0.036;(95 % CI 0.009–0.063) andβ = 0.071 (95 % CI 0.012–0.129), respectively]
Huth et al.[22]
A convenience sampleof licensed nursesemployed by amagnet-recognizedpaediatric hospitalin north-easternOhio (n = 378).
Cross-sectional Night/shift work BMI calculated based onself-reported heightand weight
No statistically significantdifference of proportions ofBMI >30 kg/m2 betweennight shift and day shiftrespondents (p > 0.05).
Kim et al.[23]
9989 nurses among10,000 whoregistered on thesurvey web site
Cross-sectional n/a BMI calculated based onself-reported heightand weight
A significant positive associationbetween obesity and shiftwork duration was found inthe unadjusted analysis;
346 Curr Obes Rep (2016) 5:344–360

Table 1 (continued)
Study Sample Study design Type of shift schedule Weight-related measures Main findings
however, it was attenuated andno longer significant in themulti-variate model.
Ko et al.[24]
Data from the NationalSurvey of MidlifeDevelopment in theUnited States II(MIDUS II study)and the MIDUS IIBiomarker Project(n = 883)
Cross-sectional Night shift work BMI calculated frommeasured height andweight
Sleep quality was found to below among night shift workers.Sleep quality was significantlyassociated with obesity (OR1.10, 95 % CI 1.03–1.18)
Macagnanet al. [25]
1206 employees 18 to50 years of age whowere working on aproduction line in apoultry processingplant
Cross-sectional Night shift work BMI calculated frommeasured height andweight and measuredwaist circumference
Nightshift workers compared todayshift workers showed ahigher prevalence ofoverweight (42.2 vs. 34.3 %;p = 0.020) and abdominalobesity (24.9 vs. 19.5 %;p = 0.037).
Marquezeet al. [26]
941 nursingprofessionals froma public Hospital
Cross-sectional Night shift work BMI calculated based onself-reported heightand weight
Working at night was associatedwith a gain in BMI greaterthan (β = 0.24 kg/m2)working during the day(β = 0.15 kg/m2).
Neil-Sztramkoet al. [27]
Data from theCanadian HealthMeasures Survey
Cross-sectional Rotating andpermanentnight shift work
BMI, waist circumferenceand waist-hip ratiomeasured in a mobileclinic
Shift workers were more likelyto be obese (OR 1.39, 95 %CI 1.09, 1.53) and be in high-risk categories of waist-hipratio (OR 1.37, 95 % CI 1.18,1.60) and waist circumference(OR 1.31, 95 % CI 1.14, 1.51).
Peplonskaet al. [28]
724 female nurses andmidwives, aged40–60 years in Łódź,Poland
Cross-sectional Rotating nightshift work
BMI calculated frommeasured height andweight
Both current and cumulativenight work was associatedwith obesity, with OR= 3.9(95 % CI 1.5–9.9), in womenreporting eight or more nightshifts per month.
Ross et al.[29]
Data from HelsinkiHealth Study(HHS) questionnairesurveys
Prospectivecohort
Night/shift work BMI calculated based onself-reported heightand weight
Shift work that included nightshifts was associated withincreased risk of weight gainamong women afteradjustment for age (OR = 1.43,95 % CI 1.13–1.82). Thepattern among men wassimilar, but not statisticallysignificant (OR = 1.29, 95 %CI 0.90–1.86).
Smith et al.[30]
Secondary analysis ofa sample fromNational Survey onthe Work and Healthof Nurses (n = 9291).
Cross-sectional Regular eveningschedule, regularnight schedule andmixed schedules.
BMI calculated based onself-reported heightand weight
After adjustment for allconfounders, femalerespondents working nightshifts had BMI scores 0.67points higher than thoseworking regular daytimeschedules, with respondentsworking mixed shift scheduleshaving BMI scores 0.44 pointhigher
Son et al.[31]
Wage workers fromthe Korea NationalHealth and NutritionExamination Survey,
Cross-sectional Night shifts (between21:00 and 8:00 thenext morning), dayand night shifts, 24-h
Percentage of total bodyfat (total fat mass / totalmass × 100) wasmeasured using
The risk of obesity in shift workshowed a statisticallysignificant increase (OR =1.779, 95 % CI 1.050–
Curr Obes Rep (2016) 5:344–360 347

routine of sleep and food intake in night shifts. Those whowork in night shifts often have no choice but to have smallconvenience meals (high-fat and high-sugar foods) due topoor access to ‘healthy food’ at night [32, 36, 37]. There isalso some evidence to suggest that shift workers are less likelyto participate in regular physical activity than day workers dueto their irregular shift schedules [38, 39].
Sedentary Work and Obesity
Since the 1960s, the percentage of jobs in the US privateindustry that requiredmoderate-intensity physical activity (en-ergy consumption of 3–6 metabolic equivalents [METs]) hasdropped from almost 50 % to less than 20 %. This is onaccount of a significant increase in the prevalence of light-intensity (2–3 METs) and sedentary occupations (<1.5METs) [40]. International time use surveys also show amarked decline in physical activity and an increase in seden-tary behaviour at work in other countries [41]. It is hypothe-sized that the resulting reduction in occupational energy ex-penditure may account for a significant portion of the increasein mean body weight in both males and females that occurredduring the same time period [42].
A 2010 review by van Uffelen et al. [43•] reported someevidence from cross-sectional studies and inconclusive evi-dence from longitudinal studies on the association betweensedentary work and obesity. Out of ten cross-sectional studiesincluded, five reported a significant positive relationship be-tween occupational sitting time and BMI (in one or both
genders), whilst other studies reported non-significant or eveninverse relationships [43•]. Out of three prospective studies,two found no significant associations between occupationalsitting and subsequent obesity, whilst one study found a sig-nificant association only in females [43•].
Following the publication of the review by van Uffelen etal. [43•], 21 studies on the association between sedentarywork and obesity have been published (Table 2). Most studies(n = 16) were cross-sectional [44–50, 53–57, 59, 62–64],whilst others used prospective cohort [52, 58, 60, 61] or qual-itative study design [51]. Nearly half of the cross-sectionalstudies found no significant associations between sedentarywork and BMI [44–46, 52, 54, 55, 60, 61, 63], waist circum-ference [46, 55, 63], waist to hip ratio [44] and/or proportionof adipose tissue [46, 63]. Most of the remaining studies re-ported mixed or unclear results [47–49, 56, 59, 64]. For ex-ample, Choi et al. [49] found that amongst male firefighters,only those in the highest category of sedentary work had asignificantly higher prevalence of obesity (based on BMI)than those in the lowest sedentary work category. However,in the same study, no significant associations were found be-tween sedentary work and obesity based on waist circumfer-ence or body fat percentage. Choi et al. [48] found a signifi-cant association between sedentary work and obesity inmales,but not in females. By contrast, Yang et al. [64] found a sig-nificant association only in females. Only four cross-sectionalstudies obtained uniform results [50, 53, 57, 62]. However,one of them was conducted only among male workers and didnot adjust for potential confounders [57] and another adjustedonly for age and gender [62].
Table 1 (continued)
Study Sample Study design Type of shift schedule Weight-related measures Main findings
2008–2011(n = 2952)
work shifts andirregular shift work.
dual-energy X-rayabsorptiometry
3.015) in the male manualworker group. No significantresults in the male non-manual and female workergroups were found.
Tada et al.[32]
Japanese female nurses(1179-day workersand 1579 rotatingshift workers) aged20–59
Cross-sectional Rotating shift work BMI calculated based onself-reported heightand weight
The BMI of shift workers wassignificantly greater thanamong day workers. Themulti-variable linearregression coefficients forBMI showed a significantrelationship with rotating shiftwork (B = 0.051), aftercontrolling for lifestyle habits.
Yoon et al.[33]
Female workers from2008 communityhealth survey insouth Korea(n = 42,234)
Cross-sectional Night/shift work BMI calculated frommeasured height andweight
Night/shift was significantlyassociated with obesity onlyin non- manual workers(aOR = 1.20, 95 % CI 1.01–1.42).
aOR adjusted odds ratio, B unstandardized regression coefficient, β standardized regression coefficient, BMI body mass index,OR odds ratio, p p value,CI confidence interval
348 Curr Obes Rep (2016) 5:344–360
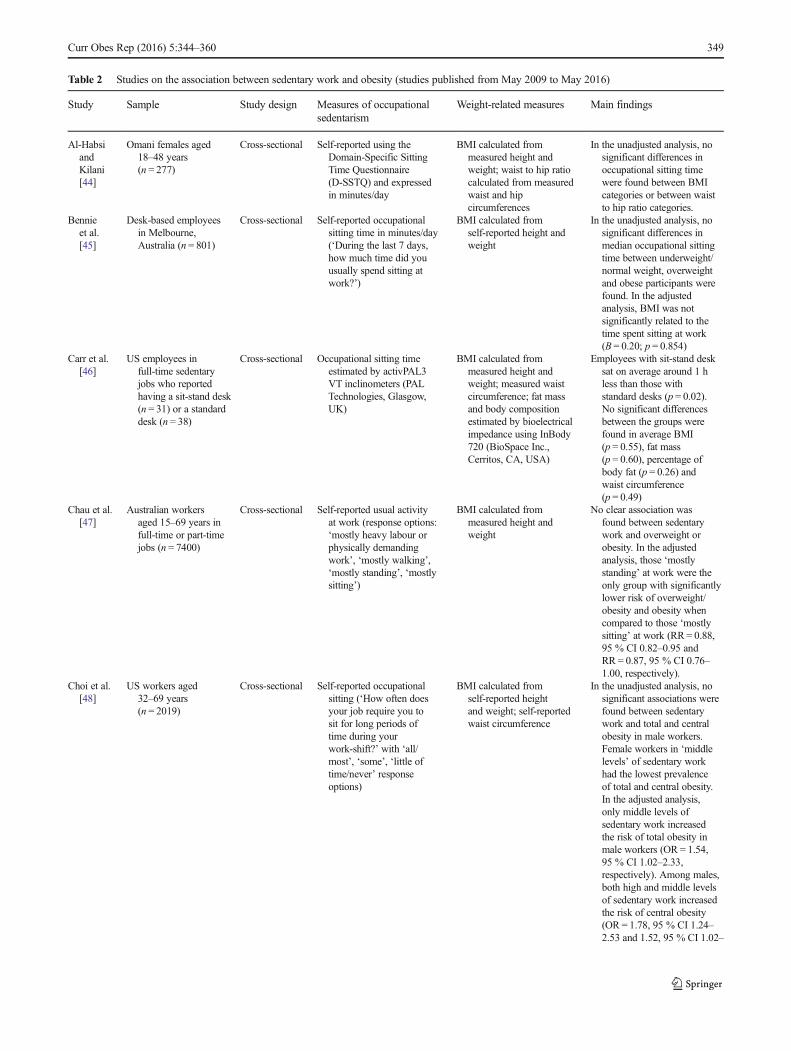
Table 2 Studies on the association between sedentary work and obesity (studies published from May 2009 to May 2016)
Study Sample Study design Measures of occupationalsedentarism
Weight-related measures Main findings
Al-HabsiandKilani[44]
Omani females aged18–48 years(n = 277)
Cross-sectional Self-reported using theDomain-Specific SittingTime Questionnaire(D-SSTQ) and expressedin minutes/day
BMI calculated frommeasured height andweight; waist to hip ratiocalculated from measuredwaist and hipcircumferences
In the unadjusted analysis, nosignificant differences inoccupational sitting timewere found between BMIcategories or between waistto hip ratio categories.
Bennieet al.[45]
Desk-based employeesin Melbourne,Australia (n = 801)
Cross-sectional Self-reported occupationalsitting time in minutes/day(‘During the last 7 days,how much time did youusually spend sitting atwork?’)
BMI calculated fromself-reported height andweight
In the unadjusted analysis, nosignificant differences inmedian occupational sittingtime between underweight/normal weight, overweightand obese participants werefound. In the adjustedanalysis, BMI was notsignificantly related to thetime spent sitting at work(B = 0.20; p = 0.854)
Carr et al.[46]
US employees infull-time sedentaryjobs who reportedhaving a sit-stand desk(n = 31) or a standarddesk (n = 38)
Cross-sectional Occupational sitting timeestimated by activPAL3VT inclinometers (PALTechnologies, Glasgow,UK)
BMI calculated frommeasured height andweight; measured waistcircumference; fat massand body compositionestimated by bioelectricalimpedance using InBody720 (BioSpace Inc.,Cerritos, CA, USA)
Employees with sit-stand desksat on average around 1 hless than those withstandard desks (p = 0.02).No significant differencesbetween the groups werefound in average BMI(p = 0.55), fat mass(p = 0.60), percentage ofbody fat (p = 0.26) andwaist circumference(p = 0.49)
Chau et al.[47]
Australian workersaged 15–69 years infull-time or part-timejobs (n = 7400)
Cross-sectional Self-reported usual activityat work (response options:‘mostly heavy labour orphysically demandingwork’, ‘mostly walking’,‘mostly standing’, ‘mostlysitting’)
BMI calculated frommeasured height andweight
No clear association wasfound between sedentarywork and overweight orobesity. In the adjustedanalysis, those ‘mostlystanding’ at work were theonly group with significantlylower risk of overweight/obesity and obesity whencompared to those ‘mostlysitting’ at work (RR= 0.88,95 % CI 0.82–0.95 andRR = 0.87, 95 % CI 0.76–1.00, respectively).
Choi et al.[48]
US workers aged32–69 years(n = 2019)
Cross-sectional Self-reported occupationalsitting (‘How often doesyour job require you tosit for long periods oftime during yourwork-shift?’ with ‘all/most’, ‘some’, ‘little oftime/never’ responseoptions)
BMI calculated fromself-reported heightand weight; self-reportedwaist circumference
In the unadjusted analysis, nosignificant associations werefound between sedentarywork and total and centralobesity in male workers.Female workers in ‘middlelevels’ of sedentary workhad the lowest prevalenceof total and central obesity.In the adjusted analysis,only middle levels ofsedentary work increasedthe risk of total obesity inmale workers (OR = 1.54,95 % CI 1.02–2.33,respectively). Among males,both high and middle levelsof sedentary work increasedthe risk of central obesity(OR = 1.78, 95 % CI 1.24–2.53 and 1.52, 95 % CI 1.02–
Curr Obes Rep (2016) 5:344–360 349

Table 2 (continued)
Study Sample Study design Measures of occupationalsedentarism
Weight-related measures Main findings
2.26, respectively). Theadjusted analyses showedno significant associationsbetween sedentary workand total or central obesityin female workers.
Choi et al.[49]
US firefighters aged25–64 years(n = 308)
Cross-sectional Self-reported occupationalsitting using a Likert-typeitem ‘My job oftenrequires sitting for longperiods of time?’ withresponse options ‘stronglydisagree’, ‘disagree’ and‘agree’ and ‘stronglyagree’
BMI calculated frommeasured height andweight; measured waistcircumference; skinfoldthickness-based body fatpercent
In the adjusted analysis, onlythose in the highestcategory of sedentary workhad significantly higherprevalence of BMI-basedobesity than those in thelowest sedentary workcategory (PR = 4.18, 95 %CI 1.03–16.99). Nosignificant associationswere found betweensedentary work and obesitycategory based on waistcircumference or body fatpercentage.
De Cockeret al.[50]
Australian employees(n = 993; mean ±SD age = 51 ±11.2 years)
Cross-sectional Self-reported occupationalsitting in hours/day (theWorkforce SittingQuestionnaire (WSQ))
BMI calculated from self-reported height andweight
The unadjusted analysisshowed no significantdifferences in meanoccupational sitting timebetween ‘normal-weight’and ‘overweight/obese’participants. In the adjustedanalysis, BMI (a continuousvariable) showed asignificant positiverelationship withoccupational sitting(B = 0.094, 95 %CI 0.018–0.170).
Dobsonet al.[51]
Four focus groups ofUS firefighters:group 1(FF/engineers,n = 8); group 2(captains, n = 4);group 3 (FF/engineers, n = 3);and group 4(battalion chiefs,n = 5)
Focus groups n/a (qualitative study) n/a Sedentary work was identifiedas one of five themes indiscussions within focusgroups about the work-related causes of obesity. Itwas mentioned that (1) thejob has become lessphysically demanding, (2)promotion into higher ranksleads to more sedentarywork, (3) sedentary work isincreasing even in lowerranks due to greater use oftechnology, (4) training forlower ranks has alsobecome computerized and(5) physically demandingjob tasks are infrequent.
Eriksenet al.[52]
Danish workers aged18–59 years(n = 3482)
Prospectivecohort(5-yearfollow-up)
Self-reported using thequestion ‘Does yourwork imply sitting?’ withsix response categories(‘almost all the time’,‘approximately threefourths of the time’,‘approximately one half ofthe time’, ‘approximatelyone fourth of the time’,
BMI calculated from self-reported height andweight; Change in BMIcalculated as thedifference between BMIscores at the follow-upand at the baseline
For both sexes, no cross-sectional associations werefound between categories ofoccupational sitting timeand BMI. In the adjustedanalysis, the change inoccupational sittingcategories and the changein BMI between baselineand follow-up were
350 Curr Obes Rep (2016) 5:344–360

Table 2 (continued)
Study Sample Study design Measures of occupationalsedentarism
Weight-related measures Main findings
‘rarely/very little’ and‘never’)
positively related amongfemale workers (B = 0.13,95 % CI 0.06–0.20), but nosignificant relationship wasfound among male workers.
Garcia et al.[53]
Brazilian employeesof industrialcompanies(n = 47,477)
Cross-sectional Self-reported using thequestion ‘How wouldyou describe your activitiesat work?’ with the responseoptions ‘I spend most of thetime seated and, at most,walk short distances’, ‘Iperform moderate activities,such as walking fast orperforming manual tasks, formost of the day’, and ‘Ifrequently perform vigorousphysical activities.’
BMI calculated from self-reported height andweight
In the adjusted analyses,sedentary work wasassociated with obesity inboth males and females(OR = 1.27; 95 % CI 1.15–1.41 and OR = 1.24, 95 %CI 1.04–1.48, respectively).
Hadgraftet al.[54]
Australian full-timeworkers (n = 1235;mean ± SD age53 ± 7 years)
Cross-sectional Self-reported using thequestion: ‘Estimate the totaltime during the last weekthat you spent sitting downas part of your job while atwork or working from home,including meal and snackbreaks, sitting to do worksuch as at desk or inmeetings, sitting to use thecomputer at work and sittingfor travel as part of worksuch as being a taxi driver?’and expressed in hours/day
BMI calculated frommeasured height andweight
In the unadjusted analysis, nosignificant associations werefound between BMI(entered to the model as acontinuous variable) andcategories of occupationalsitting (high sitting = abovemedian; low sitting = belowmedian).
Honda et al.[55]
Japanese full-timeoffice workersaged 20–64years (n = 823)
Cross-sectional Self-reported using the JapanArteriosclerosisLongitudinal Study PhysicalActivity Questionnaire(JALSPAQ) and categorizedas ‘almost all the time’,‘more than half of workinghours’, ‘approximately halfof working hours’, ‘less thanhalf of working hours’ and‘almost none of the time’
BMI calculated frommeasured height andweight; measured waistcircumference
In the unadjusted analysis, nosignificant relationship wasfound between BMI orwaist circumference(entered to the model ascontinuous variables) andcategories of occupationalsitting time.
Kazi et al.[56]
UK employees ineducation, localgovernment, retail,telecoms and serviceindustry (n = 1141;mean age 38 years)
Cross-sectional Self-reported using theDomain-Specific SittingTime Questionnaire(D-SSTQ) and expressed inminutes/day
BMI calculated fromself-reported height andweight
A significant positiveSpearman’s rank correlationwas found between BMI(analyzed as a continuousvariable) and occupationalsitting time (p < 0.05). Nosignificant differences werefound between ‘normal-weight’, overweight andobese employees inoccupational sitting time.
Kim et al.[57]
Korean male officeworkers (n = 84)
Cross-sectional Physical activity diary over twoweekdays and one weekendday
BMI calculated frommeasured height andweight
In the unadjusted analysis,overweight/obese workershad significantly highersedentary work time than‘normal-weight’ workers(p < 0.001). A significantpositive correlation wasfound between sedentarywork time and BMI.
Curr Obes Rep (2016) 5:344–360 351

Table 2 (continued)
Study Sample Study design Measures of occupationalsedentarism
Weight-related measures Main findings
Lin et al.[58]
US workers aged 38–45years (n = 5285)
Prospectivecohort(8-yearfollow-up)
Self-reported using the question‘How much time in yourcurrent job do you spendsitting?’ with responseoptions: ‘never’, ‘less thanhalf of the time’, ‘about halfof the time’, ‘more than halfof the time’ and‘continuously or almostcontinuously’
BMI calculated fromself-reported height andweight
In the adjusted analysis,workplace sitting time waspositively related to BMI inmale workers (β = 0.086,p < 0.01), but not in femaleworkers.
Nicholaset al.[59]
Canadian full-timeworkers aged 35–69years (n = 12,409)
Cross-sectional Self-reported time (h/day)sedentary behaviourdefined as time in activitieswith MET values of ≤1.5
BMI calculated from self-measured height andweight; self-measuredwaist circumference; waistto hip ratio calculated fromself-measured waist and hipcircumferences
In the adjusted analyses,>5 h/day of occupationalsitting was associated withhigher waist circumferenceand waist to hip ratioamong male workers (OR =1.46, 95 % CI 1.17–1.83and OR = 1.34, 95 %CI 1.00–1.79, respectively).Among females, nosignificant associationbetween occupationalsitting and waistcircumference was found.Female workers who sat>5 h/day were less likely tohave high waist to hip ratiothan those reporting 0 h ofsitting per day. Mixedassociations were foundbetween occupational sittingand BMI categories.
Picavetet al.[60]
Workers fromDoetinchem,Netherlands(n = 1509)
Prospectivecohort(fiveexaminationsover 15years offollow-up)
Self-reported usual activityat work (response options:‘mainly sedentary’, ‘mainlystanding’, ‘manual’ and‘involving high physicalloads’); in the fifth round offollow-up, also self-reportednumber of hours/day ofoccupational sitting
BMI calculated frommeasured height andweight
In the adjusted analysis, nosignificant association wasfound between BMI(entered to the model as acontinuous variable) and‘stable’ occupational sitting(over the follow-up period).A separate analysis ofround 5 data showed nosignificant cross-sectionalassociation between BMIand hours/day ofoccupational sitting.
Pulsfordet al.[61]
Civil servants fromLondon, UK(n = 7830)
Prospectivecohort(15–19years offollow-up)
Self-reported using thequestion ‘On average,how many hours per weekdo you spend sitting atwork?’
BMI calculated frommeasured height andweight
In the adjusted analyses, nocross-sectional orprospective associationswere found betweenoccupational sitting timeand obesity. Prior obesitywas not prospectivelyassociated with subsequentoccupational sitting time.
Ryde et al.[62]
Full-time officeworkers fromBrisbane,Australia(n = 151)
Cross-sectional Sitting time measured using apressure-sensitive sittingpad, categorized into‘high-desk-based sittingtime’ (above median) and‘low-desk-based sitting time’(below median)
BMI calculated frommeasured height andweight; measured waistcircumference
The unadjusted analysisshowed significantly higherBMI (p = 0.02) and waistcircumference (p = 0.01)among ‘high sitters’ whencompared to ‘low sitters’. Inthe age- and gender-adjustedmodels, being a ‘high sitter’was significantly associatedwith obesity (OR = 8.95,
352 Curr Obes Rep (2016) 5:344–360

In two out of four prospective cohort studies, there was nosignificant association between sedentary work and subse-quent obesity [61] or BMI [60]. The other two studies reportedcontrasting results; Lin et al. [58] found a significant positiverelationship between workplace sitting time and BMI only inmen, whilst Eriksen et al. [52] found a significant relationshipbetween these variables only among women. Interestingly, arecent prospective study presented evidence supporting re-verse causation, i.e., that higher BMI at baseline elevates therisk of later increase in total sitting time (including sitting atwork and outside work) [65]. Pulsford et al. [61], however, didnot find a significant association between prior obesity andsubsequent occupational sitting time. Hence, it may be thatthe reverse causality only exists between obesity and total ornon-occupational sitting time.
The evidence presented here and in the previous review[43•] does not seem to strongly support the hypothesized as-sociation between sedentary work and obesity. The conceptualmodels that include sedentary work as one of the main occu-pational risk factors for obesity [66] may need to be revised toaccount for mostly null findings presented in the current re-view. A rather modest difference between energy costs ofsitting and standing [67, 68] implies that simply replacing
sitting at work by standing is unlikely to help prevent or man-age obesity. This somewhat explains the lack of associationbetween occupational sitting and overweight/obesity. To pro-vide stronger evidence about the association between seden-tary work and obesity, future studies should use longitudinalstudy design and objective measures of occupational sittingtime (e.g., inclinometers, pressure-sensitive sitting pads). Toallow for adequate adjustments for physical activity (both dur-ing occupational time and outside of work hours), future stud-ies may also need to consider using compositional data anal-yses according to the recently proposed activity balance (AB)model [69].
Obesity and Workplace Productivity
Excess weight may lead to functional limitations and impairedquality of life [2]. Thus, obesity and overweight may increaseutilization of healthcare services and negatively influence workability and productivity. The economic burden, i.e., the costs ofillness, includes both direct costs (healthcare costs) and indirectcosts (lost or decreased work productivity) [70]. Indirect costsare non-medical costs to society and include morbidity-related
Table 2 (continued)
Study Sample Study design Measures of occupationalsedentarism
Weight-related measures Main findings
1.87–42.85) and high waistcircumference (OR = 2.69,95 % CI 1.17–6.19).
Saidj et al.[63]
Workers from thegreater Copenhagenarea, Denmark,aged 18–69 years(n = 2544)
Cross-sectional Self-reported using thequestion ‘During work,how many hours andminutes per day do youengage in sedentary work’from the Physical ActivityScale 2 (PAS2) andexpressed in hours/day
BMI calculated frommeasured height andweight; measured waistcircumference; percentageof body fat estimated bybioelectrical impedanceusing scale TBF-300(Tanita Corp., Japan)
In the adjusted analyses,occupational sitting timeshowed no significantassociations with BMI(p = 0.08), waistcircumference (p = 0.08)and body fat percentage(p = 0.26).
Yang et al.[64]
Inhabitants of theMissouri metropolitanarea, USA, aged21–65 years(n = 1891)
Cross-sectional Self-reported occupationalsitting time using the item‘Please estimate how manyhours you spent sitting eachday while at work’ andcategorized into fourths
BMI calculated from self-reported height and weight
In the adjusted analysis, oddsratios for being classified asobese were significantlyhigher for female workersreporting 31–180 min/day(OR = 1.53, 95 % CI 1.02–2.31), 181–360 min/day(OR = 1.90, 95 % CI 1.23–2.94) and >360 min/day(OR = 1.70, 95 % CI 1.08–2.67) of occupational sittingwhen compared to thereference group (≤30 minof occupational sitting/day).No significant associationsbetween occupationalsitting time and obesitywere found in male workers.
B unstandardized regression coefficient, β standardized regression coefficient, BMI body mass index, OR odds ratio, p p value, PR prevalence ratio, RRrelative risk CI confidence interval, FF firefighters, n/a not available
Curr Obes Rep (2016) 5:344–360 353

(absenteeism, presenteeism, disability, early retirement) andmortality-related costs (premature death). Indirect costs may oc-cur due to decreases in worker’s job performance, as a result ofexcess weight and work-related characteristics (e.g., high phys-ical loads). In this section, we will focus on morbidity-relatedcosts related to workplace productivity (Table 3).
Workplace productivity can be quantified in several ways.Absenteeism is absence from work because of illness or otherfactors. Obese and overweight employees tend to have moredays of sick leave compared to normal-weight employees, andobese persons tend to have longer duration of individual sickleaves [70, 73, 77]. Somewhat less studied is presenteeism(lost on-the-job productivity), that is, attending work whilebeing ill. This often results in working at reduced capacityand with reduced productivity due to the illness. It is unclearwhether or not excess weight increases the risk ofpresenteeism [70].
The most recent data on both direct and indirect costs ofboth overweight and obesity have been reviewed by Dee andcoworkers [71•], based on a systematic literature search pub-lished from 2000 to 2011. They included five studies, whichwere similar in methodological approaches from Canada,Germany, Sweden, Switzerland and the USA. Indirect costsaccounted for 51–59 % of total costs, whilst being the highestin the USA and the lowest in Germany. In another study in theUSA, presenteeism accounted for the largest share (56–68 %)of total costs of overweight and obesity [78]. In five EuropeanUnion countries, indirect costs of overweight and obesity wereassessed using a questionnaire on work and activity impair-ment [79]. The study suggested that overall work impairment(i.e., absenteeism, presenteeism and productivity loss) in-creased with increased BMI.
A review by Neovius et al. [72] suggested a strong J-shaped association between BMI and disability pension, withthe risk starting to rise exponentially with BMI of more than25 kg/m2. The risk is clearly increased for obese employeeswith musculoskeletal, cardiovascular and mental disorders[72]. In a prospective cohort study of Finnish twins, BMIwas found to be an early predictor of disability pensions dueto musculoskeletal diseases [80].
In addition to disability pension, premature exit from paidemployment (displacement from the labour market) can takeplace through early retirement or termination of employmentinitiated by the employer. However, there is limited evidencethat obesity is associated with unemployment or early retire-ment [74].
Workplace-Based Interventions to Reduce Obesityand Overweight and to Improve Productivity
In recent years, the workplace has been identified as apotential avenue through which high-risk individuals
may be identified and interventions may be implementedto reduce obesity and overweight. This has the potential tobe beneficial not only to individual employees, but also toemployers in improving productivity and reducing indi-rect costs due to excess weight. To date, a number ofstudies have been conducted to test a variety of workplaceinterventions with the aim to reduce obesity and over-weight, but few have concentrated on productivity.These interventions generally focused on increasing phys-ical activity and decreasing sedentary time both at workand during leisure, and/or improving nutrition, and havebeen implemented in various combinations, sometimeswith financial incentive (Table 4). Interventions, to date,have been conducted at multiple levels, either targeted atthe individual or at a higher level by intervening on thework unit or organization as a whole [91].
Several systematic reviews have focused on workplace-based interventions with primary outcomes that are close-ly related to obesity. In 2014, Malik et al. conducted asystematic review of workplace interventions aimed spe-cifically at increasing physical activity either at work orduring leisure time [81]. The included studies assessedtargeted exercise interventions, counselling or behaviouralsupport, or health promotion messages or information.Results were mixed, with 32 of 58 studies reporting astatistically significant increase in physical activity frombaseline to follow-up. Several methodological limitationswere common across studies, including the use of onlyself-report measures of physical activity and inclusion ofmultiple heterogeneous components of interventions withvarying levels of participants’ adherence, making it diffi-cult to conclude which aspects were effective at promot-ing behaviour change. Shrestha et al. [82] reviewed theinterventions aimed specifically at reducing sitting atwork in desk-based workers. The 20 studies includedassessed the effectiveness of modified desks (e.g. sit-stand desks), walking during breaks, educational informa-tion and counselling and multi-pronged interventions inreducing sitting behaviour at work. In six studies, it wasfound that sit-stand desks reduced the time spent sitting atwork on average by half an hour to 2 h at short-term (lessthan 3 months) follow-up, with no adverse effects.However, the quality of evidence from the reviewed stud-ies was low. Replacing 2 h of sitting with standing usingsit-stand desks might not be enough to lose excess weightfor overweight or obese employees or to prevent weightgain. The effects of other types of interventions on reduc-ing sitting time at work were inconsistent or non-signifi-cant. In a more recent cluster randomized controlled trial(RCT), Danquah et al. [83] reported a reduction in bodyfat percentage by 0.6 % (p = 0.011) in a multi-componentintervention group that used sit-stand desks, compared tothe control group. While this reduction is statistically
354 Curr Obes Rep (2016) 5:344–360

significant, the small absolute reduction in body fat per-centage has limited clinical relevance. Some evidence in-dicates that frequent breaks in sitting time may be bene-ficially associated with BMI and waist circumference [92]independent of total sedentary time, but more research isneeded to examine this hypothesis specifically in the oc-cupational setting.
Three recent reviews have been conducted to summa-rize the effects of workplace weight management inter-ventions. In the most recent review, Weerasekara et al.[93•] identified 23 randomized interventions consistingprimarily of nutrition and/or physical activity. All buttwo interventions reported a decrease in body weightand BMI at 6 or 12 months, but the effect was statisticallysignificant only in three studies [93•]. Of ten studiesreviewed by Ausburn et al. [84], five studies used a com-bination of physical activity, diet and health educationmaterials, three studies tested interventions targeting bothphysical activity and diet, one focused on increasing
physical activity, and one focused on increasing physicalactivity and health education materials (for physical activ-ity promotion and other health-related information) [84].The authors concluded that the inclusion of education ma-terials was essential for weight management programs andthat modification of the work environment (such as pro-viding healthier food choices in vending machines, intro-ducing ‘healthy’ cafeteria menus) and weight loss compe-titions may be the most effective strategies for reducingobesity in the workplace. In another review published in2009, Anderson et al. conducted a meta-analysis to assessthe effectiveness of worksite nutrition and physical activ-ity programs to promote healthy weight among employees[85]. Based on nine RCTs, a modest but statistically sig-nificant reduction in body weight was found after 6–12 months of the interventions (on average −1.3 kg,95 % CI −1.3, −0.5).
Despite the growing evidence on the association be-tween obesity and workplace productivity, only few
Table 3 Studies on obesity and work productivity
Review ID Characteristics of review Measures of economic burden Main findings
Dee at al. [71•] 7 studies included in qualitativesynthesis, and 5 studies included inquantitative synthesis
Direct costs and indirect costs: sickleave, early retirement, disability,absenteeism and presenteeism,premature mortality
Healthcare costs increase as BMI increases andso do costs associated with lost productivity.The costs associated with lost production arehigher than direct healthcare costs.
Neovius et al.[72]
16 studies included, threecross-sectional, eight longitudinal,five interventional
Disability pension, long-term sickleave, working status, insurancestatus
BMI was significantly associated with disabilitypension, but the direction of causality mayvary with underlying cause. Interventions hadpositive productivity effects in the morbidlyobese, but whether this holds for theoverweight remains to be proven
Neovius et al.[73]
36 non-intervention studies andintervention studies
Frequency of sick leave, work timelost due to sick leave
A clear trend towards greater sick leave amongobese compared with normal-weight workers.
Substantial weight loss in obese subjects resultedin reduced sick leave, at least temporarily.
Robroek et al.[74]
28 studiesAppraisal of study quality
Disability pension, unemploymentand early retirement
Obese [relative risk (RR) = 1.53] and overweight(RR = 1.16) individuals had an increasedlikelihood of exit from paid employmentthrough disability pension but were not atstatistically significant increased risk forunemployment or early retirement.
Schmier et al.[75]
8 studies Absenteeism, sick leave, disability Overweight or obese employees had higher sickleave or disability use. Healthcare costs werealso consistently higher for employees withhigher body mass indices.
Trogdon et al.[76]
31 studies; cohort (7 studies),cross-sectional (12 studies),aetiologic fraction (10 studies)and non-traditional designs(2 studies).
Absenteeism, disability, prematuremortality, presenteeism, workers’compensation and total indirectcosts
Compared with non-obese workers, obeseworkers miss more workdays due to illness,injury or disability. Costs of prematuremortality vary substantially across countries.The results for presenteeism and workers’compensation were mixed.
van Duijvenbodeet al. [77]
13 studiesAppraisal of study quality
Sick leave Inconclusive evidence for a relationship betweenoverweight and sick leave but strong evidencefor positive relation between obesity and sickleave
Curr Obes Rep (2016) 5:344–360 355

Table 4 Summary of reviewed studies addressing worksite health promotion programs and their effect on productivity
Study/review Type of study Interventions Outcome Results
Malik et al. [81] Systematicreview
58 studiesAppraisal of
study quality
Targeted exercise interventions,counselling or behaviouralsupport interventions, or healthpromotion messages/informationinterventions
Physical activity at work Mixed results, with 32 of 58 studiesreporting a significant increase inphysical activity from baseline tofollow-up
Shrestha et al.[82]
Systematicreview andmeta-analysis
20 studiesAppraisal of
study quality
Changes in desks, walking duringbreaks, information andcounselling and multiplecategory interventions
Time spent sitting at work Sit-stand desks reduced sitting atwork between half an hour and2 h (6 studies).
Low-quality evidence
Danquah et al.[83]
Cluster RCTfor 3 months
n = 317
Appointment of local ambassadors,management support,environmental changes (highmeeting tables in meeting rooms,offices and corridors and routesfor walking meetings), a lectureand a workshop.
Time spent sitting (at work andleisure), body weight, fat mass,fat-free mass and body fatpercentage using a scale-typeBC-418 MA (Tanita Corp.,Tokyo, Japan)
Total sitting time was reduced by48 min at 3 months follow-up.The body fat percentage waslower by 0.61 percentage points.
Ausburn et al.[84]
Systematicreview
10 studiesAppraisal of
study quality
Workplace-based interventions onphysical activity, diet and healtheducation materials
Body weight Inclusion of education materials isessential for any weightmanagement program.Modification of the workenvironment and weight losscompetitions may be the mosteffective approach to reduceobesity.
Andersonet al. [85]
Systematicreview andmeta-analysis
47 studiesAppraisal of
study quality
Workplace-based physicalactivity or nutritioninterventions
Body weight, body mass index(BMI) and percent body fat
A modest reduction in weight in9 RCTs (−1.3 kg, 95 %CI −1.3, −0.5)
Bilger et al.[86]
Secondaryanalysison pooleddata fromtwo RCTs
n = 1868
Weight loss intervention foroverweight and obeseemployees
Absenteeism and presenteeism A non-statistically (but marginally)significant reduction inabsenteeism by 0.26 days permonth and low presenteeism inthose who achieved a clinicallymeaningful weight reduction of5 % compared to those whodid not
Harden et al.[87]
Secondaryanalysisof RCT
n = 1030
Internet-based weight lossprogram for overweight andobese employees
Absenteeism andpresenteeism
No differences in absenteeism orpresenteeism in those lost >5 %of weight compared to those whodid not
Morgan et al.[88]
Cluster RCTfor 14 weeks
n = 110
Weight loss intervention includingan education session, interactivestudy website, pedometer andfinancial incentives foroverweight and obese maleemployees
Body weight, absenteeismand presenteeism
4.4-kg difference in weight lossbetween the intervention andcontrol group
A significant improvement inpresenteeism and reduction inabsenteeism
Meenan et al.[89]
Cluster RCTfor 2 years
n = 11,559
Multi-component weight lossintervention
BMI, waist to hip ratioand absenteeism
A significant decrease in BMIIncrease in absenteeism
Gussenhovenet al. [90]
RCTn = 1386
Educational modules on physicalactivity, nutrition and behaviourchange
Bodyweight, sick leavecosts and productivity
No effect on weight orproductivity
356 Curr Obes Rep (2016) 5:344–360

studies have examined the effects of a weight loss inter-vention on productivity-related outcomes. Most often,weight loss intervention studies have included productiv-ity measures as secondary outcomes. Bilger et al. pooledthe results from two RCTs of 12-month weight loss inter-ventions to compare their effects on absenteeism andpresenteeism in those who lost weight and those whodid not [86]. Among those who lost a clinically signifi-cant >5 % of body weight, a significant reduction in ab-senteeism of 0.26 days per month was observed. Therewas a non-significant effect on presenteeism. Harden etal. [87] also conducted a secondary analysis in an RCTof an internet-based weight loss program in overweightemployees. In the primary intention-to-treat analysis,there was no difference in absenteeism or presenteeismin the intervention compared to the control group. In thesecondary analysis, favourable differences in both out-comes were observed in those who lost >5 % of theirbody weight compared to those who did not [87]. It isimportant to note that both these studies were not initiallydesigned to examine the association between weight lossand productivity; thus, they may not have been adequatelypowered. Conducting a secondary analysis by pooling thestudy groups and comparing them by weight loss statusalso ignores the benefits of the randomized design; thus,these findings should be interpreted with caution.
Other weight loss intervention studies that have includ-ed measures of work productivity have produced variablefindings. In a single-group retrospective cohort study ex-amining the effects of a multi-tiered health benefit planincluding changes to the work schedule and environment,along with access to a wellness coach and educationalmaterials and financial incentives and reimbursement forphysical activity, Guo et al. found a significant decreasein the prevalence of obesity over time (−4.8 % on averageeach year), with a simultaneous increase in self-reportedjob performance and decreased absenteeism in the past28 days [94]. In a cluster RCT of male employees takingpart in a multi-pronged 14-week weight loss intervention(including an education session, interactive study website,pedometer and financial incentives), a significant meandifference in weight of 4.4 kg between the interventionand control group was observed, along with a significantimprovement in presenteeism and reduction in absentee-ism over the past 3 months [88]. In another cluster RCT ofa 2-year multi-component weight loss intervention,Meenan et al. observed a significant decrease in BMIand waist to hip ratio in the intensive intervention vs.the comparison group. However, they found an unexpect-ed increase in employee absenteeism [89]. Finally,Gussenhoven et al. conducted a three-arm RCT consistingof ten educational modules based on cognitive behaviour-al theory, focused on physical activity, nutrition and
behaviour change either delivered over the internet or bya personal coach [90]. No change in sick leave costs orproductivity was observed at 12-month follow-up.Importantly, the study did not find a significant differencein the change in weight amongst the three groups, sug-gesting no effect of the intervention itself, rather than noeffect of weight loss on productivity.
Conclusion
Despite some inconsistencies in findings, there is con-vincing evidence that shift work increases the risk of obe-sity, while most studies did not show a significant associ-ation between sedentary work and obesity. More longitu-dinal research using objective measures of occupationalsitting and adequate adjustments for physical activity(both at work and during leisure) is needed to draw soundconclusions about whether or not sedentary work is asso-ciated with the risk of obesity. The indirect costs of obe-sity may have great implications for the workplace, andstrategies to minimize obesity may be of particular inter-est to employers. Overweight and obesity were found tobe associated with absenteeism, disability pension andoverall work impairment, whilst evidence of their rela-tionship with presenteeism, unemployment and early re-tirement was not consistent. Workplace interventions havebeen designed to address obesity and productivity.However, due to the vast heterogeneity in the types ofinterventions employed across a variety of study popula-tions with different working and overweight status, cur-rently, there is no consensus on best practice recommen-dations for workplace-based interventions that aim to pre-vent or reduce obesity or overweight. However, these in-terventions might address some of the outcomes otherthan obesity like sick leave or work productivity. Theliterature, to date, suggests that a change in both dietand in physical activity at work or during leisure is need-ed to influence obesity and, thus, workplace productivity.In order to achieve this goal, a multi-component approachis most likely needed.
Compliance with Ethical Standards
Conflict of Interest Nipun Shrestha has received financial supportthrough a VU Research Scholarship 2016 from Victoria University.
Zeljko Pedisic declares that he has no conflict of interest.Sarah Neil-Sztramko has received financial support through a
Doctoral Student Award and Postdoctoral Fellowship from theCanadian Institutes of Health Research.
Katriina T. Kukkonen-Harjula declares that she has no conflict ofinterest.
Veerle Hermans declares that she has no conflict of interest.
Curr Obes Rep (2016) 5:344–360 357

Human and Animal Rights and Informed Consent This article doesnot contain any studies with human or animal subjects performed by anyof the authors.
References
Papers of particular interest, published recently, have beenhighlighted as:• Of importance
1. Jarolimova J, Tagoni J, Stern TA. Obesity: its epidemiology, co-morbidities, and management. Prim Care Companion CNS Disord.2013;15(5):PCC.12f01475.
2. Obesity: Preventing and managing the global epidemic, 2000,WHO Geneva WHO technical report series 894, 253 p.
3. NCD Risk Factor Collaboration. Trends in adult body-mass indexin 200 countries from 1975 to 2014: a pooled analysis of 1698population-based measurement studies with 19.2 million partici-pants. Lancet. 2016;387:1377–98.
4. Aronne LJ, Nelinson DS, Lillo JL. Obesity as a disease state: a newparadigm for diagnosis and treatment. Clin Cornerstone. 2009;9(4):9–25.
5. Schulte PA, Wagner GR, Ostry A, Blanciforti LA, Cutlip RG,Krajnak KM, et al. Work, obesity and occupational safety andhealth. Am J Public Health. 2007;97:428–36.
6. Victorian Health Promotion Foundation. Reducing prolonged sit-ting in the workplace. An evidence review: summary report. 2012.
7. Borak J. Obesity and the workplace. Occup Med. 2011;61(4):220–2.
8. Sanchez Bustillos A, Vargas III KG, Gomero-Cuadra R. Work pro-ductivity among adults with varied BodyMass Index: results from aCanadian population-based survey. J Epidemiol Glob Health.2015;5:191–9.
9. McMenamin TM. A time to work: recent trends in shift work andflexible schedules. Monthly Labor Review. 2007. Available from:http://www.bls.gov/opub/mlr/2007/12/art1full.pdf.
10. Harrington JM. Health effects of shift work and extended hours ofwork. Occup Environ Med. 2001;58:68–72.
11. Straif K, Baan R, Grosse Y, Secretan B, El GF, Bouvard V, et al.Carcinogenicity of shift-work, painting, and fire-fighting. LancetOncol. 2007;8:1065–6.
12. Vyas MV, Garg A, Iansavichus A, Costella J. Shift work and vas-cular events: systematic review and meta-analysis. BMJ. 2012;345:e4800.
13. Lennernas M, Andersson I. Food-based classification of eating ep-isodes (FBCE). Appetite. 1999;32(1):53–65.
14. vanDrongelen A, Boot CRL,Merkus SL, Smid T, van der Beek AJ.The effects of shift work on body weight change—a systematicreview of longitudinal studies. Scand J Work Environ Health.2011;37(4):263–75.
15.• Amani R, Gill T. Shiftworking, nutrition and obesity: implicationsfor workforce health—a systematic review. Asia Pac J Clin Nutr.2013;22:698–708. Systematically reviewed the association be-tween shiftwork and obesity; included both cross-sectionaland longitudinal studies.
16.• Proper KI, van de Langenberg D, Rodenburg W, Vermeulen RC,van der Beek AJ, van Steeg H, et al. The relationship between shiftwork and metabolic risk factors: a systematic review of longitudinalstudies. Am J Prev Med. 2016;50:e147–57. Systematically
summarized the available evidence of longitudinal studieslinking shift work with metabolic risk factors.
17. Barbadoro P, Santarelli L, Croce N, Bracci M, Vincitorio D,Prospero E, et al. Rotating shift-work as an independent risk factorfor overweight Italian workers: a cross-sectional study. PLoS ONE.2013;8(5):e63289.
18. Bekkers MB, Koppes LJ, Rodenburg W, Steeg HV, Proper KI.Relationship of night and shift work with weight change and life-style behaviors. J Occup Environ Med. 2015;57(4):e37–44.
19. Buchvold HV, Pallesen S, Øyane NM, Bjorvatn B. Associationsbetween night work and BMI, alcohol, smoking, caffeine and ex-ercise–a cross-sectional study. BMC Public Health. 2015;12(15):1112.
20. Gholami Fesharaki M, Kazemnejad A, Zayeri F, Rowzati M,Akbari H. Relationship between shift work and obesity; a retro-spective cohort study. J Mil Med. 2012;14(2):93–7.
21. Griep RH, Bastos LS, Fonseca Mde J, Silva-Costa A, Portela LF,Toivanen S, et al. Years worked at night and body mass indexamong registered nurses from eighteen public hospitals in Rio deJaneiro, Brazil. BMC Health Serv Res. 2014;14:603.
22. Huth JJ, Eliades A, Handwork C, Englehart JL, Messenger J. Shiftworked, quality of sleep, and elevated body mass index in pediatricnurses. J Pediatr Nurs. 2013;28(6):e64–73.
23. Kim M, Son K, Park H, Choi D, Yoon C, Lee H, et al. Associationbetween shift work and obesity among female nurses: KoreanNurses’ Survey. BMC Public Health. 2013;13:1204.
24. Ko SB. Night shift work, sleep quality, and obesity. Am J LifestyleMed. 2013;3(2):110–6.
25. Macagnan J, Pattussi MP, Canuto R, Henn RL, Fassa AG, OlintoMT. Impact of nightshift work on overweight and abdominal obe-sity among workers of a poultry processing plant in SouthernBrazil. Chronobiol Int. 2012;29(30):336–43.
26. Marqueze E, Lemos L, Soares N, Lorenzi-Filho G, Moreno C.Weight gain in relation to night work among nurses. Work.2012;41:2043–8.
27. Neil-Sztramko SE, Gotay CC, Demers PA, Campbell KL. Physicalactivity, physical fitness, and body composition of canadian shiftworkers: data from the Canadian Health Measures Survey Cycles 1and 2. J Occup Environ Med. 2016;58(1):94–10.
28. Peplonska B, Bukowska A, SobalaW. Association of rotating nightshift work with BMI and abdominal obesity among nurses andmidwives. PLoS ONE. 2015;10(7):e0133761.
29. Roos E, Lallukka T, Rahkonen O, Lahelma E, Laaksonen M.Working conditions and major weight gain—a prospective cohortstudy. Arch Environ Occup Health. 2013;68(3):166–72.
30. Smith P, Fritschi L, Reid A, Mustard C. The relationship betweenshift work and bodymass index among Canadian nurses. Appl NursRes. 2013;26:24–31.
31. Son M, Jin Ye B, Kim J, Kang S, Jung KY. Association betweenshift work and obesity according to body fat percentage in Koreanwage workers: data from the fourth and the fifth Korea NationalHealth and Nutrition Examination Survey (KNHANES 2008–2011). Ann Occup Environ Med. 2015;27:32.
32. Tada Y, Kawano Y, Maeda I, Yoshizaki T, Sunami A, Yokoyama Y,et al. Association of body mass index with lifestyle and rotatingshift work in Japanese female nurses. Obesity (Silver Spring).2014;22(12):2489–93.
33. Yoon CG, KangMY, Bae KJ, Yoon JH. Do working hours and typeof work affect obesity in South Korean female workers? Analysis ofthe Korean Community Health Survey. J Womens Health(Larchmt). 2016;25(2):173–80.
34. Puttonen S, Härmä M, Hublin C. Shift work and cardiovasculardisease - pathways from circadian stress to morbidity. Scand JWork Environ Health. 2010;36:96–108.
358 Curr Obes Rep (2016) 5:344–360

35. Antunes LC, Levandovski R, Dantas G, Caumo W, Hidalgo MP.Obesity and shift work: chronobiological aspects. Nutr Res Rev.2010;23:155–68.
36. Heath G, Roach GD, Dorrian J, Ferguson SA, Darwent D, SargentC. The effect of sleep restriction on snacking behavior during aweek of simulated shiftwork. Accid Anal Prev. 2012;45(Suppl):62–7.
37. Nedeltcheva AV, Kilkus JM, Imperial J, Kasza K, Schoeller DA,Penev PD. Sleep curtailment is accompanied by increased intake ofcalories from snacks. Am J Clin Nutr. 2009;89(1):126–33.
38. Burch JB, Tom J, Zhai Y, Criswell L, Leo E, Ogoussan K.Shiftwork impacts and adaptation among health care workers.Occup Med (Lond). 2009;59(3):159–66.
39. Vandelanotte C, Short C, Rockloff M, Di Millia L, Ronan K,Happell B, et al. How do different occupational factors influencetotal, occupational, and leisure-time physical activity? J Phys ActHealth. 2015;12(2):200–7.
40. de Rezende LFM, de Sá TH,Mielke GI, Viscondi JYK, Rey-LópezJP, Garcia LMT. All-cause mortality attributable to sitting time:analysis of 54 countries worldwide. Am J Prev Med. 2016.
41. Ng SW, Popkin BM. Time use and physical activity: a shift awayfrom movement across the globe. Obes Rev. 2012;13(8):659–80.
42. Church TS, Thomas DM, Tudor-Locke C, Katzmarzyk PT, EarnestCP, Rodarte RQ, et al. Trends over 5 decades in U.S. occupation-related physical activity and their associations with obesity. PLoSONE. 2011;6(5):e19657.
43.• van Uffelen JGZ, Wong J, Chau JY, van der Ploeg HP, Riphagen I,Gilson ND, et al. Occupational sitting and health risks: a systematicreview. Am J Prev Med. 2010;39(4):379–88. Systematicallyreviewed the association between occupational sitting andhealth risks.
44. Al-Habsi A, Kilani H. Lifestyles of adult Omani women: cross-sectional study on physical activity and sedentary behaviour.Sultan Qaboos Univ Med J. 2015;15(2):e257–65.
45. Bennie JA, Pedisic Z, Timperio A, Crawford D, Dunstan D,Bauman A, et al. Total and domain-specific sitting time amongemployees in desk-based work settings in Australia. Aust N Z JPublic Health. 2015;39(3):237–42.
46. Carr LJ, Swift M, Ferrer A, Benzo R. Cross-sectional examinationof long-term access to sit-stand desks in a professional office set-ting. Am J Prev Med. 2016;50(1):96–100.
47. Chau JY, van der Ploeg HP, MeromD, Chey T, Bauman AE. Cross-sectional associations between occupational and leisure-time sit-ting, physical activity and obesity in working adults. Prev Med.2012;54(3–4):195–200.
48. Choi B, Schnall PL, Yang H, DobsonM, Landsbergis P, Israel L, etal. Sedentary work, low physical job demand, and obesity in USworkers. Am J Ind Med. 2010;53(11):1088–101.
49. Choi B, DobsonM, Schnall P, Garcia-Rivas J. 24-hour work shifts,sedentary work, and obesity in male firefighters. Am J Ind Med.2016;59:486–500.
50. De Cocker K, Duncan MJ, Short C, van Uffelen JG, VandelanotteC. Understanding occupational sitting: prevalence, correlates andmoderating effects in Australian employees. Prev Med. 2014;67:288–94.
51. DobsonM, Choi B, Schnall PL, Wigger E, Garcia-Rivas J, Israel L,et al. Exploring occupational and health behavioral causes of fire-fighter obesity: a qualitative study. Am J IndMed. 2013;56(7):776–90.
52. Eriksen D, Rosthøj S, Burr H, Holtermann A. Sedentary work –associations between five-year changes in occupational sitting timeand body mass index. Prev Med. 2015;73:1–5.
53. Garcia LM, da Silva KS, Del Duca GF, da Costa FF, Nahas MV, etal. Sedentary behaviors, leisure-time physical inactivity, and chron-ic diseases in Brazilian workers: a cross sectional study. J Phys ActHealth. 2014;11:1622–34.
54. Hadgraft NT, Lynch BM, Clark BK, Healy GN, Owen N, DunstanDW. Excessive sitting at work and at home: correlates of occupa-tional sitting and TV viewing time in working adults. BMC PublicHealth. 2015;15:899. doi:10.1186/s12889-015-2243-y.
55. Honda T, Chen S, Kishimoto H, Narazaki K, Kumagai S.Identifying associations between sedentary time and cardio-meta-bolic risk factors in working adults using objective and subjectivemeasures: a cross-sectional analysis. BMC Public Health. 2014;14:1307. doi:10.1186/1471-2458-14-1307.
56. Kazi A, Duncan M, Clemes S, Haslam C. A survey of sitting timeamong UK employees. Occup Med (Lond). 2014;64(7):497–502.
57. Kim JY, Park YH, En A. The relationship between lifestyles andobesity of office workers in Korea. Int J Control Autom Syst.2015;8(10):349–60.
58. Lin TC, Courtney TK, Lombardi DA, Verma SK. Association be-tween sedentary work and BMI in a U.S. national longitudinalsurvey. Am J Prev Med. 2015;49(6):e117–23.
59. Nicholas JA, Lo Siou G, Lynch BM, Robson PJ, Friedenreich CM,Csizmadi I. Leisure-time physical activity does not attenuate theassociation between occupational sedentary behavior and obesity:Results from Alberta’s tomorrow project. J Phys Act Health.2015;12(12):1589–600.
60. Picavet HS, Pas LW, van Oostrom SH, van der Ploeg HP,Verschuren WM, Proper KI. The relation between occupationalsitting and mental, cardiometabolic, and musculoskeletal healthover a period of 15 years - The Doetinchem Cohort Study. PLoSONE. 2016;11(1).
61. Pulsford RM, Stamatakis E, Britton AR, Brunner EJ, HillsdonMM.Sitting behavior and obesity: evidence from the Whitehall II study.Am J Prev Med. 2013;44(2):132–8.
62. Ryde GC, Brown HE, Peeters GM, Gilson ND, Brown WJ. Desk-based occupational sitting patterns: weight-related health outcomes.Am J Prev Med. 2013;45(4):448–52.
63. Saidj M, Jørgensen T, Jacobsen RK, Linneberg A, Aadahl M.Separate and joint associations of occupational and leisure-timesitting with cardio-metabolic risk factors in working adults: across-sectional study. PLoS ONE. 2013;8(8):e70213. doi:10.1371/journal.pone.0070213.
64. Yang L, Hipp JA, Marx CM, Brownson RC. Occupational sittingand weight status in a diverse sample of employees in Midwestmetropolitan cities, 2012–2013. Prev Chronic Dis. 2014;11:E203.doi:10.5888/pcd11.140286.
65. Pedisic Z, Grunseit A, Ding, Chau JY, Banks E, Stamatakis E, et al.High sitting time or obesity: which came first? Bidirectional asso-ciation in a longitudinal study of 31,787 Australian adults. Obesity.2014;22(10):2126–30.
66. Pandalai SP, Schulte PA,Miller DB. Conceptual heuristic models ofthe interrelationships between obesity and the occupational envi-ronment. Scand J Work Environ Health. 2013;39(3):221–32.
67. Speck RM, Schmitz KH. Energy expenditure comparison: a pilotstudy of standing instead of sitting at work for obesity prevention.Prev Med. 2011;52:283–4.
68. Júdice PB, Hamilton MT, Sardinha LB, Zderic TW, Silva AM.What is the metabolic and energy cost of sitting, standing and sit/stand transitions? Eur J Appl Physiol. 2016;116:263–73.
69. Pedisic Z. Measurement issues and poor adjustments for physicalactivity and sleep undermine sedentary behaviour research - thefocus should shift to the balance between sleep, sedentary behav-iour, standing and activity. Kinesiology. 2014;46:135–46.
70. Lehnert T, Sonntag D, Konnopka A, Riedel-Heller S, König HH.Economic costs of overweight and obesity. Best Pract Res ClinEndocrinol Metab. 2013;27:105–15.
71.• Dee A, Kearns K, O’Neill C, Sharp L, Staines A, O’Dwyer V, et al.The direct and indirect costs of both overweight and obesity: asystematic review. BMC Res Notes. 2014;7:242. Systematicallyexamined direct costs and indirect (lost productivity) costs of
Curr Obes Rep (2016) 5:344–360 359

both overweight and obesity to provide comparable estimatesacross nations.
72. Neovius K, Johansson K, Rössner S, Neovius M. Disability pen-sion, employment and obesity status: a systematic review. ObesRev. 2008;9:572–81.
73. Neovius K, Johansson K, Kark M, Neovius M. Obesity status andsick leave: a systematic review. Obes Rev. 2009;10:17–27.
74. Robroek SJ, Reeuwijk KG, Hillier FC, Bambra CL, van Rijn RM,Burdorf A. The contribution of overweight, obesity, and lack ofphysical activity to exit from paid employment: a meta-analysis.Scand J Work Environ Health. 2013;39:233–40.
75. Schmier JK, Jones ML, Halpern MT. Cost of obesity in the work-place. Scand J Work Environ Health. 2006;32(1):5–11.
76. Trogdon JG, Finkelstein EA, Hylands T, Dellea PS, Kamal-Bahl SJ.Indirect costs of obesity: a review of the current literature. ObesRev. 2008;9(5):489–500.
77. van Duijvenbode DC, Hoozemans MJ, van Poppel MN, Proper KI.The relationship between overweight and obesity, and sick leave: asystematic review. Int J Obes (Lond). 2009;33:807–16.
78. Finkelstein EA, DiBonaventura M, Burgess SM, Hale BC. Thecosts of obesity in the workplace. J Occup Environ Med.2010;52:971–6.
79. Gupta S, Richard L, Forsythe A. The humanistic and economicburden associated with increasing body mass index in the EU5.Diabetes Metab Syndr Obes. 2015;8:327–38.
80. Ropponen A, Silventoinen K, KoskenvuoM, Svedberg P, Kaprio J.Stability and change of body mass index as a predictor of disabilitypension. Scand J Public Health. 2016;44:369–76.
81. Malik SH, Blake H, Suggs LS. A systematic review of workplacehealth promotion interventions for increasing physical activity. Br JHealth Psychol. 2014;19(1):149–80.
82. Shrestha N, Kukkonen-Harjula KT, Verbeek JH, Ijaz S, Hermans V,Bhaumik S. Workplace interventions for reducing sitting at work.Cochrane Database Syst Rev. 2016;3:CD010912. doi:10.1002/14651858.CD010912.pub3.
83. Danquah IH, Kloster S, Holtermann A, Aadahl M, Bauman A,Ersbøll AK, Tolstrup JS. Take a Stand!—a multi-component inter-vention aimed at reducing sitting time among office workers—acluster randomized trial. Int J Epidemiol. 2016.
84. Ausburn TF, LaCoursiere S, Crouter SE, McKay T. Review ofworksite weight management programs. Workplace Health Saf.2014;62(3):122–6.
85. Anderson LM, Quinn TA, Glanz K, Ramirez G, Kahwati LC,Johnson DB, et al. The effectiveness of worksite nutrition andphysical activity interventions for controlling employee overweight
and obesity: a systematic review. Am J Prev Med. 2009;37(4):340–57.
86. Bilger M, Finkelstein EA, Kruger E, Tate DF, Linnan LA. Theeffect of weight loss on health, productivity, and medical expendi-tures among overweight employees. Med Care. 2013;51(6):471–7.
87. Harden SM, YouW, Almeida FA, Hill JL, Linnan LA, Allen KC, etal. Does successful weight loss in an internet-based worksite weightloss program improve employee presenteeism and absenteeism?Health Educ Behav. 2015;42(6):769–74.
88. Morgan PJ, Collins CE, Plotnikoff RC, Cook AT, Berthon B,Mitchell S, et al. The impact of a workplace-based weight lossprogram on work-related outcomes in overweight male shiftworkers. J Occup Environ Med. 2012;54(2):122–7.
89. Meenan RT, Vogt TM, Williams AE, Stevens VJ, Albright CL,Nigg C. Economic evaluation of a worksite obesity preventionand intervention trial among hotel workers in Hawaii. J OccupEnviron Med. 2010;52 Suppl 1:S8–13.
90. Gussenhoven AH, van Wier MF, Bosmans JE, Dekkers JC, vanMechelen W. Cost-effectiveness of a distance lifestyle counsellingprogramme among overweight employees from a company per-spective, ALIFE@Work: a randomized controlled trial. Work.2013;46(3):337–46.
91. Quintiliani L, Sattelmair J, Sorensen G. The workplace as a settingfor interventions to improve diet and promote physical activity. Abackground paper prepared for the WHO/WEF Joint Event onPreventing Noncommunicable Diseases in the Workplace. Dalian:World Health Organization; 2007.
92. Healy GN, Dunstan DW, Salmon J, Cerin E, Shaw JE, Zimmet PZ,et al. Breaks in sedentary time: beneficial associations with meta-bolic risk. Diabetes Care. 2008;31:661–6.
93.• Weerasekara YK, Roberts SB, Kahn MA, LaVertu AE, Hoffman B,Das SK. Effectiveness of workplace weight management interven-tions: a systematic review. Curr Obes Rep. 2016;5(2):298–306.Systematically reviewed randomized trials of workplace weightmanagement interventions, including trials with dietary, phys-ical activity, environmental, behavioral, and incentive-basedcomponents.
94. Guo X, Coberley C, Pope JE, Wells A. The Value of a well-beingimprovement strategy: longitudinal success across subjective andobjective measures observed in a firm adopting a consumer-drivenhealth plan. J Occup Environ Med. 2015;57(10):1055–62.
95. Popkin BM, Kim S, Rusev ER, Du S, Zizza C. Measuring the fulleconomic costs of diet, physical activity and obesity-related chronicdiseases. Obes Rev. 2006;7:271–93.
96. Runge CF. Economic consequences of the obese. Diabetes.2007;56(11):2668–72.
360 Curr Obes Rep (2016) 5:344–360