Embed Size (px)
Citation preview

Eastern Illinois University Eastern Illinois University
The Keep The Keep
Undergraduate Honors Theses Honors College
2014
The Impact of On-Campus Involvement in Student's Satisfaction The Impact of On-Campus Involvement in Student's Satisfaction
for First Generation College Students for First Generation College Students
Elizabeth Burbatt
Follow this and additional works at: https://thekeep.eiu.edu/honors_theses
Part of the Higher Education Commons, and the Student Counseling and Personnel Services
Commons

DEPARTMENT OF SOCIOLOGY & ANTHROPOLOGY
UNDERGRADUATE HONORS THESIS APPROVAL
This thesis by Elizabeth Burbatt is accepted by the Department of Sociology &
Anthropology at Eastern Illinois University as satisfying the requirement of the
departmental undergraduate honors program and the degree of Bachelor of Arts with
Sociology-Anthropology Departmental Honors.
Thesis Chair
Thesis Committee Member
fv\ """ '1 .. 1 ... , 0 \ tt-(
Date

THE IMPACT OF ON-CAMPUS INVOLVEMENT IN STUDENT'S
SATISFACTION FOR FIRST GENERATION COLLEGE STUDENTS
By:
Elizabeth Burbatt
THESIS
Submitted in Partial Fulfillment of the Requirements for the
Sociology & Anthropology Departmental Honors Program
Thesis Committee:
Michael Gillespie, Ph.D. - Chair
Bill Lovekamp, Ph.D.
Lisa New Freeland, Ph. D.
Proposal approved on: January 22, 201 4
Thesis completed on: May 9 , 201 4
Department of Sociology & Anthropology
Eastern Illinois University

ABSTRACT
According to the Integrated Postsecondary Education Data System (IPEDS) conducted by the National Center for Education Statistics (20 1 3) 4 1 % of students in fouryear colleges and universities will not graduate. There are many reasons for this, including poor academics, low college/degree aspirations, poor study habits, uneducated parents, or coming from a small town. Although it is dependent on the student, Roberts and Styron (20 1 0) found that students who do not become socially integrated oftentimes suffer from persistence issues, as they do not feel connected with the institution. My research examines the relationship between extracurricular involvement and student's satisfaction for first generation college students. First generation college students have what many researchers call a lack of "college knowledge", meaning they have limited information about college in general and are likely to have less access to information from college visits, online sources, and other information compared to their counterparts. First generation students are also more likely to have low academic self-efficacy, have lower achievement and have lower degree aspirations (US Department of Education 1 998).
I hypothesize that extracurricular involvement of any kind, because of connections made with others, increases a student' s chance of remaining at a university or the likelihood of remaining on campus. I believe that these students are more likely to be connected to the university and will be more knowledgeable of resources. The relationship between involvement and student' s satisfaction for first generation students was tested through distributing quantitative questionnaire to first generation college students. For the first generation students surveyed, I found that extracurricular involvement of any kind increases a student' s chance of being satisfied with their experiences. I also found that there was no relationship between involvement and students' likelihood of wanting to remain at the institution. Finally, I found extracurricular involvement creates stronger relationships with others on-campus (students/faculty) .
Key Words
First Generation, College, Involvement, Students' Satisfaction

Burbatt, p. 1
INTRODUCTION
According to national data, first generation students make up between 20%-4 7%
of all college students (Aspelmeier et al. 2012). These first generation college students
have what many researchers call a lack of "college knowledge," meaning they have
limited information about college in general and are likely to have less access to
information from college visits, online sources, and other information compared to their
counterparts. First generation students are also more likely to have low academic self
efficacy, have lower achievement and have lower degree aspirations (US Department of
Education 1998). First generation students predominately are minority students (Black or
Hispanic), come from a low socio-economic status, are usually older than their
counterparts, may have dependent children, and are more likely to be working to help pay
for college (Engle 2007). Involvement in organizations can be seen as an important way
to overcome the barriers faced by first generation college students, as connections on
campus can be seen as a support system. This research will examine the amount of time
spent on involvement for first generation college students and the impact it has on
students' satisfaction with the institution.
LITERATURE REVIEW
Different concepts and definitions exist to define a student as a first generation
college student. Thayer (2000) defines a first generation college student as one who does
not have a parent that has earned a bachelor's degree. Aspelmeier et al (2012) defines
first generation status as having anyone in their immediate family (parents, step-parents,
guardian, or siblings) that has not attended college and has not earned an associates or

Burbatt, p. 2
bachelor's degree. This study, will use Thayer' s definition of a first generation student,
where the student' s parent(s)/caregiver have not earned bachelor's degrees. This is a
common definition throughout the literature on first generation students, as many
researchers do not include siblings or parents having an associate' s degree.
Barriers for First Generation Students
One primary reason that first generation students are at a disadvantage is because
of their parents' own educational backgrounds. Because these parents have not earned
college degrees, they do not have the same level of access to information as parents of
continuing generation students. First generation students' parents have lower levels of
understanding of the importance of college and therefore may not encourage students to
attend college fairs, college visits, and other programs to help students prepare for college
(Engle 2007).
First generation college students' parents may also discourage students or fail to
support them from attending college for a variety of reasons (Striplin 1999). Students in
this position can feel "offspring guilt", feeling guilty for leaving their family, or may be
encouraged to drop out of school to work and help the family (London 1989). This lack
of support can cause a "disjunction of life course" where these students feel a separation
from their families and friends at home while attending college. This alienation of family
support can lead students to doubt academic and motivational ability. Some first
generation students may feel that they are not being supported by their parents and
families, which forces them to create these new relationships and support systems while
away from home. By creating connections on campus, while separating from the
connections at home, these students are more likely to have a successful transition to

Burbatt, p. 3
college (Fisher 2007). Fisher explains, "although the transition was by no means simple
for either group, the complexity of the issues involved in the college transition tended to
be greater among first generation students" (p. 129). According to Perna and Swail's
(2000) research, first generation students' parents play one of the most significant roles in
student's success at any college or university. Because of this, three out of four college
programs have a parent component, while one out of four require parent participation.
These programs seek to bridge the gap for those parents that do not have experience with
college and help first generation parents best support their students. In addition to parent
programs, there are others that target first generation students themselves to help with
their transition to college. Because of the difference in enrollment rates, these students
are one of the most frequently targeted groups (along with minorities and low-income
students) for outreach programs designed to raise the level of student preparation and
readiness for postsecondary work. These early intervention programs attempt to develop
necessary skills, knowledge, confidence, aspirations, and preparation for these students to
be successful in college (Perna and Swail 2000). Because first generation students have
low graduation rates, these programs create more "college knowledge" for incoming
students, while integrating them with their continuing generation student counterparts;
which include freshmen seminar classes. Jamelske' s (2009) research shows that 95% of
4-year institutions have created some type of first year program, including freshman
seminar classes used as an "extended orientation", or a way to supply activities or
resources to first year students, catering to their academic and social needs.
Some universities have begun "First Year Experience" programs designed to
include Learning Communities that create cohorts between first year students that take

Burbatt, p. 4
classes together and get involved in different organizations together. These communities
are considered a small community of peers that focus on various topics such as the
college environment, communication and leadership. These groups participate in
extracurricular activities together and these programs have a varying degree of positive
impact on the retention of the groups involved. Hotchkiss, Moore, and Pitts' (2006) study
shows the positive relationship between Freshman Learning Community and GP A and
retention, including a .34 boost to GPA during the first year that students participated.
The retention of first generation students is another factor that is studied by many
different researchers. As Fisher (2007) explains, there are three things that impact the
success and retention of college students: minority status, socioeconomic status, and first
generation status. Therefore, first generation status is important to look at when studying
retention because it can include all three factors, making these students at an increased
risk of not completing their program. According to Engle (2007), colleges should remove
financial barriers that first generation students may encounter to allow these students to
be successful. This success can be attributed to living on-campus, involvement in
extracurricular activities, interactions with faculty outside of the classroom, and the use
of available resources. Berger and Milem (1 999) show that when students become
involved in formal (faculty) and informal groups (peers) in their first year, it predicts the
likelihood of increased future involvement. They also found that there is a positive
relationship to institutional commitment, integration into campus social and academic
life, and persistence to graduation, which is why involvement is such an important factor
in student' s satisfaction, success, and retention.

Burbatt, p. 5
Satisfaction and Involvement
According to the Integrated Postsecondary Education Data System (IPEDS)
conducted by the National Center for Education Statistics (20 1 3) 4 1 % of students in four
year colleges and universities will not graduate. There are many reasons for this,
including poor academics, low college/degree aspirations, poor study habits, uneducated
parents, or coming from a small town. Only 1 5% of college dropouts are "academic
dismissals'', therefore it is important to look at the other reasons that students may not
remain enrolled at the university (Drew 1 990). Many reasons for voluntary dropouts may
be related to the student's satisfaction with their university and their experiences . For
example, low school commitment and support often paired with family obligations and
pressures are reasons for voluntary dropouts and are especially important when looking at
first generation college students. There is a direct link between student satisfaction with
the university and retention, therefore it is important to look at why students are leaving
the university if it is not academic related.
Research with first generation students usually focuses on academic and social
integration and the impact it has on retention, or the likelihood of a student to persist to
graduation or remain at the university. Academic integration means that students are
spending time outside of the classroom learning, interacting with peers, or interacting
with professors. On the other hand, social integration means students are creating ties on
campus within different groups, both formal and informal (Aspelmeier et al. 20 1 1 , Berger
and Milem 1 999, Engle 2007, and Tym et al. 2004).
Fisher (2007) divides student involvement into three groups or categories: formal
(i.e. extracurricular), informal (i .e. friends), and own-group (i.e. subgroups used often by

Burbatt, p. 6
minority students to adjust to college social life). These types of involvement create a
sense of attachment, belonging, institutional commitment, academic and social
integration, and persistence to graduation. These groups also have more informal or latent
functions, by providing these students with support, advice, and information about
college that they may not be getting elsewhere on campus or from their families at home.
Fisher states, "For all groups, having more formal (extracurricular) and informal (friends)
social ties was positively and significantly related to higher levels of satisfaction" (p.
145). In another study, Aspelmeier, et. al (20 12) concludes that involvement in
extracurricular activities develops a much more positive and strongly associated internal
locus of control for first generation students compared to non-first generation students.
Similarly, Fisher concludes that for minority students, greater involvement in
extracurricular activities reduces the likelihood of leaving college by at least 83%.
Involvement is shown to be important for all students because student's happiness
is dependent on life outside the classroom; however, this may be especially important for
first generation college students that need extra support throughout their college
experience (Peters 1988). One study conducted found that early extracurricular
involvement has a direct effect on positive student satisfaction and retention (Berger and
Milem 1 997). Although it is dependent on the student, Roberts and Styron (201 0) found
that students who do not become socially integrated oftentimes suffer from persistence
issues, as they do not feel connected with the institution. Because Fisher' s research is
specific to minority students, it includes both first generation and continuing generation
students; therefore it is important to conduct research to find the connection between
involvement, satisfaction and ultimately retention specifically for first generation

Burbatt, p. 7
students. Currently, there is study at this university that was conducted to find the
variables that affected retention, however it was not able to include involvement or
satisfaction. My research will address the lack of information about first generation
status, in general, and the importance of involvement on satisfaction.
Hypotheses
Based on this review of literature and the gap within the research regarding the
importance of involvement on first generation college student satisfaction, I test the
following three hypotheses:
• Hypothesis I, Extracurricular involvement of any kind increases a student's
chance of being satisfied with their experiences (thus impacting retention).
Connections and relationships made with others can be seen as a support system
for students.
• Hypothesis 2. If given the opportunity to choose again, students' likelihood of
choosing to attend the same institution will be impacted by involvement.
• Hypothesis 3. Extracurricular involvement will create stronger relationships with
others on-campus (students/faculty).
METHODOLOGY
My methodology, using survey research, follows a common survey process and
examines the relationship between amount of hours involved in extracurricular activities,
students' demographics, and students' satisfaction. Through a convenience sample to
gather data from 1 00 first generation college students, I administered questionnaires to
students at on-campus meetings and classes. My research was conducted using a

Burbatt, p. 8
structured questionnaire adapted in-part from the College Student Experience
Questionnaire (CSEQ) to gather information from first generation college students at
Eastern Illinois University (EIU) (Pace and Kuh 1 998).
Variables and Measurement
College student satisfaction has been previously measured in various ways; for
example, Fisher (2007) uses a five-item model including indicators of a student's degree
of confidence in their choice of a school, importance of graduating, level of satisfaction
with social life, level of satisfaction with intellectual development, and rating their
overall experience. Berger and Milem ( 1 999), using the Early Collegiate Experiences
Survey (ECES) and the Freshman Year Survey (FYS) to measure satisfaction and social
integration, created a list of 10 items asking whether students agreed or disagreed with
the different statements. These statements focus on the impact of interpersonal
relationships, ability to make friends and have support, and interactions and relationships
with faculty members. To measure involvement, Berger and Milem's used indicators
such as how often students have involvement with faculty, other students, peers, groups,
and non-involvement.
For this research, based on portions of the College Student Experience
Questionnaire (CSEQ)1, I ask students to self-report on their experiences across three
categories: (a) amount of time and energy (effort) they devote to various activities; (b)
their perceptions of their institution' s environment; and (c) gains from attending college
(Koljatic and Kuh 2001 ). Involvement has been previously measured using the College
Student Experience Questionnaire to consider how much time is devoted outside of class
1 The full questionnaire for this research is attached as Appendix B.

Burbatt, p. 9
to things such a studying, groups, and work (Pace and Kuh 1 998). Pike and Kuh's (2005)
study on engagement and intellectual development and Koljatic and Kuh's (200 1 )
research on student engagement have both used the CSEQ to measure student' s
experiences and satisfaction with their university. When creating the CSEQ, the writers
challenged the common assumption that demographics were the most important
determinants of college success and ultimately retention. They argue that demographics
alone cannot predict success, and that student experiences and engagement play a large
role in student success and positive outcomes. (Gonyea, Kish, Kuh, Muthiah, & Thomas
2003).
Researchers encourage universities to study not only "direct learning outcomes"
but also student behavior and experiences; which the CSEQ combines both types of
research. In Pike and Kuh' s (2005) research, they found that first generation students
overall are likely to be less engaged and are "less likely to successfully integrate diverse
college experiences" (p . 289). Using the CSEQ, the first generation students responding
to the study reported that they perceived the college environment as less supportive. Also,
they found that females, minorities, students planning to pursue advanced degrees and
on-campus students tend to be more engaged than their counterparts.
Primary variables. The primary independent variable for this study is extracurricular
involvement, while the dependent variable is student satisfaction. Involvement is
measured by the amount of hours spent in extracurricular activities, collapsed into the
categories less than five hours per week and more than five hours per week.
To measure student's level of satisfaction, the dependent variable, two primary
questions from the CSEQ were used: "How do you like college?" with answers ordered

Burbatt, p . 1 0
from " I am enthusiastic about it" to " I don't like it"; and second "If you could start over
again, would you go to the same institution you are now attending?" with possible
responses ranging from "yes, definitely" to "no, definitely".
To further measure student's satisfaction I also addressed questions from the
CSEQ called "the estimates of gains", where respondents were asked to report the
amount of progress/gains in particular areas, from developing values, understanding of
self, developing ability to get along with others, ability to function in a group, learning
about ideas and finding information, and adapting the change. These gains were used to
determine what amount of support systems first generation students have at this
institution.
I use four categories of questions contained in the CSEQ to further measure
aspects of the dependent variables of student involvement: experiences with faculty,
clubs and organizations, personal experiences, and student acquaintances.
I asked respondents to think about their experiences and what qualities are
emphasized. These questions help measure student involvement and student satisfaction.
These questions include: academic and intellectual qualities, aesthetic and expressive
qualities, critical and analytical qualities, human diversity, information literacy,
vocational and occupational competence, and personal relevance. If students felt that
certain qualities are emphasized over others, it helps show areas that can be worked on by
the In addition, I asked respondents to rate different relationships to people during their
time at college. The respondents rated each relationship, including relationships with
other students, with administrative personnel/offices, with faculty members, within
organizations and clubs, and finally relationships with family members at home, on a

Burbatt, p. 1 1
scale from 1 (least supportive) to 7 (most supportive). This section measures the support
students are receiving, and shows if they are getting most of their support from home or
on-campus, and if there is a balance or a disjunction of family support.
I also collected multiple demographic characteristics of my respondents including
the student' s age, sex, race, status as an on- or off-campus resident, and class standing.
Further, these were combined with self-reported grades, major of study, current credit
hour enrollment, time spent on academic, employment, and social activities, and whether
they are a first generation college student. I will also take into consideration the variation
by class rank (freshmen, sophomores, juniors, seniors), as first year students are likely to
have less hours of involvement than senior students. Demographics are collected to
measure what variables have an impact on satisfaction.
Methods of Analysis
I administered the questionnaire to 1 00 first generation college students. The
questionnaire took students approximately 5 - 10 minutes. To reach students, I visited on
campus organization meetings and received approval to visit different classes on-campus
to recruit first generation students to participate. Once collected, my data was coded and
entered into SPSS in order to test my research hypotheses.
To consider relationships between respondent demographics and satisfaction, I
have examined bivariate tables of students' satisfaction based on sex, class standing, race,
living arrangements, majors, and time spent on involvement. To test my hypotheses, chi
square tests were run using SPSS to test the null hypothesis of independence of each
dependent variable on students' satisfaction. Other dependent variables that were
analyzed using chi-square tests were relationships (both on-campus and off-campus),

Burbatt, p. 12
experiences with faculty, clubs and organizations, personal experiences, and student
acquaintances. I reject the null hypothesis when the significant value is less than or equal
to p=0.05. Cramer 's V tests of the strength of the association between dependent and
independent variables were used ifthe null hypothesis of independence was rejected.
The Cramer 's V, as a measure of the strength of bivariate relationships, is considered
'weak' if V is between 0.00 and 0. 10, 'moderate' if between 0. 1 1 and 0.30, and 'strong' is
greater than 0.30; further, I reject the null hypothesis of no association if the significance
value is less than or equal to p=0.05.
Research Site
Eastern Illinois University is a primarily undergraduate state university located in
Charleston, Illinois. Established in 1 895 as the Eastern Illinois State Normal School,
Eastern Illinois University gradually expanded into a comprehensive university with a
broad curriculum, including baccalaureate and master 's degrees in education, business,
arts, sciences, and humanities (Eastern Illinois University 20 14). Overall, in 201 2, EIU
was made up of 8,975 undergraduate students, and had a graduation rate of 60%. Of these
students, 5 ,3 1 6 (59%) were females while 3 ,659 (4 1%) were male. By class level, 1 ,941
( 1 8 .6%) were freshmen, 1 ,694 ( 1 6.3%) were sophomores, 2,229 (2 1 .4%) were juniors,
and 3 , 1 1 1 (29.9%) were seniors. Based on the category race/ethnicity, 7,659 (73 .52%) are
White, 1 ,580 ( 1 5 . 1 7%) are Black or African American, 399 (3.83) are Hispanic/Latino,
1 52 ( 1 .46%) are International Students, 1 53 ( l .47%) identify as two or more races, 94
(.9%) are Asian, 27 (.26%) are American Indian/Alaska Native and 344 (3 .30%) are
unclassified. Broken down by major, 1 ,622 are in the College of Arts & Humanities,
2,302 in Lumpkin College of Business & Applied Sciences, 2,904 in the College of

Burbatt, p. 1 3
Education and Professional Studies, 2,55 1 in the College o f Sciences, and 1 ,038 as other
(Eastern Illinois University 2012).
In 20 1 1 , the incoming first-year class at Eastern I llinois University (EIU) was
made up of 48% first generation students, with an overall estimate of the first generation
population across all class statuses at 42%. In 201 2, the incoming freshman class was
made up of 40% first generation students. This university currently has multiple
programs in place to help first generation students such as Hall Council and the Panther
Success Initiative to connect students on individual Leaming Communities, or residence
hall floors. EIU has also implemented a first year seminar class titled University
Foundations, which assists first year students in their transition to college. During
orientation, New Student Programs puts on a Parent Program, discussing transitioning to
college life, what to expect with the transition, academic resources provided for students
and how to best support their students.
RESULTS
In the following section, the results of this analysis are first described by
exploring the demographic characteristics of the questionnaire respondents. Next, based
on self-report data, I outline the responses for each independent and dependent variable
prior to considering each specific hypothesis in detail . This is followed by other
exploratory findings, which emerged from running exploratory crosstabulations.
Demographic Profile of Respondents
Based on the distribution of this convenience sample of 1 00 first generation
college students' "sex'', the majority 63% responded "female" (see table 1 ). In terms of

Burbatt, p. 14
class standing, 47% of respondents identified as seniors (see table 2). When responding
to the question "Did you start here?'', 69% ofrespondents indicated that they started their
college career at the current institution, while the remaining 3 1 % transferred from
another institution (see table 1) . In terms ofracial or ethnic identification, 57. 1 %
respondents identified as Caucasian (see table 3) . The most typical respondents were
Caucasian, female, senior students who started at the institution.
When prompted to explain where they lived, 36% of respondents identified they
live on-campus, and 58% identified as living off campus in a residence within walking
distance or driving distance (see table 2). Respondents reported holding a wide variety of
majors; the most, 39% of total responses, identified their area of study is within the
"Social Services" category. This can likely be attributed to the fact that the questionnaire
defines "Social Services" with wide range of examples including "anthropology,
economics, political science, psychology, sociology, etc." which are considered common
majors at the institution (see table 4).
Open-Ended Self-Report Demographics
In terms of academics, respondents were asked to report the amount of hours per
week they spent on course work. The most common response by respondents (52%)
indicated that they spent 6- 1 0 hours per week on academics, while 20% indicated that
they spent 5 or fewer hours per week on academics (see table 5).
Participants were also prompted to report the number of hours per week they
spent working in on-campus and/or off-campus jobs. One-half (50%) ofrespondents
reported that they do not have a job on-campus, while 2 1% ofrespondents indicated that
they worked 1 1 -20 hours per week in on-campus employment. The vast majority (78%)

Burbatt, p. 1 5
o f respondents indicated that they do not have an off-campus job, though 7% responded
working 1 1 -20 hours and an additional 7% responded 2 1 -30 hours per week off-campus
(see table 6).
Finally, as the primary independent variable, participants were asked to report the
number of hours per week they spent on extracurricular activities (clubs and
organizations) in an effort to measure participants' involvement. Of the 1 00 respondents,
45% responded that they spent fewer than 5 hours per week in extracurricular activities
and 53% responded involvement over 5 hours per week (see table 7). I measure
extracurricular involvement based on the amount of hours engaged in clubs/organizations
on campus. My questionnaire originally measured the amount of hours using the
responses: 5 or fewer hours per week, 6- 1 0 hours, 1 1 - 1 5 hours, 1 6-20 hours, 2 1 -25 hours,
26-30 hours, more than 30 hours. This was ultimately collapsed to the two responses: 5 or
fewer hours per week and more than 5 hours per week. The responses were collapsed into
these two categories to make a distinction between students that were involved compared
to students that were minimally involved or not at all active. There were 45 (45 .9%)
respondents who indicated they were involved less than 5 hours per week, while the other
53 (54. 1 %) respondents indicated they were involved more than 5 hours per week (see
table 7).
To measure the dependent variable students' satisfaction, I used two opinion
questions, "how well do you like college" (Opinion 1 ) and "If you could start over again,
would you go to the same institution you are now attending" (Opinion 2). For the
question "how well do you like college", 40 (41 %) indicated that they are enthusiastic
about it, 4 7 ( 48%) indicated they like it, 7 (7%) indicated they are more or less neutral

Burbatt, p. 1 6
about it, and 3 (3%) indicated they don't like it. For Opinion 2 , "If you could start over
again, would you go to the same institution you are now attending", 43 (45%) indicated
they would definitely return to the institution, 33 (34%) indicated they would probably
return to the institution, 1 3 ( 14%) indicated they would probably not return to the
institution, and 7 (7%) indicated they would definitely not return to the institution (see
table 8).
Chi-Square Test of Independence
Hypothesis 1: Extracurricular Involvement on Satisfaction. My primary
hypothesis is that time spent on involvement of any kind increases a student' s chance of
being satisfied with their experiences (thus impacting retention). Fundamentally,
satisfaction with the university reported by first generation college students should be
dependent on their extracurricular involvement in student organizations. Therefore,
students who were more satisfied would have higher levels of involvement as measured
by the number of hours per week spent in any type of activity. Using a crosstabulation of
97 valid responses between the number of hours involved per week on satisfaction with
the university, statistical dependence is found in the conditional distribution of
involvement per week on satisfaction (x2=8.445; df=3 ; p=0.038) (see table 9). Therefore,
I reject the null hypothesis of independence and estimate that students' satisfaction
depends on the number of hours per week engaged with extracurricular activities. In
addition, using Cramer's V symmetrical measure of association, a significant moderate
association is found (V=.295 ; p=0.038); for the first generation students who participated,
satisfaction with the university is significantly associated with time spent per week
Burbatt, p. 17
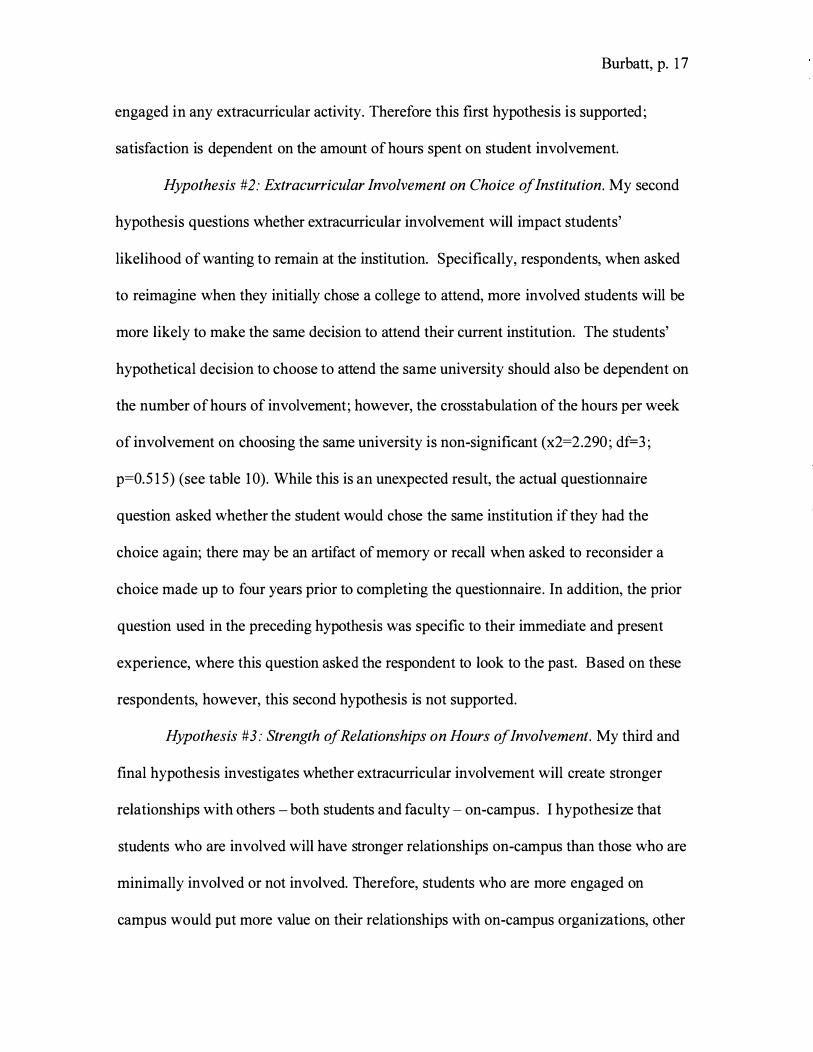
engaged in any extracurricular activity. Therefore this first hypothesis is supported;
satisfaction is dependent on the amount of hours spent on student involvement.
Hypothesis #2: Extracurricular Involvement on Choice of Institution. My second
hypothesis questions whether extracurricular involvement will impact students'
likelihood of wanting to remain at the institution. Specifically, respondents, when asked
to reimagine when they initially chose a college to attend, more involved students will be
more likely to make the same decision to attend their current institution. The students'
hypothetical decision to choose to attend the same university should also be dependent on
the number of hours of involvement; however, the crosstabulation of the hours per week
of involvement on choosing the same university is non-significant (x2=2.290; df=3;
p=0.5 1 5) (see table 1 0). While this is an unexpected result, the actual questionnaire
question asked whether the student would chose the same institution if they had the
choice again; there may be an artifact of memory or recall when asked to reconsider a
choice made up to four years prior to completing the questionnaire. In addition, the prior
question used in the preceding hypothesis was specific to their immediate and present
experience, where this question asked the respondent to look to the past. Based on these
respondents, however, this second hypothesis is not supported.
Hypothesis #3: Strength of Relationships on Hours of Involvement. My third and
final hypothesis investigates whether extracurricular involvement will create stronger
relationships with others - both students and faculty - on-campus. I hypothesize that
students who are involved will have stronger relationships on-campus than those who are
minimally involved or not involved. Therefore, students who are more engaged on
campus would put more value on their relationships with on-campus organizations, other

Burbatt, p. 1 8
students, and faculty members. Using a crosstabulation of 98 valid responses between the
number of hours involved per week on the relationship with their student club(s) or type
of involvement, statistical dependence is found in the conditional distribution of
involvement on respondent' s relationships with organizations and clubs/involvements
(x2= 1 9. 174; df=6; p=.004) (see table 1 l a) . Therefore, I reject the null hypothesis of
independence and estimate that students' relationships within their organizations depend
on their amount of hours spent on involvement. In addition, using Cramer's V
symmetrical measure of association in the strength of this dependent relationship, a
significant strong dependence is found (V=.442; p=0.004), showing that for first
generation students who participated, relationships and networks within their
involvement are important to these students and should therefore be emphasized.
Hours of involvement and relationships with other students. In terms of
relationships on campus, I also hypothesized that relationships with other students would
be ranked higher for students that spent more hours on involvement. Using a
crosstabulation of 98 valid responses, I found statistical dependence in the conditional
distribution of involvement on respondent's relationships with other students at the
university (x2=1 4.045; df=6; p=0.029) (see table 1 l b) . Therefore, I reject the null
hypothesis of independence and estimate that students' relationship with other students
depends on their amount of hours spent on involvement. In addition, using Cramer's V
symmetrical measure of association in the strength of this dependent relationship, a
significant strong dependence is found (V=.379; p=0.029). This shows that
extracurricular involvement impacts relationships with all students, not just other students

Burbatt, p. 19
that are involved. As previous literature has stated, this can be due to the connections
formed on-campus, as well students' commitment to the institution.
Hours of Involvement on Interactions with Faculty. Finally, I hypothesized that
the respondents' relationship with faculty is also dependent on the amount of the
involvement. However, the amount of hours engaged in extracurricular activities and
their relationship with faculty is non-significant (x2=2. 1 95 ; df=6; p=.90 1 ) (table 1 l c).
While this was not expected, this can be due to the fact that students may see
involvement as having limited interactions with faculty members. Also, depending on the
organization, students may have interactions with only one faculty member (the advisor
of the organization) and therefore the relationship with one faculty may not be
representative of their relationship with all faculty members on campus, as the question
states.
While I did not find statistical dependence of extracurricular involvement in
relationship with faculty on-campus, I did find a marginal dependence between
involvement and socializing with faculty members. To measure socializing with faculty
members, respondents were asked how often they "socialized with a faculty member
outside of class", with possible responses ranging from never to very often (meaning the
most likely to do so). Using a crosstabulation of 97 responses between the number of
hours involved per week on the likelihood of socializing with faculty outside of class,
marginal statistical dependence is found in the conditional distribution of involvement on
socializing with faculty (x2= 7.396; df=3 ; p=.060) (see table 1 ld). Therefore, I reject the
null hypothesis of independence with 90% confidence and estimate that students'
socialization with faculty depends on their involvement. Using Cramer's V symmetrical

Burbatt, p. 20
measure of association in the strength of this dependent relationship, a marginally
significant moderate dependence is found (V=.276; p=.060). While this was estimated
with 90% confidence, it is important to look at the results of this relationship. I found that
students who are more involved (over 5 hours per week) are more likely to respond that
they "often" or "very often" socialize with a faculty member outside of class.
This is important because relationships with faculty that are formed outside of
class commonly increase a students' likelihood of being successful as well as being
retained (Cox, Mcintosh, Terenzini, Reason, Lutovsky Quaye 201 0). This relationship
shows the importance of involvement, because the levels at which students are
involvement could create more opportunities to socialize with faculty outside of the
classroom. For example, the university has the Faculty Fellow program in place, which
connects faculty members to different residence halls on campus to form these
connections outside of the classroom.
Hours of involvement and relationships with family. Finally, the amount of hours
engaged in extracurricular activities compared to relationships at home was also non
significant (x2=1 .776; df=6; p=.939) (see table 1 le). This was an expected result, as it is
unlikely that involvement would impact relationships with family at home.
Other Exploratory Findings
Students' Satisfaction on Choice of Institution. While I thought there would be a
relationship between the respondents' satisfaction with the institution and when asked to
start over again, they would choose to go to the same institution, there was no
relationship. Students who responded enthusiastically about their college were more
likely to respond they would definitely return to the institution; this shows a very strong

Burbatt, p. 2 1
commitment of students that are satisfied with their experience. However, students who
did not respond enthusiastically have varied responses. For example, there were no
students that responded that they were "more or less neutral about it" [college] that
followed up with the answer "no, definitely" [they not would return]. Also, of the 3
students who responded, "I don't like it" to the question of their satisfaction, 1 stated that
"probably yes" they would return, and 2 "probably no" they would not return to the
institution. This suggests that students who are not committed to the institution are less
likely to be confident in their decision to return; however, this is based on only 3
respondents. Overall, respondents who had high enthusiasm had a higher likelihood of
returning.
Dependence of Student Satisfaction on Demographics. For the first generation
students involved in this study, I found that student satisfaction is only dependent on two
demographic characteristics: year in school and extracurricular involvement. This
strengthens the argument that extracurricular involvement is extremely important to
satisfaction as well as retention to the university, especially for first generation college
students.
Using a crosstabulation of 99 valid responses between year in school on
respondent's satisfaction with the university, statistical dependence is found in the
conditional distribution of class standing on satisfaction (x2=22. 1 54; df=12; p=.036) (see
table 1 2). Therefore I reject the null hypothesis of independence and estimate that
students' satisfaction depends on their year in school. This could be due to the fact that
students who are at the university longer are more likely to be involved. Also, students
who are juniors or seniors may be more committed to the institution, as they have been

Burbatt, p. 22
retained thus far. In addition, using Cramer's V symmetrical measure of association in
the strength of this dependent relationship, a significant moderate dependence is found
(V=.273 ; p=.036).
On the other hand, I did not find statistical dependence in the relationship between
respondent' s satisfaction with the university and conditional distribution of other
demographic characteristics supported in the literature including sex, living on or off
campus, or grades (see table 1 3a, b, c). One notable insignificant result, prominent in
previous literature, has stated the importance of minority status on students' satisfaction. I
theorized that minority status in terms of race would be a predictor of students'
satisfaction, however, the crosstabulation of race (even when the categories were
collapsed in to white and non-white) on students' satisfaction is non-significant
(x2=2.842; df= 3 ; p=.417) (see table 14) . While this was unexpected and did not match
the literature, it is an area of further study.
Dependence of Involvement on Personal Experiences. I hypothesized that
extracurricular involvement of any kind would impact the personal experiences of
students on campus. However, I did not find many direct relationships. Most important to
satisfaction, when asked if they have "taken a test to measure your abilities, interests, or
attitudes", I found that students who are more involved are much more likely to take
these reflective tests. Using a crosstabulation of 98 responses between the number of
hours involved per week on the likelihood of taking a test to measure ability, interests, or
attitudes, statistical dependence is found in the conditional distribution of involvement on
taking a reflexive test (x2= 8.847; df=3 ; p=.03 1 ) (see table 1 5). I reject the null
hypothesis of independence and estimate that students' likelihood of reflecting on their

Burbatt, p. 23
abilities, interests, or attitudes depends on their time spent on involvement. Using
Cramer's V symmetrical measure of association in the strength of this dependent
relationship, a significant moderate dependence is found (V= .300; p= .03 1 ) . This leads
me to further hypothesize that students who are involved are more likely to take more
time to reflect on their own strengths and weaknesses compared to those who are not
involved on-campus. This further communicated that students who are more involved
may take more time to reflect on their experiences and successes both inside and outside
of the classroom.
DISCUSSION
Summary of Findings
Hypothesis I. I found that there is a relationship between extracurricular
involvement and students' satisfaction. The impact of involvement of satisfaction can be
due to a variety of factors, but based on previous literature by Fisher (2007) and
Aspelmeier et al . (20 1 2), I theorize that this has something to do with the connections
formed on campus, resources that are available to students through their involvement, and
the support system these students may have on-campus compared to their connections at
home. Also, students' involvements may impact their relationships, making stronger
connections on campus. Some of these resources could include the Counseling Center,
the Health Education Resource Center, and other individuals or organizations that often
visit on-campus organization meetings.
Hypothesis 2. I found that there was no dependence between student involvement
and the likelihood of choosing to remain at the institution if given the decision again.

Burbatt, p. 24
These results can be due to a variety of factors, however, I hypothesize it has to do with
the wording of the question. In future research, this question can be measured
qualitatively rather than quantitatively to find out why students answer the way that they
do.
Hypothesis 3. I found that extracurricular involvement impacts relationships with
clubs/involvement including that for students who are not involved. The relationship with
faculty members was not dependent on involvement, however there was a relationship
between extracurricular involvement and the likelihood of socializing with faculty
members outside of the classroom. These relationships are all important to first
generation students' success at the institution. There was no relationship between
involvement and relationships with family at home. This was expected, but it would be
beneficial to measure quantitatively, comparing the relationships and amount of support
received on-campus versus off-campus.
Limitations
One limitation of my study is the small number of respondents, especially using
convenience sampling, I was only able to survey 100 respondents. By only having 100
respondents, it is hard to generalize to the entire population at Eastern Illinois University
or other institutions. Additionally, with a small sample size, many crosstabulations
contain cell sizes less than the recommended minimum of five. While there was statistical
dependence for my main hypothesis, it would have been strengthened with a larger
number of respondents and conducting more robust tests to correct for small test sizes.
Also, to find this sample, I reached out to professors on-campus in order to visit their
classes and distribute questionnaire to their students at the end of the class session. By
Burbatt, p. 25
doing this, I am primarily surveying students who attend class, whether it is regularly or
on the day that I surveyed. With that being said, it would be very hard to reach students
who do not attend class; but if I were to do that, I may have gathered data with more
varied responses for students' satisfaction.
Another limitation is that I only surveyed first generation college students,
therefore there was no comparison between first generation students and continuing
generation students. If I had respondents that were not first generation students, I would
be able to compare the relationships and satisfaction between groups to find differences. I
see this is an opportunity for future research, to look at the difference between first
generation students and continuing generation students.
The original goal of my research was to conduct my study using a multi-modal
questionnaire combining a standardized questionnaire with supplemental qualitative
items. The interviews conducted would build on what is demonstrated in the quantitative
data I gathered regarding student involvement, satisfaction and retention. It would have
been beneficial to use a mix of structured interview questions to capture precise data to fit
into pre-established categories, while supplementing that with unstructured interviews in
an attempt to understand complex behaviors (Denzin & Lincoln 2003). According to
Bryman (2006), combining qualitative and quantitative data can help researchers fully
explain what they want to find and makes it easier for researchers to clearly write about
findings. One reason for combining both types of research is for development, using the
results of one method to further develop the other. Other reasons would be initiation,
elaborating and enhancing both methods, or expansion, which increases the amount of
information gathered through multiple methods (Bryman 2006). While conducting both

Burbatt, p. 26
methods would have been beneficial, one limitation was access to students and time.
Interviews were set up; however, students cancelled and it would be difficult to set up
new times. In future work, the importance of including a qualitative portion should take
precedence.
Reflecting on the question, "if you could start over again, would you go to the
same institution you are now attending", and how it is used to try to measure students'
opinions and satisfaction, I think it would have been more beneficial to ask this in a
different way. Because the question prior to this on the questionnaire asks about present
views, and this question asks students to look back and decide on a decision made in the
past, I do not think that this ordering gave me the best results. For example, I could have
asked, "are you planning to stay at the institution", "if you answered 'I am enthusiastic
about it' or 'I like it' do you like it enough to stay at the institution?" or "if you answered
'I don't like it' do you dislike it enough to leave". Also, this question would have worked
much better with more qualitative information rather that quantitative. This question
would gather much more information if it asked students "why".
Looking back at students' relationships, it is hard to quantitatively measure
relationships. While the questionnaire asks if they are supportive or unsupportive (see
attached questionnaire), it would be more beneficial to have a qualitative measure of
these relationships. For example, interview questions could have gone more in depth to
ask about supportiveness, communication, and for explanations of their relationships,
rather than using a scale. This would be beneficial in supporting my hypotheses.
Recommendations

Burbatt, p. 27
It is important to look at the specific support system first generation students may
have created on-campus compared to their support systems and connections at home.
Usually, students that get involved on-campus become involved in organizations that are
of interest to them. These organizations most likely have other students that have similar
interests or who may be going through similar experiences. These connections may be
supportive and may give first generation students a network of support on-campus. This
type of support can mirror that found for minority groups on campus, for example
organizations such as the African Student Association, Latin American Student
Organization, and PRIDE. These groups form a network of support for students
members, first generation or not, that balances the lack of support they may not be
receiving from their family/connections at home.
Students' involvement in organizations may impact their on-campus relationships
allowing them to make stronger connections outside of class- meaning that there is more
interaction involved than in a typical lecture style classroom. This is also a way to get
students outside of their residence halls/homes and outside of class to form relationships.
As I argue, these stronger relationships will create satisfied students.
To connect these students, there are different things that the institution can do. For
example, it can be mandatory for students to take EIUI 1 1 1 , the first year seminar course.
Currently, this first year seminar class is only mandatory for students in the Gateway
program, and it is highly encouraged for all student-athletes. The course is designed as an
introduction to college course, where students learn the basics of college- time
management, classes, getting involved, values, diversity, and a multitude of other topics
with the goal of creating successful and retained students. A co-team of teachers, either
Burbatt, p. 28
two staff members on-campus or a staff member paired with a Peer Leader, usually teach
the class. Peer Leaders are junior or senior level students who are highly involved on
campus and act as mentors for the first-year students. In this course, first year students
are encouraged to attend Pantherpalooza, which is an event hosted on campus that
displays different Registered Student Organizations (RSOs) including what they do,
when meetings are, and how to join. Students research an organization that is of interest
of them to complete the project. Students are required to go to one meeting for the
organization and report back to the instructor with the goal that the students will continue
their involvement. Students who are getting involved earlier on are more likely to stay
involved, therefore increasing their likelihood of being satisfied. This is just one way to
help first year students, specifically first generation students, network and form these
connections early on in their college experience.
I found that students who are involved on campus are likely to have stronger
relationships not only with students within their organizations, clubs, or means of
involvement, but also in general with other students on-campus. This can be because
students who are involved create different networks throughout campus, which helps
them to meet new people. These students may also feel more invested in the university
and a sense of belonging, and therefore they may be more likely to reach out to other
students that they do not know.
While there was no dependence of involvement on relationships with faculty, I
did find dependence on socializing with faculty members along with other students. I
think that it is important to establish or sustain programs that foster these connections
between faculty and students outside of the classroom, to help with students' success. It

Burbatt, p. 29
would be beneficial to form these connections through involvement, whether it is
programming or other initiatives in organizations to connect with faculty.
As I have found with hypothesis three, students who are involved are more likely
to have stronger relationships. This is important because of networks and mentoring on
campus. If students have networks and mentors on campus, they are more likely to be
successful. One way I would recommend the university form these relationships is
implementing different programming through Housing & Dining Services. Something
that can be adopted from other institutions (Clemson University 2014, UNC Charlotte
20 14, University of Kentucky 20 1 3) is forming First Generation Learning Communities,
which would connect students who are going through similar experiences. This program
would allow for opportunities to academically provide workshops, study sessions, faculty
interactions, Resident Assistant involvement and support, as well as possible advising.
Socially, students would get the opportunity to get more involved, thus increasing
satisfaction. Students would also have opportunities for peer mentoring, leadership
positions, social activities, outings, and support (Clemson University 2014).
Other programs and initiatives that could be implemented are study halls and
mentoring outside of the Gateway Program and TRiO program. The Gateway program at
EIU is a program that targets first generation students that have low ACT test scores.
TRiO is a program that targets first generation students who are part of minority groups
or are from low-income backgrounds. Creating programs specifically for first generation
college students would be beneficial on campus. Workshops, tutoring, guest speakers,
career exploration opportunities, off-campus excursions, newsletters, and social activities

Burbatt, p. 30
(Clemson University 20 14) are all things that should not only be offered but emphasized
for first generation students.
The University of Central Florida's Multicultural Academic & Support Services
offers a program titled "First Generation Speaker Series", which presents inspirational
and motivational speakers from diverse backgrounds who have "excelled in their
academic and professional fields, which also engaging with and giving back to their
community" (University of Central Florida 20 14). This is something that can be adapted
to EIU, including student and faculty panels to help first generation students.
It would be informative and interesting to qualitatively study the difference
between relationships at school compared to relationships at home for first generation
college students. There is little research on the difference between these relationships,
however, based on my findings, they both strongly influence first generation college
students experiences.
My findings also show that students who are enthusiastic about college are
strongly committed to their decision to return to the institution; however, students who
are not as enthusiastic are more likely to have mixed results for whether they would
return to the institution if they had to make the decision again. These results show the
importance of commitment of the students at an institution. For instance, there should be
a strong focus early on helping students who are less involved become connected to the
institution to increase their chances of being satisfied and choosing to return if given the
choice. This can be done through open houses emphasizing the small campus feel and the
ability to easily get involved. I also recommend that the university, through orientation,
New Student Programs, and Housing combined, make an effort to connect first

Burbatt, p. 3 1
generation college students to on-campus involvement early on to promote their success
and satisfaction.
It is important to connect with the students who are not completely committed to
the institution. One way this is already being addressed is utilizing the "I am EIU"
campaign on campus. This campaign i s used to make students feel committed to the
institution and gives students a sense of ownership in the fact that they are EIU students.
Creating a sense of pride, especially in different majors, may see an increase in
organization involvement specific to students' majors or areas of interest.
It is interesting that when looking at the impact of involvement on personal
experiences, there was no dependence for the statements, "told a friend or family member
why you reacted to another person the way you did", "discussed with another student,
friend, or family member why some people get along smoothly, and others do not",
"asked a friend for help with a personal problem", "read articles or books about personal
growth, self-improvement, or social development", "asked a friend to tell you what he or
she really thought about you'', and "talked with a family member, counselor, or other
staff member about personal concern". However, this is informative, because these are
things that students should be gaining experience in throughout their college career.
Perhaps students do not see these as gains, or maybe they are unrelated to extracurricular
involvement, or perhaps this is something that could be important to extracurricular
involvement. While this is specific to each person, advisors and mentors on campus can
reach out to students to create more opportunities for these gains. The Office of Faculty
Development can create a mentoring program or initiative on campus to create these
relationships. Faculty members can also be encouraged to use that as an avenue for

Burbatt, p. 32
faculty development, which includes learning how to create a mentor/mentee relationship
with more students on-campus through workshops or simply intentional conversations.
While the university may have similar programs in place, there is much room for
improvement. This includes better publicizing these programs on-campus to make sure
that students are aware of these opportunities. Even a simple search of the EIU homepage
does not give information on first generation students. When searching "first generation
students", nothing about programming or resources is displayed. If this is changed, this
information would be more accessible to the over 40% of students that are first
generation students on campus. Boston University (201 4) has even created a Facebook
page for first generation students, "Boston University- University Service Center- First
Generation Students," to make these announcements and to keep students informed. A
Facebook group can be implemented or other technological platforms; from an EIU First
Generation app or a series of links/resources that are available to students on the mobile
EIU page.
Some schools also focus on the parents of first generation students. For example,
Chapman University suggests that students "provide your family members with an idea
of what college is like by sharing with them your daily activities and let them know how
they can best support you!" on their website. By doing this, students are encouraged to
help their parents understand college, their experiences, and the amount of effort required
to pursue a degree (Chapman 2014). Chapman' s website also provides a checklist for first
generation students' parents with information and resources. Parents are encouraged to
attend orientation to learn more information, and it gives information on important
paperwork. They are also encouraged to educate themselves on resources, to further help

Burbatt, p. 33
their students, be understanding that students will not have the same amount time to
devote to their family, and finally to be patient with themselves and their students since it
is a learning process. This website also includes different things current first generation
students at the institution wish their parents would know- which is a way to education
parents with past experiences. This information should be easily accessible to parents of
first generation college students.
While the institution runs "predictor" tests on students, one thing that is not
included is the level of on-campus involvement. These current predictors are first
generation status, minority status, amount of needs met, and a variety of other factors.
While it would be hard to measure the amount of involvement, it might be beneficial to
measure whether or not students are involved or not (condensed to 2 responses). By
doing this, the institution can see on-campus involvement as a predictor of future students
success and satisfaction. If on-campus involvement becomes a variable that is a predictor,
the university can begin to implement new programs and initiatives to connect students
on-campus.
Future Research
Future research can compare first generation students to their continuing
generation students to find similarities and differences. These differences will emphasize
needs of first generation students that should be met by the institution. Preforming a
comparison will highlight factors that are important for first generation students.
Research can also look at relationships that first generation students have. As I
stated earlier, it would be beneficial to qualitatively measure relationships that students
have. Instead of having students rate their relationships, students would be able to

Burbatt, p. 34
describe their relationship, how they feel about the relationships, and things that the
students feel could be improved about these relationships. These qualitative responses
would help clearly define relationships rather than using a rating system of one to seven,
where it is hard to define what a seven is for all participants.
Finally, it would be beneficial to look at the types of involvement, whether it is
service, leadership, or academic, and how that involvement plays into students'
satisfaction. For example, students who are involved in academic groups may be more
likely to interact with faculty and therefore be more satisfied, compared to students that
are involved in other types of organization on-campus.

Age 17 or
Sex
Male 37 (37) Female 63 (63)
( 1 00)
APPENDIX A: FREQUENCY TABLES
Table 1 : Demographics Did you begin here?
Started Here 69 (69) Transferred from another institution 3 1 (3 1 )
Burbatt, p . 35
*figures are reported in percentages; actual numbers reported in parentheses
Table 2: Demographics, cont.
Classification Where do in college you live?
0 (0) First Year 9 (9) On-campus 36 (36) younger housing
1 8
1 9
20
2 1
22 23 24 or older
5 (5) Sophomore
1 4 ( 1 4) Junior
1 5 ( 1 5) Senior
27 (27) Graduate Student
1 9 ( 1 9) 1 3 ( 1 3) 7 (7)
(100)
1 6 ( 16)
27 (27)
47 (47)
1 ( 1 )
(100)
Fraternity/ 6 (6) Sorority House
--Residence within 40 (40) walking distance
Residence within 1 8 ( 1 8) driving distance
(100)
*figures are reported in percentages; actual numbers reported in parentheses

Burbatt, p. 36
Demogra(!hics, cont. Grades Credit Hours
A 14 (14) 7- 1 1 2 (2)
A-, B+ 30 (30) 12- 14 28.3 (28) B 22 (22) 1 5- 16 54.5 (54)
B-, C+ 30 (30) 17 or more 1 5 .2 ( 1 5)
C, C-, or lower 4 (4) (98)
( 100)
*figures are reported in percentages; actual numbers reported in parentheses
Table 3: Racial or Ethnic Identification
Race Race
(collapsed)
Asian or Pacific Islander 2.0 (2) White 42.9 (42) Black or African American 29.6 (29) -Caucasian (other than Hispanic) 57. 1 (56) Non-White 57. 1 (56) Mexican American 5. 1 (5) Puerto Rican 1 .0 ( 1 ) (98) Other Hispanic 1 .0 ( 1 ) Mixed Race (non-white) 4. 1 (4)
(98)
*figures are reported in percentages; actual numbers reported in parentheses

Table 4: Major
Agriculture
Biological Sciences (biology, Biochemistry, botany, zoology, etc.)
Business (accounting, business administration, marketing, management, etc.)
Communication (speech, journalism, television/radio, etc.)
Computer and information services
Education
Engineering
Ethnic, cultural studies, and area studies
Foreign languages and literature (French, Spanish, etc.)
Health-related fields (nursing, physical therapy, health technology, etc.)
History
Humanities (English, literature, philosophy, religion, etc.)
Liberal/ General studies
Mathematics
Multi/interdisciplinary studies (international relations, ecology, environmental studies, etc.)
Parks, recreation, leisure studies, sports management
Physical sciences (physics, chemistry, astronomy, earth science, etc.)
Pre-professional _{pre-dental, pre-m�dical, pre-veterinary)
Public administration (city management, law enforcement, etc.)
Social Services (anthropology, economics, political science, psychology, sociology, etc.)
Visual and preforming arts (arts, music, theater, etc.)
Burbatt, p. 37
0.0 (0)
1 .0 ( 1 )
10.0 ( 10)
6.0 (6)
0.0 (0)
1 4.0 ( 14) -
1 .0 ( 1)
0.0 (0)
0.0 (0)
10 .0 ( 10)
3 .0 (3) -
0.0 (0)
0.0 (0)
0.0 (0)
0.0 (0)
7.0 (7)
4 .0 (4) -
4.0 (4)
0.0 (0)
39.0 (39)
1 .0 ( 1 )

Burbatt, p. 3 8
Undecided 0.0 (0)
( 1 00) *figures are reported in percentages; actual numbers reported in parentheses
Table 5: Course Work
Hours per week spent on course work
5 or fewer hours 20.2 (20) 6- 1 0 hours 52.5 (52) 1 1 - 1 5 hours 1 6.2 ( 1 6) 1 6-20 hours 7. 1 (7) 2 1 -25 hours 2 (2) 26-30 hours 1 (1 ) More than 3 0 hours per week 1 ( 1 )
(99) *figures are reported in percentages; actual numbers reported in parentheses
Table 6: Job Hours per week spent on Hours per week spent on off-on-campus job campus job
None; I don't have a job 50.5 (50) None; I don't have a job 78.0 (78)
1 - 1 0 hours 1 8.2 ( 1 8) 1 - 1 0 hours 5 . 1 (5) 1 1 -20 hours 2 1 .2 (2 1 ) 1 1 -20 hours 7 . 1 (7) 2 1 -3 0 hours 8. 1 (8) 2 1 -3 0 hours 7. 1 (7)
3 1 -40 hours 0.0 (0) 3 1 -40 hours 2.0 (2)
More than 40 hours per 2.0 (2) More than 40 hours per week 0.0 (0) week
(99) (99) *figures are reported in percentages; actual numbers reported in parentheses

Hours per week spent on involvement
5 or fewer hours 6-1 0 hours 1 1 - 1 5 hours 1 6-20 hours 2 1 -25 hours 26-30 hours More than 30 hours per week
Table 7: Involvement
45.9 (45) 32.7 (32) 6. 1 (6) 5 . 1 (5) 3 . 1 (3) 4 . 1 (4) 3 . 1 (3)
(98)
Hours per week spent on involvement (collapsed)
Burbatt, p. 39
45 .9 (45)
54. l (53)
(98)
*figures are reported in percentages; actual numbers reported in parentheses
Table 8: Students' Satisfaction
Opinion 1 Opinion 2 How well do you If you could start over again, like college? would you go to the same
institution you are now attending?
I am enthusiastic 41 .4 (4 1 ) Yes, definitely 45 .9 (45) about it I like it 48.5 (48) Probably yes 33 .7 (33) I am more or less 7 . 1 (7) Probably no 1 3 .3 ( 1 3) neutral about it I don't like it 3.0 {3) No, definitely 7. 1 (7)
(99) (98)

Extracurriculars
Burbatt, p. 40
Table 9: Hypothesis 1
Less than 5 hours/week More than 5 hours/week
Total
How well do �ou like college? I am I like I am I don't
enthusiastic it more or like it about it less
neutral about it
1 3 23 5 3 32.5% 48.9% 7 1 .4% 100%
27 24 2 0 67.5% 5 1 . 1 % 28.6% 0.0%
40 47 7 3 100% 100% 100% 100%
Total
44
53
97
(Pearson Chi-Square = 8.445, df= 3, p=0.038; Cramer' s V = 0.295, p=0.03 8)
Table 10: Hypothesis 2
If you could start over again, would you go Total to the same institution you are now
attending? Yes, Probably Probably No,
definitely yes no definitely Extracurriculars Less than 1 6 1 8 6 3 43
5 hours/ 37.2% 54.5% 46.2% 42.9% week More 27 15 7 4 53 than 5 62.8% 45.5% 53 .8% 57. 1 % hours/ week --Total 43 33 13 7 96
100% 100% 100% 100% (Pearson Chi-Square = 2.290, df= 3 , p=0.5 15)

Burbatt, p. 4 1
Hypothesis 3
Table l la: Clubs/Organizations
Relationships within organizations and clubs/involvement Total 1 2 3 4 5 6 7
Extracurriculars Less 3 6 2 1 1 8 6 9 45 than 5 75 .0% 100% 3 3 .3% 78 .6% 3 8 . 1 % 35 .3% 30.0% hours/ week More 1 0 4 3 1 3 1 1 21 53 than 5 25.0% 0.0% 66.7% 2 1 .4% 6 1 .9% 64.7% 70.0% hours/ week Total 4 6 6 1 4 2 1 17 30 98
100% 100% 100% 100% 100% 100% 100% (Pearson Chi-Square = 1 9. 174, df= 6, p=0 .004; Cramer's V = 0 .442, p=0 .004)
Table l lb: Other students
Relationships with other students Total 1 2 3 4 5 6 7
Extracurriculars Less 1 1 4 5 1 6 9 9 45 than 5 100% 100% 80.0% 62.5% 64.0% 3 1 .0% 3 1 .0% hours/ week More 0 0 1 3 9 20 20 53 than 5 0.0% 0.0% 20.0% 37.5% 36.0% 69.0% 69.0% hours/ week --Total 1 1 5 8 25 29 29 98
100% 100% 100% 100% 100% 100% 100% (Pearson Chi-Square = 1 4.045 , df= 6, p=0.029; Cramer's V = 0.379, p=0.029)

Burbatt, p. 42
Table l lc: Faculty Members Relationshi�s with faculty members Total
1 2 3 4 5 6 7 Extracurriculars Less 0 1 2 5 9 14 14 45
than 5 0.0% 100% 50.0% 50.0% 45.0% 46.7% 43.8% hours/ week More 1 0 2 5 1 1 1 6 1 8 53 than 5 100% 0.0% 50.0% 50.0% 55 .0% 53 .3% 56.2% hours/ week --Total 1 1 4 10 20 30 32 98
100% 100% 100% 100% 100% 100% 100% (Pearson Chi-Square = 2. 195 , df= 6, p=0.90 1 )
Table l ld: Socializing with Faculty Socialized with a faculty member outside Total
of class. Never Occasionally Often Very
Often Extracurriculars Less than 5 16 1 8 7 3 44
hours/ 64.0% 47.4% 33 .3% 23 . 1 % week --
More than 9 20 14 10 53 5 hours/ 36.0% 52.6% 66.7% 76.9%
week --Total 25 38 2 1 1 3 97
100% 100% 100% 100% (Pearson Chi-Square = 7.396, df= 6, p=0.060; Cramer's V = 0.276, p=0.060)

Extracurriculars
Class Standing
Burbatt, p. 43
Table l le: Famill'. Members - ---------- ------Relationships with family members at home
1 2 3 4 5 6 7 Less 0 2 3 2 5 8 25
than 5 0.0% 50.0% 60.0% 40.0% 45.4% 53 .3% 43.9% hours/ week More 1 2 2 3 6 7 32 than 5 1 00% 50.0% 40.0% 60.0% 54.6% 46.7% 56. 1% hours/ week Total 1 4 5 5 1 1 1 5 57
1 00% 1 00% 1 00% 1 00% 1 00% 1 00% 1 00% (Pearson Chi-Square = 1 .776, df = 6, p=0.939)
Other Findings
Table 12: Class Standing How well do l'.ou like college? Total
l am I like it l am I don't enthusiastic more or like it
about it less neutral about it
First Year 0 7 2 0 9 0.00% 14.58% 28.57% 0.00%
Sophomore 1 0 5 1 0 1 6 24.39% 1 0.42% 14.29% 0.00%
Junior 17 9 1 0 27 41 .46% 1 8.75% 1 4.29% 0.00%
Senior 14 26 3 3 46 34. 1 5% 54. 17% 42.86% 1 00%
Graduate 0 1 0 0 1 Student 0.00% 2.08% 0.00% 0.00% Total 4 1 48 7 3 99
1 00% 1 00% 1 00% 1 00% (Pearson Chi-Square = 22. 1 54, df= 12, p=0.036; Cramer's V = 0.273 , p=0.036)
Total
45
53
98

Burbatt, p. 44
Table 13a: Sex How well do l'.ou like college? Total
l am l like it l am l don't enthusiastic more or like it
about it less neutral about it
Sex Male 1 5 1 7 3 2 37 36.59% 35 .42% 42.86% 66.67%
Female 26 3 1 4 1 62 63.41 % 64.58% 57. 14% 33 .3 3%
Total 41 48 7 3 99 1 00% 1 00% 1 00% 1 00%
(Pearson Chi-Square = 1 .279, df= 3 , p=0.734)
Table 13b: Living Arrangements -How well do l'.OU like college? Total
l am l like it l am l don't enthusiastic more or like it
about it less neutral about it
Where do you On-campus 1 7 1 7 2 0 36 live? housing/ 41 .46% 35 .46% 28.57% 0.00%
residence halls
Fraternity/ 5 0 1 0 6 Sorority 12.20% 0.00% 1 4.29% 0.00% House --
Residence 1 5 20 3 1 39 within 36.59% 41 .67% 42.86% 33 .33%
walking distance
Residence 4 1 1 1 2 1 8 within 9.76% 22.92% 1 4.29% 66.67% driving distance
Total 4 1 48 7 3 99 1 00% 1 00% 1 00% 1 00%
(Pearson Chi-Square = 1 4.255, df= 9, p=0. 1 14)

Burbatt, p. 45
Table 13c: Grades How well do l:OU like college? Total
l am I like it l am I don't enthusiastic more or like it
about it less neutral about it
Self Report A 6 8 0 0 14 Grades 14 .63% 1 6.67% 0.00% 0.00%
A-, B+ 1 5 1 5 0 0 30 36.59% 3 1 .25% 0.00% 0.00%
B 8 12 2 0 22 1 9.5 1% 25 .00% 28.57% 0.00%
B-, C+ 12 1 0 4 3 29 29.27% 20.83% 57. 14% 1 00.00%
C, C-, lower 0 3 1 0 4 0.00% 6.25% 14.29% 0.00%
Total 4 1 48 7 3 99 1 00% 1 00% 1 00% 1 00%
(Pearson Chi-Square = 1 8.635, df = 12, p=0.098)

Burbatt, p. 46
Table 14: Race How well do l:OU like college? Total
l am I like l am I don't enthusiastic it more or like it
about it less neutral about it
Race Non-White 1 7 1 8 5 1 4 1 42.5% 38.3% 71 .4% 33 .3%
White 23 29 2 2 56 57.5% 61 .7% 28.6% 66.7%
Total 40 47 7 3 97 1 00% 1 00% 1 00% 1 00%
(Pearson Chi-Square = 2.842, df = 3 , p=0.4 1 7)
Table 15 Taken a test to measure your abilities, Total
interests, or attitudes. Never Occasionally Often Very
Often Extracurriculars Less 3 29 7 6 45
than 5 2 1 .43% 60.42% 36.84% 35 .29% hours/ week More 1 1 1 9 12 1 1 53 than 5 78.57% 39.58% 63 . 1 6% 64.71 % hours/ week Total 14 48 1 9 1 7 98
100% 1 00% 1 00% 1 00% (Pearson Chi-Square = 8.847, df= 3 , p=0.03 1 ; Cramer's V = 0.300, p=0.03 1 )

Burbatt, p. 4 7
APPENDIX B: QUESTIONNAIRE Indicate your response by marking the
appropriate oval next to the correct
answer Age
0 1 7 or younger 0 1 8 0 1 9 0 20 0 2 1 0 22 0 23 0 24 or older
Sex o Male o Female
What is your classification in college? o First year o Sophomore o Junior o Senior o Graduate student o Unclassified
Did you begin college here or transfer from another institution?
o Started here o Transferred from another institution
Where do you now live during the school year?
o On-campus housing/ residence halls o Fraternity/sorority house o Residence (house, apartment, etc .)
within walking distance of the institution
o Residence (house, apartment, etc.) within driving distance
What have most of your grades been up to now at this institution?
o A o A-, B+ o B o B-, C+ o C, C-, or lower
Which field best describes your major, or your anticipated major? (Can pick more than one if it applies)
o Agriculture o Biological Sciences (biology,
B iochemistry, botany, zoology, etc .) o Business (accounting, business
administration, marketing, management, etc.)
o Communication (speech, journalism, television/radio, etc.)
o Computer and information services o Education o Engineering o Ethnic, cultural studies, and area
studies o Foreign languages and l iterature
(French, Spanish, etc.) o Health-related fields (nursing,
physical therapy, health technology, etc.)
o History o Humanities (English, literature,
philosophy, religion, etc.) o Liberal/ General studies o Mathematics o Multi/interdisciplinary studies
(international relations, ecology, environmental studies, etc.)
o Parks, recreation, leisure studies, sports management
o Physical sciences (physics, chemistry, astronomy, earth science, etc.)
o Pre-professional (pre-dental, premedical, pre-veterinary)
o Public administration (city management, law enforcement, etc.)
o Social Services (anthropology, economics, political science, psychology, sociology, etc.)
o Visual and preforming arts (arts, music, theater, etc.)
o Undecided Other: �����������-

Did either of your parents graduate from college?
o No o Yes, both parents o Yes, father only o Yes, mother only o Don't know
How many credit hours are you taking this semester?
o 6 or fewer 0 7-1 1 0 1 2- 1 4 0 1 5- 1 6 o 1 7 or more
During the time school is in session, about how many hours a week do you usually spend outside of class on activities related to your academic program such as studying, writing, reading, lab work, rehearsing, etc.?
o 5 or fewer hours a week o 6- 1 0 hours a week o 1 1 - 1 5 hours a week o 1 6-20 hours a week o 2 1 -25 hours a week o 26-30 hours a week o more than 30 hours a week
During the time school is in session, about how many hours a week do you usually spend working on a job for pay? On campus Off-campus
o none; I don't have a job o o 1 - 1 0 hours a week c 1 o 1 1 -20 hours o 2 1 -3 0 hours o o 3 1 -40 hours o more than 40 hours o
Burbatt, p. 48
If you have a job, how does it affect your school work?
o I don't have a job o My job does not interfere with my
school work o My job takes some time from my
school work o My job takes a lot of time from my
school work During the time school is in session, about how many hours a week do you usually spend on extracurricular activities (clubs, organizations, etc.) o 5 or fewer hours a week o 6- 1 0 hours a week o 1 1 - 1 5 hours a week o 1 6-20 hours a week o 2 1 -25 hours a week o 26-30 hours a week o more than 3 0 hours a week
What is your racial or ethnic identification? (all that apply)
o American Indian or other Native American
o Asian or Pacific Islander o Black or African American o Caucasian (other than Hispanic) o Mexican-American o Puerto Rican o Other Hispanic o Other:

Burbatt, p. 49
College Activities
In your experience at this institution during the current school year, about
how often have you done each of the following?
Experiences with Faculty
Discussed your academic program or course selection with a faculty member.
Discussed your career plans and ambitions with a faculty member.
Worked harder as a result of feedback from an instructor.
Socialized with a faculty member outside of class.
Participated with other students in a discussion with on or more faculty members outside of class.
Worked harder than you thought you could to meet an instructor's expectations and standards.
Worked with a faculty member on a research project.
Clubs and Organizations
Attended a meeting of a campus club, organization or student government group.
Worked on a campus committee, student organization, or project (publications, student government, special event, etc.)
Worked on an off-campus committee, organization, or
0 Very Often O Often Q Occassionally O Never
O Very Often O Often O Occassionally O Never
O Very Often O Often O Occassionally O Never
0 Very Often O Often O Occassionally O Never
0 Very Often O Often O Occassionally O Never
0 Very Often 0 Often O Occassionally O Never
0 Very Often O Often O Occassionally O Never
0 Very Often O Often O Occassionally O Never
0 Very Often O Often O Occassionally O Never
project (civil group, church group, community event, etc.) O Very Often O Often Q Occassionally O Never
Met with a faculty member or staff advisor to discuss the activities of a group of organization. O Very Often O Often O Occassionally O Never
Managed or provided leadership for a club or organization, on or off the campus. O Very Often O Often Q Occassionally O Never

Personal Experiences
Told a friend or a family member why you reacted to another person the way you did.
Discussed with another student, friend, or family member why some people get along smoothly, and others do not.
Asked a friend for help with a personal problem.
Read articles or books about personal growth, selfimprovement, or social development.
Taken a test to measure your abilities, interests, or attitudes.
Asked a friend to tell you what he or she really thought about you.
Talked with a faculty member, counselor, or other staff member about personal concerns.
Burbatt, p. 50
0 Very Often Q Often Q Occassionally Q Never
0 Very Often O Often O Occassionally Q Never
O Very Often O Often Q Occassionally Q Never
Q Very Often Q Often Q Occassionally Q Never
0 Very Often O Often Q Occassionally Q Never
O Very Often O Often Q Occassionally Q Never
0 Very Often Q Often Q Occassionally Q Never
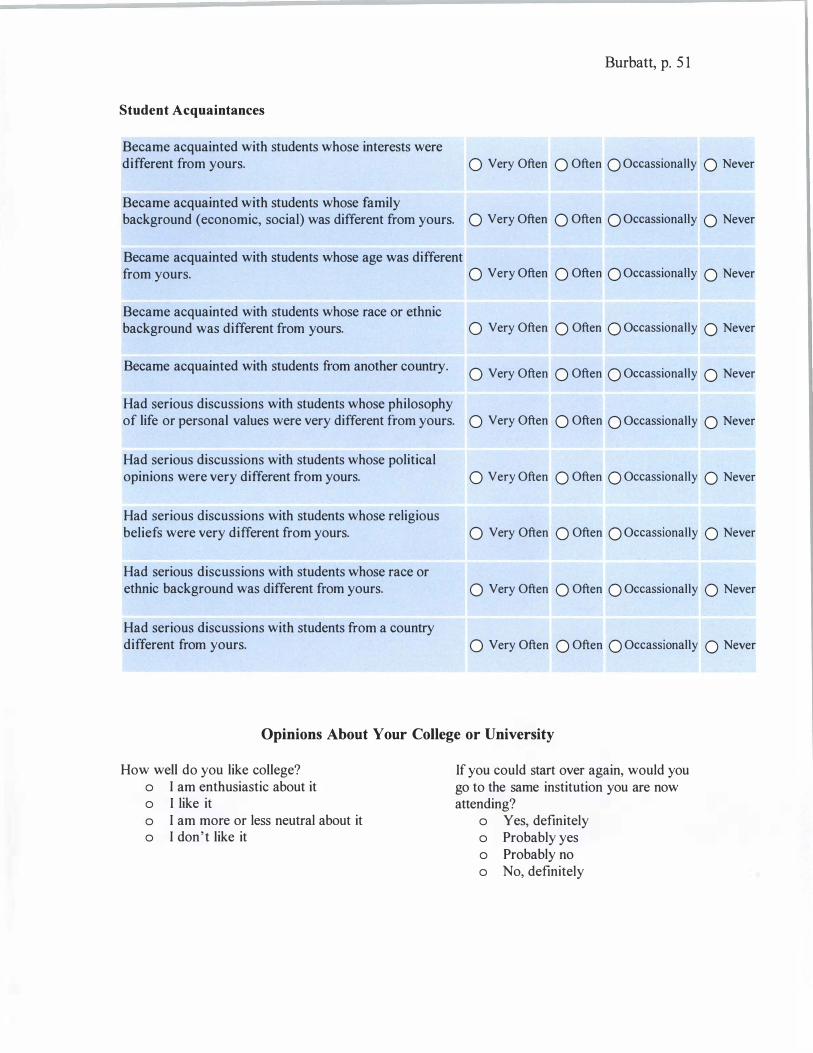
Student Acquaintances
Became acquainted with students whose interests were different from yours.
Became acquainted with students whose family
Burbatt, p. 5 1
0 Very Often O Often Q Occassionally Q Never
background (economic, social) was different from yours. O Very Often O Often Q Occassionally O Never
Became acquainted with students whose age was different from yours. O Very Often O Often Q Occassionally O Never
Became acquainted with students whose race or ethnic background was different from yours.
Became acquainted with students from another country.
Had serious discussions with students whose philosophy
0 Very Often Q Often Q Occassionally Q Never
0 Very Often O Often Q Occassionally Q Never
of life or personal values were very different from yours. O Very Often O Often O Occassionally O Never
Had serious discussions with students whose political opinions were very different from yours.
Had serious discussions with students whose religious beliefs were very different from yours.
Had serious discussions with students whose race or ethnic background was different from yours.
Had serious discussions with students from a country different from yours.
O Very Often Q Often Q Occassionally Q Never
0 Very Often O Often Q Occassionally Q Never
O Very Often O Often Q Occassionally Q Never
0 Very Often Q Often Q Occassionally Q Never
Opinions About Your College or University
How well do you like college? o I am enthusiastic about it o I like it o I am more or less neutral about it o I don't like it
If you could start over again, would you go to the same institution you are now attending?
o Yes, definitely o Probably yes o Probably no o No, definitely

Burbatt, p. 52
Estimate of Gains In thinking about your college or university experience up to now, to what extent do you feel you have gained or made progress in these areas. Student Acquaintances
Presenting ideas and infonnation effectively when speaking to O Very . . O Very
others. Much O Qmte a Bit O Some Little
Developing your own values and ethical standards. 0
Understanding yourself, your abilities, interests and 0 personality.
Developing the ability to get along with different kinds of 0 people.
Developing the ability to function as a member of a team. 0
Thinking analytically and logically. 0
Putting ideas together, seeing relationships, similarities, and 0 differences between ideas.
Very 0 Q . B ' 0 S 0 Very M h mte a 1t ome L. 1 oc m e
Very 0 Q . B ' 0 S 0 Very M h mte a 1t ome L. 1 oc m e
Very 0 Q . B ' 0 S 0 Very
M h mte a 1t ome L. 1 oc m e
Very 0 Q . B ' 0 S 0 Very
M h mte a 1t ome L . 1 oc m e
Very 0 Q . B ' 0 S 0 Very M h mte a 1t ome L. 1 oc m e
Very Q Q . B . Q S Q Very M h mte a 1t ome L. 1 oc m e
Leaming on your own, pursuing ideas, and finding infonnation d
0 Very . . O Very you nee . M h O Qmte a Bit O Some L. 1 oc m e
Leaming to adapt to change (new technologies, different jobs or personal circumstances, etc.)
0 MVery
h O Quite a Bit O Some 0 L�
eryl oc m e
The College Environment Thinking of your experiences at this institution, to what extent do you feel that each of the following is emphasized?
Emphasis on developing academic, scholarly, and intel lectual qualities Strong Emphasis I I I I Weak Emphasis
D D D D D DI
D 7 6 5 4 3 2 1
Emphasis on developing aesthetic, expressive, and creative qualities Strong Emphasis I I I I I I I I Weak Emphasis
D 7 D I D I D 6 5 4
D 3
D 2
D 1
Emphasis on developing critical, evaluative, and analytical qualities

Burbatt, p. 53
Strong Emphasis Weak Emphasis
0 D [] D LJ D [] 7 6 5 4 3 2 1
Emphasis on oeveJopmg an unoerstanomg and ap Jrec1atton or human 01vers1ty
Strong Emphasis Weak Emphasis
D D D D D D D 7 6 5 4 3 2 1
Emphasis on developing information literacy skills (using computers, other information resources)
Strong Emphasis Weak Emphasis D D D D 0 0 0 7 6 5 4 3 2 1
Emoh · <level · .f OJ Jtng voca d .f t'
Strong Emphasis Weak Emphasis 0 D [] 0 [J D 0 7 6 5 4 3 2 1
Emoh · th 1 rel d prac f f Strong Emphasis Weak Emphasis
0 D 0 0 0 0 0 7 6 5 4 3 2 1
The next five ratings refer to relations with people during your time at college. Please rate these relationships
Rel h" · h oth d Friendly, Supportive, Competitive, Uninvolved,
[) D [] 0 [] D 0 Sense of Belonging 7 6 5 4 3 2 1 Sense of Alienation
Relationsh · "th administrat d offi Helpful, Considerate, Rigid, Impersonal,
0 0 0 0 0 0 0 Flexible 7 6 5 4 3 2 1 Bound by regulations

Burbatt, p. 54
lationsh· .
h ti IDS Wll b Approachable, Helpful, Remote, Discouraging,
0 D 0 0 0 0 0 Understanding, 7 6 5 4 3 2 1 Unsympathetic
Encouraging
Relationships within organizations and clubs/involvement Friendly, Supportive, Competitive, Impersonal,
0 D 0 0 0 0 0 Sense of Belonging 7 6 5 4 3 2 1 Sense of Alienation
Relationsh · " h famil b h Helpful, Supportive, Rigid, Remote, Discouraging
Encouraging, 0 D [l 0 [) 0 [] Sense of Belonging 7 6 5 4 3 2 1 Sense of Alienation

Burbatt, p. 5 5
BIBLIOGRAPHY
Aspelmeier, Jeffery E. , Michael M. Love, Lauren A. McGill, Ann N. Elliott, Thomas W. Pierce. 20 1 2. "Self-Esteem, Locus of Control, College Adjustment, and GPA Among First- and Continuing-Generation Students: A Moderator Model of Generational Status." Res Higher Education 53: 755- 781.
Berger, Joseph & Jeffrey Milem. 1 997. "A Modified Model of College Student Persistence: Exploring the Relationship Between Astin' s Theory of lnvolvement and Tinto ' s Theory of Student Departure."
Berger, Joseph, & Jeffrey Milem 1 999. "The role of student involvement and perceptions of integration in a causal model of student persistence" Research in Higher Education 40(6) : 64 1-664.
Boston University. 2014 . "First Generation Connect." Boston, MA: Boston University Services. (http://www.bu.edu/usc/ g 1 /)
Bryman, Alan. 2006. "Integrating quantitative and qualitative research: how is it done?." Sage Journals 6( 1 ) : 97- 1 1 3 .
Chapman University. 20 1 4. "Are you a First Generation college student?" Orange, CA: Chapman University Academic Resources. (http://chapman.edu/students/academic-resources/first-generation/index.aspx)
Clemson University. 20 1 4. 'The Clemson FIRST- Generation Success Program." Clemson, South Carolina: First Generation Success. (http://wwv.i.clemson.edu/academics/programs/first/)
Cox, Bradley E . , Kadian L. Mcintosh, Patrick T. Terenzini, Robert D. Reason, Brenda R. Lutovsky Quaye. 20 1 0. "Pedagogical Signals of Faculty Approachability: Factors Shaping Faculty- Student Interaction Outside the Classroom." Research in Higher Education 5 1 (8): 767-788 .
Denzin, Norman K. , & Yvonna S. Lincoln. 2003 . Collecting and Interpreting Qualitative Materials. Thousand Oaks, CA: Sage Publications Inc.
Drew, Claudine Paula. 1990. "We can no longer love 'em and leave em: A paper on freshman retention. " Community College Review 1 7(4) : 54-59.
Eastern Illinois University 20 1 2 . "Planning and Institutional Studies @ EIU". (http://castle.eiu.edu/�planning/)
Eastern Illinois University. 20 1 4. "EIU at a Glace." (http://www.eiu.edu/about/glance.php)

Burbatt, p. 56
Engle, Jennifer. 2007. "Postsecondary Access and Success for First-Generation College Students." American Academic 3.
Fisher, Mary Jane. 2007. "Settling into Campus Life: Differences by Race/Ethnicity in College Involvement and Outcomes." The Journal of Higher Education 78(2) : 125-156.
Gonyea, Robert M. , Kelly A. Kish, George D. Kuh, Richard N. Muthiah, Auden D. Thomas. 2003 . "College Student Experiences Questionnaire: Norms for the Fourth Edition." Bloomington, IN : Indiana University Center for Postsecondary Research, Policy and Planning.
Gullatt, Yvette, and Wendy Jan. 2003 . "How Do Pre-Collegiate Academic Outreach Programs Impact College-Going among Underrepresented Students?" Washington, DCL Pathways to College Network.
Hotchkiss, Julie L. , Robert E. Moore and M. Melinda Pitts. 2006. "Freshman Learning Communities, College Performance, and Retention." Education Economics 1 4(2) : 1 97-2 1 0.
Hu, Shouping and George D. Kuh. 2002. "Being (Dis)Engaged in Educationally Purposeful Activities: The Influences of Student and Institutional Characteristics." Research in Higher Education 43(5) : 555-575.
Jamelske, Eric. 2009 . "Measuring the impact of a university first-year experiences program on student GP A and retention." International Journal of Higher Ed & Educational Planning 57(3): 373-3 9 1 .
Koljatic, Mladen and George D. Kuh. 200 1 . "A Longitudinal Assessment of College Student Engagement in Good Practices in Undergraduate Education." Higher Education 42(3): 351- 3 71 .
London, Howard B . 1 989 . Breaking Away: A Study of First-Generation College Students and Their Families. American Journal of Education 97 (2) : 144-1 70.
National Center for Education Statistics. 20 1 3 . Integrated Postsecondary Education Data System (IPEDS).
Oldfield, Kenneth. 20 12 . "Still Humble and Hopeful: Two More Recommendations on Welcoming First-Generation Poor and Working-Class Students to College." A bout Campus.
Pace, C. Robert and George D. Kuh. 1 998. "College Student Experiences Questionnaire, Fourth Edition." Educational Testing Service.

Burbatt, p. 57
Pascarella, Ernest T, Christopher T. Pierson, Gregory C. Wolniak, and Patrick T. Terenzini. 2003 . "Experiences and Outcomes of First-generation Students in Community Colleges." Journal of College Student Development 44(3) : 420-429.
Pascarella, Ernest T, Christopher T. Pierson, Gregory C. Wolniak, and Patrick T. Terenzini. 2004. "First-generation College Students: Additional Evidence on College Experiences and Outcomes." The Journal of Higher Education 75(3): 249-284.
Perna, Laura and W. Scott Swail . 2000. "Pre-College Outreach and Early Intervention." The NEA Higher Education Journal: 99- 1 l 0.
Peters, T.J. 1 98 8 . "Individual attention: the key to keeping students in school ." A CU-1 Bulletin 5 6(2) : 4-8 .
Pike, Gary R. and Georgia D . Kuh. 2005. "First- and Second- Generation College Students: A Comparison of Their Engagement and Intellectual Development." The Journal of Higher Education 76(3) : 276- 300.
Roberts, Jalynn, and Ronald Styron, Jr. 20 10 . "Student satisfaction and persistence: factors vital to student retention." Research in Higher Education Journal.
Sanchez-Leguelinel, Caridad. 2008 . "Supporting 'Slumping' Sophomores : Programmatic Peer Initiatives Designed to Enhance Retention in the Crucial Second Year of College." College Student Journal 42(2): 637-646.
Striplin, Jenny J. 1 999. "Facilitating Transfer for First-Generation Community College Students ." ERIC Digest, June.
Sy, Susan R., Kristen Fong, Rebecca Carter, Julia Boehme, Amy Alpert. 201 1 . "Parent Support and Stress Among First-Generation and Continuing-Generation Female Students During the Transition to College". College Student Retention I 3(3) : 383-398.
Thayer, Paul B. 2000. "Retention of Students from First Generation and Low Income Backgrounds." Opportunity Outlook (May), 2-8.
Turnbull, William. 1 986. "Involvement: the key to retention. " Journal of Developmental Education 1 0(20) : 6-1 1 .
Tym, Carmen, Robin McMillion, Sandra Barone, Jeff Webster. 2004 . "FirstGeneration College Students : A Literature Review."
UNC Charlotte. 2014 . "Leaming Communities at UNC Charlotte." Charlotte, NC: The University of North Carolina at Charlotte. (https://lc.uncc.edu/learningcommunities-unc-charlotte)

Burbatt, p. 5 8
University of Central Florida. 2014 . "First Generation Programs." Orlando, FL: Multicultural Academic & Support Services. (http://mass.sdes.ucf.edu/programs/first)
University of Kentucky. 201 3 . " l G First Generation Programs." Lexington KY: The University of Kentucky Undergraduate Education. (http://www.uky.edu/l G/programs.html)
US Department of Education. 1 998. "First Generation Students : Undergraduates Whose Parents Never Enrolled in Postsecondary Education." National Center for Education Statistics.
Woosley, Sherry A. and Dustin K. Shelper. 201 1 . "Understanding the Early Integration Experiences of First-Generation College Students." College Student Journal 45(4) : 700-704.