Embed Size (px)
Citation preview
AfJARE Vol 4 No 1 March 2010 Melinda Smale, Lamissa Diakité, Amadou Sidibé, Mikkel Grum, Hannah Jones, Issa Seni Traore and Hamidou Guindo
23
The impact of participation in Diversity Field Fora on farmer management of millet and sorghum varieties in Mali
MELINDA SMALE
Oxfam America, Washington, DC
(during the implementation of this research, Senior Research Fellow, International Food Policy Research Institute (IFPRI), Washington, DC)
LAMISSA DIAKITÉ
Institut d’Économie Rurale, Bamako, Mali
AMADOU SIDIBÉ
Institut d’Économie Rurale, Bamako, Mali
MIKKEL GRUM
Bioversity International, Maccarese, Rome, Italy
HANNAH JONES
International Food Policy Research Institute (IFPRI), Washington, DC
ISSA SENI TRAORE
Aide au Sahel et à l’Enfance Malienne (ASEM), Hamdallaye, San, Mali
HAMIDOU GUINDO
Institut d’Économie Rurale, Bamako, Mali
Abstract
Malian farmers have been cultivating millet and sorghum for millennia, but they are slow to adopt and develop modern varieties because it is difficult to observe the difference in yields in their fields, given the challenging local growing conditions. Farmer participatory approaches are therefore recommended. This paper applies an instrumental variables method to survey data from Mali to evaluate the impacts of Diversity Field Fora, a type of farmer field school which aims to boost millet and sorghum yields by showing farmers how to manage diverse varieties. Impact indicators are expected and recalled millet and sorghum yields, the total number of unique attributes of millet and sorghum varieties stocked as seed, and the relative
Corresponding author: [email protected]
AfJARE Vol 4 No 1 March 2010 Melinda Smale, Lamissa Diakité, Amadou Sidibé, Mikkel Grum, Hannah Jones, Issa Seni Traore and Hamidou Guindo
24
deprivation of the household farm with respect to these indicators. The findings suggest the project has had results at one of two sites where it has been implemented with the same local leadership and more intensively over a longer time frame.
Keywords: farmer field school; sorghum; millet; landraces; participatory crop improvement; Mali
Les fermiers maliens ont cultivé le millet et le sorgho pendant des millénaires, mais ils ne sont pas pressés d’utiliser et de développer des variétés modernes parce qu’il leur est difficile d’observer une différence dans leurs récoltes étant donné les conditions difficiles de l’agriculture locale. Par conséquent, des approches participatives des fermiers sont conseillées. Cet article applique une méthode de variables instrumentales aux données des enquêtes du Mali pour évaluer les impacts des Champs de Diversité, un type d’école pour fermiers spécialisée dans la culture visant à stimuler les récoltes de millet et de sorgho en apprenant aux fermiers la façon de gérer différentes variétés. Les indicateurs d’impact sont les récoltes de millet et de sorgho que les fermiers attendent et celles dont ils se souviennent, la somme totale des attributs uniques de variétés de millet et de sorgho stockées en tant que graines, et une privation relative pour les exploitations agricoles familiales par rapport à ces indicateurs. Les conclusions suggèrent que le projet a porté ses fruits dans un des deux sites, là où il fut mis en place sous la même direction locale et de manière plus intensive sur une période de temps plus longue.
Mots-clés : école pour fermiers spécialisée dans la culture ; sorgho ; millet ; variétés traditionnelles ; amélioration des récoltes grâce à la participation ; Mali
1. Introduction
Malian farmers have accumulated knowledge of millet and sorghum management that spans millennia. Pearl millet and sorghum are known to have been domesticated in multiple locations scattered across the Sahel – then savanna and now the border of the Sahara (Harlan, 1992). Archaeological evidence suggests that economies based on cattle, goats, sorghum and pearl millet were established in this region between 5,000 and 3,000 years ago (Smith, 1998).
Sorghum and millet are still the major crops of Mali, grown by subsistence oriented producers in an agricultural sector that is almost entirely rainfed. National average yields for both crops are less than one ton per hectare (Touré et al., 2006). For the Malian agricultural sector in general, the most binding constraint is the infertility and unsuitable structure of the soil, which in turn impedes moisture retention in zones with limited rainfall. The first devastating drought in a series occurred from 1968 to 1973. The 1982–1993 period was persistently dry and marked by another severe drought from 1982 to 1984. Although there was more rainfall during the 1994–2003 decade, conditions remained far drier than they had been from 1930 to 1965 (Anyamba & Tucker, 2005).
Low yields are often attributed in part to low rates of adoption of improved seed. The most recent draft Agricultural Census reports that the proportion of the area under
AfJARE Vol 4 No 1 March 2010 Melinda Smale, Lamissa Diakité, Amadou Sidibé, Mikkel Grum, Hannah Jones, Issa Seni Traore and Hamidou Guindo
25
cereals with improved seed does not exceed 10%. By contrast, 89% of the area is under industrial crops with improved seed (BCRA, 2006). Improved varieties of sorghum have been more widely adopted than improved varieties of millet (BCRA, 2006).
Low adoption rates have in turn been blamed on poor performance of the formal seed system. Despite an ongoing process of seed sector reform, liberalization of seed markets for sorghum and millet has not advanced as rapidly as liberalization of grain markets (Vitale & Bessler, 2006; Diakité et al., 2008). The formal seed sectors for sorghum and millet continue to be largely state run, with some participation by registered farmer cooperatives in multiplying seed. So far, commercialization of farmer-produced seed on more than a pilot scale has posed an insuperable challenge.
Surpassing the performance of farmers’ own millet and sorghum landraces is not easy. International and national research centers accelerated breeding efforts from 1973, but new cultivars in the dry savannas made little impact on yields (Sanders et al., 1996). Of the improved varieties that performed well on research stations during that period, few performed better than landraces on farms, for several reasons. To start with, the imported breeding material was unsuitable. Initially, an emphasis was placed on material that was successful in India but was not adapted to the high soil temperatures in the Sahel (Matlon, 1987). Local sorghum and millet varieties also have photoperiodicity, which enables plants to adjust the length of the growth cycle to synchronize with the length of the rainy season. Unfortunately, early selection programs, combined with the effects of drought, led to the gradual elimination of photoperiodism in favor of a range of varieties with short, fixed cycle lengths (Vaksmann et al., 1996).
These shortcomings have since been overcome by international and national breeding programs (Weltzien et al., 2006), but challenges remain. Attaining more than marginal changes in yield is difficult without hybrids, but while promising materials are in the pipeline, none have yet been released for either sorghum or pearl millet. The tremendous variation in climate, soils and production systems means that the degree of plant stress is not only high but also extremely variable within and among fields in close proximity. It takes time for farmers to recognize whether or not a new variety has advantages, which is one argument for farmer participation in testing and evaluation. In addition, decreasing public funds have meant that no breeding is conducted for some agro-ecologies, including that of Douentza, where part of this survey was conducted.
Thus there is no consensus about whether it is lack of effective demand or supply that constrains farmer use of certified sorghum and millet seed. Because the private sector has not taken responsibility for seed distribution, and the public sector has failed to supply improved seed in reasonable quantities, some researchers have also called for strengthening the informal seed system (De Vries & Toenniessen, 2001), but knowledge about how this may be done is only beginning to emerge. Diakité et al. (2005), Bazile (2006) and Weltzien et al. (2006) recommend greater involvement of farmer and community organizations in testing and evaluating improved varieties, coupled with decentralized seed production to reduce the time lag between variety development and adoption, and to reach more remote areas.
AfJARE Vol 4 No 1 March 2010 Melinda Smale, Lamissa Diakité, Amadou Sidibé, Mikkel Grum, Hannah Jones, Issa Seni Traore and Hamidou Guindo
26
The purpose of this paper is to evaluate the impact of one such participatory research effort. Diversity Field Fora, which bear some similarities to farmer field schools, have been launched in Mali on a pilot scale. Given the small scale and brief history of the Diversity Field Fora in Mali, and the statistical approach we use to address possible biases, this analysis focuses on measurable, short-term impacts. The findings shed light on the potential of the approach, but should not be understood as a comprehensive evaluation. The next section summarizes key features of the project and Diversity Field Fora, Section 3 describes the methodology used to evaluate impact, Section 4 interprets the findings, and Section 5 concludes.
2. Project description
Background
The project entitled ‘Empowering Sahelian farmers to leverage their crop diversity assets for enhanced livelihood strategies’1 was funded by the International Fund for Agricultural Development (IFAD) from 2005, coordinated by Bioversity International (previously, the International Plant Genetic Resources Institute, IPGRI) and implemented by a combination of local, national and international organizations. This second phase built on an earlier IFAD-financed project, conducted from 1999 to 2002 in Mali and Zimbabwe, which focused on the development of participatory strategies for on-farm (in situ) conservation of millet, sorghum and other crops. In the interim, IFAD also funded some farmer field school activities in the village of Boumboro, which became the locus of the San/Tominian project site during the second phase.
The goal of the second phase was to support the livelihood strategies of poor farmers in Mali by strengthening their capacity to manage their plant genetic resources. The findings of the earlier project demonstrated the importance of plant genetic resources in the livelihoods of Sahelian farmers. These farmers must be able to meet their staple food needs directly from their harvests in an exceedingly challenging growing environment – or migrate. Well-adapted, diverse local landraces supply them with a range of consumption attributes that are important for preparing local dishes and other end uses, and enable them to match their varieties to heterogeneous moisture and soil conditions and to smooth labor needs over the growing season. Genetic diversity also helps combat the risk of crop losses from biotic and abiotic stresses – the most pressing of which is the variability of rainfall and dry periods at critical points of plant growth.
Diversity Field Fora
In the first phase of the project, several activities were identified to support the management of crop genetic resources in farming communities. The most sustained and comprehensive of these was the notion of Diversity Field Fora (Champs de Diversité, or DFF), which built on the concept of farmer field schools.
1 « Projet de renforcement des capacités des agriculteurs sahéliens pour une meilleure gestion des ressources phylogénétiques en vue d’améliorer leurs conditions de vie »
AfJARE Vol 4 No 1 March 2010 Melinda Smale, Lamissa Diakité, Amadou Sidibé, Mikkel Grum, Hannah Jones, Issa Seni Traore and Hamidou Guindo
27
Farmer field schools are an adult education method developed and widely promoted in Asia to teach integrated pest management practices to groups of farmers. While there is considerable variation in form and content, the basic approach involves teaching farmers how to solve problems, set priorities and conduct experimental research through facilitated, hands-on sessions in fields allocated by the farming community for study. Reviews of the evidence for the impacts of farmer field schools suggest that they have not translated into changes beyond local communities, that they tend to favor the more privileged farmers in those communities (Davis, 2006), and that they provide an unlikely basis for sustained, group activity (Tripp et al., 2005). Tripp et al. (2005:1718) express concern that the assessment of farmer field schools has been ‘insufficient’, and Van der Berg and Jiggins (2007) explain that the methodology for evaluating their impact is still under development, and is characterized by a tension between statistical rigor, which implies a narrow focus, and comprehensiveness, which leads to a diversity of impact indicators and definitions of impact.
In this project, experiments in enhancing knowledge of crop genetic resources were designed and conducted by villagers, with technical support from the project staff, on land distributed for that purpose by villagers. Farmers studied both modern varieties and landraces. As defined in project documents, DFF encompass a combination of educational activities, action research and training. They aim to strengthen the capacity of farmers to understand, analyze and manage their own plant genetic resources, by creating a physical space that facilitates the exchange of ideas among farmers, extension agents and researchers and stimulates farmer experimentation.
The choice of project sites was guided by two fundamental criteria of location: they had to be in the drier savannas and in an area served by an IFAD investment program. Other criteria for village selection included considerations of feasibility, such as road access to the villages, willingness of farmers and leaders to participate in the project, social cohesion and availability of plots for experimental purposes. These criteria generate an obvious, but unavoidable, placement bias that limits the extent to which findings from this study can be generalized.
The two project sites studied here are separated by at least 400 km along a northeast transect on the main road from the capital city of Bamako into the Sahara. Each is located in a unique agro-climatic zone and cluster of ethno-linguistic groups. The village of Boumboro, Commune of Mandiakuy, Cercle2 of Tominian, Region of Segou, is situated in a semi-arid, tropical climate with annual rainfall levels of 450 to 600 mm, which places it in the Sahelo-Sudanian zone. Variation in vegetative cover is linked to variation in soils, and the landscape is a mosaic of cultivated woodland savanna, heavily populated by shea nut trees (karité). Bambara and Bobo are the major ethnic groups at this site.
The village of Petaka, Commune of Petaka, Cercle of Douentza, Region of Mopti, is located in the Sahelian agro-climatic zone, which places it within the 200 and 400 mm isohyets. The zone is composed of a series of rocky plateaus and outcroppings, interspersed with sandy plains, forest cover, cultivated areas and pasture. Villages are
2 In Mali, a cercle is an administrative unit in a region, followed by the categories of commune and village.
AfJARE Vol 4 No 1 March 2010 Melinda Smale, Lamissa Diakité, Amadou Sidibé, Mikkel Grum, Hannah Jones, Issa Seni Traore and Hamidou Guindo
28
located on both the rocky plateaus and the plains. The major ethnic groups in this region are Dogon, Peulh and Sonrhaï.
Location is also related to the development of infrastructure and services, which generally declines with distance from Bamako. Boumboro is well served by a nexus of feeder roads linked to the city of San on the main tarmac road. This site is closest to Bamako and has a higher density of large weekly markets and other types of physical infrastructure. The closest town to Petaka is Douentza, which is commercially linked to a nexus of smaller-scale weekly markets that are dispersed in villages with more restricted physical infrastructure.
3. Methods
Evaluating impacts
The economics literature about evaluating project impacts emphasizes the importance of establishing the appropriate counterfactual. As it is often described, the problem is essentially one of missing data: differences between those who participated in a program and those who did not are observable, but it is not possible to observe the status of project participants in the absence of the project. Consequently, differences due to the influence of the project are easily confused with pre-existing differences between participants and non-participants.
The term ‘selection bias’ is often applied to the errors in estimation that result from this dilemma. Several types of selection bias occur. When participation is voluntary, factors that influence the likelihood of participation might also affect the outcome of participation. For example, farmers with more income, assets and access to information may be more likely to decide to participate in a project, and attain higher yields whether they participate or not. In other cases, projects or programs deliberately target certain individuals according to their characteristics, such as income. As noted in this case, projects or programs may also be placed in certain zones or sites because of agro-ecology or infrastructural characteristics.
To reduce selection bias, economists have proposed a class of statistical approaches that are commonly referred to as treatment models. Ravallion (1994) categorizes methods for evaluating project impact in terms of five basic approaches. Each approach involves an attempt to construct a treatment and a control group in such a way that they differ only with respect to the program, mimicking an experimental situation. The treatment group represents participants. The control group represents the status of participants in the absence of the program, and is composed in such a way that it matches or represents the test group as closely as possible – with the exception that its members did not participate.
Each of the five statistical techniques has advantages and disadvantages. With the randomized approach, individuals in each group are chosen at random. This technique eliminates statistical bias but is not always acceptable from a political or social standpoint. After selection, individuals may opt not to participate in ways that are non-random. The matching approach is employed to compose test and control groups
AfJARE Vol 4 No 1 March 2010 Melinda Smale, Lamissa Diakité, Amadou Sidibé, Mikkel Grum, Hannah Jones, Issa Seni Traore and Hamidou Guindo
29
by estimating the propensity of individuals to participate based on their characteristics. Scores are sensitive to the model used to construct them, and while individuals may be well matched on observable characteristics, they may still differ in those that have not been recorded, or in unobservable characteristics. Bias caused by differences in unobservable characteristics can be addressed through the double-difference approach, which compares treatment and control groups before and after the treatment. This technique eliminates the effects of unobservable characteristics by comparing net changes in variables between two time periods. Reflexive controls compare the same group before and after the program, but ignore changes induced by factors outside the project, which can lead to false attributions. The instrumental variable approach relies on econometric methods to separate the effects of project participation from those of other factors that influence impact. Identifying valid instrumental variables is the major challenge associated with this method. Valid instrumental variables are those that determine participation but only influence impact through participation.
Only the matching and instrumental variables methods are feasible in the context of this study. An experiment could not be designed given that related project activities in Boumboro were already in the process of implementation, from 2002. The data on which the analysis is based were collected as a statistical baseline with a relatively small sample size and single-period survey because of cost constraints, which precluded either the reflexive or double difference approaches. While feasible, the matching approach is not well-suited to analyzing the impact of this project because specific socioeconomic groups were not targeted. In addition, the impact indicators we use, which are based on the management and use of crop genetic resources, are complex. Handa and Maluccio (2007) conclude that matching is more promising as an approach for evaluating easily measured outcomes, such as those related to child schooling and health, than it is for more complex outcomes, such as expenditures.
Sample design
The conceptual approach implies a sample design. The test and the control villages must be as similar as possible with respect to agro-ecology and overarching social, economic and institutional conditions. At each site, both test and control villages are located within the scope of an IFAD project. The same non-governmental organization (NGO) that is active in the test village of a site is also active in the control villages. Ethnic representation is also broadly similar.
An additional feature of this project is that one means of addressing its goal was to introduce farmers to new cultivars (both landraces and improved varieties) and to facilitate their own experimental processes as well as their informal exchange of seed and seed-related information. Customarily, farmers at the project sites depend on their own harvests or other nearby farmers for their millet and sorghum seed (Sperling et al., 2006; Diakité et al., 2008). Seed transactions most often follow ties of kin and clan, and are shaped by social and cultural norms.
AfJARE Vol 4 No 1 March 2010 Melinda Smale, Lamissa Diakité, Amadou Sidibé, Mikkel Grum, Hannah Jones, Issa Seni Traore and Hamidou Guindo
30
An effective DFF would lead to dissemination of materials from the locus villages3 to other villages where farmers have social ties. Of the two locus villages, Boumboro has the longer and more extensive history of project activities. Here, staff reported that surrounding villages have been influenced by the project through farmer visits to diversity fields cultivated by participants and farmer-to-farmer exchanges of information and seed. In their study of the effects of health programs designed to reduce intestinal worms in school children, Miguel & Kremer (2004) refer to such patterns as ‘treatment externalities’.
To address these externalities, we included in the treatment group nearby villages from which farmers had been invited to observe DFF conducted by farmers in Boumboro. Farmers sampled from these villages were not considered to be participants, however. At the Douentza site, all farmers in the treatment group are from the village of Petaka because DFF activities were much more recent and had not yet involved other villages.
In 2006, in the test villages of Boumboro and Petaka, where DFF had been established, all farmers who were active participants were interviewed. Farmers in other influenced villages near Boumboro were sampled. These and the DFF participants constitute the ‘treatment’ group. Non-participants in both Boumboro and influenced villages were also sampled at random; these constitute the ‘control’ group. Other than the census of participants, farmers were selected at random until we had a sample of 150 per site, roughly split between control and treatment groups. The control groups include at least three villages per site that had not been invited to demonstrations or field days.
Characteristics of households, farms, seed management, market participation and social capital were collected during 2006, along with yield information by variety. Data on variety attributes and additional yield data were elicited in 2007, when household demographic information was also reconfirmed. Among those households remaining in the sample, there were only a few with significant changes in composition (births and deaths).
Sample attrition, particularly at the San site, and missing responses on some variables, led to an operational sample size for this analysis of 131 farmers (62 treatment; 69 control) at the San site and 149 (56 treatment; 93 control) at the Douentza site, for a total of 280 farmers. Unfortunately, the San sample originally included some farmers from temporary populations who seek permission from longer established groups to resettle in the area. However, we posit that the remaining sample is representative of the more permanent population.
In order to simplify the text below, ‘San site’ or ‘San’ is used to refer to the clusters of test and control villages in the Cercles of San/Tominian and the ‘Douentza site’ or ‘Douentza’ refers to the parallel clusters in the Cercle of Douentza.
3 The locus village is the village where the DFF were held. Test villages include these and villages indirectly affected by the DFF.
AfJARE Vol 4 No 1 March 2010 Melinda Smale, Lamissa Diakité, Amadou Sidibé, Mikkel Grum, Hannah Jones, Issa Seni Traore and Hamidou Guindo
31
Impact indicators
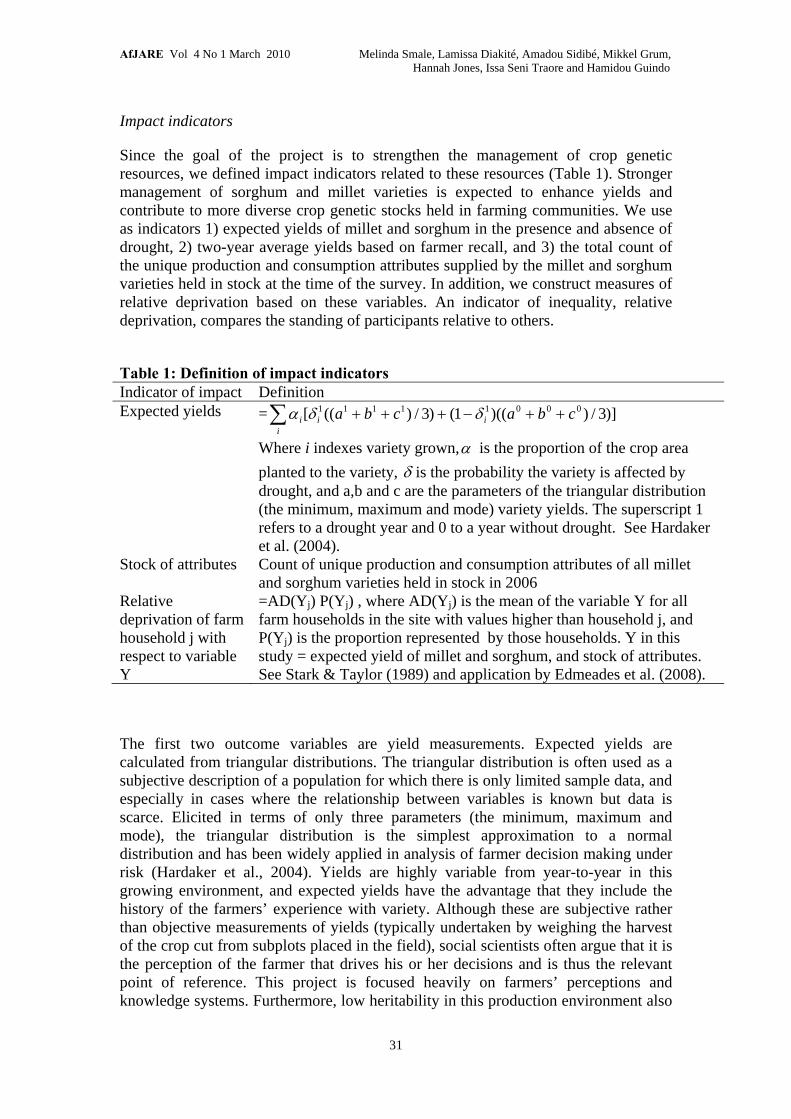
Since the goal of the project is to strengthen the management of crop genetic resources, we defined impact indicators related to these resources (Table 1). Stronger management of sorghum and millet varieties is expected to enhance yields and contribute to more diverse crop genetic stocks held in farming communities. We use as indicators 1) expected yields of millet and sorghum in the presence and absence of drought, 2) two-year average yields based on farmer recall, and 3) the total count of the unique production and consumption attributes supplied by the millet and sorghum varieties held in stock at the time of the survey. In addition, we construct measures of relative deprivation based on these variables. An indicator of inequality, relative deprivation, compares the standing of participants relative to others.
Table 1: Definition of impact indicators Indicator of impact Definition Expected yields = )]3/))((1()3/)(([ 00011111 cbacba ii
ii
Where i indexes variety grown, is the proportion of the crop area
planted to the variety, is the probability the variety is affected by drought, and a,b and c are the parameters of the triangular distribution (the minimum, maximum and mode) variety yields. The superscript 1 refers to a drought year and 0 to a year without drought. See Hardaker et al. (2004).
Stock of attributes Count of unique production and consumption attributes of all millet and sorghum varieties held in stock in 2006
Relative deprivation of farm household j with respect to variable Y
=AD(Yj) P(Yj) , where AD(Yj) is the mean of the variable Y for all farm households in the site with values higher than household j, and P(Yj) is the proportion represented by those households. Y in this study = expected yield of millet and sorghum, and stock of attributes. See Stark & Taylor (1989) and application by Edmeades et al. (2008).
The first two outcome variables are yield measurements. Expected yields are calculated from triangular distributions. The triangular distribution is often used as a subjective description of a population for which there is only limited sample data, and especially in cases where the relationship between variables is known but data is scarce. Elicited in terms of only three parameters (the minimum, maximum and mode), the triangular distribution is the simplest approximation to a normal distribution and has been widely applied in analysis of farmer decision making under risk (Hardaker et al., 2004). Yields are highly variable from year-to-year in this growing environment, and expected yields have the advantage that they include the history of the farmers’ experience with variety. Although these are subjective rather than objective measurements of yields (typically undertaken by weighing the harvest of the crop cut from subplots placed in the field), social scientists often argue that it is the perception of the farmer that drives his or her decisions and is thus the relevant point of reference. This project is focused heavily on farmers’ perceptions and knowledge systems. Furthermore, low heritability in this production environment also
AfJARE Vol 4 No 1 March 2010 Melinda Smale, Lamissa Diakité, Amadou Sidibé, Mikkel Grum, Hannah Jones, Issa Seni Traore and Hamidou Guindo
32
means that a yield measurement taken in one field or point in time will provide limited information. The survey team also elicited yields that were based on farmers’ recall of 2006 and 2007 harvests, but these were not thought to be representative. Yields in Douentza, for example, were extremely low due to locust infestation in some villages. Nonetheless, we have also included these as outcome variables.
Each farmer surveyed was asked, for each variety grown, the minimum, maximum and mode production from all plots under that variety, in years with and without drought. These were divided by plot area to obtain minimum, maximum and mode yields. To estimate the probability of drought stress, farmers were asked to report the number of years they had grown each variety and the number of years of drought stress during that period. The minimum, maximum and most frequent (mode) yields were then elicited for years with and without drought stress. Unconditional expected yields were calculated on the basis of the probabilities of each type of year and corresponding yield estimates. The average unconditional expected yield per farm was calculated by multiplying each variety’s unconditional expected yield by that variety’s proportion of total crop area (see equation in Table 1).
The third outcome variable, the count of unique production and consumption attributes, is a rough indicator of the perceived ‘richness’ of traits and uses embedded in the seed stored on the farm at the time of the survey. Farmers were asked to list all millet and sorghum varieties in stock and, for each variety, to list production characteristics and consumption uses. From farmers’ responses, a common ‘spanning set’ of production traits and consumption uses was identified. For millet and then for sorghum, each was counted only once for all varieties stocked by each farm household. This indicator recognizes that subsistence oriented farmers manage a set of varieties to address a complex combination of needs and constraints and that, typically, no single variety meets all their needs (Bellon, 1996). Thus, researchers have hypothesized that farmers with multiple objectives, and particularly those who cannot easily achieve their objectives by trading in markets, will manage more diverse varieties.
Other indicators are based on the concept of relative deprivation – a measure of inequality that has been applied in studies of migrant laborers (Stark & Taylor, 1989). Recently, this concept was applied in a study of hybrid banana adoption by Edmeades et al. (2008). An index was constructed for expected millet yields, expected sorghum yields, and the count of unique variety attributes. The index compares the status of each farm in the sample to all other farms at that project site, and is constructed by weighting the mean of all individuals with higher status by their sample proportion. The larger the number, the greater the relative deprivation of a farm with respect to the characteristic in question.
Econometric model
Instrumental variables regression can be used to explain variation in impact indicators among household farms while controlling for the effects of underlying observable and unobservable factors. Instrumental variables models are special cases of simultaneous regression models in which the causality of the relationship is recursive but the interrelationship among the error terms of the two equations is explicit. In this case,
AfJARE Vol 4 No 1 March 2010 Melinda Smale, Lamissa Diakité, Amadou Sidibé, Mikkel Grum, Hannah Jones, Issa Seni Traore and Hamidou Guindo
33
participation affects outcome variables but outcome variables do not affect participation.
The general form of the instrumental variables model is
ii vy 22i11i θxθx (1)
iiii yz 211 βx (2)
where the dependent variables include y , which measures participation, which is an endogenous regressor, and z , which measures the impacts of participation. The vector 1x represents a set of explanatory variables that influence both participation and
impacts, and the vector 2x includes instrumental variables that explain participation only. The error terms of the equations, v and , have means of zero but are correlated.
In this analysis, participation is a dichotomous variable (1=participation, 0 else). Angrist (1999) has shown that in models with dummy endogenous variables and non-negative outcome variables, if the focus of the analysis is to estimate the causal effects of treatment rather than the magnitude of structural parameters, a number of simple strategies, such as two-stage least squares, can be applied. Two-stage least squares produces consistent estimators of the ‘local average treatment effect’ that are less sensitive to assumptions about functional form than probit or logit (Angrist & Krueger, 2001:77). To improve the efficiency of estimation when heteroskedasticity is present, the generalized method of moments is recommended. Standard diagnostic statistics include tests of a) the endogeneity of the first-stage dependent variable, b) the relevance of the instruments, and c) model identification.
Explanatory variables (x1) that are common to both the participation and impact equation represent components of the ‘asset pentagon’, as conceptualized in the project according to the basic livelihoods framework. Human capital is measured in terms of the ratio of economically active persons to the total number of persons in the farm.4 The age limit for the numerator was arbitrarily set at 12 years of age (adulthood). The total value of livestock and material assets inventoried by the patriarch of the farm is the indicator of farm physical capital. Variables for human capital and farm physical capital were both highly correlated with total land area, suggesting that farm production is based on fairly fixed proportions of these three critical inputs (use of purchased inputs is negligible). Financial capital is represented by per capita cash income, calculated as the total annual expenditures for the farm divided by farm size. In this type of agricultural economy, where savings are in the form of land, livestock or other material assets, eliciting cash expenditure is thought to generate less bias than eliciting income. Enumerators asked the patriarch of the farm to report expenditures by category. The total number of unique associations to which any member of the farm belongs is used as an indicator of social capital.
4 All human capital variables were inter-correlated (age and education of the household head, number of adult women, number of adult men, number of household members with any education), and the active ratio was the least correlated with other explanatory variables.
AfJARE Vol 4 No 1 March 2010 Melinda Smale, Lamissa Diakité, Amadou Sidibé, Mikkel Grum, Hannah Jones, Issa Seni Traore and Hamidou Guindo
34
Other key explanatory factors are those related to treatment, site and orientation of production. The site variable represents major differences in agro-ecology, ethnicity and social structure, but also in market infrastructure. The treatment variable controls for indirect effects of the project in the locus villages and other test villages.5 Specialization of production in one target crop rather than another is expressed in the share of target crop area allocated to millet. Target crops include millet, sorghum and cowpea. The target crop area was summed over plots where these crops were the principal or sole crop. Very few plots were planted to cowpea as the principal or sole crop.
The last variable related to orientation of production is the number of markets in which household members buy or sell millet or sorghum. Since these are not commercial farming operations, no certified seed is sold in markets, and other purchased inputs are rarely used, the count of markets has no direct relationship to expected yields. In a commercial farming system, a direct relationship between variety choice (a modern variety, for example) and market involvement might be expected. Nevertheless, we hypothesize that market involvement may relate to the desire of household members to procure and test new materials in DFF, either because they sell, or because they are food-deficit, i.e. they produce less than their food requirements, or because there are unobservable factors that cause a farmer to seek information, whether in village markets or in project activities.
Instrumental variables (x2) are those that affect participation but have no effect on impacts other than through participation, and are uncorrelated with the error terms of the impacts equation. These variables are 1) whether or not the patriarch has a Koranic education (instead of, or in addition to, public school attendance), and 2) the binary variable ‘treatment’ which controls for the indirect effects of the project. The variable ‘Koranic education’ is not highly correlated with any of the outcome variables (correlation coefficient range from -.02 to 0.37).
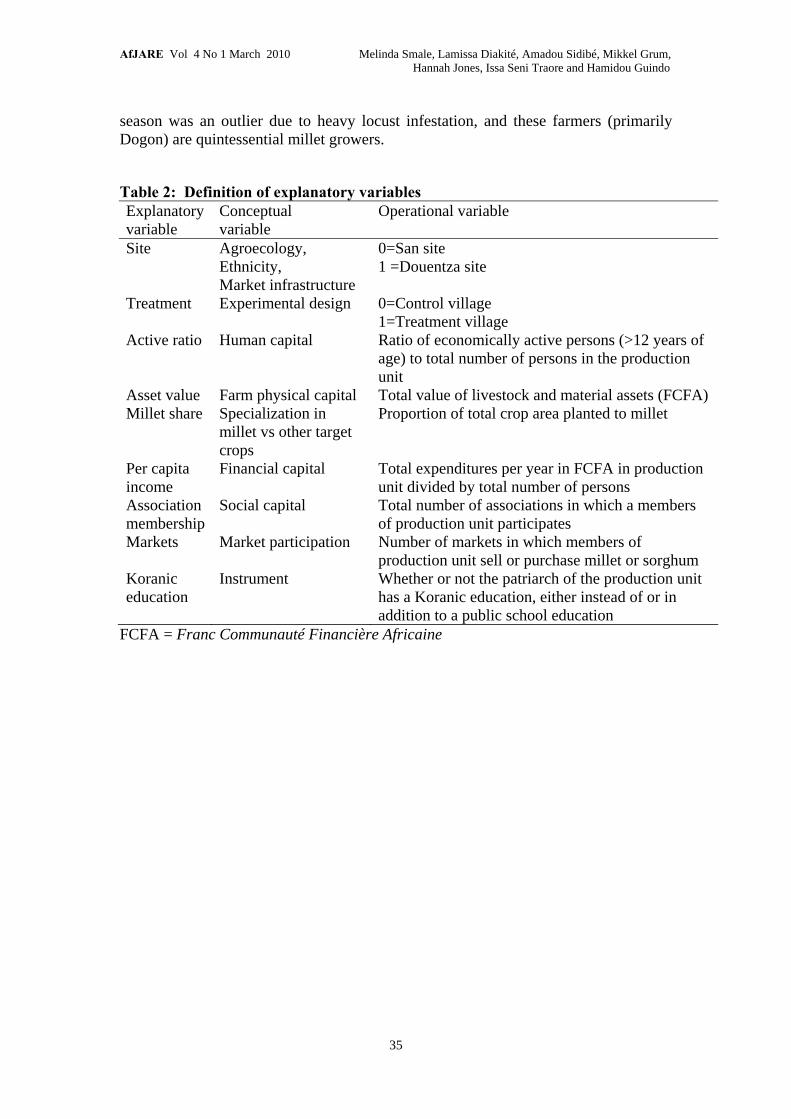
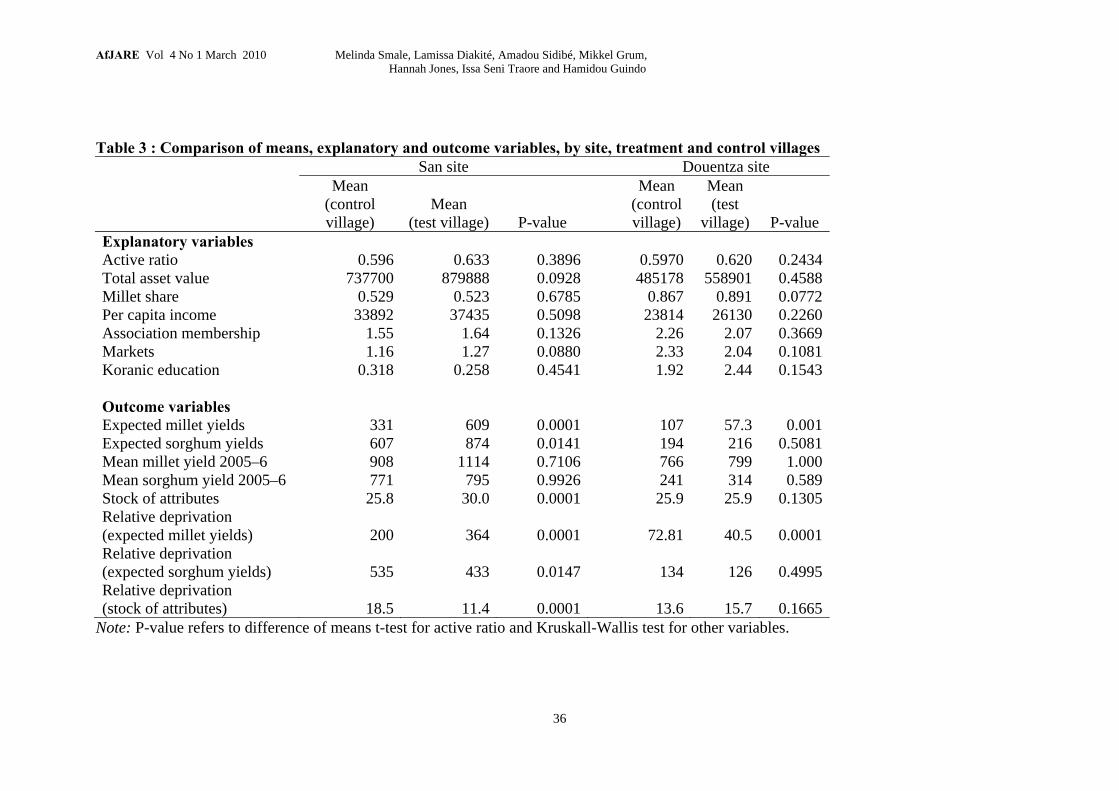
Explanatory variables are defined in Table 2, and means and standard deviations of explanatory variables are shown in Table 3. The null hypothesis that variable means are equal between test and control villages cannot be rejected at the 0.05 level of significance, although p-values are significant at the 0.10 level for total asset value and number of markets at the San site, and millet share and number of markets at the Douentza site. Additional comparisons of sample characteristics in the project baseline document6 indicate few statistically significant differences with respect to human, farm physical, financial and social capital between the treatment and control groups, with important differences between sites.
Differences in outcome variables by treatment and control group are pronounced at the San site for all outcome variables except average millet and sorghum yields in 2005–06. At Douentza, statistically significant differences are apparent only for expected millet yields and relative deprivation with respect to millet yields. The 2005
5 Although it would have been preferable to estimate separate models for the direct and spillover effects of the DFF on farmers, it was not possible for the survey team to identify the individual farmers from other villages who had procured seed when visiting Boumboro. This would have required close monitoring over time by a member of the DFF, which must be built into the original research design. 6 Available from the authors.
AfJARE Vol 4 No 1 March 2010 Melinda Smale, Lamissa Diakité, Amadou Sidibé, Mikkel Grum, Hannah Jones, Issa Seni Traore and Hamidou Guindo
35
season was an outlier due to heavy locust infestation, and these farmers (primarily Dogon) are quintessential millet growers.
Table 2: Definition of explanatory variables Explanatory variable
Conceptual variable
Operational variable
Site Agroecology, Ethnicity, Market infrastructure
0=San site 1 =Douentza site
Treatment Experimental design 0=Control village 1=Treatment village
Active ratio Human capital Ratio of economically active persons (>12 years of age) to total number of persons in the production unit
Asset value Farm physical capital Total value of livestock and material assets (FCFA) Millet share Specialization in
millet vs other target crops
Proportion of total crop area planted to millet
Per capita income
Financial capital Total expenditures per year in FCFA in production unit divided by total number of persons
Association membership
Social capital Total number of associations in which a members of production unit participates
Markets Market participation Number of markets in which members of production unit sell or purchase millet or sorghum
Koranic education
Instrument Whether or not the patriarch of the production unit has a Koranic education, either instead of or in addition to a public school education
FCFA = Franc Communauté Financière Africaine
AfJARE Vol 4 No 1 March 2010 Melinda Smale, Lamissa Diakité, Amadou Sidibé, Mikkel Grum, Hannah Jones, Issa Seni Traore and Hamidou Guindo
36
Table 3 : Comparison of means, explanatory and outcome variables, by site, treatment and control villages
San site Douentza site Mean
(control village)
Mean (test village) P-value
Mean (control village)
Mean (test
village) P-value Explanatory variables Active ratio 0.596 0.633 0.3896 0.5970 0.620 0.2434Total asset value 737700 879888 0.0928 485178 558901 0.4588Millet share 0.529 0.523 0.6785 0.867 0.891 0.0772Per capita income 33892 37435 0.5098 23814 26130 0.2260Association membership 1.55 1.64 0.1326 2.26 2.07 0.3669Markets 1.16 1.27 0.0880 2.33 2.04 0.1081Koranic education 0.318 0.258 0.4541 1.92 2.44 0.1543 Outcome variables Expected millet yields 331 609 0.0001 107 57.3 0.001Expected sorghum yields 607 874 0.0141 194 216 0.5081Mean millet yield 2005–6 908 1114 0.7106 766 799 1.000Mean sorghum yield 2005–6 771 795 0.9926 241 314 0.589Stock of attributes 25.8 30.0 0.0001 25.9 25.9 0.1305Relative deprivation (expected millet yields) 200 364 0.0001 72.81 40.5 0.0001Relative deprivation (expected sorghum yields) 535 433 0.0147 134 126 0.4995Relative deprivation (stock of attributes) 18.5 11.4 0.0001 13.6 15.7 0.1665
Note: P-value refers to difference of means t-test for active ratio and Kruskall-Wallis test for other variables.
AfJARE Vol 4 No 1 March 2010 Melinda Smale, Lamissa Diakité, Amadou Sidibé, Mikkel Grum, Hannah Jones, Issa Seni Traore and Hamidou Guindo
37
4. Findings
Instrumental variables regression
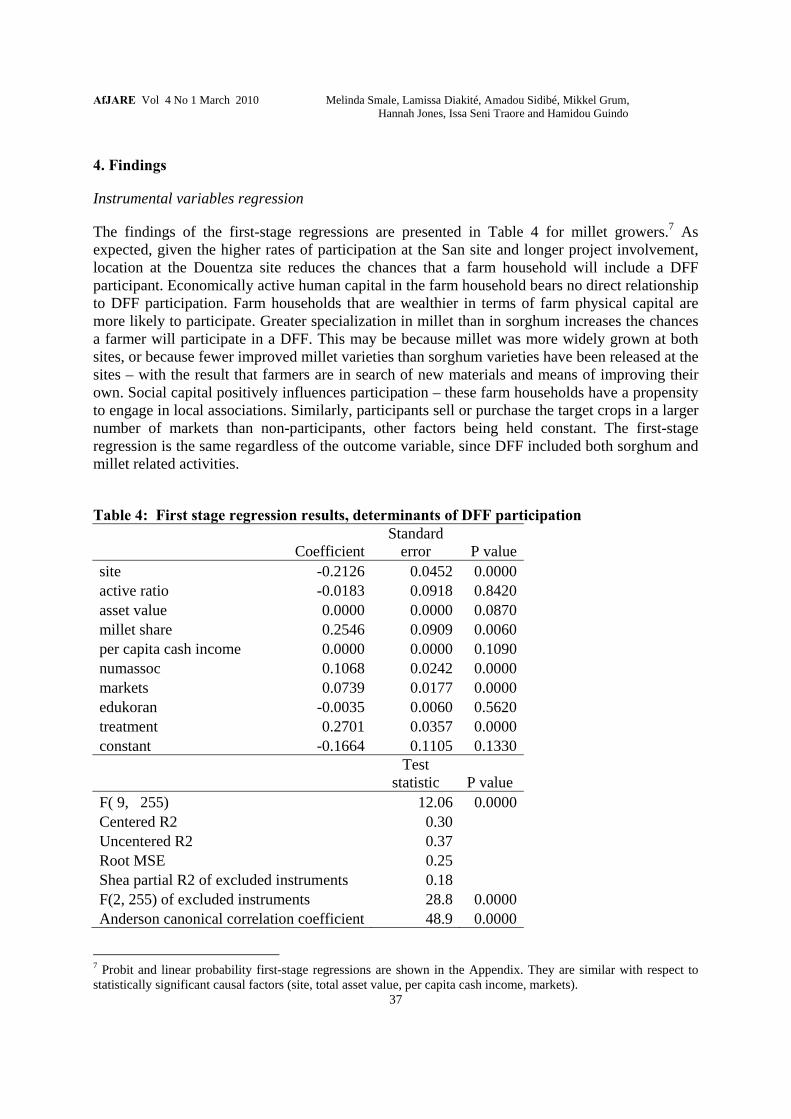
The findings of the first-stage regressions are presented in Table 4 for millet growers.7 As expected, given the higher rates of participation at the San site and longer project involvement, location at the Douentza site reduces the chances that a farm household will include a DFF participant. Economically active human capital in the farm household bears no direct relationship to DFF participation. Farm households that are wealthier in terms of farm physical capital are more likely to participate. Greater specialization in millet than in sorghum increases the chances a farmer will participate in a DFF. This may be because millet was more widely grown at both sites, or because fewer improved millet varieties than sorghum varieties have been released at the sites – with the result that farmers are in search of new materials and means of improving their own. Social capital positively influences participation – these farm households have a propensity to engage in local associations. Similarly, participants sell or purchase the target crops in a larger number of markets than non-participants, other factors being held constant. The first-stage regression is the same regardless of the outcome variable, since DFF included both sorghum and millet related activities.
Table 4: First stage regression results, determinants of DFF participation
CoefficientStandard
error P valuesite -0.2126 0.0452 0.0000active ratio -0.0183 0.0918 0.8420asset value 0.0000 0.0000 0.0870millet share 0.2546 0.0909 0.0060per capita cash income 0.0000 0.0000 0.1090numassoc 0.1068 0.0242 0.0000markets 0.0739 0.0177 0.0000edukoran -0.0035 0.0060 0.5620treatment 0.2701 0.0357 0.0000constant -0.1664 0.1105 0.1330
Test
statistic P value F( 9, 255) 12.06 0.0000Centered R2 0.30 Uncentered R2 0.37 Root MSE 0.25 Shea partial R2 of excluded instruments 0.18 F(2, 255) of excluded instruments 28.8 0.0000Anderson canonical correlation coefficient 48.9 0.0000
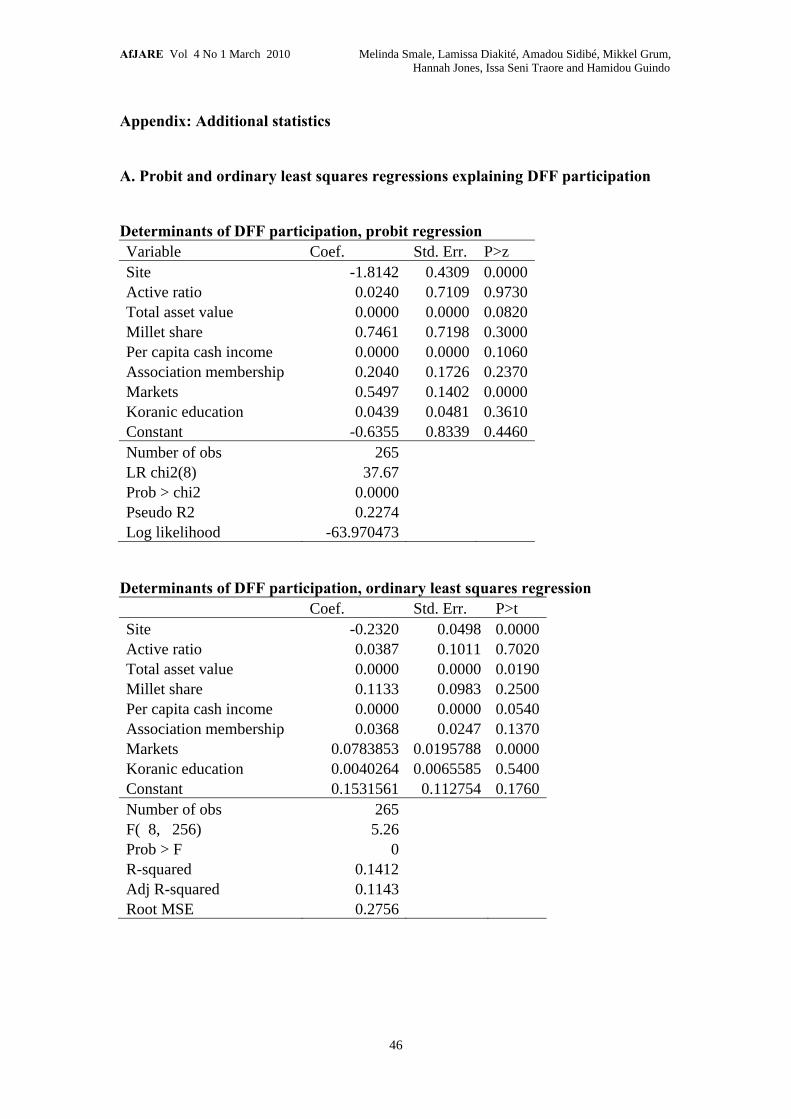
7 Probit and linear probability first-stage regressions are shown in the Appendix. They are similar with respect to statistically significant causal factors (site, total asset value, per capita cash income, markets).
AfJARE Vol 4 No 1 March 2010 Melinda Smale, Lamissa Diakité, Amadou Sidibé, Mikkel Grum, Hannah Jones, Issa Seni Traore and Hamidou Guindo
38
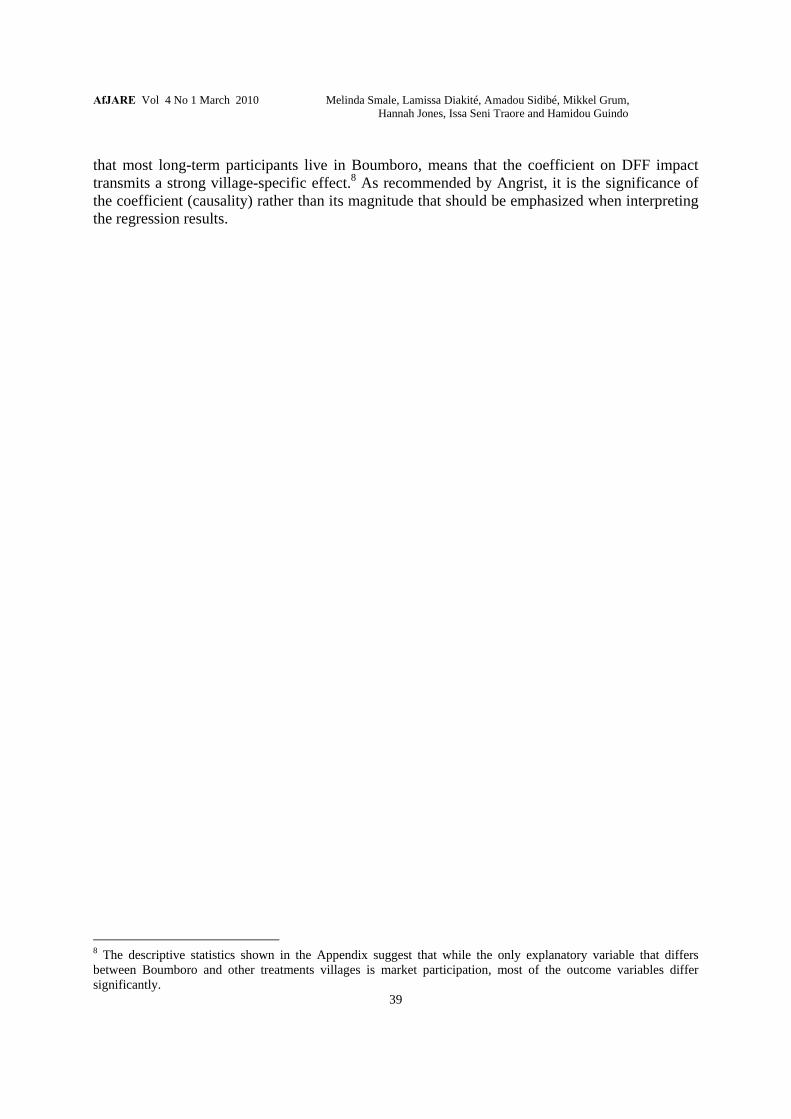
Second-stage regression results for each impact indicator are displayed in Table 5. Taking into account underlying observable and unobservable factors that predict participation in DFF, participation influences all the outcome variables with a high degree of statistical significance except average recalled sorghum yields.
Location at the Douentza site offsets estimated yield impacts, but augments stock of attributes and further reduces relative deprivation. The pervasive harshness of this environment, combined with the social structure of the Dogon, is a strong leveler of inequality. The greater degree of self-reliance makes it important for farmers to stock the varieties with attributes that span both their consumption and production needs.
While being wealthier enhances the likelihood of participation, it has a negative impact on yields per hectare once participation has been considered – perhaps because these factors are associated with a more extensive operation and crop area that are harder to manage as effectively. As expected, specialization in millet positively influences recalled millet yield, and negatively influences recalled sorghum yield and the total stock of attributes. Per capita cash income is statistically significant only in the recalled millet yield regression, and social capital is insignificant in explaining outcomes once DFF participation has been taken into account. Market participation is significant only in the expected millet yield and deprivation model.
In all except the expected millet yield and attribute stock regressions, the null hypothesis of homoskedasticity was rejected and the regression was estimated with GMM (Generalized Method of Moments), so that robust standard errors are reported. The Hausman test led to rejection of the hypothesis that DFF participation is exogenous in all cases except the regressions for expected sorghum yields and the relative deprivation with respect to the stock of attributes. The Anderson canonical correlation statistic based on the first-stage regression is highly significant, supporting the relevance of the instruments. The values of the Sargan statistic (in the presence of homoskedasticity) or Hansen J statistic (in the presence of heteroskedasticity) results in failure to reject the null hypothesis for each of the outcome equations. Thus, the instruments in the first-stage regression are uncorrelated with the error term in the second-stage regression. Rejection of the null hypothesis would have indicated either a misspecification of the second-stage regression or an invalid instrument.
Three caveats are important to remember in interpreting findings. The first is that while we assert that use of longer-term, subjective yields is more reliable than actual recent yields, it is evident that these variables measure primarily changes in perceptions. They are not highly correlated with average yields based on recall, which is to be expected given the year-to-year variability in rainfall conditions and the fact that 2005 was an outlier season at the Douentza site. In Boumboro, the project has been operational from 1999 – but not so in Petaka – where project impacts are not evident for either expected and recalled yields once other variables have been taken into account.
In addition, it is important to recognize that unobservable factors may explain both the decision to participate and yield expectations, which would contribute to an upward bias in estimated coefficients. Finally, the wide variation in average yields among villages, combined with the fact
AfJARE Vol 4 No 1 March 2010 Melinda Smale, Lamissa Diakité, Amadou Sidibé, Mikkel Grum, Hannah Jones, Issa Seni Traore and Hamidou Guindo
39
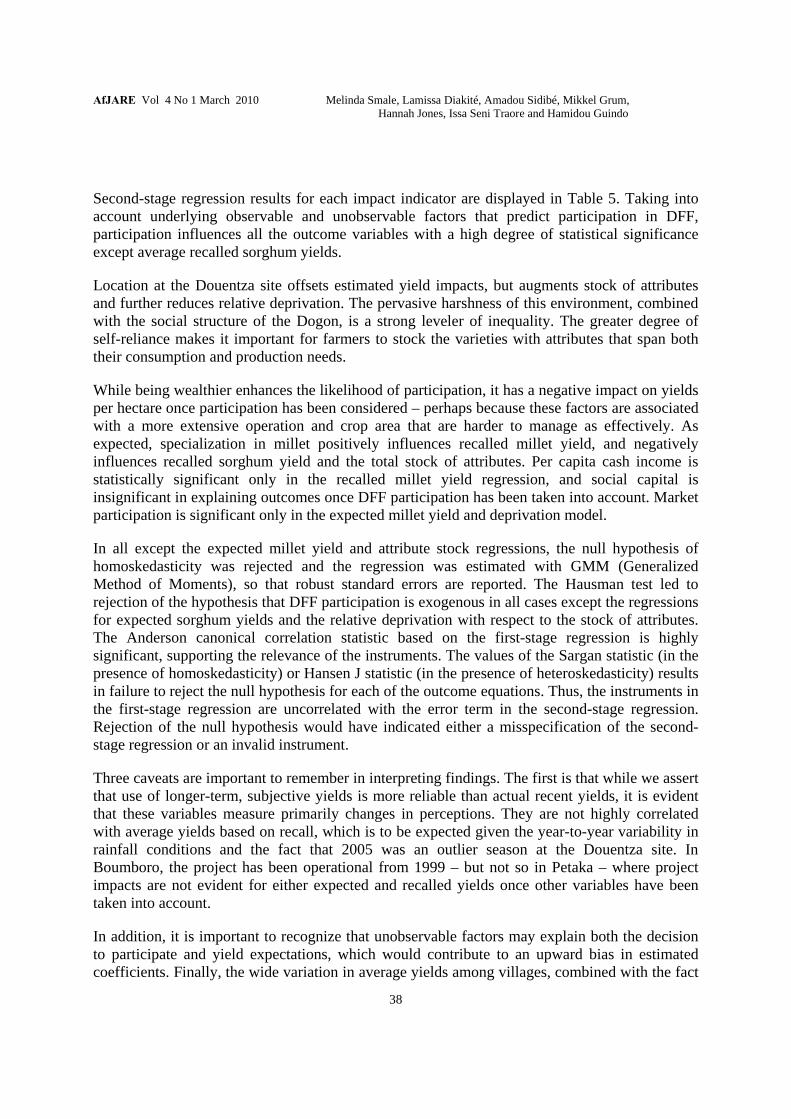
that most long-term participants live in Boumboro, means that the coefficient on DFF impact transmits a strong village-specific effect.8 As recommended by Angrist, it is the significance of the coefficient (causality) rather than its magnitude that should be emphasized when interpreting the regression results.
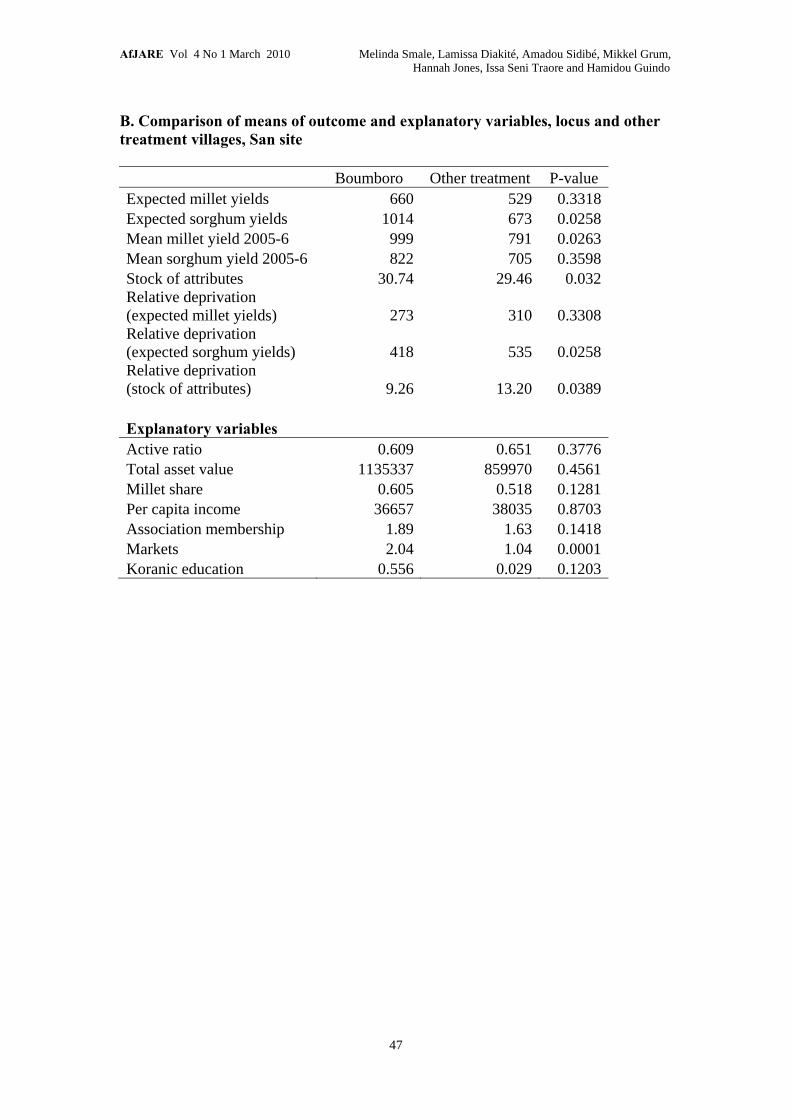
8 The descriptive statistics shown in the Appendix suggest that while the only explanatory variable that differs between Boumboro and other treatments villages is market participation, most of the outcome variables differ significantly.
AfJARE Vol 4 No 1 March 2010 Melinda Smale, Lamissa Diakité, Amadou Sidibé, Mikkel Grum, Hannah Jones, Issa Seni Traore and Hamidou Guindo
40
Table 5: Second stage regression, impact of farm household participation in DFFs on crop genetic resource management
Expected millet
yield
Expected sorghum
yield
Mean millet yield (2005-06)
Mean sorghum
yield (2005-06)
Stock of attributes
Relative deprivation (millet)
Relative deprivation (sorghum)
Relative deprivation (attributes)
cd 364 543 463 321 5.76 -205 -212 -8.01
0.0000 0.0040 0.0040 0.1060 0.0060 0.0000 0.0020 0.0220
site -331 -683 -539 -409 1.61 -347 -462 -5.27
0.0000 0.0000 0.0000 0.0000 0.1780 0.0000 0.0000 0.0010
active ratio -155 -162 -39.0 2.660 0.949 63.9 47.2 -0.154
0.1190 0.3380 0.8680 0.9850 0.6310 0.1090 0.4020 0.9570
asset value -0.0000388 -0.0000558 -0.0004070 -0.0001920 -
0.000000253 0.0000167 0.0000179 0.000000367
0.1000 0.0800 0.0000 0.0000 0.5580 0.1050 0.1000 0.4510
millet share -55.0 209 659 -682 -8.21 33.5 -74.1 10.2
0.6270 0.2660 0.0040 0.0000 0.0000 0.4650 0.2230 0.0000
per capita cash income 0.000937 -0.001096 -0.004770 -0.001720 0.0000317 -0.000414 0.000197 -0.0000810
0.4410 0.5820 0.0640 0.2570 0.1950 0.3770 0.7510 0.0250
numassoc 14.70 29.5000 5.80 -1.1400 -0.075 -5.47 -7.94 0.321
0.4100 0.3270 0.9210 0.9730 0.8790 0.4620 0.4460 0.6490
markets -36.9 -11.1 72.3 13.6 -0.390 18.2 2.1 0.272 0.0110 0.6210 0.1700 0.6600 0.3780 0.0060 0.8070 0.6490Hansen J statistic 1.4430 0.032 0.7010 0.594 0.908 0.988 0.154 0.958or Sargan test P=0.2246 P=0.8573 P=0.4024 P=0.441 P=0.3407 P=0.3203 P=0.6950 P=0.3278Uncentered R2 0.6548 0.6284 0.6902 0.7081 0.958 0.8511 0.8774 0.7848Hausman test P= 0.00296 P=0.14226 P=0.05202 P=0.07029 P=0.05583 P=0.00013 P=0.04773 P=0.26991
Note: In all cases except mean yields and stocks of attributes, the null hypothesis of homoskedasticity was rejected and the regression was estimated with GMM. For GMM, standard errors are robust. P-values are reported under the estimated regression coefficient.
AfJARE Vol 4 No 1 March 2010 Melinda Smale, Lamissa Diakité, Amadou Sidibé, Mikkel Grum, Hannah Jones, Issa Seni Traore and Hamidou Guindo
41
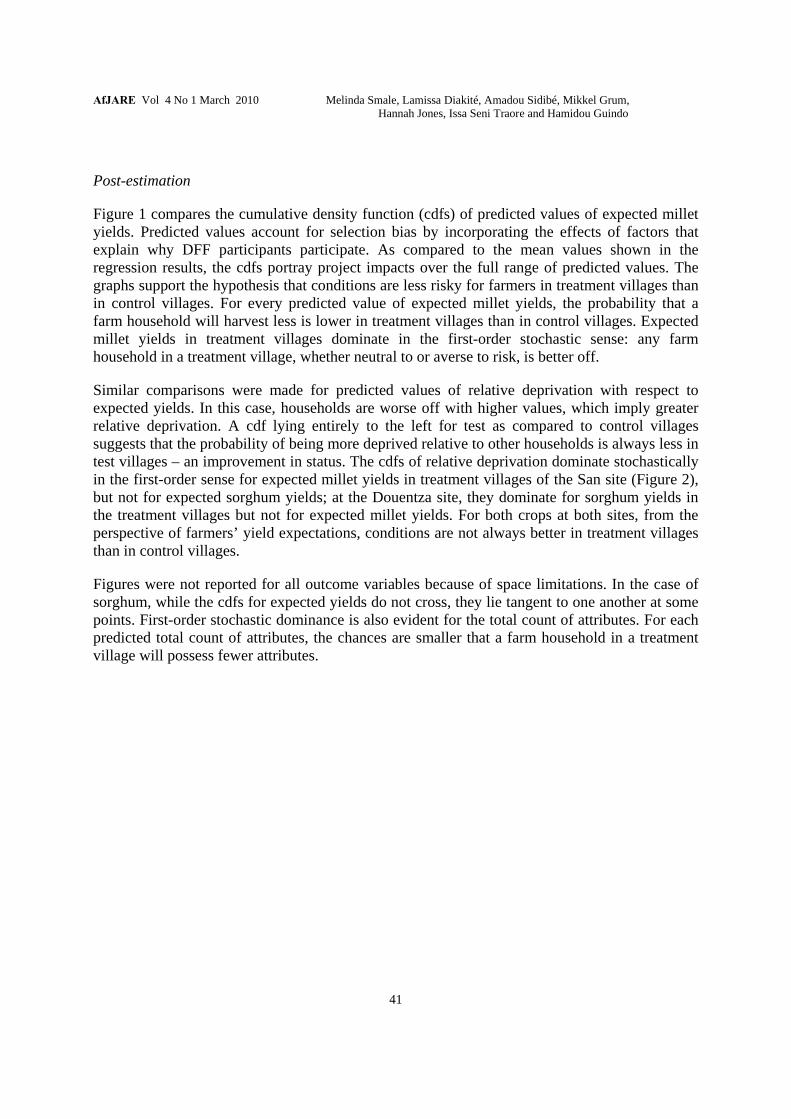
Post-estimation
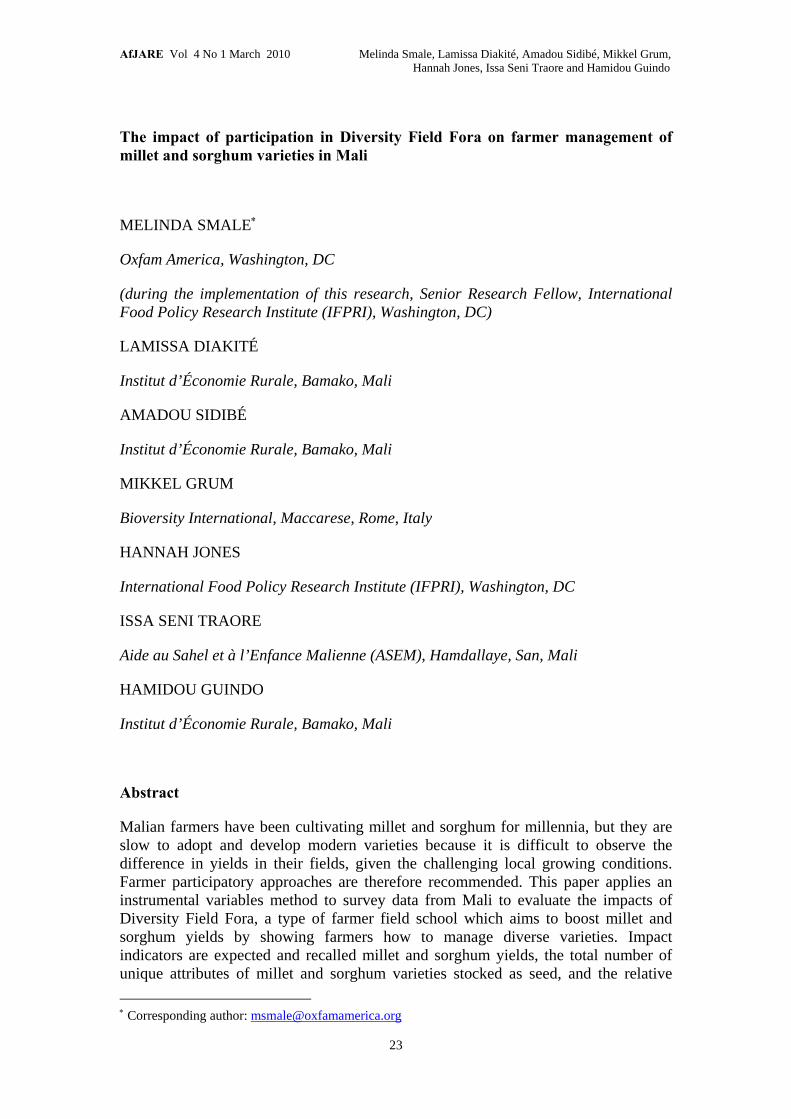
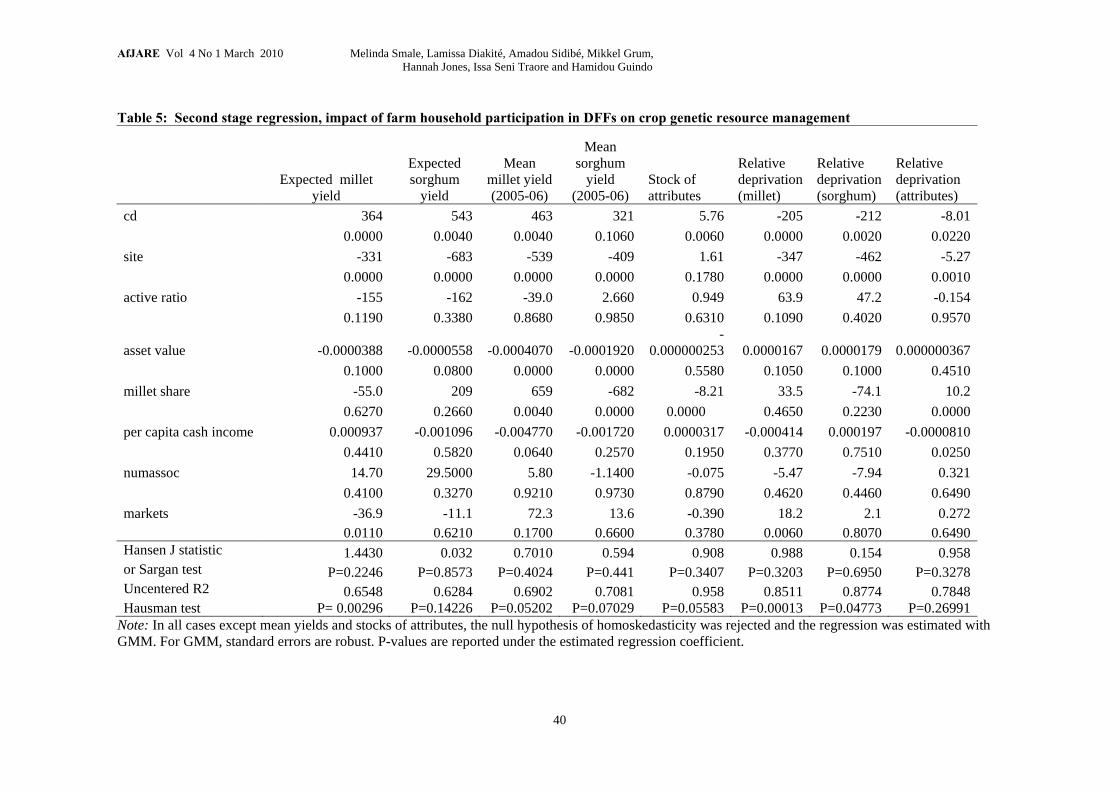
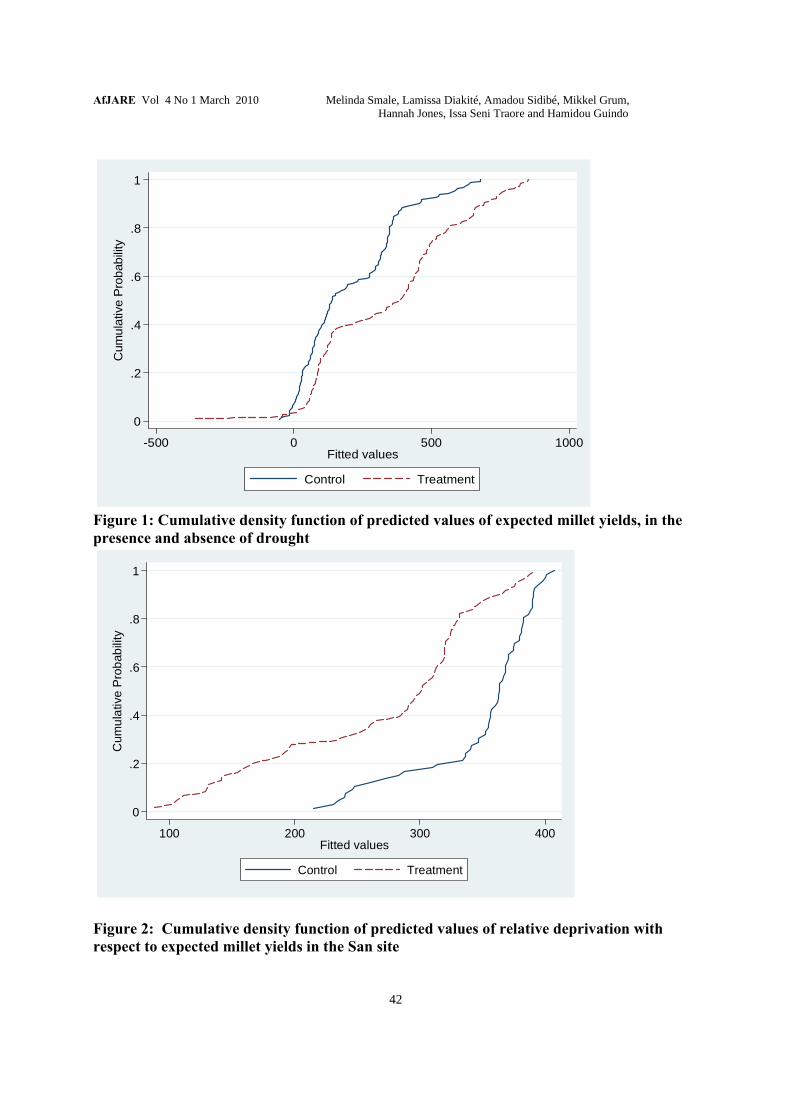
Figure 1 compares the cumulative density function (cdfs) of predicted values of expected millet yields. Predicted values account for selection bias by incorporating the effects of factors that explain why DFF participants participate. As compared to the mean values shown in the regression results, the cdfs portray project impacts over the full range of predicted values. The graphs support the hypothesis that conditions are less risky for farmers in treatment villages than in control villages. For every predicted value of expected millet yields, the probability that a farm household will harvest less is lower in treatment villages than in control villages. Expected millet yields in treatment villages dominate in the first-order stochastic sense: any farm household in a treatment village, whether neutral to or averse to risk, is better off.
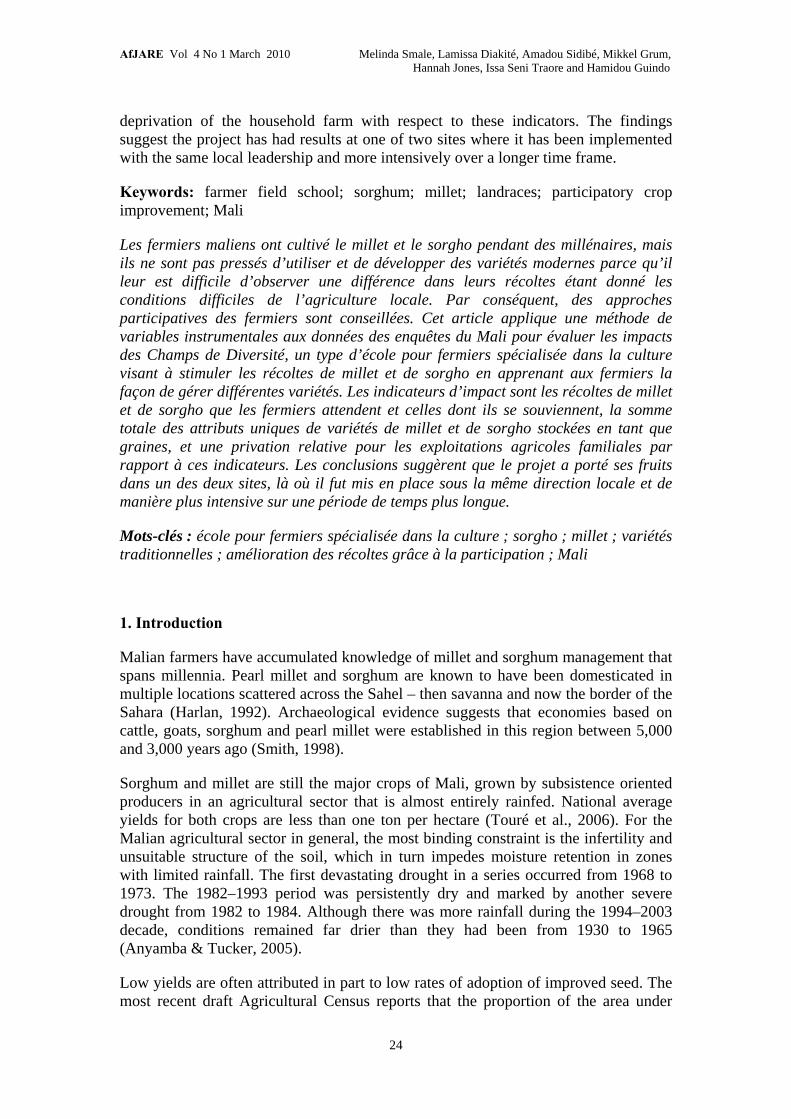
Similar comparisons were made for predicted values of relative deprivation with respect to expected yields. In this case, households are worse off with higher values, which imply greater relative deprivation. A cdf lying entirely to the left for test as compared to control villages suggests that the probability of being more deprived relative to other households is always less in test villages – an improvement in status. The cdfs of relative deprivation dominate stochastically in the first-order sense for expected millet yields in treatment villages of the San site (Figure 2), but not for expected sorghum yields; at the Douentza site, they dominate for sorghum yields in the treatment villages but not for expected millet yields. For both crops at both sites, from the perspective of farmers’ yield expectations, conditions are not always better in treatment villages than in control villages.
Figures were not reported for all outcome variables because of space limitations. In the case of sorghum, while the cdfs for expected yields do not cross, they lie tangent to one another at some points. First-order stochastic dominance is also evident for the total count of attributes. For each predicted total count of attributes, the chances are smaller that a farm household in a treatment village will possess fewer attributes.
AfJARE Vol 4 No 1 March 2010 Melinda Smale, Lamissa Diakité, Amadou Sidibé, Mikkel Grum, Hannah Jones, Issa Seni Traore and Hamidou Guindo
42
0
.2
.4
.6
.8
1
Cum
ula
tive
Pro
bab
ility
-500 0 500 1000Fitted values
Control Treatment
Figure 1: Cumulative density function of predicted values of expected millet yields, in the presence and absence of drought
0
.2
.4
.6
.8
1
Cum
ula
tive
Pro
bab
ility
100 200 300 400Fitted values
Control Treatment
Figure 2: Cumulative density function of predicted values of relative deprivation with respect to expected millet yields in the San site
AfJARE Vol 4 No 1 March 2010 Melinda Smale, Lamissa Diakité, Amadou Sidibé, Mikkel Grum, Hannah Jones, Issa Seni Traore and Hamidou Guindo
43
5. Conclusions
Despite continued progress in breeding improved sorghum and millet varieties, and the gradual process of seed sector reform, adoption rates are often considered to be relatively low in Mali – a nation whose rural population has depended on sorghum and millet for millennia. Some researchers have recommended more involvement of farmers themselves in evaluating and disseminating promising varieties. This paper has evaluated a pilot effort to involve farmers through Diversity Field Fora, which build on the concepts of farmer field schools. DFF aim to strengthen farmers’ capacity to manage diverse millet and sorghum varieties, thereby improving productivity.
Regression results concur with previous assessments of farmer field schools in demonstrating that participants in DFF are more likely to possess more social and farm physical capital than non-participants. Participation has a positive impact on expected sorghum and millet yields, recalled millet yields and the stock of variety attributes, enhancing participants’ standing relative to other farmers at the project site with respect to these impact indicators. Farmers in treatment villages are better off in terms of expected yields and attribute stocks throughout the range of predicted values. A significantly higher probability of participation at the San site, combined with the regression and descriptive results, indicates that the impacts of DFF were principally observed at this site in the village of Boumboro, where local field staff have been continuously engaged for a much longer period of time. However, inequality with respect to millet and sorghum crop genetic resources appears to be greater at the San site than at Douentza.
Two policy points with respect to DFF emerge from these findings. First, long-term commitment to fostering local leadership and capacity is likely to be a key factor in achieving impacts with this type of extension approach. The local leader at the San site has been trained on site and abroad, and has established his own NGO in surrounding communities. Second, for precisely this reason, it will be difficult to scale up impacts from one village to many without supporting, coordinated investments by national public institutions and donors.
This analysis has focused on statistical methods that reduce bias and the measurable, immediate impacts of DFF. Although farmer selection bias associated with participation has been taken into account, the findings cannot be generalized to other communities unless these communities conform to the criteria used to select sites. A more comprehensive evaluation, which would require the application of additional analytical approaches over a longer time period and in multiple locations – is not yet justified by the amount of funds invested in DFF nationwide. As more participatory research efforts are undertaken in Mali, however, these evaluations will be crucial.
AfJARE Vol 4 No 1 March 2010 Melinda Smale, Lamissa Diakité, Amadou Sidibé, Mikkel Grum, Hannah Jones, Issa Seni Traore and Hamidou Guindo
44
References
Angrist, J, 1999. Estimation of limited-dependent variable models with dummy endogenous regressors: Simple strategies for empirical practice. MIT Economics Department Working Paper 99-31. Massachusetts Institute of Technology, Cambridge, US.
Angrist, JD & Krueger, AG, 2001. Instrumental variables and the search for identification: From supply and demand to natural experiments. Journal of Economic Perspectives 15(4), 69–85.
Anyamba, A & Tucker, CJ, 2005. Analysis of Sahelian vegetation dynamics using NOAA_AVHRR NDVI data from 1981–2003. Journal of Arid Environments 63, 596–614.
Bazile, D, 2006. State-farmer partnerships for seed diversity in Mali. Gatekeeper Series 127. IIED (International Institute for Environment and Development, London.
BCRA (Bureau Central du Recensement Agricole), 2006. Recensement General de l’Agriculture 2004. Ministère de l’Agriculture, Ministère de l’Élevage et de la Pêche, Ministère du Plan et de l’Amenagement du Territoire, Bamako, Mali.
Bellon, M, 1996. The dynamics of crop infra-specific diversity: A conceptual framework at the farmer level. Economic Botany 50(1), 26–39.
Davis, K, 2006. Commentary. Farmer field schools: A boon or bust for extension in Africa? Journal of International Agricultural and Extension Education 13(1), 91–6.
De Vries, J & Toenniessen, G, 2001. Securing the harvest: Biotechnology, breeding and seed systems for African crops. CAB International, Wallingford, UK.
Diakité, L, Sidibé, A & Diakité, S, 2005. Enquête pour l’identification des paysans semenciers dans les zones et villages propices à la production semencière. Rapport final. Services d’Experts pour les Ressources Naturelles et l’Environnement au Sahel (SERNES), Bamako, Mali.
Diakité, L, Sidibe, A, Smale, M & Grum, M, 2008. Seed value chains for sorghum and millet in Mali: A state-based system in transition. IFPRI Discussion Paper 749. IFPRI (International Food Policy Research Institute), Washington, DC.
Edmeades, S, Nkuba, J & Smale, M, 2008. The impact of hybrid use on the vulnerability and deprivation of smallholder banana growers in Tanzania. Manuscript. Environment and Production Technology Division, IFPRI (International Food Policy Research Institute), Washington, DC.
Handa, S & Maluccio, JA, 2007. Matching the gold standard: Evidence from a social experiment in Nicaragua. Manuscript. Department of Economics, Middlebury College, Middlebury, Vermont, US.
Hardaker, J, Huirne, R, Anderson & Lien, G (Eds), 2004. Coping with Risk in Agriculture. CAB International Publishing, Wallingford, UK.
Harlan, JR, 1992. Crops and Man. Second edition. American Society of Agronomy and Crop Science Society of America, Madison, Wisconsin, US.
Matlon, P, 1987. The West African semi-arid tropics. In Mellor, JW, Delgado, CL & Blackie, MJ (Eds), Accelerating Food Production in Sub-Saharan Africa. Johns Hopkins University Press, Baltimore.
Miguel, E & Kremer, M, 2004. Worms: Identifying impacts on education and health in the present of treatment externalities. Econometrica 72(1), 159–217.
AfJARE Vol 4 No 1 March 2010 Melinda Smale, Lamissa Diakité, Amadou Sidibé, Mikkel Grum, Hannah Jones, Issa Seni Traore and Hamidou Guindo
45
Ravallion, M, 1994. Poverty comparisons. Fundamentals of Pure and Applied Economics. Volume 56. Harwood Academic, Chur, Switzerland.
Sanders, JH, Shapiro, BI & Ramaswamy, S, 1996. The Economics of Agricultural Technology in Semiarid Sub-Saharan Africa. Johns Hopkins University Press, Baltimore, Maryland, US.
Smith, BD, 1998. The Emergence of Agriculture. Freeman, New York. Sperling, L, Weltzien, E, Sangaré, MB, Shines, JSc, Salla Boré, S, Bamba, A, Traoré,
Keita, CO, Ag Hamada, M, Ballo, M, Sangaré, F, Kanouté, M, Sanogo, B, Guindo, H, Konta, B, Sanogo, S, Traoré, A, Loeffen, M & Dembélé, A, 2006. Seed System Security Assessment (SSSA), Douentza, Northern Mali. Final Report (June). Catholic Relief Services, Mali, and Partners, Bamako, Mali.
Stark, O & Taylor, E, 1989. Relative deprivation and international migration. Demography 26, 1–14.
Touré, A, Sanogo, O, Diakité, L & Sidibé, A, 2006. Program for Africa’s Seed Systems (PASS). Country Report: Mali, Institut d’Économie Rurale, Bamako, Mali.
Tripp, R, Wijeratne, M & Hiroshini Piyadasa, V, 2005. What should we expect from farmer field schools? A Sri Lanka case study. World Development 33(10), 1705–20.
Vaksmann, M, Traoré, SB & Niangado, O, 1996. Le photopériodisme des sorghos Africains. Agriculture et Développement 9, 13–18.
Van der Berg, H & Jiggins, J, 2007. Investing in farmers: The impacts of farmer field schools in relation to integrated pest management. World Development 35(4), 663–86.
Vitale, J & Bessler, B, 2006. On the discovery of millet prices in Mali. Papers in Regional Science 85(1), 139–62.
Weltzien, E, Christinck, A, Touré, A, Rattunde, F, Diarra, M, Sangaré A & Coulibaly, M, 2006. Enhancing farmers’ access to sorghum varieties through scaling up participatory plant breeding in Mali, West Africa. In Almekinders, C & Hardon, J (Eds), AgroSpecial 5: Bringing Farmers Back into Breeding: Experiences with Participatory Plant Breeding and Challenges for Institutionalisation. Agromisa Foundation. Wageningen, The Netherlands.
AfJARE Vol 4 No 1 March 2010 Melinda Smale, Lamissa Diakité, Amadou Sidibé, Mikkel Grum, Hannah Jones, Issa Seni Traore and Hamidou Guindo
46
Appendix: Additional statistics A. Probit and ordinary least squares regressions explaining DFF participation Determinants of DFF participation, probit regression Variable Coef. Std. Err. P>z Site -1.8142 0.4309 0.0000Active ratio 0.0240 0.7109 0.9730Total asset value 0.0000 0.0000 0.0820Millet share 0.7461 0.7198 0.3000Per capita cash income 0.0000 0.0000 0.1060Association membership 0.2040 0.1726 0.2370Markets 0.5497 0.1402 0.0000Koranic education 0.0439 0.0481 0.3610Constant -0.6355 0.8339 0.4460Number of obs 265 LR chi2(8) 37.67 Prob > chi2 0.0000 Pseudo R2 0.2274 Log likelihood -63.970473
Determinants of DFF participation, ordinary least squares regression Coef. Std. Err. P>t Site -0.2320 0.0498 0.0000Active ratio 0.0387 0.1011 0.7020Total asset value 0.0000 0.0000 0.0190Millet share 0.1133 0.0983 0.2500Per capita cash income 0.0000 0.0000 0.0540Association membership 0.0368 0.0247 0.1370Markets 0.0783853 0.0195788 0.0000Koranic education 0.0040264 0.0065585 0.5400Constant 0.1531561 0.112754 0.1760Number of obs 265 F( 8, 256) 5.26 Prob > F 0 R-squared 0.1412 Adj R-squared 0.1143 Root MSE 0.2756
AfJARE Vol 4 No 1 March 2010 Melinda Smale, Lamissa Diakité, Amadou Sidibé, Mikkel Grum, Hannah Jones, Issa Seni Traore and Hamidou Guindo
47
B. Comparison of means of outcome and explanatory variables, locus and other treatment villages, San site Boumboro Other treatment P-value Expected millet yields 660 529 0.3318 Expected sorghum yields 1014 673 0.0258 Mean millet yield 2005-6 999 791 0.0263 Mean sorghum yield 2005-6 822 705 0.3598 Stock of attributes 30.74 29.46 0.032 Relative deprivation (expected millet yields) 273 310 0.3308 Relative deprivation (expected sorghum yields) 418 535 0.0258 Relative deprivation (stock of attributes) 9.26 13.20 0.0389 Explanatory variables Active ratio 0.609 0.651 0.3776 Total asset value 1135337 859970 0.4561 Millet share 0.605 0.518 0.1281 Per capita income 36657 38035 0.8703 Association membership 1.89 1.63 0.1418 Markets 2.04 1.04 0.0001 Koranic education 0.556 0.029 0.1203