Embed Size (px)
Citation preview

43
International Journal of Economics
and
Management Sciences Vol. 2, No. 6, 2013, pp. 43-60
MANAGEMENT
JOURNALS
managementjournals.org
THE IMPACT OF POPULATION CHANGE ON ECONOMIC GROWTH IN KENYA
Gideon Kiguru Thuku¹, Gachanja Paul² and Obere Almadi3
¹ Corresponding author: Kenyatta University P.O. Box 612-00219 Karuri, Kenya.
E-mail: [email protected] ² Kenyatta University P.O. Box 43844 Nairobi, Kenya
E-mail: [email protected] 3 Kenyatta University P.O. Box 43844 Nairobi, Kenya
E-mail: [email protected]
ABSTRACT
The debate on the relationship between population growth and economic growth has been undergoing and
varies across countries. The first theory states that population growth stimulates economic growth. The
second theory view population growth as a factor that adversely affects economic growth while a third
school is that population growth is a neutral factor in economic growth and is determined outside
standard growth models. Given this scenario there was a need to establish the relationship between
economic growth and population growth in Kenya. The study employed Vector Auto Regression estimation
technique and used annual time series data for the period 1963 to 2009. The results indicated population
growth and economic growths are both positively correlated and that an increase in population will
impact positively to the economic growth in the country. The study concludes that in Kenya population
growth promotes economic growth and subsequently economic development.
CHAPTER ONE
INTRODUCTION
1.1 Background
A high population growth is a growing concern throughout the world and a challenge to countries’ economies.
The world’s population was about a billion in 1800 and rose to 2.5 billion in 1950 (Martin 2009). In the year
2007 the world’s population was 6.7 billion and is projected to rise to 9.2 billion by 2050 with almost all
population growth projected to occur in what are now considered less developed regions. Between 1950 and
2000, when the world’s population increased from 2.5 billion to 6.1 billion, the major shifts in population
weights by continent were the result of changes in fertility and mortality rather than large-scale migration
(Martin, 2009).
Economists are torn between three theories; one that state’s that population growth helps a nation’s economy by
stimulating economic growth and development and another that bases its theory on Robert Malthus’ findings.
Malthus (1798) stated that population increase is detrimental to a nation’s economy due to a variety of problems
caused by the growth. For example, overpopulation and population growth places a tremendous amount of
pressure on resources, which result in a chain reaction of problems as the nation grows. The third school of
thought is that population growth does have any impact on economic growth.
Malthus (1798) pointed out that population tends to grow geometrically, whereas food supplies grow only
arithmetically. According to the Malthusian model, the causation goes in both directions. Higher economic
growth increases population by stimulating early marriages, high birth rates, and reducing mortality rates from
malnutrition. On the other hand, higher population depresses economic growth through diminishing returns.
This dynamic interaction between population and economic growth is the centre of the Malthusian model, which
implies a counter balancing effect on population in the long-run equilibrium.

International Journal of Economics and Management Sciences Vol. 2, No. 06, 2013, pp. 43-60
© Management Journals
htt
p//
: w
ww
.man
agem
entj
ourn
als.
org
44
According to Malthusian theory, a high population growth is associated with food problem, i.e., malnutrition
and hunger but Bloom and freeman (1998) differ with the theory noting that food problem is more of a problem
of poverty and inadequate income than a matter of high population growth. The population and food problem
can be solved when income is enough to buy adequate food as prices provide adequate incentives to produce.
On the other hand, developing economies would have to export more, receive foreign aid or borrow overseas to
meet their increased demand for food by increased imports. A high rate of population growth not only has an
adverse impact on improvement in food supplies, but also intensifies the constraints on development of savings,
foreign exchange, and human resources.
Rapid population growth tends to depress savings per capita and retards growth of physical capital per worker.
The need for social infrastructure is also broadened and public expenditures must be absorbed in providing the
need for a larger population rather than in providing directly productive assets. Population pressure is likely to
intensify the foreign exchange constraints by placing more pressure on the balance of payment. The need to
import food will require the development of new industries for export expansion and/or import substitution. The
rapid increase in school-age population and the expanding number of labour force entrants puts ever-greater
pressure on educational and training facilities and retards improvement in the quality of education, which is a
problem in developing economies. Also, too dense a population aggravates the problem of improving the health
of the population and intensifies pressure on employment and the amount of investment available per labour
market entrant (Martin 2009).
More people may mean a country can produce and consume more goods and services, leading to economic
growth. But this can only occur when employment opportunities grow at least as fast as the labor force and
when people have access to the necessary education and training. A larger population may help overcome
possibly diminishing returns to this generation’s human capital in the production of the next generation’s human
capital because greater population growth induces more specialization and a larger market that raise returns to
human capital and knowledge. If human capital per capita were sufficiently large, the economy would move to
steady state growth, whereby in the steady-state growth path, consumption per capita would increase at a slower
rate than human capital if the population is growing and if the production of consumer goods has diminishing
returns to population. However, consumption per capita can still be increasing, despite these diminishing
returns, if the positive impact of the growth in human capital on productivity in the consumption sector more
than offsets the negative impact of population growth. Thus, zero population growth is not necessary for
sustainable growth in per capita consumption, even with diminishing returns to population in the production of
consumer goods (Gerald and Meier, 1995).
Economists advocating the positive side to population growth, say that the population growth creates problems
in the short run that include poverty, famine and unemployment. Yet, they also state that in the long run, it leads
to new developments through advancement in technology that leave countries better off than if the problems
never occurred. On the positive side, there is a chain reaction of events caused by population growth. According
to the neo-classical growth model, population is beneficial to an economy due to the fact that population growth
is correlated to technological advancement. Rising population promotes the need for some sort of technological
change in order to meet the rising demands for certain goods and services. With the increased populace,
economies are blessed with a large labor force, making it cheaper as well, due to its immense availability. An
increase in labor availability and a low cost for labor results in a huge rise in employment as businesses are
more inclined to the cheap labor. Low labor costs results in a shift of money usage from wages into
advancement through technology (Coale and Hoover, 1958).
According to Friedberg and Hunt (1995) population growth and urbanization go together, and economic
development is closely correlated with urbanization. Rich countries are urban countries. Population growth
increases density and, together with rural-urban migration, creates higher urban agglomeration. And this is
critical for achieving sustained growth because large urban centers allow for innovation and increase economies
of scale. Companies can produce goods in larger numbers and more cheaply, serving a larger number of low-
income customers. Many countries have companies which have been benefitting from increasing population
growth and density in targeting the large numbers of lower and lower-middle income. Their business model is
viable because they can serve a multi-million customer base.
1.2 Population Growth and Economic Growth in Kenya
The trend in population growth and Gross Domestic Product (GDP) in Kenya from 1963 to the year 2009 is
shown in figure 1.1. The figure shows that the trend in population growth in Kenya has been fluctuating over the
years. The figure shows that the country recorded the highest population growth in 1967 at 4.7 percent. In 1979
the growth rate increased to 3.8 percent from a growth rate of 3.3 percent in 1969. The population growth rate

International Journal of Economics and Management Sciences Vol. 2, No. 06, 2013, pp. 43-60
© Management Journals
htt
p//
: w
ww
.man
agem
entj
ourn
als.
org
45
decreased between the years 1979 and 1989 recording a growth rate of 3.4 percent. For the period between 1989
and 1999 growth rate was 2.9 percent which again increased to 3.0 percent for the period 1999 to 2009
(Republic of Kenya, 2010).
During the same period the rate of growth of GDP was cyclical. As can be observed from figure 1.1, the growth
rate has also been fluctuating over the years. In 1968 the growth rate declined to only 3.4 percent from an all
time high of 14.7 percent in 1966. GDP growth improved in the year 1973 recording a growth rate of 7 percent.
In 1974 the economy recorded a negative growth of 0.24 percent. There was a marked performance in the year
1977 when the economy grew by 8.6 percent. One of the worst performances for the economy was recorded in
1984 with the economy recording a growth rate of negative 0.8 percent. This decline was attributed to the
famine that occurred in that year. The economy again improved in the following years but in 1993 it went down
to 0.2 percent. There was a turnaround in the economic performance during the period 2003-2008 when the
economic growth increased fro 2.9 percent in 2003 to 7.1 percent in 2007.The growth rate however declined to
1.6 percent in 2008 due to the post elections violence that engulfed the country in December 2007.
Figure 1.1 Trends in GDP growth and population growth over the period 1963-2008
Source: Republic of Kenya Economic Survey and Statistical Abstract for various years
1.3 Trends in Demographic Development in Kenya
Population growth in Kenya continues to exert pressure on land and other resources. High fertility, combined
with declining child mortality, gave Kenya one of the world's fastest population growth rates in the 1970s and
1980s (Ajayi and Kovole, 1998). The total population rose from about 10 million at independence to 15 million
by 1978. This rapid growth, combined with an economic slowdown, prompted the government to promote
family planning to lower fertility rates. Kenya was one of the first African countries to adopt a policy to slow
population growth (Ajayi and Kovole, 1998).
Total fertility rate is the average number of children that would be born to a woman over her productive life. In
Kenya total fertility rate has been fluctuating over the years. The total fertility rate was 8.1 children per woman
between 1975 to 1978. Fertility rate decreased to 6.7 children for the period 1982 to 1988 and it declined further
to 5.4 children between 1990 to 1992. Between the periods of 1995 to 1997 the fertility rate was 4.7 children per
woman. There was an increase in fertility rate to 5 children per woman for the period between 1999 and 2000.
Fertility rate decreased again to 4.6 children between 2006 and 2008 (NCPD et al., 1999; Republic of Kenya,
2009). There was a disparity in fertility among rural and urban women which could be attributed to the
significant role played by education in population growth. When literacy of women improves fertility rates also
tend to decrease. Contraceptive use has increased from 39 percent of married women in 2003 to 46 percent in
2009 (Kenya National Bureau of Statistics, 2009).
-4
0
4
8
12
16
65 70 75 80 85 90 95 00 05
GDPGROWTH POPGROWTH

International Journal of Economics and Management Sciences Vol. 2, No. 06, 2013, pp. 43-60
© Management Journals
htt
p//
: w
ww
.man
agem
entj
ourn
als.
org
46
1.4 Population Programs in Kenya
Since attaining political independence, the government has prioritized the improvement of the health status of
Kenyans. The government recognizes that good health is a prerequisite to socio-economic development. A
number of government policy documents and successive national development plans have stated that the
provision of health services should meet the basic needs of the population, place health services within easy
reach of Kenyans, and emphasize preventive, promotive, and rehabilitative services without ignoring curative
services. Perhaps as a result of these policies, both infant mortality and life expectancy at birth, which are basic
indicators of health status, have improved significantly (Ngigi and Macharia, 2006).
Kenya was the first Sub-Saharan African country to have a population policy by forming of the National Family
Planning Programme to reduce population growth in 1967. However the implementation of the population
policy did not yield the desired results and led to the revision of the 1967 policy to form the Sessional Paper No.
4, of 1984 on Population Policy (Muia et.al 2003). The 1984 policy incorporated demographic and socio-
economic goals and diversified implementing ministries and nongovernmental and religious organizations. The
demographic intentions in the Sessional paper were to reduce the population growth rate, reduction of fertility,
Reduction of mortality particularly infant and child mortality and also the reduction of rural–urban and rural–
rural migration.
In 2000, the government of Kenya launched the National Population Policy for Sustainable Development
(National Council for Population and Development, 2000). This policy builds on the strength of Kenya’s first
national population policy outlined in Sessional Paper No. 4 of 1984 on Population Policy Guidelines. The
policy outlined ways to implement the programme of action developed at the 1994 International Conference on
Population and Development in Cairo, Egypt. The policy also addressed the issues of environment, gender, and
poverty, as well as the problems facing certain segments of the Kenyan population, such as its youth. Among the
salient features of these policy included improvement of the standard of living and quality of life, improvement
of the health and welfare of the people through provision of information and education on how to prevent illness
and premature deaths among risk groups, especially among mothers and children, sustenance of the ongoing
demographic transition to further reduce fertility and mortality, especially infant and child mortality, continuing
motivation and encouragement of Kenyans to adhere to responsible parenthood and sustainability of the
population programme among others.
Under the long term development of vision 2030 the Kenyan government through the National Coordinating
Agency for Population and Development, has initiated a review of the National Population Policy for
Sustainable Development. This review is aimed at updating the said policy blueprint, whose implementation
period ended in December 2010. The review aims at aligning the population policy, strategies and programmes
with the Millennium Development Goals (MDGs), and Kenya Vision 2030. It also seeks to incorporate the
newly emerging population issues within the development framework.
Owing to its high fertility and declining mortality, Kenya is characterized by a youthful population. Projections
show about 43 percent of the population is younger than 15 years (Republic of Kenya, 2009). This implies that
over three-fifths of Kenya’s population, or about 25 million people in 2009, are less than 25 years old.
Consequently, Kenya faces the formidable challenge of providing its youth with opportunities for a safe,
healthy, and economically productive future. The 1994 International Conference on Population and
Development (ICPD) endorsed the right of adolescents and young adults to obtain the highest levels of health
care. In line with the ICPD recommendations, Kenya has put in place an Adolescent Reproductive Health and
Development policy (ARH&D) (Odini, 2008).
1.5 Statement of the Problem
There is continued divergence of opinions regarding the consequences of population growth on economic
growth. The debate between positive impact and negative impact of population growth on the economy is thus
still ongoing. On the positive side, population growth induces technological advancements and innovations. This
is because population growth encourages competition in business activities and, as the country’s population
grows, the size of its potential market expands as well. The expansion of the market, in its turn, encourages
entrepreneurs to set up new businesses (Simon 1992).
A large population growth on the other side is not only associated with food problem but also imposes
constraints on the development of savings, foreign exchange and human resources. The increase in demand for
food leads to a decrease in natural resources, which are needed for a nation to survive. Other negative effects of
population growth include poverty caused by low income per capita, famine, and disease since rapid population
growth complicates the task of providing and maintaining the infrastructure, education and health care needed in

International Journal of Economics and Management Sciences Vol. 2, No. 06, 2013, pp. 43-60
© Management Journals
htt
p//
: w
ww
.man
agem
entj
ourn
als.
org
47
modern economies (Barro, 1991; Mankiw, Romer and Weil, 1992). The third school of thought is that
population growth is a neutral factor in economic growth and is determined outside standard growth models
(Felmingham 2004).
Cross national evidence on the relationship between population growth and economic growth is inconsistent
because the underlying parameters and assumptions vary across countries. The existing literature also points out
that depending on the country; population growth may contribute, deter or even have no impact on economic
growth. This result is explained by the fact that the effects of population growth change over-time. For example,
a higher fertility rate can have a short-term negative effect caused by the cost of expenditures on children
whereas it has a long-run positive effect through the larger labour force it generates. Due to this divergent views
among scholars on whether its population growth that drives economic growth or vise versa, the following
research questions emerged:
i. What is the causal relationship between population growth and economic growth in Kenya?
ii. Is the relationship a short term or a long run phenomenon?
iii. What is the response of population growth due to shocks in economic growth?
iv. What is the response of economic growth due to shocks in Population growth?
v. What are the sources of variations of economic growth?
vi. What are the policy implications of the study findings?
1.6 Research Objectives
i. To determine the causal relationship between population growth and economic growth in Kenya
ii. To determine if the relationship between population growth and Economic growth in Kenya is a short-
term or a long run phenomena.
iii. To determine the response of population growth due to shocks on economic growth in Kenya.
iv. To determine the response of the economic growth due to shocks in population growth.
v. To examine the sources of variations of economic growth.
vi. Draw policy implications from the study.
1.7 Significance of the Study
Population growth is a key factor to the growth and development of any country. And with continued
divergence of opinions regarding the consequences of population growth on economic development, this study
will thus serve as a necessary contribution to knowledge offering information regarding the same in Kenya. The
study will also serve as a resource material to policy makers and scholars by providing the relevant information
regarding the issue.
Secondly, it provides information on the impact of population growth and how these growths influence the
economic development. The results of this study will be helpful to the policy makers by giving them useful
information on various explanatory variables that may be targeted in the evaluation of policy changes and the
provisions of new policies in order to enhance the desired level of economic growth. The study may help to
provide useful information to the private and the public agencies in designing projects and programmes that can
assist in bringing a balance between growth in population and growth in economic growth.
1.8 Scope and Limitations of the Study
This research deals with the population growth and economic development for the period 1963-2009. Given the
big scope on the topic of population, the research is narrowed down only to the study of population growth. This
has left out the other dimensions of population which include population density and size structure, and also
population aging. Thus there is room for further research on the effect of these other dimensions of population
on economic development.
CHAPTER TWO
LITERATURE REVIEW
2.1 INTRODUCTION
The literature review focuses on both general and empirical studies carried out to examine the relationship
between population growth and economic development.
2.2 General Literature
Malthus (1798) believed that the world's population tends to increase at a faster rate than its food supply.
Whereas population grows at a geometric rate, the production capacity only grows arithmetically. Therefore in

International Journal of Economics and Management Sciences Vol. 2, No. 06, 2013, pp. 43-60
© Management Journals
htt
p//
: w
ww
.man
agem
entj
ourn
als.
org
48
the absence of consistent checks on population growth, Malthus made the prediction that in a short period of
time, scarce resources will have to be shared among an increasing number of individuals. However, such checks
that ease the pressure of population explosion do exist, and Malthus distinguished between two categories, the
preventive check and the positive one. The preventive check consists of voluntary limitations of population
growth. Individuals before getting married and building a family, make rational decisions based on the income
they expect to earn and the quality of life they anticipate to maintain in the future for themselves and their
families. The positive check to population is a direct consequence of the lack of a preventive check. When
society does not limit population growth voluntarily, diseases, famines and wars reduce population size and
establish the necessary balance with resources.
Boserup (1965) found out that population growth is an autonomous factor, which affects agricultural
productivity rather than being affected by it, as suggested by the Malthusian school. The study claimed that
Malthus' assumption of diminishing returns to labor needs not hold in the long run, as higher population may
lead to a more efficient division of labor as well as to improved agricultural practices (signaled by the frequency
of cropping). The study concluded that soil fertility should not be viewed as fixed and given by nature, but
instead can be improved by substituting the agricultural technology to a better one, which is likely to be a result
of an increase in population. Primitive communities with higher population growth rates are more likely to
experience economic development, provided that the necessary investment in agriculture in undertaken.
Thirlwal (1973) investigated the relationship between population growth and economic development with
special reference to developing economies. The study found out that the relationship between population growth
and economic development is a complex one, particularly concerning what the cause is and what the effect is.
Rapid population growth lowers per capita income growth in least developed countries (LDCs), yet there are
many ways in which population growth may be a stimulus to progress, and there are many rational reasons why
families in developing countries choose to have many children. The study concluded that complexity of the
subject is compounded by the fact that, economic development is a multidimensional concept. The pace of
economic development depends on the diversion of resources from consumption to uses that raise future output.
A population with a high ratio of dependents on producers consumes more of a given output and devotes less to
investments. Thus, high fertility, which produces a high level of dependency, promotes consumption at the
expense of investment.
Simon (1977) investigated the long run benefits of population growth. Whereas population growth has a
negative effect on living standards in the short run due to diminishing returns and the temporary burden it poses
on society, it has positive effects on living standards in the long run due to knowledge advances and economies
of scale. Employing a simulation model, the study found out that in the long run (after 30 to 100 years) and
when compared to constant-size population, moderate population growth improves standards of livings both in
more developed and in less developed countries. In the long run, a growing population tends to advance
knowledge, which, in turn, increases productivity and output at a higher rate than that of population growth.
Nevertheless, a country's optimal policy regarding population growth depends on the weight given to future
periods relative to the present. The more weight a country gives to future generations and the more willing a
country is for the short run decline in standards of livings, the better it is for that country to pursue a policy of
moderate population growth. The long run benefits of population growth that links to economic development of
poor countries are on the positive balance, contrary to conventional wisdom.
Porter (1996) employed a Solow-Swan economic growth model with exogenous saving rates to determine the
relationship between population growth and economic growth. The model assumed that both the saving rate and
the consumption rate are given. Taking a household owns the input and manages the technology. The production
technology is assumed to take the form
Y = F (K, L), (2.1)
Where Y is total output,
K is total physical capital,
And L is the size of the labour input
The production function exhibits positive and diminishing marginal products with respect to each input and also
exhibits constant returns to scale. The economy is assumed to be a one-sector economy, where output can be
either consumed or invested and capital depreciates at a constant positive rate (δ). The growth rate of population
is exogenous. The model further assumes that this growth rate is a constant (n) and that labour supply per person
is given. Normalizing the population size at time zero and the work intensity to one yield the following is the
labour input
International Journal of Economics and Management Sciences Vol. 2, No. 06, 2013, pp. 43-60
© Management Journals
htt
p//
: w
ww
.man
agem
entj
ourn
als.
org
49
L = ent
. (2.2)
The net increase in per capita capital is:
˙ k= sf (k) − (n + δ) k. (2.3)
The first term on the right-hand side (RHS) is saving per capita out of output per capita and the second term is
the effective depreciation per capita. Defining a steady state as a situation in which the quantities, such as
capital, population, and output, grow at constant rates. In the Solow-Swan model a steady state exists if the net
increase in per capita capital is equal to zero. Denoting steady state values with an asterisk the steady state
values are given by:
sf (k*) = (n + δ)k*, y* = f (k*) and c* = (1 − s)f(k*).
Since the per capita values are constant in steady state the levels of total output, total consumption, and total
capital must grow at the same rate, which is the same as that of population growth (n). An increase in the rate of
population growth in steady state does not affect the growth rate of the per capita variables, since these rates are
equal to zero in steady state. However, an increase in fertility does lead to a decrease in the level of capital per
capita and therefore to a decrease in output and consumption per capita. This is the capital dilution effect. An
increase in the population growth rate leads to a decline in the growth rate of the per capita variables. For model
with exogenous saving rates higher population growth leads to lower standard of living per capita measured
either as consumption or in growth of consumption.
Becker et.al (1999) developed altruistic models of intergenerational transfers where the behavior of individuals
is guided by a utility function that is increasing in own consumption and the utility achieved by one’s offspring.
The utility of the offspring depends, in turn, on their own consumption and the utility of their offspring. Through
this inter-linking chain the current generation consumes and transfers resources to its children influenced by its
concern not only for its own children but for all future generations. An important implication of this model is
that familial transfers will neutralize fiscal policy. When a government exercises expansionary fiscal policy it
stimulates the economy by increasing current spending financed by issuing debt. From the perspective of
intergenerational transfers, the policy is an effort to stimulate spending by transferring resources to current
generations from future generations. According to this model however, the public policy is undone by altruistic
households. They compensate future generations by increasing their saving and accumulating wealth, exactly
offsetting the increase in public debt. This model implies that public intergenerational transfers and private
intergenerational transfers are perfect substitutes. A change in public transfers is matched dollar for dollar by a
compensating change in private transfers.
2.3 Specific Literature
Bloom and Freeman (1986) provided a comprehensive organizing framework for analyzing the impact of
population growth on labor supply and employment. In particular, they identified two distinct mechanisms
through which population growth affects labor supply and employment. One is the "accounting" aspect that
refers to changes in the demographic structure and cohort size. The other is the "behavioral" aspect that refers to
the decision to participate in the labor force, particularly for women. Fertility, mortality and migration will
affect labor supply differently. Mortality and migration will have immediate effects while fertility will have
delayed effects. They also pointed out that the structure of the labor market mediates the impact of population
growth on employment. For instance, in a neoclassical labor market rapid population growth will
instantaneously depress wages. In a dual labor market where one market (modern) is behaving like a new
classical labor market and another (traditional) is characterized by surplus labor and low wage rates, rapid
population growth will delay the tightening of and eventual dissolution of the low wage traditional labor market
(or the elimination of the dualistic structure). In their review of labor markets in developing countries covering
the period 1960-80, they concluded that despite population increasing rapidly, developing countries managed,
on the whole, to improve their economic positions significantly.
According to Kelley (1988) a lower the pace of population growth will help to enhance economic growth at a
higher rate. The study elaborated that economic growth would be higher in the situation of slower population
growth even though the impact of population growth in many countries was insignificant. Population and per
capita income are closely associated to depict the picture of economic growth. Lower the population growth and
higher the per capita income show that nation achieve their growth targets. Countries with population growth
under 1 percent, their per capita income could increase at the rate of 2.5 percent annually. Countries with
population growth more than 2 percent had a little increase in per capita income of less than 2 percent.

International Journal of Economics and Management Sciences Vol. 2, No. 06, 2013, pp. 43-60
© Management Journals
htt
p//
: w
ww
.man
agem
entj
ourn
als.
org
50
Mankiw et.al (1992) used a Cobb-Douglas economy-wide production function to investigate the impact of
population growth on ‘steady state’ income per capita as well as on economic growth in the transition to the
steady state. They revealed out that an increase in the population growth rate of 10% (e.g. 3% to 3.3%) would
reduce per capita income in the steady state by 5%. If, however, one considered human capital to be an
additional factor of production (which is eminently reasonable), then the negative impact of population growth
is larger as population growth now forces economies to use their scarce savings to equip young people with
physical and human capital. As a result, a 1% increase in population growth would decrease per capita income
by 2%.
Bloom and Williamson (1997) also found that demographic factors are important determinants of economic
growth. Their results show that it is not overall population growth rate that drives economic performance but
age distribution. The age distribution effect operates through the difference in growth rates of the working-age
and the dependent population. The study found that population dynamics explain as much as 1.4 to 1.9
percentage points of the GDP per capita growth in East Asia or as much as one third of the average East Asian
miracle GDP per capita growth rate (1.9/6.1). In Southeast Asia, the estimated effect ranges from 0.9 to 1.8
points of economic growth or about half (1.8/3.8) of the recorded growth in GDP per capita.
Bucci (2003) investigated whether there is a long-run relationship between population (size and growth) and
per-capita income focusing on human and physical capital as reproducible inputs. The study found out that
population growth exerts a negative effect on economic growth. However, when individuals choose
endogenously how much to save, population growth can also have a neutral influence on economic growth. The
study also extended its analysis to the case where physical and human capital can interact with each other in the
production of new human capital. When the two types of capital are substitutes for each other in the education
sector, the effect of population growth on per-capita income growth is always negative. Instead, if human and
physical capital is complementary for each other, the impact of population change on real per-capita income
growth becomes ambiguous. The intuition is the following. For given per-capita physical capital stock, an
increase of population causes the aggregate physical capital to rise. If physical and human capital are substitutes
for each other (in the sense that the larger amount of physical capital now available in the economy deters the
demand and, thus, the consequent supply of human capital), the increase of population size, together with the
reduction of the aggregate human capital stock, determines an unambiguous decline of the per-capita level of
skills and, via this channel, a lower per-capita income growth rate. On the other hand, if physical and human
capital are complementary for each other (the increase in the supply of physical capital spurs the demand and,
therefore, the consequent production of new human capital), the final effect on the per-capita level of skills and,
hence, on per-capita income growth of an increase in population may be either positive, or negative, or else
equal to zero. Long-run per-capita income growth can be positive even without any population change; in
equilibrium, both the growth rate and the level of per-capita income are independent of population size; the
long-run level of per-capita income is proportional to per-capita human capital.
CHAPTER THREE
THEORETICAL FRAMEWORK
3.1 Introduction
This chapter describes theoretical model, empirical model and the research design. The research design reveals
the type of data and the method of data collection.
3.2 Theoretical Framework
The paper adopted the Solow swan model of growth. Solow’s model takes the rate of saving, population growth
and technical progress as exogenous. There are two inputs capital and labor which are paid their marginal
products. Assuming a Cobb -Douglas production functions the production function at time t is given by:
Y(t) = K(t)αA(t)L(t)
1-α 0<α<1 (3.1)
Where: Y is output, K is capital, L is labor and A is the level of technology.
The initial levels of capital, labor and level of technology are taken as given. Labor and level of technology
grow at constant rates: (t) = nL(t) (3.2)
(t) = gA(t) (3.3)
Where n and g are exogenous parameters and where a dot over a variable denotes a derivative with respect to
time.

International Journal of Economics and Management Sciences Vol. 2, No. 06, 2013, pp. 43-60
© Management Journals
htt
p//
: w
ww
.man
agem
entj
ourn
als.
org
51
Applying the result that a variables growth rate equals the rate of change of its log to equation (3.2) and (3.3)
tells us that the rates of change of the logs of L and A are constant and that they equal n and g respectively.
Thus,
lnL(t) = {lnL(0)}+ nt (3.4)
LnA (t) = {lnA(0)}+ gt (3.5)
Where L(0)and A(0) are the values of L and A at time 0.Exponentiating both sides of these equations gives us:
L(t) =L(0)ent
(3.6)
A(t) =A(0)ent
(3.7)
The number of effective units of labor, A (t) L (t), grows at rate n+g.
The model assumes that a constant fraction of output s is invested. Defining k as the stock of capital per
effective unit of labor, k = K/AL, and y as the level of output per effective unit of labor, y=Y/AL, the evolution of
k is governed by
(t)=sy (t)-(n+g+δ)k(t) = sk(t)
α-(n+g+δ)k(t) (3.8)
Where δ is the rate of depreciation .Equation 3.8 implies that k converges to a steady state value defined by
s α= (n+g+ δ) ,or
=[s/(n+g+δ)]
1/(1-α) (3.9)
The steady state capital labor ratio is related positively to the rate of saving and negatively to the rate of
population growth. The central prediction of the Solow model concerns the impact of saving and population
growth on real income. Substituting 3.9 into the production function (3.1) and taking logs we find the steady
state income per capita is:
ln [
] = ln A (0) + gt +
ln(s) -
ln(n+g+δ) (3.10)
Because the model assumes that factors are paid their marginal products it predicts not only the signs but also
the magnitudes of the coefficients on saving and population growth.
Relating theoretical model to the study, an extract from equation 3.10 can be expressed as:
ΔGDPt = f (ΔPOPt) (3.11)
Where:
GDPt is the economic growth rate
POPt is population change.
3.3 Empirical Model and Estimation Technique
3.3.1 Stationarity test
The study used time series data and therefore, there was need to determine whether the variables in question
were stationary or non-stationary. Augmented Dickey Fuller (ADF) test was used to test for stationarity of the
series. When time series data is non stationary and used for analysis it may give spurious results because
estimates obtained from such data will possess non constant mean and variance.
3.3.2 Exogeneity
The other step was to test whether any of the variables in the model was weakly exogenous. A variable xt is said
to be weakly exogenous for estimating a set of parameters λ1 if the joint probability density function f(yt; xt; λ)
can be partitioned as:
f (yt, xt;λ) = g (yt |xt; λ1)h(xt;λ2) (3:12)
International Journal of Economics and Management Sciences Vol. 2, No. 06, 2013, pp. 43-60
© Management Journals
htt
p//
: w
ww
.man
agem
entj
ourn
als.
org
52
So that inference on λ1 can be conducted with no loss of information from the conditional density function g(yt
|xt; λ1) (Engle et.al, 1983). Weak Exogeneity concerns the extent to which the parameters of the marginal
distribution of the exogenous variable can be ignored when focusing on the conditional distribution of the
endogenous variable given the exogenous variable. Should weak Exogeneity not hold, then estimation must
account for both the marginal and conditional distributions. If all the variables happen to be weakly exogenous
the use of a system of equations and VAR approach in the study would not be justified (Oduor, 2008). Weak
Exogeneity tests were therefore necessary to detect specification errors in the model.
3.3.3 Vector Auto regression analysis (VAR)
The empirical approach on this paper was based on VAR approach. VAR is a method of time series analysis that
does assume any structural relationship between the economic variables. The use of structural VAR was
justified because of the possibility to simulate the response over time of any variable in a set to either an own
disturbance or a disturbance to any other variable in a system of equations (Stock and Watson, 2001). A
structural VAR was used to examine the relationship among a set of economic variables and analyze the
dynamic impact of random disturbances on the system off variables in this study.
VAR econometrics analysis entails estimating regression equations in which the current value of each variable is
expressed as a function of lagged values of itself and of each of the selected variables. No variable is assumed
to be exogenous a priori and no variable is excluded from the autoregressive equation for any of the variables in
the system. The paper employed a system of reduced form structural VAR to test for the impact of population
growth on economic growth. The standard estimatable VAR (1) model with the variables in the relationship
(3.11) was specified as:
yttttt POPcGDPcPOPbbGDP 1121111210 (3.13a)
zttttt POPcGDPcGDPbbPOP 1221212120 (3.13b)
In this type of VAR model each variable was regressed on a constant variable Cij, p lags of itself, p lags of each
of the other variable and the disturbance term et. The choice of the lag length (p) was determined using the
Alkaike (AIC) and the Schwarz Information Criterion (SIC).
3.3.4 Causality Test
Granger causality was used to determine whether one time series is useful in forecasting another (Enders, 1995).
Granger causality tested the direction of causation between population and economic growth. The causality
might be bi-directional and thus there was a need to establish which direction of causality was dominant. In this
case failure to account for the reverse causation or feedback between variables is likely to either overstate or
understate the contribution of a particular variable. The VAR equations were used to perform Granger causality
tests. The F-statistic tested the null hypothesis that the coefficients on lagged values of a variable are zero in the
equation of the other variable against the alternative hypothesis that the coefficient on lagged values of a
variable are not zero in the equation of the other variable. The null hypothesis is rejected when F-statistic is
greater than the P-value.
3.3.5 Impulse Response Analysis
The coefficients estimates were used in the derivation of impulse responses and forecast error decomposition.
Impulse response analysis links the current value of the error term to the future values of Yt or equivalently, the
current and past values of the error term to the current values of Yt.. An impulse response enables one trace the
effect of one time shock to one of the innovations on the current and future values of the endogenous variable.
The impulse responses are obtained from a vector auto regression moving average (VARMA). Given a general
representation of a VARMA as:
Δxt =
0j
Фiεt-1 i=0, 1, 2……….n (3.14)
Where Фi is the impact multipliers denoting the response of each variable to innovations in each of the
corresponding error terms on impact.
et-1 are innovations
n is number of variables in the system.
Фi (0) Фi (1) Фi (n) are the impulse responses which will be plotted to trace the time path of the system
variables as they respond to various shocks overtime.

International Journal of Economics and Management Sciences Vol. 2, No. 06, 2013, pp. 43-60
© Management Journals
htt
p//
: w
ww
.man
agem
entj
ourn
als.
org
53
3.3.6 Variance Decomposition
Variance decomposition separates the variations in an endogenous variable into the component shocks to the
VAR. This variance decomposition provides information about the relative importance of each random
innovation in affecting the variables in the VAR.
It tells how much of a change in a variable is due to its own shock and how much due to shocks to other
variables. In the short run most of the variation is due to own shock. But as the lagged variables’ effect starts
kicking in, the percentage of the effect of other shocks increases over time.
3.4 Definition and measurement of variables
Gross domestic product growth rate (GDP): Represents the rate at which Kenya’s GDP increases. This is the
difference between current GDP and previous years GDP and is measured as a percentage.
Population increase (POP): Refers to the change in population over a unit time period or the Increase in the
number of people over a given period of time.
3.5 Data Type and Source
This study made use of published data for the period ranging from 1963 to 2009. The main sources of these data
were: Kenya National Bureau of Statistics publications, Government of Kenya Statistical Abstracts and
Economic Surveys.
CHAPTER FOUR
ANALYSIS AND ESTIMATION RESULTS
4.1 Introduction
This chapter presents the findings of the study.
4.2 Unit root tests
When time series data is non stationary and used for analysis it may give spurious results because estimates
obtained from such data will possess non constant mean and variance. Because this study used time series data,
it was therefore important to establish the stationarity of the data or what order they are integrated to make sure
that the results obtained are not spurious. In this regard Augmented Dickey Fuller (ADF) was used to test for
unit roots. The Augmented Dickey-Fuller (ADF) tests the hypothesis that |ρ|=0 against that |ρ|<0 in the
autoregressive equations:
( i) ADF with intercept and a trend
Δyt = α + ρyt-1+
k
oi
δt Δyt-1 + μt (4.1)
(ii) ADF With both intercept and trend
Δyt = α + βt + ρyt-1+
k
oi
δt Δyt-1 + μt (4.2)
The unit roots results of the variable in the model are reported in table 4.1. Since the calculated Augmented
Dickey Fuller test statistic value is greater than the critical value at 95 percent confidence level implies that both
economic growth rate and population growth rate are all stationary at levels.
Table 4.1: ADF Unit root tests
Variable
t-Statistic Critical Values
Gdp growth Rate Levels Intercept -3.373741 5% = -2.9271
Intercept and Trend -4.216166
5% = -3.5112
Population
Growth Rate
Levels Intercept -3.157079
5% = -2.9271
Intercept and Trend -4.632663
5% = -3.5112
International Journal of Economics and Management Sciences Vol. 2, No. 06, 2013, pp. 43-60
© Management Journals
htt
p//
: w
ww
.man
agem
entj
ourn
als.
org
54
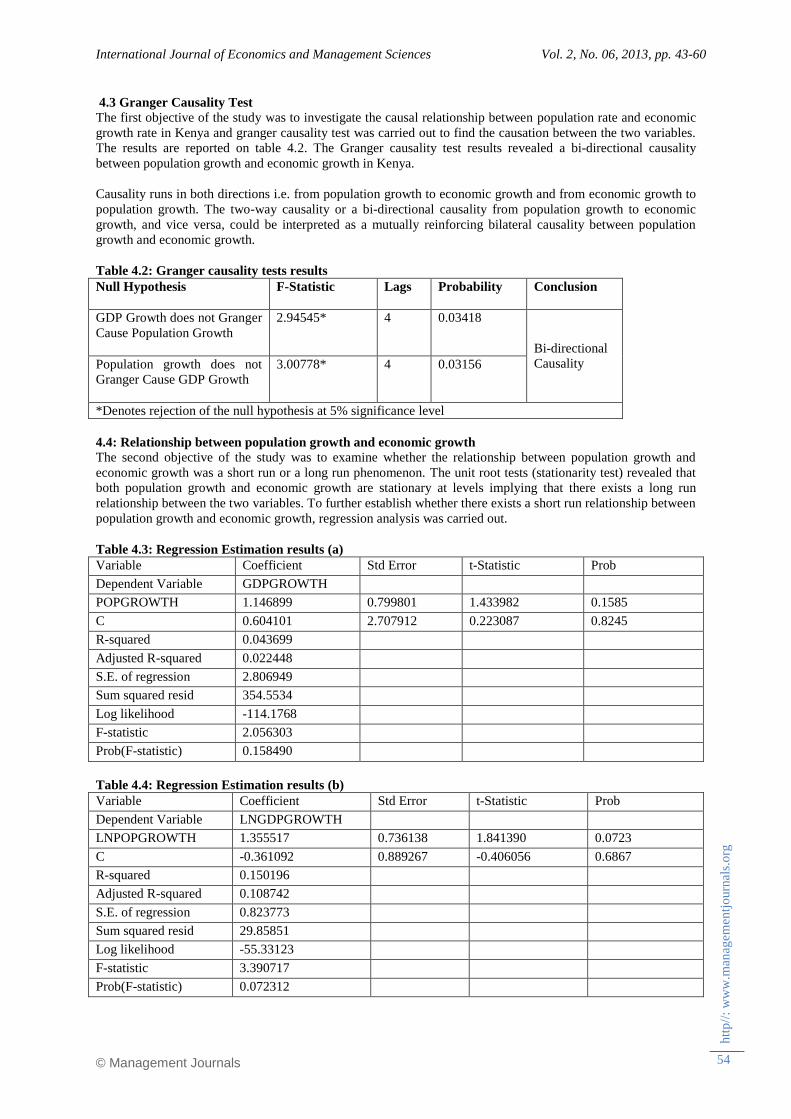
4.3 Granger Causality Test
The first objective of the study was to investigate the causal relationship between population rate and economic
growth rate in Kenya and granger causality test was carried out to find the causation between the two variables.
The results are reported on table 4.2. The Granger causality test results revealed a bi-directional causality
between population growth and economic growth in Kenya.
Causality runs in both directions i.e. from population growth to economic growth and from economic growth to
population growth. The two-way causality or a bi-directional causality from population growth to economic
growth, and vice versa, could be interpreted as a mutually reinforcing bilateral causality between population
growth and economic growth.
Table 4.2: Granger causality tests results
Null Hypothesis F-Statistic Lags Probability Conclusion
GDP Growth does not Granger
Cause Population Growth
2.94545*
4 0.03418
Bi-directional
Causality Population growth does not
Granger Cause GDP Growth
3.00778*
4 0.03156
*Denotes rejection of the null hypothesis at 5% significance level
4.4: Relationship between population growth and economic growth
The second objective of the study was to examine whether the relationship between population growth and
economic growth was a short run or a long run phenomenon. The unit root tests (stationarity test) revealed that
both population growth and economic growth are stationary at levels implying that there exists a long run
relationship between the two variables. To further establish whether there exists a short run relationship between
population growth and economic growth, regression analysis was carried out.
Table 4.3: Regression Estimation results (a)
Variable Coefficient Std Error t-Statistic Prob
Dependent Variable GDPGROWTH
POPGROWTH 1.146899 0.799801 1.433982 0.1585
C 0.604101 2.707912 0.223087 0.8245
R-squared 0.043699
Adjusted R-squared 0.022448
S.E. of regression 2.806949
Sum squared resid 354.5534
Log likelihood -114.1768
F-statistic 2.056303
Prob(F-statistic) 0.158490
Table 4.4: Regression Estimation results (b)
Variable Coefficient Std Error t-Statistic Prob
Dependent Variable LNGDPGROWTH
LNPOPGROWTH 1.355517 0.736138 1.841390 0.0723
C -0.361092 0.889267 -0.406056 0.6867
R-squared 0.150196
Adjusted R-squared 0.108742
S.E. of regression 0.823773
Sum squared resid 29.85851
Log likelihood -55.33123
F-statistic 3.390717
Prob(F-statistic) 0.072312
International Journal of Economics and Management Sciences Vol. 2, No. 06, 2013, pp. 43-60
© Management Journals
htt
p//
: w
ww
.man
agem
entj
ourn
als.
org
55
The coefficients of the model in table 4.3 represent the long run marginal effects of the model since the
regression was done at levels. The results in table 4.4 however represent the short run dynamics of the model.
The theoretical expectations are that economic growth is determined by other factors besides population growth
which are not included in the model and interpreting the coefficients of the independent variables in the model
will however be misleading. Basing our analysis on the goodness of fit (adjusted r- squared) from the two
models, the results indicate that goodness of fit improves with the short run dynamics as shown in both tables
4.3 and 4.4 respectively as compared to the long run effects of the independent variable. This indicates the
existence of a short run relationship between economic growth and population growth.
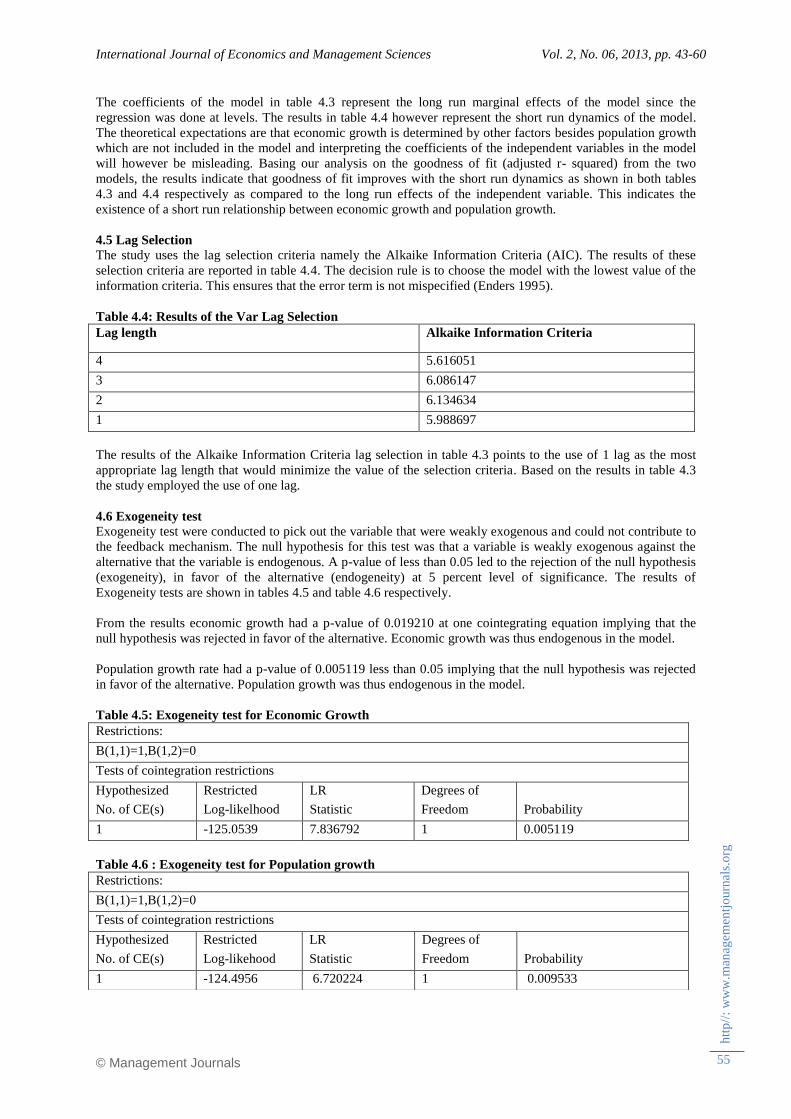
4.5 Lag Selection
The study uses the lag selection criteria namely the Alkaike Information Criteria (AIC). The results of these
selection criteria are reported in table 4.4. The decision rule is to choose the model with the lowest value of the
information criteria. This ensures that the error term is not mispecified (Enders 1995).
Table 4.4: Results of the Var Lag Selection
Lag length Alkaike Information Criteria
4 5.616051
3 6.086147
2 6.134634
1 5.988697
The results of the Alkaike Information Criteria lag selection in table 4.3 points to the use of 1 lag as the most
appropriate lag length that would minimize the value of the selection criteria. Based on the results in table 4.3
the study employed the use of one lag.
4.6 Exogeneity test
Exogeneity test were conducted to pick out the variable that were weakly exogenous and could not contribute to
the feedback mechanism. The null hypothesis for this test was that a variable is weakly exogenous against the
alternative that the variable is endogenous. A p-value of less than 0.05 led to the rejection of the null hypothesis
(exogeneity), in favor of the alternative (endogeneity) at 5 percent level of significance. The results of
Exogeneity tests are shown in tables 4.5 and table 4.6 respectively.
From the results economic growth had a p-value of 0.019210 at one cointegrating equation implying that the
null hypothesis was rejected in favor of the alternative. Economic growth was thus endogenous in the model.
Population growth rate had a p-value of 0.005119 less than 0.05 implying that the null hypothesis was rejected
in favor of the alternative. Population growth was thus endogenous in the model.
Table 4.5: Exogeneity test for Economic Growth
Table 4.6 : Exogeneity test for Population growth
Restrictions:
B(1,1)=1,B(1,2)=0
Tests of cointegration restrictions
Hypothesized
No. of CE(s)
Restricted
Log-likelhood
LR
Statistic
Degrees of
Freedom Probability
1 -125.0539 7.836792 1 0.005119
Restrictions:
B(1,1)=1,B(1,2)=0
Tests of cointegration restrictions
Hypothesized
No. of CE(s)
Restricted
Log-likehood
LR
Statistic
Degrees of
Freedom Probability
1 -124.4956 6.720224 1 0.009533
International Journal of Economics and Management Sciences Vol. 2, No. 06, 2013, pp. 43-60
© Management Journals
htt
p//
: w
ww
.man
agem
entj
ourn
als.
org
56
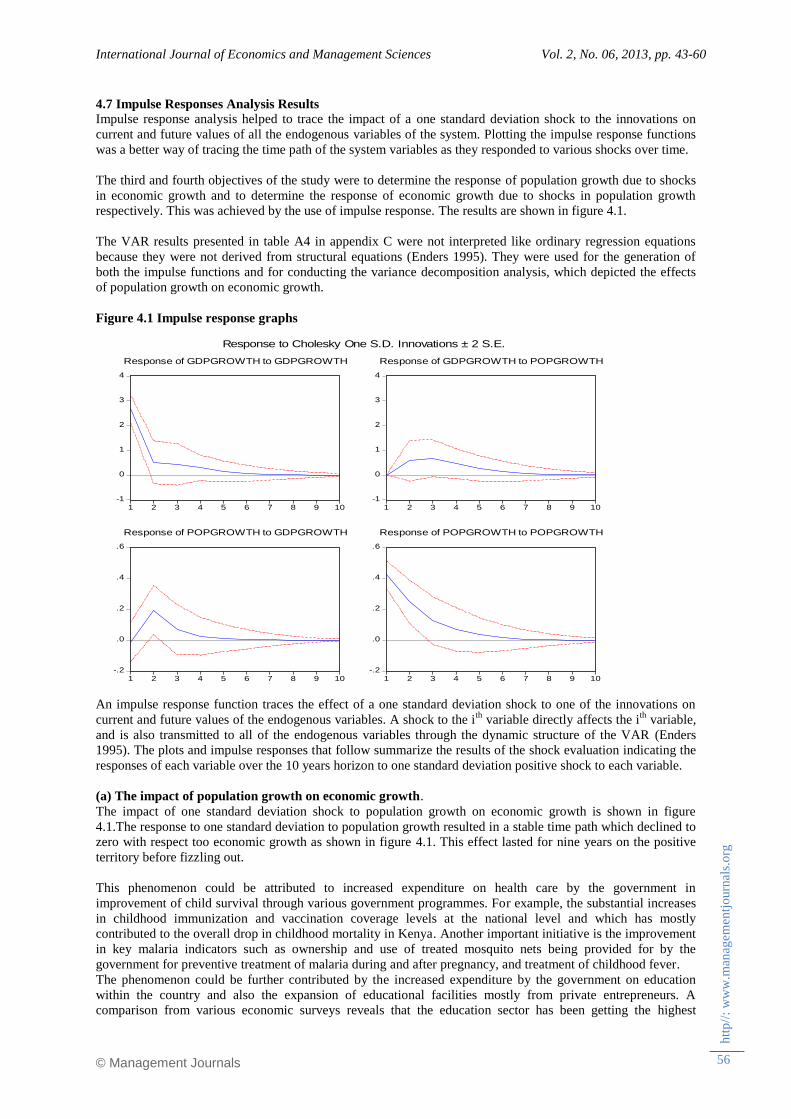
4.7 Impulse Responses Analysis Results
Impulse response analysis helped to trace the impact of a one standard deviation shock to the innovations on
current and future values of all the endogenous variables of the system. Plotting the impulse response functions
was a better way of tracing the time path of the system variables as they responded to various shocks over time.
The third and fourth objectives of the study were to determine the response of population growth due to shocks
in economic growth and to determine the response of economic growth due to shocks in population growth
respectively. This was achieved by the use of impulse response. The results are shown in figure 4.1.
The VAR results presented in table A4 in appendix C were not interpreted like ordinary regression equations
because they were not derived from structural equations (Enders 1995). They were used for the generation of
both the impulse functions and for conducting the variance decomposition analysis, which depicted the effects
of population growth on economic growth.
Figure 4.1 Impulse response graphs
An impulse response function traces the effect of a one standard deviation shock to one of the innovations on
current and future values of the endogenous variables. A shock to the ith
variable directly affects the ith
variable,
and is also transmitted to all of the endogenous variables through the dynamic structure of the VAR (Enders
1995). The plots and impulse responses that follow summarize the results of the shock evaluation indicating the
responses of each variable over the 10 years horizon to one standard deviation positive shock to each variable.
(a) The impact of population growth on economic growth.
The impact of one standard deviation shock to population growth on economic growth is shown in figure
4.1.The response to one standard deviation to population growth resulted in a stable time path which declined to
zero with respect too economic growth as shown in figure 4.1. This effect lasted for nine years on the positive
territory before fizzling out.
This phenomenon could be attributed to increased expenditure on health care by the government in
improvement of child survival through various government programmes. For example, the substantial increases
in childhood immunization and vaccination coverage levels at the national level and which has mostly
contributed to the overall drop in childhood mortality in Kenya. Another important initiative is the improvement
in key malaria indicators such as ownership and use of treated mosquito nets being provided for by the
government for preventive treatment of malaria during and after pregnancy, and treatment of childhood fever.
The phenomenon could be further contributed by the increased expenditure by the government on education
within the country and also the expansion of educational facilities mostly from private entrepreneurs. A
comparison from various economic surveys reveals that the education sector has been getting the highest
-1
0
1
2
3
4
1 2 3 4 5 6 7 8 9 10
Response of GDPGROWTH to GDPGROWTH
-1
0
1
2
3
4
1 2 3 4 5 6 7 8 9 10
Response of GDPGROWTH to POPGROWTH
-.2
.0
.2
.4
.6
1 2 3 4 5 6 7 8 9 10
Response of POPGROWTH to GDPGROWTH
-.2
.0
.2
.4
.6
1 2 3 4 5 6 7 8 9 10
Response of POPGROWTH to POPGROWTH
Response to Cholesky One S.D. Innovations ± 2 S.E.
International Journal of Economics and Management Sciences Vol. 2, No. 06, 2013, pp. 43-60
© Management Journals
htt
p//
: w
ww
.man
agem
entj
ourn
als.
org
57
allocation of the national income from the government. Due to the increase in population the demand of
education services is high leading to the government high allocation to the sector and the subsequent expansion
of the sector.
The evidence on the relationship between population growth and economic growth confirms that the
relationship between population growth and economic growth vary among countries. Furuoka (2005) found a
long-run equilibrium relationship between the population growth and per capita Gross Domestic Product (GDP)
growth in Malaysia. Klasen and Lawson (2007) examined the relationship between population growth and
economic development in Uganda. The empirical findings indicated a negative impact of population growth on
economic development. Dawson and Tiffin (1998) used time-series data to analyze a long-run relationship
between population growth and economic development in India. No long-run equilibrium relationship between
the population growth and economic development in India could be established. Thornton (2001) conducted a
similar research on the long-run relationship between population growth and economic development in seven
Latin American countries, such as Argentina, Peru, Brazil, Chile, Colombia, Venezuela and Mexico. The
findings were that a long-run relation between population and real per capita GDP does not appear to exist
hence.
(a) The impact economic growth on population growth The response to one standard deviation innovation to economic growth resulted in a stable time path which
declines to zero with respect to economic growth as shown in figure 4.1. The effect of a one standard deviation
shock on economic growth on population growth lasted for nine years on the positive territory. This result is in
support of Becker (1981) who found out that when a country is in a demographic transition, population growth
increases with an increase in economic growth in the short run.
An increase in economic growth of the country leads to growth in population up to the third year and then starts
to decline and the impact fizzles out after nine years towards its original path. Considering the causality from
economic growth to population growth first, it is likely that in the short term, high economic growth in a
developing country will increase population growth, mainly through reducing mortality rates.
This is the typical
process of a country beginning a demographic transition which initially increases population growth rates.
In the
long term, however, it is very likely that economic growth will reduce population growth as wealthier parents
choose smaller families which will over time reduce population growth as in the case of rich countries. The
situation could be further explained by the decline in child mortality enhanced by the government expenditure
on child health care.
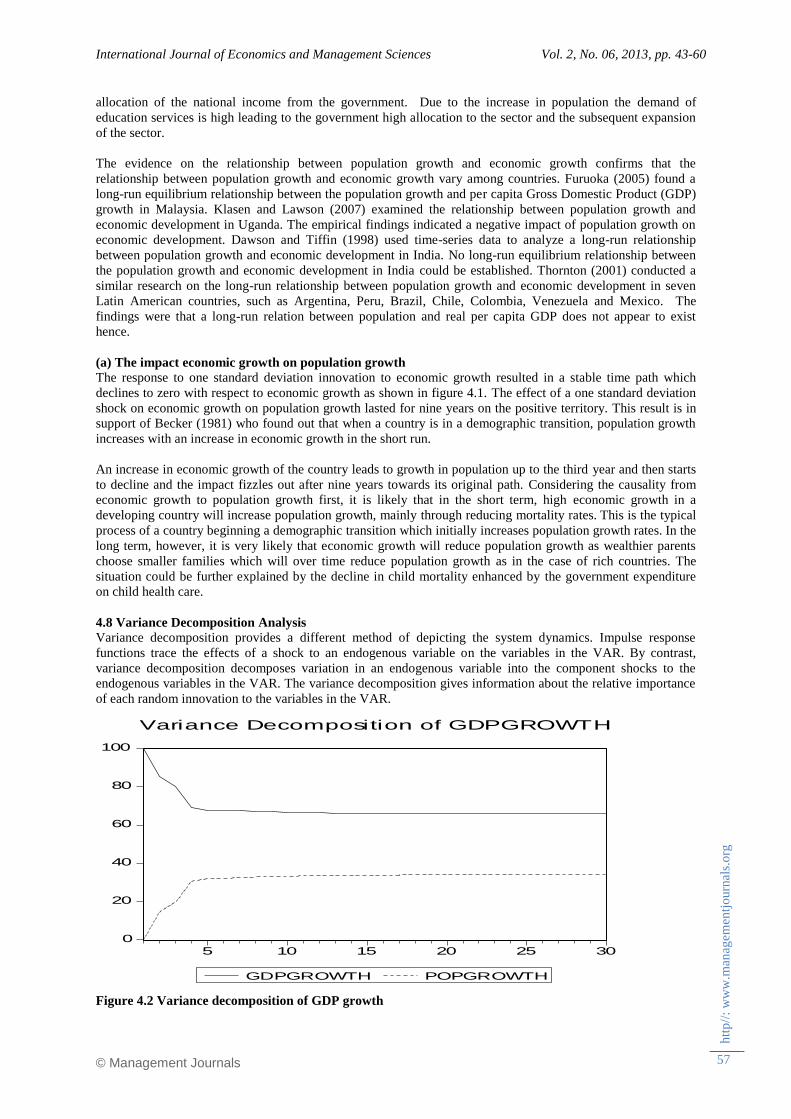
4.8 Variance Decomposition Analysis
Variance decomposition provides a different method of depicting the system dynamics. Impulse response
functions trace the effects of a shock to an endogenous variable on the variables in the VAR. By contrast,
variance decomposition decomposes variation in an endogenous variable into the component shocks to the
endogenous variables in the VAR. The variance decomposition gives information about the relative importance
of each random innovation to the variables in the VAR.
Figure 4.2 Variance decomposition of GDP growth
0
20
40
60
80
100
5 10 15 20 25 30
GDPGROWTH POPGROWTH
Variance Decomposition of GDPGROWTH
International Journal of Economics and Management Sciences Vol. 2, No. 06, 2013, pp. 43-60
© Management Journals
htt
p//
: w
ww
.man
agem
entj
ourn
als.
org
58
The variations in economic growth rate brought about by changes in population growth were analyzed. This was
an alternative method to impulse response functions for examining the effects of shocks to economic growth
rate.
The results of Variance Decomposition analysis of economic growth rate show that all the variations in
economic growth rate were due to its own shocks at 100 percent in the fist year. This implies that population
growth did not contribute at all to the variations in economic growth in the first year. The variations of own
shocks in economic growth reduced to 85.53 percent in the second year. In the third year the variations reduced
to 80.91 percent and continued to reduce as the forecasting horizon increased. The forecast error decomposition
technique continues to reveal that after the eighth year, the variations in economic growth are entirely dependent
on its composition but not population growth.
A further observation of the variance decomposition results revealed that the effect of population growth in the
system increased with the forecast period. This implies that economic growth had feedback effects with
population growth and the effects were multidirectional.
CHAPTER FIVE
SUMMARY CONCLUSION AND RECOMMENDATIONS
5.1Introduction
This chapter summarizes the study and makes conclusion based on the results. The policy implications from the
findings are also presented.
5.2 Summary
The relationship between population growth and economic growth has therefore been fundamental to the policy
makers in different countries. However, there has been no consensus whether population growth is beneficial or
detrimental to the economic growth in the developing countries. Given this scenario, there was thus a need to
establish the relationship between population growth and economic growth in Kenya. The study conducted a
granger causality test and the results indicated that there was bi- directional causality between population growth
and economic growth in the country. The study further indicated that the relationship between population
growth and economic growth was a long-run relationship. Through the use of Vector Auto regression Approach
(VAR) the results indicated population growth and economic growth are both positively correlated and an
increase in population will impact positively to the economic growth in the country both in the short run and
also in the long run.
5.3 Conclusion
The finding of the study support the existence of a long-run relationship between population and economic
growth in Kenya and provide strong support for the hypothesis that population is driving economic growth in
the country. The results of causality tests suggest that there appears to be bi-directional causality when causality
is assumed to run from population to economic growth or from economic growth to population growth. Overall,
the relationship between population and economic growth is strong and positive in Kenya over the period of the
analysis. This suggests that Kenya seem to be in the second stage of the demographic transition, called post-
Malthusian regime, in which the relationship between economic growth and population growth remains highly
strong and positive. These findings give support to the population-driven economic growth hypothesis that states
that the population growth in a country’s promotes its economic growth development.
5.4 Policy Recommendations
With the results indicating a positive correlation between population and economic growth in Kenya, then a
carefully planned population growth strategy coupled with institutional and policy changes could be beneficial
to this country. A well managed population expansion will ensure that both the population and the economy are
complementing each other without concerns that population expansion will lead countries to famines and lack of
other socio economic facilities since its the inadequate government policies, rather than population growth
which are responsible for the woes including, famines that besiege most developing nations.
The government should also put measures to ensure that the economy grows at a higher rate than the population
growth. This will ensure that the increasing demand of services arising from the population growth is met.
Having a larger, healthier, and better-educated workforce will only bear economic fruit if the extra workers can
find jobs. Open economies, flexible labor forces, and modern institutions that can gain the confidence of the
population and markets alike may help countries reap the potential benefit created by their demographic

International Journal of Economics and Management Sciences Vol. 2, No. 06, 2013, pp. 43-60
© Management Journals
htt
p//
: w
ww
.man
agem
entj
ourn
als.
org
59
transition. Openness to trade can be a key driver of economic growth, helping to significantly boost the benefits
a country receives from the demographic transition.
Population growth can influence economic growth through two essential channels including technical progress
and economies of scale. An increase in population leads to innovations. Technological advances in turn promote
productivity and economies of scale, hence the national output. There is need for the government to change the
education system to ensure that new training methods, which develop existing skills and create skills where they
do not exist are implemented. There is also a need to put in place training policies that will strengthen the
competitive capacities of the work force and increase the competitiveness. Education is the principal supplier of
highly skilled and effective human resources. The most important thing is to take action to amend and reform
mostly the higher education and makes it a useful tool in the service of the development process, and to link it to
the global market so as to meet the demands of the labor market and create new job opportunities for the
population.
The purpose of sustainable development is to create and improve an environment in which all people can
expand their capabilities and requires good governance. That concept is distinguished by its transparency and
accountability as well as its effectiveness and justice. The provision of employment opportunities is the peak of
any economic and social reform plan that aims to improve quality of life by achieving sustainable human
development. In that respect, the role of good governance in providing job opportunities need not to be
emphasized. A better political environment would also encourage private investment since its contribution to
economic growth cannot be under estimated.
REFERENCES
Ajayi, A. and Kovole, J. (1998), "Kenya's Population Policy: From Apathy to Effectiveness,” Do Population
Policies Matter? New York: Population Council, .pp 13-25.
Anker, R. Knowles, C. J. (1983) Population growth employment and economic interactions in Kenya. Gower
publishing company Hampshire England.
Bloom, D. E., and Freeman, R. (1986) “The Effects of Rapid Population Growth on Labor Supply and
Employment in Developing Countries,” Population and Development Review, pp. 381–414.
Bloom, D. E. and Williamson, G. (1997). “Demographic Transitions and Economic Miracles in Emerging
Asia,” World Bank Economic Review 12 (3): 419-55.
Bloom, D., E., and Freeman R., E. (1998) ‘Economic Development and the Timing and Components of
Population Growth.’ Journal of Policy Modeling 10(1), 57–81
Bloom, D., E. Canning, D. (2003) “Contraception and the Celtic Tiger The Economic and Social Review, Vol.
34, No. 3, Winter, 2003, pp. 229–247.
Bloom, D., D. Canning, and B. Graham. (2003). “Longevity and life-cycle savings,” National Bureau of
Economic Research Scandinavian Journal of Economics 105: 319–338.
Boserup, E. (1965), The Conditions of Agricultural Growth: The Economics of Agrarian Change under
Population Pressure. London.
Bucci, A. (2003) “Population Growth in a Model of Economic Growth with Human Capital Accumulation and
Horizontal R&D” University of Milan: Milan,
Coale, A. J., and Hoover E., M. (1958) Population Growth and Economic Development in Low- Income
Countries .Princeton: Princeton University Press.
Enders, W. (1995) Applied Econometrics Time series, New York: John Wiley and Sons Inc.
Engle, R.F., D.F. Hendry and J-F. Richard (1983),”Exogeneity. Econometrica,” 51, 277.304.
Esther Muia, Patrick Ndavi, Joyce Olenja, Paul Kizito, Sian Curtis, and Ani Hyslop” (2003) Factors that
Contribute to the Utilization of Quality Reproductive Health Care: Findings from Further Analysis of
the Kenya Service Provision Assessment of 1999”. .National Council for Population and
Development. Nairobi, Kenya.
Friedberg, R.and J. Hunt (1995). “The Impact of Immigrants on Host Country Wages, Employment and Growth
(in Symposia: Immigration).” The Journal of Economic Perspectives (2): 23-44.
Gerald, M. and Meier, M., G. (1995), “Leading Issues in Economic Development” New York: Oxford
University Press, 1995), p.276.
Kenya National Bureau of Statistics (2007), Kenya integrated household budget survey (KIHBS) 2005/06.
Nairobi: KNBS
Kenya National Bureau of Statistics, (2008), Well-Being in Kenya, a socio-economic profile.Nairobi: KNBS
Kenya National Bureau of Statistics, (2009). Demographic and Health survey 2009, Government Printer,
Nairobi: KNBS

International Journal of Economics and Management Sciences Vol. 2, No. 06, 2013, pp. 43-60
© Management Journals
htt
p//
: w
ww
.man
agem
entj
ourn
als.
org
60
Kelley, A. C. (1988). Population matters - demographic change, economic growth, and poverty In the
developing world. New York: Oxford University Press.
Kelley, A. C. & R. M. Schmidt. (1995), “Aggregate Population and Economic Growth Correlations: The role of
the components of demographic change,” Demography, 32(4): 543-555
Kirori, G.N. and Ali, J. (1998) “Macroeconomic Implications of Demographic Changes in Kenya” Africa
Economic Research Consortium .Research Paper eighty-three.
Macharia, K, (1997). “Social and Political Dynamics of the Informal Economy in African Cities” Harare and
Nairobi. Lanham, University press of America.
Malthus, T.R. (1798), An Essay on the Principles of Population, (Cambridge: Cambridge University Press.
Mankiw, G. Roemer, D. and Weil, P. (1992) A Contribution to the Empirics of Economic Growth. Quarterly
Journal of Economics
Martin .P (2009) “Demographic and Economic Trends: Implications for International Mobility” United Nations
Development Programme Human Development Reports . Research Paper 2009/17
Mukras, M. S.(1993) Elementary Econometrics: Theory, Application and Policy. Nairobi: East African
Educational Publishers Ltd.
National Council for Population and Development (NCPD) [Kenya], Central Bureau of Statistics (CBS), and
Macro International Inc. (MI). 1999. Kenya demographic and health survey 1998. Calverton,
Maryland: NCPD, CBS, and MI.
Odini, L. H., (2008) “Adolescent reproductive health and development policy 2005-2015.AID Portal. Retrieved
from http://www.aidsportal.org/Article_Details.aspx?ID=7811
Oduor, J. (2008) Impacts of Real Exchange Rate Misalignment on Trade Creation and Diversion within
Regional Trading Blocks: The case of Comesa. Shaker: Verlag, Germany.
Republic of Kenya (2006) Demographic and Health Survey Government Printer, Nairobi:
Republic of Kenya (2010) 2009 Kenya Population and Housing Census. Government Printer, Nairobi:
Ralph Thomlinson (1965), Population Dynamics Causes and Consequences of World Demographic Change
California state college random house. New York
Simon, J. L. (1977), The Economics of Population Growth. Princeton University Press: Princeton New Jersey,
Simon, J. L. (1992) Population and Developing Countries, Princeton University Press: Princeton, New. Jersey
Srinivasan, T. N., (1988) “Population Growth and Economic Development,” Journal of Policy Modeling, Vol.
10, No. 1, spring. pp. 7–28.
Stock, J.H., and Watson, M.W.(2001) Vector Auto Regressions journal of economic pespectives15,101-115
Tournemaine, Frederic, (2007) "Can population promote income per-capita growth? A balanced Perspective."
Economics Bulletin, Vol. 15, No. 8 pp. 1-7
Thirlwal, A. P. (1993) “Growth and Development with Special Reference to Developing Economies”,
University of Kent at Canterbury, 5th
Edition. Pp. 143-155.


![INGLES- Nassau Senior, Population, and added, Correspondence with Malthus [1829].pdf](https://img.pdfslide.net/doc/110x75/577cdadd1a28ab9e78a6bcec/ingles-nassau-senior-population-and-added-correspondence-with-malthus-1829pdf.jpg)