Embed Size (px)
Citation preview
THE IMPACT OF POTENTIAL MOVIE AND TELEVISION INDUSTRY STRIKES
ON THE LOS ANGELES ECONOMY
Ross C. DeVol
Joel Kotkin Jonathan M. Orszag
Peter R. Orszag Robert F. Wescott
Perry Wong
April 2001
Commissioned by the Office of Mayor Richard J. Riordan, City of Los Angeles
1
Executive Summary • The entertainment industry plays an important role in the Los Angeles economy.
For example:
o The motion picture and television production industries directly account for roughly 185,000 jobs and roughly $24 billion in output per year in Los Angeles County.
o Los Angeles accounts for more than one quarter of the nation’s movie and
television production, a larger national presence than New York in financial services, Detroit in automobile production, and Las Vegas in gambling.
o The indirect economic effects of the motion picture and television production
industry on the Los Angeles economy are even larger than these figures suggest, since film and television production boost demand for local products and services.
• The potential strikes by the writers’ union and the actors’ unions could impose
substantial short-term economic costs on the city, a variety of businesses, and individuals – many of whom are not direct participants in the negotiations. This analysis evaluates the impact of the potential strikes on the Los Angeles and Californian economies using the Milken Institute’s econometric models under alternative assumptions about the length of the labor disagreements.
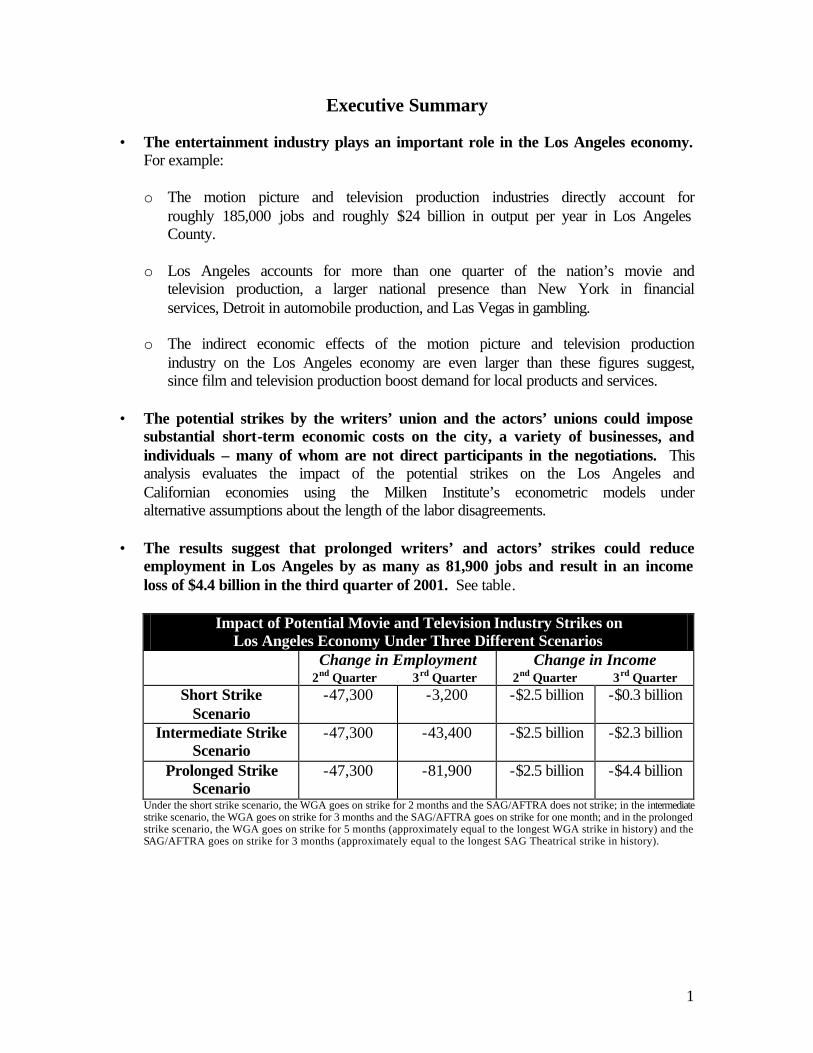
• The results suggest that prolonged writers’ and actors’ strikes could reduce
employment in Los Angeles by as many as 81,900 jobs and result in an income loss of $4.4 billion in the third quarter of 2001. See table.
Impact of Potential Movie and Television Industry Strikes on
Los Angeles Economy Under Three Different Scenarios Change in Employment
2nd Quarter 3rd Quarter Change in Income
2nd Quarter 3rd Quarter Short Strike
Scenario -47,300 -3,200 -$2.5 billion -$0.3 billion
Intermediate Strike Scenario
-47,300 -43,400 -$2.5 billion -$2.3 billion
Prolonged Strike Scenario
-47,300 -81,900 -$2.5 billion -$4.4 billion
Under the short strike scenario, the WGA goes on strike for 2 months and the SAG/AFTRA does not strike; in the intermediate strike scenario, the WGA goes on strike for 3 months and the SAG/AFTRA goes on strike for one month; and in the prolonged strike scenario, the WGA goes on strike for 5 months (approximately equal to the longest WGA strike in history) and the SAG/AFTRA goes on strike for 3 months (approximately equal to the longest SAG Theatrical strike in history).

2
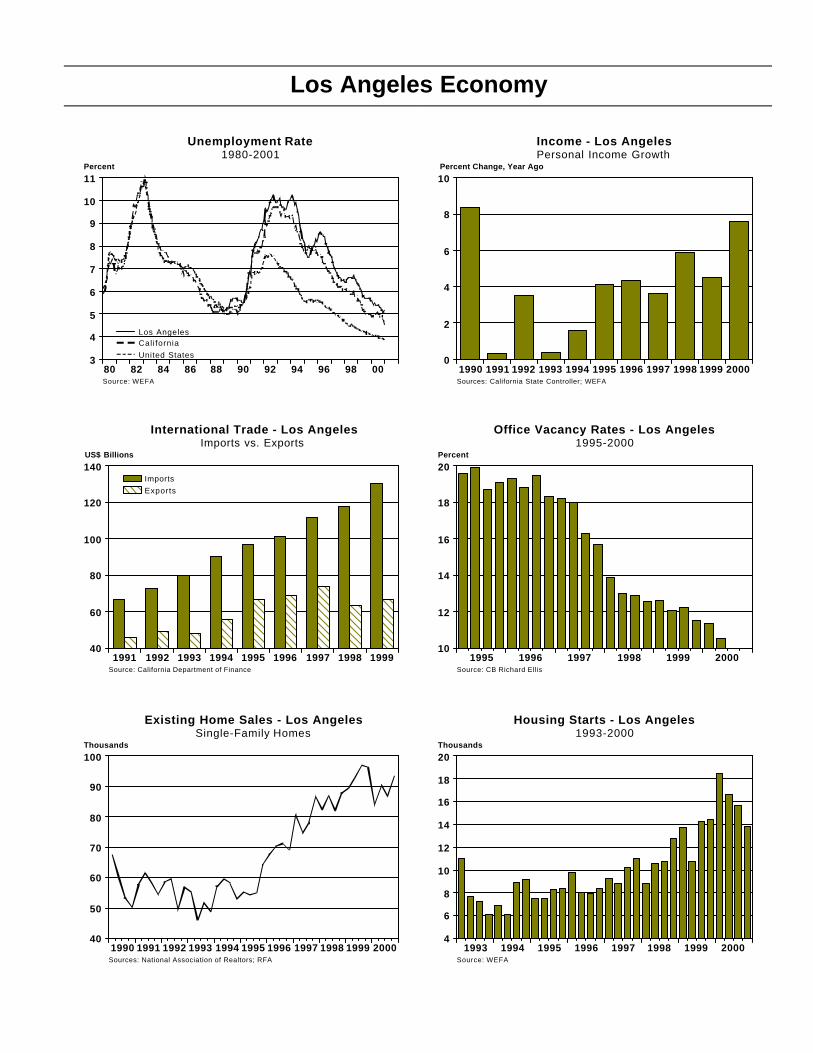
• The potential strikes would also cause a substantial increase in the Los Angeles unemployment rate. The unemployment rate in Los Angeles in March 2001 was 4.8 percent. Even under the short strike scenario, the unemployment rate would rise to 6.1 percent in the second quarter. Under the prolonged scenario, the unemployment rate would continue to rise in the third quarter, reaching 6.9 percent. For comparison, if the national unemployment rate were to rise by 2.1 percentage points, 3 million additional people would be out of work.
• To put these results in perspective, note that:
o The $4.4 billion reduction in third-quarter income is equivalent to the output from every casino and hotel in Las Vegas for more than half a year, and only slightly less than the value of automobile production in Detroit in one quarter.
o Under the prolonged strike, 81,900 jobs would be lost in the third quarter – that is roughly equivalent to laying off every ticket holder at four consecutive sold-out Lakers games.
• The impact of the potential strikes extends to many workers outside the movie and television industry. The reduction in movie and television production activity feeds into reduced work for supplier industries, such as advertising, accounting, and costume rental. Retail trade – such as eating and drinking establishments, and laundry cleaning services – would also be affected by movie and television industry strikes. Under the prolonged strike scenario, employment in this sector would drop by an estimated 16,000 in the third quarter. Similarly, finance, insurance and real estate industries could suffer during a strike. For example, home sales would likely slow due to the loss of income in all sectors of the Los Angeles economy.
• The potential strike would substantially affect the people of Los Angeles. For
example, veteran cameraman Jeff Norvet is currently earning substantially higher income than usual, but his consumer behavior betrays a deep apprehension about the future. When the actors struck in 1980, Norvet recalls, his situation was different. He was single and could live on unemployment insurance benefits. “I could take the hit then,” he explains. Now with a wife and two children, he is concerned about making ends meet in the longer run. “I am being incredibly cautious now,” Norvet explains. “I just sold my house in Agoura and moved into a smaller one. I am keeping the money from the sale of the house as a backup for the next year.”
• Movie and television strikes would affect all of California. The strike will affect
economic activity beyond Los Angeles. For example, under the prolonged strike scenario, the state of California would suffer a loss of nearly 100,000 jobs and $6.1 billion in income during the third quarter.
• If a strike occurs, Los Angeles will lose a significant amount of tax revenue. A
prolonged strike would lead to an estimated $54.4 million loss of tax revenue to Los Angeles.

3
• The economic costs to Los Angeles from the potential strike are higher than they would be in a stronger macroeconomic environment. It is unlikely that demand from other industries would be sufficient in the short run to replace the lost output and demand from the film and television industries.
• Some observers may claim that a strike would merely cause production to shift
backward or forward in time; however, the degree to which such substitution is possible is unclear. There is evidence that movie and television production has accelerated in advance of the potential strikes. For example, there are currently 111 movies in production; at this time last year, there were 82 movies in production. Nevertheless, it may not be possible to replace all of the lost production before or after a strike, especially in the television industry. Furthermore, some workers and small businesses may have difficulty weathering the storm during the strike itself.
• This study has not examined the impact of the strike on either the long-term
welfare of the parties involved or on the viability of Los Angeles as the capital of the entertainment industry. A protracted strike may affect the long-term attractiveness of producing films (and doing business) in Los Angeles relative to elsewhere. At the same time, however, the industry’s long-term future may also be affected by the incentives provided to writers, actors, and producers, which are at the heart of the contract negotiations.
• The analysis does not examine the merits of either party’s position in the
negotiations. It should therefore not be interpreted as assigning responsibility for the economic costs outlined here to either party. Rather, it merely highlights the significant costs – including to others – if the parties are unable to reach agreement.
4
About the Authors
This study was commissioned by the Office of Los Angeles Mayor Richard J. Riordan as an independent analysis of the impact of the potential movie and television industry strikes on the Los Angeles economy. The views and opinions expressed in this study are solely those of the authors and do not necessarily reflect the views and opinions of the Office of Los Angeles Mayor Richard J. Riordan. The authors of the study are: • Ross C. DeVol ([email protected]), director of regional and demographic
studies at the Milken Institute. Prior to joining the Institute, DeVol was senior vice president of WEFA, Inc. (formerly Wharton Econometric Forecasting), where he supervised their Regional Economic Services group.
• Joel Kotkin ([email protected]), senior fellow with the Milken Institute. Kotkin also serves as a senior fellow with Pepperdine University’s Davenport Institute for Public Policy, and a contributing editor to the Los Angeles Times Opinion section.
• Jonathan M. Orszag ([email protected]), Managing Director of Sebago Associates, Inc. Prior to joining Sebago Associates, Orszag served as an Economic Policy Advisor at the White House’s National Economic Council, and as the Director of Policy and Strategic Planning at the U.S. Department of Commerce.
• Peter R. Orszag ([email protected]), President of Sebago Associates. Prior to founding Sebago Associates, Orszag served as Special Assistant to the President for Economic Policy at the White House.
• Robert F. Wescott ([email protected]), economic consultant based in Washington, DC. From March 1999 until January 2001, Wescott served as Special Assistant to the President for International Economics at the White House’s National Economic Council.
• Perry Wong ([email protected]), research economist at the Milken Institute. Wong previously served as a senior economist and director of regional forecasting at WEFA, Inc.
The Milken Institute (http://www.milkeninstitute.org) is a 501(c)(3) non-partisan economic think tank founded in 1991. Its mission is to explore and explain the dynamics of world economic structure, conduct and performance by conducting research in economics, business and finance. The objective is a better-informed public, more thoughtful public policies, improved economic outcomes and better lives for people. Sebago Associates, Inc., (http://www.sbgo.com) is an economic and public policy consulting firm. The firm provides advisory services to corporations and public-sector entities facing policy challenges at the state, national, or international levels. The firm’s principals combine academic expertise with extensive experience in senior government positions, thereby merging strong analytical capabilities with a thorough understanding of how governments operate.
5
The Impact of Potential Movie and Television Industry Strikes on the Los Angeles Economy
April 2001
Introduction The entertainment industry plays an important role in the Los Angeles economy. The motion picture and television production industries directly account for roughly 185,000 jobs and roughly $24 billion in output per year in Los Angeles County.1 Los Angeles accounts for more than one quarter of the nation’s movie picture and television production, a larger national presence than New York in financial services, Detroit in automobile production, and Las Vegas in gambling.
The indirect economic effects of the motion picture and television production industry on the Los Angeles economy are substantial, since film and television production draws on a wide array of external support and boosts demand for local products and services. As the U.S. Department of Commerce recently noted, “Film production is a ‘locomotive’ industry, similar to housing construction and automobiles, in that the number of production workers directly working in the industry belies the true impact of the industry on the economy because so many upstream, downstream, and peripheral industries depend on the primary production plant.”2
Given the significance of the motion picture and television industries to the Los Angeles economy, the potential strikes by the writers’ union and the actors’ unions could impose substantial short-term economic costs on the city, on a variety of businesses, and on individuals.
On May 1, 2001, the current contract between the Writers Guild of America (WGA) and the Alliance of Motion Picture and Television Producers will expire. In the absence of a negotiated agreement before then, the WGA has indicated that it may go on strike at the beginning of May. Two months later, the current contracts of the Screen
1 Employment estimates from Bureau of Labor Statistics ES-202 report and output estimates based upon Regional Financial Associates. The employment figure likely underestimates the numb er of workers in the motion picture and television production industry because it does not include independent contractors and self-employed workers. As many as 40,000 such workers are employed in the industry in Los Angeles. 2 U.S. Department of Commerce, Impact of the Migration of U.S. Film and Television Production, March 2001, page 5, available at http://www.ita.doc.gov.
U.S. Department of Commerce: “Film production is a ‘locomotive’
industry… in that the number of production workers directly working in the industry
belies the true impact of the industry on the economy because so many upstream,
downstream, and peripheral industries depend on the primary production plant.”
6
Actors Guild (SAG) and the American Federation of Television and Radio Artists (AFTRA) with film and TV producers also expires, and SAG and AFTRA have indicated that they may go on strike unless an agreement is reached before then.
This study examines the potential economic effects of strikes by the WGA and the SAG/AFTRA. The first section of the paper provides background on the film and television industry in Los Angeles, including both its direct effect on the economy and its indirect effect through its demand for other local industries and workers. The second section presents estimates of the potential strikes’ economic effect. Using a regional economic model developed by the Milken Institute, the section examines the impact of three scenarios of potential strikes on employment, output, tax revenue, and other economic measures in the short run. A conclusion section discusses the implications of the results. Appendix I provides a set of graphs and tables on the Los Angeles economy. Appendix II describes the Milken Institute model in more detail.
This paper takes no position on the substance of the negotiations between the interested parties. Rather, the purpose of the paper is solely to provide an independent analysis of the potential economic effect should those negotiations fail. I. Background on the Entertainment Industry and the Los Angeles Economy
Producing a movie, television program, or commercial is a complicated and expensive business operation. It involves a wide array of “above-the-line” talent – actors, directors, writers, and producers – as well as hundreds of “below-the-line” workers who work behind the scenes to make the project successful. These below-the-line workers include sound engineers, set designers, caterers, electricians, animal handlers, camera operators, makeup artists, and a host of other specialists. They are typically hired locally (one estimate suggests that 70 to 80 percent of below-the-line workers are hired on location)3 and often work for small businesses or independent contractors. Movie and television production thus involves a team of professionals brought together for a designated period of time.
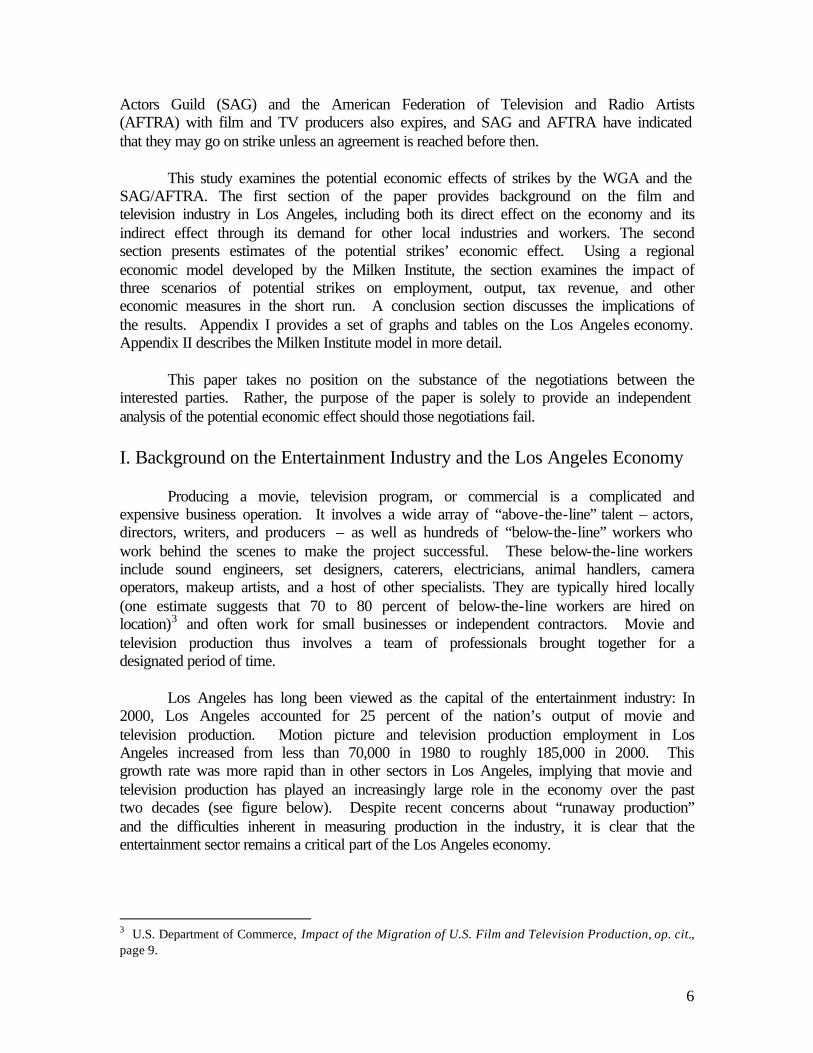
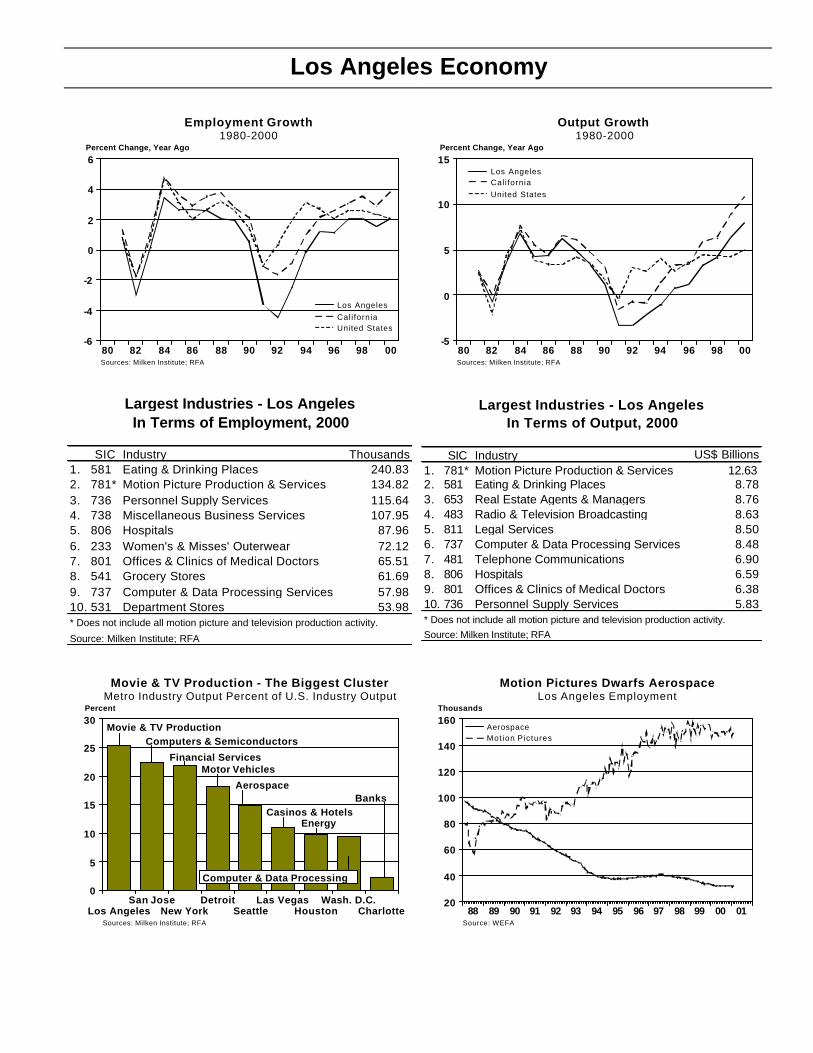
Los Angeles has long been viewed as the capital of the entertainment industry: In 2000, Los Angeles accounted for 25 percent of the nation’s output of movie and television production. Motion picture and television production employment in Los Angeles increased from less than 70,000 in 1980 to roughly 185,000 in 2000. This growth rate was more rapid than in other sectors in Los Angeles, implying that movie and television production has played an increasingly large role in the economy over the past two decades (see figure below). Despite recent concerns about “runaway production” and the difficulties inherent in measuring production in the industry, it is clear that the entertainment sector remains a critical part of the Los Angeles economy.
3 U.S. Department of Commerce, Impact of the Migration of U.S. Film and Television Production, op. cit., page 9.
7
0098969492908886848280
7
6
5
4
3
2
1
Percent
Sources: Milken Institute; RFA
Movie & Television Production - Los AngelesPercent of Total Metro Employment & Output
Employment
Output
The Entertainment Cluster in Los Angeles Entertainment in Los Angeles is among the strongest urban industry
agglomerations in the nation. The local components of the Los Angeles-based movie and television industry forms a dense and highly localized cluster -- that is, a geographic concentration of sometimes competing, sometimes collaborating firms, employees, and related supplier networks.4 Clustering results from businesses and workers seeking geographic proximity with others engaged in related activities. Dense concentrations of such activity result in economic efficiencies from three primary sources: labor-force pooling, supplier networks and technology spillovers.5
• Clusters benefit from a pooled labor force. For firms, a pooled labor force
provides a deep market of workers with the industry-specific skills that they require. For workers, it provides a wider array of job opportunities within their residential area. The high technology industry in Silicon Valley provides one oft-cited example of labor-force pooling.6 The movie and television production industry in Los Angeles is another prime example.
• Clusters also reflect intricate linkages between suppliers and producers.7 For
example, producing a movie requires a wide array of specialized input, from expensive cameras to custom automobiles used to film highway scenes. A supplier network supports, and is supported by, the production activity.
4 Ross C. DeVol, “Metro Growth: How Dependent on High-Tech Success,” WEFA Group Special Study, August 1997, page 5. 5 Paul Krugman, “Increasing Returns and Economic Geography,” Journal of Political Economy 99 (3). 6 Annalee Saxenian, Regional Advantage: Culture and Competition in Silicon Valley and Route 128 (Harvard University Press: Cambridge, 1994). 7 Joel Kotkin and Ross C. DeVol, “Knowledge-Value Cities in the Digital Age,” Milken Institute Research Report, February 13, 2001, page 11.
8
Employment Output
Metro Industry Thousands US$ Billions Employment Output Employment Output Employment OutputLos Angeles Movie & Television
Production
184.1 23.5 6.0 6.6 4.5 6.6 18.7 25.4
Charlotte Banks 26.4 5.7 2.0 3.2 3.1 8.8 1.3 2.2
Detroit Motor Vehicles 195.8 20.0 11.5 10.3 8.9 12.3 19.3 18.1Houston Energy 148.2 37.5 3.8 4.7 7.1 19.2 6.0 9.8
Las Vegas Casinos & Hotels 173.0 7.3 16.3 20.9 22.9 14.8 9.4 11.0New York Financial Services 328.0 128.1 2.7 4.3 7.7 26.7 8.8 21.9
San Jose Computers & Semiconductors
122.7 26.7 15.2 15.7 12.0 18.8 11.9 22.4
Seattle Aerospace 83.0 7.2 14.0 10.8 5.8 5.6 15.2 14.8Washington DC Computer & Data
Processing
157.2 18.2 3.8 3.7 5.7 7.6 8.1 9.4
*The Location Quotient (LQ) equals % output in metro divided by % output in the U.S. If LQ>1.0, the industry is more concentrated in the metro area than
in the U.S. on average.
Source: Milken Institute; RFA
Movie & Television Production and Other Well-Known Metro Clusters2000
Location Quotient* Percent of Metro Percent of US Industry
• Clusters facilitate technology spillovers, which can occur when creative artisans migrate between firms and ex-colleagues create informal labor-market networks that result in new technical and other innovations being shared.
A cluster’s success in generating wealth in a region is dictated by its ability to
export goods and services beyond the region. Los Angeles’ movie and television production-based cluster is a classic example of an export industry: it sells its product in national and international markets.
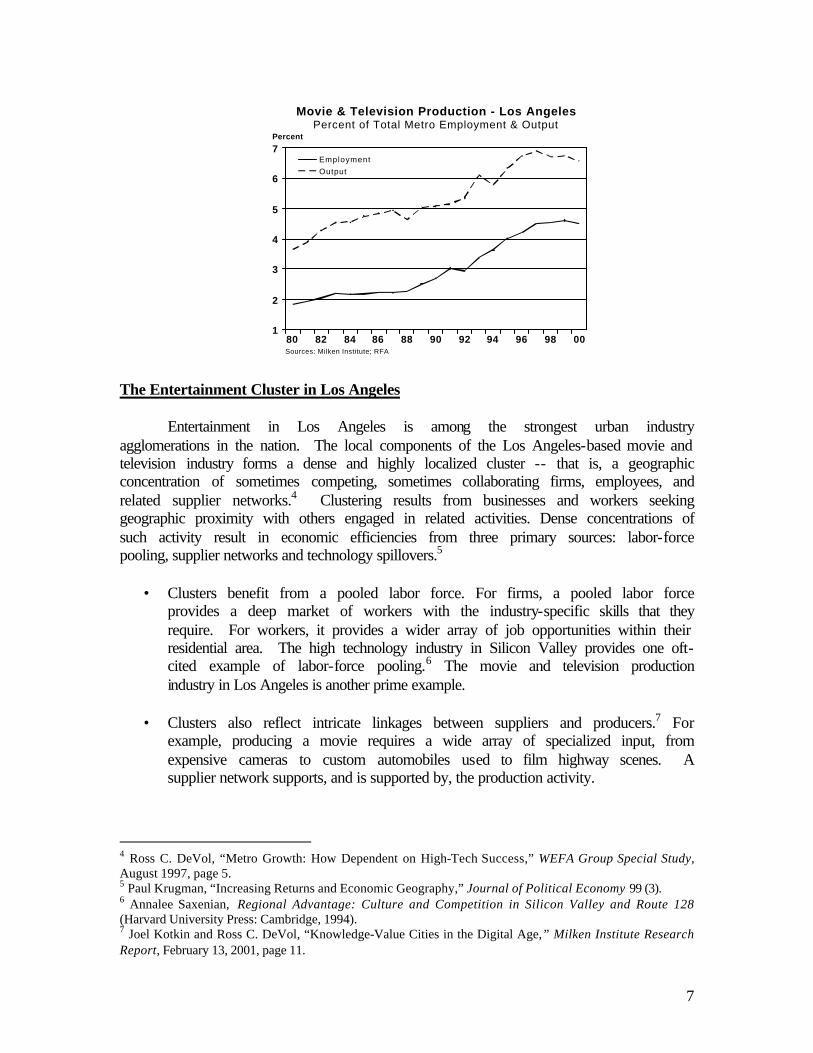
The importance of movie and television production activities to the Los Angeles
economy can be compared to other well-known industry clusters. In the table above, we provide various comparisons between movie and television production in Los Angeles and other clusters such as motor vehicles in Detroit, energy in Houston, casinos and hotels in Las Vegas, financial services in New York, computers and semiconductors in San Jose (Silicon Valley), aerospace in Seattle, computer and data processing in the Washington, D.C. metro area, and banking in Charlotte.
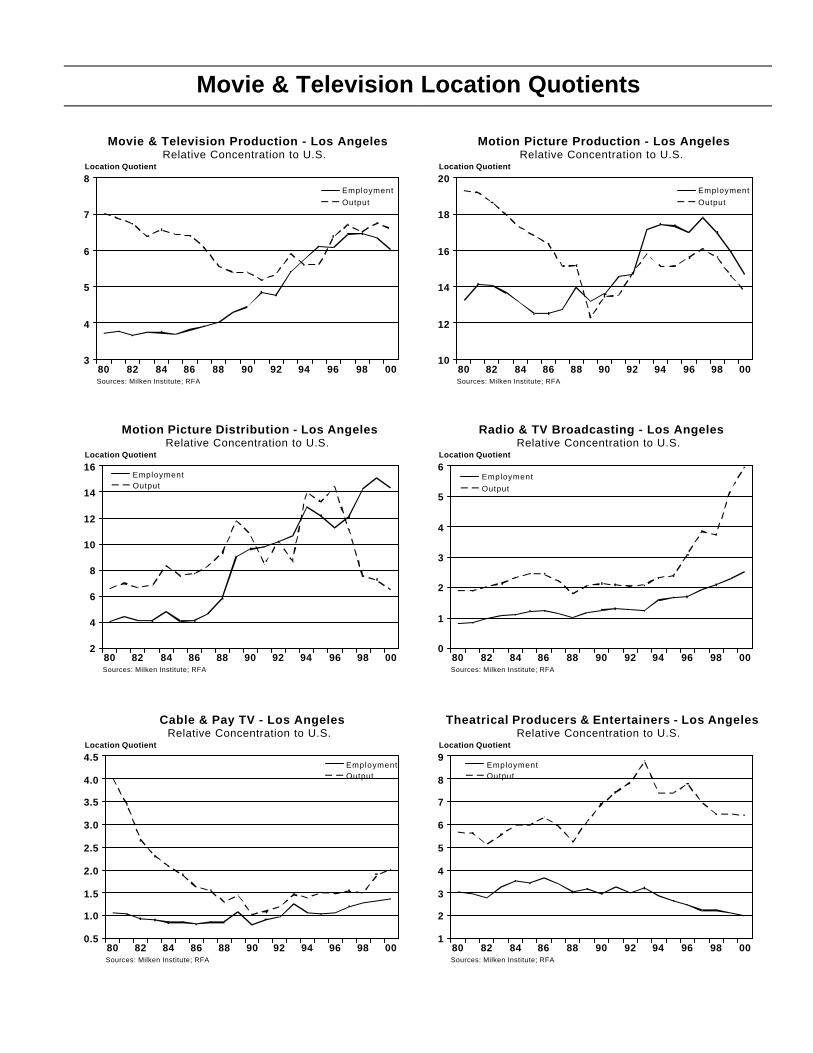
A common way to gauge the importance of a particular industry to a metropolitan economy is through the use of location quotients. If a location quotient equals 1.0, the industry has the same share of the local economy as it does in the national economy. Movie and television production in Los Angeles has a location quotient of 6.6 for output, meaning that that the industry is 6.6 times more concentrated in Los Angeles than in the nation as a whole. By comparison, the location quotient for casinos and hotels in Las Vegas (20.9) highlights the even more central role of that industry in the Las Vegas economy.
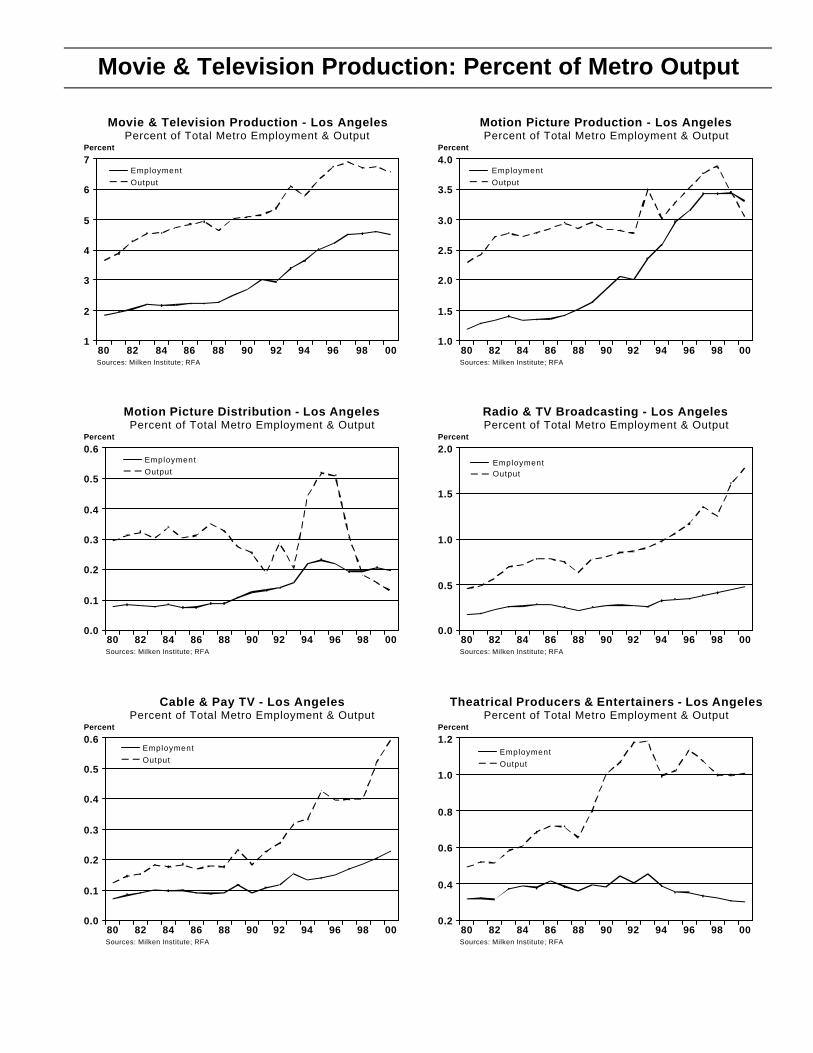
Another perspective on the role of a specific industry in a local economy is to examine the share of local economic activity that the industry represents. Movie and television production in Los Angeles account for 6.6 percent of local economic output. This share ranks eighth in the nation for a single industry in a local economy. The financial services industry in New York ranks first, representing 26.7 percent of local economic activity.
9
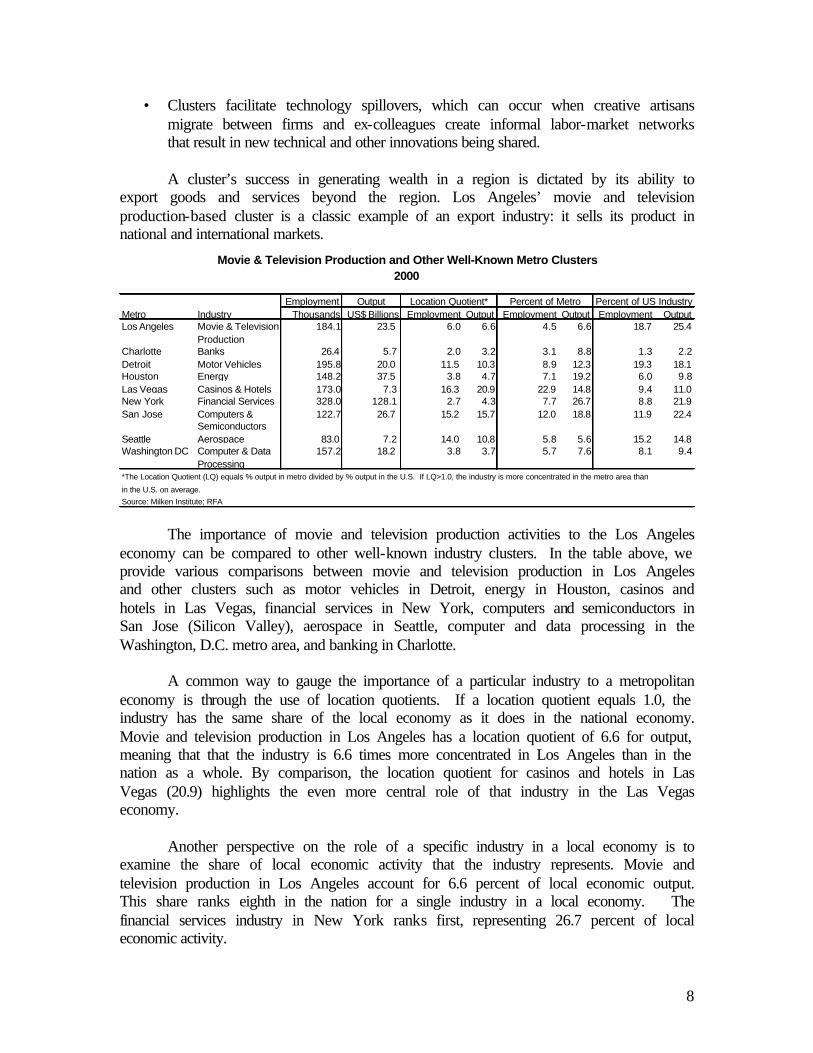
Finally, perhaps the best perspective on assessing the dominance of a metro in a
specific industry is its share of national employment and output in that industry. By this measure, Los Angeles dominates the movie and television industry more than any other area does in its leading industry (see figure below). Los Angeles accounts for 25.4 percent of national output in movie and television production.8
CharlotteWash. D.C.
HoustonLas Vegas
SeattleDetroit
New YorkSan Jose
Los Angeles
30
25
20
15
10
5
0
Percent
Sources: Milken Institute; RFA
Movie & TV Production - The Biggest ClusterMetro Industry Output Percent of U.S. Industry Output
Movie & TV ProductionComputers & Semiconductors
Financial ServicesMotor Vehicles
Aerospace
Casinos & HotelsEnergy
Computer & Data Processing
Banks
Indirect Benefits of Movie Picture and Television Production The figures above are based only on the direct economic effect of the entertainment industry. The aggregate impact of the industry is significantly larger than these direct measures suggest. In addition to employing workers, film and television production generate demand for food, gas, and other products and services from local businesses. For example, direct employment by the entertainment industry does not include the employees (including caterers, accountants, makeup stylists, and others) who are officially employed in other industries but who may work almost exclusively for the film industry.
Several studies show the magnitude of the indirect impact of movie production. In 1997, Arthur Andersen analyzed the economic impact of a film production in Chicago. The analysis found that the 90-day production produced a direct economic impact of over $12.5 million, and an indirect impact of more than $21 million.9 Another analysis by the Dallas Film Commission found that many non-film businesses benefited from a recent motion picture production there. The non-film expenditures included $420,000 on car rentals, $136,000 on the rental of a private residence, $66,000 on cell phones, $50,400 on
8 For motion picture production by itself, Los Angeles accounts for 52.8 percent of national activity. 9Arthur Anderson LLP, “Economic Impact Study for the Chicago Film, Television & Commercial Economic Development Coalition,” September 1997.
10
janitorial services, $22,000 on freeway tolls, and $6,000 on local transportation and limousine services.10 Brief History of Movie and Television Industry Strikes
A significant share of motion picture and television production employees is unionized. For example, the SAG reports that it has roughly 98,000 members nationwide, with approximately 52,000 to 53,000 members in Southern California. The WGA had 8,618 members in 1999, with more than half (4,419) employed as writers. The vast majority of the writers (3,092 of the 4,419) were employed in the television industry, and approximately 6,500 of its members reside in the Los Angeles area. Over the past 50 years, the writers’ and actors’ unions have struck roughly half a dozen times each. The first WGA strike occurred in 1952, and lasted 13 weeks. The most recent – and longest – WGA strike was in 1988, and lasted 22 weeks. There have been six WGA strikes over the past half century, with the average strike lasting 15 weeks and the shortest, in 1985, lasting 13 days.11 The SAG has struck eight times in the past 50 years. Since the first strike in 1952, the average length of all SAG strikes has been 9 weeks, with the longest theatrical strike lasting 13 weeks (in 1980). The SAG’s most recent strike against the advertising industry in 2000 continued for six months. II. The Economic Impact of Movie and Television Industry Strikes Under Different Scenarios
This section evaluates the impact of potential WGA and SAG/AFTRA strikes on
the Los Angeles and Californian economies using the Milken Institute’s econometric models under alternative assumptions about the length of the labor disagreements.
Brief Description of Methodology
The Milken Institute models of the Los Angeles and Californian economies incorporate structural linkages between “export” sectors and dependent supplier industries through an embedded input-output framework. Export sectors – such as movie and television production in Los Angeles – produce goods and services that are primarily consumed outside of Los Angeles and California. These export industries serve national rather than local markets. The income they generate, however, provides one of the major stimuli to the local economy.
The models allow an assessment of the “ripple effects” from lost movie and
television production as they spread to related sectors and indirectly affected activities in
10 U.S. Department of Commerce, Impact of the Migration of U.S. Film and Television Production, op. cit., page 22. 11 Two more targeted strikes were not included in this calculation: first, the 1959 strike against independent motion picture producers; and second, the ABC and CBS news and promotion writers strike in 1987.

11
Los Angeles and California. For example, in the Los Angeles and California models, the local economy is composed of construction, transportation, utilities and communications, finance, insurance, and real estate, wholesale and retail trade, services, and state and local government. The income generated by export sectors such as television and movie production circulates and multiplies through the local economy. The embedded input-output module thus allows changes in movie and television production to pass through to its supplier industries (such as legal services, caterers, makeup stylists, and many others). A more detailed description of the model is contained in Appendix II.
The basic methodology of the study is as follows. A baseline economic forecast for Los Angeles and California is estimated from likely international, national, and local conditions without a strike. Economic activity under different assumptions about the length of the potential strikes is then estimated by the models. These results are then compared to the baseline forecast, providing an estimate of the impact of the potential strikes on economic activity. Potential Strike Scenarios
To provide insight into the economic effects of potential strikes, three alternative strike scenarios were evaluated. The three scenarios were:
1. Short strike. The first scenario involves a short strike, in which the WGA
goes on strike for two months and the SAG/AFTRA does not strike. 2. Intermediate strike. The second scenario involves an intermediate strike, in
which the WGA goes on strike for three months and the SAG/AFTRA goes on strike for one month.
3. Prolonged strike. The final scenario involves an extended strike, in which the
WGA goes on strike for five months (approximately equal to the longest WGA strike in history) and the SAG/AFTRA goes on strike for three months (approximately equal to the longest SAG Theatrical strike in history).
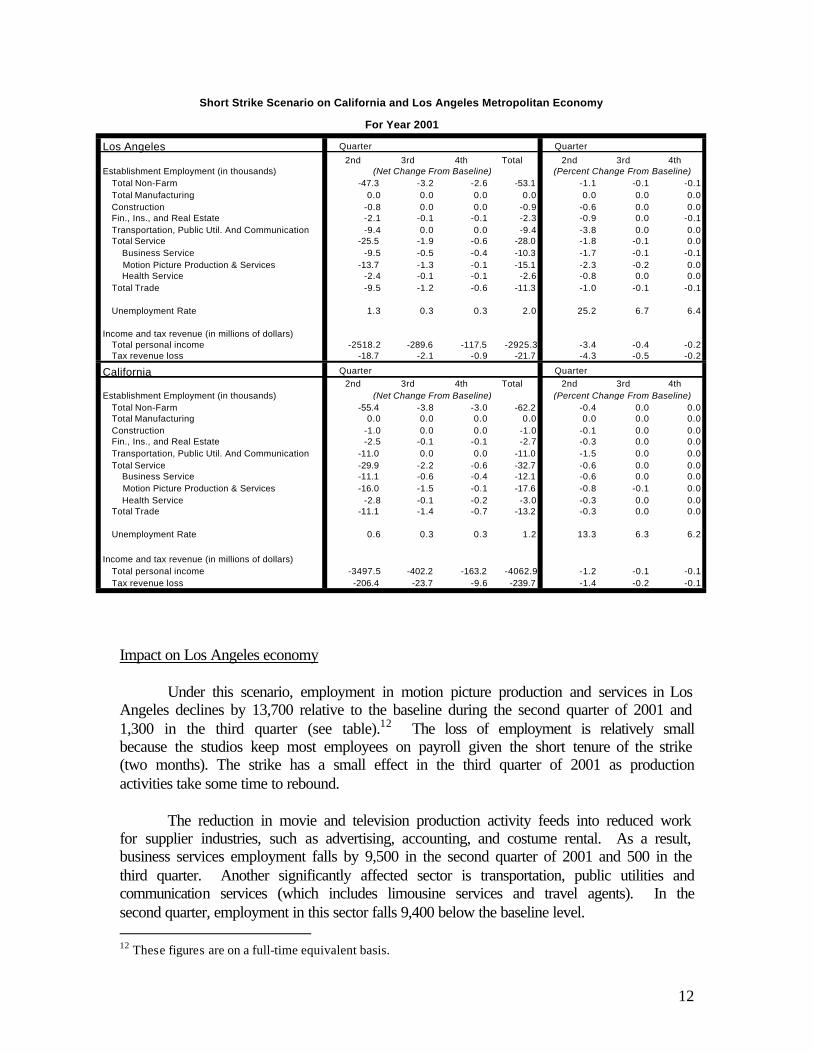
Short Strike
In the short strike scenario, the WGA is assumed to go on strike for two months and the SAG does not strike. This scenario has the least severe impact on the Los Angeles and California economies because it does not end all movie and television production activity. Nevertheless, production activities are dramatically curtailed. The degree of curtailment was estimated based on an analysis of previous WGA strikes and their effects on employment in movie and television production. Without the presence of the writers, many movie and especially television production activities would be stalled.
12
Impact on Los Angeles economy
Under this scenario, employment in motion picture production and services in Los Angeles declines by 13,700 relative to the baseline during the second quarter of 2001 and 1,300 in the third quarter (see table).12 The loss of employment is relatively small because the studios keep most employees on payroll given the short tenure of the strike (two months). The strike has a small effect in the third quarter of 2001 as production activities take some time to rebound.
The reduction in movie and television production activity feeds into reduced work for supplier industries, such as advertising, accounting, and costume rental. As a result, business services employment falls by 9,500 in the second quarter of 2001 and 500 in the third quarter. Another significantly affected sector is transportation, public utilities and communication services (which includes limousine services and travel agents). In the second quarter, employment in this sector falls 9,400 below the baseline level. 12 These figures are on a full-time equivalent basis.
Los Angeles Quarter Quarter
2nd 3rd 4th Total 2nd 3rd 4th Establishment Employment (in thousands)
Total Non-Farm -47.3 -3.2 -2.6 -53.1 -1.1 -0.1 -0.1
Total Manufacturing 0.0 0.0 0.0 0.0 0.0 0.0 0.0
Construction -0.8 0.0 0.0 -0.9 -0.6 0.0 0.0Fin., Ins., and Real Estate -2.1 -0.1 -0.1 -2.3 -0.9 0.0 -0.1
Transportation, Public Util. And Communication -9.4 0.0 0.0 -9.4 -3.8 0.0 0.0Total Service -25.5 -1.9 -0.6 -28.0 -1.8 -0.1 0.0
Business Service -9.5 -0.5 -0.4 -10.3 -1.7 -0.1 -0.1
Motion Picture Production & Services -13.7 -1.3 -0.1 -15.1 -2.3 -0.2 0.0 Health Service -2.4 -0.1 -0.1 -2.6 -0.8 0.0 0.0
Total Trade -9.5 -1.2 -0.6 -11.3 -1.0 -0.1 -0.1
Unemployment Rate 1.3 0.3 0.3 2.0 25.2 6.7 6.4
Income and tax revenue (in millions of dollars)Total personal income -2518.2 -289.6 -117.5 -2925.3 -3.4 -0.4 -0.2Tax revenue loss -18.7 -2.1 -0.9 -21.7 -4.3 -0.5 -0.2
California Quarter Quarter
2nd 3rd 4th Total 2nd 3rd 4th
Establishment Employment (in thousands)
Total Non-Farm -55.4 -3.8 -3.0 -62.2 -0.4 0.0 0.0Total Manufacturing 0.0 0.0 0.0 0.0 0.0 0.0 0.0
Construction -1.0 0.0 0.0 -1.0 -0.1 0.0 0.0Fin., Ins., and Real Estate -2.5 -0.1 -0.1 -2.7 -0.3 0.0 0.0
Transportation, Public Util. And Communication -11.0 0.0 0.0 -11.0 -1.5 0.0 0.0
Total Service -29.9 -2.2 -0.6 -32.7 -0.6 0.0 0.0 Business Service -11.1 -0.6 -0.4 -12.1 -0.6 0.0 0.0
Motion Picture Production & Services -16.0 -1.5 -0.1 -17.6 -0.8 -0.1 0.0
Health Service -2.8 -0.1 -0.2 -3.0 -0.3 0.0 0.0Total Trade -11.1 -1.4 -0.7 -13.2 -0.3 0.0 0.0
Unemployment Rate 0.6 0.3 0.3 1.2 13.3 6.3 6.2
Income and tax revenue (in millions of dollars)
Total personal income -3497.5 -402.2 -163.2 -4062.9 -1.2 -0.1 -0.1
Tax revenue loss -206.4 -23.7 -9.6 -239.7 -1.4 -0.2 -0.1
(Net Change From Baseline)
(Net Change From Baseline)
Short Strike Scenario on California and Los Angeles Metropolitan Economy
For Year 2001
(Percent Change From Baseline)
(Percent Change From Baseline)
13
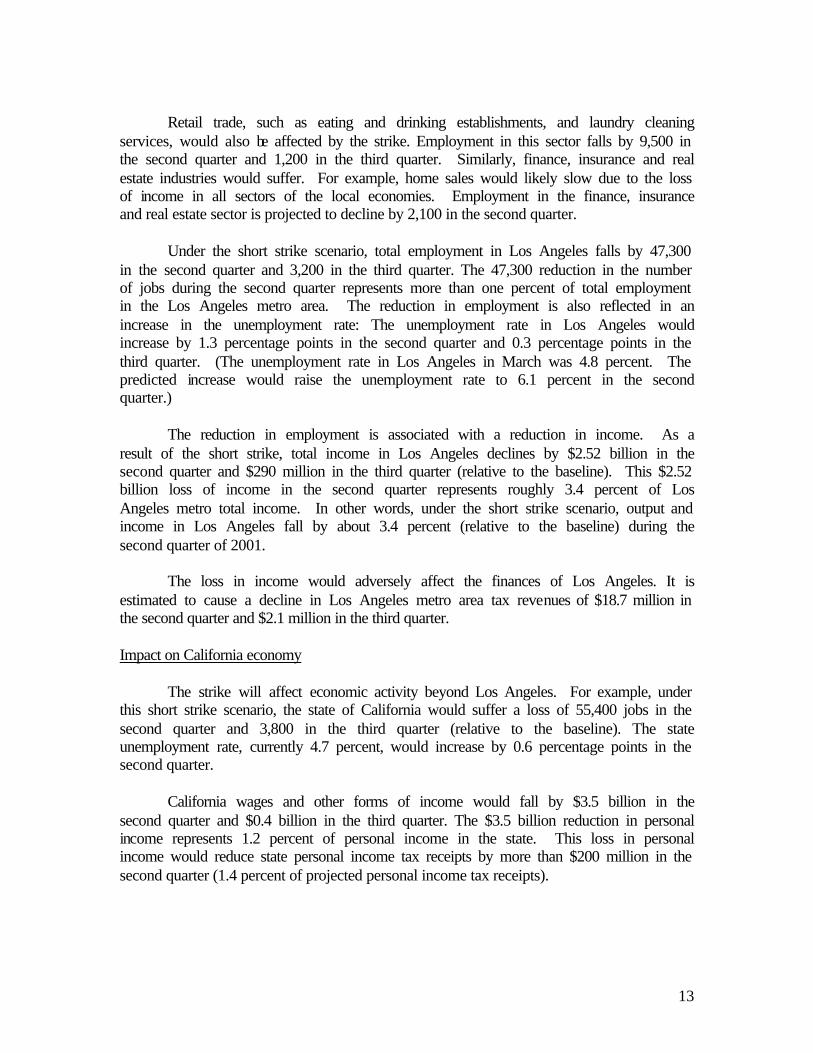
Retail trade, such as eating and drinking establishments, and laundry cleaning
services, would also be affected by the strike. Employment in this sector falls by 9,500 in the second quarter and 1,200 in the third quarter. Similarly, finance, insurance and real estate industries would suffer. For example, home sales would likely slow due to the loss of income in all sectors of the local economies. Employment in the finance, insurance and real estate sector is projected to decline by 2,100 in the second quarter.
Under the short strike scenario, total employment in Los Angeles falls by 47,300 in the second quarter and 3,200 in the third quarter. The 47,300 reduction in the number of jobs during the second quarter represents more than one percent of total employment in the Los Angeles metro area. The reduction in employment is also reflected in an increase in the unemployment rate: The unemployment rate in Los Angeles would increase by 1.3 percentage points in the second quarter and 0.3 percentage points in the third quarter. (The unemployment rate in Los Angeles in March was 4.8 percent. The predicted increase would raise the unemployment rate to 6.1 percent in the second quarter.)
The reduction in employment is associated with a reduction in income. As a result of the short strike, total income in Los Angeles declines by $2.52 billion in the second quarter and $290 million in the third quarter (relative to the baseline). This $2.52 billion loss of income in the second quarter represents roughly 3.4 percent of Los Angeles metro total income. In other words, under the short strike scenario, output and income in Los Angeles fall by about 3.4 percent (relative to the baseline) during the second quarter of 2001.
The loss in income would adversely affect the finances of Los Angeles. It is
estimated to cause a decline in Los Angeles metro area tax revenues of $18.7 million in the second quarter and $2.1 million in the third quarter. Impact on California economy
The strike will affect economic activity beyond Los Angeles. For example, under this short strike scenario, the state of California would suffer a loss of 55,400 jobs in the second quarter and 3,800 in the third quarter (relative to the baseline). The state unemployment rate, currently 4.7 percent, would increase by 0.6 percentage points in the second quarter.
California wages and other forms of income would fall by $3.5 billion in the
second quarter and $0.4 billion in the third quarter. The $3.5 billion reduction in personal income represents 1.2 percent of personal income in the state. This loss in personal income would reduce state personal income tax receipts by more than $200 million in the second quarter (1.4 percent of projected personal income tax receipts).
14
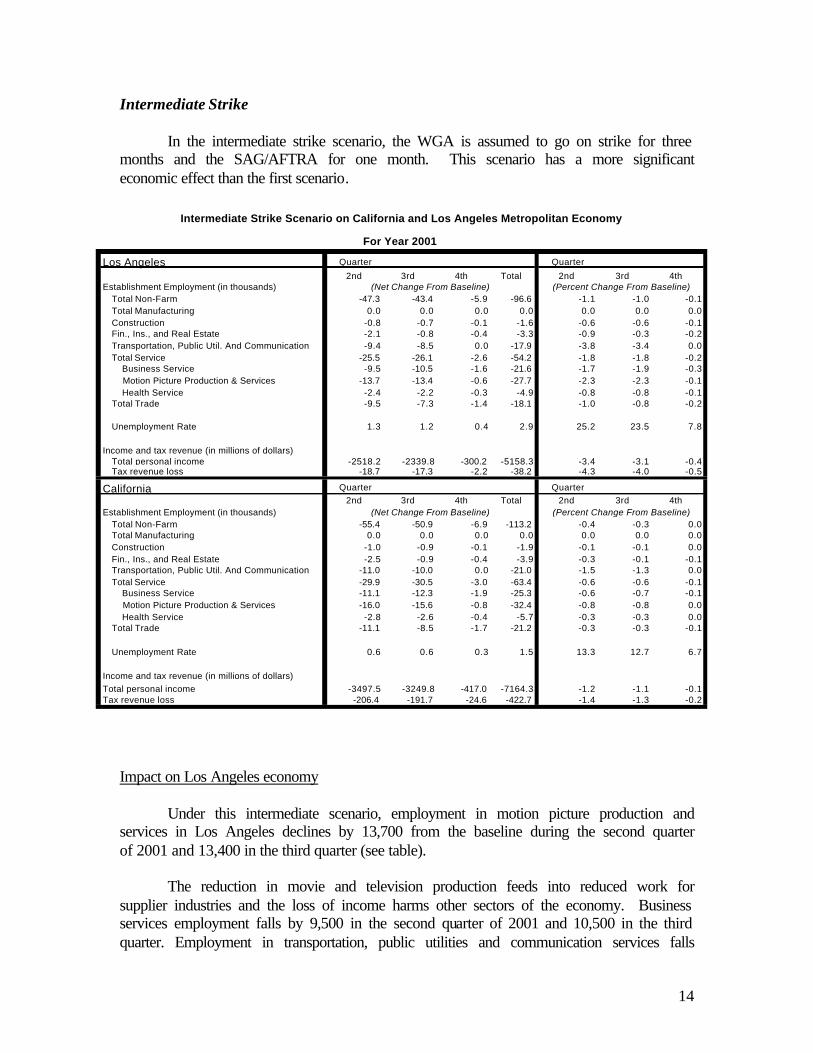
Intermediate Strike
In the intermediate strike scenario, the WGA is assumed to go on strike for three months and the SAG/AFTRA for one month. This scenario has a more significant economic effect than the first scenario.
Impact on Los Angeles economy Under this intermediate scenario, employment in motion picture production and
services in Los Angeles declines by 13,700 from the baseline during the second quarter of 2001 and 13,400 in the third quarter (see table).
The reduction in movie and television production feeds into reduced work for supplier industries and the loss of income harms other sectors of the economy. Business services employment falls by 9,500 in the second quarter of 2001 and 10,500 in the third quarter. Employment in transportation, public utilities and communication services falls
Los Angeles Quarter Quarter
2nd 3rd 4th Total 2nd 3rd 4th Establishment Employment (in thousands)
Total Non-Farm -47.3 -43.4 -5.9 -96.6 -1.1 -1.0 -0.1
Total Manufacturing 0.0 0.0 0.0 0.0 0.0 0.0 0.0
Construction -0.8 -0.7 -0.1 -1.6 -0.6 -0.6 -0.1Fin., Ins., and Real Estate -2.1 -0.8 -0.4 -3.3 -0.9 -0.3 -0.2
Transportation, Public Util. And Communication -9.4 -8.5 0.0 -17.9 -3.8 -3.4 0.0
Total Service -25.5 -26.1 -2.6 -54.2 -1.8 -1.8 -0.2 Business Service -9.5 -10.5 -1.6 -21.6 -1.7 -1.9 -0.3
Motion Picture Production & Services -13.7 -13.4 -0.6 -27.7 -2.3 -2.3 -0.1
Health Service -2.4 -2.2 -0.3 -4.9 -0.8 -0.8 -0.1Total Trade -9.5 -7.3 -1.4 -18.1 -1.0 -0.8 -0.2
Unemployment Rate 1.3 1.2 0.4 2.9 25.2 23.5 7.8
Income and tax revenue (in millions of dollars)Total personal income -2518.2 -2339.8 -300.2 -5158.3 -3.4 -3.1 -0.4Tax revenue loss -18.7 -17.3 -2.2 -38.2 -4.3 -4.0 -0.5
California Quarter Quarter
2nd 3rd 4th Total 2nd 3rd 4th
Establishment Employment (in thousands)
Total Non-Farm -55.4 -50.9 -6.9 -113.2 -0.4 -0.3 0.0Total Manufacturing 0.0 0.0 0.0 0.0 0.0 0.0 0.0
Construction -1.0 -0.9 -0.1 -1.9 -0.1 -0.1 0.0
Fin., Ins., and Real Estate -2.5 -0.9 -0.4 -3.9 -0.3 -0.1 -0.1Transportation, Public Util. And Communication -11.0 -10.0 0.0 -21.0 -1.5 -1.3 0.0
Total Service -29.9 -30.5 -3.0 -63.4 -0.6 -0.6 -0.1 Business Service -11.1 -12.3 -1.9 -25.3 -0.6 -0.7 -0.1
Motion Picture Production & Services -16.0 -15.6 -0.8 -32.4 -0.8 -0.8 0.0
Health Service -2.8 -2.6 -0.4 -5.7 -0.3 -0.3 0.0Total Trade -11.1 -8.5 -1.7 -21.2 -0.3 -0.3 -0.1
Unemployment Rate 0.6 0.6 0.3 1.5 13.3 12.7 6.7
Income and tax revenue (in millions of dollars)
Total personal income -3497.5 -3249.8 -417.0 -7164.3 -1.2 -1.1 -0.1Tax revenue loss -206.4 -191.7 -24.6 -422.7 -1.4 -1.3 -0.2
(Net Change From Baseline)
(Net Change From Baseline)
Intermediate Strike Scenario on California and Los Angeles Metropolitan Economy
For Year 2001
(Percent Change From Baseline)
(Percent Change From Baseline)
15
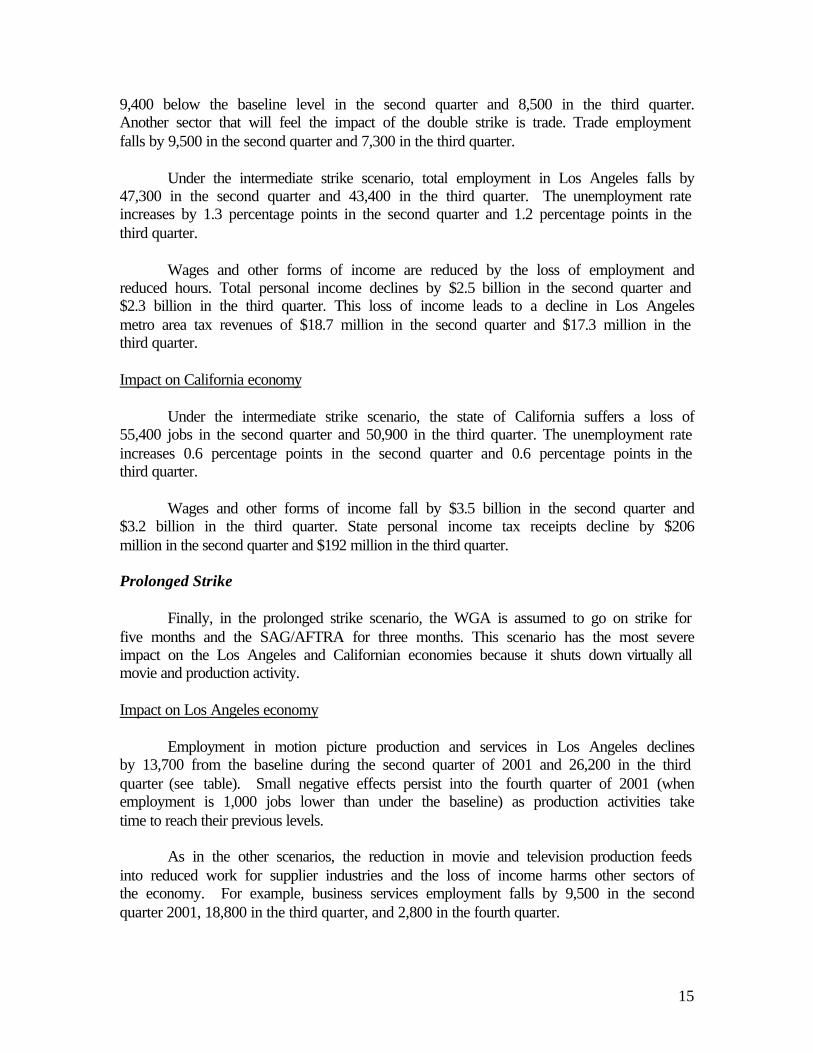
9,400 below the baseline level in the second quarter and 8,500 in the third quarter. Another sector that will feel the impact of the double strike is trade. Trade employment falls by 9,500 in the second quarter and 7,300 in the third quarter.
Under the intermediate strike scenario, total employment in Los Angeles falls by 47,300 in the second quarter and 43,400 in the third quarter. The unemployment rate increases by 1.3 percentage points in the second quarter and 1.2 percentage points in the third quarter.
Wages and other forms of income are reduced by the loss of employment and reduced hours. Total personal income declines by $2.5 billion in the second quarter and $2.3 billion in the third quarter. This loss of income leads to a decline in Los Angeles metro area tax revenues of $18.7 million in the second quarter and $17.3 million in the third quarter. Impact on California economy
Under the intermediate strike scenario, the state of California suffers a loss of 55,400 jobs in the second quarter and 50,900 in the third quarter. The unemployment rate increases 0.6 percentage points in the second quarter and 0.6 percentage points in the third quarter.
Wages and other forms of income fall by $3.5 billion in the second quarter and $3.2 billion in the third quarter. State personal income tax receipts decline by $206 million in the second quarter and $192 million in the third quarter. Prolonged Strike
Finally, in the prolonged strike scenario, the WGA is assumed to go on strike for five months and the SAG/AFTRA for three months. This scenario has the most severe impact on the Los Angeles and Californian economies because it shuts down virtually all movie and production activity.
Impact on Los Angeles economy
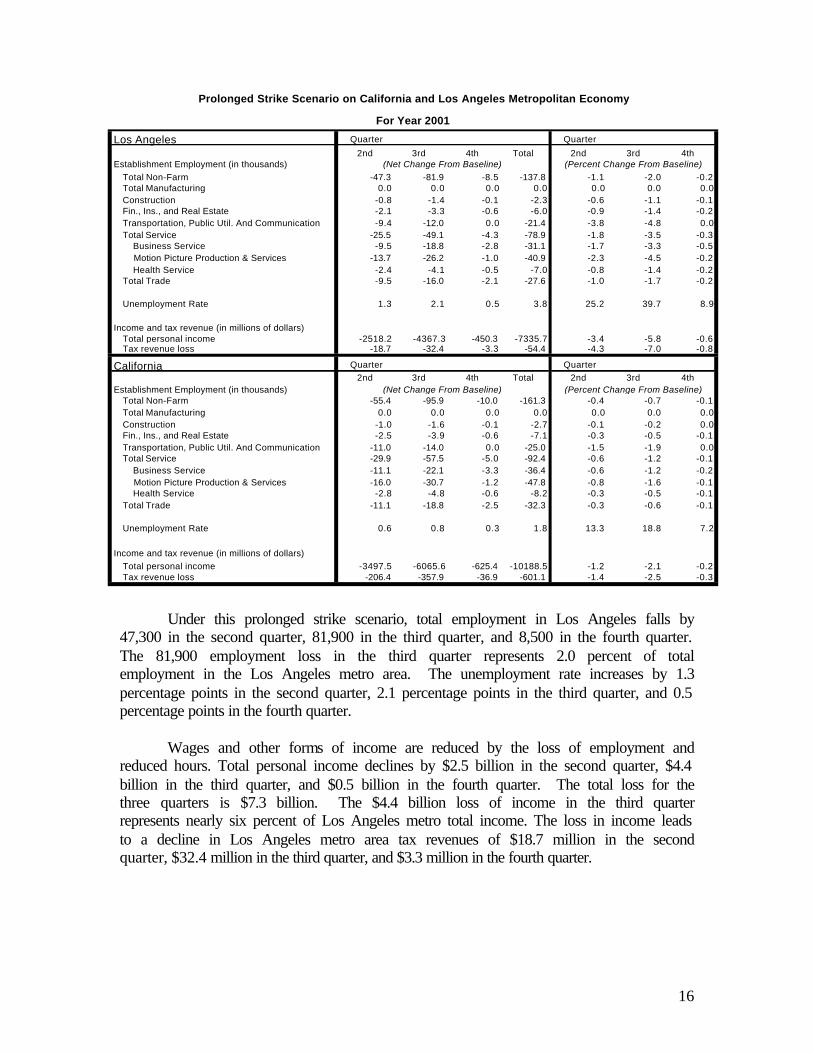
Employment in motion picture production and services in Los Angeles declines by 13,700 from the baseline during the second quarter of 2001 and 26,200 in the third quarter (see table). Small negative effects persist into the fourth quarter of 2001 (when employment is 1,000 jobs lower than under the baseline) as production activities take time to reach their previous levels.
As in the other scenarios, the reduction in movie and television production feeds
into reduced work for supplier industries and the loss of income harms other sectors of the economy. For example, business services employment falls by 9,500 in the second quarter 2001, 18,800 in the third quarter, and 2,800 in the fourth quarter.
16
Under this prolonged strike scenario, total employment in Los Angeles falls by 47,300 in the second quarter, 81,900 in the third quarter, and 8,500 in the fourth quarter. The 81,900 employment loss in the third quarter represents 2.0 percent of total employment in the Los Angeles metro area. The unemployment rate increases by 1.3 percentage points in the second quarter, 2.1 percentage points in the third quarter, and 0.5 percentage points in the fourth quarter.
Wages and other forms of income are reduced by the loss of employment and reduced hours. Total personal income declines by $2.5 billion in the second quarter, $4.4 billion in the third quarter, and $0.5 billion in the fourth quarter. The total loss for the three quarters is $7.3 billion. The $4.4 billion loss of income in the third quarter represents nearly six percent of Los Angeles metro total income. The loss in income leads to a decline in Los Angeles metro area tax revenues of $18.7 million in the second quarter, $32.4 million in the third quarter, and $3.3 million in the fourth quarter.
Los Angeles Quarter Quarter
2nd 3rd 4th Total 2nd 3rd 4th Establishment Employment (in thousands)
Total Non-Farm -47.3 -81.9 -8.5 -137.8 -1.1 -2.0 -0.2Total Manufacturing 0.0 0.0 0.0 0.0 0.0 0.0 0.0
Construction -0.8 -1.4 -0.1 -2.3 -0.6 -1.1 -0.1Fin., Ins., and Real Estate -2.1 -3.3 -0.6 -6.0 -0.9 -1.4 -0.2
Transportation, Public Util. And Communication -9.4 -12.0 0.0 -21.4 -3.8 -4.8 0.0
Total Service -25.5 -49.1 -4.3 -78.9 -1.8 -3.5 -0.3 Business Service -9.5 -18.8 -2.8 -31.1 -1.7 -3.3 -0.5
Motion Picture Production & Services -13.7 -26.2 -1.0 -40.9 -2.3 -4.5 -0.2
Health Service -2.4 -4.1 -0.5 -7.0 -0.8 -1.4 -0.2Total Trade -9.5 -16.0 -2.1 -27.6 -1.0 -1.7 -0.2
Unemployment Rate 1.3 2.1 0.5 3.8 25.2 39.7 8.9
Income and tax revenue (in millions of dollars)Total personal income -2518.2 -4367.3 -450.3 -7335.7 -3.4 -5.8 -0.6Tax revenue loss -18.7 -32.4 -3.3 -54.4 -4.3 -7.0 -0.8
California Quarter Quarter
2nd 3rd 4th Total 2nd 3rd 4th
Establishment Employment (in thousands)Total Non-Farm -55.4 -95.9 -10.0 -161.3 -0.4 -0.7 -0.1
Total Manufacturing 0.0 0.0 0.0 0.0 0.0 0.0 0.0
Construction -1.0 -1.6 -0.1 -2.7 -0.1 -0.2 0.0Fin., Ins., and Real Estate -2.5 -3.9 -0.6 -7.1 -0.3 -0.5 -0.1
Transportation, Public Util. And Communication -11.0 -14.0 0.0 -25.0 -1.5 -1.9 0.0Total Service -29.9 -57.5 -5.0 -92.4 -0.6 -1.2 -0.1
Business Service -11.1 -22.1 -3.3 -36.4 -0.6 -1.2 -0.2
Motion Picture Production & Services -16.0 -30.7 -1.2 -47.8 -0.8 -1.6 -0.1 Health Service -2.8 -4.8 -0.6 -8.2 -0.3 -0.5 -0.1
Total Trade -11.1 -18.8 -2.5 -32.3 -0.3 -0.6 -0.1
Unemployment Rate 0.6 0.8 0.3 1.8 13.3 18.8 7.2
Income and tax revenue (in millions of dollars)
Total personal income -3497.5 -6065.6 -625.4 -10188.5 -1.2 -2.1 -0.2Tax revenue loss -206.4 -357.9 -36.9 -601.1 -1.4 -2.5 -0.3
(Net Change From Baseline)
(Net Change From Baseline)
Prolonged Strike Scenario on California and Los Angeles Metropolitan Economy
For Year 2001
(Percent Change From Baseline)
(Percent Change From Baseline)

17
Impact on California economy
Under the prolonged strike scenario, the state suffers a loss of 55,400 jobs in the second quarter, 95,900 in the third quarter, and 10,000 in the fourth quarter. The unemployment rate increases 0.6 percentage points in the second quarter and 0.8 percentage points in the third quarter.
Wages and other forms of income fall by $3.5 billion in the second quarter, $6.1 billion in the third quarter, and $0.6 billion in the fourth quarter. The $6.1 billion reduction in personal income in the third quarter represents 2.1 percent of personal income in the state. State personal income tax receipts decline by $206 million in the second quarter and $358 million in the third quarter. Impact on People
The figures delineated above may seem removed from the daily experiences of people who work in the entertainment industry. This section therefore briefly explores the impact a strike could have on the people who work and live in Los Angeles.
Will Blount is a prop master and union member. In preparation for a potential
strike, he’s already tightening his belt. A fifteen-year industry veteran, Blount has used his career as a prop-man to build a good living for his wife Sharon and their three children. But seeing the struggles of other people in the union during last year’s commercial strike has given him pause. He is now holding back on new purchases for his home in North Hollywood, and has taken out an equity line of credit, just in case. “If you are a working class person, even if you save, you know a strike is going to make it tough,” he notes. “A lot of people lost their homes in the commercial strike.” Blount explains, “If it went eight months I’d lose a lot of what I’ve made the last few years. Even if I would survive it, it would leave me upside down for years.”
This worry ripples through the Los Angeles economy. In places like the Valley,
where many members of the International Alliance of Theatrical Stage Employees (IATSE) live, the effects could be profound. Housing prices in this suburban tree-lined section of the Valley have been rising steadily, but many of the area’s residents work in the entertainment industry and are vulnerable to the impact of a strike. Homeowners in this area are artisans, writers, voice coaches, and people in scores of other entertainment-industry-related professions. Those employed in ancillary industries connected to entertainment in Los Angeles, such as construction, dry cleaning, accounting, and law, will also experience a human toll.
Veteran camerman Jeff Norvet, like so many in Hollywood, is enjoying a “speedup” in his work over the past few months as movie production accelerates in anticipation of the strikes. Although he is now earning significantly higher income, his consumer behavior betrays a deep apprehension about the future.
18
When the actors struck in 1980, Norvet recalls, his situation was different. He was single and could live on unemployment insurance. “I could take the hit then,” he explains. Now with a wife and two children, he is concerned about making ends meet in the longer run. “I am being incredibly cautious now,” Norvet explains. “I just sold my house in Agoura and moved into a smaller one. I am keeping the money from the sale of the house as a backup for the next year.”
Such decisions could impair the real estate-dependent economy in Los Angeles. Properties – particularly in the Hollywood Hills – have suddenly seen their value soften. “There’s been a slowdown already,” reports Rochelle Tetrault, who has been selling real estate in the hills and adjacent areas for a quarter century. “People are lowering prices.” Tetrault, who works for DBL Realtors, says properties in areas like West Hollywood, recently marketing for as much as $500 a square foot, are, in the current market, probably worth no more than $300. “People who are looking for ‘gouge me’ prices are going to be disappointed,” she suggests. Conclusions
The results above suggest that a strike in the entertainment industry could reduce employment in Los Angeles by as many as 81,900 jobs in the third quarter of 2001, and reduce output by $4.4 billion in that quarter. The majority of the lost jobs would occur in industries outside of those directly represented at the negotiating table. As a result of the strike, Los Angeles would lose as much as $54.4 million in tax revenue. To put the results into context:
• The $4.4 billion reduction in third-quarter income is equivalent to the output from every casino and hotel in Las Vegas for more than half a year, and only slightly less than the value of automobile production in Detroit in one quarter.
• At an annual rate, the $4.4 billion reduction in third-quarter income is approximately three times the size of The Bahamas’ economy, twice the size of the Icelandic economy, and roughly equal to the size of the Jordanian economy.
• Under the prolonged strike scenario, the Los Angeles unemployment rate rises by 2.1 percentage points; if the national unemployment rate were to rise by 2.1 percentage points, 3 million additional people would be out of work.
• In the first six months of the early 1990s recession, the unemployment rate in Los Angeles did not rise as rapidly as it would during a prolonged strike.
Jeff Norvet, Veteran Cameraman “I am being incredibly cautious now…I
just sold my house in Agoura and moved into a smaller one. I am keeping the money from sales of the house as a
backup for the next year.”
19
• Under the prolonged strike, 81,900 jobs would be lost in the third quarter – that is equivalent to laying off every ticket holder at four consecutive sold-out Lakers games.
• During a prolonged strike, the Los Angeles metropolitan area would lose $54 million in tax revenue. In the third quarter alone, the Los Angeles area would suffer a 7.0 percent drop in tax revenue (relative to the baseline). For comparison, a 7.0 percent drop in Federal tax revenue for one quarter would total $35 billion.
Several points are worth noting.
First, as emphasized above, this analysis does not examine the merits of either party’s position in the negotiations. The analysis should therefore not be interpreted as assigning responsibility for the economic costs outlined here to either party. Rather, it merely highlights the significant costs – including to others – if the parties are unable to reach agreement.
Second, the economic costs to Los Angeles from the potential strike are higher than they would be in a stronger macroeconomic environment. The national economy is experiencing a period of sluggish economic growth, and the local economy is similarly likely to experience some moderation in growth. In this environment, it is unlikely that demand from other industries would be sufficient in the short run to replace the lost output in, and demand for products and services from, the film and television industries.
Third, the estimates do not reflect
the full costs imposed outside Los Angeles, including on movie theaters, television advertisers, and the general population.13 It is possible that instead of watching television re-runs or substitute programming that is likely to be less entertaining than what would have been produced in the absence of a strike,
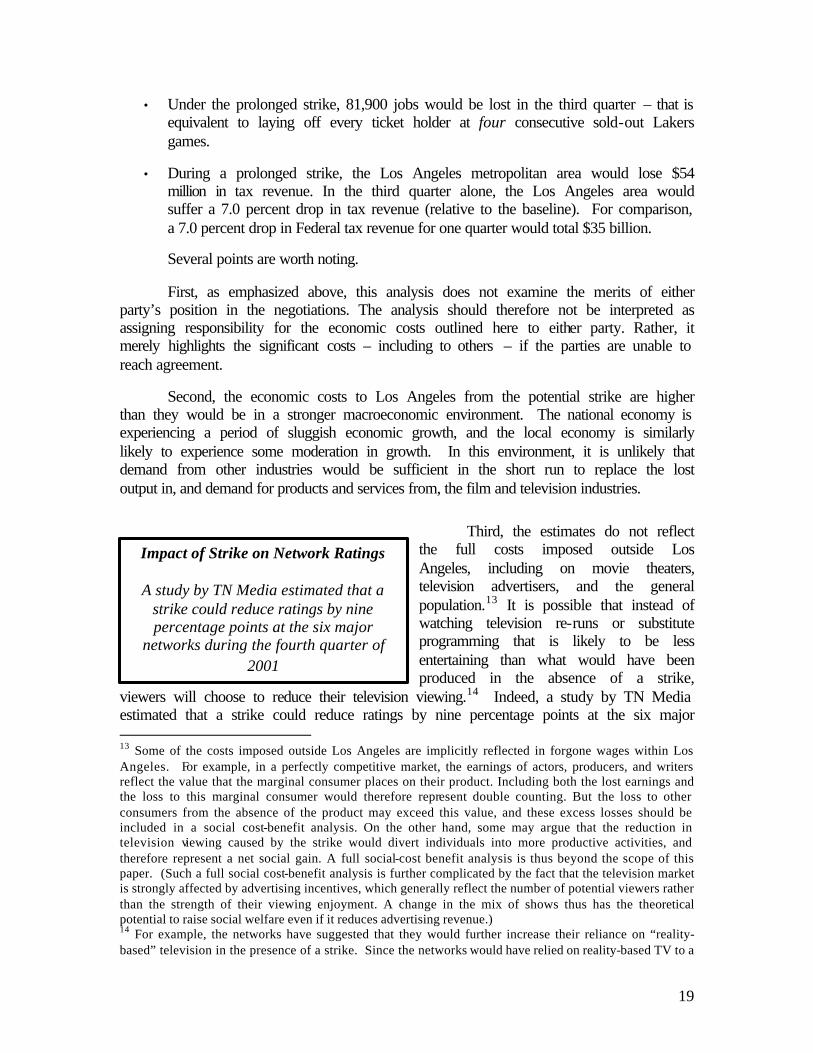
viewers will choose to reduce their television viewing.14 Indeed, a study by TN Media estimated that a strike could reduce ratings by nine percentage points at the six major 13 Some of the costs imposed outside Los Angeles are implicitly reflected in forgone wages within Los Angeles. For example, in a perfectly competitive market, the earnings of actors, producers, and writers reflect the value that the marginal consumer places on their product. Including both the lost earnings and the loss to this marginal consumer would therefore represent double counting. But the loss to other consumers from the absence of the product may exceed this value, and these excess losses should be included in a social cost-benefit analysis. On the other hand, some may argue that the reduction in television viewing caused by the strike would divert individuals into more productive activities, and therefore represent a net social gain. A full social-cost benefit analysis is thus beyond the scope of this paper. (Such a full social cost-benefit analysis is further complicated by the fact that the television market is strongly affected by advertising incentives, which generally reflect the number of potential viewers rather than the strength of their viewing enjoyment. A change in the mix of shows thus has the theoretical potential to raise social welfare even if it reduces advertising revenue.) 14 For example, the networks have suggested that they would further increase their reliance on “reality-based” television in the presence of a strike. Since the networks would have relied on reality-based TV to a
Impact of Strike on Network Ratings
A study by TN Media estimated that a strike could reduce ratings by nine percentage points at the six major
networks during the fourth quarter of 2001

20
networks during the fourth quarter of 2001.15 The result is reduced viewing on the part of households (who would have preferred to watch new television programs to their alternative activity), and a related reduction in advertising revenue. Fourth, some observers might claim that a strike would merely cause production to shift backward or forward in time. In other words, examining only the period of the strike may be misleading, since reduced output during the strike period may be offset by increased output before or after the strike. There is indeed some evidence that production has been accelerated in advance of the strike.16 For example, data from The Hollywood Reporter suggest that 111 movies were in production the week including April 10, 2001, compared to 82 movies during the same week in 2000 and 87 movies during the same week in 1999.17 This evidence underscores the industry’s ability to undertake such inter-temporal shifting to some degree. It is unclear, however, how much flexibility exists and therefore how much of the lost output will be replaced. Television production is traditionally more resistant to shifting across time than film production. For instance, daily shows, such as late-night comedy, would have substantial difficulty in accelerating or delaying production.
Furthermore, even if a significant percentage of the output lost during a strike were replaced before or after the strike, the overall loss would still be significant. For example, if increased output before or after the strike makes up for half of the forgone output during the strike itself, the lost output would still amount to more than $3.5 billion under the prolonged strike scenario. In addition, and perhaps more importantly, many independent contractors and individual workers will have difficulty weathering the storm during the strike itself. Some small businesses will be unable to pay their bills, and many workers who live pay-check to pay-check will face substantial hardship. Fifth, for a variety of reasons, estimates of the impact of the potential strikes may vary somewhat from study to study. For example, the Los Angeles Economic
lesser degree in the absence of a strike, the strike would change the mix of television production away from what the networks had anticipated to be most consistent with consumer demands. Given this shift, even those who continue to watch may experience a loss: They may not enjoy the experience as much as they would have given the non-strike programming, even if they enjoyed it sufficiently to justify continued viewing. 15 Steven Sternberg and Stacey Lynn Koerner, “Primetime Program Development,” TN Media Research Report, April 2001. 16 One actress stated that “The way I see it and hear it, whether or not a strike happens, there won’t be a lot of work coming up because we’re doing so much work now to get it all in before the strike.” See Sharon Waxman, “Hollywood Gears Up for Strike Shutdown; Actors and Writers May Walk Out,” The Washington Post, March 24, 2001, page A1. 17 For comparison, during the week including January 16th, there were 75 movies in production in 2001, 70 movies in production in 2000, and 74 movies in production in 1999. Data are from The Hollywood Reporter, April 10, 2001 and The Hollywood Reporter, January 16, 2001.
Evidence of Accelerated Film Production Before The Strike
• 2001: 111 movies were in production the week including April 10th
• 2000: 82 movies were in production the week including April 10th
• 1999: 87 movies were in production the week including April 10th

21
Development Corporation (LAEDC) has estimated that the potential strikes could cost the city as much as $520 million in lost economic output per week. The LAEDC results are slightly higher than our estimates, even under the prolonged strike scenario. The difference is likely attributable to assumptions regarding the impact of the potential strike on production within the movie and television industry, in addition to the “ripple” effects from such changes.
Finally, this study has not examined the impact of the strike on either the long-term welfare of the parties involved or on the viability of Los Angeles as the capital of the entertainment industry. New forces in the information industry, such as digitization and the Internet, are creating pressures on traditional Hollywood industries, from music to special effects. For related reasons, the position of Los Angeles is under attack by “runaway film production” (that is, production in Canada, Australia and other locations).
Given these challenges, the unique advantage of Southern California is its concentration of skills, resources and support services for the global entertainment industry. Southern California can provide what no other region is capable of –comprehensive service for the entire industry clustered in one place. A strike, particularly a long one, may weaken this unique supply chain. The historical evidence suggests that previous strikes may have contributed to the shift in production to other venues and the move to intensify development of other media, including digital technology. In particular, a strike potentially sends a message that Los Angeles has poor labor-management relations. A protracted strike thus may affect the long-term attractiveness of making films (and doing business) in Los Angeles relative to elsewhere.
On the other hand, the incentives provided to the writers, actors and producers,
which are at the heart of these contract negotiations, may affect the industry’s long-term future. This paper has highlighted the costs of a strike in the industry. If a fair and efficient contract can be negotiated without such a costly strike, both parties to the negotiation – as well as many workers and businesses not represented at the negotiating table – might be better off.

22
Appendix I: Background on the Los
Angeles Economy
Los Angeles Economy
0098969492908886848280
6
4
2
0
-2
-4
-6
Percent Change, Year Ago
Sources: Milken Institute; RFA
Employment Growth1980-2000
Los Angeles
Cali fornia
United States
0098969492908886848280
15
10
5
0
-5
Percent Change, Year Ago
Sources: Milken Institute; RFA
Output Growth1980-2000
Los Angeles
Cali fornia
United States
CharlotteWash. D.C.
HoustonLas Vegas
SeattleDetroit
New YorkSan Jose
Los Angeles
30
25
20
15
10
5
0
Percent
Sources: Milken Institute; RFA
Movie & TV Production - The Biggest ClusterMetro Industry Output Percent of U.S. Industry Output
Movie & TV ProductionComputers & Semiconductors
Financial ServicesMotor Vehicles
Aerospace
Casinos & HotelsEnergy
Computer & Data Processing
Banks
0100999897969594939291908988
160
140
120
100
80
60
40
20
Thousands
Source: WEFA
Motion Pictures Dwarfs AerospaceLos Angeles Employment
Aerospace
Motion Pictures
SIC Industry US$ Billions
1. 781* Motion Picture Production & Services 12.632. 581 Eating & Drinking Places 8.783. 653 Real Estate Agents & Managers 8.764. 483 Radio & Television Broadcasting 8.635. 811 Legal Services 8.506. 737 Computer & Data Processing Services 8.487. 481 Telephone Communications 6.908. 806 Hospitals 6.599. 801 Offices & Clinics of Medical Doctors 6.3810. 736 Personnel Supply Services 5.83* Does not include all motion picture and television production activity.
Source: Milken Institute; RFA
Largest Industries - Los AngelesIn Terms of Output, 2000
SIC Industry Thousands1. 581 Eating & Drinking Places 240.832. 781* Motion Picture Production & Services 134.82
3. 736 Personnel Supply Services 115.644. 738 Miscellaneous Business Services 107.955. 806 Hospitals 87.96
6. 233 Women's & Misses' Outerwear 72.127. 801 Offices & Clinics of Medical Doctors 65.518. 541 Grocery Stores 61.69
9. 737 Computer & Data Processing Services 57.9810. 531 Department Stores 53.98* Does not include all motion picture and television production activity.
Source: Milken Institute; RFA
Largest Industries - Los AngelesIn Terms of Employment, 2000
Los Angeles Economy
0098969492908886848280
11
10
9
8
7
6
5
4
3
Percent
Source: WEFA
Unemployment Rate1980-2001
Los Angeles
Cali fornia
United States
20001999199819971996199519941993199219911990
10
8
6
4
2
0
Percent Change, Year Ago
Sources: California State Controller; WEFA
Income - Los AngelesPersonal Income Growth
199919981997199619951994199319921991
140
120
100
80
60
40
US$ Billions
Source: California Department of Finance
International Trade - Los AngelesImports vs. Exports
Imports
Exports
200019991998199719961995
20
18
16
14
12
10
Percent
Source: CB Richard Ellis
Office Vacancy Rates - Los Angeles1995-2000
20001999199819971996199519941993199219911990
100
90
80
70
60
50
40
Thousands
Sources: National Association of Realtors; RFA
Existing Home Sales - Los AngelesSingle-Family Homes
20001999199819971996199519941993
20
18
16
14
12
10
8
6
4
Thousands
Source: WEFA
Housing Starts - Los Angeles1993-2000
Movie & Television Location Quotients
0098969492908886848280
8
7
6
5
4
3
Location Quotient
Sources: Milken Institute; RFA
Movie & Television Production - Los AngelesRelative Concentration to U.S.
Employment
Output
0098969492908886848280
20
18
16
14
12
10
Location Quotient
Sources: Milken Institute; RFA
Motion Picture Production - Los AngelesRelative Concentration to U.S.
Employment
Output
0098969492908886848280
16
14
12
10
8
6
4
2
Location Quotient
Sources: Milken Institute; RFA
Motion Picture Distribution - Los AngelesRelative Concentration to U.S.
Employment
Output
0098969492908886848280
6
5
4
3
2
1
0
Location Quotient
Sources: Milken Institute; RFA
Radio & TV Broadcasting - Los AngelesRelative Concentration to U.S.
Employment
Output
0098969492908886848280
4.5
4.0
3.5
3.0
2.5
2.0
1.5
1.0
0.5
Location Quotient
Sources: Milken Institute; RFA
Cable & Pay TV - Los AngelesRelative Concentration to U.S.
Employment
Output
0098969492908886848280
9
8
7
6
5
4
3
2
1
Location Quotient
Sources: Milken Institute; RFA
Theatrical Producers & Entertainers - Los AngelesRelative Concentration to U.S.
Employment
Output
Movie & Television Production: Percent of Metro Output
0098969492908886848280
7
6
5
4
3
2
1
Percent
Sources: Milken Institute; RFA
Movie & Television Production - Los AngelesPercent of Total Metro Employment & Output
Employment
Output
0098969492908886848280
4.0
3.5
3.0
2.5
2.0
1.5
1.0
Percent
Sources: Milken Institute; RFA
Motion Picture Production - Los AngelesPercent of Total Metro Employment & Output
Employment
Output
0098969492908886848280
0.6
0.5
0.4
0.3
0.2
0.1
0.0
Percent
Sources: Milken Institute; RFA
Motion Picture Distribution - Los AngelesPercent of Total Metro Employment & Output
Employment
Output
0098969492908886848280
2.0
1.5
1.0
0.5
0.0
Percent
Sources: Milken Institute; RFA
Radio & TV Broadcasting - Los AngelesPercent of Total Metro Employment & Output
Employment
Output
0098969492908886848280
0.6
0.5
0.4
0.3
0.2
0.1
0.0
Percent
Sources: Milken Institute; RFA
Cable & Pay TV - Los AngelesPercent of Total Metro Employment & Output
Employment
Output
0098969492908886848280
1.2
1.0
0.8
0.6
0.4
0.2
Percent
Sources: Milken Institute; RFA
Theatrical Producers & Entertainers - Los AngelesPercent of Total Metro Employment & Output
Employment
Output
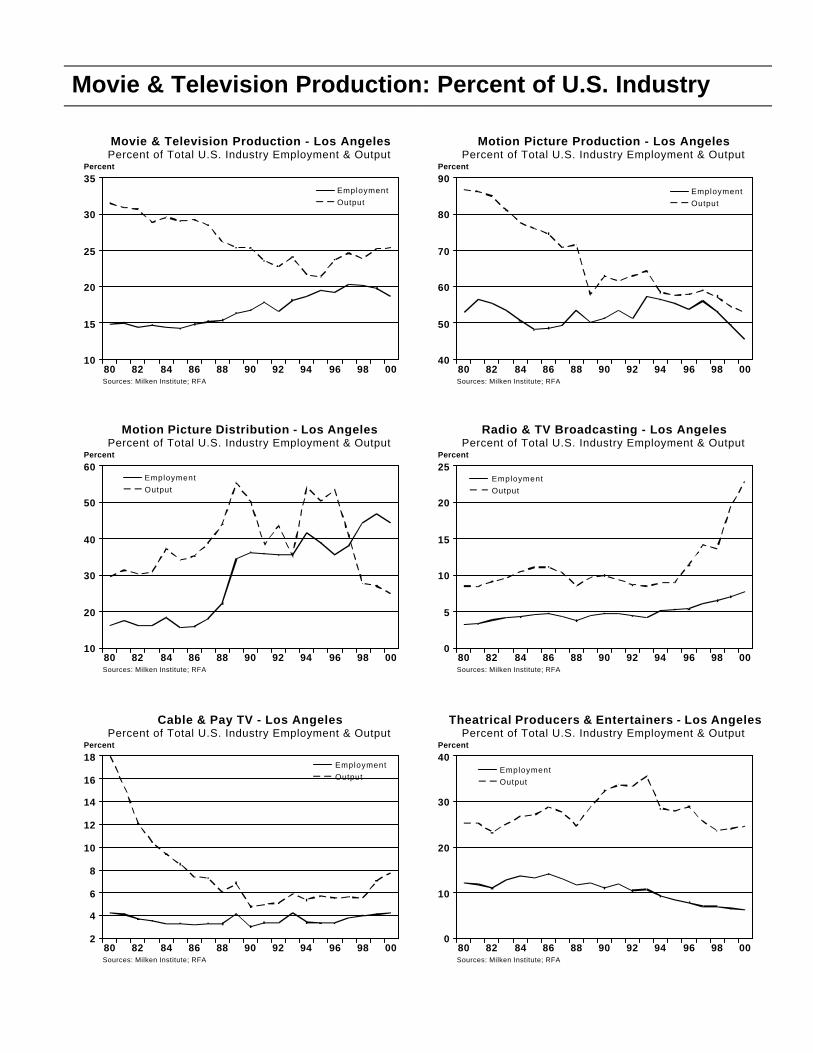
Movie & Television Production: Percent of U.S. Industry
0098969492908886848280
35
30
25
20
15
10
Percent
Sources: Milken Institute; RFA
Movie & Television Production - Los AngelesPercent of Total U.S. Industry Employment & Output
Employment
Output
0098969492908886848280
90
80
70
60
50
40
Percent
Sources: Milken Institute; RFA
Motion Picture Production - Los AngelesPercent of Total U.S. Industry Employment & Output
Employment
Output
0098969492908886848280
60
50
40
30
20
10
Percent
Sources: Milken Institute; RFA
Motion Picture Distribution - Los AngelesPercent of Total U.S. Industry Employment & Output
Employment
Output
0098969492908886848280
25
20
15
10
5
0
Percent
Sources: Milken Institute; RFA
Radio & TV Broadcasting - Los AngelesPercent of Total U.S. Industry Employment & Output
Employment
Output
0098969492908886848280
18
16
14
12
10
8
6
4
2
Percent
Sources: Milken Institute; RFA
Cable & Pay TV - Los AngelesPercent of Total U.S. Industry Employment & Output
Employment
Output
0098969492908886848280
40
30
20
10
0
Percent
Sources: Milken Institute; RFA
Theatrical Producers & Entertainers - Los AngelesPercent of Total U.S. Industry Employment & Output
Employment
Output
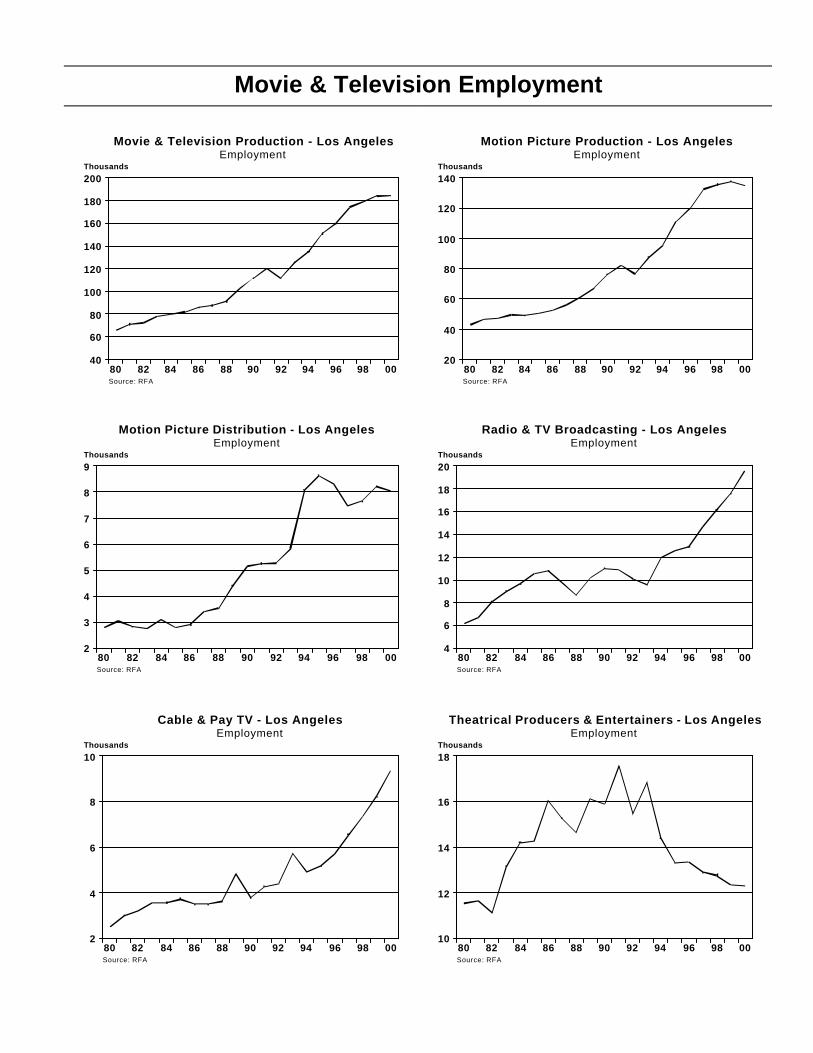
Movie & Television Employment
0098969492908886848280
200
180
160
140
120
100
80
60
40
Thousands
Source: RFA
Movie & Television Production - Los AngelesEmployment
0098969492908886848280
140
120
100
80
60
40
20
Thousands
Source: RFA
Motion Picture Production - Los AngelesEmployment
0098969492908886848280
9
8
7
6
5
4
3
2
Thousands
Source: RFA
Motion Picture Distribution - Los AngelesEmployment
0098969492908886848280
20
18
16
14
12
10
8
6
4
Thousands
Source: RFA
Radio & TV Broadcasting - Los AngelesEmployment
0098969492908886848280
10
8
6
4
2
Thousands
Source: RFA
Cable & Pay TV - Los AngelesEmployment
0098969492908886848280
18
16
14
12
10
Thousands
Source: RFA
Theatrical Producers & Entertainers - Los AngelesEmployment
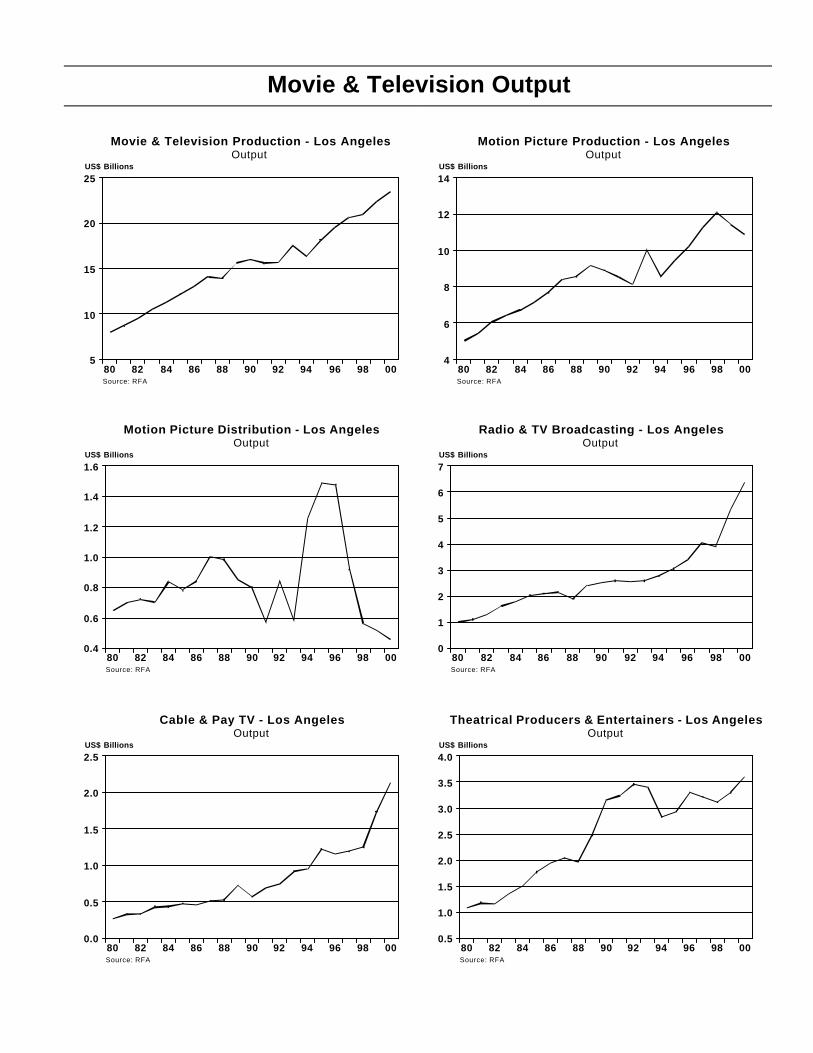
Movie & Television Output
0098969492908886848280
25
20
15
10
5
US$ Billions
Source: RFA
Movie & Television Production - Los AngelesOutput
0098969492908886848280
14
12
10
8
6
4
US$ Billions
Source: RFA
Motion Picture Production - Los AngelesOutput
0098969492908886848280
1.6
1.4
1.2
1.0
0.8
0.6
0.4
US$ Billions
Source: RFA
Motion Picture Distribution - Los AngelesOutput
0098969492908886848280
7
6
5
4
3
2
1
0
US$ Billions
Source: RFA
Radio & TV Broadcasting - Los AngelesOutput
0098969492908886848280
2.5
2.0
1.5
1.0
0.5
0.0
US$ Billions
Source: RFA
Cable & Pay TV - Los AngelesOutput
0098969492908886848280
4.0
3.5
3.0
2.5
2.0
1.5
1.0
0.5
US$ Billions
Source: RFA
Theatrical Producers & Entertainers - Los AngelesOutput
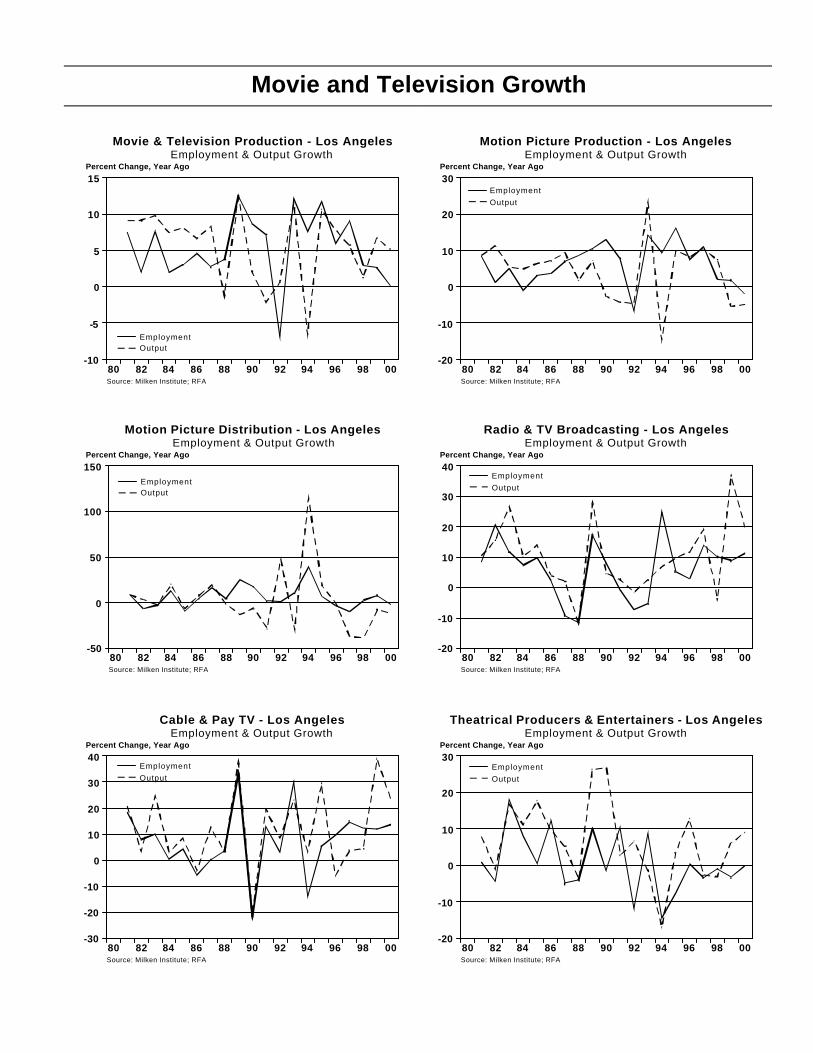
Movie and Television Growth
0098969492908886848280
15
10
5
0
-5
-10
Percent Change, Year Ago
Source: Milken Institute; RFA
Movie & Television Production - Los AngelesEmployment & Output Growth
Employment
Output
0098969492908886848280
30
20
10
0
-10
-20
Percent Change, Year Ago
Source: Milken Institute; RFA
Motion Picture Production - Los AngelesEmployment & Output Growth
Employment
Output
0098969492908886848280
150
100
50
0
-50
Percent Change, Year Ago
Source: Milken Institute; RFA
Motion Picture Distribution - Los AngelesEmployment & Output Growth
Employment
Output
0098969492908886848280
40
30
20
10
0
-10
-20
Percent Change, Year Ago
Source: Milken Institute; RFA
Radio & TV Broadcasting - Los AngelesEmployment & Output Growth
Employment
Output
0098969492908886848280
40
30
20
10
0
-10
-20
-30
Percent Change, Year Ago
Source: Milken Institute; RFA
Cable & Pay TV - Los AngelesEmployment & Output Growth
Employment
Output
0098969492908886848280
30
20
10
0
-10
-20
Percent Change, Year Ago
Source: Milken Institute; RFA
Theatrical Producers & Entertainers - Los AngelesEmployment & Output Growth
Employment
Output
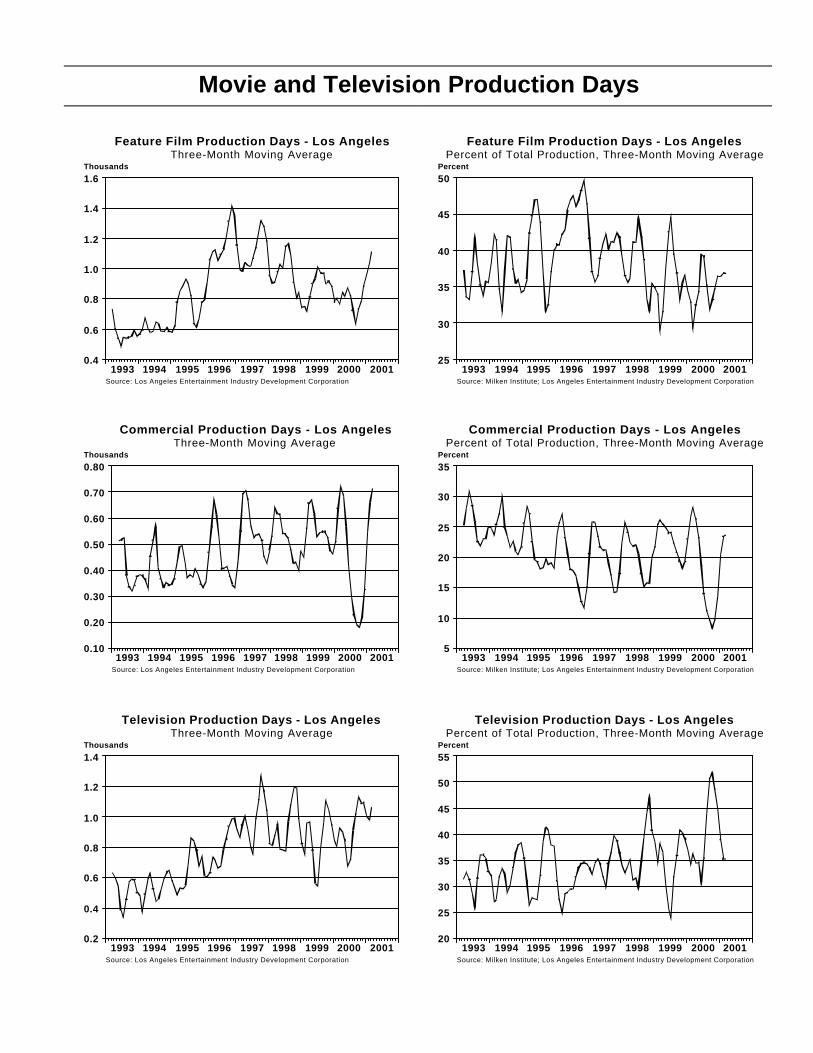
Movie and Television Production Days
200120001999199819971996199519941993
1.6
1.4
1.2
1.0
0.8
0.6
0.4
Thousands
Source: Los Angeles Entertainment Industry Development Corporation
Feature Film Production Days - Los AngelesThree-Month Moving Average
200120001999199819971996199519941993
50
45
40
35
30
25
Percent
Source: Milken Institute; Los Angeles Entertainment Industry Development Corporation
Feature Film Production Days - Los AngelesPercent of Total Production, Three-Month Moving Average
200120001999199819971996199519941993
0.80
0.70
0.60
0.50
0.40
0.30
0.20
0.10
Thousands
Source: Los Angeles Entertainment Industry Development Corporation
Commercial Production Days - Los AngelesThree-Month Moving Average
200120001999199819971996199519941993
35
30
25
20
15
10
5
Percent
Source: Milken Institute; Los Angeles Entertainment Industry Development Corporation
Commercial Production Days - Los AngelesPercent of Total Production, Three-Month Moving Average
200120001999199819971996199519941993
1.4
1.2
1.0
0.8
0.6
0.4
0.2
Thousands
Source: Los Angeles Entertainment Industry Development Corporation
Television Production Days - Los AngelesThree-Month Moving Average
200120001999199819971996199519941993
55
50
45
40
35
30
25
20
Percent
Source: Milken Institute; Los Angeles Entertainment Industry Development Corporation
Television Production Days - Los AngelesPercent of Total Production, Three-Month Moving Average

Appendix II: Background on the Milken
Institute Model

Milken Institute – Regional and Demographic Services
i
Milken Institute
State and Metro Economy Models
Approach and Methodology
Table of Contents A. Overview of Modeling Approach.......................................................................................................1 B. Core Economic Forecasting Module ................................................................................................1 1. The Export Economy....................................................................................................................2 A. The Manufacturing Sector .....................................................................................................2 1. The Formulation................................................................................................................3 2. Industry Mix........................................................................................................................4 3. Interindustry and Interregional Demand ........................................................................4 4. Cost of Doing Business ....................................................................................................5 B. Other Export Sectors ..............................................................................................................6 1. Mining and Agriculture......................................................................................................6 2. Federal Government.........................................................................................................7 2. The Local Economy......................................................................................................................7 A. Local Nonmanufacturing Sectors .........................................................................................7 B. General Model Structure ........................................................................................................7 1. Sector Activity Measures .................................................................................................8 2. Labor Costs........................................................................................................................9 3. National Conditions ...........................................................................................................9 4. Business Cycle Timing .................................................................................................. 10 3. Personal Income ........................................................................................................................ 10 A. Background ........................................................................................................................... 10 B. Wages.................................................................................................................................... 11 C. Other Income Components ................................................................................................ 11 4. Residential Construction........................................................................................................... 12 C. Demographic Forecasting Module ................................................................................................ 13 1. Population ................................................................................................................................... 13 A. Births ...................................................................................................................................... 13 B. Deaths.................................................................................................................................... 14 2. Net Migration............................................................................................................................... 14 A. Data........................................................................................................................................ 15 B. Forecasting Net Migration................................................................................................... 15 D. Summary .......................................................................................................................................... 15 Chart 1: State and Metro Model Structure....................................................................................... 17
State and Metro Economy Models
Approach and Methodology
A. Overview of Modeling Approach The Milken Institute approach to state and metropolitan area models represents a departure from most previous multi-regional modeling, forecasting, and alternative economic impact simulation efforts. Most other regional models are constructed as proportions of the United States. In the Milken Institute formulation, and in the Los Angeles metro and California state models in particular, regions are modeled individually and then linked into a national system. Thus, our metro models do not forecast regional growth as simple proportions of U.S. totals, but focus on internal growth dynamics, structural linkages between “export” sectors and dependent supplier industries through an embedded input/output framework, and differential business cycle responses. This approach is referred to as "top-down bottom-up." It contrasts sharply with pure share (top-down) models, and models that are not linked to a national macroeconomic model (bottom-up), and contains much of the best of both approaches. This model structure provides perhaps the most insightful framework for conducting impact analyses of events such as a strike in the movie TV industry, rising electricity prices, and hikes in minimum wages. Our basic objective is to project how regional activity varies given an economic environment using WEFA’s (formerly, Wharton Econometrics) macroeconomic and industry models. In order to do this, we must be able to explain three key phenomena:
• why states and metros react differently from one another over the business cycle,
• why states and metros grow or decline relative to each other over the longer run, and
• why states and metros are affected differently by their “export” industries and their related cluster members (such as entertainment in the case of Los Angeles).
These issues are addressed using information about detailed industrial mix, interindustry and interregional relationships, productivity and relative costs, and migration trends. B. Core Economic Forecasting Module The state and MSA (metropolitan) models are econometric and have a quarterly periodicity. Consequently, each model is able to capture the full business cycle behavior of the economy, including the timing and amplitude of the turning points. Another general characteristic of the models is that they are policy sensitive — they respond to changes in tax rates, military spending, utility costs, etc. This sensitivity arises from a variety of sources, and these will be highlighted in the description below. A few of these reasons are the following:
• Each state and metro is modeled individually, with different model structures specified according to the characteristics of the metro,
• National policy is explicitly captured, and
• The comparative advantage of one region over another is explicitly modeled using relative cost variables.
The three major components of the Milken Institute approach are summarized below:
1. Export sectors. The major linkages among the models occur in the economic base or export sectors. Such export sectors include agriculture, mining, the federal government, and most manufacturing industries. In a few metro models, specific industries are also classified as export sectors, including banking (Charlotte), insurance (Hartford), casinos and hotels (Las Vegas), computer and data processing services (Washington) and movie and television production (Los Angeles). For the most part, these industries serve national rather than local markets or are not dependent upon the local market. On the other hand, the income generated from these sectors provides one of the major stimuli to the local economy.
2. Local economy. The local economy comprises construction, transportation, utilities
and communications, finance, insurance, and real estate, wholesale and retail trade, services, and state and local government. The income generated by the export sectors circulates and multiplies through the local economy and generates the greater part of regional employment. These interactions and simultaneities can only be captured in an interdependent model.
3. Demographics. In our demographic sector, net migration is driven by economic
conditions. The principal assumption is that people follow jobs and higher incomes rather than vice-versa. This does not mean that nonpecuniary determinants of migration do not exist. However, these are fixed (climate and landscape), vary only slowly (urbanization), or are special in nature (the ability to sell homes and retire to Sunbelt areas). Demographic factors are most important on the consumption side of the regional economy. They are a significant factor in housing, retail sales, autos, etc., and the relationships are captured in the models. Population is also an important long-term determinant of the size of sectors such as local government.
In what follows, each of the three major sectors introduced above (export economy, local economy, demographics) is discussed separately. The key income sector is described, followed by the housing and consumption sectors. 1. The Export Economy A. The Manufacturing Sector Manufacturing is the predominant export activity for a majority of the states and metros. This sector is accorded special attention, particularly with respect to the industrial composition in each metro. The current version of the Milken Institute framework contains integral quarterly models of employment by 20 two-digit SIC industries, covering all aspects of manufacturing. The coverage of individual industries is critical to our approach. During nearly every recession, for example, certain sectors are hit harder than others, and each is affected at different points in the cycle . Obvious examples are housing, consumer durables, and business investment. These end uses — to the extent they are supplied from domestic U.S. sources, rather than imports — place heavy demands upon basic industry, i.e. wood products, steel, concrete, aluminum, etc. Therefore, these sectors tend to be more cyclical than the rest of manufacturing. Regions with high concentrations of such industries will tend to suffer disproportionately more during recessions and grow disproportionately faster during recoveries.
Of course, each business cycle is unique, with different sectors weakening and recovering at different rates. Some localized recessions can even be quite focused on one industry, such as seen in the effects of falling oil prices beginning in 1983, and subsequent declines in related income components and energy exploration activity. This "energy recession" occurred as most of the nation's manufacturing industries were rapidly climbing out of the long double-recession period of 1979-1982, and was naturally concentrated in the energy-producing regions of the U.S. In Los Angeles, the defense downsizing in the early 1990s, and the attendant collapse in aerospace, similarly caused severe economic damage to the local economy. In the development of the metro manufacturing employment equations, the Milken Institute has incorporated a number of innovations to enhance the explanatory richness of the equations.
• The equations capture interindustry, interregional, and dynamic linkages by integrating input-output, spatial theory, and econometric concepts;
• The employment equations are estimated using quarterly employment data beginning in
1978. These data cover all two-digit manufacturing sectors across all states and metros, and were derived by Milken Institute using data from the Bureau of Labor Statistics (ES-202 and 790 survey data), the Bureau of Economic Analysis, and the Census Bureau. With quarterly data, the equations are able to capture the timing and amplitude of turning points in the business cycle. In addition, at the two-digit level, employment data are the most reliable, accurate, and timely measure of metro industrial activity. Where a particular industry cluster is vital to a metro, as is the case of movie and TV production in Los Angeles, three-digit detail is incorporated into the model structure to capture the dynamic impacts on the rest of the local economy; and
• Employment levels are estimated using national and metro-specific explanatory variables.
Through direct linkages to the national economy, consistency with the Milken Institute national forecasts is ensured, and the depth of the WEFA’s macroeconomic model and its detailed industrial production sector is captured. By linking the employment equations to the national model, we also have the ability to analyze variations in the impact of Federal policy changes — for example, tax policies and defense spending — across regions and states and metros.
1. The Formulation The manufacturing employment equation has the following functional form for each two-digit industry in a given metro:
EM = f(EMUS, RWIPI, RINTDM, RCOST, LPRM, FINDEM) where: EM = employment by industry by metro EMUS = employment by industry, national RWIPI = industry mix relative to U.S. RINTDM = relative interindustry demand RCOST = costs of doing business, relative to U.S. LPRM = labor productivity FINDEM = final demand factor The first two terms are the key linkages to U.S. economic activity, and may enter the equation in two ways. First is the case in which U.S. employment by two-digit industry is modified by that industry's mix in the metro relative to that in the nation. The second can be interpreted as metro-weighted industrial production, modified by national productivity trends in each industry. An explanation of how we measure industry mix, as well as how the components of the equation are constructed is covered below.
2. Industry Mix The Milken Institute two-digit models are affected by the industry mix within categories, a key factor all too often ignored in other models of regional activity. Examples include Aircraft versus Motor vehicles within SIC 37 (Transportation Equipment), Appliances versus Electronic components within SIC 36 (Electrical Machinery), or Floor coverings versus Fabrics and Yarns within SIC 22 (Textiles). In every analysis undertaken by the Milken Institute, this detailed understanding of the industrial underpinnings of a metro's economy dominates every other factor, and is critical in the analysis of short-term cycles as well as long-term growth. Of course, other factors are also relevant, and these will be discussed in the following sections. Industry mix effects are captured in the "weighted industrial production index," or WIPI, a concept common to all previous versions of the Milken Institute regional models. The difference in the current version is in the use of the index for separate two-digit industry equations rather than for total manufacturing alone. The WIPI is simply a re-weighting of the U.S. indexes of industrial production at the three-digit level, according to the relative importance of industries within the metro's two-digit sectors (using employment as weights in most applications). Localized demand may also be an important determinant of manufacturing activity. Construction activity, a major source of regional final demand, has already been included in the creation of the intermediate demand variable, but local housing markets are often explicitly included in the equation. The impact of the other final demand categories enters the employment equations through three-digit SIC metro employment weighted industrial production indices. At the national level, forecasts for the three-digit IPIs are determined by both intermediate and final demand drivers using a hybrid input-output-based model. For example, the IPI for Transportation Equipment (SIC 37) is determined by consumer expenditures for motor vehicles and parts, imports of motor vehicles and parts, and relative prices. The IPI forecast for nonferrous metals is then derived from the demands from Transportation Equipment and other metal-using industries. Consequently, any increase in these final demand components flows directly into the metro employment equations. 3. Interindustry and Interregional Demand The third term in the manufacturing employment equations and in the key export service sectors is a measure of demand for an industry's products by other industries. An interindustry, interregional demand term is constructed for every two-digit SIC industry in each metro. As computed, the importance to each industry of each geographic market varies according to:
• Input-output relationships that quantify demand from 70 key industrial buyers by sector and from selected end-user sectors,
• The geographic location of potential markets, measured with employment data,
• Transportation costs, measured by distance or known trade patterns between states and
metros, and • Strength of industrial demand, measured by the expected growth of manufacturing activity
by sector in every metro. These concepts allow the models to respond to such phenomena as:
• The semiconductor manufacturer in Silicon Valley facing weakening demand from declining investment in information technology equipment in domestic and international markets;
• The transportation and logistic industry in Los Angeles affected by a financial crisis in Asia
curtailing exports from Southern California and the rest of the U.S.;
• The paper manufacturer in Kenosha facing weak demand when a decline in the auto industry makes the Great Lakes area a weak market relative to the rest of the U.S.; or
• The steel industry in Texas facing weak oil-related demand, relative to the stronger end-use
demand faced by steel producers recovering in the Northeast. Previous attempts to capture such effects in other regional forecasting systems have resulted in large and unwieldy simultaneous models at the metro level, or in the necessity to create a separate set of models at the broad region level, despite the wide variance in industry mix among individual states and metros. The Milken Institute’s approach is unique in avoiding these difficulties, while still maintaining the ability to simulate only one or any desired number of states and metros at a time. 4. Cost of Doing Business The third set of independent variables to enter the employment equations is the relative costs of doing business in states and metros. Any explanation of regional growth must recognize that there are few barriers to the flow of economic activity across borders. Regions actively and openly compete for new and expanding businesses that determine economic growth. Since most industrial firms charge the same price for their products, regardless of their place of origin, differences in profitability are tied directly to differences in relative costs. Since greater profitability means higher returns to capital invested in the region, we expect that the region’s share of investment will be inversely related to relative costs. The major factors affecting relative costs are natural resource costs, unit labor costs, unit capital costs, transportation and distribution costs, energy costs, and unit taxes.
• Regional natural resources are well known and not changing over the historical period, and their costs are difficult to measure in any case. We therefore do not only include mineral resources, such as coal or copper, harbors and waterways, landform and climate, and the like. The effect of natural resources is embedded in the estimated equations but does not appear explicitly.
• The regional variation in unit labor costs comprises two components: wage rates and productivity.
Productivity is primarily related to the industrial mix and the age of the capital stock. These are not direct determinants of new investment decisions. Therefore, the wage rate is the important variable. Wage rates vary by skill, education, and underlying local costs of living. This is captured by defining the relative labor cost variable as the metro wage rate relative to the national wage rate weighted by the industry mix of that metro. The denominator is weighted in just the same way as national industrial production. For example, if a metro is primarily manufacturing textiles, that metro’s wage rate should not be related to the overall national wage rate but to a weighted average consisting primarily of textiles. The metro may have very low wage rates, but if they are in a low-wage rate industry such as apparel, they do not provide the comparative advantage they might in a high-skill high-wage industry.
• Unit capital costs of structures are primarily a function of wage rates, in this case in the construction
industry. On average, about one-quarter of nonresidential construction costs are accounted for by labor costs. Of the other costs — equipment rental, overhead, and materials — the variation from metro to metro is mostly short-term related. For example, raw materials flows between states and metros are extremely small, accounting for only five percent of expenditures on average. Thus, construction materials are produced locally in most states and metros, where differences in price are accounted for by

labor and energy costs. Therefore, other relative costs can account for regional variations in unit capital costs.
• Transportation costs are important for bulk commodities, but less so for manufactured goods with a high
value-to-weight ratio. Historically, transportation costs have had the same characteristics as natural resource costs; they were well-known and relatively stable, particularly between regions. In pure time series, transportation costs do not enter the employment equations significantly, primarily because they are related to average distance to markets that do not vary over time, and because they are correlated with the energy costs variables as described below. However, transport costs do enter the equations via the interindustry demand variable.
• Energy costs are natural resource costs that we are often able to include explicitly. Historical time series
data are available for electrical power and natural gas costs because of the Federal and metro regulations that apply to these industries. Natural gas costs per BTU by region are measured by the average delivered industrial price. These forecasts are generated from relationships that account for acquisition and transmission costs, and the different sources and types of natural gas, plus a term accounting for transmission costs (that vary primarily due to distance from the wellhead). The relative metro natural gas cost term is the ratio of metro natural gas costs to a comparable national average. Industrial electric power costs, which are also assumed to adequately proxy oil and coal costs, are measured by the ratio of utility revenues to sales within the region. Forecasts of electric power costs are based on an equation with input costs to utilities as the key independent variable. The determination of the input mix used in the generation of electricity is dependent on the projected mix of generating capacity within the region.
• The tax cost variable is somewhat different from the others in that the variable is not specific to
manufacturing. Instead, the variable is defined as the ratio of total metro and local taxes, personal as well as business-related, to metro personal income, relative to the national average of this ratio. This is often referred to as tax load. Numerous studies have shown that business-related taxes are not significantly related to locational investment decisions. However, research undertaken at the Milken Institute, both cross-sectional and time series, indicates that tax load can be important when taken together with other costs. Severance taxes are excluded since they affect only one specific industry and are usually exported to other areas of the country.
B. Other Export Sectors 1. Mining and Agriculture Aside from manufacturing, agriculture and mining (including Oil and Gas) represent the primary export sectors in most states and metros. Agricultural employment declines over time for proprietors, although wage earner employment is often trendless and highly volatile. It is forecast exogenously. Agricultural activity, on the other hand, can be highly influential on a metro’s manufacturing activity. Fargo, North Dakota, for example, has a food processing industry that is dependent on agricultural performance in the metro. We therefore use local crop and livestock cash receipts as a variable in its model. Whereas agriculture is an example of a nearly perfectly competitive industry with a great deal of regional homogeneity by product, mining is often the other extreme. In nonferrous metals, for example, relatively few companies dominate the market. Therefore, for many states and metros, mining forecasts consist of microeconomic analysis. Mining in general, however, is modeled along the lines of manufacturing since an output measure is often available. Mining employment and certain metro manufacturing sector activities are then driven by the output forecast in conjunction with other conventional variables. When output measures do not suffice, real prices (or oil, metal, ores, etc.) are often added to the analysis in order to incorporate expected returns on investment.

2. Federal Government The Milken Institute metro models separate Federal from State and Local government employment. This distinction is important because of the relative insulation of Federal workers from local economic conditions, and is critical in the District of Columbia and surrounding areas where the federal sector dominates. Forecasts of federal employment are made consistent with national trends and budget appropriations, as well as local population growth. Military personnel (as opposed to defense and nondefense civilian employment) are not included in the establishment employment totals, consistent with the reported data. However, the presence of military bases is often important economic driver, so we include military employment in our models. 2. The Local Economy A. Local Non-manufacturing Sectors Manufacturing, mining, agriculture, and key service sectors — the export economy — produce primarily for national, or at least regional, markets, and provide a source of income for the local economy. Other sources of external funds are Federal Government expenditures, tourism, and certain kinds of banking and insurance transactions. The local economy responds and builds on these external stimulants, multiplying the effect by creating its own demand. This is a key area of simultaneity in the model. Most of the local economy is captured in the non-manufacturing sector. The classic examples are construction, wholesale trade, retail trade, services, local government, utilities, and the like. These are nearly always support services, providing the necessary infrastructure for the base (export) sectors and the local population. Demographics work in two directions. Migration is drawn toward centers of economic growth, and that same migration is as stimulus to the local economy, creating a demand for services. Migration, therefore, constitutes a powerful feedback mechanism — in-migration further strengthens a growing economy, while out-migration further weakens a declining economy. More will be said about the causes of migration below. As mentioned above, certain non-manufacturing sectors, although usually driven by local requirements, can also serve national markets. The best examples are the insurance industry in Connecticut, the banking interests in New York, Chicago and California, and the tourist industry. These exceptions are export sectors in selected states and metros. Where they are export-oriented, these non-manufacturing sectors are driven by national variables. B. General Model Structure The Milken Institute metro econometric models forecast nine categories of locally-oriented nonmanufacturing:
• Construction • Retail Trade • Wholesale Trade • Transportation, Communications and Public Utilities • Finance, Insurance and Real Estate • Health Service • Business Services • Other Services • State and Local Government
Each of these contains a diversified group of sub-industries that vary considerably from metro to metro. For example, construction employment in energy-producing states and metros is often tied as directly to exploration and development activity as it is to local housing starts. Wholesale trade in farming states and metros is highly
dependent on acreage planted and other measures of agricultural activity. Transportation, communications, and public utilities in Central New Jersey has a large component dominated by AT&T and Lucent headquarters staff, and finance, insurance and real estate has similar headquarters (i.e. non-locally determined) employment in New York and Connecticut. Services in Las Vegas contain a highly disproportionate number of hotel workers. Finally, metro and local government employment is dependent upon tax and other policy decisions made by individual governments. The generalized structure of the non-manufacturing equations contains four key factors — measures of activity, a cost term, national conditions of importance to a particular sector, and a measure of the stage of the business cycle. Each of these will be examined in detail below. Sectoral activity measures are the primary determinants of employment by category. These include real income, population, and export sector activity. The cost term is real wages, which captures labor substitution effects. Higher wages lead to lower employment. The third term, national conditions, refers to such factors as credit availability, which can affect local construction or retail trade. The business cycle measure, which is often expressed as unemployment relative to the working-age population, reflects the stage of the business cycle. This affects the use of overtime and hiring/firing practices. 1. Sector Activity Measures One of the most crucia l objectives in developing a model of the localized economy is to find a suitable measure of the activities driving a particular sector. This is usually a complex function involving income, export sectors, and demographic trends. It varies according to the particular non-manufacturing sector being examined. Real personal income is the most frequently used variable, either alone or in combination with others. It is the best measure of aggregate economic activity at the metro level, capturing wages, transfer payments, and nonwage income. Thus, it is a key determinant of the level of services. Through its effect on trade and tax revenues, it is also a powerful factor in wholesale/retail employment and government employment. Since these employment categories are major contributors to personal income (through wages), this introduces one of the principal simultaneities in the Milken Institute model. Stated another way, personal income is a function of employment, and certain employment categories are a function of income. Population is another key measure of sector activity. Certain age cohorts, for example, are primary determinants of the level of government services required. Younger age groups require more educational facilities. Older age groups require more medical and other services. Population is also a key ingredient in determining the need for transportation and utilities. In the Milken Institute regional models, population and real income often enter in the same equation, measuring different aspects of the need for services or other non-manufacturing sectors. In summary, non-manufacturing employment and income are so closely intertwined that any model that fails to treat them simultaneously cannot capture the local economy’s short-term behavior. Population is also intertwined with income and employment, but on a longer time scale. The Demographic Forecasting Module will be discussed below. This appendix has previously discussed how manufacturing and other export sectors drive the local economy. Thus, key export sectors are included wherever they impact the local economy. Manufacturing, for example, is a prime determinant of utilities and transportation employment. In highly industrialized states and metros, it has an effect on almost every non-manufacturing support sector. In certain western states and metros, on the other hand, it is agriculture or mining that are important export sectors. The appropriate export sector is explicitly represented in the equation, and in this way, the second effects of a new plant, a new mine, or increased acreage is directly captured in the non-manufacturing sectors. Since the non-manufacturing sector has explicit feedbacks unto itself, the third and fourth order effects are also captured. It is a truly dynamic and policy sensitive equation structure.

2. Labor Costs When real wages are high or rising rapidly, business, government, and other organizations tend to hold employment down as much as possible. The reverse holds true when real wages are low or falling rapidly. In the manufacturing sector, wage costs were shown to be one of the principle determinants of business location decisions. In the non-manufacturing support sectors, this is reflected in the level rather than the location of employment. Thus, employment is inversely proportional to real wage costs. Real wages enter many of the non-manufacturing employment equations. For forecast purposes, this wage rate is related to the appropriate national variable and the growth rate of the sector itself. 3. National Conditions The national economy is reflected in three areas in the non-manufacturing sectors. First, certain macroeconomic conditions affect local activity, even non-manufacturing, significantly. The best example is credit availability. Tight credit conditions with high interest rates have an adverse impact on local construction activity, sales of autos, and other durables and the like. Thus, when money is tight, employment in construction and in wholesale and retail trade is adversely affected. The opposite holds true during periods of easy money and low interest rates. The second class of national variables are those that reflect nationwide trends. An example of this is the trend towards an increasingly large services sector. Capturing this secular trend is sometimes difficult when one uses only local variables in the non-manufacturing equations. Thus, the usual assortment of local variables – income, populations, wages costs, etc. – is sometimes supplemented by the ratio of sector employment to total employment at the national level. This is not a simple “shift-share” relationship. Instead, it is used to supplement, not supplant, local activity variables. The elasticity on the national series is uniformly lower than the elasticity on the local variables, and it is simply reflecting gradual long-term changes in the nation’s employment structure. The local variables remain the main drivers of the local economy. The third application of national variables is in the export-oriented non-manufacturing sectors, such as the insurance and banking industries in certain states and metros. The New York, Chicago, and California banking sectors respond to national markets rather than depending heavily on local markets. In states and metros in which tourism is a significant factor in generating services employment, such as Las Vegas, more national variables enter the non-manufacturing equations. This is not to say that tourism is explicitly captured. Econometric modelers of all types have yet to properly capture tourism in their models, partially due to the lack of good data. At the Milken Institute, we capture tourism in those states and metros where it is important by including more and more heavily weighted national variables and national ratios. The rationale for this is the propensity for tourism to follow the national business cycles or nationwide phenomena such as gasoline prices and availability. 4. Business Cycle Timing A cyclical variable that measures the state of the national business cycle is usually included with each non-manufacturing sector. The purpose of this variable, which is the employment rate or capacity utilization, is to the capture the hiring-firing cycle. As the local economy slides into a recession, employers are reluctant to lay off workers until necessary. It is costly to dismiss and then re-hire employees, and it is usually difficult to tell whether a recession is really coming in the early stages of a downturn. Conversely, as the economy pulls out of a recession, employers are reluctant to hire new employees until the recovery is clearly underway. Thus, there is a clear lag between the behavior of the activity variables, such as income or export sector employment, and the behavior of employment in the non-manufacturing sectors. Many sectors have a cyclical variable in the specification to capture this lagged effect.
3. Personal Income A. Background The complex structures and feedback loops contained in the metro export sectors, local economy sectors, and demographic formulations are designed to meet three key objectives. The first is to capture the complex interactions between the various sectors, allowing the most sophisticated policy analysis possible. The second is to provide consistent forecasts of output and employment by sector, which are key statistics for many business and government applications. The third is to produce accurate forecasts of personal income because of its important to the whole metro economy. Personal income is the most frequently updated and best overall measure of activity within a metro, capturing labor income, property income and transfer payments. Good employment forecasts are critical to a good forecast of personal income, since wages and other labor income constitute over 70 percent of income. In addition, there are multiple feedbacks between various employment sectors, cost variables, income, and population. The Milken Institute forecasts sixteen categories of personal income in the following groupings both in constant and current dollars:
• Total Personal Income by Place of Residence • Disposable Personal Income • Manufacturing Wages • Non-manufacturing Wages by Sector • Other Labor Income • Farm Proprietors’ Income • Business Proprietors Income • Transfer Payments • Contributions to Social Insurance Programs
It is important to note that many of the minor income sectors, which in total account for less than 30 percent of personal income, are forecast using national variables. The motivation for this is the underlying data. As long as reported data are basically shared from national totals, the forecast equations will rely heavily on national variables for the minor income sectors. This weakens somewhat, but does not invalidate, the independent nature of each metro model, the basic reliance on local variables, and the various feedback mechanisms. B. Wages Compared with most factors of production, there is mobility in the labor market. Consequently, we expect the real wage to be similar across the United States, and nominal wages should increase with the local price level. From the demand side, we expect real wages to vary directly with labor productivity and with metro manufacturing output relative to the United States. Finally, in the short-term, the unemployment rate will affect the average wage rate. In order to model manufacturing wages, we explicitly account for the industry mix in the metro, as well as the differences in wages per employee between industries as experienced by the metro. To accomplish this, a variable called “generated wages” was calculated. The generated wage bill used in the manufacturing wage bill relationship is the sum of locally weighted national hourly earnings at the two-digit SIC level. Since the two-digit manufacturing employment relationships are endogenous, the weights in the generated wage bill for manufacturing change as the composition of manufacturing employment changes at the metro level. Also, as is the case in the Private Service Producing and Construction/Mining equations, a labor market tightness variable (usually the ratio of unemployment to working-age population) is included in some of the equations as a local modifier.

There are four stochastic relationships for components of the total wage bill in each metro model. The endogenous components of the wage bill are Private Service Producing, Construction and Mining, State and Local Government, and Manufacturing. The Federal Government is exogenous. The structure of the wage bill equations for Private Service Producing and Construction/Mining are identical. In each of these sectors, a “generated” wage bill and a labor market tightness variable are used as independent variables in the relationships. The generated wage bills are equal to the wage bill to be expected by employees in each industry in the metro had they been paid at the national industry rate. The labor market tightness variable is defined as the relative ratio of the number of unemployed persons per capita in each metro to that in the nation, and it acts as a local modifier to the generated wage bill term. The State and Local Government wage bill equation explains compensation per employee as a function of the compensation rates in Private Service Producing industries. C. Other Income Components Taking each non-wage income category in order, other labor income is tied to the size of an individual’s wages since it represents employer-paid benefits. It is evident that a properly specified equation for this variable must include total wages and salaries. Further, this income category is increasing at a faster rate than total wages as a result of trends in non-wage compensation and medical care costs. To capture this effect, a variable representing the national ratio of other labor income to total wages and salaries is added to the equation. Business proprietors’ income is a category that is frequently specified incorrectly in regional models because of the failure to include both national and regional variables. Most unincorporated businesses depend heavily on local activity. For example, the project-oriented nature of the movie and television production industry is dominated by small, unincorporated businesses whose earnings would be reported as proprietors’ income. To capture this effect, regional personal income less business proprietors’ income is included in the specification as a general indicator of regional activity. It is also necessary, however, to include variables that capture the effects of activity in other regions and changes in national economic conditions (such as revisions in tax codes) that affect profitability. National business proprietors’ income serves this requirement. Because the bond and equity markets are national in nature, we have found that property income is best specified using national variables. Specifically, we include both interest and rental income and dividends in the equation. Property income is 18 percent of national income. Virtually all income transfer programs are either Federally administered or Federally funded. They are dominated by the Social Security program, resulting in nearly identical movements of transfer payments across regions. Transfer payments are 15 percent of personal income. The last category of income is personal contributions for social insurance programs, primarily Social Security. These payments are obviously a debit to personal income since they are already included in wages. The impact of Federal regulation on expenditures in this category is much the same as it is on transfer payments. However, we do not use the national totals for this income component directly as an explanation of its regional counterpart. We compute instead an implicit rate of taxation by including the ratio of national social insurance contributions to national wages and salaries along with total regional wage income. In this way, contributions vary directly with changes in tax rates or local wages and salaries. 4. Residential Construction Housing starts are one of the most complex regional variables to forecast. There are two reasons for this -- a lack of data and the nature of the industry. No metro-by-metro figures on housing starts are available. Instead, only permit data are available. These permit data usually cover only a portion of each metro, i.e. “permit issuing

places.” Thus, historical data on housing starts by metro must be estimated from limited coverage permit data. This is an inexact process that can only be verified in Census years. The second problem is that housing starts are extremely volatile, responding rapidly to interest rates, credit availability, changes in vacancy rates, strikes, usury ceilings, weather, and other factors. Since the number of starts is an addition to the housing stock, forecasting housing is analogous to predicting the change in employment rather than the level. The apparent error is magnified. The appropriate specification of the housing equation is a stock adjustment equation where the desired stock is essentially the desired number of households. The desired stock is determined from the size of the number and age distribution of households, permanent real income, and unit prices. Since population by age group is the key long-term, determinant of the number of households, there is a natural consistency between housing starts and long-term economic growth in each metro. C. Demographic Forecasting Module 1. Population Although the trend has slowed recently, Americans have been leaving the North and East for the past three decades. Their migration south and westward has meant rapid population growth in these areas and stagnant or declining population in many of the older industrial states and metros. This population shift is related to relative economic opportunity and other factors. The purpose of the Milken Institute metro population model is to capture this dynamic relationship between population and the economy while capturing demographic factors through “cohort-component” techniques. Population change at the metro level is made up of:
• Births • Deaths • Net migration
During the 1990s, natural increase has accounted for 60 percent of population growth nationwide, but in a number of fast-growing states and metros in the South and West, net migration accounted for over half of the gain, making intermetro mobility an important determinant of metro population growth. The Milken Institute’s econometric analysis of net migration based upon economic determinants differentiates its forecasts from the Census Bureau’s trended metro projections. Migration flows between the states and metros are the result of individual decisions, which are responsive to economic opportunities. Net migration, the difference between immigration and outmigration, has been modeled in rate form as the outcome of each metro’s economic performance relative to that of the nation. The demographic factors in population change are built into the model through the use of “cohort-component” techniques. This method projects a given population by applying age and sex-specific rates of fertility, mortality, and migration. Birth, death, and foreign immigration rates are based upon the Census Bureau’s “Middle Series” projections, adjusted for intermetro differences. Because considerable age and sex detail is maintained over the projection period, the model reflects the sensitivity of population change to variations in age structure and permits analyses of the relative roles of natural increase and migration. The use of age-specific rates allows the distinction to be made between, for example, population growth due to increased birth or survival rates and that due to a change in the age structure, even though the rates at each age may remain constant. To fully exploit economic-demographic linkages, the Milken Institute has developed a quarterly population sector within each core model. This system simultaneously determines economic activity and population for eight age groups. Birth rates, death rates, and graduation rates, used to project the population from one age

group to the next, are derived from the results of annual models containing detailed information by single year of age and sex. The models are run periodically to incorporate newly available demographic information, and data used by the metro quarterly models are updated accordingly. In the following section, we describe the manner in which each of the three components of population change is measured. A. Births One of the most significant demographic developments of the 30 years was the dramatic drop in the national birth rate. Although U.S. fertility patterns have been characterized by long, regular cycles, there are indications that the most recent downturn reflects structural as well as temporal changes, which are likely to reduce the amplitude of future cycles. There is a substantial degree of variation among metro fertility rates reflecting differences in racial/ethnic compositions, immigrant share of the population, and other social and economic characteristics. Consequently, the projected national fertility rates are adjusted to reflect the historical relationship between each of the states and metros and the nation. In order to forecast metro births, a crude birth rate is calculated based upon these detailed fertility rates. The rates are updated periodically as new metro fertility information becomes available. B. Deaths The differences between the states and metros in life expectancy at birth and in the age-sex structure of survival rates are marked enough to advise against the use of a single set of national survival rates as is generally done. The mortality component of the Milken Institute metro population model takes account of these differences by applying age and sex-specific adjustment factors for each of the states and metros as they relate to the national survival rates projected by the Census Bureau. These adjustment factors were calculated as the ratio of metro to national birth rates as reported by the National Center for Health Statistics (NCHS). 2. Net Migration The economic explanation of regional migration is that labor will move from low-wage, less-developed areas to where wages are higher and economic opportunity greater, while firms will tend to locate facilities where profit opportunities are the greatest. In practice, the relationship between migration and regional economic development is somewhat looser. People often prefer present family and social ties to the uncertainties of other places. In periods of slack national economic activity, mobility generally declines as people are less willing to chance a move and as businesses reduce the number of employee transfers. And, of course, some migration responds to noneconomic incentives such as a more pleasant climate. Nevertheless, a good part of the migration pattern of the United States has reflected the movement of people to areas of greater opportunity. Historically, this has meant migration from the agricultural, low-wage areas of the Middle West and South to the developing urban-industrial centers of the Far West, North, and East. Since the late 1960s, however, there has been a dramatic reversal of this traditional migration pattern and a redistribution of population away from the older industrial regions toward the burgeoning centers of the South and West. This change of direction in migration flows is related to the same factors, which have stimulated economic growth in the Sun Belt states and metros. Regional differences in employment opportunities, real per capita income, and housing costs, together with changes in technology and in the structure of the national economy, have conferred substantial locational advantages to these newer economic growth centers. Migration has followed suit. In areas like the Southeast and Southwest, once subject to a chronic population drain, employment has grown fast enough to draw in considerable numbers of newcomers, as well as to provide jobs for local
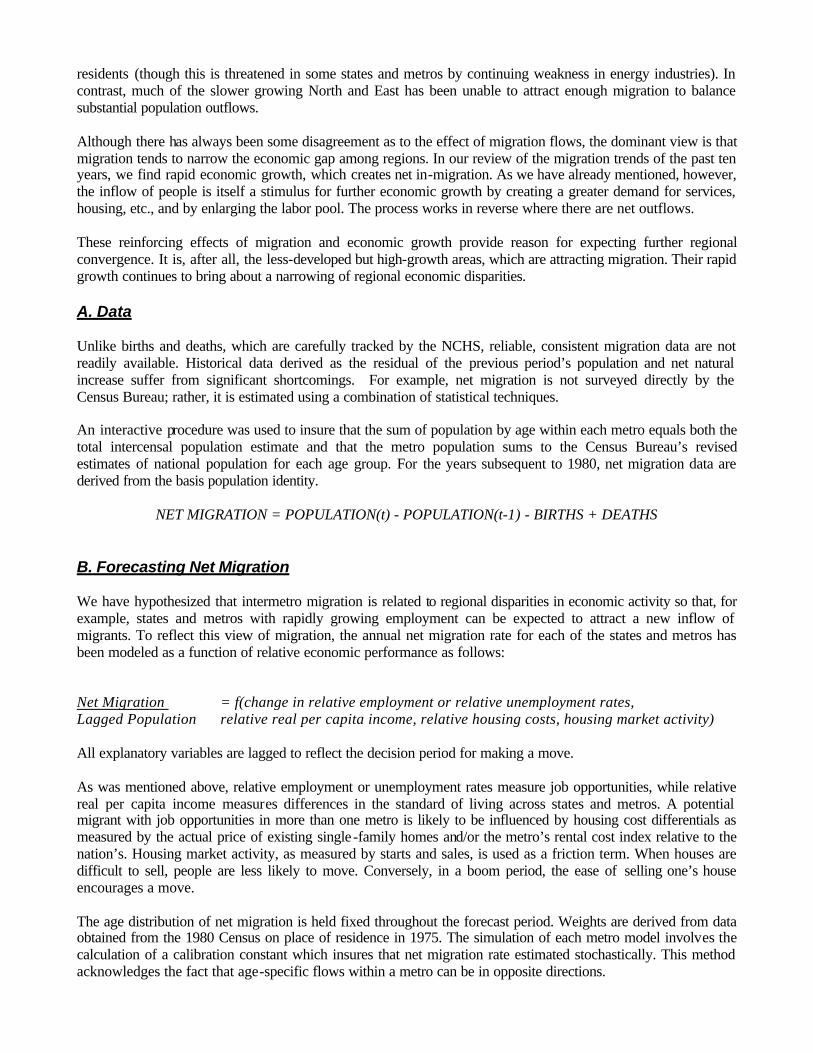
residents (though this is threatened in some states and metros by continuing weakness in energy industries). In contrast, much of the slower growing North and East has been unable to attract enough migration to balance substantial population outflows. Although there has always been some disagreement as to the effect of migration flows, the dominant view is that migration tends to narrow the economic gap among regions. In our review of the migration trends of the past ten years, we find rapid economic growth, which creates net in-migration. As we have already mentioned, however, the inflow of people is itself a stimulus for further economic growth by creating a greater demand for services, housing, etc., and by enlarging the labor pool. The process works in reverse where there are net outflows. These reinforcing effects of migration and economic growth provide reason for expecting further regional convergence. It is, after all, the less-developed but high-growth areas, which are attracting migration. Their rapid growth continues to bring about a narrowing of regional economic disparities. A. Data Unlike births and deaths, which are carefully tracked by the NCHS, reliable, consistent migration data are not readily available. Historical data derived as the residual of the previous period’s population and net natural increase suffer from significant shortcomings. For example, net migration is not surveyed directly by the Census Bureau; rather, it is estimated using a combination of statistical techniques. An interactive procedure was used to insure that the sum of population by age within each metro equals both the total intercensal population estimate and that the metro population sums to the Census Bureau’s revised estimates of national population for each age group. For the years subsequent to 1980, net migration data are derived from the basis population identity.
NET MIGRATION = POPULATION(t) - POPULATION(t-1) - BIRTHS + DEATHS B. Forecasting Net Migration We have hypothesized that intermetro migration is related to regional disparities in economic activity so that, for example, states and metros with rapidly growing employment can be expected to attract a new inflow of migrants. To reflect this view of migration, the annual net migration rate for each of the states and metros has been modeled as a function of relative economic performance as follows: Net Migration = f(change in relative employment or relative unemployment rates, Lagged Population relative real per capita income, relative housing costs, housing market activity) All explanatory variables are lagged to reflect the decision period for making a move. As was mentioned above, relative employment or unemployment rates measure job opportunities, while relative real per capita income measures differences in the standard of living across states and metros. A potential migrant with job opportunities in more than one metro is likely to be influenced by housing cost differentials as measured by the actual price of existing single -family homes and/or the metro’s rental cost index relative to the nation’s. Housing market activity, as measured by starts and sales, is used as a friction term. When houses are difficult to sell, people are less likely to move. Conversely, in a boom period, the ease of selling one’s house encourages a move. The age distribution of net migration is held fixed throughout the forecast period. Weights are derived from data obtained from the 1980 Census on place of residence in 1975. The simulation of each metro model involves the calculation of a calibration constant which insures that net migration rate estimated stochastically. This method acknowledges the fact that age-specific flows within a metro can be in opposite directions.
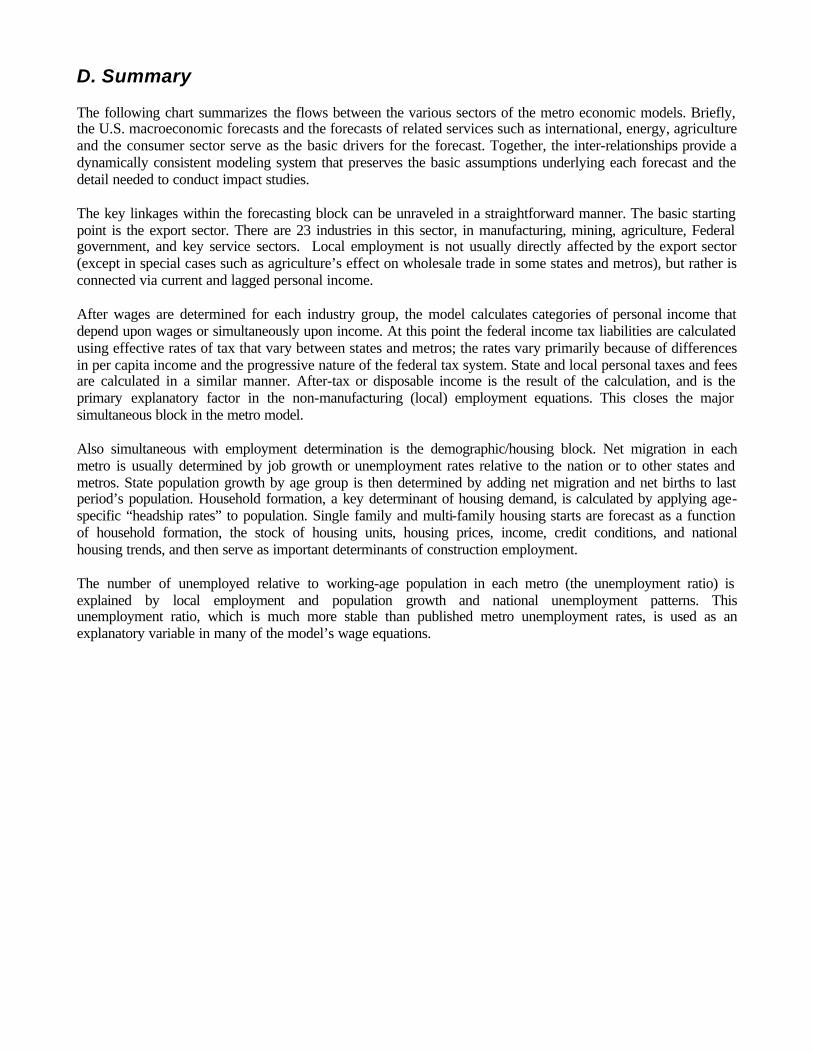
D. Summary The following chart summarizes the flows between the various sectors of the metro economic models. Briefly, the U.S. macroeconomic forecasts and the forecasts of related services such as international, energy, agriculture and the consumer sector serve as the basic drivers for the forecast. Together, the inter-relationships provide a dynamically consistent modeling system that preserves the basic assumptions underlying each forecast and the detail needed to conduct impact studies. The key linkages within the forecasting block can be unraveled in a straightforward manner. The basic starting point is the export sector. There are 23 industries in this sector, in manufacturing, mining, agriculture, Federal government, and key service sectors. Local employment is not usually directly affected by the export sector (except in special cases such as agriculture’s effect on wholesale trade in some states and metros), but rather is connected via current and lagged personal income. After wages are determined for each industry group, the model calculates categories of personal income that depend upon wages or simultaneously upon income. At this point the federal income tax liabilities are calculated using effective rates of tax that vary between states and metros; the rates vary primarily because of differences in per capita income and the progressive nature of the federal tax system. State and local personal taxes and fees are calculated in a similar manner. After-tax or disposable income is the result of the calculation, and is the primary explanatory factor in the non-manufacturing (local) employment equations. This closes the major simultaneous block in the metro model. Also simultaneous with employment determination is the demographic/housing block. Net migration in each metro is usually determined by job growth or unemployment rates relative to the nation or to other states and metros. State population growth by age group is then determined by adding net migration and net births to last period’s population. Household formation, a key determinant of housing demand, is calculated by applying age-specific “headship rates” to population. Single family and multi-family housing starts are forecast as a function of household formation, the stock of housing units, housing prices, income, credit conditions, and national housing trends, and then serve as important determinants of construction employment. The number of unemployed relative to working-age population in each metro (the unemployment ratio) is explained by local employment and population growth and national unemployment patterns. This unemployment ratio, which is much more stable than published metro unemployment rates, is used as an explanatory variable in many of the model’s wage equations.
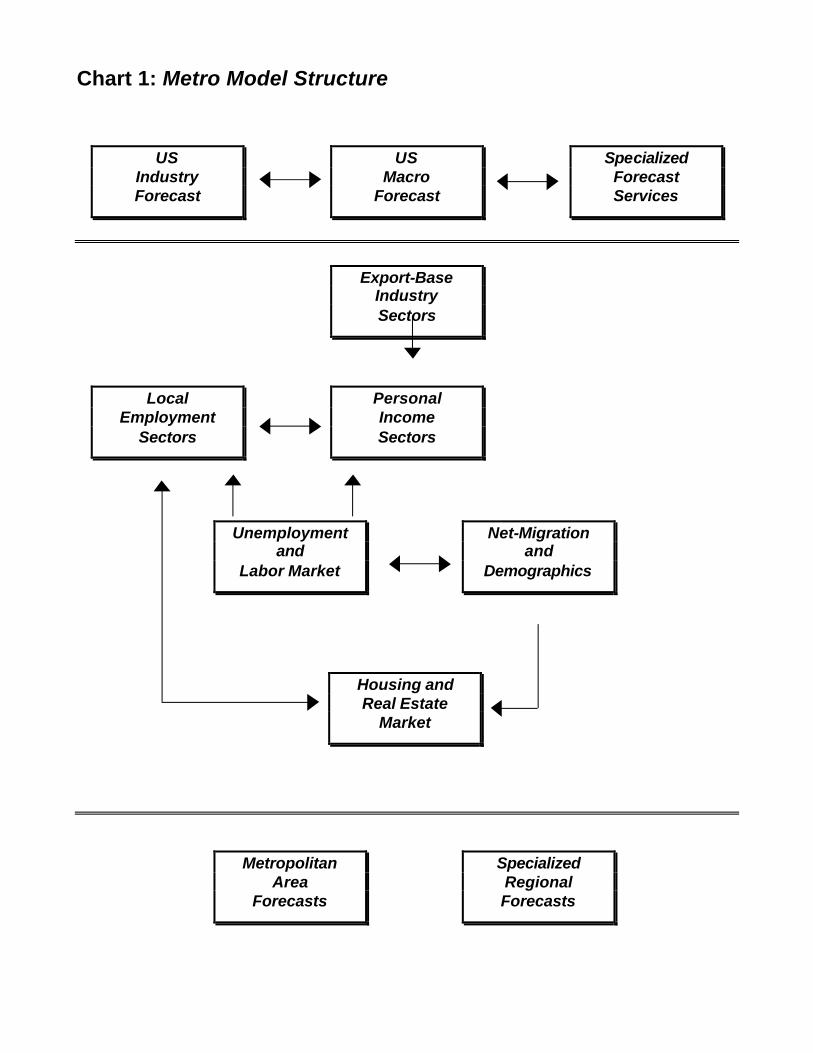
Chart 1: Metro Model Structure
US Macro
Forecast
Specialized Forecast Services
US Industry Forecast
Export-Base Industry Sectors
Local Employment
Sectors
Personal Income Sectors
Unemployment and
Labor Market
Net-Migration and
Demographics
Housing and Real Estate
Market
Metropolitan Area
Forecasts
Specialized Regional Forecasts
![中日本興業株式会社 Nakanihon kogyo Co.Ltd.€¦ · JAPANESE MOVIE JAPANESE MOVIE JAPANESE MOVIE "firFate / stay night [Heaven's Feel] Ill.spring song] MOVIE JAPANESE MOVIE](https://img.pdfslide.net/doc/110x75/608cca7f8add6d77bb46c372/oeec-nakanihon-kogyo-coltd-japanese-movie-japanese-movie.jpg)


![5 movie mas mayo [movie-mas.com]](https://img.pdfslide.net/doc/110x75/559b4a451a28ab9c678b4596/5-movie-mas-mayo-movie-mascom.jpg)