Embed Size (px)
Citation preview

1
The impact of private banknote deposit systems on the monetary income and
profit of the national central banks of the Eurosystem.
by
Gerhard Rösl1
Abstract This paper analyses the effects of private banknote deposit systems such as notes-held-to-
order (NHTO) schemes and deposit bank systems on monetary income and profit of the
national central banks (NCBs) of the Eurosystem. On the basis of an analytical framework it
can be shown that such systems can imply heavy redistributions of monetary seigniorage
income between the NCBs which ultimately cannot be justified. Furthermore, the overall loss
of monetary seigniorage income can be higher than NCBs’ cost savings from the installment
of private cash deposit systems. From an accounting point of view, this can question such
schemes in principle.
1 Regensburg University of Applied Sciences, Business Department, Seybothstrasse 2, 93053 Regensburg, Germany. E-mail: [email protected].

2
1 Introduction
In recent years more and more central banks took effort to reduce their cash costs by installing
private cash deposit systems such as notes-held-to-order (NHTO) schemes and deposit bank
systems. This paper examines the impact which the introduction of such systems has on the
redistribution of monetary income among the national central banks (NCBs) of the
Eurosystem and their profit.
The paper is structured as follows. After introducing remarks the second chapter starts by
distinguishing between various types of cash deposit systems and then the third chapter goes
on to examine the extent to which such systems change banknote circulation and thus the
basis for the creation of monetary income. The allocation effects among the NCBs that this
creates are analysed separately for notes-held-to-order systems (NHTO schemes) in chapter 4
and deposit bank systems in chapter 5 respectively. To this end, the paper develops a
theoretical analysis framework, which describes, first, the allocation effects among NCBs
when monetary income is pooled under such deposit systems and, second, formalises the
impact this has on NCB profits. This also helps identify the conditions that must be met to
avoid, or at least mitigate, any undesired allocation among the NCBs as a result of deposit
systems. With the help of this framework it is also possible to identify the criteria which have
to be met to ensure the equivalence of NHTO and deposit bank systems against the
background of seigniorage pooling within the Eurosystem. This is done in chapter 6. Section
7 summarises the results of the study.

3
2 Types of banknote deposit systems
The growing debate about a more efficient cash supply has resulted in an increasing number
of countries introducing private banknote deposit systems. The basic concept is that the
central bank instructs credit institutions or cash-in-transit companies (CITs) with holding
banknotes in custody at their premises and putting them into or withdrawing them from
circulation on behalf of its NCB. The private cash handlers often also provide other services,
such as checking the banknotes for authenticity and fitness. Another important characteristic
of such banknote deposit systems is that the institutions holding banknotes in custody on
behalf of the central bank do not incur any opportunity costs for holding the cash. In practice,
there are a large number of private banknote deposit systems, which can be categorised as
follows:2
Figure 1 Types of private banknote deposit systems
According to the ECB definition,3 an NHTO scheme is a “scheme consisting of individual
contractual arrangements between an NCB and certain credit institutions (“NHTO banks”) in
the NCB’s participating Member State, whereby the NCB
a) supplies the NHTO banks with euro banknotes which they hold in custody at their
premises for the purpose of putting them into circulation; and
b) credits the NHTO banks for euro banknotes which are deposited by their customers,
checked for authenticity and fitness, held in custody and notified to the NCB.
Banknotes transferred from the NCB to NHTO banks form part of the NCB’s created
banknotes. Banknotes held in custody by NHTO banks do not form part of the NCB’s
national net issuance of banknotes.”
NHTO banks are therefore a kind of “virtual central bank branch”, as they are not considered
the owners of the banknotes they hold in custody on behalf of the central bank. Consequently,
the stocks of banknotes held in custody by the credit institution on behalf of the central bank
2 For further information, see also the Summary of the Deposit System Seminar in Tallinn, September 2009. 3 Guideline of the European Central Bank of 11 September 2008 (ECB/2008/8) on data collection regarding the euro and the operation of the Currency Information System 2 (CIS 2), Glossary.

4
are not included in the volume of banknotes in circulation either. As the table below shows,
within the Eurosystem or the EU in general, Ireland, Malta and Slovenia currently have
typical NHTO schemes.4 In addition, there is the Extended custodial inventory programme
(ECI programme), a programme set up by the ECB, consisting of contractual arrangements
between the Eurosystem central banks and individual credit institutions (ECI banks), whereby
the ECB supplies the ECI banks with euro banknotes, which they hold in custody outside
Europe for the purpose of putting them into or withdrawing them from circulation.5
Table 1: Deposit system classification within EU
Source: Bank of Finland (2009), Summary of the Deposit System Seminar in Tallinn,
September 2009, page 3
Furthermore, there are a number of modified NHTO schemes, which in some ways do more
than simply holding cash in custody on behalf of the central bank. For example, in some
countries unsorted banknotes may also be included in the NHTO deposit, while in the United
States, for instance, only banknotes that will be required again for withdrawals within the
same working week may be submitted.6 Moreover, the transfer of ownership of the banknotes
from the credit institutions lodging/withdrawing them to/from the central bank does not
necessarily always take place on the same day that the banknotes are lodged/withdrawn.
Hence, some NCBs have introduced value date rules, whereby lodgements and withdrawals at
the central bank take place with a time lag: lodgements are credited before physical
lodgement takes place and withdrawals are debited from the NHTO bank’s central bank
4 See also Bank of Finland, Summary of the Deposit System Questionnaire 2009, Table 2 as well as the overview documents of the IWG AD HOC Group, A description of notes held to order schemes operated by central banks in the European union (2005). 5 There are currently 2 ECI schemes in Hong Kong and Singapore, which are managed by the Bundesbank on behalf of the Eurosystem. 6 See also Bank of Finland, Summary of the Deposit System Questionnaire 2009, Table 2.
Deposit system classification within EU countries
GR MT DK ECB AT NL UK SI HU SE ES FI IE Sums
Typical NHTO scheme X X X X 4
Modified NHTO system X X X X X 5
Depot scheme X X X 3
Cannot say or no response
X 1

5
account with a time lag.7 This is an attempt to compensate the participating NHTO banks for
the opportunity costs incurred by holding the cash. As the respective NCB rules differ greatly,
reference should be made to the relevant overview presentations.8 Within Europe, such
modified NHTO schemes are currently in operation in Austria, the Netherlands, the United
Kingdom, Hungary and Spain.
Deposit bank systems are another “pure” form of private banknote deposit system. The most
important difference between them and the (modified) NHTO schemes is that the deposit
banks retain ownership of the entire volume of banknotes in circulation9 and the NCB pays
interest to the deposit bank’s central bank account for a separate stock of banknotes by way of
compensation for the opportunity costs incurred by holding the banknotes. This interest-
bearing banknote stock is generally the stock that is held in the deposit bank’s vaults
overnight. However, it may also include banknotes held in ATMs. Such systems are currently
in operation in Denmark, Sweden and Finland. An interesting feature is that the Finnish
central bank pays interest on the stocks of banknotes held in custody by deposit banks on its
behalf at the one-month rate on the interbank market, whereas other central banks pay interest
based on the respective main refinancing rate of the ECB.
This directly raises the question of the extent to which the monetary income of the
Eurosystem and the central bank profits of the Eurosystem central banks are affected by the
introduction of the deposit systems described above.
3 Banknote deposit systems and their impact on banknote circulation
Installing private banknote deposit systems affects the profitability of NCBs in various ways.
For example, on the revenue side, the income of the NCBs from assets covering banknotes in
circulation and thus the allocation of the NCBs’ monetary income can change if the
introduction of such systems results in a change in banknote circulation. However, without
knowing the specifics of the banknote deposit systems, it is impossible to predict beforehand
7 The Banque centrale du Luxembourg also has in place a value date rule of this kind, although it has not actually introduced an NHTO scheme in the true sense. 8 See Bank of Finland, Summary of the Deposit System Questionnaire 2009. 9 However, the ECB points out that in practice the contracts between the NCBs and private operators do not strictly adhere to this categorical distinction. See also Summary of the Deposit System Seminar in Tallinn, September 2009, p 6.

6
whether banknote circulation will rise or fall. This is because, in practice, banknote deposit
systems complement rather than completely replacing NCBs and their branches.
For example, whether or not cash handlers can lodge their banknote holdings more quickly
and easily in a hybrid system of NHTO points and NCB branches than in a system consisting
purely of branches is crucial for the future development of banknote circulation under an
NHTO scheme. The contractionary effect of the hybrid system on the volume of banknotes in
circulation is greater, the easier it is to reach and access NHTO points compared with the
closed NCB branches. This is more likely to be the case,
the more NHTO points there are,
the longer the opening times of the NHTO points are,
the easier it is to reach the NHTO points (geographical location),
the fewer requirements there are regarding storage, collateralisation and volume
limitations of the stocks eligible for the NHTO
compared with the closed NCB branches. However, as mentioned above, the impact of an
NHTO scheme on banknote circulation can be cancelled out or even reversed if the NHTO
scheme is an inadequate replacement of the previous branch system.
In the case of deposit bank systems, too, the resulting hybrid system of deposit banks and
NCB branches does not necessarily lead to a change in banknote circulation. The deposit
banks have less incentive to reduce their surplus cash holdings by quickly lodging them at the
NCB branches the more of these holdings are counted towards the NCB deposit. And since
the deposit banks retain ownership of these surplus banknote holdings, the volume of
banknotes in circulation can increase sharply as a result of hoarding in the wake of the
changeover in the cash supply system. This is because the deposit banks do not incur
opportunity costs on surplus banknote holdings owing to the interest payments made by the
central bank on the banknotes held in custody. Nevertheless, the example of Finland shows
that if the contracts between the central bank and the deposit banks are properly worded, there
can even be a significant reduction in the volume of banknotes in circulation. Naturally, the
amount of eligible banknote holdings at the deposit banks plays a crucial role.

7
The following diagrammatic breakdown of banknote circulation presents the basic channels
through which deposit systems influence banknote circulation (BNC). If banknote circulation
is conceptually divided into domestic (in the sense of national or within the euro area) and
foreign banknote circulation, it appears appropriate to assume that national cash deposit
systems initially only influence the domestic circulation of cash. Banknote circulation outside
the euro area should conceptually be assigned to the ECB’s ECI programme as the
supranational NHTO scheme.
Figure 2: Conceptual breakdown of banknotes in circulation
Domestic banknote circulation can, in turn, be broken down into banknote holdings in the
hands of commercial banks (BNCCB), which store them in ATMs, vaults on their premises
(including automated cash dispensers (ACD) and in national cash centres, and into banknotes
in circulation held by non-banks (BNCNB). Depending on the specific design of the deposit
system, credit institutions’ cash balances respond immediately to the introduction of NHTO
schemes or deposit bank systems as their holdings are eligible. However, in the case of non-
banks, probably only the transaction balances of retailers and service providers (BNUC) are
affected. The possibility of disposing of surplus cash holdings comparatively faster results in
average cash holdings tending to decrease and thus to a declining volume of banknotes in
circulation in the hands of these holders of money. The cash holdings of households (BNUH)
and general government (BNUGG) are unlikely to be affected by the installation of deposit
systems.

8
4 Impact of NHTO schemes on the allocation of monetary income and central bank
profits in the Eurosystem
In the following section, it is always assumed that Eurosystem NCBs that introduce NHTO
schemes see a decline in the volume of banknotes in circulation. This seems to be the most
likely scenario, as experience shows that central banks take corrective action relatively
quickly if the NHTO scheme does not yield the desired cost savings.10 The allocation effects
with regard to the pooling of monetary income that result from a decline in the volume of
banknotes in circulation are described mathematically, and then various methods are used to
simulate and calculate the allocation effects for individual NCBs. Finally, the question is
addressed as to how the respective decline in monetary income caused by NHTO schemes and
NHTO-induced cost reductions is reflected in the NCBs’ profits.
4.1 Analytical framework
To ensure that the analysis remains clear and concise, simplifying assumptions are made.11 It
shall be assumed that the contributions made by the NCBs to the pool, ie monetary income,
stem solely from interest on assets that are held against the banknotes in circulation issued by
the respective NCB as “earmarked assets”. It is not difficult to justify this assumption as it is
easy to demonstrate that the interest on the relevant intra-Eurosystem balances and on NCBs’
liabilities to credit institutions (items 2, 3, 4 and 6 of the liability base) means that, in practice,
the liability base for calculating monetary income is effectively reduced to banknote
circulation.12 Furthermore, non-interest-bearing gold receivables shall not be included as they
do not alter the net allocation arising from the pooling of monetary income among the
NCBs.13 The in any case artificial balance sheet ex post allocation of aggregated banknote
circulation to the NCBs and the ECB (Capital Share Mechanism, CSM), which then results in
corresponding intra-Eurosystem claims and liabilities from banknote circulation among the
10 Nevertheless, the following mathematical description also permits an analysis of the impact of NHTO schemes and deposit bank systems on the allocation of monetary income if the NCB’s banknote circulation increases as a result of the scheme’s design. 11 A detailled analysis of the creation and allocation of monetary income is provided by Rösl (2012). For the discussion on the redistribution effects of socialising pre-EMU-assets of the NCBs see Sinn, H.-W./Feist, H. (1997), Sinn, H.-W. (1997), Rösl, G./Schäfer W. (2000), Sinn, H.-W./Feist, H. (2000) and Rösl, G. (2002). 12 The Eurosystem receives additional net monetary income from a positive difference between the interest income from assets that are held against credit institutions’ deposits and the interest expenditure which NCBs pay on these deposits, such as interest income from Eurosystem monetary policy claims and interest expenditure from interest on the deposit facility and non-interest-bearing excess reserves. However, apart from during the financial crisis, credit institutions held only relatively few deposits with the Eurosystem. 13 For proof, see Rösl (2002), p 217.

9
central banks, can also easily be disregarded. Thus, for the purposes of this analysis, the ECB,
which in practice does not issue any banknotes anyway, is not considered a banknote issuer.14
Therefore, only NCBs’ banknote circulation according to their actual issuance remains as a
liability base in the balance sheets. Initially, we will abstract from the existence of NHTO
schemes.
The monetary income and the individual contribution to the pool made by each national
central bank is thus the product of the banknotes in circulation iB issued by an NCB i
multiplied by the uniform main refinancing rate for all NCBs r:
rBP ii . (pool financing contribution of the NCB i, no NHTO)
The sum of monetary income (= pool mass) corresponds to the interest income of the NCBs
from the issuance of the aggregate banknotes in circulation B:
n
ii
n
ii rBrBPP
11
. (Pool mass, no NHTO)
As is well-known, the allocation of the pool mass takes place in accordance with the shares of
the NCBs k in the capital of the ECB ( 11
n
iik with 10 ik ). An NCB i therefore receives
the following amount from the pool
rBki . (amount distributed to NCB i, no NHTO)
The net position of the respective NCB in the pooling of monetary income is therefore
rBkrBx iii . (net contribution to the pool of NCB i, no NHTO)
The sum of the net contributions to the pool is zero, ie the accumulated monetary income is
distributed in full to the NCBs:15
14 It can be shown that the ex post allocation of banknotes in favour to the ECB’s balance sheet does not affect the effective net pooling position of the NCBs within the pooling of monetary income of the Eurosystem. 15 In practice, the ECB can access the monetary income of the NCBs to finance provisions and cover a possible ECB loss. Within this analytical framework, this can be interpreted as using monetary income that has already been distributed to the NCBs.
10
01111
rBrBrBkrBxn
ii
n
i
n
ii
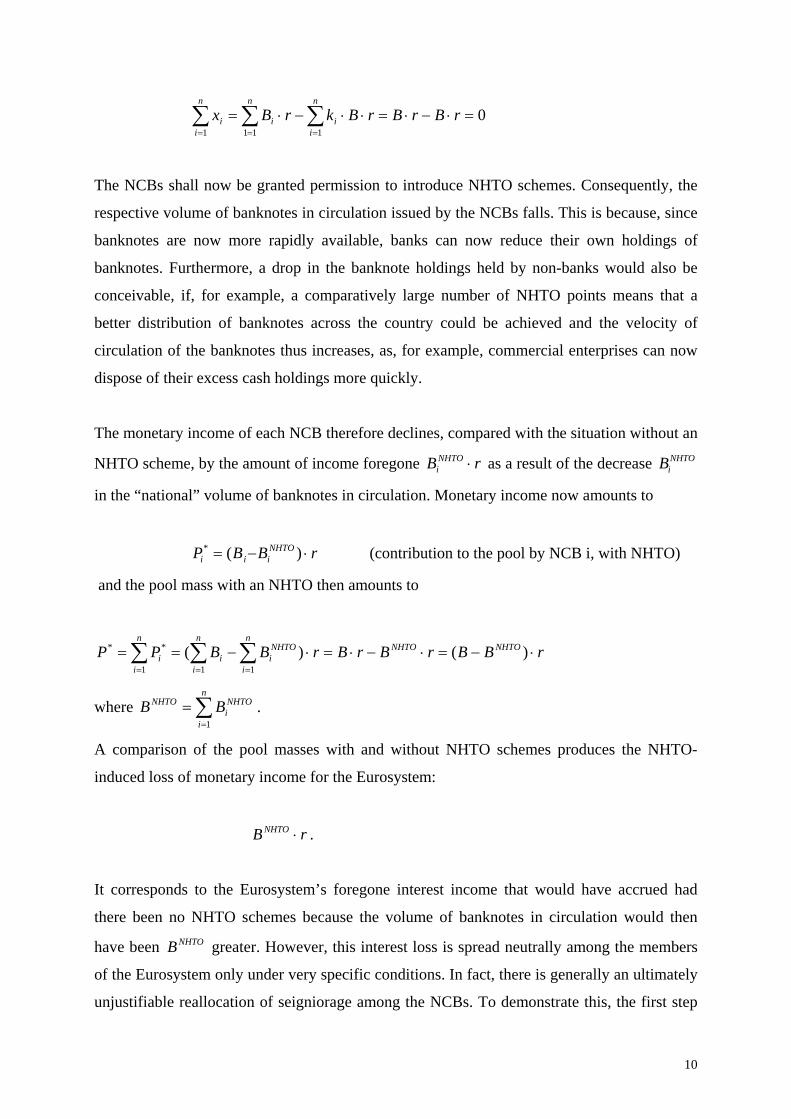
The NCBs shall now be granted permission to introduce NHTO schemes. Consequently, the
respective volume of banknotes in circulation issued by the NCBs falls. This is because, since
banknotes are now more rapidly available, banks can now reduce their own holdings of
banknotes. Furthermore, a drop in the banknote holdings held by non-banks would also be
conceivable, if, for example, a comparatively large number of NHTO points means that a
better distribution of banknotes across the country could be achieved and the velocity of
circulation of the banknotes thus increases, as, for example, commercial enterprises can now
dispose of their excess cash holdings more quickly.
The monetary income of each NCB therefore declines, compared with the situation without an
NHTO scheme, by the amount of income foregone rBNHTOi as a result of the decrease NHTO
iB
in the “national” volume of banknotes in circulation. Monetary income now amounts to
rBBP NHTOiii )(* (contribution to the pool by NCB i, with NHTO)
and the pool mass with an NHTO then amounts to
rBBrBrBrBBPP NHTONHTOn
i
NHTOi
n
ii
n
ii
)()(111
**
where
n
i
NHTOi
NHTO BB1
.
A comparison of the pool masses with and without NHTO schemes produces the NHTO-
induced loss of monetary income for the Eurosystem:
rB NHTO .
It corresponds to the Eurosystem’s foregone interest income that would have accrued had
there been no NHTO schemes because the volume of banknotes in circulation would then
have been NHTOB greater. However, this interest loss is spread neutrally among the members
of the Eurosystem only under very specific conditions. In fact, there is generally an ultimately
unjustifiable reallocation of seigniorage among the NCBs. To demonstrate this, the first step

11
is to determine the net contribution to the pool by the respective NCB i for the scenario with
NHTO schemes:
rBBkrBBx NHTOi
NHTOiii )()(* (net contribution to the pool of NCB i),
where the sum of the net pool positions is once again zero ( 01
*
n
iix ). Nevertheless, an NCB
can receive NHTO-induced interest subsidy payments from other NCBs or can be forced to
make NHTO-induced subsidy payments to other NCBs. The individual position of an NCB i
in this NHTO-induced inter-NCB subsidy system can be calculated using the difference in the
net pool positions with and without an NHTO scheme:
rBkBrBkrBxxx NHTOi
NHTOi
NHTOi
NHTOiiii )(~ * .
(Net position of NCB i in the NHTO-induced inter-NCB subsidy system).
Hence, an NCB i receives an NHTO-induced subsidy from the other NCBs if the loss of
monetary income generated for the entire Eurosystem as a result of the introduction of the
national NHTO scheme ( rBNHTOi ) is greater than the NCB i’s participation in the losses of
monetary income arising from the sum of the NHTO schemes of all NCBs ( rBk NHTOi ). In
other words, an NCB is a “winner” in the NHTO-induced subsidy system if its national share
in the NHTO-induced reduction in the volume of banknotes in circulation in the Eurosystem
is greater than its ECB capital share ( iNHTONHTO
i kBB / ). Such “profits" or, more precisely,
“avoided NHTO-induced losses” of monetary income for an NHTO-NCB are, of course,
financed by the other Eurosystem NCBs. The following calculation shows that this is in fact a
zero-sum game.
0)(~1
*
11
*
1
n
ii
n
ii
n
iii
n
ii xxxxx .
What would an NHTO scheme need to look like to ensure that it causes no NHTO-induced
redistribution of monetary income among the NCBs in the Eurosystem? The equation for
calculating the net pool position for any NCB i derived above provides the basis for
answering this question:
rBkBx NHTOi
NHTOii )(~ .

12
If this equation is set to zero, three potential solutions are found:16
1. The ECB sets the main refinancing rate to zero ( 0r ). This would mean that both the
credit institutions and the non-banks would incur no opportunity costs for holding
central bank money, as they would receive the banknotes free of charge as it were.
There would be no monetary income and therefore also no redistribution problems
owing to the NHTO scheme. However, overriding monetary policy reasons mean this
possibility cannot be implemented in practice.
2. The ECB bans NHTO schemes in all countries ( 0 NHTONHTOi BB ). In practice, this
possibility also appears to be unrealistic, as some NCBs have already introduced such
NHTO schemes and other NCBs are apparently considering setting up such a scheme.
3. The ECB ensures that all NCBs introduce an NHTO scheme and that each NCB’s
national share in the NHTO-induced decline in the volume of banknotes in circulation
in the Eurosystem corresponds to its ECB capital share ( iNHTONHTO
i kBB / ).
Finally, the impact of NHTO schemes on the NCBs’ operating result, ie on the central bank
profit after pooling of monetary income and taking account of NHTO-induced cost savings, is
to be formalised. On the income side, the NHTO-induced drop in monetary income for an
NCB i amounts to ( rBk NHTOi ). This compares to NHTO-induced cost savings of
NHTOiBl on the expenditure side. In simplified terms, a linear total costs function of cash
operations (with l as a measure of unit costs per banknote) is assumed. The NHTO-induced
change in the NCB’s operating result therefore amounts to
rBkBlZ NHTOi
NHTOii (NHTO-induced change in NCB operating result)
An NCB can thus improve its operating result by introducing an NHTO scheme, if the cost
savings from introducing its own NHTO scheme ( NHTOiBl ) are greater than the ensuing
decline in monetary income ( rBk NHTOi ).
4.2 NHTO-induced redistribution of monetary income among the NCBs
16 The fourth possibility, namely that the Eurosystem consists of one NCB only ( 11 k and thus by inference
NHTONHTOi BB
) is ruled out by definition here.
13
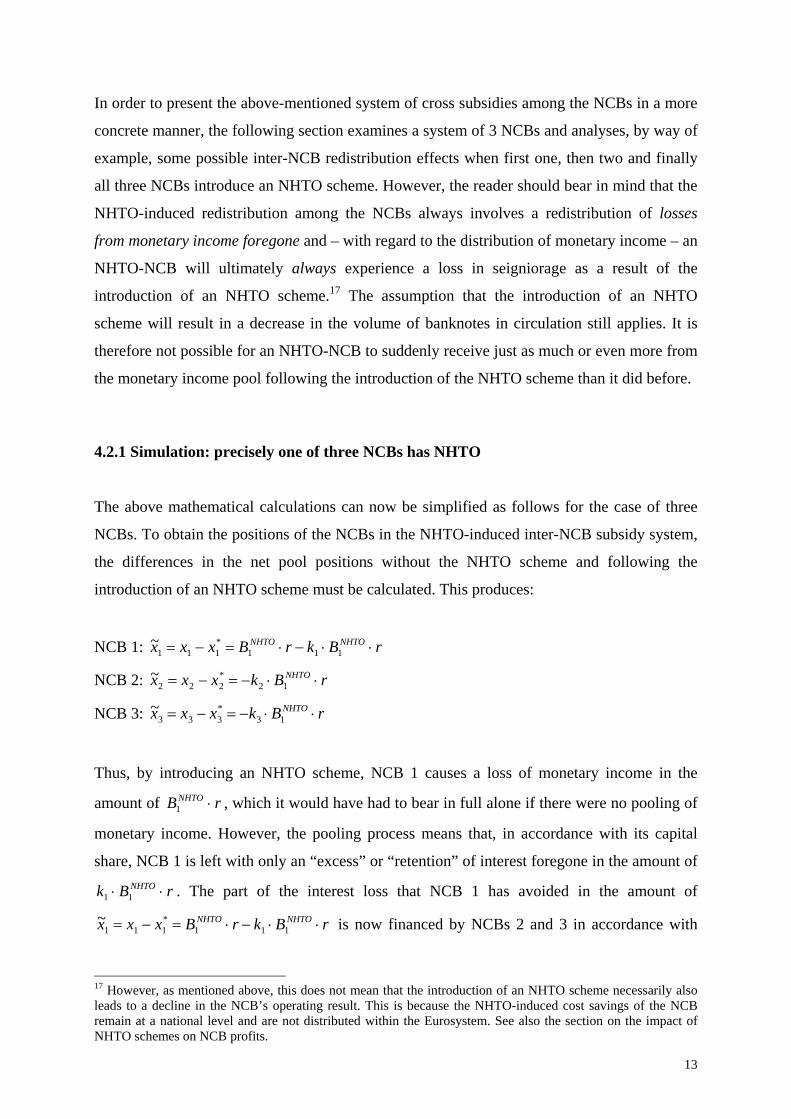
In order to present the above-mentioned system of cross subsidies among the NCBs in a more
concrete manner, the following section examines a system of 3 NCBs and analyses, by way of
example, some possible inter-NCB redistribution effects when first one, then two and finally
all three NCBs introduce an NHTO scheme. However, the reader should bear in mind that the
NHTO-induced redistribution among the NCBs always involves a redistribution of losses
from monetary income foregone and – with regard to the distribution of monetary income – an
NHTO-NCB will ultimately always experience a loss in seigniorage as a result of the
introduction of an NHTO scheme.17 The assumption that the introduction of an NHTO
scheme will result in a decrease in the volume of banknotes in circulation still applies. It is
therefore not possible for an NHTO-NCB to suddenly receive just as much or even more from
the monetary income pool following the introduction of the NHTO scheme than it did before.
4.2.1 Simulation: precisely one of three NCBs has NHTO
The above mathematical calculations can now be simplified as follows for the case of three
NCBs. To obtain the positions of the NCBs in the NHTO-induced inter-NCB subsidy system,
the differences in the net pool positions without the NHTO scheme and following the
introduction of an NHTO scheme must be calculated. This produces:
NCB 1: rBkrBxxx NHTONHTO 111*111
~
NCB 2: rBkxxx NHTO 12*222
~
NCB 3: rBkxxx NHTO 13*333
~
Thus, by introducing an NHTO scheme, NCB 1 causes a loss of monetary income in the
amount of rB NHTO 1 , which it would have had to bear in full alone if there were no pooling of
monetary income. However, the pooling process means that, in accordance with its capital
share, NCB 1 is left with only an “excess” or “retention” of interest foregone in the amount of
rBk NHTO 11 . The part of the interest loss that NCB 1 has avoided in the amount of
rBkrBxxx NHTONHTO 111*111
~ is now financed by NCBs 2 and 3 in accordance with
17 However, as mentioned above, this does not mean that the introduction of an NHTO scheme necessarily also leads to a decline in the NCB’s operating result. This is because the NHTO-induced cost savings of the NCB remain at a national level and are not distributed within the Eurosystem. See also the section on the impact of NHTO schemes on NCB profits.

14
their capital shares by foregoing monetary income they would have received in a scenario
with no pooling ( rBk NHTO 12 and rBk NHTO 13 , respectively).
The following sample calculation illustrates the above considerations. Thereby, it is
additionally assumed that the three NCBs in the Eurosystem have an identical ECB capital
share of 1/3 each and in the beginning an identical monetary base of 100 and as a reference
scenario no NHTO scheme is installed. Given a main refinancing rate (r) of 10% and an
aggregate monetary base of 300, the monetary income pool would be 30. Each of the NCBs
would finance one-third of the pool in accounting terms and receive one-third of the
distribution. There would be no allocation of seigniorage among the NCBs.
However, if – as assumed here – NCB 1 introduces an NHTO scheme in isolation, the
resident credit institutions can now permanently lodge banknotes in the amount of 30 at the
NHTO, causing the “national” volume of banknotes in circulation to fall by this amount.
Table 2: Simulation of NHTO-induced effects on monetary income, precisely one of three
NCBs has NHTO
The national monetary base in country 1 now amounts to only 70 and NCB 1’s contribution to
the pool decreases by 3 from 10 to 7. This loss of monetary income must now be borne by all
NCBs in accordance with their respective capital share (in this case, each must bear one-
NCB1 NCB2 NCB3 Total Pool (P)
Capital share (ki) 0.333 0.333 0.333 1.000 27.0
National share in total NHTO-induced decline in the volume of banknotes in circulation in the Eurosystem
(BiNHTO
/BNHTO
) 1.000 0.000 0.000 1.000Interest rate (r)
Monetary base without NHTO (Bi) 100.0 100.0 100.0 300.0 0.1
NHTO-induced decline in the monetary
base (BiNHTO
) 30.0 0.0 0.0 30.0
Monetary base with NHTO (Bi - BiNHTO
) 70.0 100.0 100.0 270.0
Contribution to the pool
Pi = (Bi - BiNHTO
)*r 7.0 10.0 10.0 27.0
Amount distributed (ki*P) 9.0 9.0 9.0 27.0
Change in monetary income caused by
NHTO (-ki*BNHTO*r) -1.0 -1.0 -1.0 -3.0
Inter-NCB subsidy (balance) xi-xi* 2.0 -1.0 -1.0 0.0
Change in seigniorage for NHTO
without EMU (-BiNHTO
* r) -3.0 0.0 0.0 -3.0

15
third). Consequently, the amount distributed to the NCBs declines by 1 in each case, from 10
to 9 due to the introduction of the NHTO scheme. However, from an opportunity point of
view, this process leads to NCBs 2 and 3 subsidising NCB 1. This is because, in a world
without pooling of monetary income, the interest loss caused by the introduction of the NHTO
scheme of 3 would have been borne in full by NCB 1. As the pooling process means that
NCB 1 only suffers a drop in monetary income of 1, it receives an inter-NCB subsidy of 2,
which is financed on a pro rata basis by NCBs 2 and 3, with each foregoing interest of 1.
In line with the theoretical considerations, the positive net position in the amount of 2
)2~( *111 xxx of NCB 1 in the NHTO-induced inter-NCB subsidy system can thus be
broken down into the interest loss which NCB 1 would have had to bear alone without
pooling of monetary income ( 31 rBNHTO ) less the share of the loss arising from the
reduction in the pool mass to be borne by NCB 1 after pooling ( 111 rBk NHTO ). This
subsidy payment in favour of NCB 1 is financed through the loss participation of NCBs 2 and
3 in the amount of 1~12
*222 rBkxxx NHTO or 1~
13*333 rBkxxx NHTO in
the form of monetary income foregone. Generalising this result, it can be said that each
NHTO-NCB forces the other NCBs to make subsidy payments, as the decline in the volume
of banknotes in circulation means that the NHTO-NCB socialises the resulting seigniorage
loss. In a system with precisely one NHTO-NCB, the latter is consequently the sole net
subsidy recipient in the NHTO-induced inter-NCB subsidy system.
4.2.2 Simulation: precisely two of three NCBs have NHTO
However, in a system of several NHTO-NCBs, the NHTO-induced net allocation effects
among Eurosystem NCBs can no longer be clearly determined beforehand. It therefore cannot
simply be claimed that each individual NHTO-NCB will indeed always receive net NHTO-
induced subsidy payments from the other Eurosystem NCBs. It can only be stated that the
sum of the NHTO-NCBs will receive such implied net payments from non-NHTO-NCBs. This
is because, following the introduction of their respective national NHTO schemes, the NHTO-
NCBs force one another to make gross subsidy payments. As the next example shows, this
can result in one NCB (below, NCB 2) becoming an NHTO-induced net subsidy payer even if
it introduces an NHTO scheme itself and thus imposes gross interest losses on other NCBs.
By contrast, those NCBs that categorically reject an NHTO scheme always become net

16
subsidy payers (see NCB 3) as soon as just one NCB introduces an NHTO scheme. In the
following sample calculation, the same conditions apply as in the previous simulation
(identical NCB monetary bases and capital shares) but with one difference, namely that NCB
1 is now assumed to have sustained an NHTO-induced reduction in the volume of banknotes
in circulation in the amount of 43 and NCB 2 introduces an NHTO scheme, which causes a
decline in its “national” volume of banknotes in circulation in the amount of 20.
Table 3: Simulation of NHTO-induced effects on monetary income, precisely two of three
NCBs have NHTO, net subsidy payments by NCB2 despite own NHTO
The resulting positions of the NCBs in the NHTO-induced inter-NCB subsidy system are now
formally as follows:
NCB 1: rBkrBrBkrBkrBxxx NHTONHTONHTONHTONHTO 1121111*111
~
Overall, NCB 1 receives from the other NCBs in the central bank system an implied NHTO-
induced subsidy payment in the form of seigniorage losses avoided in the amount of
2.2~ *111 xxx . This is because, if NCB 1 had introduced a national NHTO scheme in
isolation, ie with no pooling of monetary income, it would have sustained interest losses in the
amount of 3.41 rBNHTO . However, its effective seigniorage loss in the form of lower
NCB1 NCB2 NCB3 Total Pool (P)
Capital share (ki) 0.333 0.333 0.333 1.000 23.7
National share in total NHTO-induced decline in the volume of banknotes in circulation in the Eurosystem
(BiNHTO
/BNHTO
) 0.683 0.317 0.000 1.000Interest rate (r)
Monetary base without NHTO (Bi) 100.0 100.0 100.0 300.0 0.1
NHTO-induced decline in the
monetary base (BiNHTO
) 43.0 20.0 0.0 63.0
Monetary base with NHTO (Bi - BiNHTO
) 57.0 80.0 100.0 237.0
Contribution to the pool
Pi = (Bi - BiNHTO
)*r 5.7 8.0 10.0 23.7
Amount distributed (ki*P) 7.9 7.9 7.9 23.7
Change in monetary income caused
by NHTO (-ki*BNHTO*r) -2.1 -2.1 -2.1 -6.3
Inter-NCB subsidy (balance) xi-xi* 2.2 -0.1 -2.1 0.0
Change in seigniorage for NHTO
without EMU (-BiNHTO
* r) -4.3 -2.0 0.0 -6.3

17
monetary income now amounts to only 2.1. This decline in monetary income for NCB 1
)1.23.63/1( 1 rBk NHTO is the result of the participation of NCB 1 ( 3/11 k ) in the
NHTO-induced interest loss of the entire Eurosystem ( 3.6 rBNHTO ) and can be
subdivided into the participation of NCB 1 in the NHTO-induced interest loss it generated
itself ( 43.111 rBk NHTO ) and its participation in the NHTO-induced interest loss
generated by NCB 2 ( 67.021 rBk NHTO ). The latter arises as, in this example, NCB 2 has
now also introduced an NHTO scheme, resulting in a decline in the volume of banknotes in
circulation, and NCB 2 forces NCB 1 to make an NHTO-induced subsidy payment in
accordance with its capital share.
NCB 2: rBkrBrBkrBkrBxxx NHTONHTONHTONHTONHTO 2222122*222
~
Although it has introduced an NHTO scheme itself and should therefore tend to be a net
recipient of subsidy payments, NCB 2 must now make net transfers of 0.1 to NCB 1. While
the national NHTO scheme would in any case have lowered the monetary income of NCB 2
by 2.0 in a world without monetary union ( 0.22 rB NHTO ), this is only a consolation in
part, as the pooling of monetary income results in NCB 2 sustaining a reduction in monetary
income of 2.1 ( 1.22 rBk NHTO ). Thus, in accordance with its capital share, NCB 2 must
participate in the NHTO-induced losses in monetary income following the introduction of an
NHTO scheme at NCB 1 in the amount of 43.112 rBk NHTO
and, at the same time, it
must bear the “excess” of the interest losses in the amount of 67.022 rBk NHTO
caused
by its own NHTO scheme ( 1.222212 rBkrBkrBk NHTONHTONHTO ).
NCB 3: rBkrBkrBkxx NHTONHTONHTO 32313*33
NCB 3, which has not introduced an NHTO scheme of its own, turns out to be the biggest net
payer in the NHTO-induced subsidy system among the NCBs in this example. In accordance
with its capital share, it must bear both the NHTO-induced interest losses generated by NCB 1
( 43.113 rBk NHTO ) and the NHTO-induced interest losses generated by NCB 2
)67.0( 23 rBk NHTO . As NCB 3 has not introduced an NHTO scheme, the interest losses
of which it would have been able to pass on to NCBs 1 and 2 on a pro rata basis at

18
313/2 k , it must bear the full NHTO-induced interest loss of the entire central bank
system alone ( 1.23 rBk NHTO ).
Nevertheless, it is quite conceivable that – as long as not all NCBs introduce an NHTO
scheme – all NHTO-NCBs will receive net subsidy payments from the non-NHTO-NCBs.
This will be the case wherever the national share in the NHTO-induced decline in the volume
of banknotes in circulation in the central bank system is, for all NHTO-NCBs, larger than their
respective ECB capital share ( iNHTONHTO
i kBB / ). The following sample calculation shows
such a constellation.
Table 4: Simulation of NHTO-induced effects on monetary income, precisely two of three
NCBs have NHTO, no net subsidy payments by both NHTO-NCBs
A detailed analysis of the NHTO-induced redistribution effects will not be carried out here, as
it is immediately clear that NCB 3, as the only non-NHTO-NCB, finances all of the intra-
Eurosystem subsidy payments in favour of the NHTO-NCBs by foregoing interest in the
amount of 2.8.
4.2.3 Simulation: all three NCBs have NHTO
However, if all NCBs introduce an NHTO which reduces the volume of banknotes in
circulation, this does not necessarily lead to net subsidy payments among the NCBs. This can
NCB1 NCB2 NCB3 Total Pool (P)
Capital share (ki) 0.333 0.333 0.333 1.000 21.7
National share in total NHTO-induced decline in the volume of banknotes in circulation in the Eurosystem
(BiNHTO
/BNHTO
) 0.518 0.482 0.000 1.000Interest rate (r)
Monetary base without NHTO (Bi) 100.0 100.0 100.0 300.0 0.1
NHTO-induced decline in the
monetary base (BiNHTO
) 43.0 40.0 0.0 83.0
Monetary base with NHTO (Bi - BiNHTO
) 57.0 60.0 100.0 217.0
Contribution to the pool
Pi = (Bi - BiNHTO
)*r 5.7 6.0 10.0 21.7
Amount distributed (ki*P) 7.2 7.2 7.2 21.7
Change in monetary income caused
by NHTO (-ki*BNHTO*r) -2.8 -2.8 -2.8 -8.3
Inter-NCB subsidy (balance) xi-xi* 1.5 1.2 -2.8 0.0
Change in seigniorage for NHTO
without EMU (-BiNHTO
* r) -4.3 -4.0 0.0 -8.3

19
be demonstrated by having another look at the mathematical description of the net position of
an NCB i in the NHTO-induced inter-NCB subsidy system:
rBkBrBkrBxxx NHTOi
NHTOi
NHTOi
NHTOiiii )(~ *
An NCB has a neutral position in the NHTO-induced inter-NCB subsidy system if the interest
loss for the Eurosystem, which the NCB generates by introducing a national NHTO scheme,
)( rBNHTOi is equal in size to the NCB’s participation in the cumulated interest loss, which
results from the sum of all the NHTO schemes of the NCBs (including the NCB’s own NHTO
scheme) ( NHTOi Bk ). In other words: an NCB is “neutral” in the NHTO-induced subsidy
system if its national share in the NHTO-induced drop in the volume of banknotes in
circulation in the Eurosystem corresponds to its ECB capital share ( iNHTONHTO
i kBB / ). If this
condition is fulfilled for all NCBs, then the net positions of the NCBs are all zero – as
confirmed by the following example.
Table 5: Simulation of NHTO-induced effects on monetary income, all NCBs have NHTO, no
net subsidy payments despite NHTO
The above demonstrates that there will necessarily be NHTO-induced subsidy payments
among the NCBs if not all of the NCBs introduce such a scheme that reduces the volume of
banknotes in circulation. Each individual NCB that does not introduce such an NHTO scheme
becomes a net payer, while the NHTO-NCBs in sum are winners. Whether each NHTO-NCB
does actually receive net subsidy payments depends, in turn, on whether the national share in
NCB1 NCB2 NCB3 Total Pool (P)
Capital share (ki) 0.333 0.333 0.333 1.000 18.0
National share in total NHTO-induced decline in the volume of banknotes in circulation in the Eurosystem
(BiNHTO
/BNHTO
) 0.333 0.333 0.333 1.000Interest rate (r)
Monetary base without NHTO (Bi) 100.0 100.0 100.0 300.0 0.1
NHTO-induced decline in the monetary
base (BiNHTO
) 40.0 40.0 40.0 120.0
Monetary base with NHTO (Bi - BiNHTO
) 60.0 60.0 60.0 180.0
Contribution to the pool
Pi = (Bi - BiNHTO
)*r 6.0 6.0 6.0 18.0
Amount distributed (ki*P) 6.0 6.0 6.0 18.0
Change in monetary income caused by
NHTO (-ki*BNHTO*r) -4.0 -4.0 -4.0 -12.0
Inter-NCB subsidy (balance) xi-xi* 0.0 0.0 0.0 0.0
Change in seigniorage for NHTO
without EMU (-BiNHTO
* r) -4.0 -4.0 -4.0 -12.0

20
the total NHTO-induced decline in the volume of banknotes in circulation in the Eurosystem
is greater than the corresponding ECB capital share of the NHTO-NCB. However, it would at
least theoretically be possible to introduce an NHTO scheme that does not generate NHTO-
induced net subsidy payments among the NCBs. The ECB would have to ensure that all
NCBs introduce an NHTO scheme and that each NCB’s national share in the NHTO-induced
fall in the volume of banknotes in circulation in the Eurosystem corresponds to its ECB
capital share. But it is likely to prove fairly difficult to implement this rule in practice.
4.3 Calculations of the NHTO-induced subsidy payments within the Eurosystem and the
changes in monetary income following the introduction of NHTO schemes
The following calculations show the impact on the monetary income of the Eurosystem that
would be expected if such a system were to be introduced throughout the euro area. Such a
scenario is unlikely to occur in this form anytime soon, but it shows the maximum NHTO-
induced seigniorage losses that the Eurosystem could sustain and the allocation effects among
the NCBs that such a system would imply. The calculations are based on the average annual
cash balances of the credit institutions in 2009 with an assumed main refinancing rate of
2.5%. In such an extreme scenario, the Eurosystem would lose out on monetary income in the
amount of just under €1.3 billion per year, as the volume of euro banknotes in circulation
would decline by the amount of the credit institutions’ cash balances of just over €51 billion
which in turm can be interpreted as a measure of the present value of all future and present
NHTO-induced losses in monetary income for the Eurosystem.
Table 6: All NCBs introduce an NHTO scheme, NHTO-induced decline in credit institutions’
cash balances of 100%

21
The Bundesbank would sustain an annual decline in monetary income, in accordance with its
ECB capital share of 27.13%, of €348 million. Surprisingly, the German central bank would
even receive implied NHTO-induced net subsidy payments of €17 million annually from the
other Eurosystem NCBs. This is because, with no pooling of monetary income, its monetary
income would have declined by as much as 365€%5.2605,14 rBNHTOD million. Yet, since
German credit institutions hold 28.48% of all cash balances of banks in the Eurosystem and
thus the Bundesbank would absorb 28.48% of the decline in the aggregate volume of
banknotes in circulation in the Eurosystem, but would participate in the NHTO-induced
overall interest loss for the Eurosystem in the amount of 27.13% only (= German ECB capital
share), all other things being equal, the Bundesbank would therefore avoid an interest loss of
€17 million per year. However, the above table also shows that the NHTO-induced NCB
subsidy payments would probably generally remain within fairly narrow bounds if all
Eurosystem central banks were to introduce an NHTO scheme. This would be the case at least
if there were no discrimination among the NHTO schemes within the euro area with regard to
administrative rules (opening times, lodgement and withdrawal conditions etc). Then the
distribution of the cash balances of the credit institutions in the individual euro-area countries
would probably remain quite similar to the monetary income allocation key. Admittedly, the
above picture suddenly changes if not all NCBs introduce an NHTO scheme resulting in a
decline in the volume of banknotes in circulation.
SLK AT BE FI FR GR IE ITCapital share (ki ) since 1.1.2009 0.99% 2.78% 3.48% 1.80% 20.38% 2.82% 1.59% 17.91%
National share in total NHTO-induced decline in credit institutions’ cash balances
(BiNHTO
/BNHTO
) 1.16% 4.41% 3.23% 0.54% 13.74% 4.27% 2.17% 19.25%
NHTO-induced decline (of 100%) in credit
institutions’ cash balances (BiNHTO
) in €
million, all NCBs have NHTO 596 2,263 1,657 275 7,047 2,189 1,113 9,875Change in monetary income as a result of NHTO in € million -13 -36 -45 -23 -261 -36 -20 -230Net subsidy balance in € million 2 21 -3 -16 -85 19 7 17
LU MT NL PT SLO ES CYP D Eurosystem Interest rateCapital share (ki ) since 1.1.2009 0.25% 0.09% 5.71% 2.51% 0.47% 11.90% 0.20% 27.13% 100.00% 2.50%
National share in total NHTO-induced decline in credit institutions’ cash balances
(BiNHTO
/BNHTO
) 0.55% 0.12% 3.58% 2.94% 0.42% 14.60% 0.54% 28.48% 100.00%
NHTO-induced decline (of 100%) in credit
institutions’ cash balances (BiNHTO) in €
million, all NCBs have NHTO 282 60 1,838 1,507 217 7,488 275 14,605 51,286Change in monetary income as a result of NHTO in € million -3 -1 -73 -32 -6 -153 -3 -348 -1,282Net subsidy balance in € million 4 0 -27 6 -1 35 4 17 0

22
If it is assumed that all NCBs in the Eurosystem introduce an NHTO scheme and this results
in a decline in the cash balances of credit institutions of 50% or even 10%18, the drop in the
volume of banknotes in circulation with corresponding losses of monetary income in the
amount of €641 million or €128 million per year given an assumed annual interest rate of
2.5%. The lion’s share of these seigniorage losses would once again be borne by the Deutsche
Bundesbank with a decline in monetary income of €174 million and €35 million per year,
respectively. However, the Bundesbank would again receive implied NHTO-induced subsidy
payments from the other Eurosystem NCBs in the amount of €9 million and €2 million per
year. The biggest payer of transfers would be the Banque de France with intra-Eurosystem net
subsidy payments in the amount of €43 million and €9 million per year, respectively.
As a next step, we will analyse the possible effects on monetary income which could arise as
a result of the lower volume of banknotes in circulation if retailers and service providers could
dispose of their cash holdings more quickly under the NHTO schemes. However, this analysis
is much more difficult than the previous analysis of the change in credit institutions’ cash
balances, as the size of the transaction balances of retailers and service providers in the
respective euro-area countries is not clear. However, studies for Germany indicate that,
measured against the total volume of banknotes in circulation, these holdings are likely to be
comparatively small.19 Thus the value of the transaction balances held by retailers and service
providers, which was estimated on the basis of sectoral sales data for 2007, amounted to only
just over €2 billion, while the cash balances of credit institutions and the transaction balances
of households and general government each accounted for around €14 billion. At that point in
time, the cash balances of retailers and service providers as a percentage of the total net
issuance of euro banknotes put into circulation by the Deutsche Bundesbank in 2007 (€283
billion) was 0.7%. The introduction of a German NHTO scheme could cause the average cash
holdings of retailers and service providers in Germany to fall by up to 80% (to €415 million).
However, at an interest rate of 2.5% pa, all other things being equal, this would correspond to
an annual interest loss for the Eurosystem and the Bundesbank of €43 million and €12
million, respectively.20
18 These figures seem plausible if credit institutions’ cash balances in ATMs or even cash centres are not allowed to be attributed to NHTO stocks. 19 See Deutsche Bundesbank, Monthly Report, June 2009, p 49 ff, Bartzsch/Rösl/Seitz (2011a,b). The demand for euro area currencies is discussed in Fischer, B./Köhler, P./Seitz F. (2004). 20 Compare: 43€025.0702,1 million or 12€2713.0025.0702,1 million with a €1,702 million NHTO-induced decline in the volume of banknotes in circulation held by retailers and service providers, given a German ECB capital share of 27.13%.

23
By contrast, it is hardly possible to reliably estimate the amount of monetary income that the
Bundesbank would additionally lose if an NHTO scheme with a similar impact on the
transaction balances of the retailers and service providers were to be introduced in all the
other euro-area countries. If, by way of example, it is assumed that the average transaction
balances in the euro area account for 10% of euro banknote circulation and, in turn, 10% of
this is held by retailers and service providers, then, based on the year 2007, the NHTO-
induced interest foregone by the Eurosystem would amount to around €135 million per year
with a corresponding present value of €5,413 million.21 Consequently, Germany would then
sustain a decline in monetary income of around €37 million per year.
The following table summarises the findings of the estimated effects on monetary income
resulting from the euro area wide introduction of NHTO schemes. The first column shows the
expected maximum annual losses of monetary income at a given refinancing rate of 2.5%. As
metioned above it is assumed that credit instituins are allowed to attribute their cash deposits
fully to the national NHTO system and retailers and other cash prone companies can reduce
their cash holdings by 80% due to quicker lodgements at NHTO points compared to
lodgements at NCB branches. The second column shows the corresponding present values of
these losses represented by the expected reduction of banknotes in circulation.
Table 7: Eurosystem’s estimated maximum losses from installing NHTO schemes in the euro
area
Annual losses* (in € million)
Present value (in € million)
Credit institutions 1,282 51,286
Retailers and service providers
135 5,413
Total 1,418 56,699
* Calculated on the following assumptions. Reduction of cash holdings by credit institutions (100%) and by
retailers and service providers (80%). Refinancing rate 2.5% pa.
21 The calculations are based on data from 2007 not only for reasons of consistency. Owing to extensive hoarding in 2009-2010, more recent data on banknote circulation distort the measurement of the transaction-related cash holdings of retailers and service providers. The following data were used: banknotes in circulation held by retailers and service providers as a percentage of the total volume of banknotes in circulation: 1%, NHTO-induced decline in the volume of banknotes in circulation held by retailers and service providers: 80%, volume of banknotes in circulation in the euro area at the end of 2007: €676,621 million, monetary policy interest rate: 2.5% pa. See 135€025.08.001.0621,676 million annual loss and 413,5€8.001.0621,676 million present value.

24
It is obvious that these figures have to be interpreted properly as an upper limit of expected
NHTO-induced losses of monetary income of the euro system. At any rate, however, this
estimate shows that the introduction of NHTO schemes have to be organised well before
sending into action. Otherwise it could easily happen that the cost savings from these cash
deposit systems are offset by a dramatic reductions in NCBs’ seigniorage income.
4.4 The impact of NHTO schemes on NCB profit
So far, we have only examined the impact of the introduction of NHTO schemes on monetary
income and the allocation thereof among the Eurosystem NCBs. However, this analysis is not
extensive enough to examine the impact of NHTO schemes on the central bank profit of the
individual NCBs. A clear distinction must be made between NHTO-NCBs and non-NHTO-
NCBs. As described above, the NHTO-NCBs force the NCBs that do not introduce an NHTO
scheme to make net subsidy payments, which take the form of a decline in the amounts
distributed from the pool of monetary income and directly lower the operating result. These
interest losses are currently not compensated for. Furthermore, these NCBs cannot make any
NHTO-induced cost savings ( NHTOiBl ), such as savings on personnel costs or banknote
printing, etc. This is also demonstrated by the general formula for the NHTO-induced change
in an NCB’s operating result
rBkBlZ NHTOi
NHTOii ,
which can be simplified for those NCBs j that do not introduce an NHTO scheme to
rBkZ NHTOj
NHTOnoj _
The decline in the operating result therefore corresponds to the monetary income lost by these
NCBs, which finance the interest foregone by the Eurosystem as a result of the NHTO
scheme ( rBNHTO ) in accordance with their ECB capital shares ( jk ). Although each
NHTO-NCB m also always sees monetary income decline (by rBkZ NHTOm
NHTOm ), this
decrease on the income side of each NHTO-NCB can be more than offset by the cost savings

25
arising from the introduction of a national NHTO scheme ( NHTOmBl ), and therefore the
NHTO schemes ultimately lead to an improvement in the operating results of the NHTO-
NCBs:22
rBkBlZ NHTOm
NHTOm
NHTOm .
It is therefore more likely that an NHTO-NCB will ultimately see an improvement in its profit
situation as a result of introducing an NHTO scheme, the more of the NHTO-induced net
subsidy payments it receives. The higher these implied subsidies to the NHTO-NCB
concerned are, the lower the NHTO-induced decline in monetary income for this NCB, all
other things being equal, and the easier it is for NHTO-induced cost savings to
overcompensate this fall in income. Thus, the design of the NHTO schemes at the other NCBs
has a direct impact on the NCB’s own profit situation.
However, whether or not the introduction of a national NHTO scheme improves an NCB’s
operating result also crucially depends on the specific design of its own NHTO scheme. It is
self-evident that the NCB’s profit situation will improve the more it manages to pass on
NHTO-related costs (eg banknote processing costs, transport costs, personnel costs, etc) to the
NHTO banks. However, as the example of Bank of England’s original NHTO scheme shows
that the NHTO-NCB will not necessarily achieve cost savings. In this case, because
commercial banks no longer incurred opportunity costs for holding banknotes, the stocks of
banknotes in credit institutions’ vaults rose considerably due to hoarding, and thus, instead of
the hoped-for cost savings, the Bank of England actually incurred additional banknote
printing expenses. Possible unexpected costs from the loss in control and quality, which the
NCBs can even incur subsequently, represent a further problem.
5 Impact of deposit bank systems on the allocation of monetary income and central bank
profits in the Eurosystem
In addition to NHTO schemes, there are also deposit bank systems, which, within the EU, are
currently in operation in Denmark, Sweden and Finland. However, the banknotes held in
custody at deposit banks on behalf of the NCB do not reduce the volume of banknotes in
circulation, as the deposit banks retain ownership of these holdings. To compensate for the
22 See also ECB (2009), Impact of deposit systems on seigniorage income, slide handout.

26
opportunity costs incurred by holding the banknotes, the NCB (referred to hereinafter as
“deposit-bank-NCB”) pays interest to the deposit bank’s central bank account for a separate
stock of banknotes. In Finland, the only euro-area country that has a procedure of this kind in
place, the Finnish central bank remunerates the stocks of banknotes held in custody at deposit
banks on its behalf at the one-month interbank rate. These expenses are borne by the Bank of
Finland (BoF) alone; they have so far not been included as expense items in the calculation of
monetary income. Nevertheless, it cannot be claimed that the introduction of deposit bank
systems does not affect the monetary income of the Eurosystem. Like NHTO schemes, the
introduction of such systems can have a lasting impact on banknote circulation. In Finland,
for example, the introduction of private deposit banks has clearly improved the number of
ways to lodge surplus banknotes and the possibilities for commercial banks to readily access
additional banknotes. Credit institutions have therefore been able to reduce their own holdings
of banknotes. However, the stocks of banknotes lodged at the deposit banks remain the
property of those banks that jointly operate the deposit bank system, meaning that, seen in
isolation, neither deposit lodgements nor withdrawals lower the volume of banknotes in
circulation. Since, in addition, interest is paid on the banknotes held in custody at the deposit
banks at the money market rate for one-month money by crediting the current account of the
deposit banks at the BoF, there is actually no incentive for the deposit banks to efficiently
manage the stocks of banknotes held on behalf of the BoF. However, to prevent any undesired
hoarding of banknotes by the deposit banks, the Finnish central bank sets an upper limit for
the amount of banknote stocks that can be lodged at each deposit bank.23 The desired decline
in the average cash balances of credit institutions (in relation to growing GDP) has probably
been achieved only because these restrictions are in place.
These comments once again show that, as with NHTO schemes, the effect of deposit bank
systems on banknote circulation and thus on monetary income cannot be predicted in
advance. However, assuming that the respective NCB is able to introduce a deposit bank
system that does actually result in the desired fall in the volume of banknotes in circulation,
then the impact on monetary income or the allocation thereof would be the same as for the
NHTO schemes. In a deposit bank system (without NHTOs) a deposit-bank-NCB's
contribution to the pool can therefore be formulated as
23 See: A description of notes-held-to-order schemes operated by central banks in the European Union, IWG ad hoc Group, 1 December 2005, p 18.

27
rBBP Depotii
Depoti )(,*
and the pool mass with the deposit bank system amounts to
rBBPP Depotn
i
Depoti
Depot
)(1
,*,* , where
n
iiBB
1
and
n
i
Depoti
Depot BB1
.
resulting in a deposit-bank-induced loss in monetary income for the Eurosystem of rBDepot .
The net contribution to the pool of an NCB i is then
rBBkrBBx Depoti
Depotii
Depoti )()(,*
and the respective net position of NCB i in the deposit-bank-induced inter-NCB subsidy
system is
rBkBx Depoti
Depoti
Depoti )(~ .
However, there is an important difference, namely that, according to the current procedure, an
NCB that introduces such a deposit bank system (deposit-bank-NCB) must bear the expenses
from the interest paid on the deposit bank holdings ( Depoti
Depot Br ) itself. The change in the
operating result following the introduction of a national deposit bank system is thus
Depoti
DepotDepoti
Depoti
Depoti BrrBkBlZ .
This puts the deposit-bank-NCB at a clear disadvantage. The same decline in the volume of
banknotes in circulation could also be achieved through an NHTO scheme. Yet with an
NHTO scheme, the NCBs would not have to pay interest on the deposit bank holdings
)( Depoti
Depot Br .
6 Equivalence between NHTO schemes and deposit bank systems
The following section will examine on a theoretical basis under which conditions deposit
bank systems and NHTO schemes are equivalent with regard to the redistribution of monetary
income and the NCB operating result. If a deposit-bank-NCB should be equivalent to an
NHTO-NCB in terms of income, the deposit-bank-NCBs would first have to ensure that the

28
introduction of the deposit bank system has no impact on banknote circulation. In a second
step, the deposit-bank-related interest expenses of the NCBs would have to be made
deductible when calculating monetary income and the underlying interest rate Depotr would
have to be brought into line with the main refinancing rate r. The contribution to the pool of a
deposit-bank-NCB j would then be:
rBBrBrBP Depotjj
Depotjj
Depotj )(,* .
The NHTO-NCBs would not need to make any adjustments. The NHTO-induced drop in the
volume of banknotes in circulation thus still results in a contribution to the pool for each
NHTO-NCB i of
rBBP NHTOii
NHTOi )(,* .
A comparison of the contributions to the pool of the deposit-bank-NCB and the NHTO-NCB
immediately shows that the NCBs are equivalent in terms of income in the monetary income
pooling process. This is not surprising, as the deduction of NCBs' interest expenses from the
monetary income liability base is de facto equivalent to a decrease in the liability base.
However, as soon as the introduction of a deposit bank system lowers the national volume of
banknotes in circulation, like NHTO schemes do, this results in a distortion of the NCBs’
income statements. Either, as is currently the case in the Eurosystem, the deposit-bank-NCBs
pay the interest payments deemed unnecessary given the desired decline in the volume of
banknotes in circulation ( Depoti
Depot Br ) and the structural differences in the operating results
of NHTO-NCBs and deposit-bank-NCBs are accepted, or the deposit bank interest expenses
are distributed among all NCBs in accordance with their respective ECB capital shares.
Although this removes the structural differences between NHTO-NCBs and deposit-bank-
NCBs, the NHTO-NCBs ultimately incur unnecessary costs. Of course, the same is true for all
NCBs that introduce neither an NHTO scheme nor a deposit bank system. Their position as
net payers in the inter-NCB subsidy system deteriorates further by their share in interest
expenses.

29
7 Summary of the results
The introduction of private cash deposit systems, such as the notes-held-to-order schemes and
deposit bank systems, generally changes the national contribution of a NCB to the overall
volume of banknotes in circulation and thus leads to distortions in the pooling of monetary
income. The corresponding redistribution effects, which are caused by the change in the
volume of banknotes in circulation when pooling monetary income, can be described in
general mathematical terms. It becomes evident that there is always a deposit-system-induced
redistribution of seigniorage losses, which implicitly means subsidy payments among the
NCBs if not all NCBs introduce such a system that changes the volume of banknotes in
circulation. If it is assumed that the introduction of a national deposit system lowers the
banknote circulation of an NCB, then each individual NCB that does not introduce such a
deposit system automatically becomes a net payer, while the deposit-system NCBs in sum are
winners. Whether each deposit-system NCB actually receives net subsidy payments depends,
in turn, on whether the national share in the total deposit-system-induced decline in the
volume of banknotes in circulation in the Eurosystem is greater than the corresponding ECB
capital share of the deposit-system NCB.
For a specific NCB, this means that the more NCBs introduce deposit systems and the income
from aggregate euro banknote circulation consequently decreases, the more its losses from the
pooling of monetary income. An NCB can only avoid the resulting net subsidy payments to
the NHTO-NCBs by introducing a deposit system itself or if it were to receive subsequent
compensation payments from the deposit-system NCBs. However, as yet, there are no plans
for the latter.
Summarising the calculation results of the expected NHTO-induced losses for the Eurosystem
from the decline in the volume of banknotes in circulation, it would appear to make sense to
set the upper limit of annual amounts of around €1.4 billion, which correspond to a present
value of interest income foregone (measured by an expected decline of banknotes in
circulation) of just under €57 billion. This calculation assumes that NHTO schemes are
introduced throughout the euro area and result in the cash holdings of credit institutions
declining by 100% and those of retailers and service providers falling by 80%. Although such
a scenario cannot be ruled out beforehand, since it is not known what form a possible euro-
area-wide NHTO scheme would take, it is not exactly likely to happen. However, this

30
estimate shows at any rate that the introduction of NHTO schemes have to be organised well
before sending into action. Otherwise it could easily happen that the cost savings from these
cash deposit systems are offset by a dramatic reductions in NCBs’ seigniorage income. With
the mathematical formalism presented here, however, it is very easy to calculate the effects on
the allocation and redistribution of monetary income and resulting from various NHTO and
other banknote deposit systems.
NHTO schemes and deposit bank systems do not differ per se in terms of their impact on the
creation and allocation of monetary income. What is decisive is their respective impact on
“national” banknote circulation. Although the theoretical analysis shows that NHTO schemes
tend to reduce the volume of banknotes in circulation, whereas deposit bank systems tend to
increase it, in practice the contracts between the central banks and deposit system operators
can be worded so that in principle any desired change in the volume of banknotes in
circulation can probably be achieved. This could be of crucial importance if NHTO schemes
and deposit bank systems are to continue to be allowed to operate side by side within the euro
area. In theory, at least, conditions can be established under which deposit bank systems are
equivalent to NHTO schemes not only against the backdrop of pooling monetary income but
also with regard to the NCB operating result.
With deposit bank systems, NCBs incur interest expenses as a result of paying interest on
eligible deposit holdings. These interest expenses directly lower the NCB operating result,
but, in line with current practice, cannot be deducted when pooling monetary income. By
contrast, under NHTO schemes, these expenses, which are ultimately unnecessary, are
avoided. Yet it is possible for both NHTO-NCBs and deposit-bank-NCBs to see an
improvement in their operating result, ie the NCB profit, by introducing such systems,
provided the deposit-system-induced cost savings more than compensate for the decline in
monetary income. This is not the case for those NCBs that reject the introduction of such
systems. In accordance with their ECB capital share, they must bear the deposit-system-
induced decline in the total volume of euro banknotes in circulation and thus also in monetary
income.

31
9 List of references
Bartzsch, N., Rösl, G., Seitz, F. (2011a): Foreign Demand for Euro Banknotes Issued in
Germany: Estimation Using Direct Approaches, Discussion Paper, Series 1, 20/2011,
Deutsche Bundesbank.
Bartzsch, N., Rösl, G., Seitz, F. (2011b): Foreign Demand for Euro Banknotes Issued in
Germany: Estimation Using Indirect Approaches, Discussion Paper, Series 1, 21/2011,
Deutsche Bundesbank.
Fischer, B./Köhler, P./Seitz F. (2004): The demand for Euro Area Currencies: Past, Present
and Future, ECB Working Paper Series, No. 330.
Rösl, G./Schäfer W. (2000): A Conceptual Approach to the Creation and Allocation of
Central Bank Profits in the Euro Area, in: Kredit und Kapital, No. 1, pp 39 – 61.
Rösl, G. (2002): Seigniorage in der EWU – Eine Analyse der Notenbankgewinnentstehung
und -verwendung des Eurosystems, Diss. (Helmut Schmidt University of the Federal
Armed Forces Hamburg).
Rösl, G. (2012): The impact of notes-held-to-order schemes and deposit bank systems on the
monetary income and profit of the national central banks of the Eurosystem,
http://www.bundesbank.de/download/vfz/konferenzen/20120227_29_eltville/12_roesl.
pdf.
Sinn, H.-W./Feist, H. (1997): Eurowinners and Eurolosers: The Distribution of Seigniorage
Wealth in EMU, in: European Journal of Political Economy, Vol. 13, pp 665 – 689.
Sinn, H.-W. (1997): Die Kühe des Bauern Buba, in: Wirtschaftswoche, No. 49 of 27
November 1997, pp 42 – 44.
Sinn, H.-W./Feist, H. (2000): The Accidental Redistribution of Seigniorage Wealth in the
Eurosystem, in: CESifo Forum, Vol. 1, No. 3, pp 27 – 29.