Embed Size (px)
Citation preview
Hieu Huu NGUYEN / Journal of Asian Finance, Economics and Business Vol 6 No 4 (2019) 99-107
Print ISSN: 2288-4637 / Online ISSN 2288-4645 doi:10.13106/jafeb.2019.vol6.no4.99
The Impact of State Budget Revenue on Economic Growth: A Case of Vietnam
Hieu Huu NGUYEN1
Received: July 14, 2019 Revised: September 16, 2019 Accepted: September 24, 2019
Abstract
This paper is intended to study the relationship between state budget revenue and economic growth in Vietnam. The ordinary least-
squares regression method is used with secondary data collected from General Statistics Office of Vietnam in the period of 2000-
2017. Vietnamese state budget revenue includes domestic revenue (excluding oil revenue), oil revenue, custom duty revenue, and
grants. The testing result shows that the state budget revenue has a positive correlation with economic growth of Vietnam. However,
the components of state budget revenue have different levels of impact on the economy. Domestic revenue and oil revenue are
statistically significant and have a positive effect on the economy, while the impact of custom duty revenue and grants on the
economy is invisible. Vietnamese state budget revenue should be restructured toward the sustainability and by way of boosting the
economy, specifically: (1) Increase the proportion of domestic revenue to state budget revenue and domestic revenue should be based
on the ground of production and business activities rather than collection from state-owned assets; (2) Reduce the proportion of
custom duty revenue and grants to state budget revenue; (3) Keep the volume and ratio of oil revenue in state budget revenue at an
appropriate proportion.
Keywords : State Budget, State Budget Revenue, Economic Growth, Vietnam
JEL Classification Code : H20, H27, H61, O11
1. Introduction12
Vietnam has been transforming to a market economy
from a centrally-planned economy. The state's intervention
in the economy has also been shifting from direct to indirect
control through macroeconomic instruments which are fiscal
policy and monetary policy. The state budget revenue, a part
of the fiscal policy, has been focused by the Vietnamese
government in order to create financial resources to meet the
spending needs, to regulate and promote economic
development.
According to Law on State budget of Vietnam, the state
budget revenue refers to revenue of the government financed
from domestic production, business and service
1 First Author and Corresponding Author, Dean, Fundamental
Faculty, Audit Training Institute, State Audit Office of Vietnam. [Postal Address: 111 Tran Duy Hung Street, Cau Giay District, Hanoi, 100000, Vietnam] Email: [email protected] and [email protected]
ⓒ Copyright: Korean Distribution Science Association (KODISA)
This is an Open Access article distributed under the terms of the Creative Commons Attribution Non-Commercial License (http://Creativecommons.org/licenses/by-nc/4.0/) which permits unrestricted noncommercial use, distribution, and reproduction in any medium, provided the original work is properly cited.
establishments or citizens and other revenues from abroad.
There are many ways to categorize state budget revenue.
Government revenue can be classified into tax and non-tax
revenue (Muriithi, 2013), oil and non-oil revenue (Raifu &
Raheem, 2018). In this paper, the author divides state budget
revenue based on its sources, which is in line with Law on
State budget and Statistical Yearbook of Vietnam.
Accordingly, Vietnamese state budget revenue includes four
items: domestic revenue (excluding oil revenue), oil revenue,
custom duty revenue and grants.
State budget revenue-to-GDP ratio and the structure of
revenues have important meanings. An appropriate ratio will
nurture the collection sources, create the sustainability of the
state budget revenue. In the contrary, the extremely high or
low ratio will hold back the growth of the economy. The
revenue structure reflects the corresponding proportion of
each revenue component to total state budget revenue. The
impact of revenue items on the economy differs because
they are orginated from different revenue bases. Changing
the revenue structure in an appropriate way will have a
positive impact on the economy. Given the above, there are
many important questions on state budget revenue of
Vietnam, specifically: Whether the state budget revenue of
99
Hieu Huu NGUYEN / Journal of Asian Finance, Economics and Business Vol 6 No 4 (2019) 99-107
Vietnam has positive impact on the economy? In the
structure of state budget revenue, which revenue items are
meant to promote the economy? Which revenue items are
not? The following research will search for answers.
2. Literature Review
The relationship between the state budget revenue (in
whole or in part) and economic growth has been studied by
many scholars from different perspectives with different
results being given.
Ofoegbu and Akwu (2016) researched state budget
revenue from the perspective of its main source, taxes. They
examined the effect of tax revenue on the economic
development of Nigeria. Ordinary least-squares regression
technique was used with time series data for the period
2005-2014. The result showed that tax revenue had
significant and positive influence on economy. Tax revenue
also had significant and positive impact on human
development index of Nigeria. Thus tax revenue was an
instrument for economic growth in Nigeria. When studying
the relationship between tax revenue and economic growth
of Ghana for period 1986 - 2010, Takumah (2014) had the
same result. The statistical analysis confirmed that “there
exists uni-directional causality between tax revenue and
economic growth and the flow of causality is through tax
revenue to economic growth in Ghana” (Takumah, 2014,
p.22). Based on his research, Takumah (2014) is of
opinion that Ghanaian government should enforce the tax
revenue mobilization to meet the demand of infrastructure
building for development. The enforcement was reflected by
the expansion of tax base and reduction of tax rates.
Similarly, by approaching the state budget revenue from
its main source namely taxes, Dladla and Khobai (2018)
however gave a different result with Ofoegbu and Akwu
(2016) and Takumah (2014). Dladla and Khobai used
autoregressive distribution lag approach to find the relation
between the taxes and economic growth in South Africa for
the period 1981-2016. The empirical results indicated that
the impact of taxes on economic growth in South Africa was
negative and significant in the short-run and long-run. A 1%
increase in taxes would decrease economic growth by 0.01%.
Romer and Romer (2010) also investigated the impact of tax
changes on economic growth of America. Their results were
in line with Dladla and Khobai (2018). Tax changes had
very large effects on American economic growth. A tax
increase of 1% GDP lowered real GDP almost 3%.
Nantob (2014) studied the relationship between four
categories of taxes namely taxes revenue; taxes on goods
and services; taxes on income, profits, and capital gains; and
tax on international trade and economic growth of 47
developing countries in the period 2000-2012. The result
showed that there were both a positive relationship and a
non-linear relationship between taxes revenue and economic
growth. The result also suggested both a negative
relationship and a non-linear (U-shaped) relationship
between taxes on income, profits, and capital gains and
economic growth. The last two categories of taxes: taxes on
goods and services and taxes on international trade had a
negative relationship and a non-linear relationship with
economic growth.
Researching on the relationship between taxation and
economic growth in Nigeria for the period 1980-2013,
Babatunde and Ibukun (2016) confirmed that in the long-run
(but not short-run) the relationship between tax and
economic growth would exist. The key components of tax
had the different impacts on Nigeria's economy. Petroleum
profit tax and company income tax were positively related to
real GDP. On the other hand, the relationship between
custom and excise duties and economic growth was negative.
Taken together, the tax components did not significantly
affect Nigerian economic growth.
Mur ii thi (2013) had a broader approach where he
classified Kenyan government revenues into tax and non-tax
revenue; tax revenue comprises import duty, excise duty,
income tax, and value added tax. Annual data was collected
from 1992 to 2011 and analyzed by SPSS to examine the
relationship between government revenues and economic
growth in Kenya. The result showed that government
revenues had positive effects on Kenyan economic growth.
The components of government revenues had different
impacts. There was an inverse relationship between
economic growth and import duty. The study also concluded
that increase in excise duty reduced the rate of economic
growth. Income tax led to continuous increase in revenue
collected by government and there was a direct relationship
between income tax and economic growth. Value added tax
also had positive effect on economy. The study finding
concluded that non-tax revenue had a direct relationship with
economic growth.
Raifu and Raheem (2018) had a different approach when
researching the impact of government revenues on Nigerian
economic growth for the period 1983-2013. They divided
government revenues into oil and non-oil revenues to assess
deeply the role of oil revenue because Nigeria is one of oil
producing countries in the world. The results revealed that
all revenues (total revenue, oil revenue and non-oil revenue)
had positive effects on economic growth in both the short-
run and long-run. A 1% increase in government total
revenue, oil revenue, and non-oil revenue led to 0.12%,
0.118% and 0.092% increase in Nigerian economic growth
respectively.
Gnangnon (2017) had a study on the relationship
between multilateral trade liberalization and government
revenue. In his empirical analysis on data collected from 169
countries in period 1995-2013, it was proven that
multilateral trade liberalization had positive impact on
government revenue in medium and long term. This result
was especially applicable to least-developed countries.
Gnangnon (2017) was of the opinion that the restrictions on
international trade would negatively impact the government
revenue.
100
Hieu Huu NGUYEN / Journal of Asian Finance, Economics and Business Vol 6 No 4 (2019) 99-107
3. Research Methodology
This paper uses ordinary least-squares technique to
research the relationship between state budget revenue and
economic growth of Vietnam in the period 2000-2017.
Secondary data is taken from Statistical Yearbook of
Vietnam published by General Sta t i st ics Office o f
Vietnam. A regression model is built where independent
variable is GDP and four dependent variables are
components of state budget revenues (domestic revenue, cu
stom duty revenue, oil revenue, and grants).
The model is expressed as follows:
GDP = β1 + β2 DOM + β3 CUS + β4 OIL + β5 GRA + u
where
β1: Intercept of the regression line. It implies any level
of economy at zero state budget revenue.
β2, β3, β4, β5: Coefficients to be estimated. They measure
the effects of domestic revenue, custom duty revenue, oil
revenue, and grants on GDP, respectively.
DOM: Domestic revenue (excluding oil revenue)
CUS: Custom duty revenue
OIL: Oil revenue.
GRA: Grants
u: stochastic variable to accommodate the influence of
other determinants of economy not included in the
model.
Five hypotheses are set up based on regression results to
test the impact of state budget revenue and the components
of state budget revenue on the economy.
Hypothesis 1: Whether the population regression function is
significant or not
Hypothesis 2: Whether DOM impacts GDP or not
Hypothesis 3: Whether CUS impacts GDP or not.
Hypothesis 4: Whether OIL impacts GDP or not
Hypothesis 5: Whether GRA impacts GDP or not
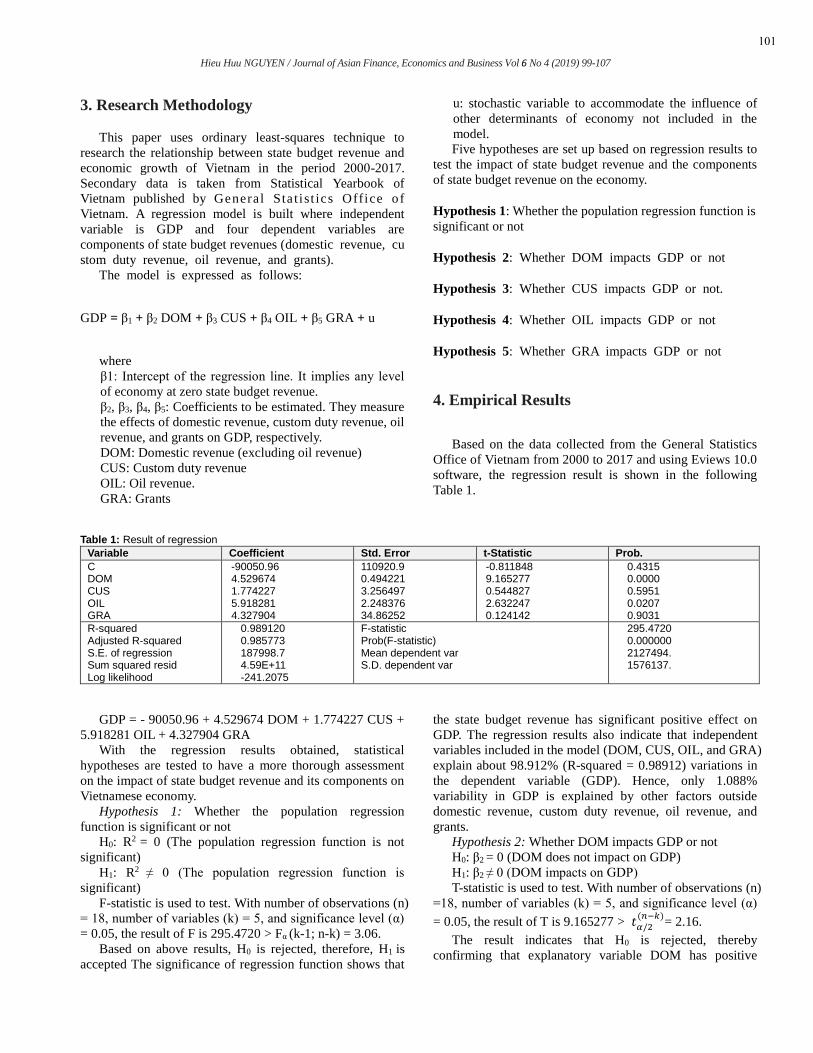
4. Empirical Results
Based on the data collected from the General Statistics
Office of Vietnam from 2000 to 2017 and using Eviews 10.0
software, the regression result is shown in the following
Table 1.
Table 1: Result of regression
Variable Coefficient Std. Error t-Statistic Prob.
C DOM CUS OIL GRA
-90050.96 4.529674 1.774227 5.918281 4.327904
110920.9 0.494221 3.256497 2.248376 34.86252
-0.811848 9.165277 0.544827 2.632247 0.124142
0.4315 0.0000 0.5951 0.0207 0.9031
R-squared Adjusted R-squared S.E. of regression Sum squared resid Log likelihood
0.989120 0.985773 187998.7 4.59E+11 -241.2075
F-statistic Prob(F-statistic) Mean dependent var S.D. dependent var
295.4720 0.000000 2127494. 1576137.
GDP = - 90050.96 + 4.529674 DOM + 1.774227 CUS +
5.918281 OIL + 4.327904 GRA
With the regression results obtained, statistical
hypotheses are tested to have a more thorough assessment
on the impact of state budget revenue and its components on
Vietnamese economy.
Hypothesis 1: Whether the population regression
function is significant or not
H0: R2 = 0 (The population regression function is not
significant)
H1: R2 ≠ 0 (The population regression function is
significant)
F-statistic is used to test. With number of observations (n)
= 18, number of variables (k) = 5, and significance level (α)
= 0.05, the result of F is 295.4720 > Fα (k-1; n-k) = 3.06.
Based on above results, H0 is rejected, therefore, H1 is
accepted The significance of regression function shows that
the state budget revenue has significant positive effect on
GDP. The regression results also indicate that independent
variables included in the model (DOM, CUS, OIL, and GRA)
explain about 98.912% (R-squared = 0.98912) variations in
the dependent variable (GDP). Hence, only 1.088%
variability in GDP is explained by other factors outside
domestic revenue, custom duty revenue, oil revenue, and
grants.
Hypothesis 2: Whether DOM impacts GDP or not
H0: β2 = 0 (DOM does not impact on GDP)
H1: β2 ≠ 0 (DOM impacts on GDP)
T-statistic is used to test. With number of observations (n)
=18, number of variables (k) = 5, and significance level (α)
= 0.05, the result of T is 9.165277 > 𝑡𝛼/2(𝑛−𝑘)
= 2.16.
The result indicates that H0 is rejected, thereby
confirming that explanatory variable DOM has positive
101
Hieu Huu NGUYEN / Journal of Asian Finance, Economics and Business Vol 6 No 4 (2019) 99-107
effect on explained variable GDP.
Hypothesis 3: Whether CUS impacts GDP or not.
H0: β3 = 0 (CUS does not impact on GDP)
H1: β3 ≠ 0 (CUS impacts on GDP)
T-statistic is used to test. With number of observations (n)
=18, number of variables (k) = 5, and significance level (α)
= 0.05, the result of T is 0.544827 < 𝑡𝛼/2(𝑛−𝑘)
= 2.16.
The above result indicates that H0 is not rejected. There
is insufficient evidence to conclude that the explanatory
variable CUS impacts on the explained variable, namely
GDP.
Hypothesis 4: Whether OIL impacts GDP or not
H0: β4 = 0 (OIL does not impact on GDP)
H1: β4 ≠ 0 (OIL impacts on GDP)
T-statistic is used to test. With number of observations (n)
=18, number of variables (k) = 5, and significance level (α)
= 0.05, the result of T is 2.632247 > 𝑡𝛼/2(𝑛−𝑘)
= 2.16.
The result indicates that H0 is rejected, thereby
confirming that explanatory variable OIL has positive effect
on explained variable GDP.
Hypothesis 5: Whether GRA impacts GDP or not
H0: β5 = 0 (GRA does not impact on GDP)
H1: β5 ≠ 0 (GRA impacts on GDP)
T-statistic is used to test. With number of observations (n)
=18, number of variables (k) = 5, and significance level (α)
= 0.05, the result of T is 0.124142 < 𝑡𝛼/2(𝑛−𝑘)
= 2.16.
The above result indicates that H0 is not rejected. There
is insufficient evidence to conclude that the explanatory
variable GRA impacts on the explained variable GDP.
In conclusion, the results of statistical hypothesis tests
reveal that the state budget revenue, domestic revenue and
oil revenue have positive effect on economic growth of
Vietnam while the influence of custom duty revenue and
grants on the economy is invisible.
5. Discussion
State budget revenue impacts the economy through the
transmission mechanism. The state mobilizes a part of the
financial resources of the economy to maintain the
government apparatus and develop the investment. The
revenue-to-GDP ratio has important implications for
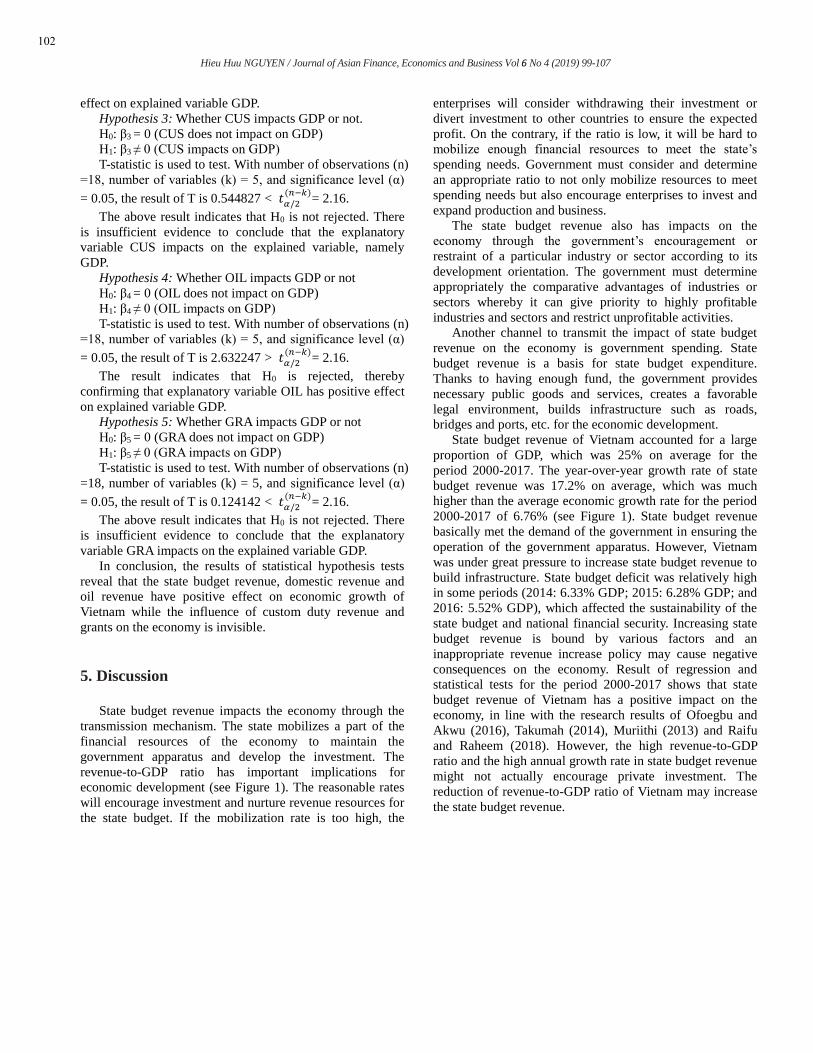
economic development (see Figure 1). The reasonable rates
will encourage investment and nurture revenue resources for
the state budget. If the mobilization rate is too high, the
enterprises will consider withdrawing their investment or
divert investment to other countries to ensure the expected
profit. On the contrary, if the ratio is low, it will be hard to
mobilize enough financial resources to meet the state’s
spending needs. Government must consider and determine
an appropriate ratio to not only mobilize resources to meet
spending needs but also encourage enterprises to invest and
expand production and business.
The state budget revenue also has impacts on the
economy through the government’s encouragement or
restraint of a particular industry or sector according to its
development orientation. The government must determine
appropriately the comparative advantages of industries or
sectors whereby it can give priority to highly profitable
industries and sectors and restrict unprofitable activities.
Another channel to transmit the impact of state budget
revenue on the economy is government spending. State
budget revenue is a basis for state budget expenditure.
Thanks to having enough fund, the government provides
necessary public goods and services, creates a favorable
legal environment, builds infrastructure such as roads,
bridges and ports, etc. for the economic development.
State budget revenue of Vietnam accounted for a large
proportion of GDP, which was 25% on average for the
period 2000-2017. The year-over-year growth rate of state
budget revenue was 17.2% on average, which was much
higher than the average economic growth rate for the period
2000-2017 of 6.76% (see Figure 1). State budget revenue
basically met the demand of the government in ensuring the
operation of the government apparatus. However, Vietnam
was under great pressure to increase state budget revenue to
build infrastructure. State budget deficit was relatively high
in some periods (2014: 6.33% GDP; 2015: 6.28% GDP; and
2016: 5.52% GDP), which affected the sustainability of the
state budget and national financial security. Increasing state
budget revenue is bound by various factors and an
inappropriate revenue increase policy may cause negative
consequences on the economy. Result of regression and
statistical tests for the period 2000-2017 shows that state
budget revenue of Vietnam has a positive impact on the
economy, in line with the research results of Ofoegbu and
Akwu (2016), Takumah (2014), Muriithi (2013) and Raifu
and Raheem (2018). However, the high revenue-to-GDP
ratio and the high annual growth rate in state budget revenue
might not actually encourage private investment. The
reduction of revenue-to-GDP ratio of Vietnam may increase
the state budget revenue.
102
Hieu Huu NGUYEN / Journal of Asian Finance, Economics and Business Vol 6 No 4 (2019) 99-107
Source: General Statistics Office of Vietnam *Note: - %SBR/GDP: State budget revenue-to-GDP ratio - %SBE/GDP: State budget expenditure-to-GDP ratio
Figure 1: The ratio of state budget revenue and state budget expenditure to GDP of Vietnam
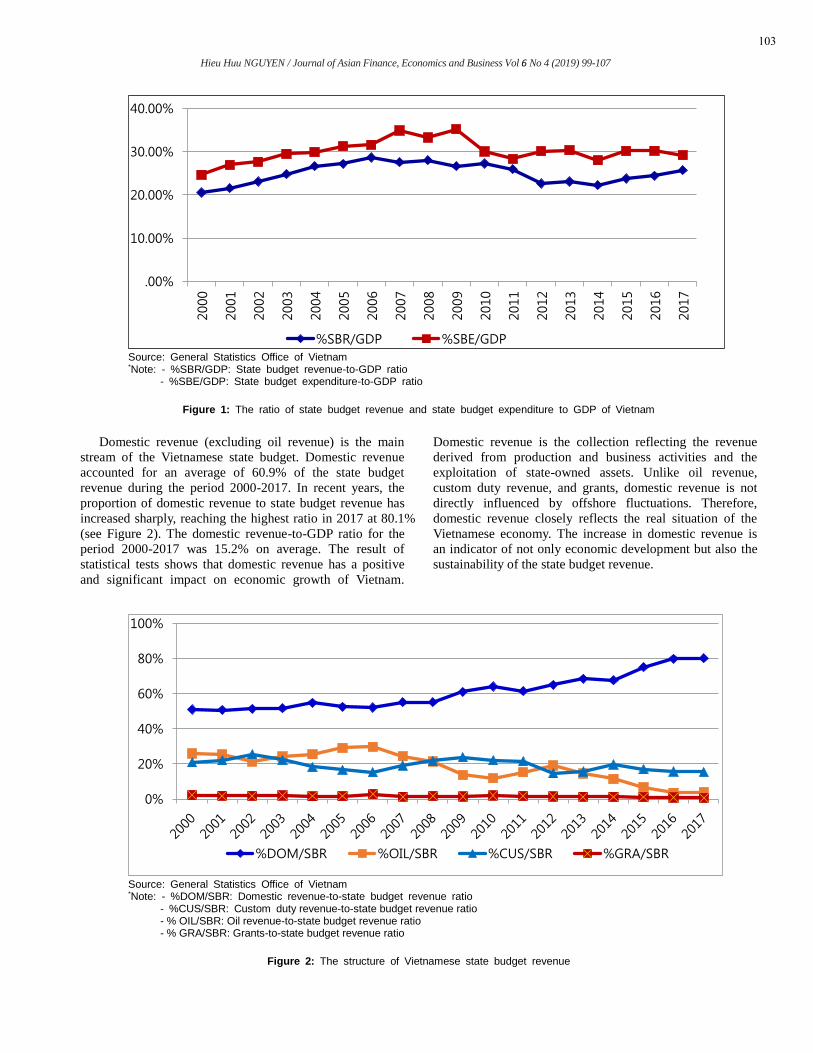
Domestic revenue (excluding oil revenue) is the main
stream of the Vietnamese state budget. Domestic revenue
accounted for an average of 60.9% of the state budget
revenue during the period 2000-2017. In recent years, the
proportion of domestic revenue to state budget revenue has
increased sharply, reaching the highest ratio in 2017 at 80.1%
(see Figure 2). The domestic revenue-to-GDP ratio for the
period 2000-2017 was 15.2% on average. The result of
statistical tests shows that domestic revenue has a positive
and significant impact on economic growth of Vietnam.
Domestic revenue is the collection reflecting the revenue
derived from production and business activities and the
exploitation of state-owned assets. Unlike oil revenue,
custom duty revenue, and grants, domestic revenue is not
directly influenced by offshore fluctuations. Therefore,
domestic revenue closely reflects the real situation of the
Vietnamese economy. The increase in domestic revenue is
an indicator of not only economic development but also the
sustainability of the state budget revenue.
Source: General Statistics Office of Vietnam *Note: - %DOM/SBR: Domestic revenue-to-state budget revenue ratio
- %CUS/SBR: Custom duty revenue-to-state budget revenue ratio - % OIL/SBR: Oil revenue-to-state budget revenue ratio - % GRA/SBR: Grants-to-state budget revenue ratio
Figure 2: The structure of Vietnamese state budget revenue
.00%
10.00%
20.00%
30.00%
40.00%
2000
2001
2002
2003
2004
2005
2006
2007
2008
2009
2010
2011
2012
2013
2014
2015
2016
2017
%SBR/GDP %SBE/GDP
0%
20%
40%
60%
80%
100%
%DOM/SBR %OIL/SBR %CUS/SBR %GRA/SBR
103
Hieu Huu NGUYEN / Journal of Asian Finance, Economics and Business Vol 6 No 4 (2019) 99-107
Domestic revenue is composed of a lot of collection
channels, of which the main sources include revenue from
state-owned enterprises, revenue from foreign-invested
enterprises, revenue from non-state sector, fees, revenue
from land and houses.
Revenue from state-owned enterprises is the largest
stream in the domestic revenue, accounting for 30.8% on
average for the period 2000-2017. According to Law on
Enterprise of Vietnam, state-owned enterprise is any
enterprise of which 100% charter capital is held by the state.
Currently, Vietnam has 1,204 state-owned enterprises,
accounting for 0.2% of total enterprises operating in
Vietnam (see Table 2). Along with the economic
restructuring process, Vietnam has implemented the policy
of equitization and divestment in state-owned enterprises.
This is the main reason why revenue from state-owned
enterprises tends to decrease in both quantity and proportion
in total domestic revenue.
Revenue from foreign-invested enterprises has positive
changes, reaching 16.4% of total domestic revenue for the
period 2000-2017 on average. Foreign-invested enterprises
include enterprises with capital directly invested by
foreigners. There are two main types of foreign-invested
enterprises: 100% foreign invested enterprises and joint
ventures between foreign parties and domestic partners.
Foreign direct investment activities have officially started
since Vietnam issued the first Law on Foreign investment in
1987. After more than 30 years, the foreign-invested sector
in Vietnam has been growing strongly and making positive
contributions to Vietnam's economy. By the end of 2017,
Vietnam attracted US$ 319.6 billion of foreign direct
investment capital with 16,178 foreign-invested enterprises
(see Table 2), accounting for 2.9% of total enterprises
operating in almost all sectors in Vietnam. Foreign-invested
enterprises have bright prospect which create room to
increase revenue from this dynamic and highly efficient
economic sector.
Revenue from non-state sector also tended to increase
and accounted for a relatively high proportion in the state
budget revenue, averaging 16.4% for the period 2000-2017.
The increase in state budget revenue from private enterprises
was mainly due to the increase in the number of private
enterprises established and effectiveness in operation of this
sector. The number of private enterprises increased rapidly,
currently Vietnam has 543,035 private enterprises (see Table
2), accounting for 96.9% of total enterprises. Private
enterprises are now affirmed by the Vietnamese government
as an important motivation of the economy. This is a big
milestone in mindset and outlook of Vietnam on the role of
the private sector. The private sector had only been officially
recognized in Vietnam since 1986.
Table 2: Number of enterprises in Vietnam
Year 2000 2001 2010 2013 2014 2015 2016 2017
State-owned enterprise 5,759 5,355 1,801 1,590 1,470 1,315 1,276 1,204
Non-state enterprise 35,004 44,314 270,311 361,403 389,810 429,230 489,781 543,035
Foreign-invested enterprise
1,525 2,011 7,248 10,220 11,046 11,940 14,002 16,178
Total 42,288 51,680 279,360 373,213 402,326 442,485 505,059 560,417
Source: General Statistics Office of Vietnam
Besides taxes, state agencies and public service
providers as assigned by competent state agencies collect
fees from organizations and individuals. Revenue from
public service fees of Vietnam was relatively stable,
averaging 6.2% of total domestic revenue for the period
2000-2017. Collected fees contribute an important part to
compensate the costs of providing public services.
Revenue from land and houses accounted for 12.9% of
total domestic revenue on average. This revenue reflects the
exploitation of state-owned assets such as proceeds from the
disposal of state-owned assets (e.g. houses, offices, etc.),
transfer of land use rights, land rental and state-owned house
rental, etc. Although there has been an increase in quantity
and proportion in the total domestic revenue from land and
houses, this revenue reflects the unsustainability due to its
inability to regenerate. The state must dispose of a part of
state-owned resources for current expenditure.
Custom duty revenue includes export and import duties,
special consumption tax, surtax on import, value added tax
on imports. Custom duty revenue relates to import and
export activities. Custom duty revenue of Vietnam has
increased in volume, but its proportion in total state budget
revenue tends to decrease (see Figure 2). This revenue
accounted for 19.3% of the state budget revenue for the
period 2000-2017. Currently, custom duty revenue ranks
second on the scale, following domestic revenue. Custom
duty revenue is impacted in two opposite directions. The
first direction which increases revenue is the expansion of
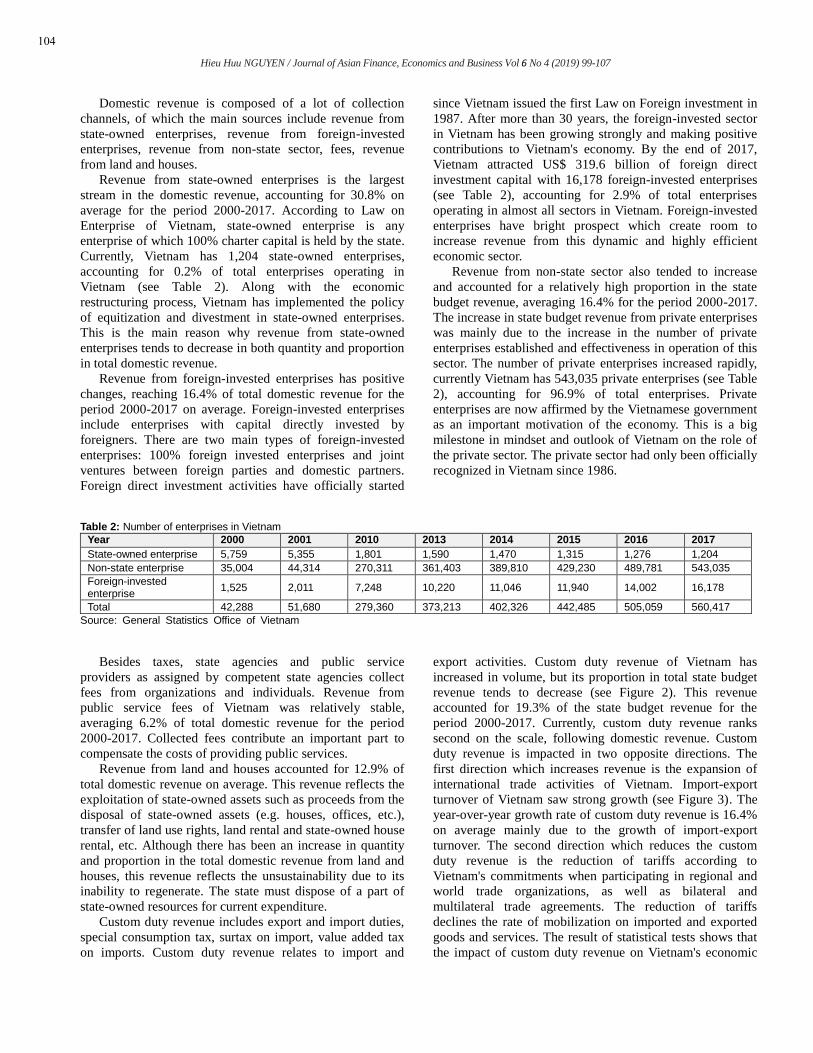
international trade activities of Vietnam. Import-export
turnover of Vietnam saw strong growth (see Figure 3). The
year-over-year growth rate of custom duty revenue is 16.4%
on average mainly due to the growth of import-export
turnover. The second direction which reduces the custom
duty revenue is the reduction of tariffs according to
Vietnam's commitments when participating in regional and
world trade organizations, as well as bilateral and
multilateral trade agreements. The reduction of tariffs
declines the rate of mobilization on imported and exported
goods and services. The result of statistical tests shows that
the impact of custom duty revenue on Vietnam's economic
104
Hieu Huu NGUYEN / Journal of Asian Finance, Economics and Business Vol 6 No 4 (2019) 99-107
growth in the period 2000-2017 is invisible. This result is
consistent with the research of Nantob (2014) and Muriithi
(2013) in which they were of opinion that tax on
international trade or import duty had negative impacts on
economic growth. The increase in the volume of custom
duty revenue may restraint Vietnam's economic
development due to slowing down international trade
activities. Promoting international trade may increase
government revenue (Gnangnon, 2017).
Source: General Statistics Office of Vietnam
Figure 3: International trade of Vietnam
Crude oil used to play an important role in the
Vietnamese economy as it contributed nearly 1/3 of the state
budget revenue (reaching the highest proportion of 29.6% in
2006). Oil revenue accounted for an average proportion of
18.2% of the state budget revenue for the period 2000-2017,
but tended to decrease rapidly, especially in recent years (see
Figure 2). In 2017, oil revenue only accounted for 3.8% of
the state budget revenue. Oil revenue fluctuates and depends
mainly on crude oil prices in the world market. The erratic
fluctuation of crude oil prices in the world over the past
years made the actual revenue from crude oil much different
from the estimation (see Table 3). This impacted the state
budget expenditure because the revenue did not reach the
budget estimation approved by the National Assembly of
Vietnam. The result of statistical tests affirms the positive
role of oil revenue in Vietnam's economy in the period 2000-
2017, in line with the research results of Raifu and Raheem
(2018). However, state budget revenue should not depend
heavily on non-renewable resources. World crude oil price,
volatile factor which is extremely difficult to predict
accurately, also affects the sustainability of state budget
revenue.
Table 3: Comparison of estimation and execution crude oil prices Unit: USD/barrel
Financial Year 2011 2012 2013 2014 2015 2016 2017
Estimation price 77 85 90 98 100 60 50
Execution price 102 116.5 115 107.3 56.2 43.6 55.6
Source: Ministry of Finance of Vietnam
Grants are non-refundable aids. Vietnamese government
receives grants and does not have obligation to return them
to foreign donors. Non-refundable aids are mainly used to
implement projects aiming at researching of policies,
institutions, technique, competence; improving human
capacity or preparing to implement other programs and
projects through activities such as providing experts,
training, supporting materials, documents, visiting tours,
seminars, etc. The scale of grants was not large (see Figure
2), accounted for an average of 1.6% of the state budget
0
50000
100000
150000
200000
250000
300000
350000
400000
450000
5000002000
2001
2002
2003
2004
2005
2006
2007
2008
2009
2010
2011
2012
2013
2014
2015
2016
2017
$U
S M
illion
Export turnover Import turnover Total
105
revenue for the period 2000-2017. This revenue stream also
tends to decrease in both funding volume and proportion in
state budget revenue as international donors reduce the
provision of grants because Vietnam has surpassed the poor
country threshold. The testing result for the period 2000-
2017 shows that grants do not have statistical significance to
the Vietnamese economy. The impact of grants on economic
growth is invisible. This result reflects low efficiency in
grant usages. There are three main reasons for this issue.
Firstly, a large portion of the financial resources granted for
Vietnam is paid back to foreign experts providing advisory
services. Secondly, the targets of granting are sometimes not
clearly defined, even not suitable with Vietnam's needs.
Thirdly, since there is no obligation to repay foreign donors,
Vietnam, as a receiving country, has a lax mentality in
management and receipts of grants even if their funding
objectives are unclear or inappropriate.
6. Conclusion
This study uses the ordinary least-squares method to
analyze the relationship between state budget revenue and
components of state budget revenue and Vietnam's
economic growth in the period 2000-2017. The results of
regression and statistic tests show that state budget revenue
has a positive impact on the economy of Vietnam. The state
budget collection policy of Vietnam has contributed to
economic growth. The statistical tests also show that state
budget revenue components have different influences on the
economy. Domestic revenue and crude oil revenue are
statistically significant, while the impact of custom duty
revenue and grants on the economy is invisible. Vietnamese
government needs to restructure the state budget revenue to
increase the effectiveness and efficiency of the state budget
revenue to the economy.
7. Recommendations
In order to improve and enhance the effectiveness and
efficiency of state budget revenue, based on empirical
research results, some recommendations are proposed as
follows:
Firstly, Vietnam should reduce the state budget deficit
and maintain under 4% GDP to release the pressure on state
budget revenue increase.
Secondly, Vietnam should increase volume and
proportion of domestic revenue to the state budget revenue.
Domestic revenue would be improved towards covering all
revenue sources, expanding the collection bases, reducing
the revenue mobilization ratio in order to boost production
development and encourage private investment, cutting
down the revenue from sale of state-owned assets.
Thirdly, Vietnam should pay attention to improve the
capacity in analyzing and forecasting the world crude oil
prices to minimize the negative impact of world oil prices on
state budget revenue. The exploitation of crude oil should be
at a reasonable level to avoid the exhaustion of this non-
renewable resource and the point of drilling should be
considered to keep pace with the fluctuations of the world
crude oil market.
Fourthly, Vietnam should actively cut down the tariff
according to the committed international agreements to
boost the economy. In addition, Vietnam needs to continue
expanding international trade through negotiating and
concluding of bilateral and multilateral free trade
agreements.
Finally, Vietnam should reduce non-refundable aids. The
objectives of projects financed by aid resources should be
clearly defined and these projects should be strictly managed
to ensure the effective usage of the grants.
References
Babatunde, O. A., & Ibukun, A. O. (2016). Taxation and
economic growth in Nigeria. Asian Journal of Economic
Modelling, 4(4), 199-210. DOI:
10.18488/journal.8/2016.4.4/8.4.199.210
Dladla, K., & Khobai, H. (2018). The impact of taxation on
economic growth in South Africa (MPRA Paper No.
86219). Retrieved from https://mpra.ub.uni-
muenchen.de/86219/
Gnangnon, S. K. (2017). Multilateral trade liberalization and
government revenue. Journal of Economic Integration,
32(3), 586-614.
http://dx.doi.org/10.11130/jei.2017.32.3.586
Muriithi, C. (2013). The relationship between government
revenue and economic growth in Kenya. International
Academic Journal of Information Sciences and Project
Management, 1(1), 87-109. Retrieved from
http://www.iajournals.org/articles/iajispm_v1_i1_87_109
Nantob, N. (2014). Taxes and economic growth in
developing countries: A dynamic panel approach
(MPRA Paper No. 61346). Retrieved from
https://mpra.ub.uni-muenchen.de/61346/
Ofoegbu, G. N., & Akwu, D. O. (2016). Empirical analysis
of effect of tax revenue on economic development of
Nigieria. International Journal Asian Social Science,
6(10), 604-613. DOI:
10.18488/journal.1/2016.6.10/1.10.604.613
Raifu, I. A., & Raheem, A. N. (2018). Do government
revenues matter for economic growth? Evidence from
Nigeria. European Journal of Government and
Economics, 7(1), 60-84.
DOI: https://doi.org/10.17979/ejge.2018.7.1.4333
Romer, C. D., & Romer, D. H. (2010). The macroeconomic
effects of tax changes: Estimates based on a new
measure of fiscal shocks. American Economic Review,
106
Hieu Huu NGUYEN / Journal of Asian Finance, Economics and Business Vol 6 No 4 (2019) 99-107
100(3), 763-801. Retrieved from
http://www.aeaweb.org/articles.php?doi=10.1257/aer.100
.3.763
Saidin, N. A. B., Basit, A., & Hamza, S. M. (2016). The role
of tax on economic growth. International Journal of
Accounting & Business Management, 4(2), 242-250.
DOI: 10.24924/ijabm/2016.11/v4.iss2/242.250
Takumah, W. (2014). Tax revenue and economic growth in
Ghana: A cointegration approach (MPRA Paper No.
58532). Retrieved from http://mpra.ub.uni-
muenchen.de/58532/
107
Hieu Huu NGUYEN / Journal of Asian Finance, Economics and Business Vol 6 No 4 (2019) 99-107