Embed Size (px)
Citation preview

1
THE IMPACT OF TAXES ON LOCATION DECISIONS
Martin Thomsena, Robert Ullmann
a and Christoph Watrin
a
a School of Business Administration and Economics, Institute of Accounting and Taxation,
University of Muenster, Germany
May 2013
Abstract
In this study, we investigate whether taxes influence the location of real business activities.
To this end, we identify a natural experiment in the German tax regime and find that lower tax
rates in a particular region are associated with firms paying higher wages in that region.
Moreover, our findings show that firms adapt to changes in tax rates over time by making
decisions about locating their workforce that are consistent with the hypothesis of tax-induced
income shifting. We conclude that the frequently employed argument that business income
shifting is undertaken primarily through accounting changes does not necessarily hold; thus,
in addition to reducing the income of domestic firms, unfavorable changes in the tax system
may also reduce domestic investment and curtail real business activity.

2
THE IMPACT OF TAXES ON LOCATION DECISIONS
1. Introduction
Although it is well established in accounting research that profits are shifted on the
merits to low tax jurisdictions to minimize consolidated tax rates, the exact channels of in-
come shifting are not yet well understood. An in-depth understanding of these channels is
important, however, because policy makers should be aware of all of the effects that are em-
bodied in changes in tax systems — particularly in light of increasing global tax rate competi-
tion. Consequently, Shevlin et al. (2012), among others, have recently called for further re-
search into the exact channels of how income shifting is implemented in multinational enter-
prises because such research would be particularly relevant if it were possible “[…] to […]
test whether firms are shifting real operations or relying on accounting-based methods of
income shifting.” In this study, we investigate specifically whether tax rates influence loca-
tion decisions.
It has often been argued that accounting methods are used to shift income between
countries with different tax rates because of the relatively low cost of this strategy (e.g., Har-
ris 1993; Klassen et al. 1993; Shackelford and Shevlin 2001; Devereux and Maffini 2007;
Huizinga and Laeven 2008).1 However, the tangible overall business activity of a country
might be unaffected by cross-border tax rate differentials — or even increase as a conse-
quence of the higher investment potential for domestic firms caused by lower consolidated tax
rates. Of course, revenue-maximizing policy makers understand that most developed coun-
tries rely considerably more on personal income taxes than on business taxes. Thus, in gen-
eral, shifting business income based on accounting decisions might be negligible in terms of a
country’s tax revenue if the individual incomes of the country’s residents remain largely un-
1 Income shifting via accounting decisions means contracting and includes setting transfer prices, debt, or
licensing intangible property.

3
changed (i.e., if the tangible business activity of a country was unchanged) or if the initial
shifting of business income might be offset by the subsequently higher potential for tangible
investment by domestic firms. In such an environment, policy makers — contrary to intuition
— might not have an incentive to engage in global competition with respect to business tax
rates or may, in fact, encourage a decrease in tax rates in nearby foreign countries for their
own country’s advantage. In this light, policy makers must understand the exact channels of
income shifting that multinational enterprises employ.
Despite its importance, research on the exact channels of income shifting is hindered
by data availability. As a consequence, most available research merely investigates whether
income shifting occurs on its merits — without isolating the means of income shifting (for an
overview, see Shackelford and Shevlin 2001 and Devereux and Maffini 2007). The prior liter-
ature focuses specifically on accounting decisions that result in income shifting, such as
changes in transfer pricing (e.g., Newberry and Dhaliwal 2001; Mills and Newberry 2004;
Blouin et al. 2012) and selective location of debt (e.g., Froot and Hines 1995; Newberry and
Dhaliwal 2001) or intangibles (Dischinger and Riedel 2011; Karkinsky and Riedel 2012). The
body of research on altering tangible business activity as a means of shifting business income
is considerably smaller because of limited data availability (Shevlin et al. 2012). Against this
background, our research design takes advantage of a peculiarity in the German tax system:
for purposes of the so-called "trade tax", each local municipality determines its own individu-
al rate, and there were 12,266 municipalities in Germany in 2007. Firms are liable for trade
tax in a municipality if they have a permanent establishment therein. When a given firm has
permanent establishments in more than one municipality, formulary apportionment is used to
allocate the trade tax base to the relevant municipalities, and wages paid in a municipality are
used as the allocation key. Thus, to shift income to a municipality with a favorable trade tax
rate, a transfer of personnel (more specifically, of wages paid) and a change of tangible opera-

4
tions are inevitable. Conversely, accounting changes have no effect on the allocation of a
firm’s trade tax base between municipalities.
We note that wages paid are a particularly well-suited proxy for investigating tax-
induced location decisions for several reasons. First, wages paid can be measured with mini-
mal error. Most particularly, wage taxes in Germany are levied directly at the source firm, so
data are not estimated or rounded. Moreover, the data are explicitly audited by tax authorities.
Second, wages paid cannot realistically be shifted without actual changes in headcount, i.e.,
without changes in location decisions.2 Finally, wages paid are a better proxy for tangible
business activity than other measures that are also often discussed as allocation keys in formu-
lary apportionment, such as sales or total assets. Sales can be manipulated without difficulty
by adjusting intra-group trades, and total assets are generally subject to considerable discre-
tion for accounting purposes, such as in the assessment of their fair value.
We acknowledge that there are tax regimes that use formulary apportionment in other
countries (e.g., state tax in the U.S.). However, regarding research on location decisions, the
German trade tax has several notable advantages. First, the wording and application of the
trade tax law is exactly the same for each municipality; thus, variation in the trade taxation
regimes between municipalities is solely derived from differences in the trade tax rates. Fur-
thermore, tax audits are conducted at the level of the firm; thus, the total trade tax base is not
affected by its allocation among municipalities. Second, wages paid affect only the allocation
of the trade tax base, and other taxes are not affected. Third, other tax laws (e.g., corporate
tax, labor tax, value added tax) and non-tax laws (including labor laws) are largely identical
2 We note that tax planning based on accounting decisions would theoretically also be possible by simply in-
creasing the wages of employees in municipalities with low trade tax levy rates. However, wages (and ancil-
lary wage costs) are in fact paid out in full to a third party (i.e., employees) and are thus full expenses from
the perspectives of the firm and the entire consolidated group (a slightly different rationale might hold in the
case of the employment of family members or close friends, but these rare and arguably negligible cases are
not addressed here). Moreover, given Germany’s strong labor laws, increases in wages cannot generally be
reversed in the future; thus, such a strategy would be almost prohibitively inflexible. In sum, the strategy of
purposefully increasing the wages of selected individuals for purposes of a firm’s trade tax planning is not an
economically sensible strategy and is even anecdotally unheard of.

5
between municipalities because the relevant laws are created on a national level and national
courts are in place that specialize in different areas of laws to guarantee homogenous applica-
tion (e.g., one national court for tax law, one national court for labor law, and the supreme
court). Fourth, trade taxes are economically relevant to the firm. Roughly speaking, trade tax-
es account for approximately 40 % of the corporate income tax burden and approximately
30 % of the income tax burdens of other types of business entities (e.g., for sole proprietor-
ships). Fifth, there are many municipalities in Germany, and trade tax rates vary between 0 %
and 31.0 %, which indicates that considerable variation can be found in the data. Sixth, gen-
eral institutional factors, such as the stability of the government (central and local), function-
ality of public authorities, infrastructure, availability of finance, unemployment support, and
antitrust regulations, are similar throughout Germany. Finally, because of Germany’s relative-
ly small geographic dimensions, any unobservable variables — such as tax-paying mentality
— are likely more similar in our data than in cross-border studies (e.g., Klassen and Laplante
2012b) or compared to within-country studies in geographically larger and culturally more
heterogeneous countries, such as China (e.g., Shevlin et al. 2012) or the U.S. (e.g., Gupta and
Mills 2002).
We obtained access to a confidential dataset from the German fiscal authorities that
includes full trade-tax returns for all German-based commercial firms for the years 2001,
2004 and 2007 (5,116,719 firms). Our main set of tests focuses on the subset of firms that
have permanent establishments in more than one municipality. In our cross-sectional analysis,
we find that a greater share of total wages paid on the firm level is allocated to permanent
establishments in municipalities with relatively low trade tax rates. We also report that firms
with greater incentives to shift trade tax bases between municipalities (proxied by a higher tax
rate differential between the maximum trade tax rate and the minimum trade tax rate within a
firm) indeed exhibit relatively more income shifting with respect to these “extreme” munici-

6
palities. Following this cross-sectional analysis, in a panel analysis, we analyze how changes
in trade tax rates impact firms’ behavior over time and find evidence that firms react to
changes in trade tax rates with changes in location.
This study connects to three major research issues in international taxation. First, it fits
directly into the growing body of research on cross-border business income shifting in multi-
national enterprises. Such research is vital because global tax rate competition is increasing
the pressure on the tax revenues of developed countries. Second, in the U.S., multistate-level
research has been conducted to a notable extent in the past that has been aimed at investigat-
ing cross-state income shifting under a formulary apportionment regime. However, data avail-
ability is a key concern in this respect. The unique data and setting that are the focus of this
study offer a deeper understanding of the behavior of firms under formulary apportionment
between regions within one country that might be transferred to the U.S. context, although
allocation keys and further details might differ. Finally, the EU continues to debate a common
consolidated corporate tax base, which considers a joint tax base computation scheme for all
EU firms and an allocation of resulting tax revenue to member countries based on formulary
apportionment. Admittedly, this project has moved slowly because of the considerable politi-
cal disputes among member countries. However, there appears to be a common understanding
that the arm’s length standard that is currently applied has its flaws — some that are rather
serious to the public finances of certain EU member countries — and that formulary appor-
tionment might have the potential to increase the efficiency and effectiveness of tax systems
in the EU.
We contribute to the available literature on multinational enterprise income shifting by
exploiting a unique data set in a well-defined natural experiment at the firm level to show that
taxes impact location decisions. Our analysis arguably does not suffer from self-selection bias
because we have obtained data on all commercial firms in Germany. Furthermore, we use

7
genuine tax data; therefore, no estimation of any tax effects from accounting data is neces-
sary. Given these factors, we present a distinctive analysis of the effects of taxes on the be-
havior of firms.
The remainder of this paper is organized as follows. Section 2 provides a short over-
view of the institutional details of the German trade tax system. We review the empirical lit-
erature in Section 3 and subsequently develop hypotheses in Section 4. Section 5 describes the
data and the research design. We present our results and discuss robustness tests in Section 6,
and conclusions and summary comments are provided in Section 7.

8
2. Institutional Details of the German Trade Tax System
Politically, the Federal Republic of Germany has 16 states, and each state has several
districts (there are a total of 470 districts). Each district is subdivided into municipalities
(12,266 municipalities overall). Trade taxes collected are available to the municipalities di-
rectly and represent a major source of their public financing. Every municipality has the right
to set its trade tax rate independently but must apply the same national trade tax code and may
only collect taxes from firms that have a permanent establishment in its geographic area. Con-
sequently, competition is fierce among municipal governments to attract firms to establish
facilities in their municipalities.
From an empirical point of view, economically important municipalities — such as
Munich or Cologne — have higher trade tax rates (approximately 19.7 %) than lesser-known
municipalities that are mostly located in rural areas (some have tax rates as low as 0 % to at-
tract businesses).3 Consequently, there is a variety of trade tax rates in Germany (in our sam-
ple, between 0 % and 31.0 %, with a mean of 14.3 %). With the addition of general corporate
income taxes, the total corporate tax burden is approximately 35 % to 40 %, on average, dur-
ing our sample period; the individual income tax burden for high-income individuals amounts
to approximately 45 % (including the trade tax). Thus, the trade tax is an economically rele-
vant factor in firm decisions.
With respect to its legal application, the trade tax base is generally derived directly
from financial accounting income (with certain specific adaptations for trade tax purposes). It
is computed and audited on the firm level (in a single-firm financial statement tax audit).
When a firm has permanent establishments in more than one municipality, the firm-level trade
3 To calculate the trade tax rate, we compute the following: trade tax rate = trade tax levy rate / (trade tax levy
rate + 2000 %). This computation correctly considers the marginal statutory basic federal rate in our sample
period of 5 % (paragraph 11 of section 2 of the trade tax code) and the fact that the trade tax is deductible
from its own tax base (known as the circularity problem with German trade tax). Trade tax levy rates in our
sample period vary between 0 % and 900 %, with a mean of approximately 333 %.

9
tax base is allocated in a formulary apportionment regime with respect to the different munic-
ipalities, and trade taxes are paid directly to the municipalities accordingly. The sole alloca-
tion key in this regard is wages paid.4 Ceteris paribus, the allocation of wages paid between
municipalities has no direct impact on the financial statement of a firm, whereas a potential
decrease in the trade tax indirectly impacts net income. If a firm has only one permanent es-
tablishment, wages paid are irrelevant in the calculation of the trade tax burden.
As a result, when considering individual firms with permanent establishments in more
than one municipality, income shifting for trade tax purposes is only possible by changing
locations. In particular, changes in transfer prices on transactions between several permanent
establishments or the deliberate allocation of debt and intangible property has no impact on
the allocation of the trade tax base among the firm’s permanent establishments. Consequently,
the German trade tax system offers a unique natural experiment to analyze the effect of tax
rates (or tax rate changes) on location decisions.
4 We note that there are rare and exceptional cases, such as for firms with wind power stations (which general-
ly have limited permanent personnel) in which allocations are based on both wages paid (30 % weight) and
the value of property, plants, and equipment (70 % weight).

10
3. Literature Review
3.1 Overview
We investigate whether firms alter their “real” business activity — i.e., the allocation
of tangible resources — in response to tax incentives. Consistent with Gunny (2010), we dif-
ferentiate between two major channels of income shifting, which we denote as accounting
decisions and location decisions. Accounting decisions are broadly defined as any accounting
choice within generally accepted accounting principles (GAAP) that aims at “hiding” true
economic results (Dechow and Skinner 2000). In particular, we include transfer-pricing
changes because they are technically accounting decisions. Moreover, we include matters
such as changes in the financing structure (e.g., the tax-optimal allocation of debt) or in the
location of intangible property. We argue that these changes to business activity are relatively
easy to implement and reverse — compared, for instance, to the establishment of new facto-
ries and the relocation of employees — and are thus considered accounting decisions. Other
matters are included when they fulfill those requirements. On the contrary, a firm might gen-
erally decide to decrease its tax burden by location decisions, which we define as changing
the structure or timing of the firm’s tangible operations. Location decisions include reallocat-
ing factory equipment, such as machinery, or of personnel.
We first briefly discuss research on income shifting on its own merits and its determi-
nants; however, we refer to a review of the available literature in this area to avoid unneces-
sary repetition. Most research falls into this relatively broad category. Subsequently, we dis-
cuss the two threads of research that focus specifically on the effect of accounting decisions
on income shifting and, alternatively, on the effect of location decisions on income shifting
separately.

11
3.2 Income shifting on the merits
It is well documented that firms react to tax incentives by shifting income across juris-
dictions (for a detailed overview, see Shackelford and Shevlin 2001 and Devereux and Maf-
fini 2007). The consolidated tax burden decreases when income is shifted from a high-tax
jurisdiction to a low-tax jurisdiction. Because this shifting also generally leads to a decrease in
the tax base in a firm’s domestic country, policy makers in well-developed countries (with
relatively high tax rates) have become increasingly concerned about the possible tax revenue
losses that income shifting might evoke (Klassen and Laplante 2012b).
The first studies to investigate the cross-border income shifting of multinational firms
were Harris 1993 and Klassen et al. 1993. Both studies investigated whether tax rate differ-
ences between the parent company and its subsidiaries leads to income-shifting incentives.
Huizinga and Laeven 2008 were the first to investigate the extent and effect of tax rate differ-
entials on cross-border income shifting specifically between the subsidiaries of a multination-
al firm (rather than between a parent firm and subsidiaries). They find that income shifting
can also be observed between different subsidiaries and that this income shifting is ultimately
comparable to that between a parent firm and its subsidiaries.
Income shifting on the merits within one specific jurisdiction was investigated by
Gramlich et al. 2004, who relied on the specific Japanese setting of so-called keiretsu groups.5
A benefit of keiretsu groups is the possibility of effortlessly shifting income among member
firms. Using this setting, Gramlich et al. 2004 demonstrate that tax-induced income shifting
can be observed because high-tax-rate keiretsu group firms shift income to relatively low-tax-
rate firms in the same keiretsu group.
5 Keiretsu groups are diversified groups of manufacturing and trading firms that share the same financial insti-
tutions and adopt coordinated business strategies. They represent a significant portion of Japan’s economy.

12
Consistent with most recent research, Klassen and Laplante 2012b examine the long-
term cross-border income shifting of U.S. multinational firms. By considering two full dec-
ades of data, they investigate how income shifting behavior has changed over time and report
that income shifting has increased significantly — mainly because of declining regulatory
costs. Along the same lines, a previous study by Grubert 2003 has generally shown a negative
association between income shifting and the costs of income shifting. With increased globali-
zation, income shifting thus appears to be an ever-increasing phenomenon.
3.3 Accounting decisions
Previous research regarding the impact of accounting decisions on income shifting fo-
cuses largely on transfer prices, financing structures, and the location of intangible property.
Arguably one of the most important means of shifting income is the purposeful adjustment of
transfer prices on intra-firm trades. Intra-firm trading is economically relevant in magnitude
and constitutes approximately 40 % and 20 % of the U.S. and worldwide trading volumes,
respectively (Tang 2002). Transfer pricing changes might be particularly easy to implement
when cross-border transactions already exist because they must only be readjusted. Some ear-
lier studies in this area concentrate on the specific techniques that are used to shift income
from one jurisdiction to another (Newberry and Dhaliwal 2001; Mills and Newberry 2004).
For example, the types of balance sheet items most suitable for to set transfer prices in a tax
optimal manner have been investigated.
Other studies concentrate on the possible conflicts surrounding transfer price setting
for minimizing income tax and pursuing other firm goals (some of which might also be tax
related). In this context, Blouin et al. 2012 are the first to consider the conflict between trans-
fer prices and customs duties (‘all tax’). The authors mainly argue that high transfer prices on
goods delivered from low-tax jurisdictions to high-tax jurisdictions might minimize income
tax payments while concurrently evoking high customs duties — and vice versa. They find

13
that when income taxes and customs duties cannot be optimized simultaneously, considera-
tions involving the planning of customs duties outweigh income tax considerations. An eco-
nomically similar conflicting situation theoretically arises when transfer prices compete
against internal performance measures, such as schemes of internal management accounting
(Baldenius et al. 2004, Tang 2002).
Research on financing structures generally investigates whether firms shift debt into
high-tax jurisdictions to deduct interest payments and save taxes. To investigate this research
question on the merits, previous research has relied on tax reforms, such as the 1986 Ameri-
can tax reform, in which the tax benefits of foreign debt were decreased because of the intro-
duction of a foreign tax credit limitation. Newberry 1998 shows that this regulation leads
firms to reduce their domestic debt and issue more equity. This finding is consistent with that
of Collins and Shackelford 1992, who also report that U.S. firms issue more (preferred) stock
in reaction to the tax reform. Froot and Hines 1995 find that debt is reduced as a reaction to
the tax reform but cannot confirm the use of more equity. In addition to the rather isolated
effect of firms' reducing U.S. debt holdings, it has also been reported that the American tax
reform of 1986 in fact resulted in a shift of debt to low-tax foreign subsidiaries (Smith 1997;
Newberry and Dhaliwal 2001).
With a specific focus on the magnitude of income shifting from financing structure
decisions, Desai et al. 2004 compute that a 10 % increase in the tax rate is associated with
2.8 % more debt. Using European samples, Mintz and Weichenrieder 2005, Huizinga et al.
2008, Buettner et al. 2012 and Buettner and Wamser 2013 compute similar elasticities.
Regarding the allocation of intangible property, Dischinger and Riedel 2011 find that
in a setting of multinational firms domiciled in Europe, subsidiaries subject to relatively low
tax rates have more investments in intangible properties compared to subsidiaries subject to
relatively high tax rates. Similar results can also be shown more specifically for patents
14
(Karkinsky and Riedel 2012). These findings are consistent with the hypothesis that differ-
ences in tax rates lead to an allocation of intangible property such that license fees are deduct-
ible in high-tax jurisdictions and subject to taxation in low-tax jurisdictions.
We finally note that research on the repatriation of U.S. domestic firms connects to
research on income shifting by means of accounting decisions (see for example Altshuler and
Newlon 1993; Altshuler et al. 1995; Desai et al. 2001; Altshuler and Newlon 2003; Altshuler
and Grubert 2003; Krull 2004; Clausing 2005; Blouin and Krull 2009; Albring et al. 2011).
Thus, in a recent study, Klassen and Laplante 2012a investigate the impact of both reinvest-
ment-related incentives and incentives that stem from financial reporting income shifting
(similarly also: Collins et al. 1998; Newberry and Dhaliwal 2001; Mills and Newberry 2004).
Regarding the latter, in particular, they find that firms with higher financial reporting-related
incentives for earnings management are more aggressive in income shifting compared to other
firms. Desai et al. 2012 find that U.S. multinational enterprises use trade credits to allocate
capital from foreign low-tax jurisdictions to the U.S, which is arguably in response to the re-
patriation taxation regime.
3.4 Location decisions
Research has also begun to investigate the effects of tax incentives on the location of
tangible business activity. Because of data limitations in this field, such work must depend
considerably more on surveys, highly aggregated data or specific circumstances than the re-
search discussed above. We intend to add to this line of research by using a rather broad da-
taset (all commercial firms in Germany) with access to in-depth information (on the level of
the firm and to permanent establishments).
Single 1999 surveys 66 tax executives of major U.S.-based multinational firms in the
manufacturing industry to evaluate the importance of location-specific factors. In this study,

15
only five of the 29 factors are tax related, and all five tax factors ranked among the lower half
in importance for the location decision. Hence, she finds evidence that tax effects are of lim-
ited importance to location decision changes or that “tax might just follow business”. In a
more recent study, Graham et al. 2011 conduct a considerably larger survey of nearly 600 tax
executives and note that 44 percent of the respondents consider the deferral of tax expenses
that are reported in financial statements to be relevant for their decision to reinvest foreign
earnings outside of the U.S. Based on this finding, Graham et al. 2011 argue that possibly
(and legally) avoiding or deferring the recording of income tax expenses for financial ac-
counting is an important consideration in undertaking real investment. Because such a possi-
bility arises from foreign business activity, these findings indicate that financial accounting
for tax purposes has an impact on firms’ location decisions.
Research considering multiple states within one country often relates to tangible busi-
ness activity because tax bases are generally allocated based on formula apportionments with
allocation keys that are affected by location decisions. In their overview article, Shackelford
and Shevlin 2001 point out that multistate research has the advantage that non-tax factors are
more homogenous between states than between countries (although state tax regimes may
fundamentally differ). As a result, the multistate research arena provides an attractive setting
for empirical tests of the mechanisms used in jurisdictional tax planning. However, most of
the studies on multistate taxation (e.g., Klassen and Shackelford, 1998 and Lightner, 1999)
have conducted such tests with macro data aggregated at the state level. Firm-level data are
rarely available and cover only specific circumstances when they are available.
In the U.S., the formulary apportionment method is generally applied, with the alloca-
tion key being based on the portion of property, wages, and sales in each state6. Whereas
property and wages are considered to be factors indicating tangible business activity in the
6 State taxation schemes in the U.S. vary in the weights assigned to different factors; 13 states use equally
weighted formulas, 23 states double-weight sales and six states weight sales more than 50%.

16
definition in which it is used here, sales might at least partly be affected by accounting deci-
sions, such as transfer pricing. Apart from the exact allocation keys, the system is ultimately
similar to the German trade tax system (for details refer to Chapter 2). In this regard, Gupta
and Mills 2002 report that corporations doing business in several U.S. state jurisdictions with
different tax treatments have both greater incentive and more opportunities to shift income.
Specifically, a firm’s effective state tax rate generally decreases with the number of states in
which it files tax returns and firms use so-called sales factor apportionments to reduce effec-
tive tax rates, which confirms our conjecture that sales might be most influenced by non-
location decisions. Their findings are consistent with the previous work of Klassen and
Shackelford 1998 and Boucher 1993, who similarly report that the sales apportionment factor
lends itself most to state tax avoidance opportunities because it can be manipulated through
legal changes and accounting adaptations. Petroni and Shackelford 1995 and Petroni and
Shackelford 1999 conduct research at the firm level in U.S. multistate taxation and find that
state tax rates have a significant effect on the behavior of property-casualty insurers.
Other countries also provide valuable research opportunities for multiregional re-
search. Using a Canadian dataset from 1983-1991, Klassen and Shackelford 1998 report that
firms use a rather specific form of tax avoidance: manufactured shipments and their cross-
state taxation. Their results are consistent with firms strategically structuring their shipments
to reduce sales reported to states with relatively high reliance on the sales for taxation. Most
recently, Shevlin et al. 2012 investigate the effects of local tax incentives in Chinese sub-
national jurisdictions on income-shifting by Chinese national firms. In China, the central gov-
ernment has structured a set of regional tax incentives (e.g., economic zones, high-tech devel-
opment zones). Using hand-collected data (the final sample contains 320 firms), Shevlin et al.
2012 present evidence that income shifting towards low-tax regions within China occurs. Re-
grettably, with the data set at hand, they ultimately cannot distinguish whether the income

17
shifting is based primarily on accounting decisions (e.g., via transfer pricing adaptions) or on
changes in tangible operations.
Finally, archival literature exists regarding settings that allow investigations of loca-
tion decisions between multiple countries (see, for instance, Hines Jr 1997; Devereux and
Griffith 1998; De Mooij and Ederveen 2003; Buettner and Ruf 2007). Boskin and Gale 1987
find that a tax rate decrease (or a tax benefit) is associated with increased foreign direct in-
vestments. Similarly, Grubert and Mutti 2000 find that average effective tax rates have a sig-
nificant effect on the choice of investment location and also on the amount of capital invested.
We note that most of the literature on cross-border location decisions focuses on foreign di-
rect investments (Hanlon and Heitzman 2010). Most studies in this area confirm that the tax
rate in the subsidiary’s country is an important factor when considering investments (e.g.,
Hartman 1985; Grubert and Mutti 1991; Hines and Rice 1994; Swenson 2001). We note that
the German Federal Reserve Bank makes available a dataset pertaining to the foreign direct
investments of domestic German firms with foreign subsidiaries and of foreign firms invest-
ing in Germany (MiDi database). Research using this specific database has generally reported
that tax rates affect firms’ investment decisions (Weichenrieder 2009, Ruf and Weichenrieder
2012). Ultimately, cross-border research on location decisions faces the issue of considerable
heterogeneity between countries (which is greater than between regions within one country).

18
4. Hypotheses Development
4.1 Trade tax rates and tax base allocation to facilities (cross-sectional analysis)
Changes in real operations are complex, and many non-tax factors are to be consid-
ered, including, but not limited to, local infrastructure, labor supply, (business) culture, eco-
nomic and political risk, geographic distance to customers, and costs of capital in segmented
global capital markets. Based on this observation, it has been argued that when different tax
rates apply in different locations, firms typically do not alter their location decisions in re-
sponse to this tax incentive but instead use accruals manipulation to shift income to low-tax
jurisdictions (e.g., Harris 1993; Klassen et al. 1993; Huizinga and Laeven 2008).
In this context, Shevlin et al. 2012 explicitly interpret their findings to mean that in-
come shifting in China through accounting decisions is more likely than reallocating real op-
erations and that lower local tax rates are not automatically associated with greater levels of
real investment. Ultimately, however, Shevlin et al. 2012 acknowledge that it is impossible
for them to clearly distinguish between accruals manipulation and changes in real operations
because they “[…] do not have data on the assets located within each subsidiary of the con-
solidated group”. Similar to Shevlin et al. 2012, we focus on one country with tax rate varia-
tion across regions, which has the advantage that country-specific institutional factors are
largely similar, particularly in well-developed and (relatively) geographically small countries,
such as Germany. Germany also provides considerable variation in its municipal trade tax
rates (i.e., ranging from 0 % to 31.0 %).
For the sake of simplicity and comprehensibility, we derive our hypotheses based on a
hypothetical firm A. Firm A is in no way representative or even realistic, but this method al-
lows for a straightforward discussion of the expected effects in our setting. We assume the
following initial situation: firm A has total wages paid that amount to $6,000 and are paid to
19
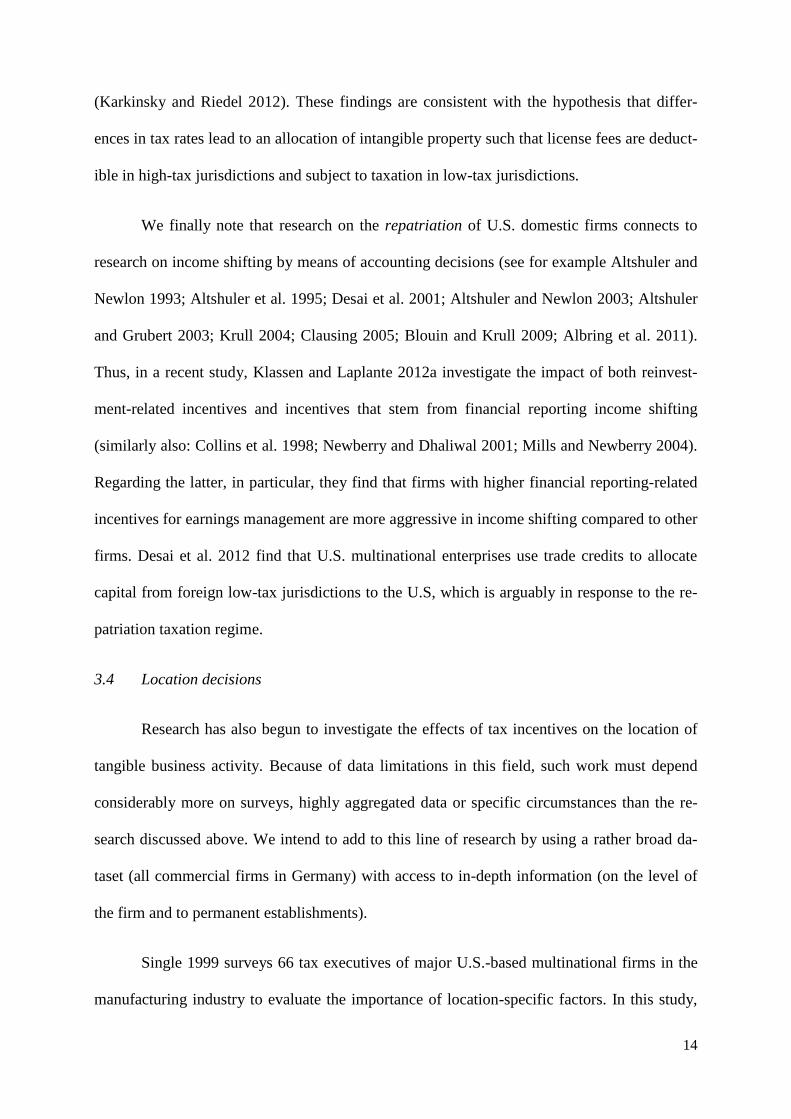
personnel in two facilities in two different municipalities. These municipalities are exactly
alike in all parameters. In this case, an average firm A should be indifferent about where to
locate its assets and personnel; thus, it should allocate personnel equally between facility 1
and facility 2 (each $3,000).
Figure 1: Example Initial Situation.
We continue our example and change only the tax rates for one of the hypothetical
municipalities. Firm A now faces a tax rate of 25% in facility 1 and a tax rate of 15% in facili-
ty 2. As a consequence, firm A has a tax incentive to allocate relatively more wages paid to
facility 2 than to facility 1. The allocation of wages paid might be as follows:
Figure 2: Example for H1a.
If we were to apply our example strictly and without transaction costs, to minimize its
tax burden under the German trade tax regime, firm A would, ceteris paribus, shift all person-
nel to facility 2. However, because of non-tax factors in real location decisions (e.g., geo-
graphic distance to valuable customers in municipality 1), this extreme result does not occur.
We note at this point that no decrease in tax burden would result from a mere accounting allo-
cation of income to facility 1 or facility 2. Technically, we hypothesize the following (all hy-
potheses in the alternative form):
Tax Rates Wages Paid
t0 t0
Facility 1 25% $3,000
Facility 2 25% $3,000Firm A
Tax Rates Wages Paid
t0 t0
Facility 1 25% $1,000
Facility 2 15% $5,000Firm A

20
H1a: The wages paid with respect to a particular facility are higher if the trade tax rate is
lower and vice versa.
Exploring this argument further, ceteris paribus, an incentive to shift income within a
firm is greater if the tax rate differential between the lowest and highest tax rates applicable to
any facility is higher. In our example, assume two different cases:
Figure 3: Example for H1b.
Firm A would naturally have a greater tax incentive to shift income from facility 1 to
facility 2 in case 1 than in case 2. Thus, the net benefit of reallocating employees would be
larger in case 1. We thus hypothesize the following:
H1b: The larger the trade tax rate differential of a firm (∆intra-period(Tax Rates)), the larger its
wages paid differential will be (∆intra-period(Wages Paid)) and vice versa.
Tax Rates Wages Paid
Case 1 t0 t0
Facility 1 25% $1,000
Facility 2 15% $5,000
∆ intraperiod 10 -$4,000
Case 2 t0 t0
Facility 1 25% $2,000
Facility 2 20% $4,000
∆ intraperiod 5 -$2,000
Firm A
Firm A

21
4.2 Changes in trade tax rates and tax base allocations to facilities over time
(panel analysis)
Despite treating data as cross-sectional in H1a and H1b, the available data in fact have
a panel structure. Thus, we investigate in the following how firms react to changing trade tax
rates over time. Consider the two cases in the continued example:
Figure 4: Example for H2a.
When considering only facility 2 in case 1, the firm faces a decrease in local tax rates
from 20 % to 15 % over time. Consequently, ceteris paribus, the firm might shift personnel
into the facility (wages paid increase from $4,000 to $5,000), with a corresponding decrease
in facility 1 (wages paid decrease from $2,000 to $1,000). Alternatively, considering case 2,
in which facility 2 faces a more distinct decrease in local tax rates from 20 % to 10 %, the
effects should be even stronger. Vice versa, an increase in tax rates at facility 1 should have
the economically opposite effect in both cases. We hypothesize the following:
Case 1 t0 t1 t0 t1
Facility 1 25% 25% $2,000 $1,000
∆ interperiod
Facility 2 20% 15% $4,000 $5,000
∆ interperiod
Case 2 t0 t1 t0 t1
Facility 1 25% 25% $2,000 $500
∆ interperiod
Facility 2 20% 10% $4,000 $5,500
∆ interperiod
Firm A0 not considered in H2a
-10 $1,500
Tax Rates Wages Paid
0 not considered in H2aFirm A
-5 $1,000

22
H2a: The larger the increase in the trade tax rate for a particular facility over time
(∆inter-period(Tax Rates)), the larger the decrease in wages paid of that facility over time
will be (∆inter-period(Wages Paid)) and vice versa.

23
5. Sample Selection and Research Design
5.1 Sample selection
We use a unique dataset from the German fiscal authorities. The dataset contains con-
fidential tax return data for the full population of all German commercial firms that were sub-
ject to trade tax in 20017, 2004, and 2007. This dataset includes data from corporations, part-
nerships and single entrepreneurs. Data are available at the level of single tax payers (single
firms) but excludes any identifying information. We merge this confidential dataset with a
regional dataset to insert economic variables on the district level into our analyses.
Our sample selection criteria are described in Table 2. We begin with the full popula-
tion of German firms liable for trade tax and their complete annual trade tax return infor-
mation. Our initial sample contains 5,116,719 firms with 9,720,291 facility-years. We exclude
firms that do not contain cases of trade tax allocation by means of formulary apportionment
(i.e., firms without a permanent establishment in more than one municipality), which reduces
our sample to 278,918 firms (2,012,817 facility-years). We exclude firms with missing values
for trade tax levy rates or missing identifying municipality codes (23,064 firms excluded).
Additionally, we limit our investigation to firms turning a profit, i.e., we exclude loss firms
and firms with loss carryforwards as reported on their tax returns (92,972 firms excluded).
Moreover, we eliminate all firms for which trade tax base allocation is not conducted with
regard to wages paid (976 firms excluded)8. Finally, we exclude all firms in which the sum of
total wages paid for a firm is equal to zero (19,830 firms excluded). Our resulting main sam-
ple thus consists of 617,262 facility-years from 142,076 firms.
(Insert Table 2 about here)
7 We convert 2001 values, which are in the currency Deutsche Mark, to the Euro by dividing the Deutsche
Mark values by the relevant factor 1.95583. 8 Refer to Footnote 4 for a discussion. By eliminating these firms, we ensure that only tangible income shifting
firms are investigated.

24
For inter-periodic analyses, we must further ensure that a specific firm can be followed over
time. Therefore, we exclude all firms that exist in only one of the three sample periods (i.e.,
only in 2001, 2004 or 2007),9 which reduces our sample to 21,589 firms (199,575 firm-years).
5.2 Research design
5.2.1 Trade tax rates and the tax base allocation to facilities (cross-sectional analysis)
To implement the intra-periodic approach for H1a, we treat our dataset as cross-
sectional and estimate equation (1a) using OLS10
:
where is wages paid for each facility of firm i in municipality j, scaled by total wages
paid for each firm i.11
is the trade tax rate of municipality j in which the facility is
domiciled (with the trade tax levy rate being linearly transformable to the trade tax rate, as
discussed in Section 2) scaled by the weighted average trade tax rate of firm i.12
We then con-
trol for firm-level variation. The matrix includes one non-dichotomous varia-
ble ( of each firm) and four firm-specific dummy variables:
, , , and We further control for
regional factors using a variety of macroeconomic variables. The matrix
includes the following three different municipality-specific varia-
9 There are several reasons why firms exist in only one of the three sample periods, including bankruptcy,
termination of business, establishment after 2004, or a changed tax ID. 10
A description of all variables used in this manuscript can be found in Table 1 11
If a firm has more than one permanent establishment in the same municipality, these permanent establish-
ments are consolidated and considered as one joint facility. The reason for this is straightforward. Within one
municipality, the trade tax rate for every facility is equal at all points in time. Thus, when investigating the
shifting behavior of a firm, we are interested in how many wage earners are allocated toward a specific mu-
nicipality (thus a specific trade tax rate) on the firm level. Thus, different permanent establishments of one
firm in only one specific municipality are a formal distinction of German tax law, which is not relevant to our
economic analysis at this point. 12
We scale the tax rate for each facility by the weighted average tax rate of the firm because firms face differ-
ent average levels of trade tax. Under these circumstances, tax-induced incentives on the level of an individu-
al municipality impact firms and scaling controls for this effect differently.

25
bles: , and . The matrix
includes more than 15 district-specific variables:
,
,
, , and , where k is the
anonymized district identifier. We anticipate that a higher trade tax rate is associated with
lower total wages paid for a particular facility; thus, consistent with H1a, we predict < 0.
In H1b, we ask whether firms with large trade tax rate differentials (i.e., a large differential
between the highest trade tax rate and the lowest trade tax rate within one firm) shift more
tangible operations into the extremal municipalities compared to firms with small trade tax
rate differentials. Thus, we estimate equation (1b) as the following:
where is the difference in the wages paid between the facility with the highest
and the facility with the lowest trade tax levy rate within one firm i scaled by total wages paid
for each firm i. We create four equally sized bins of trade tax rate differentials (i.e., the differ-
ences between the maximum and the minimum of TaxRatei for a single firm i within one par-
ticular year). Firms with a trade tax rate differential in the lowest quartile of the sample (i.e.,
firms with relatively small tax-induced shifting incentives) fall into the first , labeled Diff. Tax
Rate 0-25%, and so forth for the other three bins. The municipality-and district-level controls
from equation (1a) are computed as the differential between the facility with the highest trade
tax rate and the facility with the lowest trade tax rate. Considering H1b, we expect that the

26
significance and level of personnel located in facilities in low-tax municipalities will be high-
er in a bin that has higher incentives in terms of shifting income ( < < 0).
5.2.2 Changes in trade tax rates and tax base allocations to facilities over time (panel analysis)
The second part of our analysis investigates how firms react to varying tax rates over
time. To test H2a, i.e., whether firms react to time-varying trade tax rates with tangible
changes in business activity (i.e., in our study, through personnel shifting), we employ the
following equation (2a):
where is the first difference of total wages paid between periodt and periodt-1 for
each facility of firm i, both scaled by total wages paid of each firm i of the particular year.13
We create four equally sized upward and downward bins of the first difference of the
TaxRatej,t between periodt and periodt-1 for each municipality j, both periods scaled by the
weighted average trade tax rate of the firm i of the particular year. Firms with a upward
(downward) first difference in the lowest quartile of the sample fall into the first bin, labeled
, and so forth for the other three bins.
All control variables discussed above are likewise included as first difference variables.14
We
13
More precisely, period t and t-1 means 2007, 2004, and 2001. 14
In so doing, we control for the fact that the change in personnel shifting might also be caused by a change in
the unemployment rate from 2001 to 2004, for example, and not by the change of the trade tax levy rate.

27
expect that a higher positive (negative) first difference in the tax rate from one period to an-
other is associated with a higher negative (positive) first difference in total wages paid for a
particular facility. Therefore, consistent with H2a, we predict that < < 0 and
< < 0.

28
6. Empirical Results
6.1 Descriptives
Table 3 shows the descriptive statistics for the main and control variables in our regres-
sion models, which are on a firm, municipality or district level. The mean of , which
is defined as the wages paid for each facility of a firm i in municipality j scaled by the total
wages paid by each firm i, is 0.31. Our main variable of interest, which is the trade
tax rate of the municipality j in which the facility is domiciled scaled by the weighted average
trade tax rate of firm i, has a mean of 1.11.15
Municipalities and districts are naturally heterogeneous (to some extent). In particular,
the number of inhabitants per municipality shows notable variation, with the minimum being
five inhabitants (for the municipality of Wiedenborstel) and the maximum being 3.4 million
inhabitants (for the municipality of Berlin). In terms of economic indicators, the average GDP
in EUR per inhabitant ranges between 13,085 (in the Sudwestpfalz district) and 86,728 (in the
Munich district), with a mean of approximately 27,872, whereas the unemployment rate var-
ies between 2.2% (in the Eichstätt district) and 22% (in the Demmin district), with a mean of
approximately 7.88 %.
(Insert Table 3 about here)
Pairwise correlations between selected variables are shown in Table 4. The correlation
matrix shows that the independent variables in our regression are generally not strongly corre-
lated, which indicates limited multicollinearity issues. More specifically, the Pearson correla-
tions are mostly less than 50 %. However, the total No. of Inhabitants appears to be correlat-
ed strongly with variables such as Real Property Tax B, Size of District, Average Purchase
Price Land, GDP per Inhabitant, and Tourism - Beds.
15
Data confidentiality prohibits the publication of certain parameters (e.g., minimum, maximum) for certain
variables.

29
(Insert Table 4 about here)
6.2 Hypotheses testing
We report four different models for each hypothesis, with models differing in the extent
to which control variables are included. Model 1 includes only the treatment variable
TaxRatej and four firm controls. To isolate the effect of trade tax rates on location decisions,
we control for several municipality and district characteristics in further models. Control vari-
ables at the municipality and district levels allow us to control for the general economic envi-
ronment of a certain region, which in turn allows us to control for the remaining heterogenei-
ties between locations within Germany that might explain differences in wages in a given
facility on their own. Therefore, in model 2, we add selected municipality-level controls.
Model 3 further includes district-level controls on an aggregated level. For instance, the vari-
able MovingInj is incorporated into our regression only as a total, instead of separating it fur-
ther into different age groups (e.g., under 18 and between 18 and 25). Finally, model 4 in-
cludes district controls on a disaggregated level and a full set of district-fixed effects (i.e., 470
different district indicator variables). All models include industry-fixed effects.
(Insert Table 5 about here)
Consistent with H1a, we observe in Table 5 that wages paid are higher in facilities with
lower trade tax rates, and the coefficients of TaxRatej are significantly negative in all four
models. This finding suggests that firms with facilities in more than one municipality use lo-
cation decisions (reallocation of personnel) to save trade taxes; thus, the location decisions of
firms are indeed altered in response to tax incentives.
To control for the economic reasonableness of our results, we form certain expecta-
tions with regard to the control variables (as indicated by the predicted sign). For instance, we
30
find a positive and significant sign for Inhabitants, which is expected because the number of
inhabitants in a municipality indicates a large labor market, which in turn might indicate high-
er wages paid per facility within that respective location; that is, we expect larger facilities in
municipalities with larger labor markets. The control variable Real Property Tax A, which is a
special tax for agricultural activity in a given municipality, shows an expected negative asso-
ciation with wages paid because it is a proxy for more rural characteristics in a particular mu-
nicipality. We note that further control variables have significant association with Wageij, but
we do not interpret these variables in detail.
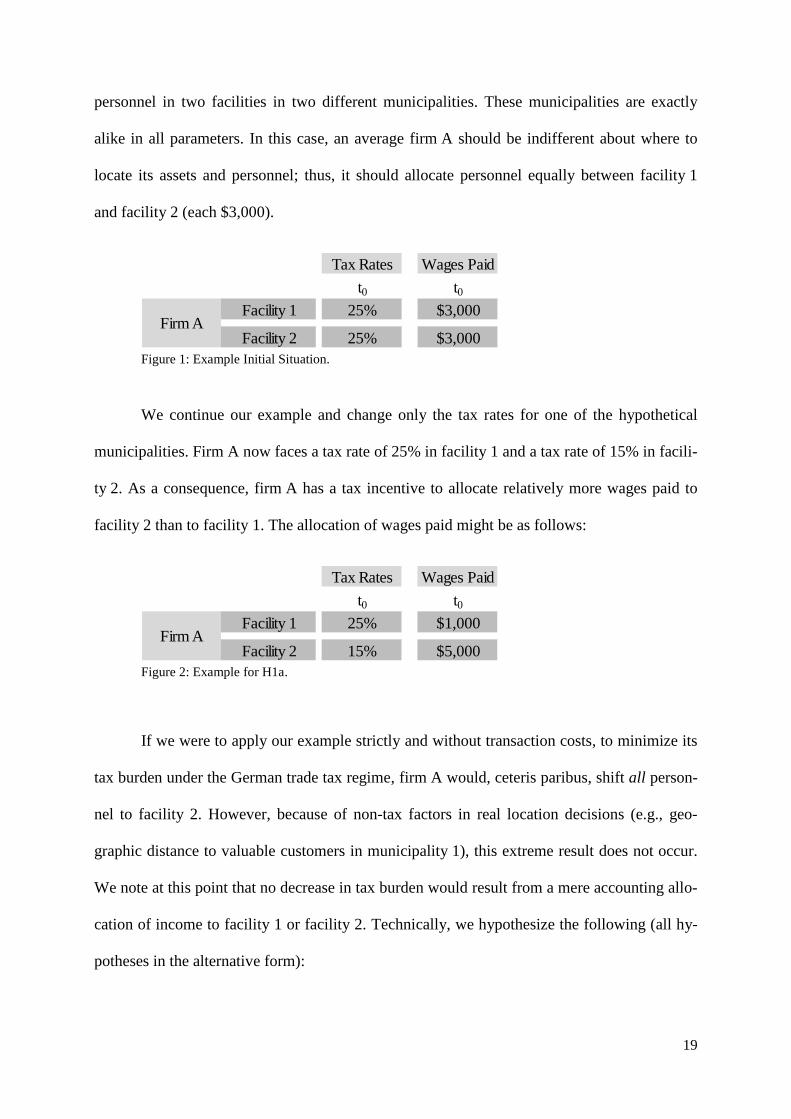
Considering H1b (Table 6), we expect that the significance and the level of personnel
located in facilities in low-tax municipalities will be higher in a bin with greater incentives in
terms of shifting income.
(Insert Table 6 about here)
Indeed, we find that firms react more when they exhibit higher trade tax differentials.
Considering models 1 and 2, which include firm- and municipality-level controls, respective-
ly, we find that the coefficients on the treatment variable bins are insignificant except for the
bin with the highest tax incentives (Diff. Tax Rate 75-100) for which the coefficient is signif-
icantly negative, which is as expected. In model 3, in which we further include aggregated
district control variables, we observe that differences in real activities between facilities ap-
pear to be induced by the level of trade tax rate differentials. Technically, the coefficient and
the corresponding T-value increase in absolute value step-by-step with each bin. Model 4,
with disaggregated district controls and also district-fixed effects, validates this finding. We
interpret this finding to mean that small trade tax rate differentials do not significantly moti-
vate firms to shift personnel because the costs of personnel shifting most likely are high com-
pared to the corresponding tax benefits. Conversely, if the trade tax rate differential is large,

31
firms appear to recognize an advantage in shifting personnel to tax-favored facilities; there-
fore, the tax savings seem to outweigh the costs of shifting.
Considering the control effects for the sake of discussion, the variable Diff. Unem-
ployment Rate shows a predicted negative sign, which indicates that a relatively higher unem-
ployment (rate) means that the labor market has more oversupply and, ceteris paribus, average
wages per employee might be lower, which in turn predicts lower wages per facility. Addi-
tionally, the coefficients of the control variables Diff. GDP per Inhabitants and Diff. Average
Purchase Price Land, which are both proxies for the economic strength of a district, are sig-
nificantly positive. This finding may be interpreted to indicate that wages paid are higher in
more economically attractive districts.
In contrast with the tests for hypotheses H1a and H1b, which are intra-periodic anal-
yses, we test in H2a whether firms react to trade tax rate changes over time (inter-periodic
analysis, Table 7). Thus, we use a slightly adjusted first-difference model. Similar to H1b, we
now create four upward and four downward bins of trade tax rate changes. Firms with a trade
tax rate upward (downward) change in the lowest quartile of the sample. Thus, firms with
relatively small tax-induced shifting incentives fall into the first bin, labeled ∆ Tax Rate up 0 -
25 (∆ Tax Rate down 0 - 25); the process is similar for the remaining bins.
In Table 7, Panel A, we present results for the association between changes in wages
paid and tax rate changes for the 2001-2004 period (short time horizon). We observe that
firms appear to react more to tax rate decreases than to tax rate increases, which indicates that
an upward tax rate change is only associated with a reduction in the workforce (away from the
respective facility) if the tax rate change is in the highest quartile. Downward tax rate changes
appear to have a greater effect in inducing firms to shift personnel; the relevant coefficients
and T-values increase in absolute value step-by-step with each downward bin, which persists
over all four models.

32
Panel B of Table 7 reports the findings from our investigation of tax rate changes from
2001 to 2007 (a long time horizon) in which we generally find that firms react more strongly
if they have more time to adapt to tax rate changes. Technically, both upward and downward
tax rate changes are associated with significant changes in wages paid over the longer time
horizon with the expected coefficients. We interpret this to mean that location decisions are
indeed shifted but only at a relatively slow pace, which contrasts the quick pace of shifting
through accounting decisions that can be implemented quickly through transfer pricing or the
allocation of debt. Shifting personnel is relatively complex to implement (and reverse) and
must therefore be carefully considered and is thus more time-consuming.
(Insert Table 7 about here)

33
6.3 Robustness tests
We conduct several sets of robustness tests to evaluate our reported results. We first
determine the reliability of our results by clustering on a district level. Moreover, we use addi-
tional models (i.e., including further variations of the available control variables) to validate
our results. In these untabulated results, we find that all our results are economically and sta-
tistically stable.
Secondly, to further strengthen the support for our findings with respect to H1b, we re-
run the regression by replacing the dummy bins with the actual tax rate differential (Table 8).
is the difference between the maximum and the minimum of TaxRatei for a
single firm i within one particular year scaled by the weighted average trade tax rate of firm i.
We find in all four models that firms with relatively higher tax rate differentials between mu-
nicipalities with the highest trade tax rate and the lowest trade tax rate have relatively more
employees located in facilities with the lowest firm-specific tax rate (
). Thus, firms appear to react to greater incentives for income
shifting by changing their real activities.
(Insert Table 8 about here)
Third, to validate our findings regarding the inter-periodic analyses in H2a, we con-
duct additional tests based on the previous research design (Table 9). In addition to the tax
rates of a given facility, the tax rate differential between a given firm's facilities at the highest
and lowest tax rates may vary over time when either the firm’s highest and/or lowest trade tax
rate changes:16
16
For our analysis, we only include cases in which the municipalities with the highest and lowest trade tax rates
of a given firm remain unchanged over time. Thus, if a medium-ranked trade tax rate changes so much be-
tween the first and second periods that the municipality becomes one of the firm’s extremal trade tax rate
municipalities (minimum or maximum), the respective firm is excluded.

34
Figure 5: Example for Inter-periodic Robustness Test.
For firm A, the trade tax rate differential in the first period is ∆intra-period, which equals
5. Because of a decrease in the minimum trade tax rate (here, a decrease from 20 % to 15 %
for facility 2), the trade tax rate differential increases between the first and second periods
(∆intra-period: 10). The same effect would occur with an increase in the maximum trade tax rate
for firm A with facility 1 (not considered in the example). We expect that firms would react to
such a change over time (∆inter-period: 10 - 5 = 5) with tangible income shifting. Based on such
arguments, in the second period, there is a greater incentive to shift personnel to facility 2.
Consequently, in the second period, we expect that the wages paid are relatively higher in
facility 2 compared to period 1. As a result, the difference in wages paid between the two fa-
cilities (∆inter-period: -$2,000) is expected to increase between the first period (∆intra-period: -
$2,000) and the second period (∆intra-period: -$4,000). Moreover, the larger the change over
time (case 1: ∆inter-period = 5; case 2: ∆inter-period = 15), the larger the difference in wages paid
over time will be (case 1: ∆inter-period = -$2,000; case 2: ∆inter-period = -$3,000). However, in our
dataset, we do not find this effect directly for the small time horizon (i.e., tax rate differentials
increase from 2001 to 2004, as shown in Table 9, Panel A). In only one of the four models
Case 1 t0 t1 t0 t1
Facility 1 25% 25% $2,000 $1,000
Facility 2 20% 15% $4,000 $5,000
∆ intraperiod 5 10 -$2,000 -$4,000
∆ interperiod
Case 2 t0 t1 t0 t1
Facility 1 25% 25% $2,000 $500
Facility 2 20% 5% $4,000 $5,500
∆ intraperiod 5 20 -$2,000 -$5,000
∆ interperiod
Firm A
15 -$3,000
Tax Rates Wages Paid
Firm A
5 -$2,000

35
(Model 4) do we observe that the larger the positive change in the trade tax rate differential of
a firm over time (∆inter-period), the larger the change is in the differential in wages paid. All
other models show the opposite effect. In further investigating the longer time horizon (Table
9, Panel B), we also do not find the expected results.
(Insert Table 9 about here)
Finally, following exactly the same argument, the trade tax differential of a firm might
also decrease over time (leading to a relative decrease in tax incentives with respect to tangi-
ble decisions, untabulated). We find that firms do not react (in a statistically significant man-
ner) to this decreasing tax rate differential.

36
7. Conclusion
We investigate the impact of taxes on location decisions for a full sample of all com-
mercial firms in Germany (5,116,719 firms) during the 2001-2007 period. To specifically
observe the location decisions of a firm, we use the peculiarity of the German trade tax regime
in which formulary apportionment is used to allocate the tax base for the different facilities of
a firm that are faced with different tax rates at the municipality level. In this respect, wages
paid at a facility are used as the sole allocation key. Contrary to location decisions, accounting
choices do not impact the allocation of a tax base in these cases and are thus excluded as an
explanation. The trade tax scheme applied has considerable variation in tax rates across
12,266 German municipalities, and the trade tax rate is economically relevant to German
firms, which provides us with a valuable natural experiment from which we can derive mean-
ingful findings about the behavior of multinational enterprises.
We report three distinct main findings. First, we find that tax rates are associated with
the allocation of wages paid between the facilities of a firm (i.e., the location of employees) in
a manner that is consistent with our hypothesis of the tax-induced effects on location deci-
sions. Second, when tax rates vary over time, firms appear to react by transferring personnel
to facilities in municipalities with lower tax rates, and this effect increases with the length of
the time period. Third, the greater the tax incentives of a firm, the greater the reaction as
shown in tangible business activity changes with respect to the relevant tax incentives will be.
Overall, we conclude that taxes thus notably impact a firm’s location decisions.
This paper contributes to the ongoing debate about the channels of income shifting.
Income shifting might be based primarily or even solely on accounting decisions (e.g., via
transfer pricing, location of debt, and the location of intangible property) or might also be
based on changes in tangible operations. Our findings suggest that tax rates can induce firms

37
to alter their location decisions. We conclude that the relevance of tax rates for location deci-
sions may thus have been underestimated.

38
References
Albring, Susan M., Lillian F. Mills and Kaye J. Newberry (2011). Do Debt Constraints Influence
Firms' Sensitivity to a Temporary Tax Holiday on Repatriations? Journal of the American
Taxation Association 33(2): S. 1-27.
Altshuler, Rosanne and Harry Grubert (2003). Repatriation taxes, repatriation strategies and multina-
tional financial policy. Journal of Public Economics 87(1): S. 73-107.
Altshuler, Rosanne and T. S. Newlon (2003). The Effects of U.S. Tax Policy on the Income Repatria-
tion Patterns of U.S. Multinational Coporations, in: A. GIOVANNINI, R. G. HUBBARD and J.
SLEMROD, Studies in International Taxation, University of Chicago Press, Chicago, 77-115.
Altshuler, Rosanne, T. S. Newlon and W. C. Randolph (1995). Do Repatriation Taxes Matter? Evi-
dence from the Tax Returns of U.S. Multinationals, in: MARTIN FELDSTEIN, JAMES R. HINES
and R. G. HUBBARD, The Effects of Taxation on Multinational Corporations, University of
Chicago Press, Chicago, 253-272.
Altshuler, Rosanne and T. Scott Newlon (1993). The Effects of U.S. Tax Policy on the Income Repat-
riation Patterns of U.S. Multinational Corporations. Studies in International Taxation. ALBER-
TO GIOVANNINI, R. GLENN HUBBARD and JOEL SLEMROD, University of Chicago Press.
Baldenius, Tim, Nahum D. Melumad and Stefan Reichelstein (2004). Integrating Managerial and Tax
Objectives in Transfer Pricing. Accounting Review 79(3): S. 591-615.
Blouin, Jennifer and Linda Krull (2009). Bringing It Home: A Study of the Incentives Surrounding the
Repatriation of Foreign Earnings Under the American Jobs Creation Act of 2004. Journal of
Accounting Research 47(4): S. 1027-1059.
Blouin, Jennifer L., Leslie A. Robinson and Jeri K. Seidman (2012). Coordination of Transfer Prices
on Intrafirm Trade, available at:
Boskin, M. J. and W. G. Gale (1987). New Results of the Effects of Tax Policy on the International
Location of Investment, in: MARTIN FELDSTEIN, The Effects of Taxation on Capital Accumu-
lation, University of Chicago Press, Chicago, 201-219.
Boucher, Karen J. (1993). Multistate corporate tax-saving strategies. Journal of State Taxation 12: S.
23-57.
Buettner, Thiess, Michael Overesch, Ulrich Schreiber and Georg Wamser (2012). The Impact of Thin-
Capitalization Rules on Multinationals' Financing and Investment Decisions. Journal of Public
Economics 96(11-12): S. 930-938.

39
Buettner, Thiess, Nadine Riedel and Marco Runkel (2008). Strategic Consolidation Under Formula
Apportionment, available at: http://papers.ssrn.com/sol3/papers.cfm?abstract_id=1313028, 1-
35.
Buettner, Thiess and Martin Ruf (2007). Tax Incentives and the Location of FDI: Evidence from a
Panel of German Multinationals. International Tax and Public Finance 14(2): S. 151-164.
Buettner, Thiess and Georg Wamser (2013). Internal debt and multinationals' profit shifting - empiri-
cal evidence from panel data. National Tax Journal: S. erscheint demnächst.
Clausing, Kimberly A. (2005). Tax Holidays (and Other Escapes) in the American Jobs Creation Act.
National Tax Journal 58(3): S. 331-346.
Collins, Julie H. and Douglas A. Shackelford (1992). Foreign Tax Credit Limitations and Preferred
Stock Issuances. Journal of Accounting Research 30(3): S. 103-124.
Collins, Julie, Deen Kemsley and Mark Lang (1998). Cross-Jurisdictional Income Shifting and Earn-
ings Valuation. Journal of Accounting Research 36(2): S. 209-229.
De Mooij, Ruud A. and Sjef Ederveen (2003). Taxation and Foreign Direct Investment: A Synthesis of
Empirical Research. International Tax and Public Finance 10(6): S. 673-693.
Dechow, Patricia M. and Douglas J. Skinner (2000). Earnings Management: Reconciling the Views of
Accounting Academics, Practitioners, and Regulators. Accounting Horizons 14(2): S. 235-
250.
Desai, Mihir A., C. Fritz Foley and James R. Hines, Jr. (2004). A Multinational Perspective on Capital
Structure Choice and Internal Capital Markets. Journal of Finance 59(6): S. 2451-2487.
Desai, Mihir A., C. Fritz Foley and James R. Hines, Jr. (2012). Trade Credit and Taxes, available at:
http://www.nber.org/papers/w18107.pdf?new_window=1
http://papers.ssrn.com/sol3/papers.cfm?abstract_id=2066404, 1-31.
Desai, Mihir A., C. Fritz Foley and Jr James R. Hines (2001). Repatriation Taxes and Dividend Distor-
tions. National Tax Journal 54(4): S. 829-851.
Devereux, Michael P. and Rachel Griffith (1998). Taxes and the location of production: Evidence
from a panel of US multinationals. Journal of Public Economics 68(3): S. 335.
Devereux, Michael P. and Giorgia Maffini (2007). The Impact of Taxation on the Location of Capital,
Firms and Profit: A Survey of Empirical Evidence, available at:
http://www.sbs.ox.ac.uk/centres/tax/Documents/working_papers/WP0702.pdf, 1-53.

40
Dischinger, Matthias and Nadine Riedel (2011). Corporate taxes and the location of intangible assets
within multinational firms. Journal of Public Economics 95(7/8): S. 691-707.
Froot, K, A. and J. R. Hines (1995). Interest Allocation Rules, Financing Patterns, and the Operations
of U.S. Multinationals. The Effects of Taxation on Multinational Corporations. M. FELDSTEIN,
J. R. HINES and R. G. HUBBARD. Chicago, University of Chicago Press: 277-307.
Graham, John R., Michelle Hanlon and Terry Shevlin (2011). Real Effects of Accounting Rules: Evi-
dence from Multinational Firms’ Investment Location and Profit Repatriation Decisions.
Journal of Accounting Research 49(1): S. 137-185.
Gramlich, Jeffrey D., Piman Limpaphayom and S. Ghon Rhee (2004). Taxes, keiretsu affiliation, and
income shifting. Journal of Accounting and Economics 37(2): S. 203-228.
Grubert, Harry (2003). Intangible Income, Intercompany Transactions, Income Shifting, and the
Choice of Location. National Tax Journal 56(1): S. 221-242.
Grubert, Harry and John Mutti (1991). TAXES, TARIFFS AND TRANSFER PRICING IN MULTI-
NATIONAL CORPORATE DECISION MAKING. Review of Economics & Statistics 73(2):
S. 285.
Grubert, Harry and John Mutti (2000). Do Taxes Influence Where U.S. Corporations Invest? National
Tax Journal 53(4): S. 825-839.
Gunny, Katherine A. (2010). The Relation Between Earnings Management Using Real Activities Ma-
nipulation and Future Performance: Evidence from Meeting Earnings Benchmarks. Contem-
porary Accounting Research 27(3): S. 855-888.
Gupta, Sanjay and Lillian F. Mills (2002). Corporate multistate tax planning: benefits of multiple ju-
risdictions. Journal of Accounting and Economics 33(1): S. 117-139.
Hanlon, Michelle and Shane Heitzman (2010). A review of tax research. Journal of Accounting and
Economics 50(2-3): S. 127-178.
Harris, David G. (1993). The Impact of U.S. Tax Law Revision on Multinational Corporations' Capital
Location and Income-Shifting Decisions. Journal of Accounting Research 31(3): S. 111-140.
Hartman, David G. (1985). TAX POLICY AND FOREIGN DIRECT INVESTMENT. Journal of Pub-
lic Economics 26(1): S. 107-121.
Hines Jr, James R. (1997). Tax policy and the activities of multinational corporations. Fiscal Policy:
Lessons from Economic Research. A. AUERBACH. Cambridge, MIT Press: 401–445.
Hines, Jr James R. and Eric M. Rice (1994). FISCAL PARADISE: FOREIGN TAX HAVENS AND
AMERICAN BUSINESS. Quarterly Journal of Economics 109(1): S. 149-182.

41
Huizinga, Harry and Luc Laeven (2008). International profit shifting within multinationals: A multi-
country perspective. Journal of Public Economics 92(5–6): S. 1164-1182.
Huizinga, Harry, Luc Laeven and Gaetan Nicodeme (2008). Capital Structure and International Debt
Shifting. Journal of Financial Economics 88(1): S. 80-118.
Karkinsky, Tom and Nadine Riedel (2012). Corporate Taxation and the Choice of Patent Location
within Multinational Firms. Journal of International Economics 88(1): S. 176-185.
Klassen, Kenneth J. and Stacie Kelley Laplante (2012a). Are U.S. Multinational Corporations Becom-
ing More Aggressive Income Shifters? Journal of Accounting Research 50(5): S. 1245-1285.
Klassen, Kenneth J. and Stacie Kelley Laplante (2012b). The Effect of Foreign Reinvestment and Fi-
nancial Reporting Incentives on Cross-Jurisdictional Income Shifting. Contemporary Ac-
counting Research 29(3): S. 928-955.
Klassen, Kenneth J. and Douglas A. Shackelford (1998). State and provincial corporate tax planning:
income shifting and sales apportionment factor management. Journal of Accounting and Eco-
nomics 25(3): S. 385-406.
Klassen, Kenneth, Mark Lang and Mark Wolfson (1993). Geographic Income Shifting by Multina-
tional Corporations in Response to Tax Rate Changes. Journal of Accounting Research 31(3):
S. 141-173.
Krull, Linda K. (2004). Permanently Reinvested Foreign Earnings, Taxes, and Earnings Management.
Accounting Review 79(3): S. 745-767.
Mills, Lillian F. and Kaye J. Newberry (2004). Do Foreign Multinationals' Tax Incentives Influence
Their U.S. Income Reporting and Debt Policy? National Tax Journal 57(1): S. 89-107.
Mintz, Jack and Alfons J. Weichenrieder (2005). Taxation and the Financial Structure of German Out-
bound FDI, available at: 1-24.
Newberry, Kaye J. (1998). Foreign Tax Credit Limitations and Capital Structure Decisions. Journal of
Accounting Research 36(1): S. 157-166.
Newberry, Kaye J. and Dan S. Dhaliwal (2001). Cross-Jurisdiction Income Shifting by U.S. Multina-
tionals: Evidence from International Bond Offerings. Journal of Accounting Research 39(3):
S. 643-662.
Oestreicher, Andreas and Melanie Klett (2011). Impact of Taxation on Company Decisions under
Seperate Accounting and Formula Apportionment, available at: 1-27.

42
Shackelford, Douglas and Terry Shevlin (2001). Empircal Tax Research in Accounting. Journal of
Accounting & Economics 31(1-3): S. 321-387.
Shevlin, Terry, Tanya Y. H. Tang and Ryan J. Wilson (2012). Domestic Income Shifting by Chinese
Listed Firms. Journal of the American Taxation Association 34(1): S. 1-29.
Single, Louise E. (1999). Tax Holidays and Firms' Subsidiary Location Decisions. Journal of the
American Taxation Association 21(2): S. 17-34.
Smith, James K. (1997). The Effect of the Tax Reform Act of 1986 on the Capital Structure of Foreign
Subsidiaries. Journal of the American Taxation Association 19(2): S. 1-18.
Swenson, Deborah L. (2001). Transaction Type and the Effect of Taxes on the Distribution of Foreign
Direct Investment in the United States. International taxation and multinational activity.
JAMES R. HINES, JR. Chicago and London, University of Chicago Press: 89-108.
Tang, R. (2002). Current Trends and Corporate Cases in Transfer Pricing, in: Quorum Books, West-
port, Conn./London,

43
Wages Total total wages paid of each firm i
Wages wages paid for each facility of a firm i in municipality j, scaled by total wages paid of each firm i
Diff. Wagesdifference of total wages paid between the facility with the highest and the facility with the lowest trade tax
rate within one firm i and year, scaled by total wages paid of each firm i
∆ Wages (2001 - 2004)first difference of total wages paid between 2004 and 2001 for each facility of firm i, scaled by total wages
paid of each firm i
∆ Wages (2001 - 2007)first difference of total wages paid between 2007 and 2001 for each facility of firm i, scaled by total wages
paid of each firm i
Tax Ratetrade tax rate of the municipality j in which the facility is domiciled, scaled by the weighted average trade tax
levy rate of the firm i
Diff. Tax Ratedifference between the maximum of TaxRate i and the minimum of TaxRate i of a single firm i within one
particular year, scaled by the weighted average trade tax levy rate of the firm i
∆ Tax Rate (2001 - 2004)first difference of the TaxRate j,t between 2004 to 2001 for each municipality j, scaled by the weighted
average trade tax rate of the firm i
∆ Tax Rate (2001 - 2007)first difference of the TaxRate j,t between 2007 to 2001 for each municipality j, scaled by the weighted
average trade tax rate of the firm i
Firm Controls
High Real Estate Dummy Variable taking the value 1 if firm i has more real estate than the mean of the full sample, 0 otherwise
High Donations Dummy Variable taking the value 1 if firm i has more donations than the mean of the full sample, 0 otherwise
No. of facilities Number of facilities of a firm i
Leverage Dummy Variable taking the value 1 if payments for permanent debt are greater than zero, 0 otherwise
Municipality Controls
Inhabitants Number of inhabitants in municipality j
Real Property Tax A Real Property Tax for agriculture, measured in %
Real Property Tax B Real Property Tax for architectural purposes, measured in %
District Controls
Size of district Size of a district k, measured in squared kilometres (km²)
Birth - Total Births of all genders in a district k
Cash Result Cash Result is the result of operting income in a district k less operating expenses in the same district k
Average Purchase Price Land Average purchase price per squared meter (m²) in one year in district k in ths. Euros - total
GDP per Inhabitants whole population
Unemployment RateUnemployment calculated as the ratio of unemployed persons and the whole employable population in
district k
Available Income per Household Average income per household in district k
Moving In Immigration over a district border k
age under 18
age 18-25
age 25-30
age 30-50
age 50-65
age > 65
Total Sum of all moving ins into district k
Moving Out Emigration over a district border k
age under 18
age 18-25
age 25-30
age 30-50
age 50-65
age > 65
Total Sum of all moving outs out of district k
Business Registration Umbrella term for all business registrations in one year in district k for different reasons
Reconstruction Business Registrations due to reconstruction in one year in district k
Moving In Business Registrations due to moving in in one year in district k
Moving Out Business Registrations due to moving out in one year in district k
Total Sum of all business registrations in one year in district k
Business Cancellation Umbrella term for all business cancellations in one year in district k for different reasons
Abandonment Business Cancellations due to abandonment in one year in district k
Moving Out Business Cancellations due to moving out in one year in district k
Transfer Business Cancellations due to transfer in one year in district k
Total Sum of all business cancellations in one year in district k
Areas Umbrella term for all areas
Land Area Land area is the sum of Settlement and Traffic Area, Farmland, Wood Area, Water Area and Mining Land
Building Open Area Housing Building Open Area Housing in district k
Building Open Area Business Building Open Area Business in district k
Plant Area Plant Area in district k without Mining Land
Traffic Area Traffic Area in district k
Farmland Area of agriculture (marsh and moorland among others)
Tourism Umbrella term for tourism key figures in district k
Beds Offered guest beds in district k
Guests Overnight Stay Guests Overnight Stay in district k
Segmentation in different age groups
Segmentation in different age groups
Table 1
Variable Explanations

44
Criteria Firms Facility-years
full population of German firms liable to trade tax 5,116,719 9,720,291
with cases of trade tax allocation 278,918 2,012,817
with no missing values for trade tax levy rate or official municipality key 255,854 1,484,481
with no losses or loss carryforwards 162,882 685,123
with the wages paid is used to determine the tax burden 161,906 682,244
with the sum of total wages paid of a firm is not equal to zero 142,076 617,262
with firms can be followed up over time (H2) 21,589 199,575
Table 2
Sample Selection
Notes: This table explains the sample selection criteria used in this study. Variables referred to above are defined in Section Sample Selection.

45
Variable Obs Mean Std. Min Max
Wages Total 506,590 14,000,000 72,400,000
Wages 506,590 0.31 0.36
Diff. Wages 54,509 -0.01 0.55
∆ Wages (2004 - 2001) 41,822 0.01 0.13
∆ Wages (2007 - 2001) 35,273 0.01 0.14
Tax Rate 506,499 1.11 74.61
Diff. Tax Rate 54,494 0.16 0.17
∆ Tax Rate (2004 - 2001) 41,822 -0.11 0.41
∆ Tax Rate (2007 - 2001) 35,273 -0.11 0.29
Firm Controls
No. of facilities 506,590 29.43 103.89
High Donations 506,590 0.11 0.31 0 1
High Real Estate 506,590 0.17 0.37 0 1
Leverage 506,590 0.66 0.47 0 1
Municipality Controls
Inhabitants 506,590 92,634.66 220,070.80 5 3,405,342
Real Property Tax A 506,590 287.53 71.94 0 970
Real Property Tax B 506,590 347.49 68.25 0 900
District Controls
Size of district 506,590 934.41 593.74 36 3,058
Birth - Total 506,590 2,382.63 2,265.54 215 31,174
Cash Result 506,590 -14,800,000 113,000,000
Average Purchase Price Land 506,590 130.15 147.24 0 906
GDP per Inhabitants 506,590 27,872.42 12,480.03 13,085 86,728
Unemployment Rate 506,590 7.88 3.68 2 22
Available Income per Household 506,590 5,033,758 4,835,163 588,377 52,300,000
Moving In
age 18-25 506,590 2,352.18 1,906.47 244 34,514
age 25-30 506,590 3,227.00 3,706.72 114 26,783
age 30-50 506,590 2,705.85 3,313.34 226 39,911
age 50-65 506,590 5,522.63 5,631.01 49 8,177
age > 65 506,590 1,176.73 1,078.13 59 4,699
Total 506,590 760.66 569.35 798 126,947
Moving Out
age 18-25 506,590 2,255.21 1,945.76 321 18,602
age 25-30 506,590 2,816.67 2,225.41 260 20,173
age 30-50 506,590 2,477.86 2,470.61 440 44,517
age 50-65 506,590 5,433.40 5,816.28 116 10,919
age > 65 506,590 1,225.85 1,311.66 73 6,157
Total 506,590 822.92 798.95 1,632 114,951
Business Registration
Reconstruction 506,590 2,433.94 2,670.29 181 39,423
Moving In 506,590 235.23 244.78 2 1,601
Moving Out 506,590 270.72 294.80 2 3,558
Business Cancellation
Abandonment 506,590 1,823.06 1,917.14 185 28,244
Moving Out 506,590 260.63 273.90 17 1,481
Transfer 506,590 261.90 307.46 3 3,239
Areas
Building Open Area Housing 506,590 3,588.79 2,275.74 116 20,493
Building Open Area Business 506,590 913.00 659.81 46 3,767
Plant Area 506,590 214.62 201.64 3 1,433
Traffic Area 506,590 5,045.12 2,783.32 341 16,477
Farmland 506,590 48,986.90 38,965.91 636 191,749
Tourism
Beds 506,590 8,085.03 8,981.78 252 89,836
Guests Overnight Stay 506,590 1,082,153 1,435,993 22,800 17,300,000
Each of the variables is defined in Table 1.
Table 3
Descriptive Statistics of Selected Variables
No permission of
publication due to
constraints on the
confidential dataset

46
Wage Tax RateNo. of
facilitiesLeverage
High
Donations
High Real
EstateInhabitants
Real
Property
Tax A
Real
Property
Tax B
Size of
district
Birth -
Total
Average
Purchase
Price - Land
GDP per
Inhabitants
Building
Open Area
Business
Tourism -
Beds
Unemploy-
ment Rate
Av. Income
per
Household
Wage1
Tax Rate-0.0012 1
No. of facilities-0.1954 -0.0005 1
Leverage0.0191 0.0011 0.014 1
High Donations-0.066 -0.0005 0.0442 -0.0496 1
High Real Estate-0.1849 -0.0007 0.2683 -0.0369 0.1277 1
Inhabitants0.0587 0 -0.0745 -0.0638 -0.0154 -0.0843 1
Real Property Tax A-0.014 0.0006 0.0134 -0.019 0.0065 0.0081 0.1322 1
Real Property Tax B0.0439 0.0023 -0.0808 -0.0285 -0.0099 -0.0838 0.5495 0.2021 1
Size of district0.0522 -0.0003 -0.0778 -0.0566 -0.0086 -0.0752 0.7986 0.115 0.3964 1
Birth - Total-0.0065 0.0001 0.0136 -0.0165 0.002 0.0069 0.0404 0.1343 -0.1229 0.0442 1
Avg. Purchase Price - Land0.0495 -0.0006 -0.0546 -0.0743 -0.0126 -0.0773 0.6838 0.1367 0.2358 0.6339 0.1975 1
GDP per Inhabitants0.0509 -0.0011 -0.079 -0.0701 -0.0186 -0.0834 0.5278 0.0402 0.266 0.4198 0.1473 0.6458 1
Building Open Area Business0.0308 0.0026 -0.0705 -0.0006 0.0046 -0.0361 0.2261 -0.0388 0.2461 0.576 -0.1234 0.0379 0.061 1
Tourism - Beds0.0195 -0.0002 -0.0325 -0.0322 -0.0064 -0.0282 0.5409 0.2055 0.1696 0.593 0.1658 0.4397 0.2939 0.2496 1
Unemployment Rate0.024 0.0049 -0.0705 0.0391 -0.004 -0.0162 0.1026 -0.1914 0.2975 -0.0437 -0.174 -0.2378 -0.1485 0.2169 -0.0513 1
Av. Income per Household 0.0527 -0.0002 -0.0767 -0.0602 -0.0085 -0.0782 0.7834 0.1213 0.3842 0.9877 0.0669 0.6603 0.4325 0.5563 0.5847 -0.0697 1
Table 4
Pearson Correlations among Selected Variables
Each of the variables is defined in Table 1.

47
Pred. Sign Model 1 Model 2 Model 3
Intercept 0.2842* 0.2939** 0.2917* 0.3342*
Tax Rate --7.54e-04***
(-17.43)
-7.54e-04***
(-15.78)
-7.35e-04***
(-26.31)
-7.53e-04***
(-20.53)
Firm Controls
No. of facilities - -0.0005*** -0.0005*** -0.0005*** -0.0005***
High Donations +/- -0.0214*** -0.0216*** -0.0206*** -0.0211***
High Real Estate +/- -0.1015*** -0.1014*** -0.0990*** -0.0983***
Leverage +/- -0.0041*** -0.0030*** -0.0017* -0.0018*
Municipality Controls
Inhabitants + 1.90e-08*** 6.16e-08*** 1.55e-07***
Real Property Tax A - -2.86e-03*** -4.17e-03*** -5.85e-03***
Real Property Tax B + -9.27e-06 -2.36e-03* -3.16e-03
District Controls
Size of district +/- -0.0036 -1.39e-03
Birth - Total + 6.82e-06*** -7.03e-06
Cash Result + -1.26e-11*** -2.60e-11***
Average Purchase Price Land +/- 2.53e-03*** -1.26e-03
GDP per Inhabitants + -6.62e-08 7.61e-08
Unemployment Rate - 6.32e-03 0.0006
Available Income per Household + -2.63e-09*** -6.94e-09
Moving In +
age under 18 -5.35e-06
age 18-25 -5.12e-06
age 25-30 7.04e-06
age 30-50 1.31e-06
age 50-65 8.42e-06
age > 65 -2.47e-03
Total 9.07e-07**
Moving Out -
age under 18 8.89e-06
age 18-25 -3.68e-06
age 25-30 -6.43e-06
age 30-50 -1.21e-06
age 50-65 -5.06e-07
age > 65 -1.43e-03
Total -7.06e-07*
Business Registration +/-
Reconstruction -4.03e-06*
Moving In -2.57e-03*
Moving Out -3.90e-06
Total -2.96e-06**
Business Cancellation +/-
Abandonment 4.15e-06
Moving Out -1.94e-03
Transfer -1.49e-03
Total 1.47e-03***
Areas +
Land Area 3.58e-03
Building Open Area Housing -1.12e-06
Building Open Area Business 3.63e-06** 1.08e-03*
Plant Area -8.87e-06*** -1.16e-03
Traffic Area 1.00e-03
Farmland 2.62e-07
Tourism +
Beds 1.38e-06*** -2.00e-06
Guests Overnight Stay -1.42e-08*** -8.89e-09
Industry fixed effects yes yes yes yes
District fixed effects no no no yes
Adj. R² 8.37% 8.41% 8.64% 8.83%
N 611,945 611,496 531,717 506,499
*, **, *** significant at the 10%, 5% and 1% level (all p-values are based on two-tailed t-tests).
Independent Variable Model 4
Total wages paid and trade tax rate (H1a)
Table 5
Each of the variables is defined in Table 1.

48
Pred. Sign Model 1 Model 2 Model 3
Intercept -0.2654*** -0.2791*** -0.2798*** -0.2791**
Diff. Tax Rate 0-25 % +/-0.0004
(0.09)
0.0029
(0.65)
-0.0021
(-0.46)
-0.0062
(-1.02)
Diff. Tax Rate 25-50 % -0.0072
(1.43)
0.0072
(1.39)
-0.0186***
(-3.39)
-0.0320***
(-4.16)
Diff. Tax Rate 50-75 % ---0.0042
(-0.73)
-0.0068
(-1.04)
-0.0583***
(-8.12)
-0.09148***
(-9.00)
Diff. Tax Rate 75-100 % ----0.1905***
(-30.25)
-0.1802***
(-20.47)
-0.2553***
(-25.07)
-0.3323***
(-23.26)
Firm Controls
No. of facilities - 0.0008*** 0.0016*** 0.0016*** 0.0016***
High Donations +/- 0.0408*** 0.0417*** 0.0433*** 0.0470***
High Real Estate +/- 0.0364*** 0.0378*** 0.0403*** 0.0408***
Leverage +/- 0.0185*** 0.0169*** 0.0173*** 0.0098
Municipality Controls
Diff. Inhabitants + -5.99e-08*** 6.32e-08*** 2.25e-07***
Diff. Real Property Tax A - 4.38e-03 0.0001*** -9.23e-03
Diff. Real Property Tax B + 0.0002*** 0.0002*** 0.0004***
District Controls
Diff. Size of district +/- 0.0075 -7.60e-03***
Diff. Birth - Total + 5.62e-03*** 2.03e-06
Diff. Cash Result + 3.61e-11 -3.93e-11
Diff. Average Purchase Price Land +/- 4.13e-03* 9.10e-03*
Diff. GDP per Inhabitants + 1.51e-06*** 1.72e-06***
Diff. Unemployment Rate - -0.003*** -0.0047***
Diff. Available Income per Household + -2.26e-08*** -1.64e-08*
Diff. Moving In +
age under 18 2.24e-03
age 18-25 -3.44e-03***
age 25-30 1.84e-03
age 30-50 -1.83e-03
age 50-65 0.0001***
age > 65 -0.0001***
Total -8.20e-06***
Diff. Moving Out -
age under 18 5.11e-06
age 18-25 1.60e-06
age 25-30 8.88e-03***
age 30-50 -1.10e-07
age 50-65 -0.0002***
age > 65 0.0002***
Total 1.01e-03***
Diff. Business Registration +/-
Reconstruction -4.34e-03***
Moving In -0.0001***
Moving Out 7.06e-03*
Total -3.06e-03***
Diff. Business Cancellation +/-
Abandonment 6.96e-03***
Moving Out 9.40e-03*
Transfer -5.86e-03
Total 1.42e-03**
Diff. Areas +
Land Area -7.50e-03
Building Open Area Housing 6.70e-06*
Building Open Area Business 3.62e-03*** 2.34e-03**
Plant Area -2.96e-03 -2.35e-03
Traffic Area -2.92e-07
Farmland 4.21e-07
Diff. Tourism +
Beds 1.93e-06 -1.01e-06
Guests Overnight Stay -1.37e-08 1.14e-08
Industry fixed effects yes yes yes yes
District fixed effects no no no yes
Adj. R² 2.52% 3.70% 4.70% 6.91%
N 54,494 54,494 54,494 40,795
*, **, *** significant at the 10%, 5% and 1% level (all p-values are based on two-tailed t-tests).
Table 6
Total wages paid and trade tax rate differentials with bins (H1b)
Independent Variable Model 4
Each of the variables is defined in Table 1.

49
PANEL A: Change 2001 to 2004
Pred. Sign Model 1 Model 2 Model 3
Intercept 0.0187 0.0177 0.0434 0.1826
∆ Tax Rate up 0 - 25 % +/--0.0091
(-1.18)
-0.0078
(-1.01)
-0.0136*
(-1.78)
-0.0139
(-1.51)
∆ Tax Rate up 25 - 50 % --0.0043
(-0.53)
-0.0031
(-0.39)
-0.0050
(-0.61)
-0.0045
(-0.47)
∆ Tax Rate up 50 - 75 % ---0.0140*
(-1.72)
-0.0125
(-1.55)
-0.0152*
(-1.85)
-0.0183*
(-1.89)
∆ Tax Rate up 75 - 100 % ----0.0152*
(-1.89)
-0.0139*
(-1.73)
-0.0126
(-1.56)
-0.0149
(-1.54)
∆ Tax Rate down 0 - 25 % +/--0.0100
(-1.38)
-0.0090
(-1.25)
-0.0095
(-1.33)
-0.0132
(-1.53)
∆ Tax Rate down 25 - 50 % --0.0115
(-1.57)
-0.0104
(-1.44)
-0.0119*
(-1.66)
-0.0152*
(-1.75)
∆ Tax Rate down 50 - 75 % ---0.0120*
(-1.65)
-0.0110
(-1.52)
-0.0125*
(-1.74)
-0.0159*
(-1.83)
∆ Tax Rate down 75 - 100 % ----0.0135*
(-1.86)
-0.0129*
(-1.78)
-0.0151**
(-2.09)
-0.0182**
(-2.08)
Firm Controls
No. of facilities - -9.60e-06*** -9.72e-06*** -8.85e-06*** -8.95e-06***
High Donations +/- -0.0021 -0.0021 -0.0027* -0.0024
High Real Estate +/- -0.0030*** -0.0029*** -0.0031** -0.0036**
Leverage +/- 0.0009 0.0009 0.0007 0.0010
Municipality Controls
∆ Inhabitants + 1.34e-07 5.27e-08 2.48e-06
∆ Real Property Tax A - -1.97e-03 -1.04e-03 2.51e-03
∆ Real Property Tax B + -6.64e-06 -3.56e-03 -5.18e-03
District Controls
∆ Size of district +/- -0.0022 -0.0006
∆ Birth - Total + -1.66e-06 -5.29e-03
∆ Cash Result + 3.41e-12 -1.61e-10**
∆ Average Purchase Price Land +/- 1.18e-03 -4.05e-03
∆ GDP per Inhabitants + -7.48e-07* -6.20e-06**
∆ Unemployment Rate - -0.0005 0.0206**
∆ Available Income per Household + 5.35e-09 -1.80e-07**
∆ Moving In +
age under 18 -2.36e-03
age 18-25 -1.43e-03
age 25-30 6.15e-03*
age 30-50 -1.25e-03
age 50-65 -5.73e-03
age > 65 0.0002*
Total -4.99e-07
∆ Moving Out -
age under 18 2.43e-06
age 18-25 3.56e-03
age 25-30 -0.0001**
age 30-50 6.13e-03***
age 50-65 -0.0001
age > 65 1.14e-03
Total 4.93e-07
∆ Business Registration +/-
Reconstruction 1.97e-03
Moving In 0.0003**
Moving Out 0.0001
Total -8.51e-07
∆ Business Cancellation +/-
Abandonment -6.77e-03
Moving Out 0.0002*
Transfer -0.0002*
Total 3.43e-06
∆ Areas +
Land Area 2.14e-03
Building Open Area Housing 3.49e-06
Building Open Area Business -1.15e-03* 2.78e-03
Plant Area 1.51e-06 5.51e-03
Traffic Area -7.26e-03
Farmland 9.98e-06
∆ Tourism +
Beds -6.89e-07 8.44e-07
Guests Overnight Stay 2.99e-09 -4.92e-08
Industry fixed effects yes yes yes yes
District fixed effects no no no yes
Adj. R² 0.14% 0.14% 0.23% 0.72%
N 69,116 69,065 53,633 41,882
*, **, *** significant at the 10%, 5% and 1% level (all p-values are based on two-tailed t-tests).
Table 7
Panel Analysis of total wages paid and trade tax rate with bins (H2a)
Independent Variable Model 4
Each of the variables is defined in Table 1.

50
PANEL B: Change 2001 to 2007
Pred. Sign Model 1 Model 2 Model 3
Intercept 0.0122 0.0118 0.0159 0.0402
∆ Tax Rate up 0 - 25 % +/--0.0198*
(-1.89)
-0.0201*
(-1.91)
-0.0239**
(-2.19)
-0.0188
(-1.54)
∆ Tax Rate up 25 - 50 % --0.0138
(-1.30)
-0.0142
(-1.33)
-0.0188*
(-1.69)
-0.0187
(-1.48)
∆ Tax Rate up 50 - 75 % ---0.0228**
(-2.17)
-0.0233**
(-2.21)
-0.0244**
(-2.22)
-0.0222*
(-1.80)
∆ Tax Rate up 75 - 100 % ----0.0211**
(-2.00)
-0.0213**
(-2.02)
-0.0251**
(-2.30)
-0.0251**
(-2.05)
∆ Tax Rate down 0 - 25 % +/--0.0145
(-1.46)
-0.0147
(-1.48)
-0.0173*
(-1.67)
-0.0170
(-1.47)
∆ Tax Rate down 25 - 50 % --0.0175*
(-1.77)
-0.0178*
(-1.79)
-0.0215**
(-2.08)
-0.0195*
(-1.68)
∆ Tax Rate down 50 - 75 % ---0.0211**
(-2.13)
-0.0214**
(-2.15)
-0.0250**
(-2.42)
-0.0250**
(-2.14)
∆ Tax Rate down 75 - 100 % ----0.0194*
(-1.95)
-0.0197**
(-1.98)
-0.0228**
(-2.20)
-0.0213*
(-1.82)
Firm Controls
No. of facilities - -1.10e-03*** -1.10e-03*** -1.27e-03*** -1.54e-03***
High Donations +/- 0.0008 0.0008 0.0011 -8.38e-03
High Real Estate +/- -0.0030*** -0.0055*** -0.0052*** -0.0059***
Leverage +/- 0.0005 -0.0006 -0.0017 -0.0016
Municipality Controls
∆ Inhabitants + -2.45e-09 1.58e-07 3.32e-06**
∆ Real Property Tax A - -3.13e-06 -6.94e-06 -2.47e-03
∆ Real Property Tax B + 1.61e-03 -1.91e-03 2.64e-03
District Controls
∆ Size of district +/- -0.0038 -3.24e-03
∆ Birth - Total + 7.29e-07 2.80e-03
∆ Cash Result + -1.85e-12 7.01e-11
∆ Average Purchase Price Land +/- -8.75e-06 0.0001
∆ GDP per Inhabitants + -4.74e-08 -4.09e-07
∆ Unemployment Rate - 0.001 -0.0065
∆ Available Income per Household + 2.89e-09 6.24e-09
∆ Moving In +
age under 18 6.50e-06
age 18-25 -7.17e-06
age 25-30 -0.0001
age 30-50 2.89e-03
age 50-65 5.65e-03
age > 65 0.0003
Total -1.94e-06**
∆ Moving Out -
age under 18 -9.41e-03
age 18-25 9.81e-03
age 25-30 6.15e-03
age 30-50 -4.94e-03
age 50-65 -9.72e-03
age > 65 0.0002
Total 2.03e-06**
∆ Business Registration +/-
Reconstruction 7.55e-03
Moving In -2.94e-06
Moving Out 0.0001
Total -6.79e-06*
∆ Business Cancellation +/-
Abandonment -0.0001
Moving Out -0.0005
Transfer -0.0001
Total 6.45e-06
∆ Areas +
Land Area 3.63e-03
Building Open Area Housing -1.29e-03
Building Open Area Business -6.79e-06 -3.77e-03
Plant Area 2.14e-03 -0.0001
Traffic Area -3.76e-03
Farmland -5.18e-06
∆ Tourism +
Beds -5.38e-07 6.72-03
Guests Overnight Stay -2.21e-10 -3.71e-07
Industry fixed effects yes yes yes yes
District fixed effects no no no yes
Adj. R² 0.28% 0.28% 0.39% 1.01%
N 51,615 51,572 44,428 35,273
*, **, *** significant at the 10%, 5% and 1% level (all p-values are based on two-tailed t-tests).
Table 7
Panel Analysis of total wages paid and trade tax rate with bins (H2a)
Independent Variable Model 4
Each of the variables is defined in Table 1.

51
Pred. Sign Model 1 Model 2 Model 3
Intercept -0.2436*** -0.2557*** -0.2617*** -0.1947*
Diff. Tax Rate --0.2989***
(-4.28)
-0.2535***
(-3.50)
-0.3344***
(-2.89)
-0.3281**
(-2.17)
Firm Controls
No. of facilities - 0.0007*** 0.0015*** 0.0014*** 0.0014***
High Donations +/- 0.0412*** 0.0415*** 0.0426*** 0.0448***
High Real Estate +/- 0.0359*** 0.0369*** 0.0380*** 0.0367***
Leverage +/- 0.0181*** 0.0137** 0.0139** 0.0057
Municipality Controls
Diff. Inhabitants + -9.36e-08*** -2.72e-08 1.05e-07
Diff. Real Property Tax A - 4.10e-03 0.0002*** -2.68e-03
Diff. Real Property Tax B + 0.0002*** 0.0001* 0.0002**
District Controls
Diff. Size of district +/- 0.0062 -4.66e-03**
Diff. Birth - Total + 5.38e-03*** 9.96e-06
Diff. Cash Result + 4.92e-11** -3.07e-11
Diff. Average Purchase Price Land +/- 2.69e-03 -1.26e-03
Diff. GDP per Inhabitants + 1.79e-06*** 2.22e-06***
Diff. Unemployment Rate - -0.0027*** -0.0038***
Diff. Available Income per Household + -2.03e-08*** -1.10e-08
Diff. Moving In +
age under 18 1.88e-03
age 18-25 -3.54e-03***
age 25-30 2.74e-03
age 30-50 -2.05e-03
age 50-65 0.0001**
age > 65 -0.0001***
Total -7.65e-06***
Diff. Moving Out -
age under 18 1.04e-03
age 18-25 1.96e-03
age 25-30 3.96e-03
age 30-50 5.41e-06
age 50-65 -'0.0002***
age > 65 0.0001***
Total 9.15e-06***
Diff. Business Registration +/-
Reconstruction -3.13e-03***
Moving In -7.83e-03*
Moving Out 5.98e-03
Total -2.60e-03***
Diff. Business Cancellation +/-
Abandonment 4.90e-03***
Moving Out 7.64e-03
Transfer -6.43e-03
Total 6.84e-06
Diff. Areas +
Land Area -6.28e-03
Building Open Area Housing 4.92e-06
Building Open Area Business 3.29e-03*** 1.72e-03*
Plant Area -2.64e-03 -1.90e-03
Traffic Area -1.22e-06
Farmland 3.02e-07
Diff. Tourism +
Beds 1.43e-06 -2.06e-06
Guests Overnight Stay -1.33e-08 1.58e-08
Industry fixed effects yes yes yes yes
District fixed effects no no no yes
Adj. R² 1.95% 3.26% 4.15% 6.06%
N 54,494 54,494 54,494 53,758
*, **, *** significant at the 10%, 5% and 1% level (all p-values are based on two-tailed t-tests).
Table 8
Total wages paid and trade tax rate differentials (H1b)
Independent Variable Model 4
Each of the variables is defined in Table 1.
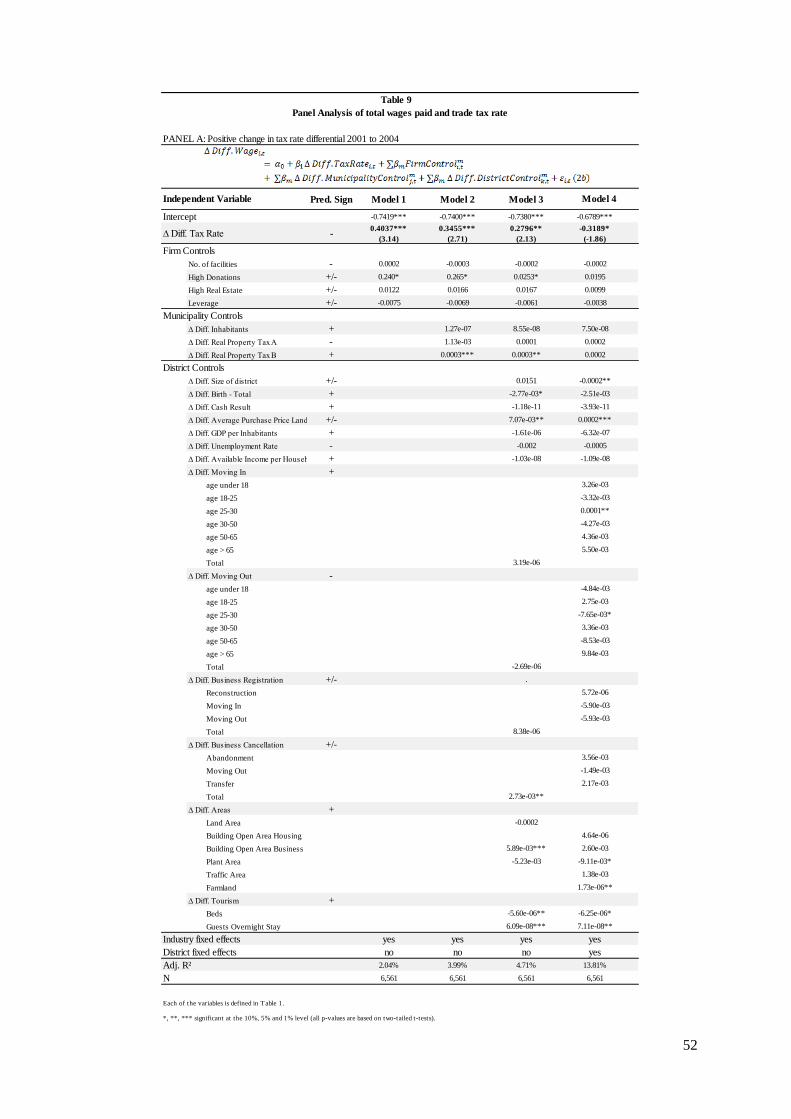
52
PANEL A: Positive change in tax rate differential 2001 to 2004
Pred. Sign Model 1 Model 2 Model 3
Intercept -0.7419*** -0.7400*** -0.7380*** -0.6789***
∆ Diff. Tax Rate -0.4037***
(3.14)
0.3455***
(2.71)
0.2796**
(2.13)
-0.3189*
(-1.86)
Firm Controls
No. of facilities - 0.0002 -0.0003 -0.0002 -0.0002
High Donations +/- 0.240* 0.265* 0.0253* 0.0195
High Real Estate +/- 0.0122 0.0166 0.0167 0.0099
Leverage +/- -0.0075 -0.0069 -0.0061 -0.0038
Municipality Controls
∆ Diff. Inhabitants + 1.27e-07 8.55e-08 7.50e-08
∆ Diff. Real Property Tax A - 1.13e-03 0.0001 0.0002
∆ Diff. Real Property Tax B + 0.0003*** 0.0003** 0.0002
District Controls
∆ Diff. Size of district +/- 0.0151 -0.0002**
∆ Diff. Birth - Total + -2.77e-03* -2.51e-03
∆ Diff. Cash Result + -1.18e-11 -3.93e-11
∆ Diff. Average Purchase Price Land +/- 7.07e-03** 0.0002***
∆ Diff. GDP per Inhabitants + -1.61e-06 -6.32e-07
∆ Diff. Unemployment Rate - -0.002 -0.0005
∆ Diff. Available Income per Household + -1.03e-08 -1.09e-08
∆ Diff. Moving In +
age under 18 3.26e-03
age 18-25 -3.32e-03
age 25-30 0.0001**
age 30-50 -4.27e-03
age 50-65 4.36e-03
age > 65 5.50e-03
Total 3.19e-06
∆ Diff. Moving Out -
age under 18 -4.84e-03
age 18-25 2.75e-03
age 25-30 -7.65e-03*
age 30-50 3.36e-03
age 50-65 -8.53e-03
age > 65 9.84e-03
Total -2.69e-06
∆ Diff. Business Registration +/- .
Reconstruction 5.72e-06
Moving In -5.90e-03
Moving Out -5.93e-03
Total 8.38e-06
∆ Diff. Business Cancellation +/-
Abandonment 3.56e-03
Moving Out -1.49e-03
Transfer 2.17e-03
Total 2.73e-03**
∆ Diff. Areas +
Land Area -0.0002
Building Open Area Housing 4.64e-06
Building Open Area Business 5.89e-03*** 2.60e-03
Plant Area -5.23e-03 -9.11e-03*
Traffic Area 1.38e-03
Farmland 1.73e-06**
∆ Diff. Tourism +
Beds -5.60e-06** -6.25e-06*
Guests Overnight Stay 6.09e-08*** 7.11e-08**
Industry fixed effects yes yes yes yes
District fixed effects no no no yes
Adj. R² 2.04% 3.99% 4.71% 13.81%
N 6,561 6,561 6,561 6,561
*, **, *** significant at the 10%, 5% and 1% level (all p-values are based on two-tailed t-tests).
Table 9
Panel Analysis of total wages paid and trade tax rate
Independent Variable Model 4
Each of the variables is defined in Table 1.

53
PANEL B: Positive change in tax rate differential 2001 to 2007
Pred. Sign Model 1 Model 2 Model 3
Intercept 0.0209 -0.0220 -0.0338 0.8405
∆ Diff. Tax Rate -0.1729
(1.23)
0.3220**
(2.33)
0.2906**
(2.02)
0.0646
(0.38)
Firm Controls
No. of facilities - 0.0004 -0.0010* -0.0002 0.0002
High Donations +/- -0.0476* -0.0378 -0.0405 -0.0346
High Real Estate +/- 0.0102 0.0259 0.0245 0.0209
Leverage +/- -0.0080 -0.0050 0.0063 0.0008
Municipality Controls
∆ Diff. Inhabitants + -2.05e-07*** -1.11e-07 -1.42e-07
∆ Diff. Real Property Tax A - 3.78e-03 6.91e-03 0.0002
∆ Diff. Real Property Tax B + 0.0003** 0.0003 0.0001
District Controls
∆ Diff. Size of district +/- -0.0426 -9.03e-03
∆ Diff. Birth - Total + -1.20e-03 -2.84e-03
∆ Diff. Cash Result + -1.04e-10** -3.79e-11
∆ Diff. Average Purchase Price Land +/- -6.82e-03 -6.61e-06
∆ Diff. GDP per Inhabitants + 2.68e-06** 4.34e-06***
∆ Diff. Unemployment Rate - -0.0046 -0.0042
∆ Diff. Available Income per Household + 5.11e-09 4.21e-09
∆ Diff. Moving In +
age under 18 1.36e-03
age 18-25 -3.49e-03
age 25-30 1.32e-03
age 30-50 -3.34e-03
age 50-65 6.02e-03
age > 65 5.63e-03
Total 5.32e-06
∆ Diff. Moving Out -
age under 18 -1.94e-06
age 18-25 9.84e-03**
age 25-30 -4.07e-03
age 30-50 2.57e-03
age 50-65 -0.0001
age > 65 4.91e-03
Total 7.13e-06
∆ Diff. Business Registration +/- .
Reconstruction 4.39e-06
Moving In -2.85e-03
Moving Out 8.40e-03
Total -1.07e-03
∆ Diff. Business Cancellation +/-
Abandonment 3.90e-06
Moving Out -9.16e-03
Transfer 1.26e-03
Total -2.05e-03
∆ Diff. Areas +
Land Area 0.0004
Building Open Area Housing 8.66e-06
Building Open Area Business 4.41e-03** 1.77e-03
Plant Area -1.17e-06 7.48e-06
Traffic Area 1.23e-07
Farmland 2.83e-07
∆ Diff. Tourism +
Beds -5.09e-06 -7.57e-06
Guests Overnight Stay 6.03e-08** 7.45e-08*
Industry fixed effects yes yes yes yes
District fixed effects no no no yes
Adj. R² 1.43% 4.58% 5.61% 17.40%
N 3,737 3,737 3,737 3,737
*, **, *** significant at the 10%, 5% and 1% level (all p-values are based on two-tailed t-tests).
Table 9
Panel Analysis of total wages paid and trade tax rate
Independent Variable Model 4
Each of the variables is defined in Table 1.