Embed Size (px)
Citation preview

NBER WORKING PAPER SERIES
THE IMPACT OF THE COVID-19 PANDEMIC AND POLICY RESPONSE ON HEALTH CARE UTILIZATION:
EVIDENCE FROM COUNTY-LEVEL MEDICAL CLAIMS AND CELLPHONE DATA
Jonathan H. CantorNeeraj SoodDena BravataMegan Pera
Christopher M. Whaley
Working Paper 28131http://www.nber.org/papers/w28131
NATIONAL BUREAU OF ECONOMIC RESEARCH1050 Massachusetts Avenue
Cambridge, MA 02138November 2020
The views expressed herein are those of the authors and do not necessarily reflect the views of the National Bureau of Economic Research.
NBER working papers are circulated for discussion and comment purposes. They have not been peer-reviewed or been subject to the review by the NBER Board of Directors that accompanies official NBER publications.
© 2020 by Jonathan H. Cantor, Neeraj Sood, Dena Bravata, Megan Pera, and Christopher M. Whaley. All rights reserved. Short sections of text, not to exceed two paragraphs, may be quoted without explicit permission provided that full credit, including © notice, is given to the source.

The Impact of the COVID-19 Pandemic and Policy Response on Health Care Utilization:Evidence from County-level Medical Claims and Cellphone dataJonathan H. Cantor, Neeraj Sood, Dena Bravata, Megan Pera, and Christopher M. WhaleyNBER Working Paper No. 28131November 2020JEL No. I0,I1,I12,I18
ABSTRACT
The COVID-19 pandemic has forced federal, state and local policymakers to respond by legislating, enacting, and enforcing social distancing policies. However, the impact of these policies on healthcare utilization in the United States has been largely unexplored. We examine the impact of county-level shelter in place ordinances on healthcare utilization using two unique datasets—employer-sponsored insurance for over 6 million people in the US and cell phone location data. We find that introduction of these policies was associated with reductions in the use of preventive care, elective care, and the number of weekly visits to physician offices and hospitals. However, controlling for county-level exposure to the COVID-19 pandemic reduces the impact of these policies. Our results imply that while social distancing policies do lead to reductions in healthcare utilization, much of these reductions would have occurred even in the absence of these policies.
Jonathan H. CantorRAND Corporation 1776 Main Street Santa Monica, CA [email protected]
Neeraj SoodSchaeffer Center for Health Policy and Economics Sol Price School of Public PolicyUniversity of Southern CaliforniaUniversity Park CampusLos Angeles CA 90089and [email protected]
Dena BravataCastlight HealthStanford University150 SpearSan Francisco, CA [email protected]
Megan PeraCastlight Health150 SpearSan Francisco, CA 94105 [email protected]
Christopher M. Whaley RAND Corporation1776 Main StreetSanta Monica, CA 90401 [email protected]

2
1. INTRODUCTION
The COVID-19 pandemic has impacted health systems and economies throughout the United
States and the world. It is expected that the total economic cost of the pandemic may reach 16
trillion dollars (Cutler and Summers 2020). In the United States, policymakers have responded
by enacting federal and state policies that seek to “flatten the curve” through shelter-in-place
(SIP) policies that encourage social distancing. Previous research suggests that these policies had
their intended effect and reduced spread of COVID-19 infection in the United States (Amuedo-
Dorantes, Kaushal, and Muchow 2020; Courtemanche et al. 2020; Matrajt and Leung 2020).
However, evidence on the impacts of social distancing and SIP policies on healthcare
utilization remains limited (Ziedan, Simon, and Wing 2020). In previous work, we examined
changes in use of preventive healthcare services, both in-person and telemedicine visits, after the
declaration of nationwide emergency in March 2020 (Whaley et al. 2020). Consistent with other
studies, we find that the use of preventive and elective services declined drastically, and that the
share of visits replaced by telemedicine did not fully replace the gap (Mehrotra et al. 2020).
However, it is unclear from this evidence whether the decline in utilization was in response to
implementation of SIP policies or due to patients’ fears of COVID-19 infection while in a
healthcare facility. The effect of SIP policies on healthcare use is a priori ambiguous: While the
decline in COVID-19 cases associated with these policies might instill public confidence and
encourage people to seek healthcare, SIP policies might encourage the public to stay at home and
avoid doctors’ offices and hospitals. If these policies do reduce necessary medical care, then,
while they may limit the spread of COVID-19, they may also impose costs. If delayed or forgone
care worsens patient health outcomes, then the positive COVID-related health impacts of SIP
policies must be balanced with the potentially adverse consequences of SIP policies on non-

3
COVID care. Appropriately weighing these tradeoffs requires precise estimation of the impact of
SIP policies on non-COVID care.
In this paper, we attempt to inform these tradeoffs by examining the effect of SIP polices on
use of healthcare services. An important empirical challenge with evaluating the impacts of these
policies is the endogenous nature of their implementation (Goodman-Bacon and Marcus 2020).
While there is variation in the timing of implementation of SIP policies across counties, which
can be used to identify the effects of these policies on health care utilization, counties might have
implemented these policies in response to or concurrently with rising COVID cases. Therefore, it
is important to disentangle the effects of SIP policies from the effects of changes in trajectory of
the COVID-19 pandemic within a county. We address this potential endogeneity of SIP policies
by non-parametrically controlling for the number of weeks since the first COVID-19 case and
COVID-19 death in each county.
To assess the impacts of SIP policies on health services utilization, we used claims data from
a nationwide sample of U.S. individuals with employer-sponsored health insurance. Our results
indicate that county-level SIP policies appear to be endogenously implemented in response to
COVID-19 exposure. We find large reductions in use of preventive care and elective services
following the introduction of SIP policies. We find that fully controlling for variations in
exposure to the COVID-19 pandemic significantly reduces the magnitude of SIP policies on
healthcare utilization. For example, when not controlling for variations in COVID-19 exposure
SIP policies are associated with an 82% reduction in the use of mammograms. Adding COVID-
19 controls for the number of weeks since the first COVID-19 case and death within a county
reduces the impact of SIP policies on use of mammograms to 16%. We find similar reductions
for other forms of preventive (e.g., colonoscopy screenings and infant immunizations) and

4
elective care (e.g., MRIs, musculoskeletal surgery, and cataract surgery). In contrast, we find
small changes in non-elective care (chemotherapy and angiograms) and no change in labor and
delivery rates. Thus, while use of health services has declined during the COVID-19 pandemic,
the decline is not due solely to SIP policies. Instead, variation in reductions in care are driven by
both the implementation of SIP policies and variations in the intensity of the COVID-19
pandemic across counties. Our results imply that while SIP policies do lead to reductions in
preventive and elective care, much of these reductions would have occurred even in the absence
of these policies. We confirm our main findings by using cellphone data on visits to physicians
and hospitals that allow for a longer duration of follow-up post implementation of SIP policies.
Additionally, we examine changes in telemedicine and in-person office visits because many
providers have shifted towards telemedicine services during the pandemic, based on
recommendations from Centers for Disease Control and Prevention (CDC) (Centers for Disease
Control and Prevention 2020). For example, over 9 million Medicare beneficiaries have received
a telemedicine service during the public health emergency, mid-March through mid-June (Verma
2020). Similarly, between March 2 and April 14, 2020, telemedicine visits increased from 102.4
daily to 801.6 daily at NYU Langone Health (Mann et al. 2020). Data from four national
telehealth providers showed a 154 percent increase in telehealth visits during the last week of
March 2020 compared to the same period in 2019 (Koonin et al. 2020). Consistent with the
existing literature, we also find that even after controlling for variations in the intensity of the
COVID-19 pandemic, the implementation of SIP policies led to a 35% reduction in the use of
office-based clinician visits and a 100% increase in the use of telemedicine. However, the
absolute change in telemedicine only offset 29% of the reduction in office-based clinician visits.
Our results echo previous work which has also confirmed that telemedicine visits have not fully

5
replaced office-based visits (Ziedan, Simon, and Wing 2020). Analysis of employer-based claims
data indicates that patients living in zip codes with lower-income or majority racial/ethnic
minority populations experienced smaller reductions in in-person visits but also had lower rates
of adoption of telemedicine (Whaley et al. 2020).
We believe that these results have several important implications for public policy. First, our
finding that necessary care has been delayed suggests that additional policies designed to restore
avoided care may be required. A concern echoed by other studies (Jain and Santhosh 2020;
Ziedan, Simon, and Wing 2020; Czeisler 2020). Second, for some patients, delaying necessary
care could have potential adverse health impacts in the future. These non-COVID-19 health
impacts are currently not fully accounted for in the health impacts of the COVD-19 pandemic
nor the impact of SIP policies (Woolf et al. 2020). These impacts are also not a major focus in
the current discussion on the impact of the pandemic on healthcare disparities despite the fact
deferred care is happening disproportionately in some populations (Czeisler 2020). Third, the
pandemic, SIP policies and their associated decline in utilization might also affect the supply
side of the market. For example, the decline in utilization of care is expected to have severe
impacts on healthcare provider finances (Farr 2020). This is in stark contrast to insurers where
lower use of health care will improve their profitability putting them in a strong financial
position to withstand COVID-19 (Lucia et al. 2020). The decline in health care utilization also
seems to be impacting employment in the health care industry. Himmelstein and Woolhander
(2020) using the Bureau of Labor Statistics data found that the number of ambulatory workforce
fell by 1.19 million persons, a 14.9% drop and the number of hospital employees decreased by
135, 000 (2.6% decline) (Himmelstein and Woolhandler 2020). Finally, we use real time
cellphone mobility data on weekly visits to offices of physicians and hospitals to confirm the

6
results of the detailed claims data. This is an important finding given that it suggests that
regulators, healthcare providers, and health departments can use these types of data to make
more rapid decisions on public health interventions.
The rest of the paper proceeds as follows. First, we outline the data sources and measures
used in the present study. Second, we define the methods used for evaluating the impact county-
level SIP policies on county-level healthcare utilization. Third, we report the results. Finally, we
contextualize the results within the broader literature and present policy implications.
2. DATA
2.1. Medical Claims Data
Our primary source of data on healthcare utilization comes from weekly aggregates of
medical claims data collected by Castlight Health in 2019 and 2020. Castlight provides price
transparency and health benefits to self-insured employers. As part of operating these services,
Castlight receives medical claims data for all employees and beneficiaries of their employer
customers. The customers vary in both size—ranging from 500 to 50,000 individuals—and in
industry—including manufacturing, education, and financial services. The data covers all U.S.
states and the District of Columbia.
We obtained de-identified information on the number of patients, number of claims, and
spending for common preventive care (colonoscopies for persons ages 46 to 64, mammograms
for women ages 46 to 64, and vaccines and immunizations for children ages two and younger),
elective (MRIs, musculoskeletal surgery, and cataract surgery), and non-elective (labor and
delivery, chemotherapy, and angioplasty) services. We also obtained information on patient
demographics (age, and gender), geographic market (state and county), and the number of

7
eligible members within each cell. The demographics of the Castlight sample in 2018 is similar
to the American Community Survey in 2018 as exhibited in Table 1. We used this information to
calculate the weekly number of patients who received each procedure per 10,000 eligible persons
We similarly obtained the number of telemedicine interactions for this population.2
2.2. Cellphone-based Measures of Healthcare Utilization
In conjunction with medical claims data, we use data from SafeGraph as a second way to
measure healthcare utilization. SafeGraph aggregates GPS pings from about 45 million mobile
devices and 6 million points-of-interest (POI). The effect of this is measurements of traffic
patterns, both to a large collection of POIs, and to/from residences of the users. We used the
“Weekly Patterns” data from SafeGraph to quantify office-based healthcare utilization. In this
dataset, for each weekly file, SafeGraph makes one row for each POI. For each POI, SafeGraph
reports its geographic location, industry via the National American Industry Classification
System (NAICS) code, and the total number of visitors in their mobile device panel that have
visited each day. The weekly data measures begin on Monday and end the following Sunday.
Since visits to each facility is a length 7 array, we are able to calculate this every day, then
combine for each week for 2019 and 2020. We use the four-digit NAICS code to identify office
of physicians (6211) and general medical and surgical hospitals (6221).3 These data have been
commonly used to examine the effect of COVID-19 and COVID-19 related policies on social
distancing (Cronin and Evans 2020; Goolsbee and Syverson 2020; Gupta et al. 2020; Cook,
Newberger, and Smalling 2020; Moreland 2020; Gao et al. 2020). To our knowledge, there are
2 Telemedicine procedures were identified as claims with procedure codes in the following set: ('99441','99442','99443','99444','99421','99422','99423','98970','98971','98972','G2061','G2062','G2063'), claims with a procedure code modifier in ('95','GT','GQ'), or a place of service code equal to 2. 3 Note that our weeks which are Wednesday-Tuesday are different than SafeGraph weeks which are Monday-Sunday. This required breaking each row into seven different daily entries, then re-combining based upon our weeks. We used the Wednesday-Tuesday designation for computational reasons.

8
only two studies that have used the SafeGraph data to measure utilization of healthcare services,
proxied by either visits to hospitals (Jay et al. 2020) or abortion clinics (Andersen, Bryan, and
Slusky 2020).
2.3. Data on Social Distancing Policies
To measure county-level SIP policies, we use data collected by Cook et al. (2020). The data
include SIP policies from the New York Times and local news and government websites. The
authors collected the dates for statewide orders from the New York Times (The New York Times
2020). For states without a state-wide order the authors searched local news and government
sites for SIP policy dates for individual counties. Counties that the authors failed to find a news
report or website that contained a SIP policy were assumed to have followed the state’s policy
(Cook, Newberger, and Smalling 2020).
2.4. COVID-19 Cases and Deaths
We obtained the total number of COVID-19 cases and deaths for each county from
USAFacts (USAFacts 2020). These data have been used in previous studies examining
disparities in COVID-19 case rates (Adhikari et al. 2020; Brown and Ravallion 2020). The data
are accumulated by the Centers for Disease Control and Prevention (CDC) using information
from state public health websites. The data track the total number of COVID-19 cases and deaths
in each county for each day. Based on these data we identified the week of the first COVID-19
case and COVID-19 death for each county.

9
3. ESTIMATION APPROACH
3.1. Effect of Social Distancing Policies on Healthcare Utilization
To estimate the effect of SIP on healthcare utilization, we would ideally estimate two-way
fixed effects difference-in-difference models that estimate the difference in utilization following
the implementation of a SIP policy. However, a key challenge of the validity of this type of
approach is the endogenous nature of SIP policies, which are likely implemented in response to
growth in the COVID-19 pandemic. We attempt to address this limitation by controlling for
county-level variations in exposure to the COVID-19 pandemic.
Our main approach uses non-parametric controls for the duration of exposure to the COVID-
19 pandemic in each county. For each county ! and week ", we calculate the number of weeks
since the first COVID-19 case (#$%&'&&(%)*) and death (+&$"ℎ'&&(%)*) in that county. We
estimate a regression that includes fixed effects for each measure of COVID-19 exposure
duration:
-$".&/"%0)* = 2 + 45678)* + ∑:*#$%&'&&(%)* + ∑;*+&$"ℎ'&&(%)* + <5=0 +>5?@@A* + >BC@DE* + FGHIJKC) + L0)* (1)
In this model, -$".&/"%0)* represents the number of patients per 10,000 eligible members who
receive each of the selected procedures. Using a dependent variable in level-terms allows for an
absolute comparison in changes in utilization across procedures. To allow for a relative
comparison, we also estimate models that use the log-transformed number of patients who
receive each procedure. We included controls for patient demographics, age and gender, in =0.
We also include fixed effects for calendar week, year, and county. We weight each regression by

10
the number of eligible members within each sample cell. We estimate these models using
ordinary least squares and cluster standard errors at the county level.
The 45 coefficient measures the effect of SIP policies, indexed by 678)*, on utilization. For
this coefficient to have a causal interpretation, there must not be an unobservable that changes
both the implementation of policies (-QR.#S)*) and utilization of care. Given the scope of the
COVID-19 pandemic, the validity of this assumption may be challenging. In particular, changes
in COVID-19 cases could lead to both implementation of policies and concerns of infection that
lead to care avoidance that would have occurred even in the absence of formal policy
declarations. Our controls for the duration of exposure attempt to address the potential
endogeneity of SIP policies. We iteratively add these controls to assess the impacts of controlling
for county-level variations in exposure to COVID-19 on the impacts of SIP policies.
We perform two additional tests to control for variations in the intensity of the COVID-19
pandemic. First, we test for differential trajectories of the COVID-19 pandemic based on county
urbanicity using measures from the National Center for Health Statistics (Centers for Disease
Control and Prevention 2019). We interact the fixed effects for the number of weeks since the
first COVID-19 case and death in each county with indicators for whether the county is an urban
or rural county, and measures of urbanicity.4 We avoid directly controlling for the number of
COVID-19 cases or deaths because both cases and deaths could be impacted by the
implementation of SIP policies.
Second, we test for pre- and post-implementation trends using an event study approach. For
the 13 weeks before and the 10 weeks following implementation of policy implementation, we
estimate weekly differences in use of each procedure using a regression of the form
4 The urban/rural categories include large central metropolitan area, large fringe metropolitan area, medium metropolitan area, micropolitan area, noncore area, and small metropolitan area.

11
S0)T* = 2 +U4V-QR.#S)VV
+ <5=0 + >?@@A* + FWDEA@K) + XYEHG@ZIE@T + L0)T* (2)
In this specification, the 4V coefficients test the impacts of the policy in the weeks before and
after implementation.
4. RESULTS
4.1. Effect of SIP policies on use of preventive, elective, and non-elective care
Figure 1 presents unadjusted trends in the use of preventive (Panel A), elective (Panel B),
and non-elective care (Panel C). For each outcome, 2020 use rates are relative to the use rates in
the same week in 2019. For all three care categories, we observe stable trends in January and
February. Beginning in March, after the declaration of the pandemic in the US, preventive and
elective care use rates decline rapidly.
While the unadjusted figures show reductions in care, they do not identify how policy
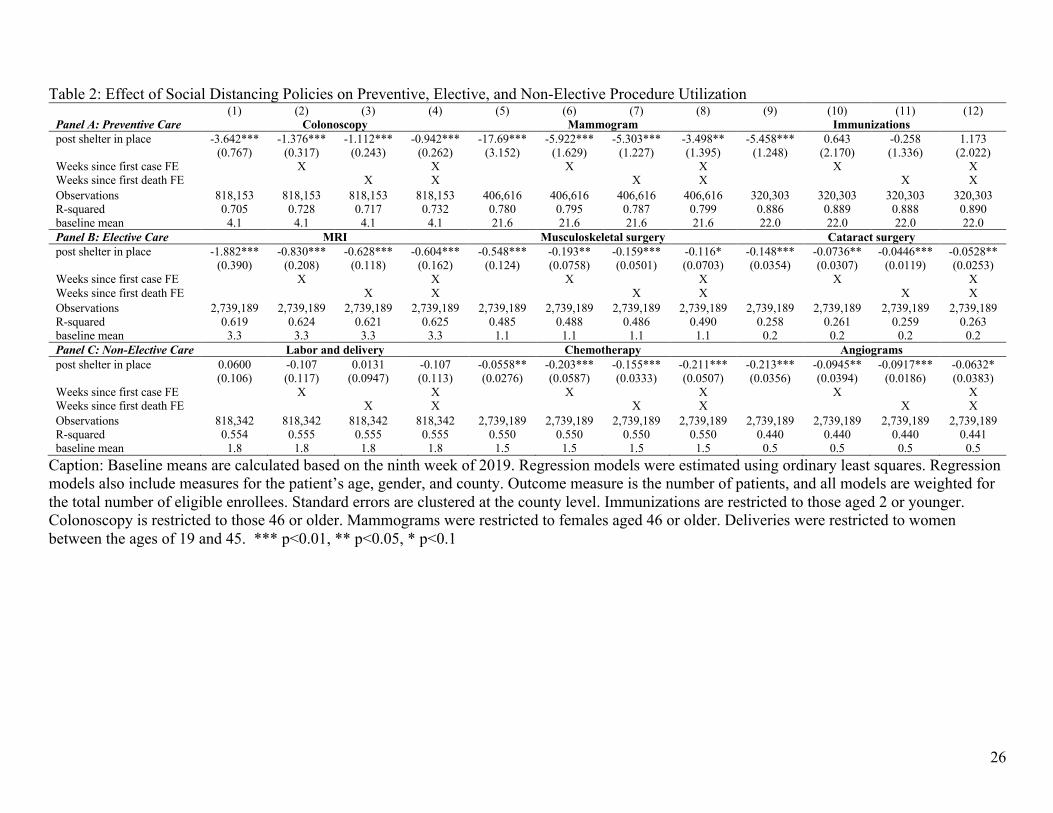
responses to limit the spread of COVID-19 impacted non-COVID-19 healthcare services. Table
2 presents difference-in-difference estimates of changes in care utilization following county-level
SIP policies. The unit of observation is at the week, county, gender, and age-group level.5 For
colonoscopies, the first four columns, utilization rates decreased by 3.6 per 10,000 persons
following SIP laws when not controlling for the county-level COVID-19 exposure, which
translates to a 89% when compared to the baseline mean utilization rate in the ninth week of
2019. Non-parametrically controlling for the weeks since the first COVID-19 case, death, and
both cases and deaths substantially reduces the impact of SIP policies on colonoscopy use (rows
5 The population for colonoscopy procedures is limited to those ages 46 to 64. Mammograms are limited to women ages 46 to 64.

12
2-4). In the preferred specification in column 4 that includes both sets of controls, the
introduction of SIP policies lead a 0.9-person decrease in the use of colonoscopies, a relative
decrease of 23%. Thus, controlling for the trajectory of the COVID-19 pandemic reduces the
impact of SIP policies on colonoscopy utilization by 74%.
In the rest of Panel A, we observe similar results for the two other forms of preventive
services—mammograms for women ages 46 to 64 (columns 5-8) and immunizations for children
under the age of two (columns 9-12). SIP laws lead to a 17.1-person decline (82% relative
reduction) in use of mammograms when not controlling for COVID-19 exposure. The effect falls
by 80% to a 5.5-person reduction (16% relative reduction) when fully controlling for COVID-19
exposure. For immunizations, we find a 5.5-person reduction (23% relative reduction) when not
controlling for COVID-19 exposure and no impacts of SIP policies when fully controlling for
COVID-19 exposure.
SIP policies lead to similarly-sized reductions in the use of elective procedures, and the effect
of SIP policies is again influenced by county exposure to the COVID-19 pandemic (Panel B).
For MRIs, musculoskeletal surgery, and cataract surgery, we find absolute reductions of 1.9, 0.5,
and 0.15 per 10,000 when not controlling for COVID-19 exposure, respectively. These absolute
reductions translate to relative reductions of 55%, 50%, and 70% in the use of each service.
However, adding the full set of COVID-19 controls reduces the impact of SIP policies on
elective healthcare utilization by approximately 70%. In columns 4, 8, and 12, we find absolute
reductions of 0.6, 0.1, and 0.05, which translate into relative reductions of 18%, 11%, and 25%.
For non-elective care (Panel C), we observe smaller changes following SIP policies. We do
not observe changes in labor and delivery rates following SIP policies. We find a small reduction
in use of chemotherapy (columns 5-8). When including the full set of COVID-19 controls, we

13
find a 0.2-person reduction in chemotherapy rates, which translates to a 14% relative reduction.
Unlike the other procedures, the effect of SIP policies is largest when including the full set of
COVID-19 controls. For cardiac angiograms, we find a 34% relative reduction when not
controlling for COVID-19 exposure and a 11% reduction when including the full set of COVID-
19 controls.
As shown in Table 3, we find similar results when using the log-transformed number of
patients with each visit. For preventive care and when fully controlling for county-level exposure
to the COVID-19 pandemic, we find a 22% reduction in the use of colonoscopies,6 a 38%
reduction in mammogram use, and a 10% reduction in infant immunization rates. These effects
of SIP policies are approximately 40% of the magnitude of the estimated effect when not
controlling for exposure to the COVID-19 pandemic (columns 1, 5, and 9). We likewise find
12%, 6%, and 2% reductions in MRI, musculoskeletal surgery, and cataract surgery elective
procedures when controlling for variations in exposure to COVID. These effects are similarly
approximately 60% of the estimated effect when not controlling for the county-level intensity of
the COVID-19 pandemic. For non-elective care, we find no change in labor and delivery rates
and small reductions, approximately 4%, in chemotherapy and angiogram rates.
Our sensitivity test that non-parametrically controls for differing trajectories of the COVID-
19 pandemic based on county-level urban vs. rural status shows similar results (Appendix Table
1 for levels and Appendix Table 2 for logs). Controlling for differential exposure to the COVID-
19 pandemic using both measures of market type (urban vs. rural and categories for urbanicity)
reduces the impact of SIP policies on healthcare utilization. In addition, we obtain similar results
for both measures of market type.
6 Because the dependent variable is log-transformed, the coefficients can be interpreted in percentage terms by applying exp(<) − 1.

14
4.1.1. Event Study Results
We estimate event studies that examine weekly trends in the use of each procedure for the
year 2020. As shown in Figure 2, the event study results are similar to the previously discussed
regression results. Following the implementation of SIP policies, we observe reductions in use
rates for preventive and elective care, but smaller or no change in weekly trends for non-elective
care. Importantly, we do also find some evidence that the reduction in utilization occurs in the
one- or two-week period prior to the implementation of a SIP policies. This immediate pre-trend
suggests that, consistent with the regression results, SIP policies are implemented in response to
COVID-19 exposure, which concurrently contributes to reductions in use of preventive and
elective services.
4.2. Substitution of in-person office visits with telehealth visits
Similar to the procedure-level trends, Figure 3 presents unadjusted weekly trends in the use
of in-person office visits and telemedicine. Through February 2020, office visit trends were
stable and averaged approximately 661.2 visits per week. During this period, telemedicine visits
were minimal, and averaged 2.8 calls per 10,000 patients per week. Beginning in March 2020,
there is a clear reduction in in-person office visits and a corresponding spike in telemedicine use.
By the end of April, in-person office visits decreased to 341.7 per 10,000 persons, relative to the
year prior, an absolute reduction of 319.4 visits and a relative decrease of 48%. Use of
telemedicine services increased to 87.6 per 10,000 persons, a relative increase of 3,066%.
However, the absolute increase in the use of telemedicine only offsets approximately 27.4% of
the decline in in-person office visits.
These descriptive findings are confirmed in the regression results presented in Table 4. Panel
A presents level changes and Panel B presents log changes. In column 1, following SIP laws, use

15
of in-person office visits declined by 107.4 persons per 10,000. The inclusion of fixed effects for
the number of weeks since the first COVID-19 case within the county reduces the magnitude of
the SIP policy coefficient by half to 49.3 (column 2). Including the number of weeks since the
first COVID-19 death further reduces the SIP coefficient to 34.0, and including both, the
preferred specification, results in a 36.6-person reduction in the use of office visits. In Panel B,
when using log-transformed in-person office visits, SIP policies lead to a 55% reduction in use of
in-person office visits (column 1), which decreases to a 35% reduction when including the full
set of county-level COVID-19 controls (column 4).
The same factors that cause a reduction in in-person office visits also lead to an increase in
telemedicine visits. SIP policies lead to a 64.2-person increase in the use of telemedicine when
not controlling for variation in COVID-19 exposure, and a 10.5-person increase when adding the
full set of COVID-19 controls. In relative terms (Panel B), the preferred specification in column
8 shows a 99.6% increase in the use of telemedicine, which is smaller than the estimated 766%
in column 5 when not controlling for county-level COVID-19 exposure. However, the large
relative shift towards telemedicine does not offset the even larger absolute reduction in in-person
office visits. The difference between the absolute change coefficients in columns 4 and 8 shows
that the increase in telemedicine offsets only approximately 29% of the decline in in-person
office visits.
4.3. Changes in healthcare utilization using mobile tracking data
As a robustness check we estimate models using the mobile tracking data. In Appendix
Figure 1 we report the unadjusted number of weekly visits to both office of physicians and
hospitals in 2020. The number of weekly visits dropped drastically for physicians and hospitals
after the national emergency declaration. For the regression models we obtain similar results

16
when using mobile tracking data that measures the weekly number of visits to healthcare
providers (Table 5). For physician office visits, columns 1-4, we find that weekly visits to
physicians decreased by 11.8 following the introduction of SIP policies, a relative decrease of
26%. The dependent variable is weekly foot traffic to locations of individual offices of
physicians. Panel B presents log-transformed visits, which can be interpreted as relative changes.
Because the SafeGraph data derives from a sample approximately 10% of all cell phone users,
the absolute reductions are an underestimate of the absolute changes in visits. The estimated
impact of SIP laws falls considerably when controlling for the number of weeks since the first
COVID-19 case and death. The preferred specification in column 4 indicates a 3.7 decrease, a
relative change of 8%. The result in Panel B, a 10% reduction, is similar.
Similar patterns exist for visits to hospitals (Table 8, columns 5-8). Following the
introduction of SIP policies, weekly visits to hospitals decreased by 145.8 visits per week, a
relative decrease of 30%. The relative decreases in Panel B is a 23% reduction. Adding in the
fixed effects that measure COVID-duration in each county reduces the magnitude of the SIP
coefficient. Following the first COVID-19 case, weekly visits to hospitals decrease by 61.9 visits
per week, a relative decrease of 13%. In column 8, the impact of SIP laws on weekly visits to
hospitals decreases to a 49.3 absolute differences, equivalent to a 10.0% reduction off of baseline
rates, and a 14% relative difference when measured in logs.
5. DISCUSSION
The COVID-19 pandemic has been an unprecedented shock to the U.S. healthcare delivery
system. We found a drastic decline in preventive and elective services due to SIP policies related
to the COVID-19 pandemic, but the impact of these policies is lessened when accounting for
variations in exposure to the COVID-19 pandemic. These reductions in use of non-COVID care

17
as a result of SIP policies should be weighed against potential benefits when evaluating the
welfare implications of SIP policies.
Our results also suggest that the COVID-19 pandemic led to drastic reductions in use of
health care. These effects were much larger than the decline in care due to SIP policies. Our
estimates of decline in healthcare utilization during the early stages of the pandemic are in line
with existing studies by Chatterji and Li (2020), Mehrotra and colleagues (2020) and Ziedan et
al. (2020). It is important to note that our findings are during the initial stage of the pandemic,
and that the length of the pandemic and mitigation strategies will define the aggregate cost on
both consumers and providers (Cutler 2020). Some are concerned that the deferred care may
cause some individuals with chronic conditions to become sicker and that it might increase
aggregate costs (Lucia et al. 2020). This may also lead to constraints on care capacity post
pandemic (Wosik et al. 2020). In addition, how the healthcare sector will be able to provide
elective procedures once the pandemic has subsided is not known. Anecdotal evidence from
some providers is that they will shift elective procedures to weekends (Lucia et al. 2020). Future
researchers should explore this possibility and whether there are impacts on quality of care.
Our results provide a crucial first step on measuring the impact of COVID-19 on healthcare
utilization based on various measures. The findings are important given that the Government
Accountability Office has now pledged to track monthly changes in healthcare employment,
change in volume of elective procedures across settings, median monthly changes in hospital
operating margins, and changes in healthcare services as a proportion of personal consumption
expenditures (Government Accountability Office 2020). The results using cellular phone
geolocation data imply that these data should be considered when measuring healthcare

18
utilization over the course of the pandemic while waiting for healthcare claims data to be
released.
We also found that while there were drastic declines in in-person office visits that there was a
rapid increase in telemedicine utilization. Telemedicine services have been used to maintain
access and continuity of medical care (Wosik et al. 2020). However, in line with previous work,
telemedicine utilization did not sufficiently replace the entire drop in in-person office visits
(Mehrotra et al. 2020). Whether telemedicine use will be sustained during and following the
COVID-19 pandemic remains uncertain. The uncertainty is driven in part by uncertainty if the
existing policy landscape for telemedicine will be sustained as the pandemic proceeds and
eventually ends (Lucia et al. 2020). For example, insurers are concerned that the increase in
telemedicine may lead to increases in fraud and overutilization of services if it becomes additive
over existing trends post pandemic (Lucia et al. 2020). Separately, many providers report that
they do not have the technology system to make the shift to telemedicine or that in-person office
visits are needed to achieve a positive health outcome (Lucia et al. 2020). These concerns should
be addressed given that after the pandemic, telemedicine can serve as one way to proactively
engage with patients who deferred care and to help the healthcare system manage the upcoming
surge in demand for procedures unrelated to COVID-19 (Wosik et al. 2020).
This study is not without limitations. First, while we use medical claims data from a large
and diverse study population that is employed, it represents a subset of individuals with private
insurance and it does not include other important populations, such as patients with Medicaid,
and those lacking insurance. Insurers have reported that Medicaid enrollment is increasing at a
rapid rate when compared to marketplace enrollment, but surprisingly enough slower-than
expected (Lucia et al. 2020). Our findings, while large, are potentially an underestimate for the

19
declines in the number of visits and length of stay. Second, the SafeGraph mobile tracking data,
comprise of approximately 10 percent of all cellphone users and 6 million locations. Thus, our
results using those data are limited to that particular population and those particular locations.
Our measures of number of visits are not necessarily tracking healthcare utilization, instead the
number of individuals who visit locations under that particular NAICS code. Third, we are not
able to examine whether care that has been deferred during the early period of the COVID-19
pandemic will be deferred until the future or avoided completely. Our estimates do not capture
potential innovative approaches by providers to ensure patient resumption of preventive care.
This limitation is important, given that concerted efforts are being made to increase the use of
preventive services such as vaccinations which has exhibited a sharp initial drop after the
national emergency declaration. Future work must monitor each of the preventive measures that
we track in the present study and disparities in the use of preventive services. Fourth, the present
study does not include measures of healthcare capacity. That said, a recent report by the
Government Accountability Office (2020) reports that intensive care unit bed availability data is
not currently up to date given that only 60 percent of hospitals have reported their information as
of early June 2020 and that 95 to 100 percent are needed for effective analysis (Government
Accountability Office 2020).
To our knowledge, our study is the most comprehensive to date on the effects of county-level
SIP policies on healthcare utilization. We use multiple novel datasets and measures to evaluate
the effect of these policies. Our results indicate that utilization has dropped drastically and that it
varies by the type of care received and the severity of the COVID-19 pandemic within a county.
Finally, our results indicate that while the use of telemedicine has increased, it has not fully

20
replaced the use of office-based visits. Thus, it is critical that public policy and public health
officials do more to ensure that individuals receive the care that they desperately need.

21
6. REFERENCES
Adhikari, Samrachana, Nicholas P. Pantaleo, Justin M. Feldman, Olugbenga Ogedegbe, Lorna Thorpe, and Andrea B. Troxel. 2020. “Assessment of Community-Level Disparities in Coronavirus Disease 2019 (COVID-19) Infections and Deaths in Large US Metropolitan Areas.” JAMA Network Open 3 (7): e2016938–e2016938. https://doi.org/10.1001/jamanetworkopen.2020.16938.
Amuedo-Dorantes, Catalina, Neeraj Kaushal, and Ashley N Muchow. 2020. “Is the Cure Worse than the Disease? County-Level Evidence from the COVID-19 Pandemic in the United States.” Working Paper 27759. Working Paper Series. National Bureau of Economic Research. https://doi.org/10.3386/w27759.
Andersen, Martin, Sylvia Bryan, and David Slusky. 2020. “COVID-19 Surgical Abortion Restriction Did Not Reduce Visits to Abortion Clinics.” Working Paper 28058. National Bureau of Economic Research. https://www.nber.org/papers/w28058#fromrss.
Brown, Caitlin S, and Martin Ravallion. 2020. “Inequality and the Coronavirus: Socioeconomic Covariates of Behavioral Responses and Viral Outcomes Across US Counties.” Working Paper 27549. Working Paper Series. National Bureau of Economic Research. https://doi.org/10.3386/w27549.
Centers for Disease Control and Prevention. 2019. “Urban Rural Classification Scheme for Counties.” 2019. https://www.cdc.gov/nchs/data_access/urban_rural.htm.
———. 2020. “Healthcare Facilities: Managing Operations During the COVID-19 Pandemic.” Centers for Disease Control and Prevention. 2020. https://www.cdc.gov/coronavirus/2019-ncov/hcp/guidance-hcf.html.
Chatterji, Pinka, and Yue Li. 2020. “Effects of the COVID-19 Pandemic on Outpatient Providers in the US.” Working Paper 27173. Working Paper Series. National Bureau of Economic Research. https://doi.org/10.3386/w27173.
Cook, Jonathan, Noah Newberger, and Sami Smalling. 2020. “The Spread of Social Distancing.” Economics Letters 196 (November): 109511. https://doi.org/10.1016/j.econlet.2020.109511.
Courtemanche, Charles, Joseph Garuccio, Anh Le, Joshua Pinkston, and Aaron Yelowitz. 2020. “Strong Social Distancing Measures In The United States Reduced The COVID-19 Growth Rate.” Health Affairs 39 (7): 1237–46. https://doi.org/10.1377/hlthaff.2020.00608.
Cronin, Christopher J., and William N. Evans. 2020. “Private Precaution and Public Restrictions: What Drives Social Distancing and Industry Foot Traffic in the COVID-19 Era?” National Bureau of Economic Research Working Paper Series, July. https://www.nber.org/papers/w27531.ack.
Cutler, David. 2020. “How Will COVID-19 Affect the Health Care Economy?” JAMA Health Forum 1 (4): e200419–e200419. https://doi.org/10.1001/jamahealthforum.2020.0419.
Cutler, David M., and Lawrence H. Summers. 2020. “The COVID-19 Pandemic and the $16 Trillion Virus.” JAMA, October. https://doi.org/10.1001/jama.2020.19759.
Czeisler, Mark É. 2020. “Delay or Avoidance of Medical Care Because of COVID-19–Related Concerns — United States, June 2020.” MMWR. Morbidity and Mortality Weekly Report 69. https://doi.org/10.15585/mmwr.mm6936a4.

22
Farr, Christina. 2020. “Hospitals Losing Millions of Dollars per Day in Covid-19 Pandemic- and Recovery May Take Years.” CNBC, 2020. https://www.cnbc.com/2020/05/05/hospitals-losing-millions-of-dollars-per-day-in-covid-19-pandemic.html.
Gao, Song, Jinmeng Rao, Yuhao Kang, Yunlei Liang, Jake Kruse, Dorte Dopfer, Ajay K. Sethi, Juan Francisco Mandujano Reyes, Brian S. Yandell, and Jonathan A. Patz. 2020. “Association of Mobile Phone Location Data Indications of Travel and Stay-at-Home Mandates With COVID-19 Infection Rates in the US.” JAMA Network Open 3 (9): e2020485–e2020485. https://doi.org/10.1001/jamanetworkopen.2020.20485.
Goodman-Bacon, Andrew, and Jan Marcus, 2020. "Difference-in-Differences to Identify Causal Effects of COVID-19 Policies." Discussion Papers of DIW Berlin 1870, DIW Berlin, German Institute for Economic Research.
Goolsbee, Austan, and Chad Syverson. 2020. “Fear, Lockdown, and Diversion: Comparing Drivers of Pandemic Economic Decline 2020.” Working Paper 27432. Working Paper Series. National Bureau of Economic Research. https://doi.org/10.3386/w27432.
Government Accountability Office. 2020. “Covid-19: Opportunities to Improve Federal Response and Recovery Efforts.” https://www.gao.gov/products/gao-20-625.
Gupta, Sumedha, Laura Montenovo, Thuy D Nguyen, Felipe Lozano Rojas, Ian M Schmutte, Kosali I Simon, Bruce A Weinberg, and Coady Wing. 2020. “Effects of Social Distancing Policy on Labor Market Outcomes.” Working Paper 27280. Working Paper Series. National Bureau of Economic Research. https://doi.org/10.3386/w27280.
Himmelstein, David U., and Steffie Woolhandler. 2020. “The U.S. Health Care System on the Eve of the Covid-19 Epidemic: A Summary of Recent Evidence on Its Impaired Performance.” International Journal of Health Service, 1–7.
Jain, Snigdha, and Lekshmi Santhosh. 2020. “On Treatments and Tests Deferred: Preparing for Collateral Damage from COVID-19.” Annals of the American Thoracic Society, July. https://doi.org/10.1513/AnnalsATS.202004-387VP.
Jay, Jonathan, Jacob Bor, Elaine O. Nsoesie, Sarah K. Lipson, David K. Jones, Sandro Galea, and Julia Raifman. 2020. “Neighbourhood Income and Physical Distancing during the COVID-19 Pandemic in the United States.” Nature Human Behaviour, November, 1–9. https://doi.org/10.1038/s41562-020-00998-2.
Koonin, Lisa M., Brooke Hoots, Clarisse A. Tsang, Zanie Leroy, Kevin Farris, Brandon Jolly, Peter Antall, et al. 2020. “Trends in the Use of Telehealth During the Emergence of the COVID-19 Pandemic — United States, January–March 2020.” MMWR. Morbidity and Mortality Weekly Report 69 (43): 1595–99. https://doi.org/10.15585/mmwr.mm6943a3.
Lucia, Kevin, Linda J. Blumberg, Emily Curran, John Holahan, Erik Wengle, Olivia Hoppe, and Sabrina Corlette. 2020. “The COVID-19 Pandemic – Insurer Insights Into Challenges, Implications, and Lessons Learned.” Urban Institute. June 29, 2020. https://www.urban.org/research/publication/covid-19-pandemic-insurer-insights-challenges-implications-and-lessons-learned.
Mann, Devin M., Ji Chen, Rumi Chunara, Paul A. Testa, and Oded Nov. 2020. “COVID-19 Transforms Health Care through Telemedicine: Evidence from the Field.” Journal of the American Medical Informatics Association 27 (7): 1132–35. https://doi.org/10.1093/jamia/ocaa072.
Matrajt, Laura, and Tiffany Leung. 2020. “Evaluating the Effectiveness of Social Distancing Interventions to Delay or Flatten the Epidemic Curve of Coronavirus Disease.” Emerging Infectious Diseases 26 (8): 1740–48. https://doi.org/10.3201/eid2608.201093.

23
Mehrotra, Ateev, Michael Chernew, David Linetsky, Hilary Hatch, and David Cutler. 2020. “The Impact of the COVID-19 Pandemic on Outpatient Visits: A Rebound Emerges.” 2020. https://doi.org/10.26099/ds9e-jm36.
Moreland, Amanda. 2020. “Timing of State and Territorial COVID-19 Stay-at-Home Orders and Changes in Population Movement — United States, March 1–May 31, 2020.” MMWR. Morbidity and Mortality Weekly Report 69. https://doi.org/10.15585/mmwr.mm6935a2.
“Proclamation on Declaring a National Emergency Concerning the Novel Coronavirus Disease (COVID-19) Outbreak.” 2020. The White House. https://www.whitehouse.gov/presidential-actions/proclamation-declaring-national-emergency-concerning-novel-coronavirus-disease-covid-19-outbreak/.
The New York Times. 2020. “See How All 50 States Are Reopening (and Closing Again).” 2020. https://www.nytimes.com/interactive/2020/us/states-reopen-map-coronavirus.html.
USAFacts. 2020. “Coronavirus Outbreak Stats & Data.” 2020. https://usafacts.org/issues/coronavirus/.
Verma, Seema. 2020. “Early Impact Of CMS Expansion Of Medicare Telehealth During COVID-19.” 2020. https://www.healthaffairs.org/do/10.1377/hblog20200715.454789/full/.
Whaley, Christopher, Megan Pera, Jonathan Cantor, Jennie Chang, Julia Velasco, Heather Hagg, and Dena Bravata. 2020. “Changes in Health Services Use Among Commercially Insured US Populations During the COVID-19 Pandemic.” JAMA Network Open 3 (11).
Woolf, Steven H., Derek A. Chapman, Roy T. Sabo, Daniel M. Weinberger, and Latoya Hill. 2020. “Excess Deaths From COVID-19 and Other Causes, March-April 2020.” JAMA 324 (5): 510–13.
Wosik, Josek, Marat Fudim, Blake Cameron, Ziad F. Gellad, Alex Cho, Donna Phinney, Simon Curtis, et al. 2020. “Telehealth Transformation: COVID-19 and the Rise of Virtual Care.” Journal of Informatics in Health and Biomedicine 27 (6): 957–62. https://doi.org/10.1001/jamanetworkopen.2020.24984.
Ziedan, Engy, Kosali I Simon, and Coady Wing. 2020. “Effects of State COVID-19 Closure Policy on NON-COVID-19 Health Care Utilization.” Working Paper 27621. Working Paper Series. National Bureau of Economic Research. https://doi.org/10.3386/w27621.

24
7. TABLES AND FIGURES
Table 1: Unadjusted Descriptive Statistics of Castlight Health population and American US Community Survey in 2018
Castlight Health (2018) ACS (2018) Number of enrolled persons 5,608,888 162,136,077 Gender, percent female (%) 50.0% 50.0% Average age 34.3 33.5 Census region South 40.6% 35.70% Midwest 23.0% 22.80% Northeast 10.4% 18.20% West 26.0% 23.40%

25
Figure 1: Unadjusted Trends in Healthcare Service Utilization Panel A: Preventive Care
Panel B: Elective Care
Panel C: Non-Elective Care
Caption: Immunizations are restricted to those aged 2 or younger. Colonoscopy is restricted to those 46 or older. Mammograms were restricted to females aged 46 or older. Deliveries were restricted to women between the ages of 19 and 45.
-100
-50
0
Pere
cent
cha
nge
in ra
te
0 5 10 15 20week of year
Colonoscopy MammogramImmunizations
-100
-50
0
Pere
cent
cha
nge
in ra
te
0 5 10 15 20week of year
Cataract removal Musculoskeletal SurgeryMRI
-60
-40
-20
0
20
Pere
cent
cha
nge
in ra
te
0 5 10 15 20week of year
Deliveries ChemotherapyAngiograms
26
Table 2: Effect of Social Distancing Policies on Preventive, Elective, and Non-Elective Procedure Utilization (1) (2) (3) (4) (5) (6) (7) (8) (9) (10) (11) (12) Panel A: Preventive Care Colonoscopy Mammogram Immunizations post shelter in place -3.642*** -1.376*** -1.112*** -0.942*** -17.69*** -5.922*** -5.303*** -3.498** -5.458*** 0.643 -0.258 1.173
(0.767) (0.317) (0.243) (0.262) (3.152) (1.629) (1.227) (1.395) (1.248) (2.170) (1.336) (2.022) Weeks since first case FE X X X X X X Weeks since first death FE X X X X X X Observations 818,153 818,153 818,153 818,153 406,616 406,616 406,616 406,616 320,303 320,303 320,303 320,303 R-squared 0.705 0.728 0.717 0.732 0.780 0.795 0.787 0.799 0.886 0.889 0.888 0.890 baseline mean 4.1 4.1 4.1 4.1 21.6 21.6 21.6 21.6 22.0 22.0 22.0 22.0 Panel B: Elective Care MRI Musculoskeletal surgery Cataract surgery post shelter in place -1.882*** -0.830*** -0.628*** -0.604*** -0.548*** -0.193** -0.159*** -0.116* -0.148*** -0.0736** -0.0446*** -0.0528**
(0.390) (0.208) (0.118) (0.162) (0.124) (0.0758) (0.0501) (0.0703) (0.0354) (0.0307) (0.0119) (0.0253) Weeks since first case FE X X X X X X Weeks since first death FE X X X X X X Observations 2,739,189 2,739,189 2,739,189 2,739,189 2,739,189 2,739,189 2,739,189 2,739,189 2,739,189 2,739,189 2,739,189 2,739,189 R-squared 0.619 0.624 0.621 0.625 0.485 0.488 0.486 0.490 0.258 0.261 0.259 0.263 baseline mean 3.3 3.3 3.3 3.3 1.1 1.1 1.1 1.1 0.2 0.2 0.2 0.2 Panel C: Non-Elective Care Labor and delivery Chemotherapy Angiograms post shelter in place 0.0600 -0.107 0.0131 -0.107 -0.0558** -0.203*** -0.155*** -0.211*** -0.213*** -0.0945** -0.0917*** -0.0632*
(0.106) (0.117) (0.0947) (0.113) (0.0276) (0.0587) (0.0333) (0.0507) (0.0356) (0.0394) (0.0186) (0.0383) Weeks since first case FE X X X X X X Weeks since first death FE X X X X X X Observations 818,342 818,342 818,342 818,342 2,739,189 2,739,189 2,739,189 2,739,189 2,739,189 2,739,189 2,739,189 2,739,189 R-squared 0.554 0.555 0.555 0.555 0.550 0.550 0.550 0.550 0.440 0.440 0.440 0.441 baseline mean 1.8 1.8 1.8 1.8 1.5 1.5 1.5 1.5 0.5 0.5 0.5 0.5
Caption: Baseline means are calculated based on the ninth week of 2019. Regression models were estimated using ordinary least squares. Regression models also include measures for the patient’s age, gender, and county. Outcome measure is the number of patients, and all models are weighted for the total number of eligible enrollees. Standard errors are clustered at the county level. Immunizations are restricted to those aged 2 or younger. Colonoscopy is restricted to those 46 or older. Mammograms were restricted to females aged 46 or older. Deliveries were restricted to women between the ages of 19 and 45. *** p<0.01, ** p<0.05, * p<0.1

27
Table 3: Effect of Social Distancing Policies on Log-Transformed Preventive, Elective, and Non-Elective Procedure Utilization (1) (2) (3) (4) (5) (6) (7) (8) (9) (10) (11) (12) Panel A: Preventive Care Colonoscopy Mammogram Immunizations post shelter in place -0.745*** -0.370*** -0.296*** -0.247*** -1.002*** -0.647*** -0.587*** -0.473*** -0.156*** -0.129*** -0.126*** -0.104***
(0.0703) (0.0587) (0.0342) (0.0452) (0.0444) (0.0801) (0.0402) (0.0556) -0.0158 -0.0245 -0.0164 -0.0241 Weeks since first case FE X X X X X X Weeks since first death FE X X X X X X Observations 818,153 818,153 818,153 818,153 406,616 406,616 406,616 406,616 320,303 320,303 320,303 320,303 R-squared 0.748 0.758 0.757 0.763 0.879 0.884 0.886 0.888 0.930 0.930 0.930 0.931 baseline mean 4.1 4.1 4.1 4.1 21.6 21.6 21.6 21.6 22.0 22.0 22.0 22.0 Panel B: Elective Care MRI Musculoskeletal surgery Cataract surgery post shelter in place -0.296*** -0.180*** -0.143*** -0.131*** -0.176*** -0.0958*** -0.0757*** -0.0646*** -0.0679*** -0.0337*** -0.0215*** -0.0223**
(0.0248) (0.0260) (0.0150) (0.0202) (0.0238) (0.0179) (0.0128) (0.0160) (0.0121) (0.0112) (0.00519) (0.00878) Weeks since first case FE X X X X X X Weeks since first death FE X X X X X X Observations 2,739,189 2,739,189 2,739,189 2,739,189 2,739,189 2,739,189 2,739,189 2,739,189 2,739,189 2,739,189 2,739,189 2,739,189 R-squared 0.719 0.720 0.720 0.721 0.551 0.552 0.552 0.553 0.297 0.300 0.299 0.301 baseline mean 3.3 3.3 3.3 3.3 1.1 1.1 1.1 1.1 0.2 0.2 0.2 0.2 Panel C: Non-Elective Care Labor and delivery Chemotherapy Angiograms post shelter in place -0.00155 -0.0164 -0.0103 -0.0195 -0.0173*** -0.0370*** -0.0333*** -0.0401*** -0.0825*** -0.0522*** -0.0494*** -0.0408***
(0.00878) (0.0143) (0.0108) (0.0138) (0.00507) (0.0127) (0.00709) (0.0113) (0.0112) (0.0111) (0.00856) (0.0115) Weeks since first case FE X X X X X X Weeks since first death FE X X X X X X Observations 818,342 818,342 818,342 818,342 2,739,189 2,739,189 2,739,189 2,739,189 2,739,189 2,739,189 2,739,189 2,739,189 R-squared 0.646 0.646 0.646 0.647 0.629 0.629 0.629 0.629 0.477 0.477 0.477 0.478 baseline mean 1.8 1.8 1.8 1.8 1.5 1.5 1.5 1.5 0.5 0.5 0.5 0.5
Caption: Baseline means are calculated based on the ninth week of 2019. Regression models were estimated using ordinary least squares. Regression models also include measures for the patient’s age, gender, and county. Outcome measure is the natural log for the number of patients, and all models are weighted for the total number of eligible enrollees. Standard errors are clustered at the county level. Immunizations are restricted to those aged 2 or younger. Colonoscopy is restricted to those 46 or older. Mammograms were restricted to females aged 46 or older. Deliveries were restricted to women between the ages of 19 and 45. *** p<0.01, ** p<0.05, * p<0.1

28
Figure 2: Event Studies on Effect of Social Distancing on Preventive, Elective, and Non-Elective Procedure Utilization Panel A: Preventive Care
Panel B: Elective Care
Panel C: Non-Elective Care
-2
0
2
4
6
rela
tive
diffe
renc
e to
pre
per
iod
-13 -12 -11 -10 -9 -8 -7 -6 -5 -4 -3 -2 -1 1 2 3 4 5 6 7 8 9 10
Colonoscopy
-10
0
10
20
30
rela
tive
diffe
renc
e to
pre
per
iod
-13 -12 -11 -10 -9 -8 -7 -6 -5 -4 -3 -2 -1 1 2 3 4 5 6 7 8 9 10
Mammograms
-10
0
10
20
30
rela
tive
diffe
renc
e to
pre
per
iod
-13 -12 -11 -10 -9 -8 -7 -6 -5 -4 -3 -2 -1 1 2 3 4 5 6 7 8 9 10
Injections immunizations
-2
-1
0
1
2
rela
tive
diffe
renc
e to
pre
per
iod
-13 -12 -11 -10 -9 -8 -7 -6 -5 -4 -3 -2 -1 1 2 3 4 5 6 7 8 9 10
MRI
-.5
0
.5
1
rela
tive
diffe
renc
e to
pre
per
iod
-13 -12 -11 -10 -9 -8 -7 -6 -5 -4 -3 -2 -1 1 2 3 4 5 6 7 8 9 10
Other major musculoskeletal surgery
-.1
0
.1
.2
.3
rela
tive
diffe
renc
e to
pre
per
iod
-13 -12 -11 -10 -9 -8 -7 -6 -5 -4 -3 -2 -1 1 2 3 4 5 6 7 8 9 10
Cataract removal
-1
-.5
0
.5
rela
tive
diffe
renc
e to
pre
per
iod
-13 -12 -11 -10 -9 -8 -7 -6 -5 -4 -3 -2 -1 1 2 3 4 5 6 7 8 9 10
Deliveries
-.4
-.2
0
.2
.4
.6
rela
tive
diffe
renc
e to
pre
per
iod
-13 -12 -11 -10 -9 -8 -7 -6 -5 -4 -3 -2 -1 1 2 3 4 5 6 7 8 9 10
Chemotherapy
-.2
0
.2
.4
rela
tive
diffe
renc
e to
pre
per
iod
-13 -12 -11 -10 -9 -8 -7 -6 -5 -4 -3 -2 -1 1 2 3 4 5 6 7 8 9 10
Angiograms

29
Figure 3: Unadjusted Trends in In-Person Office Visits and Telemedicine Use

30
Table 4: Effect of Social Distancing Policies and COVID-19 Exposure on In-Person Office Visit and Telemedicine Utilization:
(1) (2) (3) (4) (5) (6) (7) (8) In-person office visits Telemedicine Panel A: Level changes post shelter in place -107.4*** -49.30*** -34.01*** -36.62*** 64.18*** 17.26*** 12.20*** 10.48***
(20.50) (10.20) (5.972) (8.060) (12.69) (3.145) (2.541) (2.555) Weeks since first case FE X X X X Weeks since first death FE X X X X Observations 2,739,189 2,739,189 2,739,189 2,739,189 2,739,189 2,739,189 2,739,189 2,739,189 R-squared 0.731 0.744 0.738 0.746 0.329 0.507 0.421 0.519 baseline mean 161.8 161.8 161.8 161.8 1.4 1.4 1.4 1.4 Panel B: Log changes post shelter in place -0.797*** -0.521*** -0.546*** -0.432*** 2.159*** 0.976*** 0.992*** 0.691***
(0.0248) (0.0486) (0.0235) (0.0364) (0.0831) (0.116) (0.0606) (0.0834) Weeks since first case FE X X X X Weeks since first death FE X X X X Observations 2,739,189 2,739,189 2,739,189 2,739,189 2,739,189 2,739,189 2,739,189 2,739,189 R-squared 0.943 0.944 0.944 0.945 0.767 0.799 0.801 0.809
Caption: Baseline means are calculated based on the ninth week of 2019. Regression models were estimated using ordinary least squares. Regression models also include measures for the patient’s age, gender, and county. Outcome measure is the number of patients, and all models are weighted for the total number of eligible enrollees. Standard errors are clustered at the county level. *** p<0.01, ** p<0.05, * p<0.1

31
Table 5: Effect of Social Distancing Policies on Visits to Physician Office and Hospital Locations
(1) (2) (3) (4) (5) (6) (7) (8) Offices of Physicians Hospitals Panel A: Level changes post shelter in place -11.80*** -5.065*** -7.694*** -3.671*** -145.8*** -73.65*** -87.59*** -49.34***
(0.352) (1.043) (0.666) (0.834) (11.75) (14.68) (10.50) (14.95) Weeks since first case FE X X X X Weeks since first death FE X X X X Observations 8,194,303 8,194,303 8,194,303 8,194,303 635,050 635,050 635,050 635,050 R-squared 0.030 0.030 0.030 0.031 0.318 0.319 0.319 0.320 baseline mean 45.5 45.5 45.5 45.5 490.1 490.1 490.1 490.1 Panel B: Log changes post shelter in place -0.207*** -0.124*** -0.165*** -0.102*** -0.258*** -0.169*** -0.237*** -0.149***
(0.00429) (0.0155) (0.00903) (0.0114) (0.0188) (0.0200) (0.0140) (0.0182) Weeks since first case FE X X X X Weeks since first death FE X X X X Observations 8,194,303 8,194,303 8,194,303 8,194,303 635,050 635,050 635,050 635,050 R-squared 0.056 0.057 0.057 0.057 0.428 0.430 0.429 0.431 Baseline mean 45.5 45.5 45.5 45.5 490.1 490.1 490.1 490.1
Caption: Unit of analysis is the number of visits in a week to an office of physician or hospital. Baseline means are calculated based on the ninth week of 2019. Regression models were estimated using ordinary least squares. Outcome measure is the number of visits. We use the four-digit NAICS code to identify office of physicians (6211) and general medical and surgical hospitals (6221). Standard errors are clustered at the county level. *** p<0.01, ** p<0.05, * p<0.1

32
8. APPENDIX
Table A1: Effect of Social Distancing Policies on Preventive, Elective, and Non-Elective Procedure Utilization—Differences by County Urbanicity (1) (2) (3) (4) (5) (6) (7) (8) (9) Panel A: Preventive Care Colonoscopy Mammogram Immunizations post shelter in place -3.642*** -1.079*** -1.082*** -17.69*** -4.451*** -4.934*** -5.458*** 0.765 -0.670
(0.767) (0.276) (0.318) (3.152) (1.466) (1.634) (1.248) (1.903) (1.292) Weeks since first case FE × urban X X X Weeks since first death FE × metro type X X X Observations 818,153 816,870 816,870 406,616 405,964 405,964 320,303 319,698 319,698 R-squared 0.705 0.735 0.750 0.780 0.802 0.816 0.886 0.890 0.894 baseline mean 4.1 4.1 4.1 21.6 21.6 21.6 22.0 22.0 22.0 Panel B: Elective Care MRI Musculoskeletal surgery Cataract surgery post shelter in place -1.882*** -0.636*** -0.581*** -0.548*** -0.142** -0.181** -0.148*** -0.0560** -0.0450***
(0.390) (0.158) (0.156) (0.124) (0.0702) (0.0722) (0.0354) (0.0235) (0.0168) Weeks since first case FE × urban X X X Weeks since first death FE × metro type X X X Observations 2,739,189 2,734,831 2,734,831 2,739,189 2,734,831 2,734,831 2,739,189 2,734,831 2,734,831 R-squared 0.619 0.626 0.630 0.485 0.490 0.495 0.258 0.263 0.266 baseline mean 3.3 3.3 3.3 1.1 1.1 1.1 0.2 0.2 0.2 Panel C: Non-Elective Care Labor and delivery Chemotherapy Angiograms post shelter in place 0.0600 -0.0520 0.0966 -0.0558** -0.189*** -0.136*** -0.213*** -0.0634* -0.0481
(0.106) (0.116) (0.120) (0.0276) (0.0476) (0.0389) (0.0356) (0.0374) (0.0361) Weeks since first case FE × urban X X X Weeks since first death FE × metro type X X X Observations 818,342 817,035 817,035 2,739,189 2,734,831 2,734,831 2,739,189 2,734,831 2,734,831 R-squared 0.554 0.555 0.556 0.550 0.551 0.551 0.440 0.441 0.442 baseline mean 1.8 1.8 1.8 1.5 1.5 1.5 0.5 0.5 0.5
Caption: Baseline means are calculated based on the ninth week of 2019. Regression models were estimated using ordinary least squares. Regression models also include measures for the patient’s age, gender, and county. Outcome measure is the number of patients, and all models are weighted for the total number of eligible enrollees. Standard errors are clustered at the county level. Immunizations are restricted to those aged 2 or younger. Colonoscopy is restricted to those 46 or older. Mammograms were restricted to females aged 46 or older. Deliveries were restricted to women between the ages of 19 and 45. *** p<0.01, ** p<0.05, * p<0.1

33
Appendix Table A2: Effect of Social Distancing Policies on Log-Transformed Preventive, Elective, and Non-Elective Procedure Utilization—Differences by County Urbanicity
(1) (2) (3) (5) (6) (7) (9) (10) (11) Panel A: Preventive Care Colonoscopy Mammogram Immunizations post shelter in place -0.745*** -0.286*** -0.263*** -1.002*** -0.528*** -0.441*** -0.156*** -0.119*** -0.125***
(0.0703) (0.0489) (0.0638) (0.0444) (0.0608) (0.0770) (0.0158) (0.0238) (0.0246) Weeks since first case FE × urban X X X Weeks since first death FE × metro type X X X Observations 818,153 816,870 816,870 406,616 405,964 405,964 320,303 319,698 319,698 R-squared 0.748 0.768 0.780 0.879 0.892 0.898 0.930 0.931 0.931 baseline mean 4.1 4.1 4.1 21.6 21.6 21.6 22.0 22.0 22.0 Panel B: Elective Care MRI Musculoskeletal surgery Cataract surgery post shelter in place -0.296*** -0.139*** -0.123*** -0.176*** -0.0743*** -0.0803*** -0.0679*** -0.0243*** -0.0214***
(0.0248) (0.0213) (0.0267) (0.0238) (0.0169) (0.0225) (0.0121) (0.00818) (0.00749) Weeks since first case FE × urban X X X Weeks since first death FE × metro type X X X Observations 2,739,189 2,734,831 2,734,831 2,739,189 2,734,831 2,734,831 2,739,189 2,734,831 2,734,831 R-squared 0.719 0.722 0.723 0.551 0.555 0.558 0.297 0.302 0.305 baseline mean 3.3 3.3 3.3 1.1 1.1 1.1 0.2 0.2 0.2 Panel C: Non-Elective Care Labor and delivery Chemotherapy Angiograms post shelter in place -0.00155 -0.0118 0.00135 -0.0173*** -0.0356*** -0.0294*** -0.0825*** -0.0416*** -0.0349***
(0.00878) (0.0142) (0.0144) (0.00507) (0.0109) (0.00927) (0.0112) (0.0120) (0.0134) Weeks since first case FE × urban X X X Weeks since first death FE × metro type X X X Observations 818,342 818,342 818,342 2,739,189 2,734,831 2,734,831 2,739,189 2,734,831 2,734,831 R-squared 0.646 0.647 0.647 0.629 0.630 0.630 0.477 0.478 0.479 baseline mean 1.8 1.8 1.8 1.5 1.5 1.5 0.5 0.5 0.5
Caption: Baseline means are calculated based on the ninth week of 2019. Regression models were estimated using ordinary least squares. Regression models also include measures for the patient’s age, gender, and county. Outcome measure is the number of patients, and all models are weighted for the total number of eligible enrollees. Standard errors are clustered at the county level. Immunizations are restricted to those aged 2 or younger. Colonoscopy is restricted to those 46 or older. Mammograms were restricted to females aged 46 or older. Deliveries were restricted to women between the ages of 19 and 45. *** p<0.01, ** p<0.05, * p<0.1

34
Appendix Figure 1: Trends in Weekly Visits to Physician Office and Hospital Locations Using Cellular Phone Mobility Data for 2020
Caption: Total number of weekly visits were calculated for hospitals and offices of physicians in the SafeGraph data. We use the four-digit NAICS code to identify office of physicians (6211) and general medical and surgical hospitals (6221).