Embed Size (px)
Citation preview
Loughborough UniversityInstitutional Repository
The impact of underbodyroughness on rear wakestructure of a squareback
vehicle
This item was submitted to Loughborough University's Institutional Repositoryby the/an author.
Citation: PERRY, A.K. and PASSMORE, M., 2013. The impact of underbodyroughness on rear wake structure of a squareback vehicle. SAE Technical Paper2013-01-0463, doi:10.4271/2013-01-0463.
Additional Information:
• This paper was presented at the SAE 2013 World Congress & Exhibition.Copyright c© 2013 SAE International. This paper is posted on this sitewith permission from SAE International, and is for viewing only. Furtheruse or distribution of this paper is not permitted without permission fromSAE.
Metadata Record: https://dspace.lboro.ac.uk/2134/22631
Version: Accepted for publication
Publisher: c© SAE International
Please cite the published version.
2013-01-0463
The Impact of Floor Roughness on Rear Wake Structure of a Squareback vehicle
Author, co-author (Anna Perry, Martin Passmore)
Affiliation (Loughborough University)
ABSTRACT In this paper the effects of a rough floor on the rear wake structure of a simplified squareback model (the Windsor model) is investigated using balance, base pressure measurements and two and three component planar PIV. The work forms part of a larger study to develop understanding of the mechanisms that influence overall base pressure and hence the aerodynamic drag. In the work reported in this paper the impact of a rough floor on the base pressure and wake flow structures is quantified at three different ride heights. The floor roughness has been created through the addition of five roughness strips and the ride heights of 10.3%, 17.3% and 24.2% of the model height are assessed. All work has been carried out in the Loughborough University Large Wind Tunnel with a ¼ scale model giving a blockage ratio of 4% for a smooth under-body or 4.5% with the roughness strips. The tests are conducted with a fixed ground plane. Results are presented for the base pressure distribution and the area weighted contribution to the drag. These are correlated against the stream-wise results. This work demonstrates the need for rough floor structures to be considered before model scale work is conducted. INTRODUCTION Vehicle aerodynamics and the reduction of drag has become of increased importance over recent decades due to the desire to reduce fuel consumption and consumer focus on a greener vehicle. While improvements in efficiency are being made to conventional petrol and diesel engines, as well as the development of alternative powertrains e.g. hybrid and fuel cells, there is still the requirement to reduce the drag of vehicles as a cost effective alternative. The current and future introduction of range limited vehicles (EVs) makes drag reduction of even bigger importance. Here there are many potential savings to be made due to
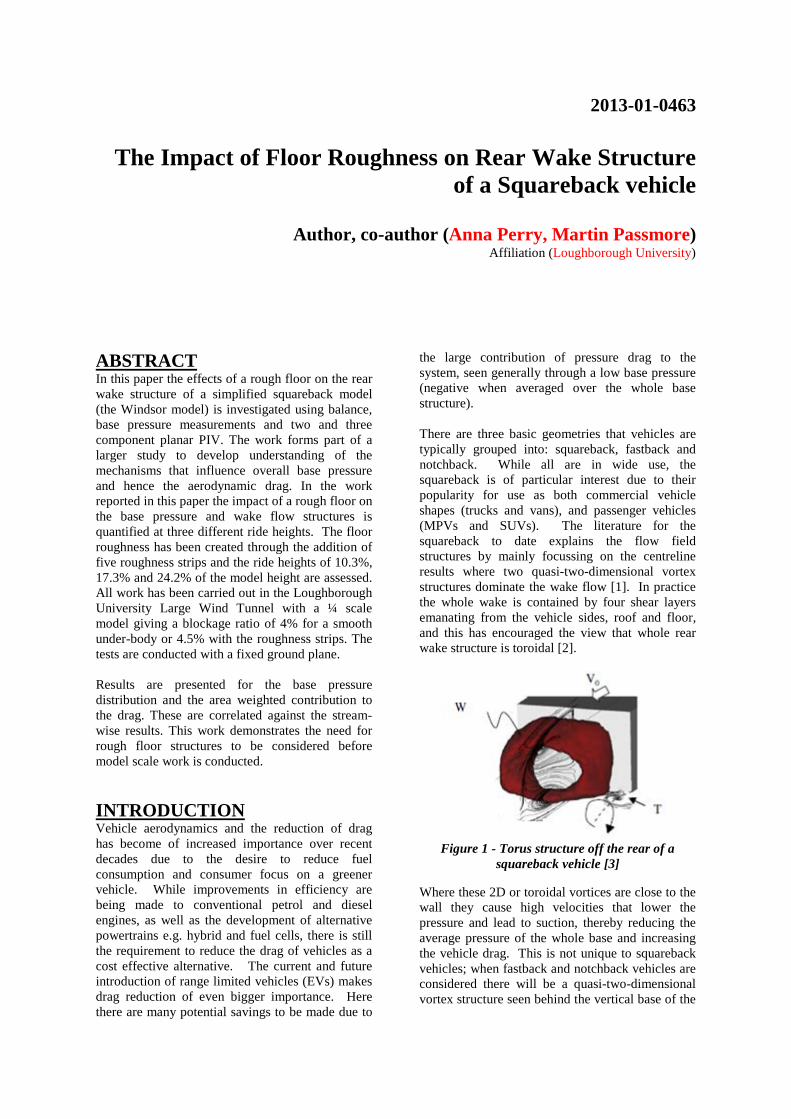
the large contribution of pressure drag to the system, seen generally through a low base pressure (negative when averaged over the whole base structure). There are three basic geometries that vehicles are typically grouped into: squareback, fastback and notchback. While all are in wide use, the squareback is of particular interest due to their popularity for use as both commercial vehicle shapes (trucks and vans), and passenger vehicles (MPVs and SUVs). The literature for the squareback to date explains the flow field structures by mainly focussing on the centreline results where two quasi-two-dimensional vortex structures dominate the wake flow [1]. In practice the whole wake is contained by four shear layers emanating from the vehicle sides, roof and floor, and this has encouraged the view that whole rear wake structure is toroidal [2].
Figure 1 - Torus structure off the rear of a
squareback vehicle [3]
Where these 2D or toroidal vortices are close to the wall they cause high velocities that lower the pressure and lead to suction, thereby reducing the average pressure of the whole base and increasing the vehicle drag. This is not unique to squareback vehicles; when fastback and notchback vehicles are considered there will be a quasi-two-dimensional vortex structure seen behind the vertical base of the
base fed by the lower shear layer – as seen in the lower region of the squareback vehicle. Shape optimisation is common for all these vehicle shapes to raise the base pressure values primarily through passive flow control methods such as shape optimisation but some work has also been done with active flow control. In industry shape optimisation is often used however constraints will be set by design and packaging requirements. Research uses both CFD and experimental testing but in both cases simplified vehicle geometries often provide the vehicle structure. Passive flow control techniques that have been applied recently are demonstrated in work by Littlewood [4] and others [5-11] where the work has proved the vast scope for base pressure increase that has yet to be fully exploited. However most of this work has been conducted with models with smooth floor, yet it has been found that pressure recovery found on the simplified model geometry does not cross over to full scale testing, as shown by Littlewood [12]. Here a base structure modification resulted in a base pressure increase in the model scale wind tunnel, but when the same modifications were made to a full scale vehicle there was no change to the vehicle drag. Only a small change was able to be made once the floor of the full scale vehicle had been made smooth. Generally simplified bodies do not include features such as wheels, wheel arches and rough underfloors; however it is known that the underbody flow is responsible for 12% of the drag force and wheels and wheel arches provide a 32% contribution to drag force. Both of these features will clearly lead to changes in the base pressure of the vehicle particularly in the lower region of the wake. Balance measurements have been taken for rough underbodies by Howell [13] where it was found that the trends remain the same although the finite drag and lift values are changed when floor roughness was introduced to a MIRA model. However during this study there is no evidence as to the mechanisms that cause this change. The same form of work has been done for the consideration of wheels and wheel housings; there are many reports on the trends in the force coefficients that introducing wheels (both stationary and spinning) [14] but far fewer on the effect that this has on base pressure [15]. Here Elofsson and Bannister concluded that the spinning rear wheels increased the base pressure due to the wake interactions. This paper reports on the effects of floor roughness on a simplified vehicle geometry as the first stage of a larger study on mechanisms influencing base pressure on squareback vehicles. Once the
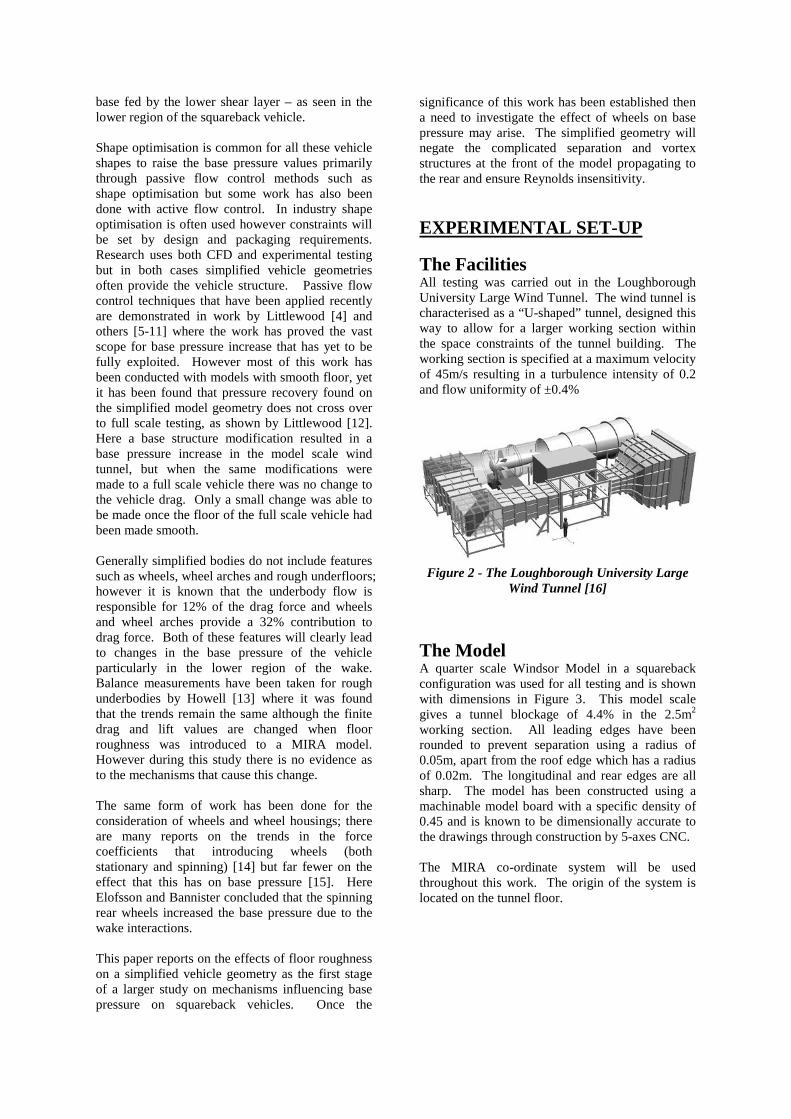
significance of this work has been established then a need to investigate the effect of wheels on base pressure may arise. The simplified geometry will negate the complicated separation and vortex structures at the front of the model propagating to the rear and ensure Reynolds insensitivity. EXPERIMENTAL SET-UP The Facilities All testing was carried out in the Loughborough University Large Wind Tunnel. The wind tunnel is characterised as a “U-shaped” tunnel, designed this way to allow for a larger working section within the space constraints of the tunnel building. The working section is specified at a maximum velocity of 45m/s resulting in a turbulence intensity of 0.2 and flow uniformity of ±0.4%
Figure 2 - The Loughborough University Large
Wind Tunnel [16]
The Model A quarter scale Windsor Model in a squareback configuration was used for all testing and is shown with dimensions in Figure 3. This model scale gives a tunnel blockage of 4.4% in the 2.5m2 working section. All leading edges have been rounded to prevent separation using a radius of 0.05m, apart from the roof edge which has a radius of 0.02m. The longitudinal and rear edges are all sharp. The model has been constructed using a machinable model board with a specific density of 0.45 and is known to be dimensionally accurate to the drawings through construction by 5-axes CNC. The MIRA co-ordinate system will be used throughout this work. The origin of the system is located on the tunnel floor.
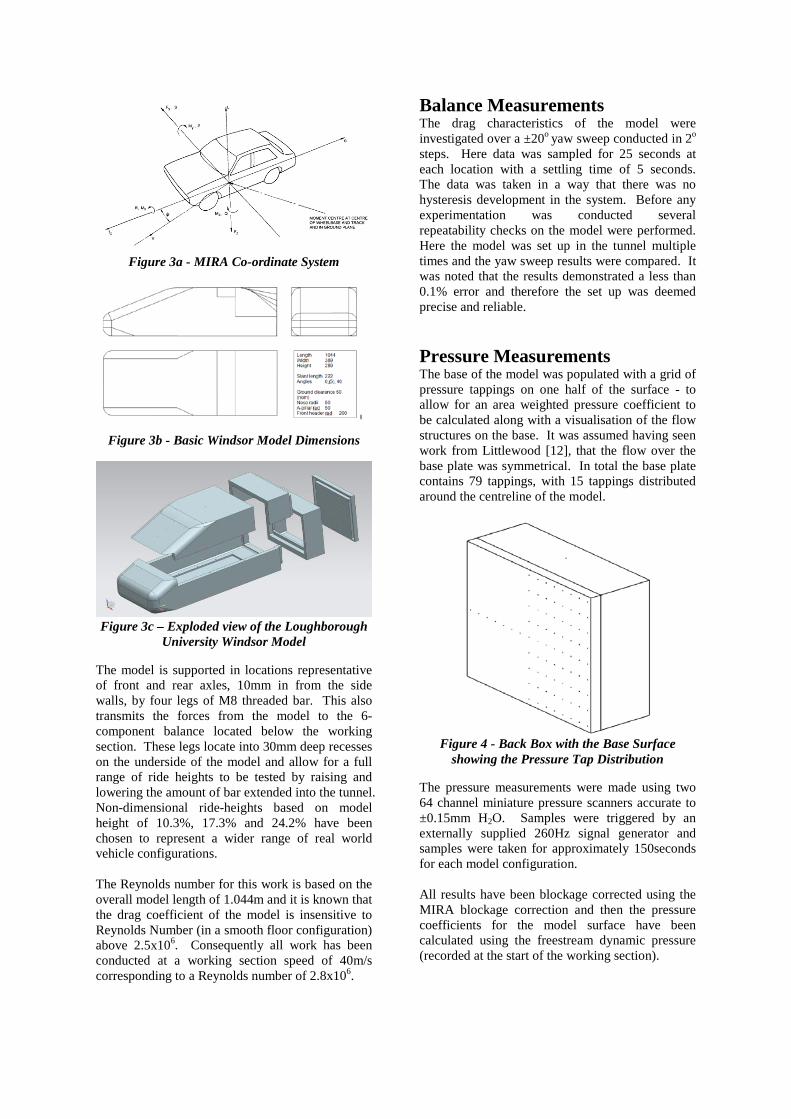
Figure 3a - MIRA Co-ordinate System
Figure 3b - Basic Windsor Model Dimensions
Figure 3c – Exploded view of the Loughborough
University Windsor Model
The model is supported in locations representative of front and rear axles, 10mm in from the side walls, by four legs of M8 threaded bar. This also transmits the forces from the model to the 6-component balance located below the working section. These legs locate into 30mm deep recesses on the underside of the model and allow for a full range of ride heights to be tested by raising and lowering the amount of bar extended into the tunnel. Non-dimensional ride-heights based on model height of 10.3%, 17.3% and 24.2% have been chosen to represent a wider range of real world vehicle configurations. The Reynolds number for this work is based on the overall model length of 1.044m and it is known that the drag coefficient of the model is insensitive to Reynolds Number (in a smooth floor configuration) above 2.5x10⁶. Consequently all work has been conducted at a working section speed of 40m/s corresponding to a Reynolds number of 2.8x10⁶.
Balance Measurements The drag characteristics of the model were investigated over a ±20o yaw sweep conducted in 2o steps. Here data was sampled for 25 seconds at each location with a settling time of 5 seconds. The data was taken in a way that there was no hysteresis development in the system. Before any experimentation was conducted several repeatability checks on the model were performed. Here the model was set up in the tunnel multiple times and the yaw sweep results were compared. It was noted that the results demonstrated a less than 0.1% error and therefore the set up was deemed precise and reliable. Pressure Measurements The base of the model was populated with a grid of pressure tappings on one half of the surface - to allow for an area weighted pressure coefficient to be calculated along with a visualisation of the flow structures on the base. It was assumed having seen work from Littlewood [12], that the flow over the base plate was symmetrical. In total the base plate contains 79 tappings, with 15 tappings distributed around the centreline of the model.
Figure 4 - Back Box with the Base Surface
showing the Pressure Tap Distribution
The pressure measurements were made using two 64 channel miniature pressure scanners accurate to ±0.15mm H2O. Samples were triggered by an externally supplied 260Hz signal generator and samples were taken for approximately 150seconds for each model configuration. All results have been blockage corrected using the MIRA blockage correction and then the pressure coefficients for the model surface have been calculated using the freestream dynamic pressure (recorded at the start of the working section).
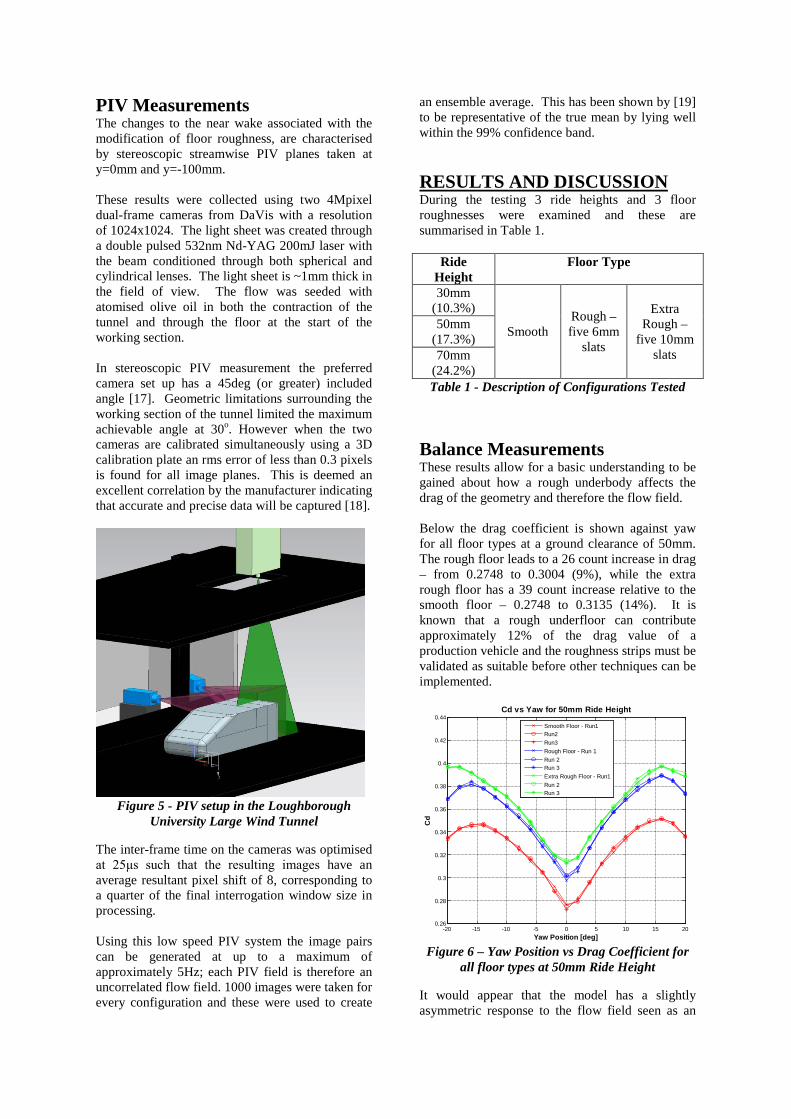
PIV Measurements The changes to the near wake associated with the modification of floor roughness, are characterised by stereoscopic streamwise PIV planes taken at y=0mm and y=-100mm. These results were collected using two 4Mpixel dual-frame cameras from DaVis with a resolution of 1024x1024. The light sheet was created through a double pulsed 532nm Nd-YAG 200mJ laser with the beam conditioned through both spherical and cylindrical lenses. The light sheet is ~1mm thick in the field of view. The flow was seeded with atomised olive oil in both the contraction of the tunnel and through the floor at the start of the working section. In stereoscopic PIV measurement the preferred camera set up has a 45deg (or greater) included angle [17]. Geometric limitations surrounding the working section of the tunnel limited the maximum achievable angle at 30o. However when the two cameras are calibrated simultaneously using a 3D calibration plate an rms error of less than 0.3 pixels is found for all image planes. This is deemed an excellent correlation by the manufacturer indicating that accurate and precise data will be captured [18].
Figure 5 - PIV setup in the Loughborough
University Large Wind Tunnel
The inter-frame time on the cameras was optimised at 25μs such that the resulting images have an average resultant pixel shift of 8, corresponding to a quarter of the final interrogation window size in processing. Using this low speed PIV system the image pairs can be generated at up to a maximum of approximately 5Hz; each PIV field is therefore an uncorrelated flow field. 1000 images were taken for every configuration and these were used to create
an ensemble average. This has been shown by [19] to be representative of the true mean by lying well within the 99% confidence band. RESULTS AND DISCUSSION During the testing 3 ride heights and 3 floor roughnesses were examined and these are summarised in Table 1.
Ride Height
Floor Type
30mm (10.3%)
Smooth Rough – five 6mm
slats
Extra Rough –
five 10mm slats
50mm (17.3%) 70mm
(24.2%) Table 1 - Description of Configurations Tested
Balance Measurements These results allow for a basic understanding to be gained about how a rough underbody affects the drag of the geometry and therefore the flow field. Below the drag coefficient is shown against yaw for all floor types at a ground clearance of 50mm. The rough floor leads to a 26 count increase in drag – from 0.2748 to 0.3004 (9%), while the extra rough floor has a 39 count increase relative to the smooth floor – 0.2748 to 0.3135 (14%). It is known that a rough underfloor can contribute approximately 12% of the drag value of a production vehicle and the roughness strips must be validated as suitable before other techniques can be implemented.
Figure 6 – Yaw Position vs Drag Coefficient for
all floor types at 50mm Ride Height
It would appear that the model has a slightly asymmetric response to the flow field seen as an
-20 -15 -10 -5 0 5 10 15 200.26
0.28
0.3
0.32
0.34
0.36
0.38
0.4
0.42
0.44
Yaw Position [deg]
Cd
Cd vs Yaw for 50mm Ride Height
Smooth Floor - Run1Run2Run3Rough Floor - Run 1Run 2Run 3Extra Rough Floor - Run1Run 2Run 3
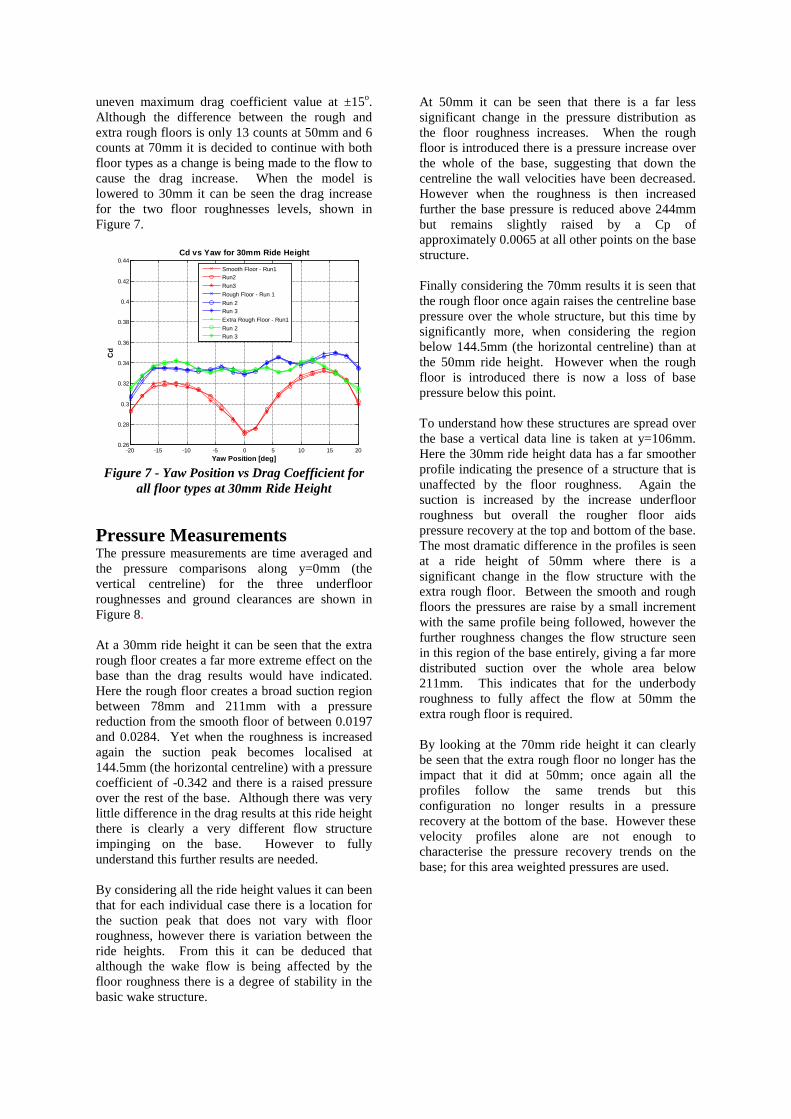
uneven maximum drag coefficient value at ±15o. Although the difference between the rough and extra rough floors is only 13 counts at 50mm and 6 counts at 70mm it is decided to continue with both floor types as a change is being made to the flow to cause the drag increase. When the model is lowered to 30mm it can be seen the drag increase for the two floor roughnesses levels, shown in Figure 7.
Figure 7 - Yaw Position vs Drag Coefficient for
all floor types at 30mm Ride Height
Pressure Measurements The pressure measurements are time averaged and the pressure comparisons along y=0mm (the vertical centreline) for the three underfloor roughnesses and ground clearances are shown in Figure 8. At a 30mm ride height it can be seen that the extra rough floor creates a far more extreme effect on the base than the drag results would have indicated. Here the rough floor creates a broad suction region between 78mm and 211mm with a pressure reduction from the smooth floor of between 0.0197 and 0.0284. Yet when the roughness is increased again the suction peak becomes localised at 144.5mm (the horizontal centreline) with a pressure coefficient of -0.342 and there is a raised pressure over the rest of the base. Although there was very little difference in the drag results at this ride height there is clearly a very different flow structure impinging on the base. However to fully understand this further results are needed. By considering all the ride height values it can been that for each individual case there is a location for the suction peak that does not vary with floor roughness, however there is variation between the ride heights. From this it can be deduced that although the wake flow is being affected by the floor roughness there is a degree of stability in the basic wake structure.
At 50mm it can be seen that there is a far less significant change in the pressure distribution as the floor roughness increases. When the rough floor is introduced there is a pressure increase over the whole of the base, suggesting that down the centreline the wall velocities have been decreased. However when the roughness is then increased further the base pressure is reduced above 244mm but remains slightly raised by a Cp of approximately 0.0065 at all other points on the base structure. Finally considering the 70mm results it is seen that the rough floor once again raises the centreline base pressure over the whole structure, but this time by significantly more, when considering the region below 144.5mm (the horizontal centreline) than at the 50mm ride height. However when the rough floor is introduced there is now a loss of base pressure below this point. To understand how these structures are spread over the base a vertical data line is taken at y=106mm. Here the 30mm ride height data has a far smoother profile indicating the presence of a structure that is unaffected by the floor roughness. Again the suction is increased by the increase underfloor roughness but overall the rougher floor aids pressure recovery at the top and bottom of the base. The most dramatic difference in the profiles is seen at a ride height of 50mm where there is a significant change in the flow structure with the extra rough floor. Between the smooth and rough floors the pressures are raise by a small increment with the same profile being followed, however the further roughness changes the flow structure seen in this region of the base entirely, giving a far more distributed suction over the whole area below 211mm. This indicates that for the underbody roughness to fully affect the flow at 50mm the extra rough floor is required. By looking at the 70mm ride height it can clearly be seen that the extra rough floor no longer has the impact that it did at 50mm; once again all the profiles follow the same trends but this configuration no longer results in a pressure recovery at the bottom of the base. However these velocity profiles alone are not enough to characterise the pressure recovery trends on the base; for this area weighted pressures are used.
-20 -15 -10 -5 0 5 10 15 200.26
0.28
0.3
0.32
0.34
0.36
0.38
0.4
0.42
0.44
Yaw Position [deg]
Cd
Cd vs Yaw for 30mm Ride Height
Smooth Floor - Run1Run2Run3Rough Floor - Run 1Run 2Run 3Extra Rough Floor - Run1Run 2Run 3
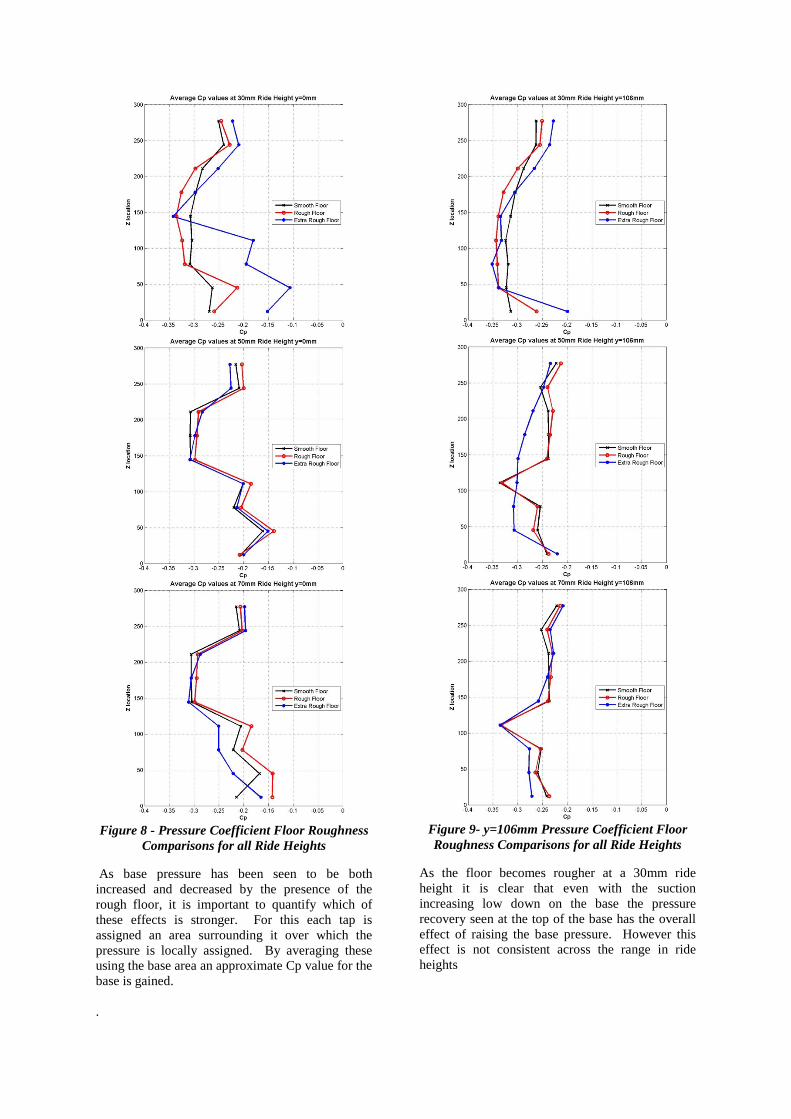
Figure 8 - Pressure Coefficient Floor Roughness
Comparisons for all Ride Heights
As base pressure has been seen to be both increased and decreased by the presence of the rough floor, it is important to quantify which of these effects is stronger. For this each tap is assigned an area surrounding it over which the pressure is locally assigned. By averaging these using the base area an approximate Cp value for the base is gained. .
Figure 9- y=106mm Pressure Coefficient Floor Roughness Comparisons for all Ride Heights
As the floor becomes rougher at a 30mm ride height it is clear that even with the suction increasing low down on the base the pressure recovery seen at the top of the base has the overall effect of raising the base pressure. However this effect is not consistent across the range in ride heights
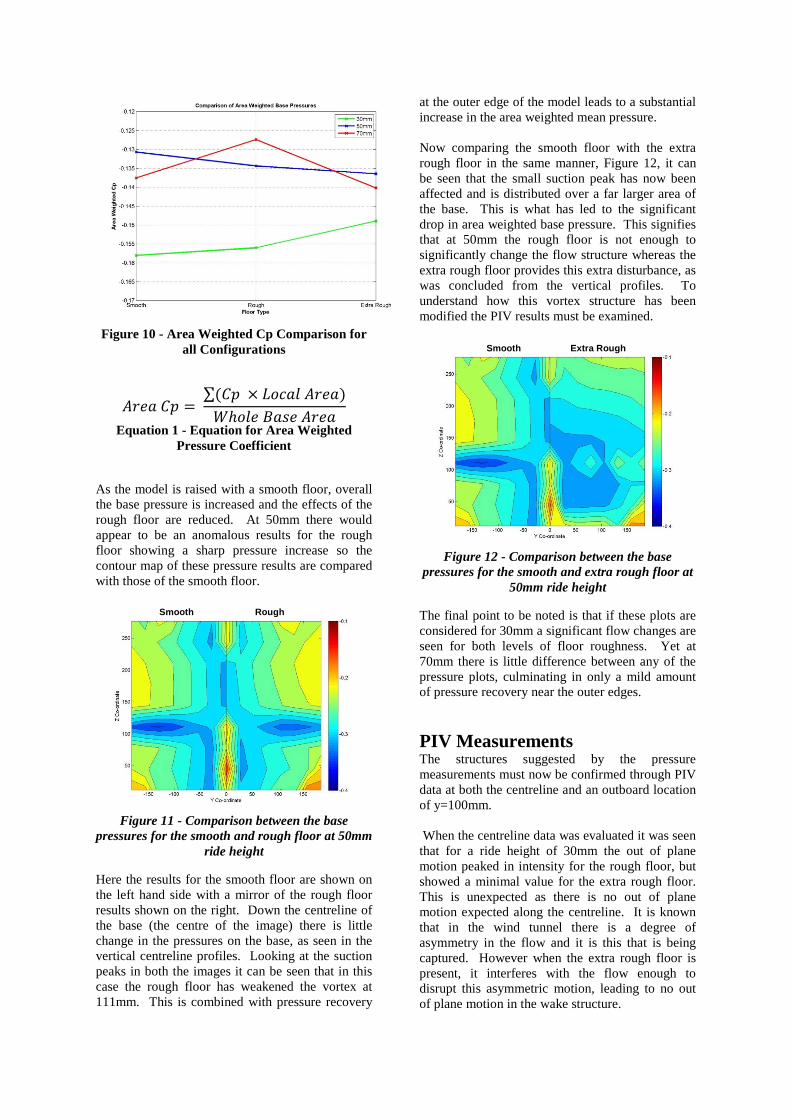
Figure 10 - Area Weighted Cp Comparison for
all Configurations
𝐴𝐴𝐴𝐴𝐴𝐴𝐴𝐴 𝐶𝐶𝐶𝐶 = ∑(𝐶𝐶𝐶𝐶 × 𝐿𝐿𝐿𝐿𝐿𝐿𝐴𝐴𝐿𝐿 𝐴𝐴𝐴𝐴𝐴𝐴𝐴𝐴)𝑊𝑊ℎ𝐿𝐿𝐿𝐿𝐴𝐴 𝐵𝐵𝐴𝐴𝐵𝐵𝐴𝐴 𝐴𝐴𝐴𝐴𝐴𝐴𝐴𝐴
Equation 1 - Equation for Area Weighted
Pressure Coefficient
As the model is raised with a smooth floor, overall the base pressure is increased and the effects of the rough floor are reduced. At 50mm there would appear to be an anomalous results for the rough floor showing a sharp pressure increase so the contour map of these pressure results are compared with those of the smooth floor.
Figure 11 - Comparison between the base
pressures for the smooth and rough floor at 50mm ride height
Here the results for the smooth floor are shown on the left hand side with a mirror of the rough floor results shown on the right. Down the centreline of the base (the centre of the image) there is little change in the pressures on the base, as seen in the vertical centreline profiles. Looking at the suction peaks in both the images it can be seen that in this case the rough floor has weakened the vortex at 111mm. This is combined with pressure recovery
at the outer edge of the model leads to a substantial increase in the area weighted mean pressure. Now comparing the smooth floor with the extra rough floor in the same manner, Figure 12, it can be seen that the small suction peak has now been affected and is distributed over a far larger area of the base. This is what has led to the significant drop in area weighted base pressure. This signifies that at 50mm the rough floor is not enough to significantly change the flow structure whereas the extra rough floor provides this extra disturbance, as was concluded from the vertical profiles. To understand how this vortex structure has been modified the PIV results must be examined.
Figure 12 - Comparison between the base
pressures for the smooth and extra rough floor at 50mm ride height
The final point to be noted is that if these plots are considered for 30mm a significant flow changes are seen for both levels of floor roughness. Yet at 70mm there is little difference between any of the pressure plots, culminating in only a mild amount of pressure recovery near the outer edges. PIV Measurements The structures suggested by the pressure measurements must now be confirmed through PIV data at both the centreline and an outboard location of y=100mm. When the centreline data was evaluated it was seen that for a ride height of 30mm the out of plane motion peaked in intensity for the rough floor, but showed a minimal value for the extra rough floor. This is unexpected as there is no out of plane motion expected along the centreline. It is known that in the wind tunnel there is a degree of asymmetry in the flow and it is this that is being captured. However when the extra rough floor is present, it interferes with the flow enough to disrupt this asymmetric motion, leading to no out of plane motion in the wake structure.
Smooth Rough
Smooth Extra Rough
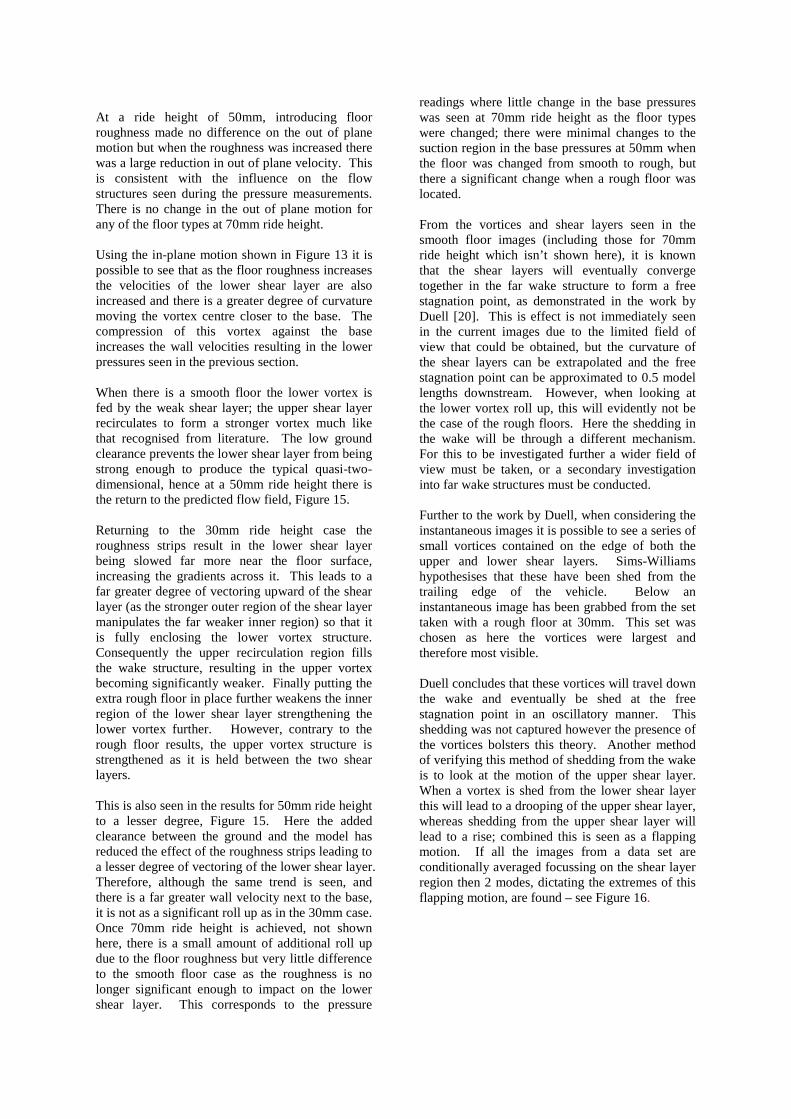
At a ride height of 50mm, introducing floor roughness made no difference on the out of plane motion but when the roughness was increased there was a large reduction in out of plane velocity. This is consistent with the influence on the flow structures seen during the pressure measurements. There is no change in the out of plane motion for any of the floor types at 70mm ride height. Using the in-plane motion shown in Figure 13 it is possible to see that as the floor roughness increases the velocities of the lower shear layer are also increased and there is a greater degree of curvature moving the vortex centre closer to the base. The compression of this vortex against the base increases the wall velocities resulting in the lower pressures seen in the previous section. When there is a smooth floor the lower vortex is fed by the weak shear layer; the upper shear layer recirculates to form a stronger vortex much like that recognised from literature. The low ground clearance prevents the lower shear layer from being strong enough to produce the typical quasi-two-dimensional, hence at a 50mm ride height there is the return to the predicted flow field, Figure 15. Returning to the 30mm ride height case the roughness strips result in the lower shear layer being slowed far more near the floor surface, increasing the gradients across it. This leads to a far greater degree of vectoring upward of the shear layer (as the stronger outer region of the shear layer manipulates the far weaker inner region) so that it is fully enclosing the lower vortex structure. Consequently the upper recirculation region fills the wake structure, resulting in the upper vortex becoming significantly weaker. Finally putting the extra rough floor in place further weakens the inner region of the lower shear layer strengthening the lower vortex further. However, contrary to the rough floor results, the upper vortex structure is strengthened as it is held between the two shear layers. This is also seen in the results for 50mm ride height to a lesser degree, Figure 15. Here the added clearance between the ground and the model has reduced the effect of the roughness strips leading to a lesser degree of vectoring of the lower shear layer. Therefore, although the same trend is seen, and there is a far greater wall velocity next to the base, it is not as a significant roll up as in the 30mm case. Once 70mm ride height is achieved, not shown here, there is a small amount of additional roll up due to the floor roughness but very little difference to the smooth floor case as the roughness is no longer significant enough to impact on the lower shear layer. This corresponds to the pressure
readings where little change in the base pressures was seen at 70mm ride height as the floor types were changed; there were minimal changes to the suction region in the base pressures at 50mm when the floor was changed from smooth to rough, but there a significant change when a rough floor was located. From the vortices and shear layers seen in the smooth floor images (including those for 70mm ride height which isn’t shown here), it is known that the shear layers will eventually converge together in the far wake structure to form a free stagnation point, as demonstrated in the work by Duell [20]. This is effect is not immediately seen in the current images due to the limited field of view that could be obtained, but the curvature of the shear layers can be extrapolated and the free stagnation point can be approximated to 0.5 model lengths downstream. However, when looking at the lower vortex roll up, this will evidently not be the case of the rough floors. Here the shedding in the wake will be through a different mechanism. For this to be investigated further a wider field of view must be taken, or a secondary investigation into far wake structures must be conducted. Further to the work by Duell, when considering the instantaneous images it is possible to see a series of small vortices contained on the edge of both the upper and lower shear layers. Sims-Williams hypothesises that these have been shed from the trailing edge of the vehicle. Below an instantaneous image has been grabbed from the set taken with a rough floor at 30mm. This set was chosen as here the vortices were largest and therefore most visible. Duell concludes that these vortices will travel down the wake and eventually be shed at the free stagnation point in an oscillatory manner. This shedding was not captured however the presence of the vortices bolsters this theory. Another method of verifying this method of shedding from the wake is to look at the motion of the upper shear layer. When a vortex is shed from the lower shear layer this will lead to a drooping of the upper shear layer, whereas shedding from the upper shear layer will lead to a rise; combined this is seen as a flapping motion. If all the images from a data set are conditionally averaged focussing on the shear layer region then 2 modes, dictating the extremes of this flapping motion, are found – see Figure 16.
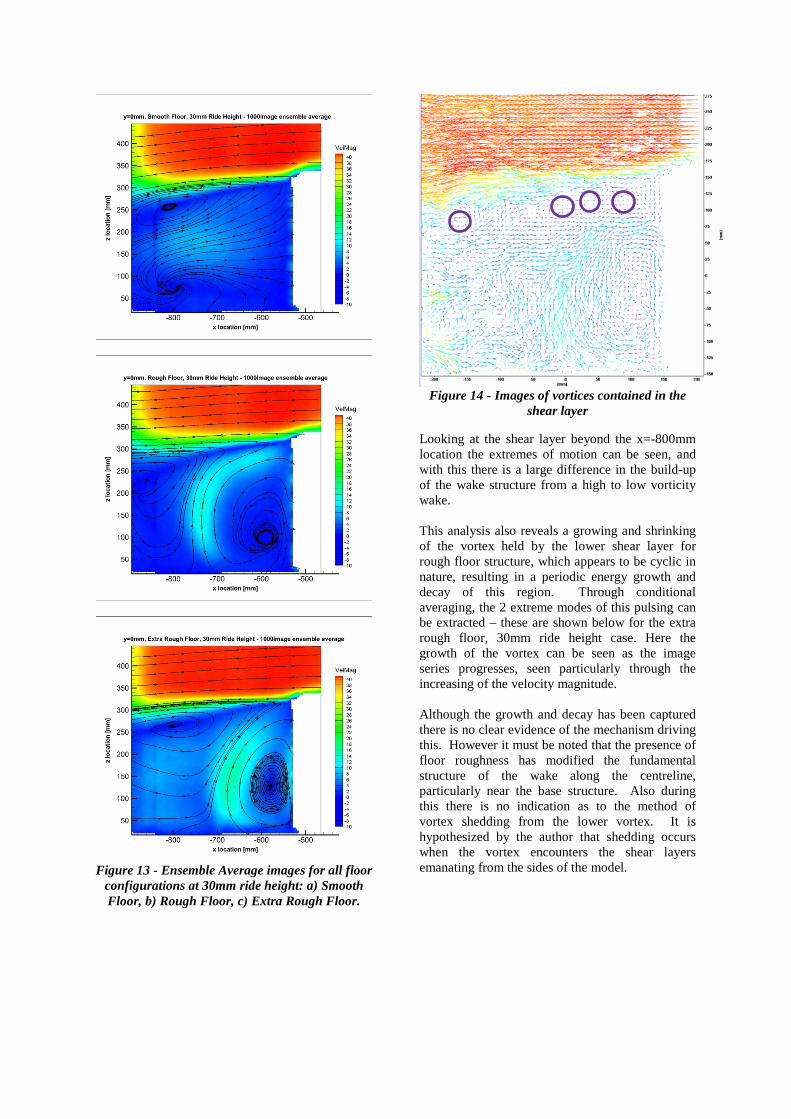
Figure 13 - Ensemble Average images for all floor
configurations at 30mm ride height: a) Smooth Floor, b) Rough Floor, c) Extra Rough Floor.
Figure 14 - Images of vortices contained in the
shear layer
Looking at the shear layer beyond the x=-800mm location the extremes of motion can be seen, and with this there is a large difference in the build-up of the wake structure from a high to low vorticity wake. This analysis also reveals a growing and shrinking of the vortex held by the lower shear layer for rough floor structure, which appears to be cyclic in nature, resulting in a periodic energy growth and decay of this region. Through conditional averaging, the 2 extreme modes of this pulsing can be extracted – these are shown below for the extra rough floor, 30mm ride height case. Here the growth of the vortex can be seen as the image series progresses, seen particularly through the increasing of the velocity magnitude. Although the growth and decay has been captured there is no clear evidence of the mechanism driving this. However it must be noted that the presence of floor roughness has modified the fundamental structure of the wake along the centreline, particularly near the base structure. Also during this there is no indication as to the method of vortex shedding from the lower vortex. It is hypothesized by the author that shedding occurs when the vortex encounters the shear layers emanating from the sides of the model.
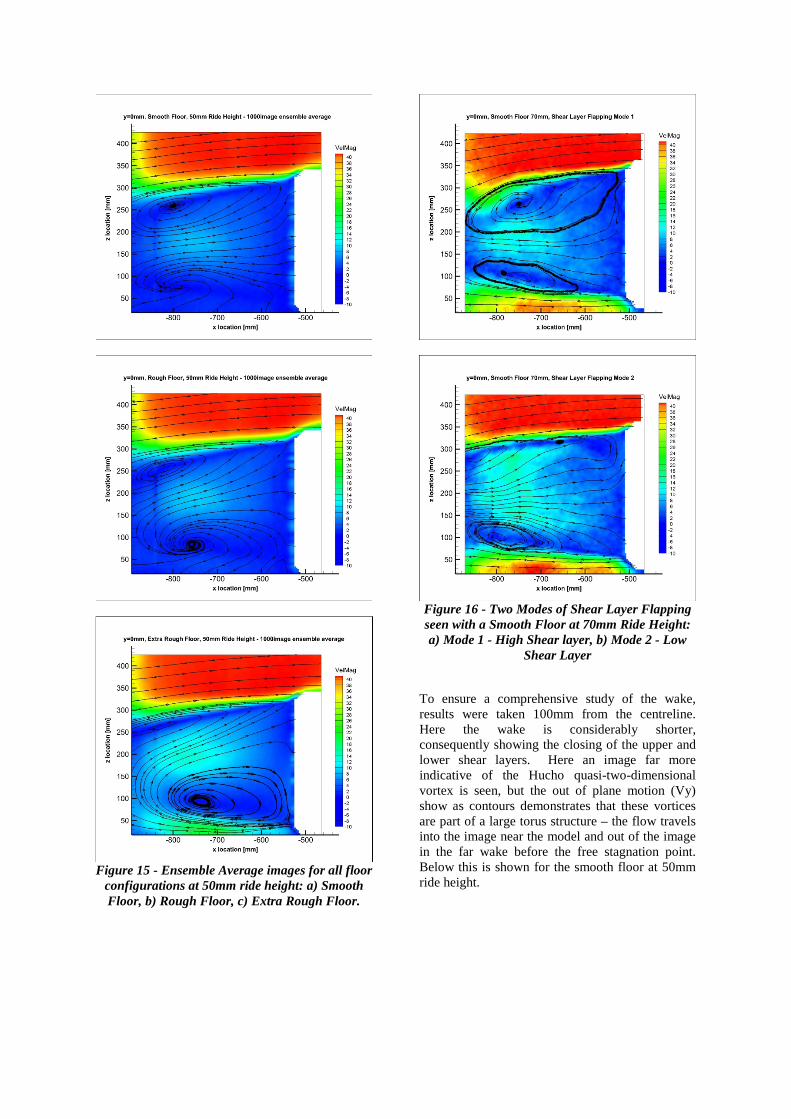
Figure 15 - Ensemble Average images for all floor
configurations at 50mm ride height: a) Smooth Floor, b) Rough Floor, c) Extra Rough Floor.
Figure 16 - Two Modes of Shear Layer Flapping seen with a Smooth Floor at 70mm Ride Height: a) Mode 1 - High Shear layer, b) Mode 2 - Low
Shear Layer
To ensure a comprehensive study of the wake, results were taken 100mm from the centreline. Here the wake is considerably shorter, consequently showing the closing of the upper and lower shear layers. Here an image far more indicative of the Hucho quasi-two-dimensional vortex is seen, but the out of plane motion (Vy) show as contours demonstrates that these vortices are part of a large torus structure – the flow travels into the image near the model and out of the image in the far wake before the free stagnation point. Below this is shown for the smooth floor at 50mm ride height.
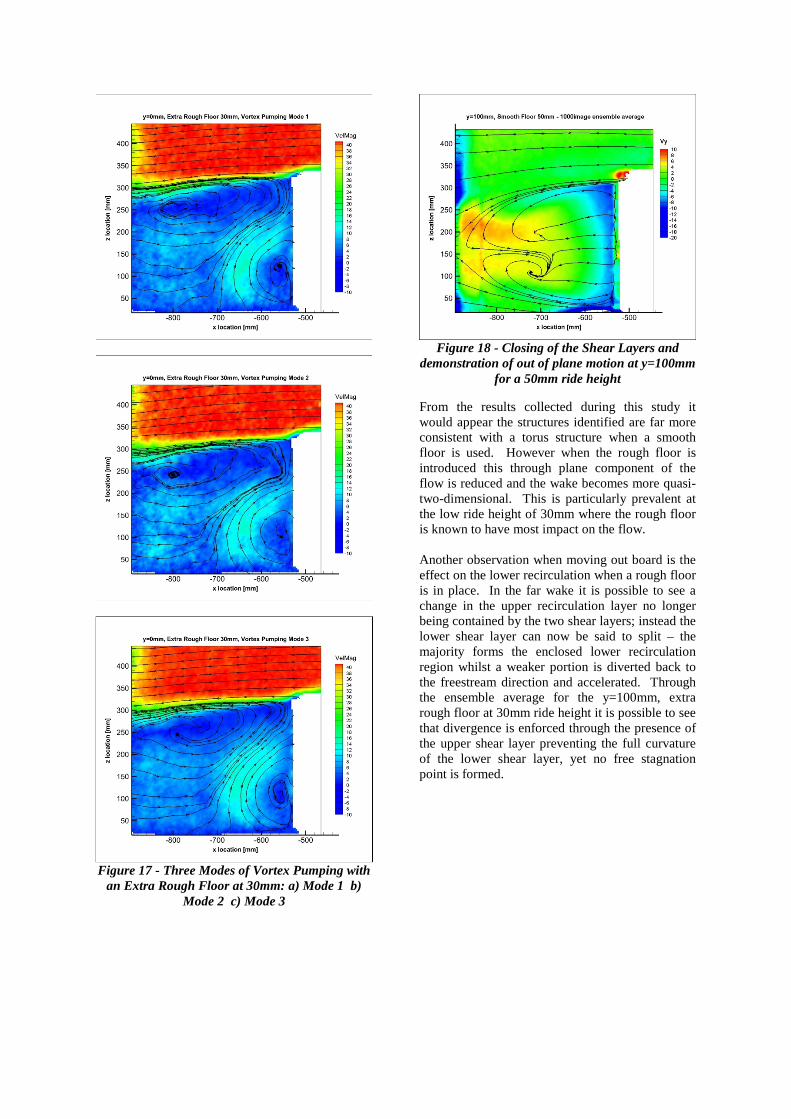
Figure 17 - Three Modes of Vortex Pumping with
an Extra Rough Floor at 30mm: a) Mode 1 b) Mode 2 c) Mode 3
Figure 18 - Closing of the Shear Layers and
demonstration of out of plane motion at y=100mm for a 50mm ride height
From the results collected during this study it would appear the structures identified are far more consistent with a torus structure when a smooth floor is used. However when the rough floor is introduced this through plane component of the flow is reduced and the wake becomes more quasi-two-dimensional. This is particularly prevalent at the low ride height of 30mm where the rough floor is known to have most impact on the flow. Another observation when moving out board is the effect on the lower recirculation when a rough floor is in place. In the far wake it is possible to see a change in the upper recirculation layer no longer being contained by the two shear layers; instead the lower shear layer can now be said to split – the majority forms the enclosed lower recirculation region whilst a weaker portion is diverted back to the freestream direction and accelerated. Through the ensemble average for the y=100mm, extra rough floor at 30mm ride height it is possible to see that divergence is enforced through the presence of the upper shear layer preventing the full curvature of the lower shear layer, yet no free stagnation point is formed.
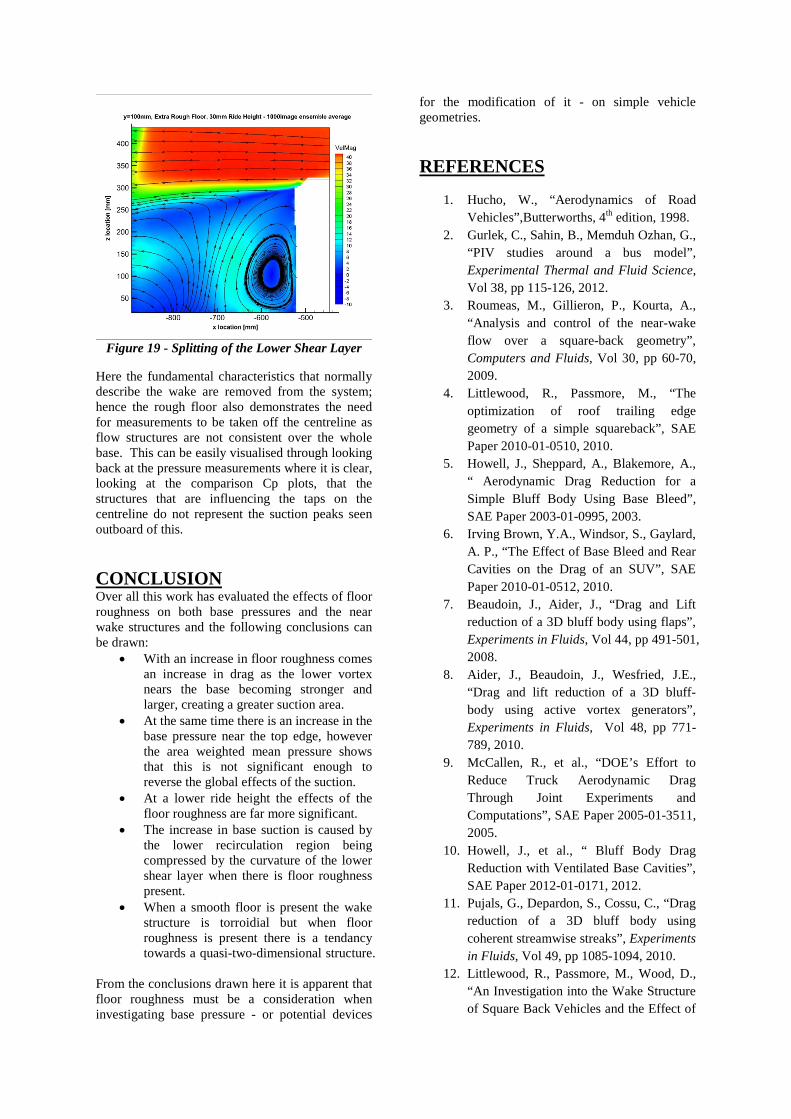
Figure 19 - Splitting of the Lower Shear Layer
Here the fundamental characteristics that normally describe the wake are removed from the system; hence the rough floor also demonstrates the need for measurements to be taken off the centreline as flow structures are not consistent over the whole base. This can be easily visualised through looking back at the pressure measurements where it is clear, looking at the comparison Cp plots, that the structures that are influencing the taps on the centreline do not represent the suction peaks seen outboard of this. CONCLUSION Over all this work has evaluated the effects of floor roughness on both base pressures and the near wake structures and the following conclusions can be drawn:
• With an increase in floor roughness comes an increase in drag as the lower vortex nears the base becoming stronger and larger, creating a greater suction area.
• At the same time there is an increase in the base pressure near the top edge, however the area weighted mean pressure shows that this is not significant enough to reverse the global effects of the suction.
• At a lower ride height the effects of the floor roughness are far more significant.
• The increase in base suction is caused by the lower recirculation region being compressed by the curvature of the lower shear layer when there is floor roughness present.
• When a smooth floor is present the wake structure is torroidial but when floor roughness is present there is a tendancy towards a quasi-two-dimensional structure.
From the conclusions drawn here it is apparent that floor roughness must be a consideration when investigating base pressure - or potential devices
for the modification of it - on simple vehicle geometries. REFERENCES
1. Hucho, W., “Aerodynamics of Road Vehicles”,Butterworths, 4th edition, 1998.
2. Gurlek, C., Sahin, B., Memduh Ozhan, G., “PIV studies around a bus model”, Experimental Thermal and Fluid Science, Vol 38, pp 115-126, 2012.
3. Roumeas, M., Gillieron, P., Kourta, A., “Analysis and control of the near-wake flow over a square-back geometry”, Computers and Fluids, Vol 30, pp 60-70, 2009.
4. Littlewood, R., Passmore, M., “The optimization of roof trailing edge geometry of a simple squareback”, SAE Paper 2010-01-0510, 2010.
5. Howell, J., Sheppard, A., Blakemore, A., “ Aerodynamic Drag Reduction for a Simple Bluff Body Using Base Bleed”, SAE Paper 2003-01-0995, 2003.
6. Irving Brown, Y.A., Windsor, S., Gaylard, A. P., “The Effect of Base Bleed and Rear Cavities on the Drag of an SUV”, SAE Paper 2010-01-0512, 2010.
7. Beaudoin, J., Aider, J., “Drag and Lift reduction of a 3D bluff body using flaps”, Experiments in Fluids, Vol 44, pp 491-501, 2008.
8. Aider, J., Beaudoin, J., Wesfried, J.E., “Drag and lift reduction of a 3D bluff-body using active vortex generators”, Experiments in Fluids, Vol 48, pp 771-789, 2010.
9. McCallen, R., et al., “DOE’s Effort to Reduce Truck Aerodynamic Drag Through Joint Experiments and Computations”, SAE Paper 2005-01-3511, 2005.
10. Howell, J., et al., “ Bluff Body Drag Reduction with Ventilated Base Cavities”, SAE Paper 2012-01-0171, 2012.
11. Pujals, G., Depardon, S., Cossu, C., “Drag reduction of a 3D bluff body using coherent streamwise streaks”, Experiments in Fluids, Vol 49, pp 1085-1094, 2010.
12. Littlewood, R., Passmore, M., Wood, D., “An Investigation into the Wake Structure of Square Back Vehicles and the Effect of
Structure Modification on Resultant Vehicle Forces”, SAE Paper 2011-37-0015, 2011.
13. Howell, J., Hickman, D., “The Influence of Ground Simulation on the Aerodynamics of a Simple Car Model”, SAE Paper 970134, 1997.
14. Cogotti, A., “A Parametric Study on the Ground Effect of a Simplified Car Model”, SAE Paper 980031, 1998.
15. Elofsson, P., Bannister, M.,”Drag Reduction Mechanisms Due to Moving Ground and Wheel Rotation in Passenger Cars”, SAE Paper 2002-01-0531, 2002.
16. Johl, G., Passmore, M., Render, P., “Design Methodology and performance of an Indraft wind tunnel”, The Aeronautical Journal, Vol 108, pp 65-473, 2004.
17. Adrian, R., Westerweel, J., “Particle Image Velocimetry”, Cambridge University Press, 1st edition, 2011.
18. LaVision Software Manual For DaVis 19. Passmore, M., Spencer, A., Jowsey, L.,
Newnham, P., Wood, D., “The Application of Particle Image Velocimetry in Automotive Aerodynamics”, SAE Paper 2010-01-0120, 2010.
20. Gregg Duell, E., George, A.R., “Experimental Study of a Ground Vehicle Body Unsteady Near Wake”, SAE Paper 1999-01-0812, 1999.