Embed Size (px)
Citation preview
THE IMPACT OF VISUAL COMMUNICATION AND USER EXPERIENCE
ON RESIDENTIAL WATER CONSUMPTION
by
Samual Lee Ward, B.F.A.
A thesis submitted to the Graduate Council of
Texas State University in partial fulfillment
of the requirements for the degree of
Master of Fine Arts
with a Major in Communication Design
December 2013
Committee Members:
Grayson Lawrence, MFA, Chair
Sameera Kapila, MFA
Roselynn Newton, MFA

COPYRIGHT
by
Samual L Ward
2013
FAIR USE AND AUTHOR’S PERMISSION STATEMENT
Fair Use
This work is protected by the Copyright Laws of the United States (Public Law 94-553,
section 107). Consistent with fair use as defined in the Copyright Laws, brief quotations
from this material are allowed with proper acknowledgment. Use of this material for
financial gain without the author‘s express written permission is not allowed.
Duplication Permission
As the copyright holder of this work I, your name here, refuse permission to copy in
excess of the ―Fair Use‖ exemption without my written permission.
DEDICATION
I made a conscious decision after completing my undergraduate degree that I was
NEVER going back to school again. For some reason though, I just couldn‘t stay away,
and decided in 2008 to give it another go. My life has changed so much since I decided to
attend graduate school 5 years ago. When I started back, my dog Dexter and I were two
bachelors just ―livin‘ the dream.‖ Our steady diet of mac n‘ cheese and cold beer made
for a pretty easygoing way of life. Little did I know then, that over the course of the next
5 years, I would meet and marry an amazing woman named Lana (and her dog
Maggie…of course), have a son named Owen, and learn to write a thesis. Not bad for a
glorified artist! My wife‘s support during this whole graduate school process was
probably the thing that kept me going.
I would be remiss if I didn‘t share this dedication with my dad and mom, Joe and
Mikki Ward. Whether they realize it or not, they have always motivated me to succeed
because of the example they set. Since I was a kid, I watched them work hard for what
they wanted, and work even harder for what they believed in. Their dedication to helping
other people, helping the planet, and helping their family is such an inspiration to me and
I love them very much for it. I just hope that I can do half as well for my own family as
they did for me.
v
ACKNOWLEDGEMENTS
I could not have completed this thesis research with out the leadership and
guidance of my chair, Grayson Lawrence. His support throughout my graduate education
and the thesis has been more than I could‘ve asked for. Additionally, my thesis
committee members, Sam Kapila and Rose Newton deserve a ton of thanks as well.
Without their collective wisdom (and design prowess), this thesis research would not be
successful.
It is so important that I thank Suzanne Williams, Roger Biggers, and New
Braunfels Utility. Their willingness to help me in this process truly made my research
study possible. Additionally, I must acknowledge all of my graduate educators, Claudia,
Christine, Jeff, Bill, and the rest. They all make me very proud to have been a part of the
MFA Communication Design program at Texas State University.
vi
TABLE OF CONTENTS
Page
ACKNOWLEDGMENTS ....................................................................................................... v
LIST OF TABLES ................................................................................................................viii
LIST OF FIGURES ................................................................................................................ ix
ABSTRACT ............................................................................................................................. x
CHAPTER
I. INTRODUCTION.................................................................................................... 1
Water Resources .............................................................................................. 1
Technologies for Water and Energy Conservation at Home ........................ 2
Nest®
.................................................................................................... 3
Opower®
Billing ................................................................................. 4
Smart Water Meters ............................................................................ 6
Improving Smart Water Meters ......................................................... 7
Thesis Organization ........................................................................................ 7
II. STATEMENT OF THE PROBLEM ..................................................................... 9
Issues Facing Freshwater Supplies................................................................. 9
Population............................................................................................ 9
Industrial Water Use and Pollution ................................................. 10
Commercial/Residential Irrigation and Contamination ................. 11
Climate Change................................................................................. 12
Conservation Programs and Practices .......................................................... 14
Residential Water Costs and Billing ............................................................ 15
Hypothesis ..................................................................................................... 16
III. PRELIMINARY RESEARCH ........................................................................... 19
Emotional Connections Between Humans and Technology ...................... 19
User Interface and User Experience............................................................. 20
UI ....................................................................................................... 21
UX...................................................................................................... 23
Visual Cues and Symbol/Icon Recognition ................................................. 24
vii
Icons................................................................................................... 26
Energy Consumption Resulting from In-Home Technology ..................... 27
IV. METHODS .......................................................................................................... 30
Explanation and Validity of Exploratory Research .................................... 30
Pre-Study Executions and Logistics ............................................................ 31
Study Consent ................................................................................... 31
Study Population Criteria ................................................................. 31
Data Collection, Distribution, and Acknowledgement .................. 32
Post-Study Survey ............................................................................ 34
Baseline for Data Analysis ............................................................... 34
Water Watch App Design ............................................................................. 35
Daily Water Consumption Volume ................................................. 37
Volume Equivalent Icon................................................................... 38
Mood of the App ............................................................................... 42
Last 7-Days Total Value .................................................................. 43
Acknowledge Button ........................................................................ 43
V. RESULTS ............................................................................................................. 44
Study Demographics and Water Consumption Allotments ........................ 45
Study Period Water Consumption Versus Historical
Water Consumption ...................................................................................... 46
Mitigating Factors ............................................................................. 47
Analysis of Study Findings .............................................................. 49
In-Study Observations ...................................................................... 49
Follow-Up Survey Results............................................................................ 51
Water Consumption Perceptions ..................................................... 51
Water Watch App UI Elements ....................................................... 52
Emotional Connection ...................................................................... 52
Overall Reactions.............................................................................. 53
VI. CONCLUSION ................................................................................................... 54
Further Research ........................................................................................... 55
APPENDIX SECTION ............................................................................................. 57
REFERENCES .......................................................................................................... 67
viii
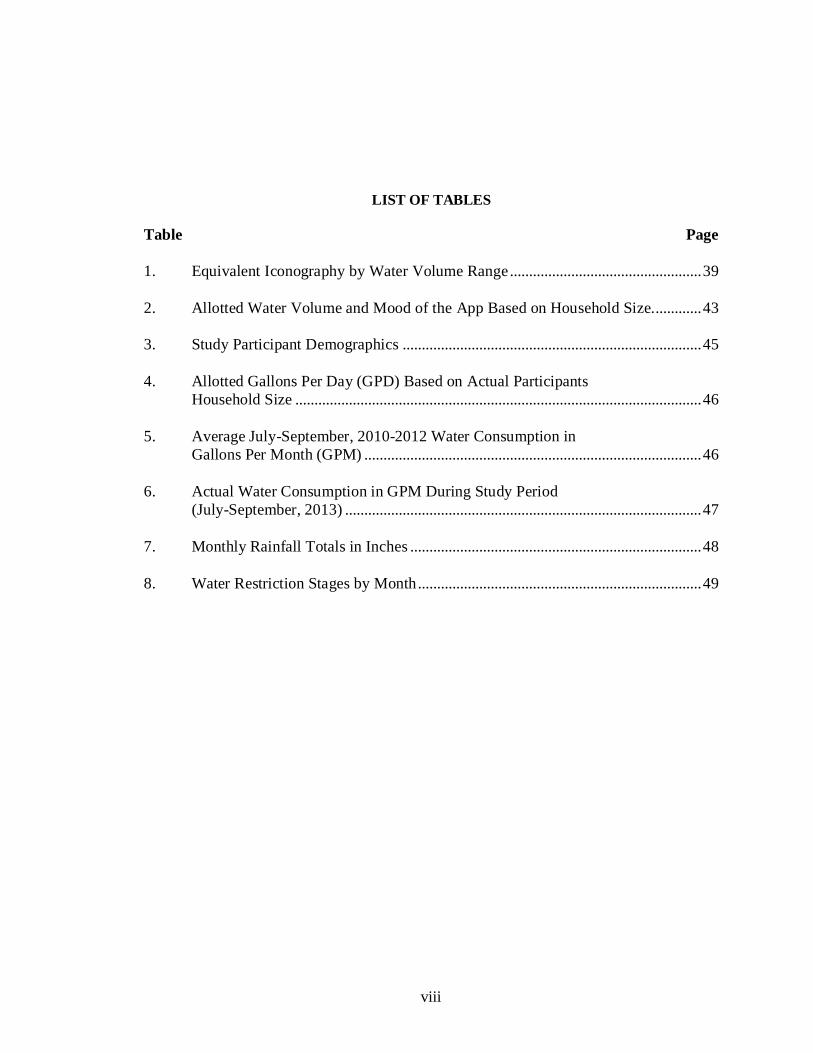
LIST OF TABLES
Table Page
1. Equivalent Iconography by Water Volume Range .................................................. 39
2. Allotted Water Volume and Mood of the App Based on Household Size............. 43
3. Study Participant Demographics .............................................................................. 45
4. Allotted Gallons Per Day (GPD) Based on Actual Participants
Household Size .......................................................................................................... 46
5. Average July-September, 2010-2012 Water Consumption in
Gallons Per Month (GPM) ........................................................................................ 46
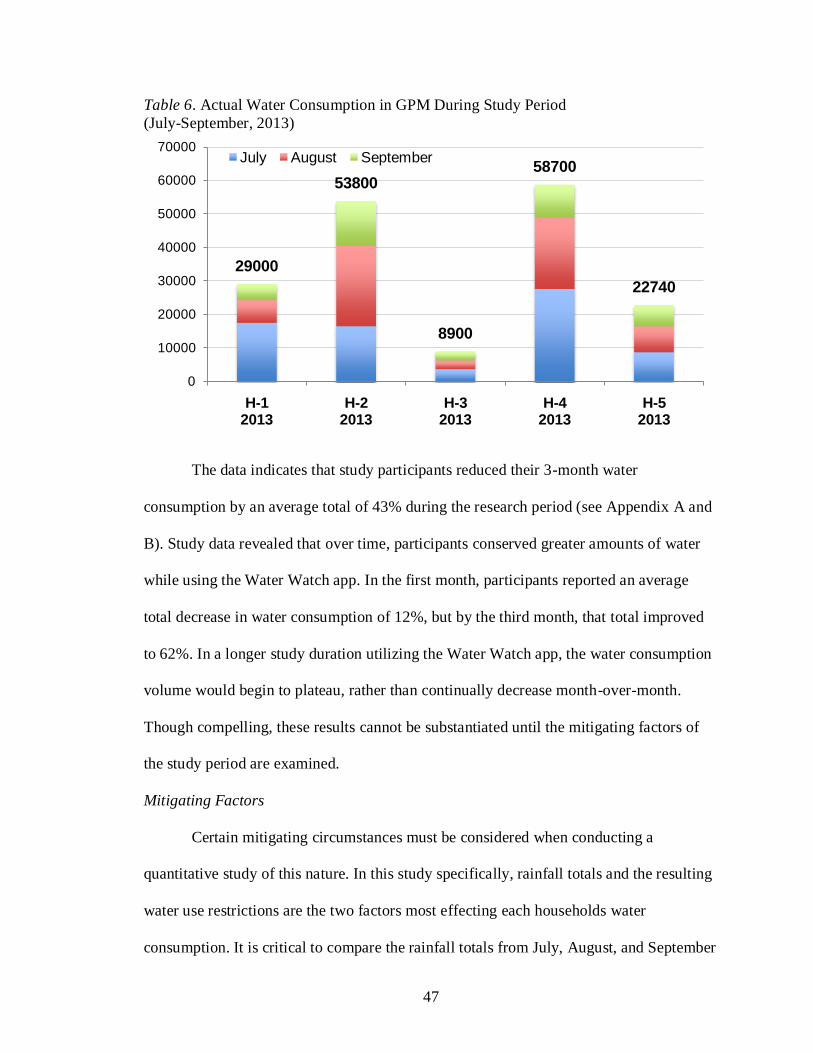
6. Actual Water Consumption in GPM During Study Period
(July-September, 2013) ............................................................................................. 47
7. Monthly Rainfall Totals in Inches ............................................................................ 48
8. Water Restriction Stages by Month .......................................................................... 49
ix
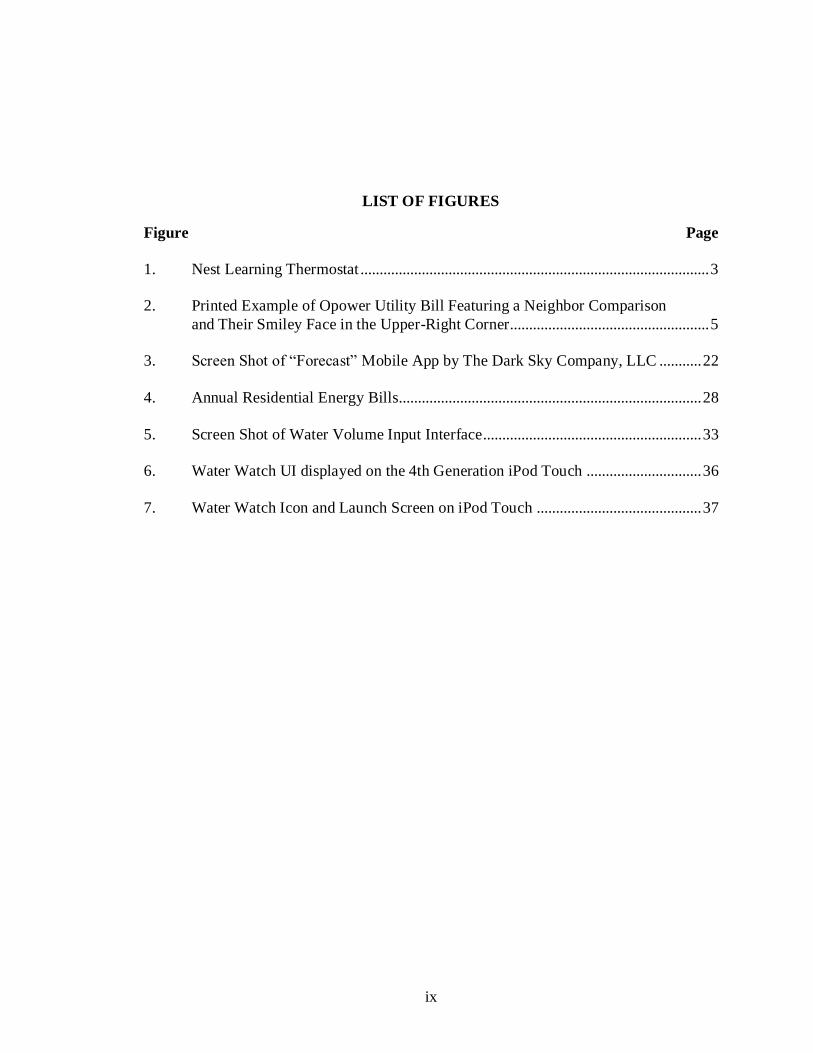
LIST OF FIGURES
Figure Page
1. Nest Learning Thermostat ........................................................................................... 3
2. Printed Example of Opower Utility Bill Featuring a Neighbor Comparison
and Their Smiley Face in the Upper-Right Corner.................................................... 5
3. Screen Shot of ―Forecast‖ Mobile App by The Dark Sky Company, LLC ........... 22
4. Annual Residential Energy Bills............................................................................... 28
5. Screen Shot of Water Volume Input Interface ......................................................... 33
6. Water Watch UI displayed on the 4th Generation iPod Touch .............................. 36
7. Water Watch Icon and Launch Screen on iPod Touch ........................................... 37
x
ABSTRACT
The amount and availability of freshwater on the planet earth is threatened each
day by factors such as rapid population growth, industrial contamination, and residential
misuse. The need for greater technologies and programs aimed at water use education and
conservation are now more important than ever. Without ample freshwater or the tools to
help save it, the human way of life stands to suffer immeasurable consequences.
This thesis research examines some of the key issues facing earth‘s water
supplies, while exploring the human habits of water consumption. Focused on resource
consumption in typical American households, this research discusses technologies
designed to promote energy conservation at home. The goal is to uncover the elements
that make those technologies successful so that they can be applied to a device designed
to promote smarter water consumption at home.
A 3-month study to examine the impact of visual communication and user
experience on residential water consumption was conducted in support of this thesis. An
Apple iPod Touch®
application named Water Watch was developed specifically for this
research. The function of the app was to provide its users with their daily water
consumption in several different visual formats. Five households participated in the study
and the results revealed that the availability of more frequent water consumption
information led to a decrease in overall water usage.
1
CHAPTER I
INTRODUCTION
The purpose of this thesis research is to examine the impact of visual
communication and user experience (UX) on residential water usage. This thesis will
discuss factors contributing to the earths decreasing freshwater resources and will explore
the effects of UX on a household‘s water consumption habits. A research study will be
conducted in support of this project, consisting of daily household water usage data
presented to its participants through an application (app) designed to operate on an Apple
iPod Touch. The experimentation period will conclude with a follow-up survey focused
on gauging individual experiences with the app as well as an analysis of each household's
historical water consumption versus that of the study period. This research project will
also investigate residential water misuse, examine the possible causes, and reinforce the
importance of more prevalent conservation practices.
Water Resources
The volume of water on earth has remained fairly constant for millions of years,
which often causes some debate when discussing its decline in availability. ―One should
consider the Earth as a ‗closed system‘ for the most part, like a terrarium. That means that
the Earth, as a whole, neither gains nor loses much matter, including water‖ (Global
Water Cycle, 2013). With a mere 1% of the earth‘s water available for human
consumption, factors such as rising demand from population growth, changing weather
patterns, and industrial contamination and waste, threaten the long-term availability of
2
the life-sustaining resource. In 1746, Benjamin Franklin proclaimed, ―When the well runs
dry, we know the worth of water‖ (Prud‘Homme, 2011, p. 13). Little did Franklin know
that his statement foreshadowed the increasingly critical need for greater conservation
tools, practices, and programs for maintaining clean, affordable water supplies for future
generations.
In a 2008 poll, 71 water utility managers and other experts were asked about
ineffectiveness of communications regarding the value of water. They responded by
highlighting a lack of audience attention to the value of water. In addition, the poll‘s
respondents believed that people view utility services such as water as a right rather than
a privilege (Chowdhury, Means, Passantino, Ruettan, Westerhoff, 2008, p. 72). The
convenience, availability, and ―on-demand‖ nature of water and electricity has created
complacency among many consumers in the U.S. Professor of Human Dimensions and
Natural Resources, Richard Knight points out that, ―Historically, we have taken those
services for granted, but an increasingly crowded planet and the degradation of lands and
waters are causing people to appreciate how much it costs to pay for substituting those
services once they are gone‖ (2008, p. 104). The rising costs Knight eludes to have
already begun to occur as evidenced by a 12-year study conducted by USA Today.
Researchers in that study found that in twenty-nine localities in the U.S., monthly water
costs have increased by at least double (McCoy, 2012, p. 1A).
Technologies for Water and Energy Conservation at Home
In-home systems and technologies have begun to emerge that target change in
human water and electricity consumption habits. Smart water meters, air conditioning
3
thermostats like Nest, and new billing techniques by companies like Opower are
beginning to show a profound impact on the way people consume water and electricity.
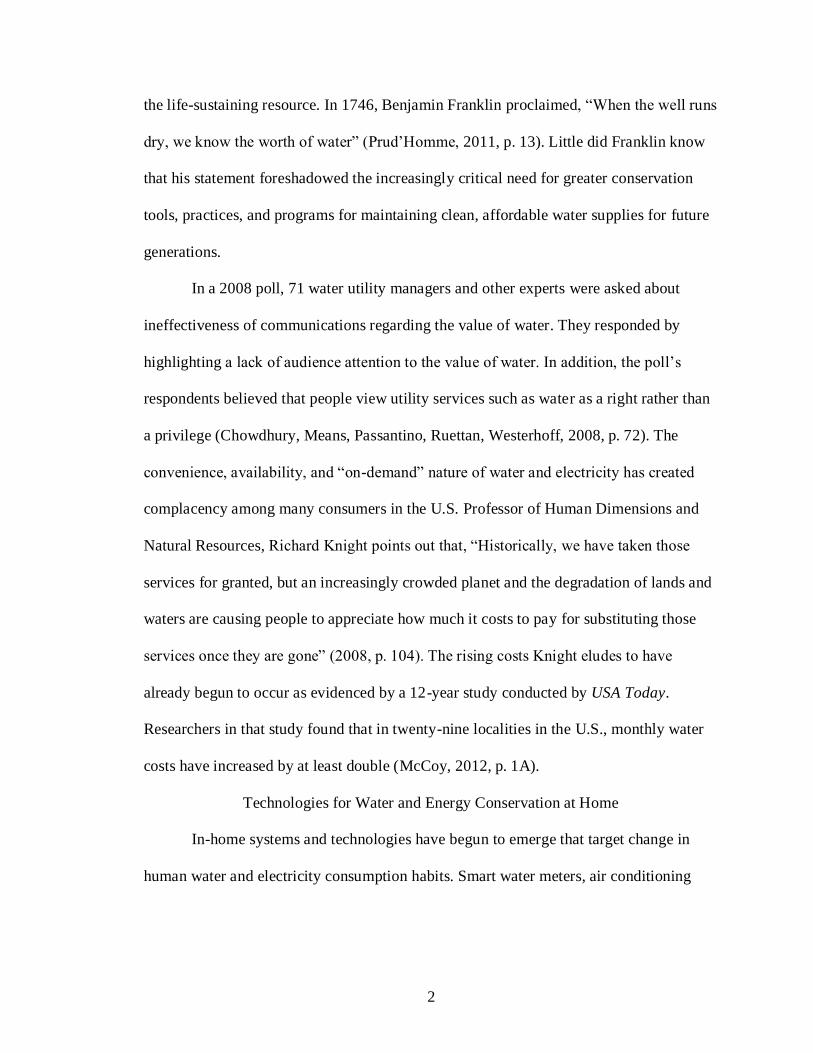
Nest
The Nest learning thermostat is a revolutionary device built to help save energy in
the home. The Nest combines modern design with energy saving functionality into the
electronic device driven human interactions of the 21st century (see Figure 1). The
strength of Nest lies in its remote access capability and its capacity to learn the
temperature habits of a given household.
Figure 1. Nest Learning Thermostat. (Eco Rehab Reviews, 2013).
The learning function of Nest is what makes it such a valuable device for energy
conservation. Wired Magazine‘s Steven Levy writes, ―If you‘re not home for a while, the
Nest will figure out the house is empty. If you routinely turn down the air conditioning
4
before your household goes to sleep, and you forget to do this one night, the Nest will
figure it out and take action‖ (2011). The thermostat can also teach its users better habits
by tracking their energy consumption as well as notifying them which temperature
settings are optimum for saving money. Nest captures and learns the temperature
adjustment habits of a household and builds custom schedules for the air conditioner (a/c)
to run on. This feature eliminates the mistakes people typically make when programming
traditional thermostats. As a result, Nest‘s adaptability allows a/c units to run more
efficiently than statically programmed thermostats.
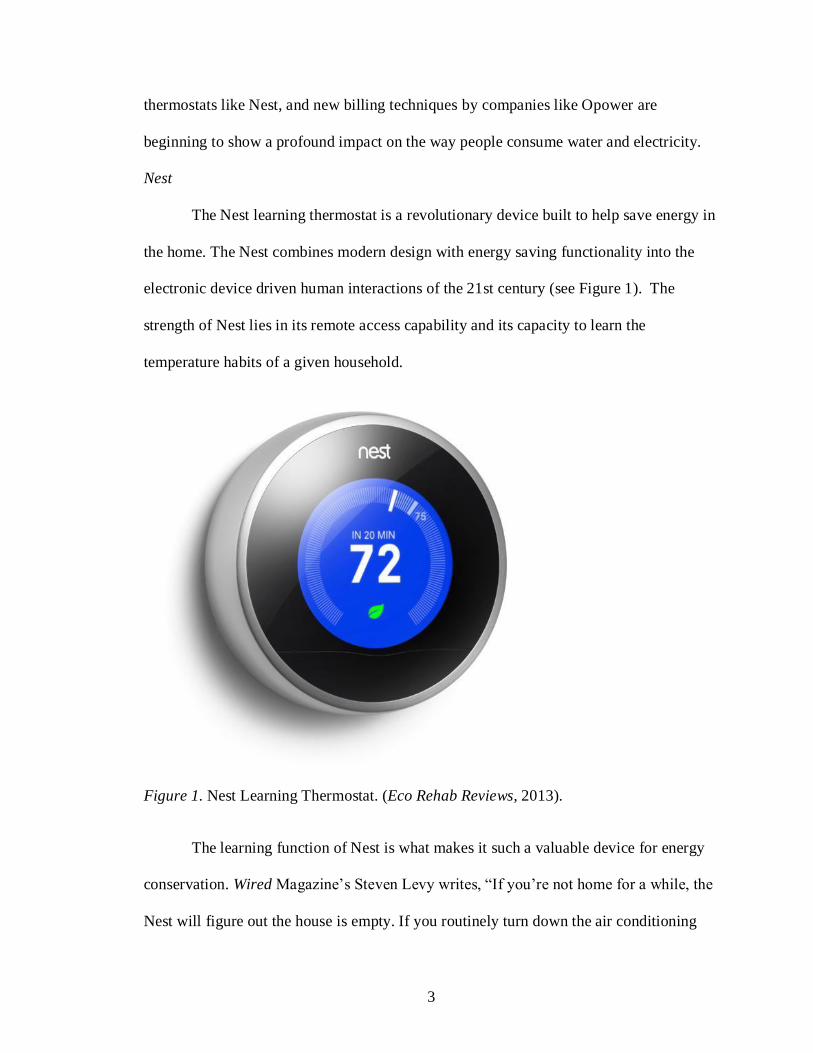
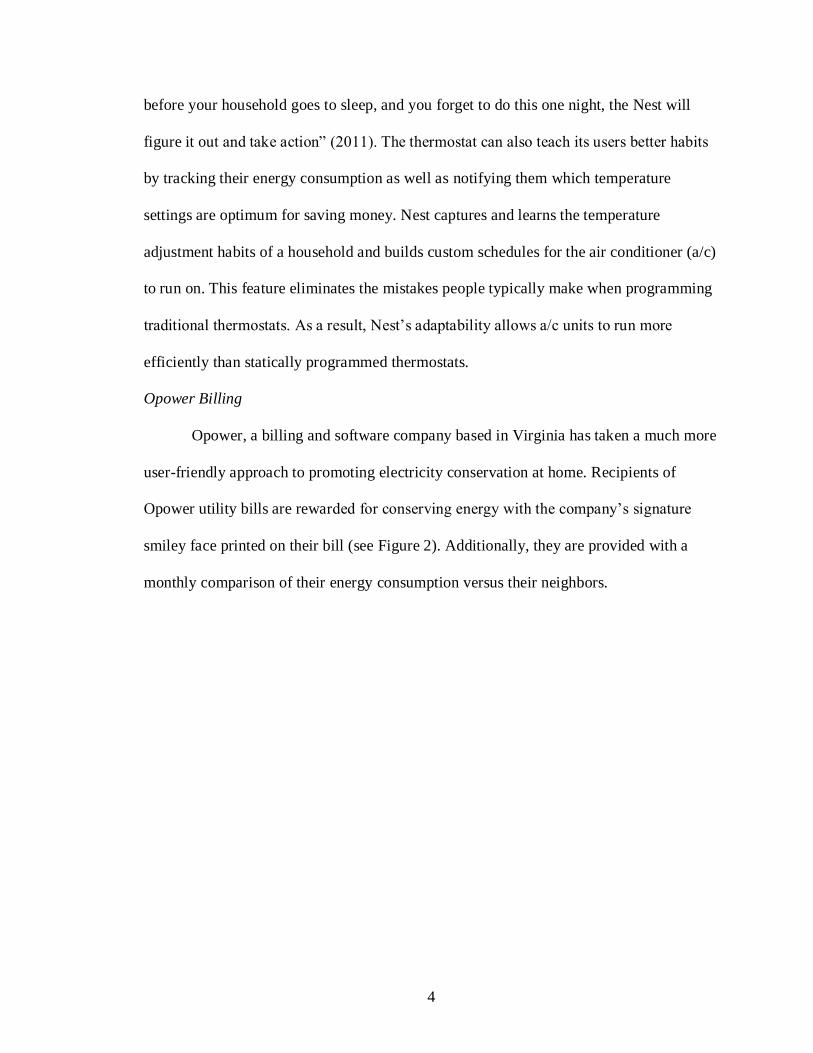
Opower Billing
Opower, a billing and software company based in Virginia has taken a much more
user-friendly approach to promoting electricity conservation at home. Recipients of
Opower utility bills are rewarded for conserving energy with the company‘s signature
smiley face printed on their bill (see Figure 2). Additionally, they are provided with a
monthly comparison of their energy consumption versus their neighbors.
5
Figure 2. Printed Example of Opower Utility Bill Featuring a Neighbor Comparison and
Their Smiley Face in the Upper-Right Corner (Lundin, 2011).
The neighborly energy comparison plays a significant role in producing Opower‘s
reported energy savings. First, it creates a competition-like situation among neighbors
making them want to out perform each other in energy and dollar savings. Secondly, it
raises awareness and encourages households to research and ask questions about how
their ―efficient neighbors‖ are successfully conserving energy. ―The energy savings
produced by the [billing] software could be significant. Dan Yates, the company's CEO,
says the average Opower customer cuts 2% to 3% of his or her energy usage because of
this snappily presented information‖ (Sutter, 2010).
6
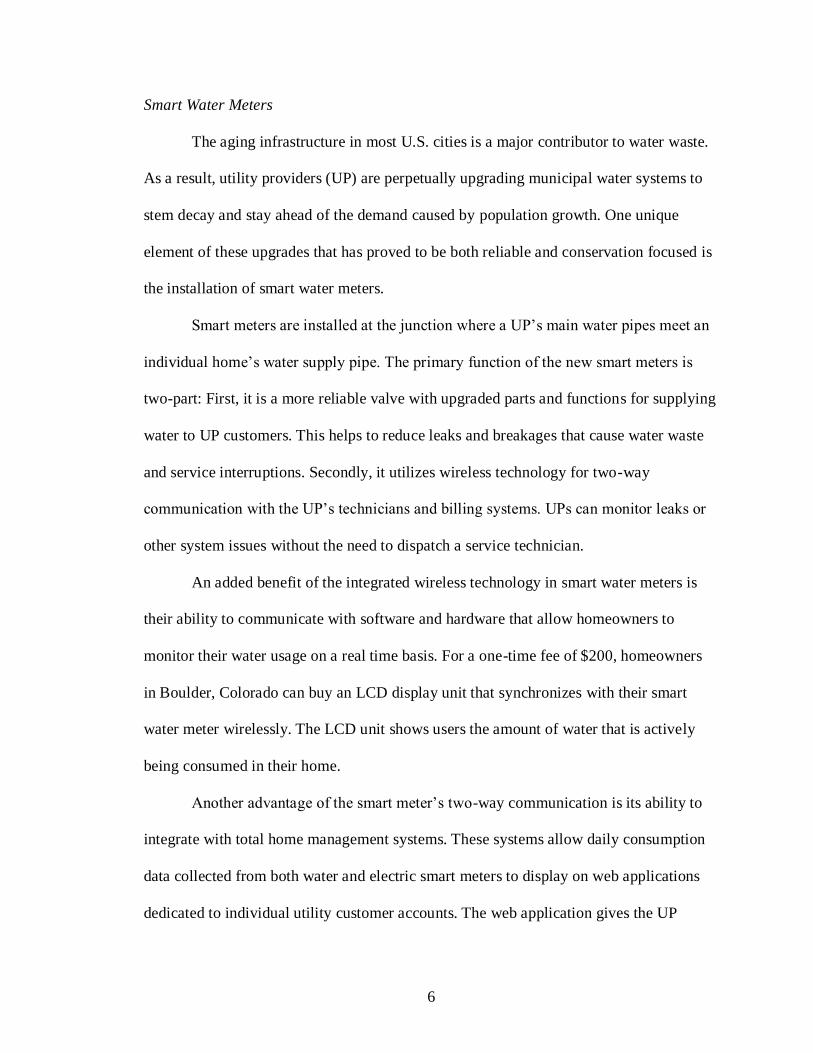
Smart Water Meters
The aging infrastructure in most U.S. cities is a major contributor to water waste.
As a result, utility providers (UP) are perpetually upgrading municipal water systems to
stem decay and stay ahead of the demand caused by population growth. One unique
element of these upgrades that has proved to be both reliable and conservation focused is
the installation of smart water meters.
Smart meters are installed at the junction where a UP‘s main water pipes meet an
individual home‘s water supply pipe. The primary function of the new smart meters is
two-part: First, it is a more reliable valve with upgraded parts and functions for supplying
water to UP customers. This helps to reduce leaks and breakages that cause water waste
and service interruptions. Secondly, it utilizes wireless technology for two-way
communication with the UP‘s technicians and billing systems. UPs can monitor leaks or
other system issues without the need to dispatch a service technician.
An added benefit of the integrated wireless technology in smart water meters is
their ability to communicate with software and hardware that allow homeowners to
monitor their water usage on a real time basis. For a one-time fee of $200, homeowners
in Boulder, Colorado can buy an LCD display unit that synchronizes with their smart
water meter wirelessly. The LCD unit shows users the amount of water that is actively
being consumed in their home.
Another advantage of the smart meter‘s two-way communication is its ability to
integrate with total home management systems. These systems allow daily consumption
data collected from both water and electric smart meters to display on web applications
dedicated to individual utility customer accounts. The web application gives the UP
7
customers the ability to monitor and manage their water and electricity consumption from
anywhere they have internet connectivity.
Improving Smart Water Meters
Though devices that interact with smart water meters like the LCD unit exist
today, their simplistic displays lack a UX capable of connecting with viewers at an
emotional level. ―User [Experience] (abbreviated as UX) is how a person feels when
interfacing with a system. The system could be a website, a web application or desktop
software and, in modern contexts, is generally denoted by some form of human-computer
interaction (HCI)‖ (Gube, 2010). The device‘s User Interface (UI) and UX are critical in
delivering an actionable message about each household‘s water usage.
The water monitoring app designed for this thesis research, nicknamed Water
Watch, will attempt to enhance the capabilities of smart water meters by taking cues from
the UX of Nest combined with the psychological response of Opower billing. Water
Watch intends to evoke the same daily human interaction habits as common thermostats.
Unlike most thermostat experiences though, the app focuses on creating a UX that
resonates with its users. Water Watch will also seek to bolster its UI and UX by
leveraging the ease of use of the iPod Touch platform.
Thesis Organization
This thesis project is organized into six chapters. After discussing factors that
threaten earth‘s current freshwater supplies, this thesis will present available water
conservation programs and practices. The project will then examine the habits of daily
water consumption in typical American households.
8
In the preliminary research chapter, this thesis will probe the relationships of
visual communication and UI design with human interactions by researching mobile
devices, visual cues, icon/symbol recognition, and the emotional connection between
humans and technology. These components will be critical in understanding habits
surrounding water consumption at home.
The next portion of this thesis will introduce the methods used to support the
research study performed with the Water Watch app. This transitions into the
presentation of the research study components as well as its results. This thesis project
will conclude with a study analysis, conclusions made from the entire investigation of
this topic, and projections for further research.
9
CHAPTER II
STATEMENT OF PROBLEM
Issues Facing Freshwater Supplies
Without the continued establishment of policies created to protect water resources
and smarter, more conservation-minded consumption at the residential level, humans will
be facing catastrophic water shortages in the coming years. ―Ismail Sergeldin, the
[World] bank‘s vice president for environmental affairs and chairman of the World Water
commission, stated bluntly the ‗the wars of the twenty-first century will be fought over
water‘‖ (de Villers, p. 13). Rapid population growth, water waste, contamination, and
climate change are just a few of the major issues facing earth‘s freshwater supply.
Population
By the year 2030, the population of planet earth is predicted to exceed 8 billion
people. That is an increase of over 1 billion consumers of todays already strained water
supply. Alex Prud‘Homme writes that in the U.S., ―A report by the US General
Accounting Office predicts that thirty-six states will face water shortages by 2013, while
McKinsey & Co. forecasts that global demand for water will outstrip supply by 40
percent in 2030‖ (2011, p.12). In a 2009 report, the United States Geological Survey
(USGS) estimates that the U.S. used nearly 410 billion gallons of water per day in 2005
(Kenny, Barber, Hutson, Linsey, Lovelace, Maupin, 2009). Though the water volume
indicated in the 2005 findings is staggering, it marks the beginning of a leveling off of the
water consumption in the U.S. through today. This leveling off can be attributed in large
part to policy changes like the Clean Water Act, the Safe Drinking Water Act, as well as
greater adoption of water conservation practices. Despite the increase in conservation
10
efforts since 2005, there remains an urgency to reduce daily water consumption in the
U.S. Targeting residential water consumers with conservation-focused technologies and
services can help to ensure the availability of freshwater for years to come.
Population-driven demand is one of the greatest threats to the earth‘s water
resources. This demand goes well beyond the human need to consume water for
sustaining life. As population increases, the need for industries that supply consumers
with essentials like, fuel, electricity, and food increase as well. Not surprisingly, each one
of these industries relies heavily on the use of water for their production.
Industrial Water Use and Pollution
Industrial processes that produce fuel for transportation and electricity such as
thermoelectric-power, hydraulic fracturing, and coal production use almost half of all the
water consumed daily in the U.S. The twenty-two highest coal producing states in the
U.S. use as much as 3.5 billion gallons of water per day in their mining operations
(Maxwell, Yates, 2011, p. 92). The recent boom in Hydraulic Fracturing (fracking), a
process used to remove oil and gas from shale deposits with high-pressure liquid, uses an
estimated 40 and 70 billion of gallons of water each year in the U.S. according to the
EPA (Kenworthy, 2013). The water used each day for fracking is only part of the threat
to water resources. ―Indeed, shale gas is a black hole for water. Exploiting it requires and
pollutes massive amounts‖ (Biswas, 2013). The fracking fluid is a cocktail of thousands
of gallons of water combined with toxic chemicals that include lead, uranium, and
methanol to name a few. Most alarming is the fact that most of these chemicals cannot be
refined from the wastewater created by the fracking process.
11
The fracking fluid has the potential to affect freshwater supplies in two significant
ways. First, when fracking for oil and gas, the toxic fluids used can easily seep through
shale deposits contaminating underground aquifers. Secondly, the perpetually
contaminated water used for fracking is commonly stored in large, plastic-lined retention
ponds that are treated to lessen the toxicity of the chemicals used. The liners in the ponds
are at risk of failing, allowing contaminated water to drain back into the ground, aquifers,
and rivers.
Commercial/Residential Irrigation and Contamination
Commercial and residential irrigation also make up a steadily increasing portion
of the U.S. daily water consumption. The USGS estimates that in 2005, as many as 60
million acres were irrigated in the U.S. equaling 128 billion gallons of water per day.
This issue is compounded by population growth, and aside from the water needs of
commercial agriculture, much of it can be attributed to vanity and social pressure.
On average, 50% of a typical American home‘s total water consumption is
attributed to lawn irrigation, while southern states can reach averages as high as 60%.
Water dependent, non-native turf grasses and plants coupled with pressure from
neighbors and homeowners association (HOA) regulations lead to water devouring
lawns. In her 2008 article for The New Yorker, Elizabeth Kolbert writes, ―The lawn has
become so much a part of the suburban landscape that it is difficult to see it as
something that had to be invented‖ (Water on the Home Front, p. 8).
In addition to the volume of water used, contamination is another aspect of
commercial and residential irrigation threatening freshwater resources in the U.S. Lawn
care products and insecticides such as glyphosate (commonly known as Roundup®
)
12
runoff into storm drains, rivers and underground water supplies. In a 2013 literature
review conducted to analyze the effects of glyphosate on humans, the authors concluded
that:
Contrary to the current widely-held misconception that glyphosate is relatively
harmless to humans, the available evidence shows that glyphosate may rather be
the most important factor in the development of multiple chronic diseases and
conditions that have become prevalent in Westernized societies. In addition to
autism, these include gastrointestinal issues such as inflammatory bowel disease,
chronic diarrhea, colitis and Crohn‘s disease, obesity, cardiovascular disease,
depression, cancer, cachexia, Alzheimer‘s disease, Parkinson‘s disease, multiple
sclerosis, and ALS, among others. (Samsel, Seneff, 2013, p. 1443)
Rainwater runoff from city streets can include a myriad of harmful pollutants such as
motor oil, paints, sewage, and pharmaceuticals (Prud‘Homme, 2011, p. 43). The most
concerning aspect of the water contamination resulting from irrigation and runoff is that
trace amounts of the deadly chemicals will always exist in the water we use daily.
Climate Change
Climate change resulting from global warming is one of the most highly discussed
and contested issues facing the planet earth. Regardless of which side one might take in
this debate, scientific evidence has shown that earth‘s temperature is steadily rising. The
EPA reports that in the U.S., temperatures have risen by an average of 0.14˚F per decade
since 1901 (Climate Change Indicators in the United States, 2013). This trend is expected
to continue with estimates showing an increase in temperature by as much as 11˚F by
2100. The rise in temperatures has adverse effects on the planets delicate ecology–all of
13
which negatively impact the human way of life. Diane Raines Ward, author of Water
Wars: Drought, Flood, Folly and The Politics of Thirst, quotes the German magazine Der
Spiegel writing, ―In human history . . . far smaller temperature shifts have doomed
kingdoms, set off wars, forced peoples into exile, and created new religions‖ (2002, p.
22).
Earth‘s water supply is one of the most greatly impacted resources by climate
change. Rising global temperatures will change where water is found due to increased
evaporation rates. Alex Prud‘Homme points out, ―As a result, global warming will not
change the amount of water in the world, but it will change the distribution of water,
which will have many consequences‖ (2011, p. 129). Changing weather patterns resulting
from rising temperatures have begun carrying the additional evaporated water to and
away from regions that have had consistent weather patterns for many centuries.
The frequency of prolonged droughts will plague certain regions while deadly
flooding will become more common in others. Recent drought conditions have greatly
impacted the United States, with many regions considered to be ―exceptional‖ in intensity
according to the National Drought Mitigation Center (2013). The Mississippi river has
reached historically low levels, threatening closures to major shipping channels. In South
Texas, the lack of rain has scorched grasslands, forcing ranchers to burn the needles from
native cactus in order to create additional food and water sources for their cattle.
Additionally, cities like Denver, Austin, and Charlotte continue to see rapid population
growth, further stressing the available water resources. All of these examples can be
attributed to earth‘s water redistribution due to climate change. In the future, continued
climate change will have immeasurable consequences on human life.
14
Conservation Programs and Practices
Water conservation programs and practices in the U.S. have made significant
strides over the past 50 years. The Clean Water Act (CWA) of 1972 placed strict
regulations on water used for industrial purposes in order to control water waste and
pollution. The CWA opened the door for the Safe Drinking Water Act (SDWA), which
was enacted to protect drinking water sources such as rivers, lakes, and underground
aquifers. Additionally, the SDWA allowed the government to better monitor public water
systems, ensuring quality, contaminant-free water is supplied to all Americans.
Apart from federally run programs focused on protecting water and its sources in
the U.S., conservation practices on a municipal and individual level have become
increasingly more common. Today, many utility/water providers across the country offer
their customers monetary incentive programs aimed at conserving both water and
electricity. Additionally, UPs have set more strict rules and penalties to counteract water
waste during drought periods. These regulations commonly include limiting lawn
irrigation to specific days and times.
Rebates for low-flow toilets, energy-efficient washing machines, and the use of
reclaimed water from showers and sinks (greywater) are offered by UPs from coast to
coast. New Braunfels Utility (NBU) located in New Braunfels, Texas offers its customers
a rebate of up to $250 when residents purchase and install a rainwater harvesting system.
The San Antonio Water Authority (SAWS), like UPs in many other southern cities,
encourages water conservation by offering a rebate of up to $400 for replacing water-
thirsty grasses with drought-tolerant landscaping.
15
Companies who provide water and electricity understand that conservation
practices are critical to the sustainability of both quality resources and long-term revenue.
New York Times, Business Day reporter Diane Cardwell points out, ―While it seems
counterintuitive for utilities to discourage use of their product, it actually makes financial
sense as they face government mandates to encourage more energy conservation and deal
with the rising cost and difficulty of building power plants and distribution systems‖
(2012). In light of this trend towards greater water conservation, more and more
technologies have begun to emerge that make conservation practices at home easier for
consumers.
Residential Water Costs and Billing
One dilemma surrounding the adoption of widely accepted residential
conservation practices is that the financial burden of water use is somewhat minimal. It is
estimated that the average American uses as much as 80-100 gallons of water per day at a
cost of $1.50 per 1000 gallons (Water Science School, 2013). Based on these averages, a
typical household in the U.S. will use 11,200 gallons of water per month, at a cost of
$16.50. Therefore, it can be difficult for consumers to embrace a change in consumption
habits when compared to their cable or cell phone bills; the cost of water is considerably
less expensive.
Unless the dollar amount on a typical household‘s monthly water bill is vastly
different than anticipated, the consumer will generally assume that their usage is
―normal‖. This factor reinforces the issue that the cost of water is prohibitive to better
conservation practices. ―Water has generally been so cheap for so long, that people have
16
become anchored to the past price, not realizing that sustainability costs money to
achieve‖ (Walton, 2010).
Drying wells, refinement processes, and increasingly complex distribution
systems have all resulted in increased water costs. In fact, some regions have turned to
very costly methods such as desalination because of their lack of a freshwater.
Desalination is a process used to create freshwater by removing salts and other minerals
from brackish or seawater. Paul Alois, research analyst for The Arlington Institute claims,
―Desalination is an expensive and energy intensive technology, and currently only
wealthy countries with serious water shortages consider it a viable option‖ (2007).
Programs and technology that promote water conservation practices are vital to keeping
this essential resource readily available and equally affordable for everyone.
Hypothesis
At the current rate of daily consumption in the United States, it is becoming clear
that Americans lack an overwhelming concern for freshwater resources. Overall, water
consumers lack an adequate understanding of their daily consumption, or the
consequences of their water management decisions. In Texas, the EPA claims, ―If just 20
percent of households in Texas retrofit with water-efficient fixtures and appliances, they
could save more than 50 billion gallons per year—enough to fill the new Dallas Cowboys
stadium, the largest domed structure in the world, more than 60 times‖ (Texas Water Fact
Sheet, p. 2).
The misunderstanding of water consumption on a residential level supports the
dire need to create an increased awareness through water conservation education,
practices, and technologies. The Water Watch app, designed for participants of this
17
research study, is a tool that will provide an increased awareness of the daily water usage
by utilizing five distinct components.
The first of these components used by the app is the participating households
actual daily water consumption. This will be displayed numerically in the upper-right
hand corner of the UI. The second component, set in the center of the UI, is a set of icons
used to illustrate a real-world equivalent of the numeric water volume. For example, if
the participants water consumption on a given day is between 1500 and 2000 gallons, the
app will display a round bale of hay, a four-door hatchback automobile, or 2-commercial
propane tanks.
The mood of the app makes up the third component. Participants are allocated an
acceptable water consumption range based on their household size. If the water
consumption for that day is at or below the acceptable range, the app is happy and the UI
will appear green in color with a smiling face icon representing a happy mood. If the
household has consumed more than their acceptable range, but less than an additional 100
gallons, the app is indifferent and will appear yellow in color with an indifferent looking
face icon representing a neutral mood. When the participating household has consumed
more than 100 gallons of water above their acceptable range, the app will appear red in
color with a sad face icon representing an unhappy mood.
The fourth component of the Water Watch app, used to help increase
comprehension of daily water consumption is the last 7-day total display. This feature
will appear numerically in the lower-right hand corner of the app‘s UI. The last 7-day
total is intended to provide participants with a snapshot of their consumption over a
week‘s time. Finally, the fifth component of the Water Watch app is the acknowledge
18
button. Once tapped, this feature is one of the most vital elements of the app because it
verifies that the study participants have viewed all of the elements discussed above each
day.
By drawing from the strengths of other known conservation methods and
technologies like the UI of Nest learning thermostat and the UX of Opower billing, the
Water Watch app will help change the way its users consume water at home. As a result,
the researcher expects that Water Watch app users will consume less water in July,
August, and September of 2013 than their 3-year average water consumption from the
same months.
19
CHAPTER III
PRELIMINARY RESEARCH
Emotional Connections Between Humans and Technology
In the 21st century, human interactions with technology have become increasingly
inevitable. Everyday, humans are required to interact with a computer, appliance, or a
mobile device to complete daily tasks. This can include activities like banking, work-
related tasks, learning, and even watching television. It is with this overwhelming
reliance on technology that humans have begun to form a much closer bond with their
electronic devices. Furthermore, new research has shown that people have gained such an
attachment to their technology and devices that they have even begun to build somewhat
of a relationship with it.
Reciprocity, or human-to-human exchanges and interactions, plays a major role in
the way relationships are formed and maintained. For example, if person-1 helps person-2
move from one apartment to another, person-1 would expect person-2 to reciprocate their
deed by receiving help from person-2 at some point in the future. Stanford professor
Clifford I. Nass, Ph.D., took this exchange a step further by performing a study to test the
limits of the rule of reciprocity between humans and technology. In the experiment, study
participants were given the opportunity to ask a computer a series of questions. Nass
says, ―In the first experiment, the computer was very helpful. When you asked a question,
it gave a great answer‖ (Spiegel, 2013). After completing the question and answer (Q&A)
session, half of the study group remained at the same computer (PC-A) while the other
half was moved to a different computer (PC-B). Both PC-A and PC-B then asked the
20
human participants for help with improving its performance by requesting that they
complete complex tasks that included a series of color matching exercises.
Researchers found that the study participants that were moved to PC-B were less
willing to help that computer improve since they had no prior relationship with PC-B.
This was proven by the fact that the participants that were moved to PC-B completed far
less of the color matching exercises than those who stayed at PC-A. In subsequent
testing, both PC-A and PC-B participated in a Q&A session with study participants. PC-
A provided ―great answers‖ while the PC-B was considered, ―a computer terrible at
answering questions‖ (Spiegel, 2013). Once again, the participants were less willing to
help PC-B improve itself because of its ―terrible‖ answers, and therefore did not
reciprocate.
Dr. Nass‘ experiment shows that people tend to interact with machines and
technologies using human social behaviors, even if they fail to realize it. ―Change the
way a machine looks or behaves, tweak it‘s level of intelligence, and you can manipulate
the way humans interact with it‖ (Spiegel, 2013). This theory of human-technology
reciprocity supports the idea that people can, in fact, form an emotional bond with their
technology and therefore will show concern for the needs of a machine. Of course,
building this human-technology relationship is dependent upon the effectiveness of the
UI and UX of the device they are interacting with.
User Interface and User Experience
UI/UX are vital interaction components impacting everything from consumer
electronics such as washing machines and televisions to computers and smartphone
applications. It is these two components that allow users to achieve a desired result from
21
an appliance, smartphone, or mobile app. For example, when a person wants their coffee
brewed before their morning alarm, they program the coffee maker to do so using digital
interface, or UI. If operating the UI was intuitive and made programming easy, then they
will have hot coffee awaiting them in the morning. The result is a satisfying and
memorable UX.
UI
The UI of a digital or mobile application can best be thought of as the way the app
looks and feels. In other words, the UI is the environment in which the buttons, levers,
switches, inputs, and displays allowing users to interact with the app reside. By
definition, UI is, ―the aspects of a computer system or program which can be seen (or
heard or otherwise perceived) by the human user, and the commands and mechanisms the
user uses to control its operation and input data‖ (user interface, n.d.). The user‘s
perception of the UI is the critical first step in creating a memorable interactive
experience within an app.
It is imperative that the UI is intuitive and comfortable for users. This requires a
UI design to present information in a well-organized manner while feeling somewhat
familiar to the user. In other words, ―Their perception of the display is based more on
what their past experience leads them to expect than on what is actually on the screen‖
(Johnson, 2010, p. 4). In addition, the study of the relationships between signs and
symbols to natural languages (Semiotics) plays an important role in the ability of the UI
to appear familiar/recognizable to users.
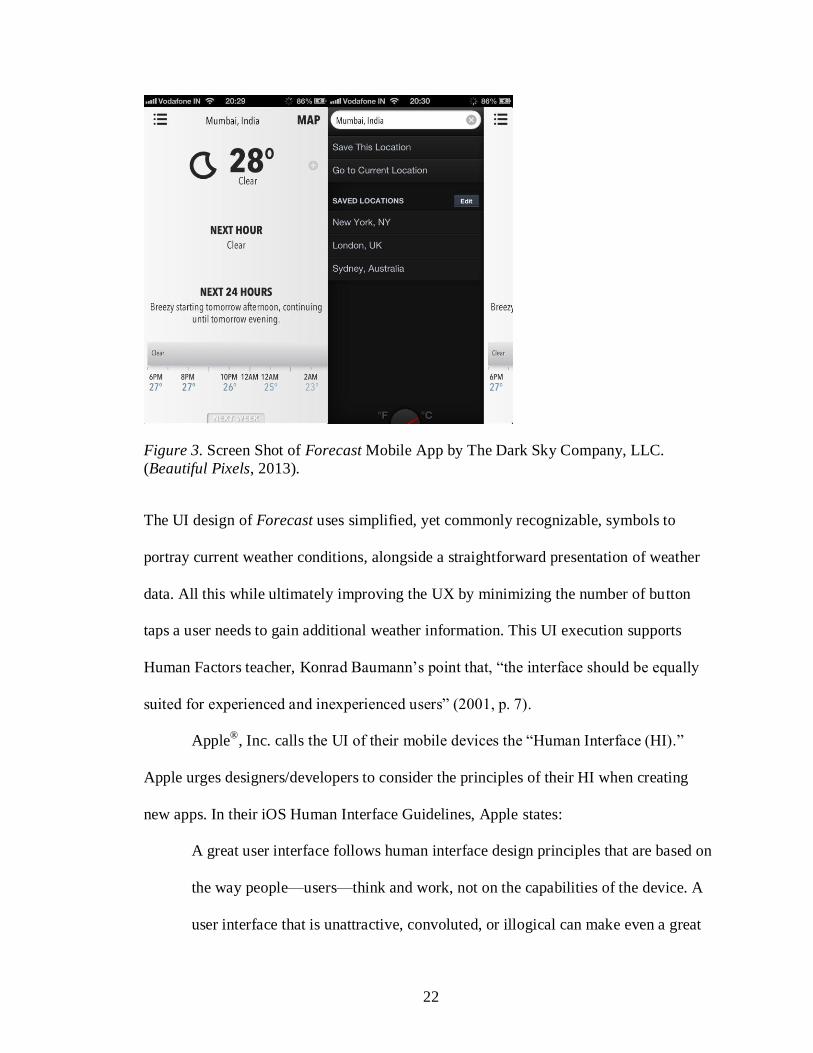
What appears to be a very minimalist UI, the app ―Forecast‖ (see Figure 3) is
designed to provide powerful weather forecasting results.
22
Figure 3. Screen Shot of Forecast Mobile App by The Dark Sky Company, LLC.
(Beautiful Pixels, 2013).
The UI design of Forecast uses simplified, yet commonly recognizable, symbols to
portray current weather conditions, alongside a straightforward presentation of weather
data. All this while ultimately improving the UX by minimizing the number of button
taps a user needs to gain additional weather information. This UI execution supports
Human Factors teacher, Konrad Baumann‘s point that, ―the interface should be equally
suited for experienced and inexperienced users‖ (2001, p. 7).
Apple®
, Inc. calls the UI of their mobile devices the ―Human Interface (HI).‖
Apple urges designers/developers to consider the principles of their HI when creating
new apps. In their iOS Human Interface Guidelines, Apple states:
A great user interface follows human interface design principles that are based on
the way people—users—think and work, not on the capabilities of the device. A
user interface that is unattractive, convoluted, or illogical can make even a great
23
application seem like a chore to use. But a beautiful, intuitive, compelling user
interface enhances an application‘s functionality and inspires a positive emotional
attachment in users. (2011, p. 8)
These HI principles have been successfully integrated into Apple‘s mobile devices since
their first iPod shipped in 2001. In fact, in order for newly developed apps to be accepted
and distributed by their Application Store (App store), Apple reviews each to ensure that
it maintains the standards of quality and usability defined by the iOS Human Interface
Guidelines. Today, the almost one million apps available in the Apple App Store have
been downloaded over fifty billion times.
UX
The primary function of the UX is to establish how viewers consume and retain
the information provided by the app. Yet, an app's UI and UX must work in concert to
create both a fulfilling and lasting experience for its users. Though a UI may be designed
masterfully, the key message/goal of an app can be threatened by an inefficient or
disengaging UX.
In UX Book: Process and Guidelines for Ensuring a Quality User Experience,
Rex Hartson states:
User experience is the totality of the effect or effects felt by a user as a result of
interaction with, and the usage context of, a system, device, or product, including
the influence of usability, usefulness, and emotional impact during interaction,
and savoring the memory after interaction. (2012, p. 5)
Hartson points out that UX is responsible for how the interactions make the user feel
about the information presented in the app. He goes on to say that, ―‗Interaction with‘ is
24
broad and embraces seeing, touching, and thinking about the system or product, including
admiring it and its presentation before any physical interaction‖ (2012, p. 5).
Like the Q&A sessions in Dr. Nass‘ experiments, an exceptional UX has a
reciprocating relationship with its users. In an article for Smashing Magazine, web
designer Paul Boag writes, ―A happy user is considerably more likely to recommend your
services and is more patient when things occasionally go wrong. Enthusiastic users can
also become valuable volunteers; they have innumerable ideas about how your website
and products can be improved‖ (2011). The goal of the UX should be to recruit the happy
and enthusiastic users that Boag points to because of the willingness of those users to
reciprocate with the app.
The Water Watch app in this thesis research must embody the principles of
compelling UI and UX in order to accomplish a human-technology relationship. Without
an emotional connection between the app‘s water consumption data and the user, it is
unlikely that a voluntarily adoption or promotion of water conservation practices will
take place.
Visual Cues and Symbol/Icon Recognition
Human beings have relied on symbols for thousands of centuries. Ancient
civilizations utilized symbols as representations of directions, landmarks, warnings, or
even as simplified representations of their life experiences. Psychologist Harold Gardner
writes, ―Because humans isolate events and draw inferences about them, we have
developed linguistic and pictorial symbols that can handily capture the meanings of
events‖ (1999, p. 38). Not unlike past civilizations, humans today rely on symbols for
much of the same reasons, many of which are essential to human existence.
25
The form and interpretation of symbols can vary based on cultural and social
differences. Yet, what links symbols across cultures is that they are used to provide
humans with visual cues to remind them of actions or experiences that they have or will
encounter. According to Gardner, humans have become quite adept to this, stating, ―the
human brain seems to have evolved to process certain kinds of symbols efficiently‖
(1999, p. 38). Based on Gardner‘s assessment, utilizing symbols and icons is relevant
when examining, and perhaps even altering human behavioral habits.
One of the most easily comprehended symbols in the U.S. is the stop sign. In a
given day, humans repeatedly encounter the red octagon with the word ―STOP‖ posted
on it. Though a very simple example of a symbol, what makes the stop sign unique is
how its make-up has transformed how humans interpret it‘s visual cues. The scientific
analysis of this human perception is known as the Sequence of Cognition. In this
sequence, the human brain first recognizes and acknowledges visual communications
before it decodes the meanings of words or phrases (Wheeler, 2013, p. 52). Because of
the abundance of stops signs people see daily, its shape, color, and meaning are ingrained
in the human brain. Even with word ―STOP‖ absent from the sign, the red octagon is still
be capable of making drivers understand its meaning. Furthermore, since the color red is
often associated with a warning or danger, the typographical element of a stop sign is
almost unnecessary in order for it to achieve its intended message.
Due to the human brain‘s ability to recognize symbols, the combined shape and
color of the stop sign can communicate a similar message in applications other than
driving. The same logic can be applied to the green, yellow, and red colors of a traffic
light. Though these visual cues contain no identifiable icon, the symbolism of light‘s
26
color transcends their traffic control application. ―Many experiments have shown,
however, that the color experiences we have are the result of the total situation in which
they are obtained‖ (Kuehni, 2012, p. 51). Therefore the experiences gained from the
colors used in something like a traffic light have the ability to invoke the same human
reactions when used in a different medium. Green has a positive connotation and
indicates to viewers that they can safely proceed, while yellow is neutral and hints at the
possibility of approaching danger.
Icons
Icons can be considered a subset of symbols, as they are more category-specific
representations of objects. Much of their interpretation depends on how universally
recognized the symbol or icon is across cultures. For example, the cross is a ―symbol‖
known throughout the world as a representation of Christianity, whereas an ―icon‖
depicting a telephone may be specific to only modernized cultures. One definition
identifies icons as, ―a sign or representation that stands for its object by virtue of a
resemblance or analogy to it‖ (icon, n.d.). Icons, like symbols have the ability to
condense powerful messages into minimal visual cues.
Of key importance to an icon in a UI is its systematic relationship to what it is
representing. The trash can icon on a computer represents the disposing of something,
which in this is example is files. In his book Visual Intelligence, Donald Hoffman writes:
The trash can icon is systematically related to that of erasing software, but the
relation is arbitrary: the trash can icon doesn‘t resemble the erasing software in
any way. It could be any color or shape you wish and still successfully do the job
of letting you interact with the erasing software. It could be a pig or toilette icon
27
instead of a trash can icon. All that matters is the systematic connection. (1998, p.
193)
Hoffman shows that the stylistic elements of icons are often of less importance than the
systematic relationship they create. In other words, in the appropriate context, an icon
portraying an elephant does not have to be full-size, or gray in color in order for a person
to understand that it represents an elephant, a large animal, or something of substantial
size.
Energy Consumption Resulting from In-Home Technology
When examining methods of altering water consumption habits, it is important to
understand how homes use other resources like electricity. Households today are
inundated with technology in the form of appliances, computers, and mobile devices;
each designed to provide automation and convenience. In the U.S., people often minimize
the technological aspect of conveniences like air conditioners, refrigerators, and washing
machines because they are seen as common requirements in a home. But, as Ed Sobey
writes, ―technology isn‘t all connected to your computer. It‘s in every widget and gizmo
that you use‖ (2007, p. 8). One aspect, universal to all of these in-home technologies, is
that they all consume energy. This commonality is of great importance when attempting
to examine how people interact with these technologies each day, as it is directly
connected to a homeowner‘s monthly energy expense.
Household energy consumption habits are most often impacted by the level of
concern a homeowner has for saving money. Therefore it is no coincidence that a 2006
nationwide survey conducted by the Pew Research Center found that 77% of Americans
considered themselves to be always looking for opportunities to save money (2007).
28
Programs like the Energy Star Certification promote savings by ensuring that appliances
and consumer electronics are manufactured to operate at minimum energy consumption
and operating costs.
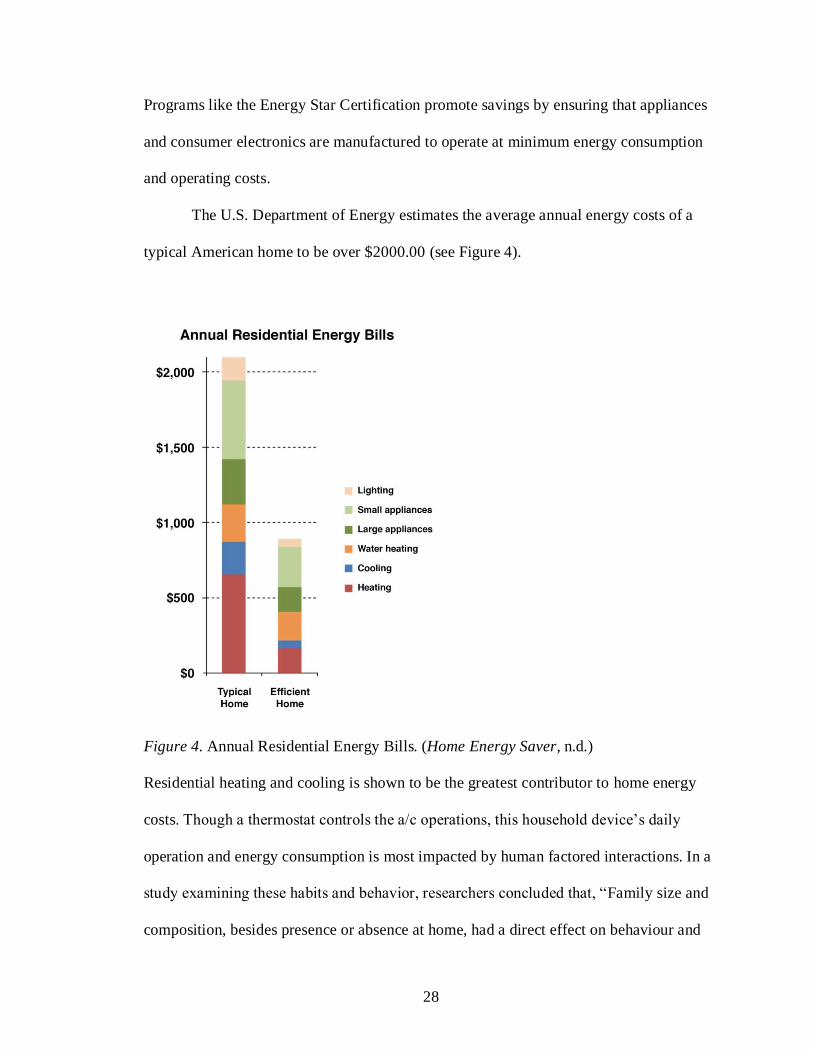
The U.S. Department of Energy estimates the average annual energy costs of a
typical American home to be over $2000.00 (see Figure 4).
Figure 4. Annual Residential Energy Bills. (Home Energy Saver, n.d.)
Residential heating and cooling is shown to be the greatest contributor to home energy
costs. Though a thermostat controls the a/c operations, this household device‘s daily
operation and energy consumption is most impacted by human factored interactions. In a
study examining these habits and behavior, researchers concluded that, ―Family size and
composition, besides presence or absence at home, had a direct effect on behaviour and

29
energy consumption‖ (Guerra, 2010, p. 125). The question of what motivates a change in
technology usage habits and energy consumption at home seems clear: Monetary savings
is of much greater value to the average American than conserving the resources required
to supply their homes with energy (i.e., oil, gas, water).
30
CHAPTER IV
METHODS
The quantitative study performed for the purpose of this thesis research will
attempt to discover if visual cues and UX are capable of altering a household‘s daily
water consumption behaviors. Participants of a 3-month study will be provided an iPod
Touch with a preinstalled version of the Water Watch app, designed exclusively for this
research. The focus of the app‘s UI and UX will be to aid study participants in making
informed, more conservation minded decisions about their home water usage.
Explanation and Validity of Exploratory Research
The research study and data collection conducted for this thesis project will be
exploratory in nature. This data gathering method is often used when there is a need to
gain qualitative data from a relatively small sample size. Business and Law Professor
Martyn Denscombe explains, ―An exploratory sample is used as a way of probing
relatively unexplored topics and as a route to the discovery of new ideas or theories‖
(2010, p. 24). Denscombe goes on to write, ―The point of the sample is to provide the
researcher with a means for generating insights and information‖ (2010, p. 24). The
insights and information Denscombe points to provide researchers with the ability to
determine the validity of conducting further full-scale scientific studies.
The primary goal of exploratory research is to help expose flaws in study
methods, while collecting valuable observations and feedback. Most often, exploratory
research is used initially to clarify and define the problem rather than to provide
conclusive evidence. (Hyman, 2010, p. 39). Though the results of the exploratory method
31
cannot be considered definitive, they are extremely valuable in creating a foundation for
the ongoing research of this thesis project.
Pre-Study Executions and Logistics
In order to conduct this research study, there are a number of logistical matters
that must be addressed prior to its commencement. This includes items such as the
purchase of five iPod Touch devices, the preparation of applicable legal consent forms
for study participants, establishment of criteria for study eligibility, and creation of
methods for water volume data collection and distribution during the study period.
Study Consent
Since all participant households will be water customers of New Braunfels
Utilities (NBU), written legal consent is required from each. The NBU legal department
will assist in drafting a consent form granting the utility provider permission to release
participant account information for the purposes of this research. Each participating NBU
account holder will be required to sign this document before they are authorized to take
part in this study. The specific account information of each participant released by NBU
to this research will include:
• Monthly water consumption volumes for the years 2010, 2011, and 2012;
• Daily water consumption volumes for the study period of July, August,
and September 2013;
• Monthly water consumption volumes for 6-months following the
completion of the study period.
Study Population Criteria
Each of the five participating households will be selected based on their ability to
meet four requirements. First, they must have received water services from NBU for a
32
minimum of 3-years prior to the study period. Second, their homes must have smart water
meters installed. Third, each household will be required to have a wireless internet
connection for the duration of the study period. Finally, they must agree to the terms and
conditions of the consent form as defined by NBU. In addition to the consent form,
participants will be provided with a document explaining the guidelines of thesis data
gathering under Texas State University policy. This will include information regarding
the non-disclosure of participant‘s personal information and/or likeness in the final
published research.
When selecting households for this research study, it will be important to identify
potential candidates that have little or no prior relationship with the researcher. This is
critical because it will help prevent participants from altering their water consumption
habits during the study period based on assumptions they may have about a preferred
outcome of this research. In other words, participating households may believe that the
expected outcome of this study is to demonstrate a reduction in water consumption based
on prior interactions or conversations with the researcher. As a result, they may be
inclined to involuntarily change their water usage habits during the study in order to help
provide this research with results that they believe to be considered as favorable.
Data Collection, Distribution, and Acknowledgment
Water volume data for each participating home will be received via email from
NBU each night at 8:30pm in spreadsheet format. This efficient data delivery method is
made possible by the capabilities of the smart water meters installed at each home.
Without the wireless connectivity of the smart water meters, data collection for this study
would require physically reading meters at participating homes each day.
33
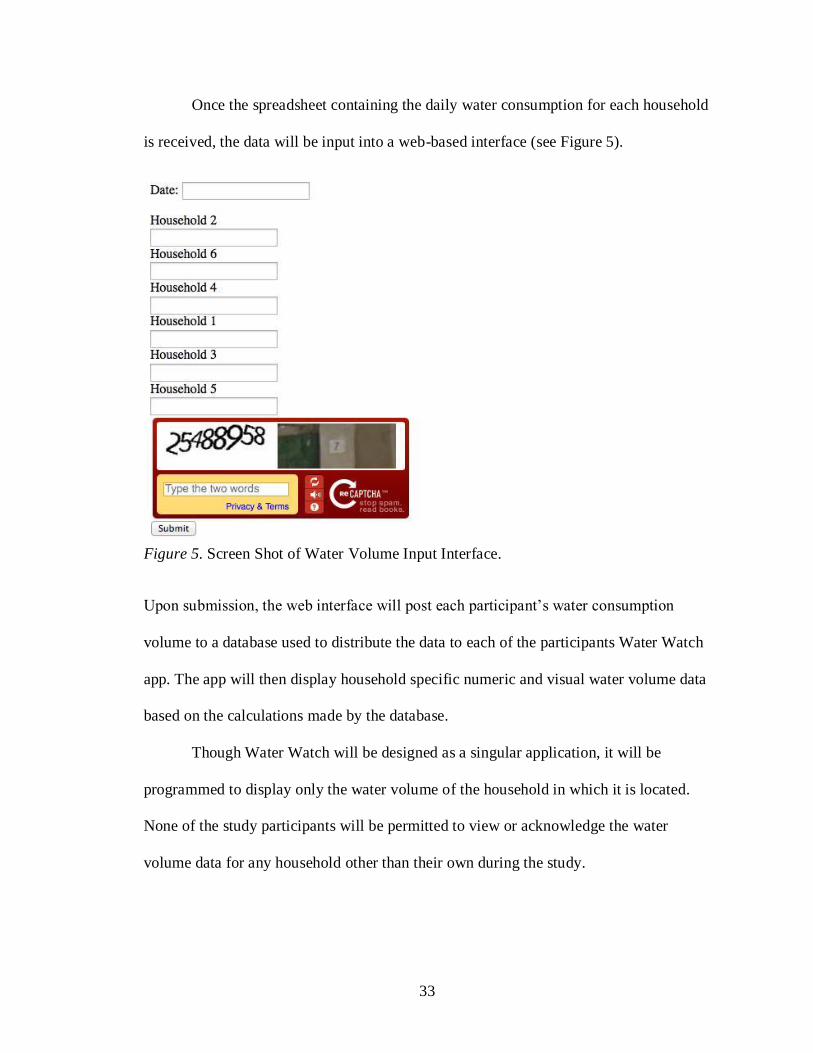
Once the spreadsheet containing the daily water consumption for each household
is received, the data will be input into a web-based interface (see Figure 5).
Figure 5. Screen Shot of Water Volume Input Interface.
Upon submission, the web interface will post each participant‘s water consumption
volume to a database used to distribute the data to each of the participants Water Watch
app. The app will then display household specific numeric and visual water volume data
based on the calculations made by the database.
Though Water Watch will be designed as a singular application, it will be
programmed to display only the water volume of the household in which it is located.
None of the study participants will be permitted to view or acknowledge the water
volume data for any household other than their own during the study.
34
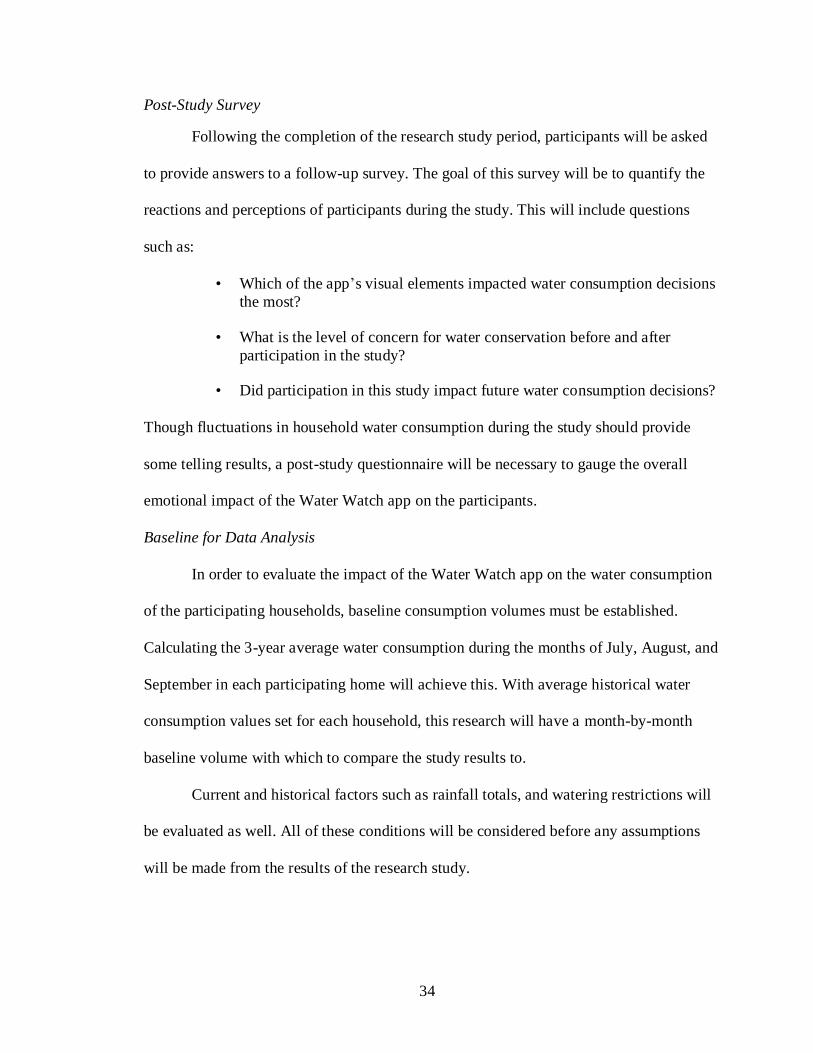
Post-Study Survey
Following the completion of the research study period, participants will be asked
to provide answers to a follow-up survey. The goal of this survey will be to quantify the
reactions and perceptions of participants during the study. This will include questions
such as:
• Which of the app‘s visual elements impacted water consumption decisions
the most?
• What is the level of concern for water conservation before and after
participation in the study?
• Did participation in this study impact future water consumption decisions?
Though fluctuations in household water consumption during the study should provide
some telling results, a post-study questionnaire will be necessary to gauge the overall
emotional impact of the Water Watch app on the participants.
Baseline for Data Analysis
In order to evaluate the impact of the Water Watch app on the water consumption
of the participating households, baseline consumption volumes must be established.
Calculating the 3-year average water consumption during the months of July, August, and
September in each participating home will achieve this. With average historical water
consumption values set for each household, this research will have a month-by-month
baseline volume with which to compare the study results to.
Current and historical factors such as rainfall totals, and watering restrictions will
be evaluated as well. All of these conditions will be considered before any assumptions
will be made from the results of the research study.
35
Water Watch App Design
The primary function of the Water Watch app will be to communicate a
household‘s daily water consumption in a way that allows its users to gain a greater
understanding of their actual volumes. The app will provide users with relatable visual
cues in an effort to guide them towards making their own decisions about how they
consume water at home.
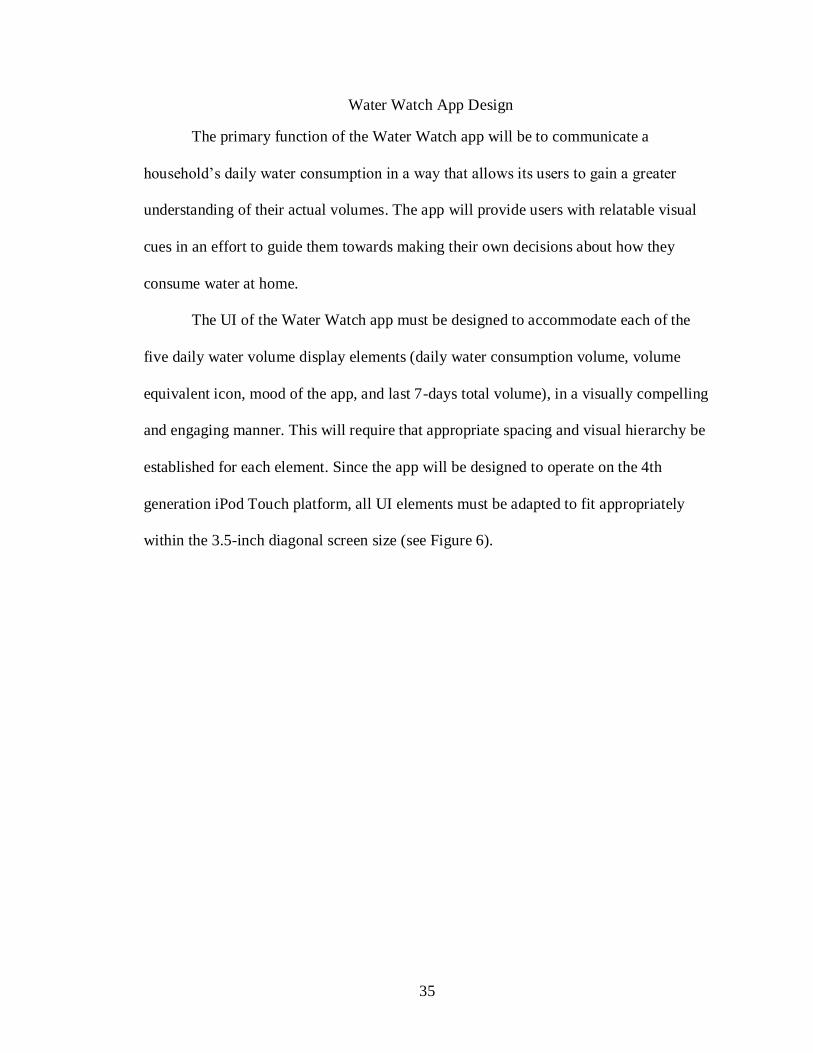
The UI of the Water Watch app must be designed to accommodate each of the
five daily water volume display elements (daily water consumption volume, volume
equivalent icon, mood of the app, and last 7-days total volume), in a visually compelling
and engaging manner. This will require that appropriate spacing and visual hierarchy be
established for each element. Since the app will be designed to operate on the 4th
generation iPod Touch platform, all UI elements must be adapted to fit appropriately
within the 3.5-inch diagonal screen size (see Figure 6).
36
Figure 6. Water Watch UI Displayed on the 4th Generation iPod Touch.
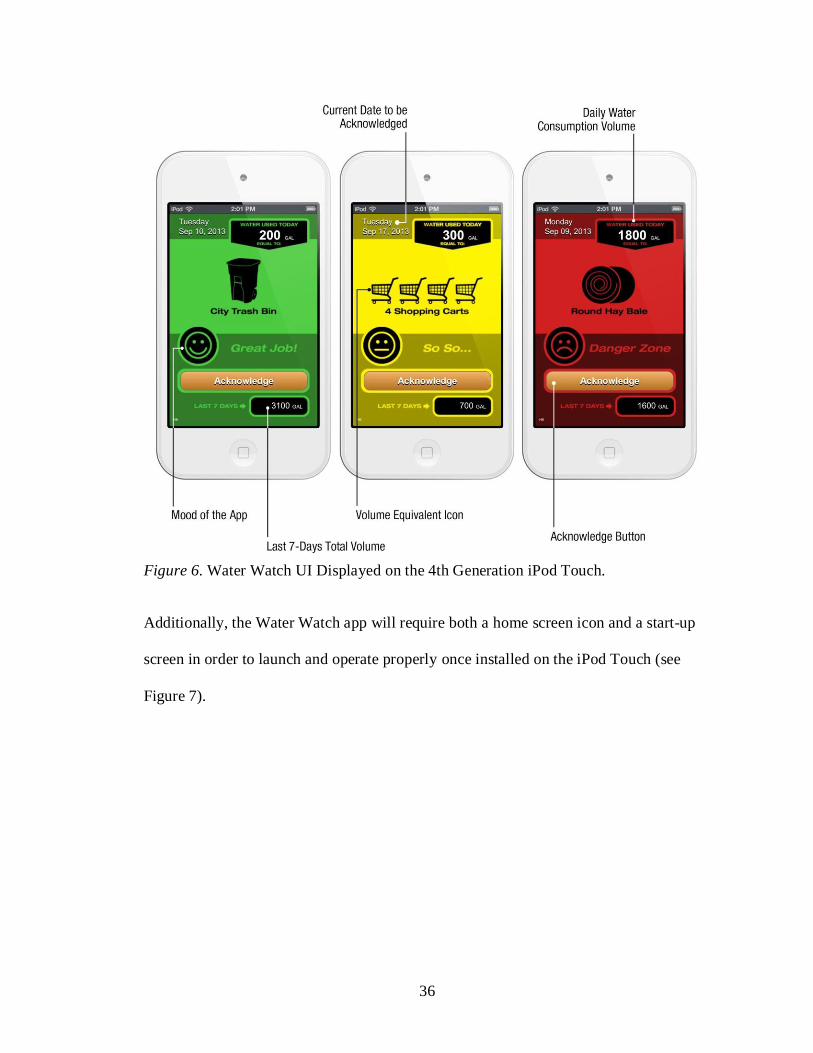
Additionally, the Water Watch app will require both a home screen icon and a start-up
screen in order to launch and operate properly once installed on the iPod Touch (see
Figure 7).
37
Figure 7. Water Watch Icon and Launch Screen on iPod Touch.
Daily Water Consumption Volume
The daily water volume will be displayed in the upper-right corner of the app each
day (see Figure 6). Because of the systems NBU currently has in place, some of the smart
water meters display a home‘s water consumption where an increase of one metered unit
equals 100 gallons. While in another home, one metered unit can equal 10 gallons. Each
participating home‘s total daily water consumption value will be determined by a
database calculation of the current days water meter read subtracted from the previous
day, and then multiplied by 10 or 100 (depending on the participants meter type). For
example, the current day‘s water usage report for a single home may show a meter
reading value of 1398; while the previous day read was 1390. Once the current and
previous days values are subtracted and multiplied by 100, the Water Watch app will
38
display the current days water consumption value as 800 gallons (e.g., [1398 - 1390] x
100 = 800).
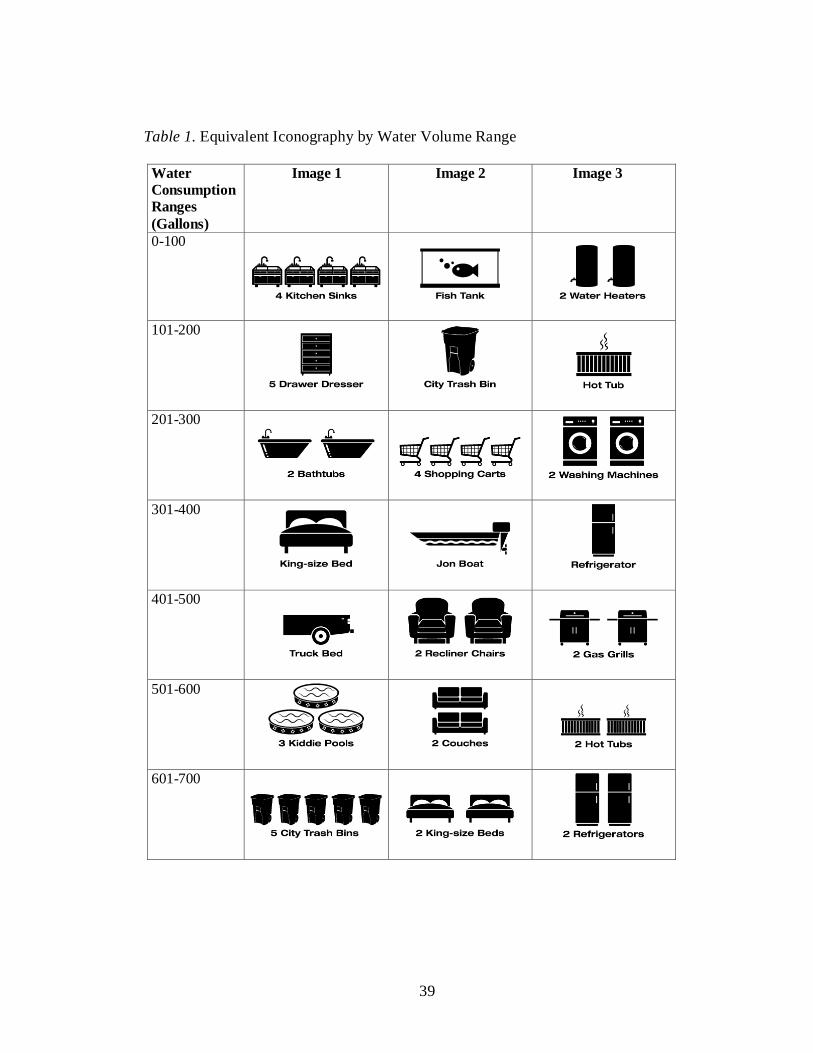
Volume Equivalent Icon
The volume equivalent icon displayed in the Water Watch app will consume the
largest portion of the apps UI (see Figure 6). The intent of this iconography will be to
portray relatable visual references that are volumetrically equivalent to a given
households daily water usage. People may lack the ability to quickly equate their water
consumption volume to something familiar. In other words, people have an inadequate
visual frame of reference that would allow them to make a judgment about whether or not
they consider the amount of water they consumed to be a lot or a little. By displaying
more relevant, real life objects, these icons will provide participants with a visual
reference to help communicate water consumption.
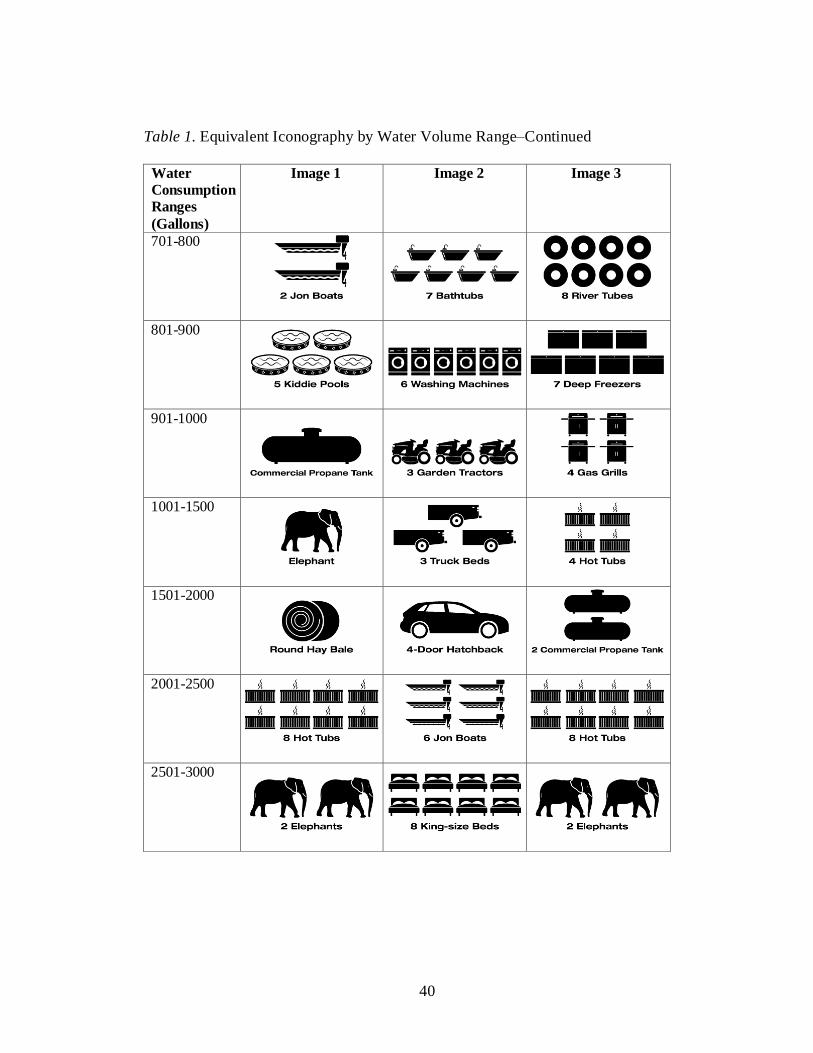
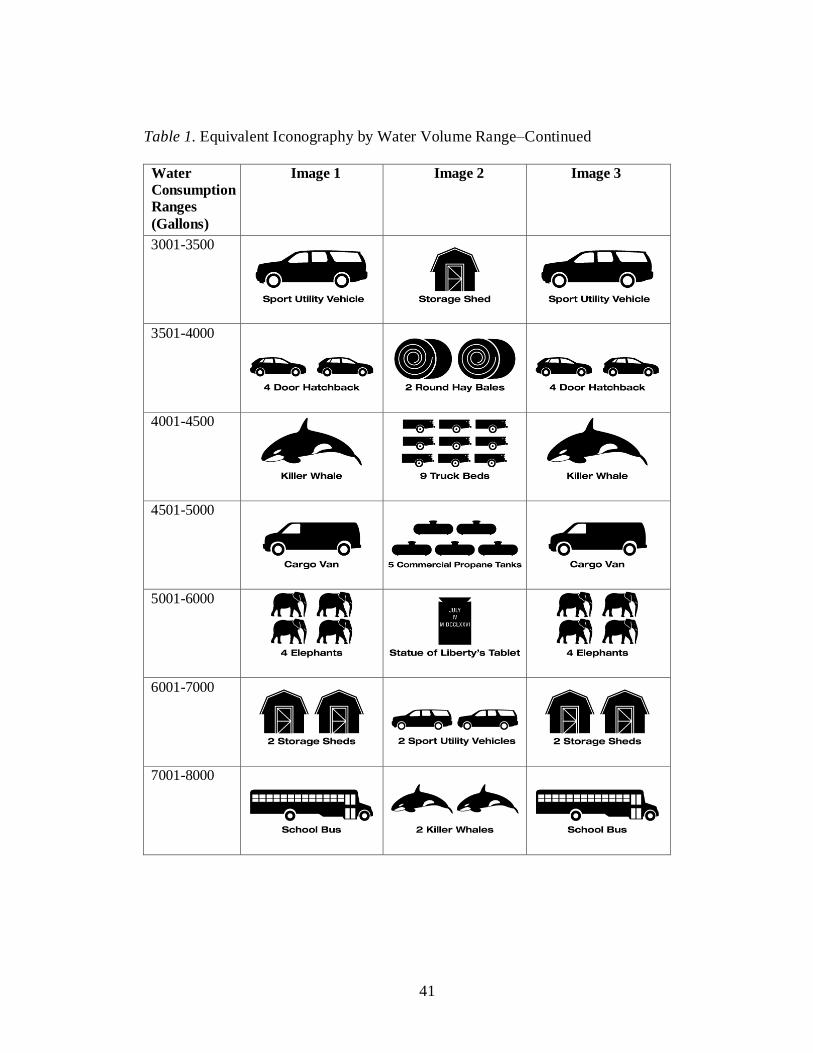
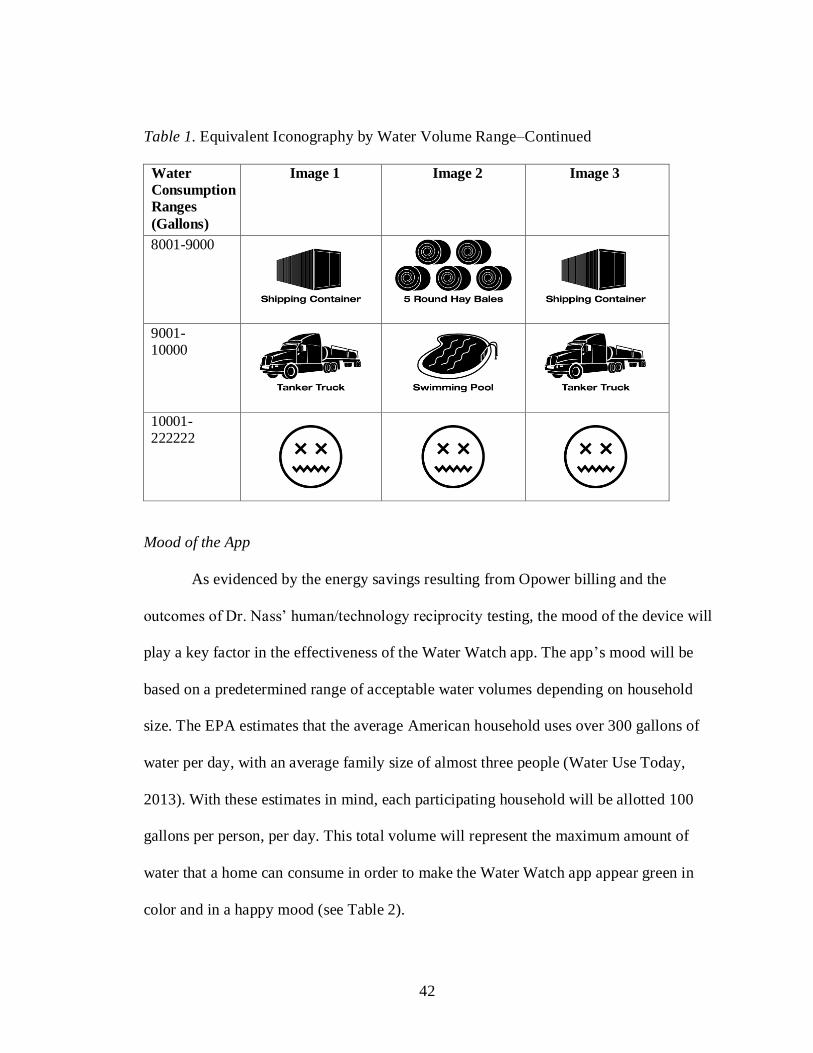
There will be up to three icons per predetermined volumetric range. Based on the
household‘s daily water consumption volume, Water Watch will randomly display one of
the three available icons from the appropriate volumetric range (see Table 1).
39
Table 1. Equivalent Iconography by Water Volume Range
Water
Consumption
Ranges
(Gallons)
Image 1 Image 2 Image 3
0-100
101-200
201-300
301-400
401-500
501-600
601-700
40
Table 1. Equivalent Iconography by Water Volume Range–Continued
Water
Consumption
Ranges
(Gallons)
Image 1 Image 2 Image 3
701-800
801-900
901-1000
1001-1500
1501-2000
2001-2500
2501-3000
41
Table 1. Equivalent Iconography by Water Volume Range–Continued
Water
Consumption
Ranges
(Gallons)
Image 1 Image 2 Image 3
3001-3500
3501-4000
4001-4500
4501-5000
5001-6000
6001-7000
7001-8000
42
Table 1. Equivalent Iconography by Water Volume Range–Continued
Water
Consumption
Ranges
(Gallons)
Image 1 Image 2 Image 3
8001-9000
9001-10000
10001-222222
Mood of the App
As evidenced by the energy savings resulting from Opower billing and the
outcomes of Dr. Nass‘ human/technology reciprocity testing, the mood of the device will
play a key factor in the effectiveness of the Water Watch app. The app‘s mood will be
based on a predetermined range of acceptable water volumes depending on household
size. The EPA estimates that the average American household uses over 300 gallons of
water per day, with an average family size of almost three people (Water Use Today,
2013). With these estimates in mind, each participating household will be allotted 100
gallons per person, per day. This total volume will represent the maximum amount of
water that a home can consume in order to make the Water Watch app appear green in
color and in a happy mood (see Table 2).
43
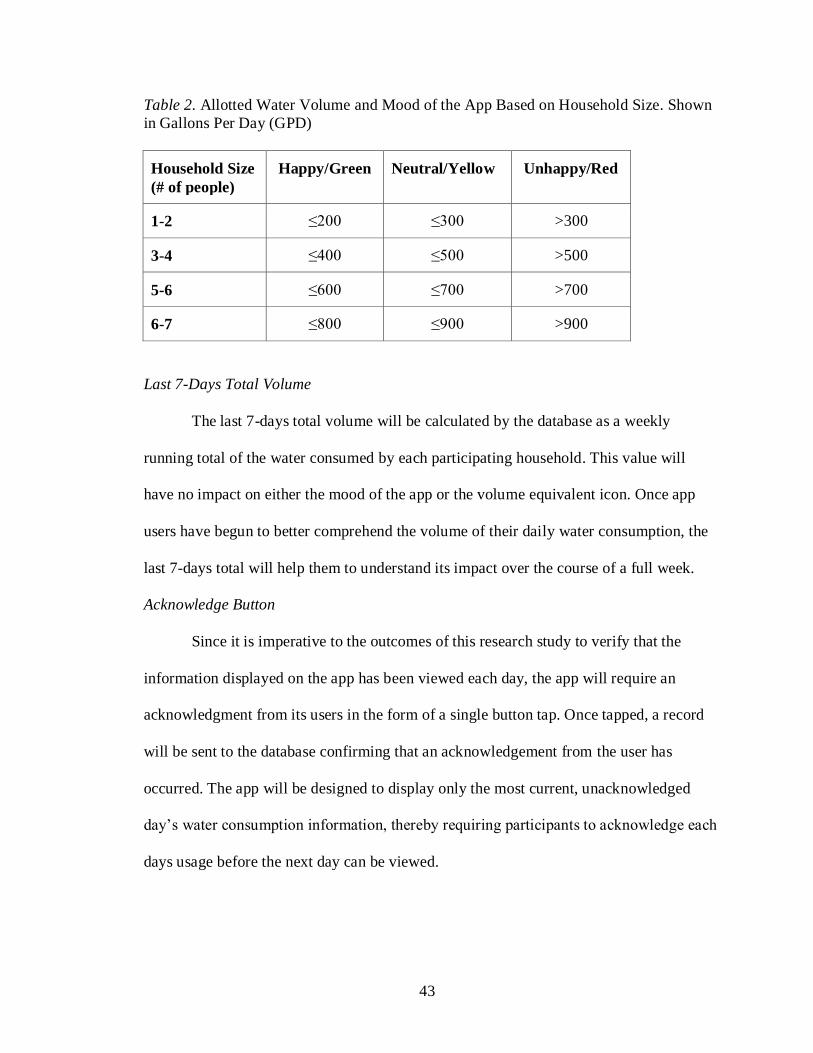
Table 2. Allotted Water Volume and Mood of the App Based on Household Size. Shown
in Gallons Per Day (GPD)
Household Size
(# of people)
Happy/Green
Neutral/Yellow Unhappy/Red
1-2 ≤200 ≤300 >300
3-4 ≤400 ≤500 >500
5-6 ≤600 ≤700 >700
6-7 ≤800 ≤900 >900
Last 7-Days Total Volume
The last 7-days total volume will be calculated by the database as a weekly
running total of the water consumed by each participating household. This value will
have no impact on either the mood of the app or the volume equivalent icon. Once app
users have begun to better comprehend the volume of their daily water consumption, the
last 7-days total will help them to understand its impact over the course of a full week.
Acknowledge Button
Since it is imperative to the outcomes of this research study to verify that the
information displayed on the app has been viewed each day, the app will require an
acknowledgment from its users in the form of a single button tap. Once tapped, a record
will be sent to the database confirming that an acknowledgement from the user has
occurred. The app will be designed to display only the most current, unacknowledged
day‘s water consumption information, thereby requiring participants to acknowledge each
days usage before the next day can be viewed.
44
CHAPTER V
RESULTS
This research study was conducted from July 1, 2013 to September 30, 2013 in
New Braunfels, Texas. Based on the study requirements, five households were identified
by the researcher and New Braunfels Utilities as authorized participants. Each household
was given an iPod Touch with the Water Watch app preinstalled on the device. After the
iPod was connected to their home‘s wireless network, participants were given
instructions on how the device and app would be used throughout the study.
Participants were told that between 8:30 pm and 9:30 pm each night, the Water
Watch app installed on their iPod Touch would display their household‘s total water
consumption for that day. They were then asked to review the information presented on
the Water Watch UI and tap a single button, acknowledging that they had done so (see
Figure 6). This process only required one to two minutes of the participants time each
day.
Additionally, each participant was given a brief tutorial on the operation of the
iPod Touch. This included instructions on charging the device as well as launching the
Water Watch app should the app be closed or the iPod be turned off. Participants were
given contact information for the researcher in the event that they experienced any issues
during the study period. Furthermore, as a show of appreciation for their involvement in
this study, participants were told that they would be allowed to keep the iPod Touch for
personal use after completing the study.
45
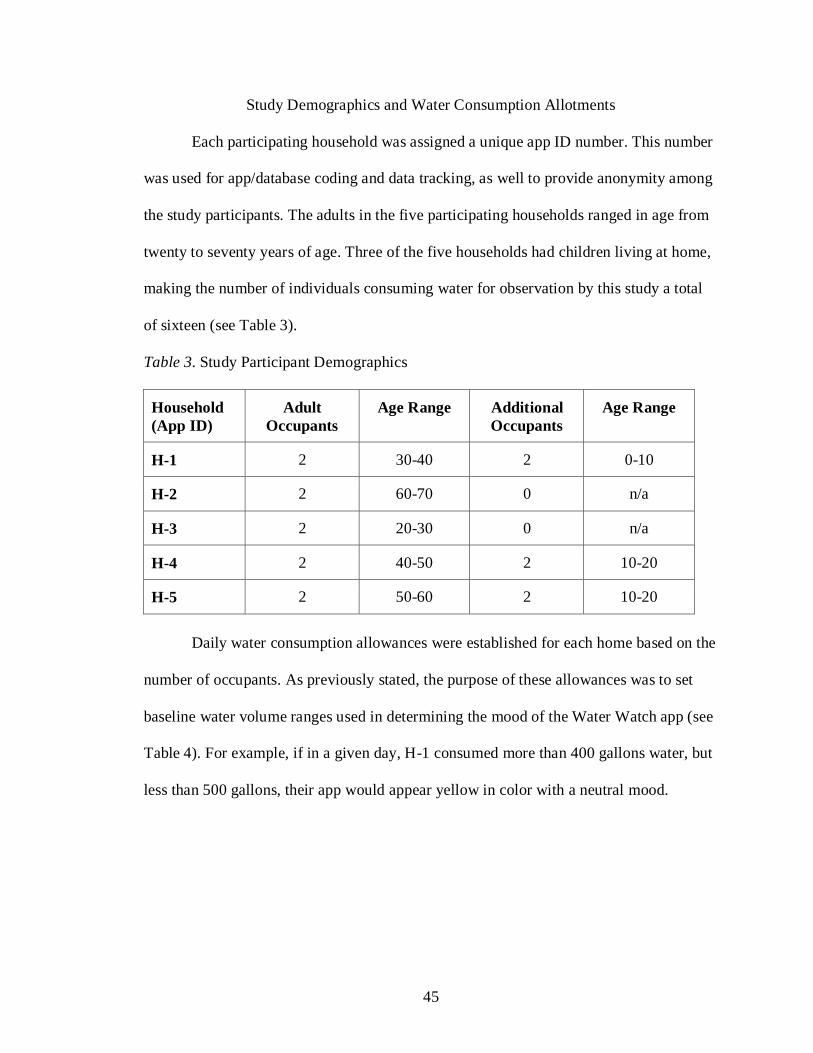
Study Demographics and Water Consumption Allotments
Each participating household was assigned a unique app ID number. This number
was used for app/database coding and data tracking, as well to provide anonymity among
the study participants. The adults in the five participating households ranged in age from
twenty to seventy years of age. Three of the five households had children living at home,
making the number of individuals consuming water for observation by this study a total
of sixteen (see Table 3).
Table 3. Study Participant Demographics
Household
(App ID)
Adult
Occupants
Age Range Additional
Occupants
Age Range
H-1 2 30-40 2 0-10
H-2 2 60-70 0 n/a
H-3 2 20-30 0 n/a
H-4 2 40-50 2 10-20
H-5 2 50-60 2 10-20
Daily water consumption allowances were established for each home based on the
number of occupants. As previously stated, the purpose of these allowances was to set
baseline water volume ranges used in determining the mood of the Water Watch app (see
Table 4). For example, if in a given day, H-1 consumed more than 400 gallons water, but
less than 500 gallons, their app would appear yellow in color with a neutral mood.
46
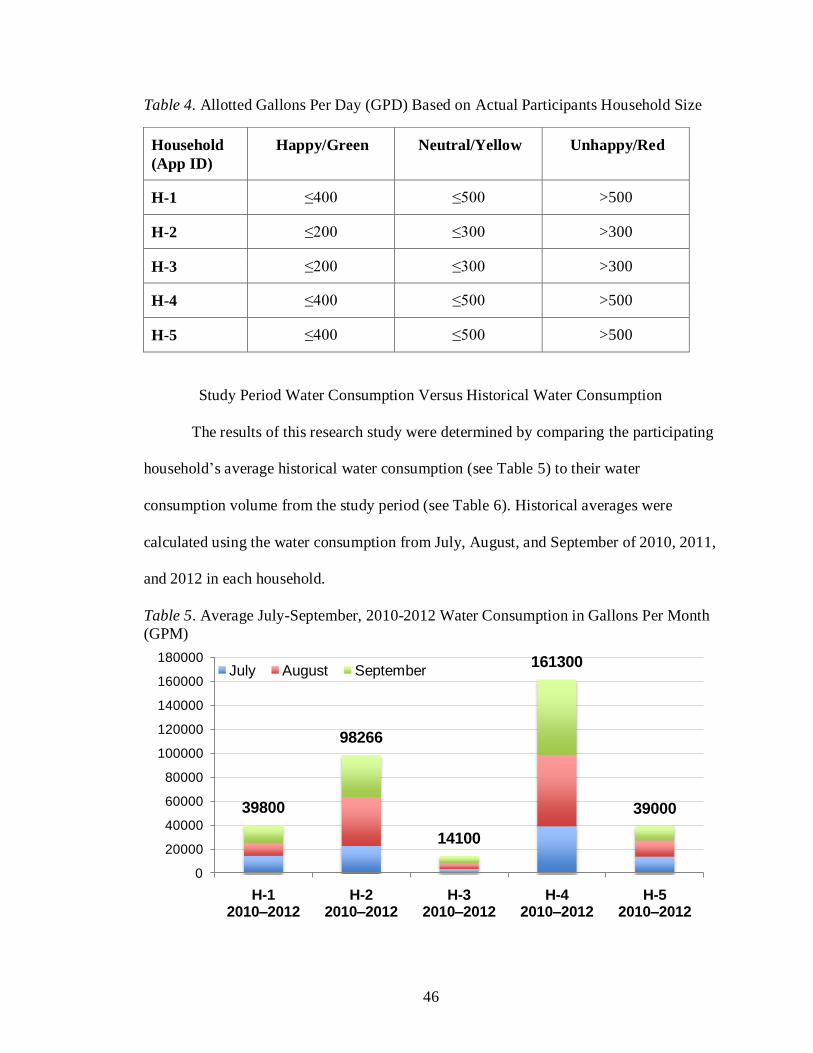
Table 4. Allotted Gallons Per Day (GPD) Based on Actual Participants Household Size
Household
(App ID)
Happy/Green Neutral/Yellow Unhappy/Red
H-1 ≤400 ≤500 >500
H-2 ≤200 ≤300 >300
H-3 ≤200 ≤300 >300
H-4 ≤400 ≤500 >500
H-5 ≤400 ≤500 >500
Study Period Water Consumption Versus Historical Water Consumption
The results of this research study were determined by comparing the participating
household‘s average historical water consumption (see Table 5) to their water
consumption volume from the study period (see Table 6). Historical averages were
calculated using the water consumption from July, August, and September of 2010, 2011,
and 2012 in each household.
Table 5. Average July-September, 2010-2012 Water Consumption in Gallons Per Month
(GPM)
39800
98266
14100
161300
39000
0
20000
40000
60000
80000
100000
120000
140000
160000
180000
H-12010–2012
H-22010–2012
H-32010–2012
H-42010–2012
H-52010–2012
July August September
47
Table 6. Actual Water Consumption in GPM During Study Period
(July-September, 2013)
The data indicates that study participants reduced their 3-month water
consumption by an average total of 43% during the research period (see Appendix A and
B). Study data revealed that over time, participants conserved greater amounts of water
while using the Water Watch app. In the first month, participants reported an average
total decrease in water consumption of 12%, but by the third month, that total improved
to 62%. In a longer study duration utilizing the Water Watch app, the water consumption
volume would begin to plateau, rather than continually decrease month-over-month.
Though compelling, these results cannot be substantiated until the mitigating factors of
the study period are examined.
Mitigating Factors
Certain mitigating circumstances must be considered when conducting a
quantitative study of this nature. In this study specifically, rainfall totals and the resulting
water use restrictions are the two factors most effecting each households water
consumption. It is critical to compare the rainfall totals from July, August, and September
29000
53800
8900
58700
22740
0
10000
20000
30000
40000
50000
60000
70000
H-12013
H-22013
H-32013
H-42013
H-52013
July August September
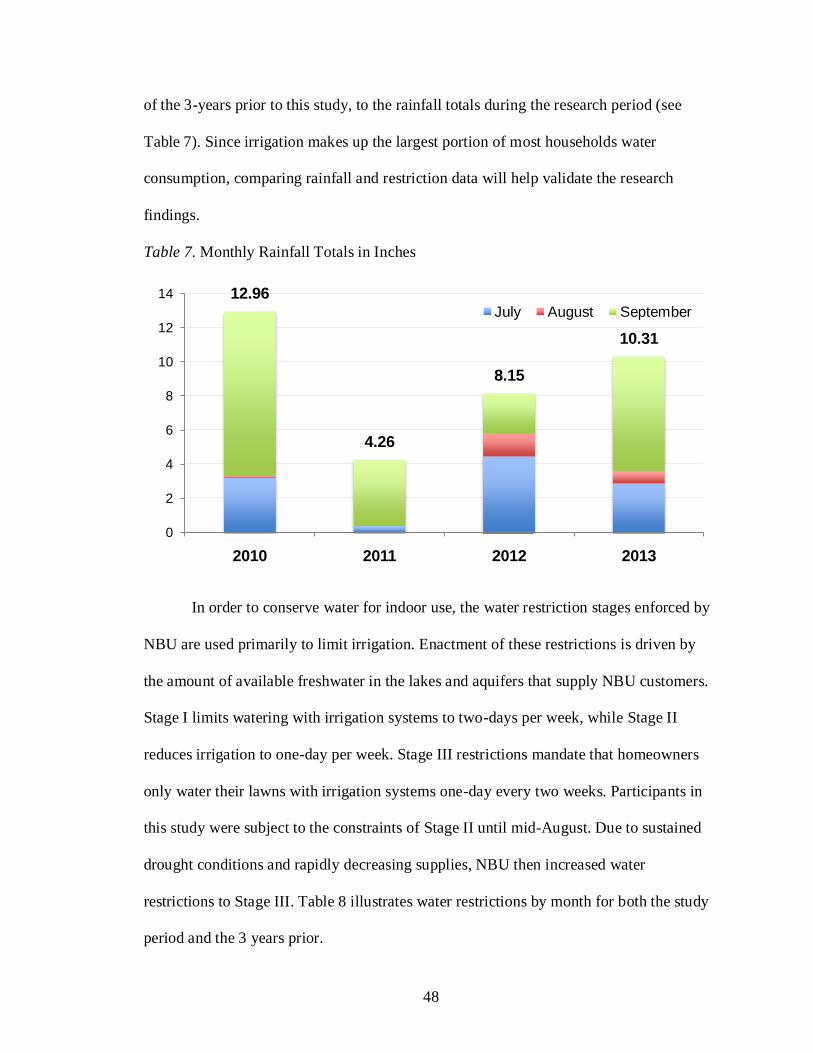
48
of the 3-years prior to this study, to the rainfall totals during the research period (see
Table 7). Since irrigation makes up the largest portion of most households water
consumption, comparing rainfall and restriction data will help validate the research
findings.
Table 7. Monthly Rainfall Totals in Inches
In order to conserve water for indoor use, the water restriction stages enforced by
NBU are used primarily to limit irrigation. Enactment of these restrictions is driven by
the amount of available freshwater in the lakes and aquifers that supply NBU customers.
Stage I limits watering with irrigation systems to two-days per week, while Stage II
reduces irrigation to one-day per week. Stage III restrictions mandate that homeowners
only water their lawns with irrigation systems one-day every two weeks. Participants in
this study were subject to the constraints of Stage II until mid-August. Due to sustained
drought conditions and rapidly decreasing supplies, NBU then increased water
restrictions to Stage III. Table 8 illustrates water restrictions by month for both the study
period and the 3 years prior.
12.96
4.26
8.15
10.31
0
2
4
6
8
10
12
14
2010 2011 2012 2013
July August September
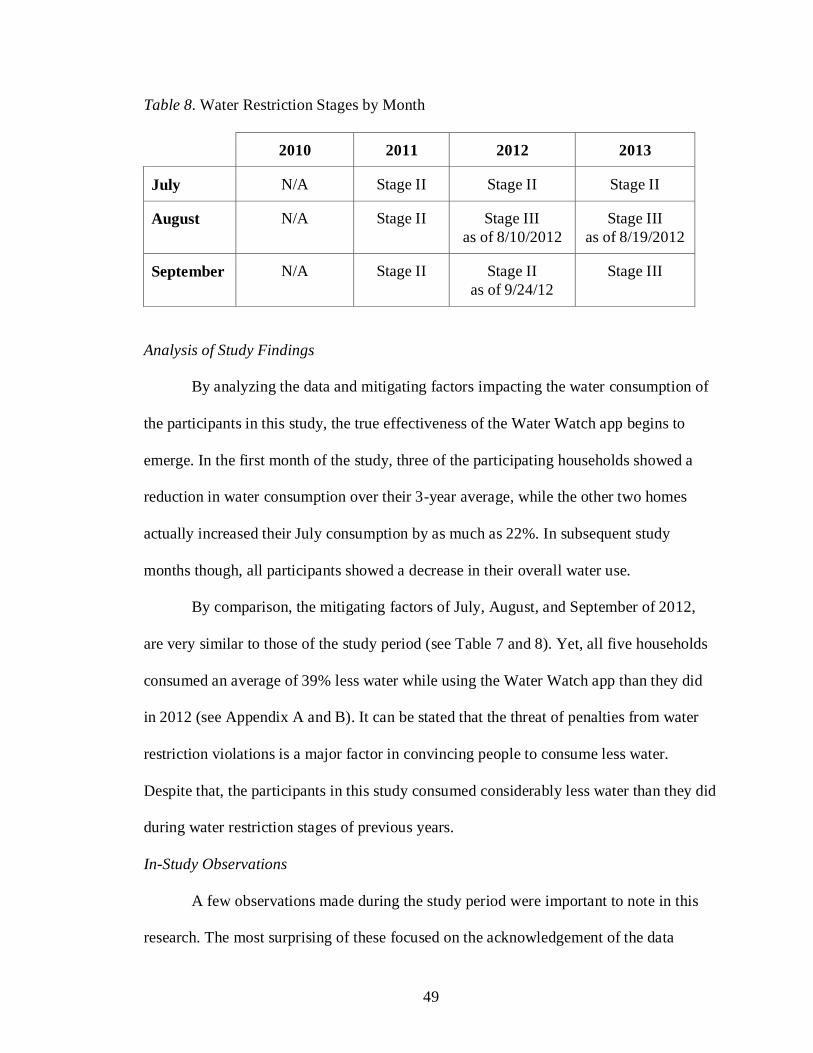
49
Table 8. Water Restriction Stages by Month
2010 2011 2012 2013
July N/A Stage II Stage II Stage II
August N/A Stage II Stage III
as of 8/10/2012
Stage III
as of 8/19/2012
September N/A Stage II Stage II
as of 9/24/12
Stage III
Analysis of Study Findings
By analyzing the data and mitigating factors impacting the water consumption of
the participants in this study, the true effectiveness of the Water Watch app begins to
emerge. In the first month of the study, three of the participating households showed a
reduction in water consumption over their 3-year average, while the other two homes
actually increased their July consumption by as much as 22%. In subsequent study
months though, all participants showed a decrease in their overall water use.
By comparison, the mitigating factors of July, August, and September of 2012,
are very similar to those of the study period (see Table 7 and 8). Yet, all five households
consumed an average of 39% less water while using the Water Watch app than they did
in 2012 (see Appendix A and B). It can be stated that the threat of penalties from water
restriction violations is a major factor in convincing people to consume less water.
Despite that, the participants in this study consumed considerably less water than they did
during water restriction stages of previous years.
In-Study Observations
A few observations made during the study period were important to note in this
research. The most surprising of these focused on the acknowledgement of the data
50
presented in the Water Watch app each day. Since the study was introducing people to a
new habit of checking and acknowledging their daily water consumption, the researcher
anticipated that there would be a need to provide frequent reminders to gain full
compliance. Though, that was not the case. Study participants acknowledged their water
consumption data daily, without requiring any intervention or reminder throughout the
study period. This occurrence indicated that either the study participants were able to
easily adopt new habits, or that they had a genuine interest in the Water Watch app UI
and its water consumption data.
The Water Watch app appeared to indicate a rise in water consumption awareness
by the participants. One example that provided evidence for this was an email received
on August 18, from participant H-2. H-2 shared concerns about the amount of water the
Water Watch app was reporting by stating:
Unbelievable we have a water leak. I am sure you noticed that we had been
running 1000, 500, 500, and we were only watering by hand 30 minutes. This
morning we turned everything in the house off and the water meter was still going
slowly. At 8:00 we will call a Plumber to fix our leak. Your little program may
have saved us a lot of money. Thank you. (Study Participant H-2, personal
communication, August 22, 2013)
This communication was very encouraging, as it reinforced the value of more real time
water consumption data. Because of the observation made by H-2, they were able to
quickly identify that they had a water leak. This alertness not only saved them money on
their water bill, but it also prevented thousands of gallons of water from being wasted.
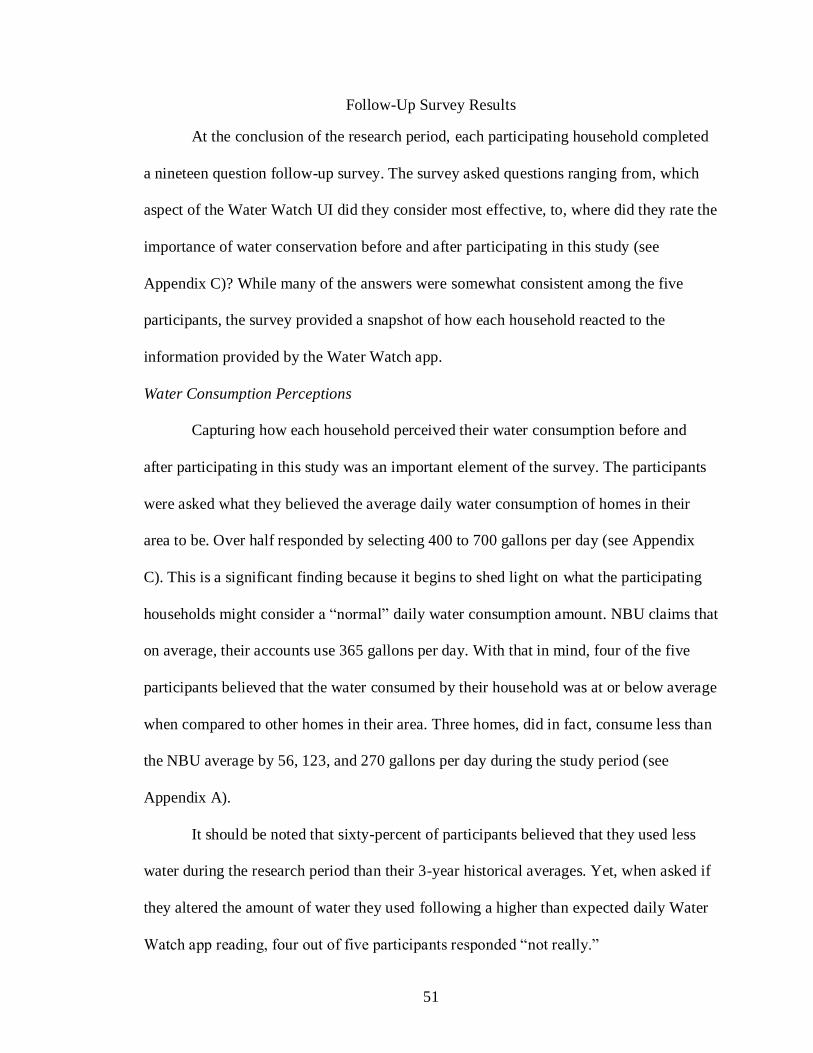
51
Follow-Up Survey Results
At the conclusion of the research period, each participating household completed
a nineteen question follow-up survey. The survey asked questions ranging from, which
aspect of the Water Watch UI did they consider most effective, to, where did they rate the
importance of water conservation before and after participating in this study (see
Appendix C)? While many of the answers were somewhat consistent among the five
participants, the survey provided a snapshot of how each household reacted to the
information provided by the Water Watch app.
Water Consumption Perceptions
Capturing how each household perceived their water consumption before and
after participating in this study was an important element of the survey. The participants
were asked what they believed the average daily water consumption of homes in their
area to be. Over half responded by selecting 400 to 700 gallons per day (see Appendix
C). This is a significant finding because it begins to shed light on what the participating
households might consider a ―normal‖ daily water consumption amount. NBU claims that
on average, their accounts use 365 gallons per day. With that in mind, four of the five
participants believed that the water consumed by their household was at or below average
when compared to other homes in their area. Three homes, did in fact, consume less than
the NBU average by 56, 123, and 270 gallons per day during the study period (see
Appendix A).
It should be noted that sixty-percent of participants believed that they used less
water during the research period than their 3-year historical averages. Yet, when asked if
they altered the amount of water they used following a higher than expected daily Water
Watch app reading, four out of five participants responded ―not really.‖
52
Water Watch App UI Elements
One primary goal of this survey was to attempt to identify which of the Water
Watch apps four visual elements (daily water consumption volume, volume equivalent
icon, mood of the app, last 7 days value) had the greatest impact on the participants‘
water usage. From the survey responses, that identification remains unclear with two of
the participants noting that the daily water consumption volume was most helpful in
understanding their water use. Two others claimed that the volume equivalent icon
helped them the most, while the fifth benefited most from the mood of the app. However,
when asked if the volume equivalent icon gave them a greater understanding of the
amount of water they used daily, four of the five participants responded ―yes‖.
Consequently, none of the participants were able to recall the largest volume equivalent
icon that appeared on their app during the study period.
Emotional Connection
With regards to the emotional connection between the Water Watch app and its
users, the survey provided interesting results. When asked how they felt about viewing
and acknowledging their household‘s daily water consumption, two participants
responded that they did not have strong feelings about it, while three responded that they
looked forward to it. In contrast, when asked how they felt if on a given day, their actual
water consumption was higher than what they anticipated it to be, most participants
answered either that they were ―concerned‖ or ―irritated.‖ Almost all of the participants
indicated that if technology similar to the Water Watch app were available through their
utility provider, most would utilize it on a weekly basis.
53
Overall Reactions
All of the households responded positively to the survey question regarding their
overall reactions to participation in this study. H-2 and H-4 noted that they gained a
greater understanding of the amount of water used by items at their homes like sprinkler
systems and clothes washers. H-1 stated, ―I liked it. I think it‘s a good idea to educate
people on water and just how important it is‖ (see Appendix C).
54
CHAPTER VI
CONCLUSION
After considering human-technology interactions as well as the mitigating factors
impacting water use during the research period, this thesis research demonstrates that
visual communication and UX can help reduce residential water consumption. This
research supports the importance of making water consumption information more readily
available to residential water consumers. Furthermore, the combination of more real-time
data, relatable visual cues, and a willingness to reciprocate with technology create a
greater influence on human water consumption habits than simple monthly paper billing.
In an age that has seen mobile and digital technology become so integrated into
the daily human experience, it is logical to leverage the human-technology relationship
for conserving a resource as essential as water. People are often more concerned about
the remaining battery life of their mobile phone than they are of the remaining amount of
drinkable water available to sustain their own lives. In his novel, The Picture of Dorian
Gray, Oscar Wilde wrote, ―Nowadays people know the price of everything, and the value
of nothing‖ (Murray, Wilde, 2000). His statement is particularly true with regard to the
earth‘s freshwater supply. Like other natural resources, people have taken the
convenience and low-cost of freshwater for granted for too long. With factors like rapid
population growth, water waste/contamination, and climate change, it is more crucial
than ever that water conservation practices become much more common.
55
Further Research
Though the outcomes of this research were positive, further development of the
Water Watch app can improve its effectiveness in helping reduce residential water
consumption. Due to the limitations of the exploratory research method, the findings of
this research study cannot be considered definitive. Because of this, a study with a
sampling size of 50-100 participants should occur to scientifically validate its results.
One key consideration in future developments of the Water Watch app is its
ability to learn and adapt based on a household‘s water consumption. Like the technology
available in the Nest thermostat, the app can help conserve more water by providing
individualized feedback based on the learned water usage habits of the home. In order to
accomplish this, the Water Watch app would require more home-specific data. This could
include property size, user ages, and an ability to monitor the individual sources that draw
water in the home (i.e. faucets, dishwashers, etc.). User age is an important factor for
future iterations of the Water Watch app to consider. This user aspect will allow the app
to tailor its feedback more effectively. For example, children can perhaps learn and
respond to the information provided by the app if the UI is presented more like a game or
animation. Conversely, adults may prefer the water consumption feedback to be
displayed as practical water saving tips with more information and links to additional
resources.
Further exploration of the smart water meter‘s data transfer capabilities will
provide a number of new possibilities for the Water Watch app. Similar to Opower‘s
billing statements, app users could begin to compare their water consumption to that of
their neighbors, even on a more real-time basis. In addition to the app, the data provided
56
by the smart water meters could be displayed on a variety of internet-connected
interfaces. These systems would allow for real-time management of household water
consumption, even when users are away from the home.
The survey question regarding which of the Water Watch apps elements affected
the participant‘s water consumption the most proved to be inconclusive. To identify if the
daily water consumption volume, volume equivalent icon, mood of the app, last 7-day
value, or the daily acknowledgement had the greatest impact, further testing is required.
In future studies, each app element would be tested independently in order to identify
which one resulted in the highest reduction of water consumption.
Finally, NBU and the participants of this study have authorized this research to
record their water consumption volumes for six months following the completion of this
study. That participant water volume data will be compared to their 2010, 2011, and 2012
water usage of the same period. The objective is to understand if the study participants
continue to reduce their monthly water consumption even after the Water Watch app is
no longer available to them. This will demonstrate whether or not the app was able to
provide lasting education and experiences with its users.
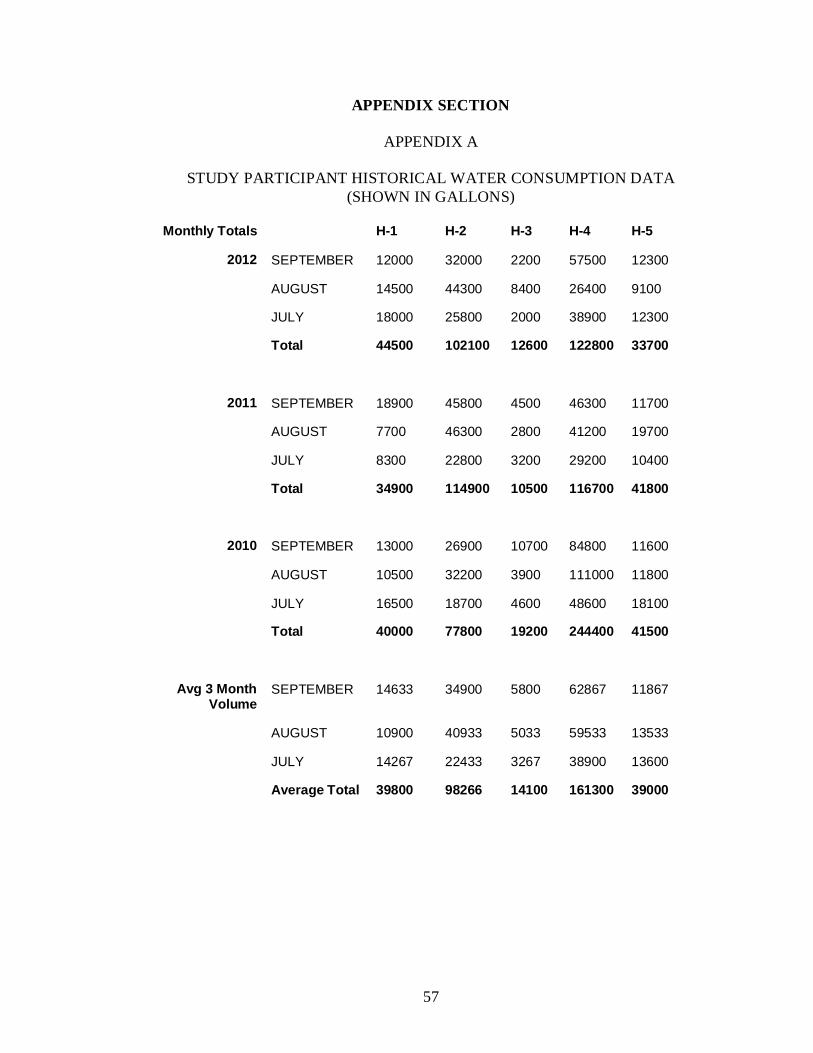
57
APPENDIX SECTION
APPENDIX A
STUDY PARTICIPANT HISTORICAL WATER CONSUMPTION DATA
(SHOWN IN GALLONS)
Monthly Totals H-1 H-2 H-3 H-4 H-5
2012 SEPTEMBER 12000 32000 2200 57500 12300
AUGUST 14500 44300 8400 26400 9100
JULY 18000 25800 2000 38900 12300
Total 44500 102100 12600 122800 33700
2011 SEPTEMBER 18900 45800 4500 46300 11700
AUGUST 7700 46300 2800 41200 19700
JULY 8300 22800 3200 29200 10400
Total 34900 114900 10500 116700 41800
2010 SEPTEMBER 13000 26900 10700 84800 11600
AUGUST 10500 32200 3900 111000 11800
JULY 16500 18700 4600 48600 18100
Total 40000 77800 19200 244400 41500
Avg 3 Month Volume
SEPTEMBER 14633 34900 5800 62867 11867
AUGUST 10900 40933 5033 59533 13533
JULY 14267 22433 3267 38900 13600
Average Total 39800 98266 14100 161300 39000
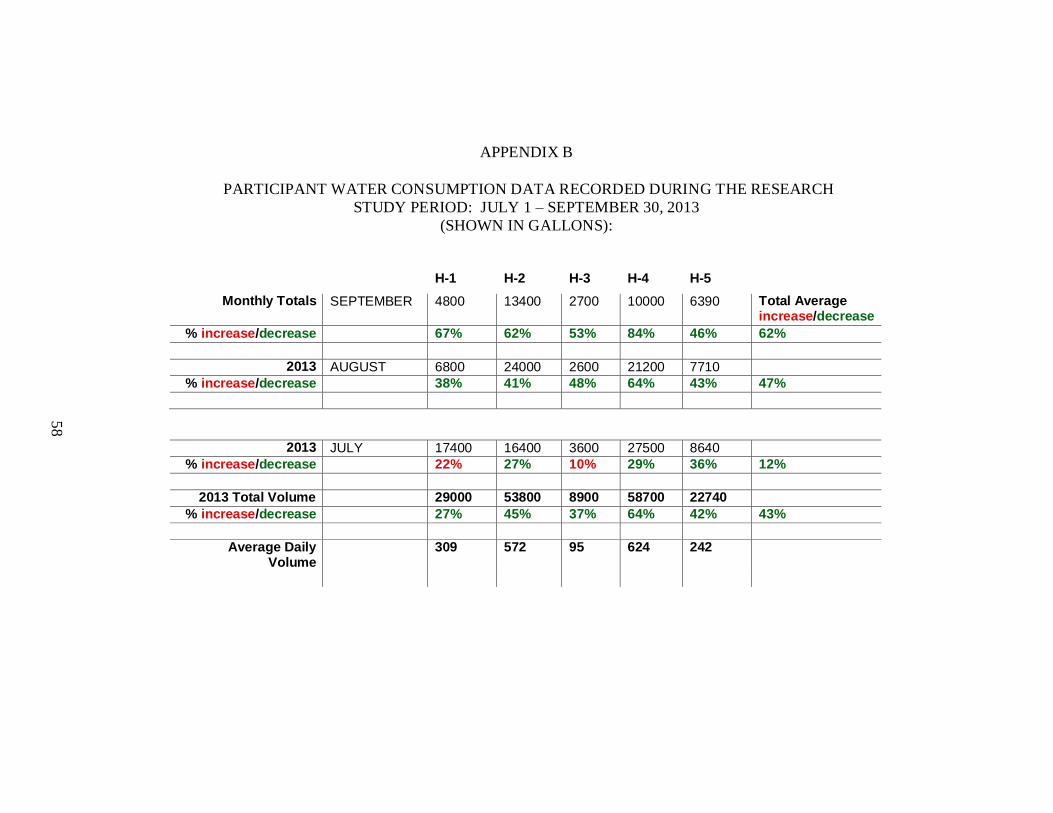
58
APPENDIX B
PARTICIPANT WATER CONSUMPTION DATA RECORDED DURING THE RESEARCH
STUDY PERIOD: JULY 1 – SEPTEMBER 30, 2013
(SHOWN IN GALLONS):
H-1 H-2 H-3 H-4 H-5
Monthly Totals SEPTEMBER 4800 13400 2700 10000 6390 Total Average increase/decrease
% increase/decrease 67% 62% 53% 84% 46% 62%
2013 AUGUST 6800 24000 2600 21200 7710
% increase/decrease 38% 41% 48% 64% 43% 47%
2013 JULY 17400 16400 3600 27500 8640
% increase/decrease 22% 27% 10% 29% 36% 12%
2013 Total Volume 29000 53800 8900 58700 22740
% increase/decrease 27% 45% 37% 64% 42% 43%
Average Daily Volume
309 572 95 624 242
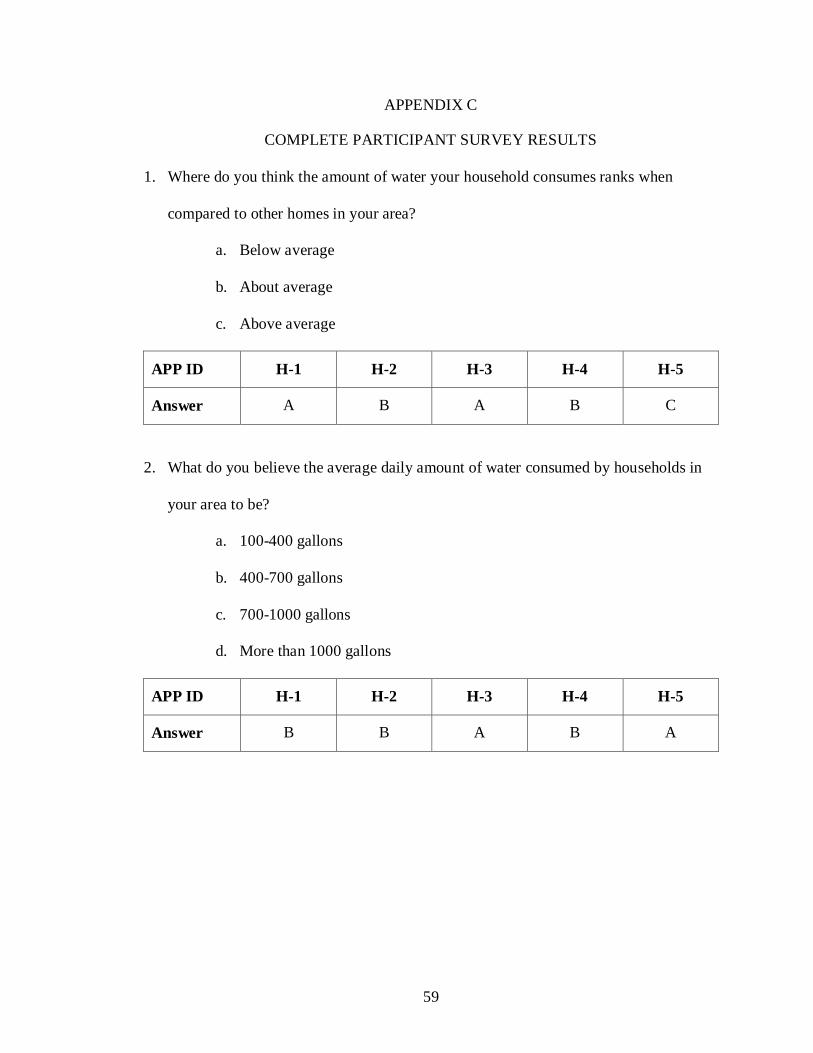
59
APPENDIX C
COMPLETE PARTICIPANT SURVEY RESULTS
1. Where do you think the amount of water your household consumes ranks when
compared to other homes in your area?
a. Below average
b. About average
c. Above average
APP ID H-1 H-2 H-3 H-4 H-5
Answer A B A B C
2. What do you believe the average daily amount of water consumed by households in
your area to be?
a. 100-400 gallons
b. 400-700 gallons
c. 700-1000 gallons
d. More than 1000 gallons
APP ID H-1 H-2 H-3 H-4 H-5
Answer B B A B A
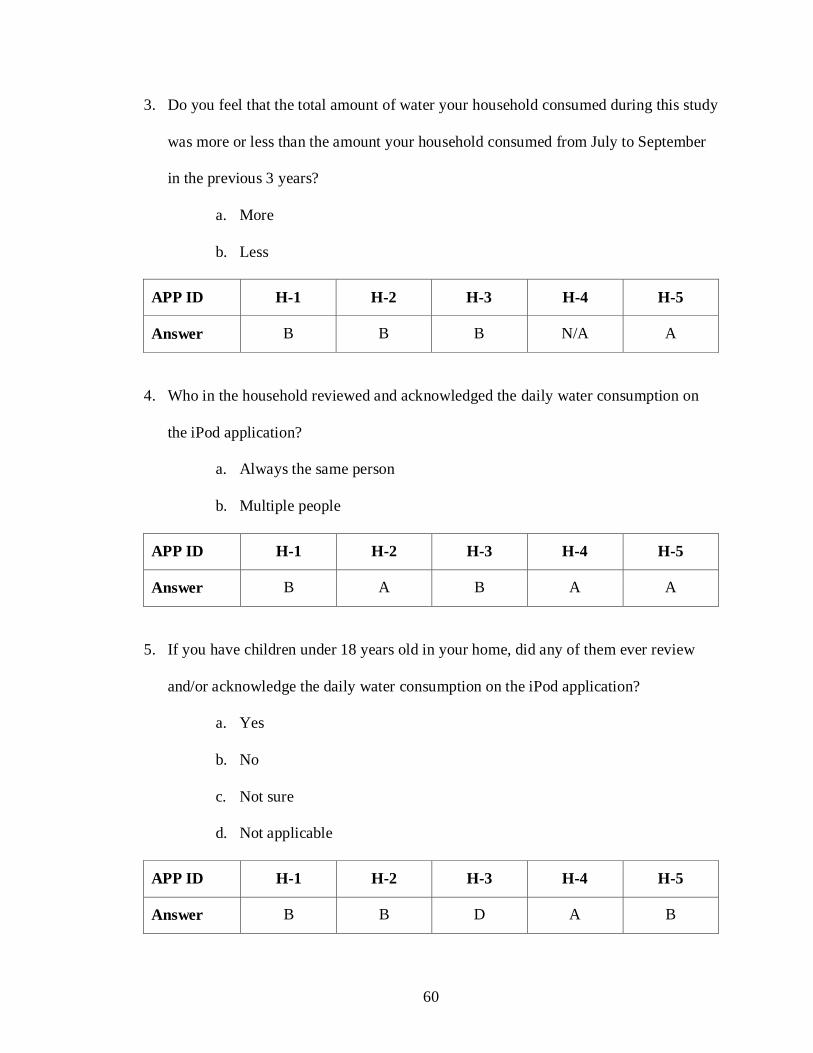
60
3. Do you feel that the total amount of water your household consumed during this study
was more or less than the amount your household consumed from July to September
in the previous 3 years?
a. More
b. Less
APP ID H-1 H-2 H-3 H-4 H-5
Answer B B B N/A A
4. Who in the household reviewed and acknowledged the daily water consumption on
the iPod application?
a. Always the same person
b. Multiple people
APP ID H-1 H-2 H-3 H-4 H-5
Answer B A B A A
5. If you have children under 18 years old in your home, did any of them ever review
and/or acknowledge the daily water consumption on the iPod application?
a. Yes
b. No
c. Not sure
d. Not applicable
APP ID H-1 H-2 H-3 H-4 H-5
Answer B B D A B
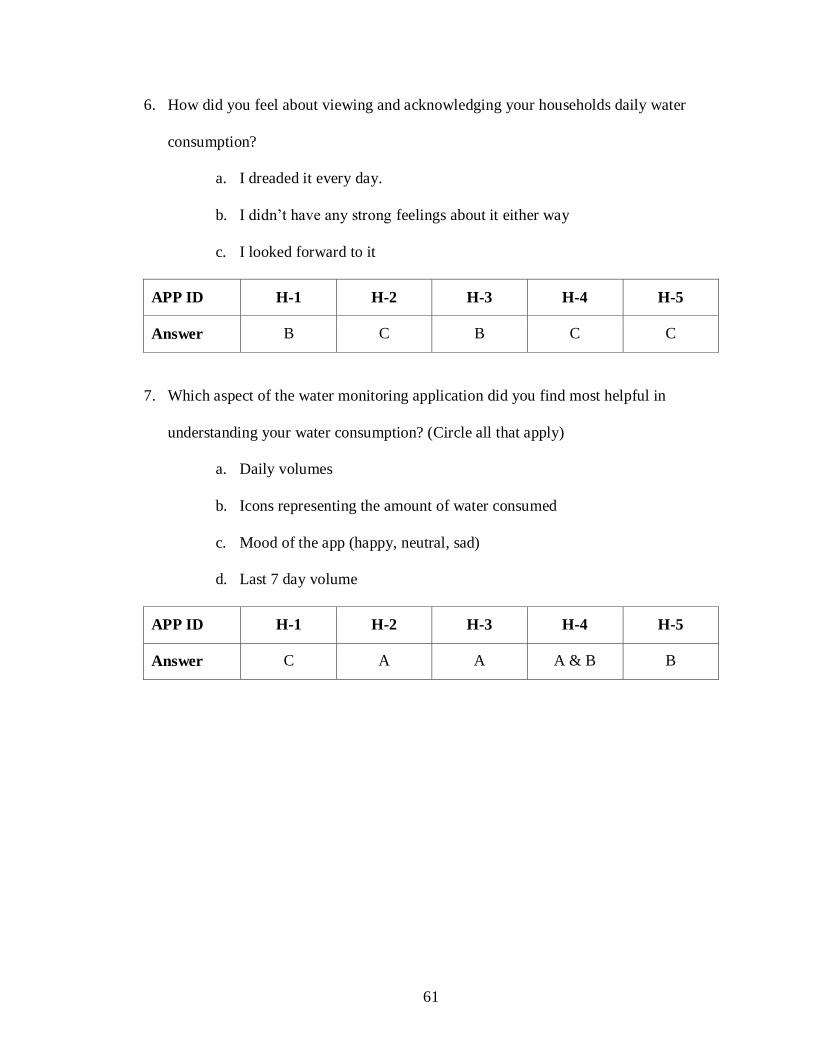
61
6. How did you feel about viewing and acknowledging your households daily water
consumption?
a. I dreaded it every day.
b. I didn‘t have any strong feelings about it either way
c. I looked forward to it
APP ID H-1 H-2 H-3 H-4 H-5
Answer B C B C C
7. Which aspect of the water monitoring application did you find most helpful in
understanding your water consumption? (Circle all that apply)
a. Daily volumes
b. Icons representing the amount of water consumed
c. Mood of the app (happy, neutral, sad)
d. Last 7 day volume
APP ID H-1 H-2 H-3 H-4 H-5
Answer C A A A & B B
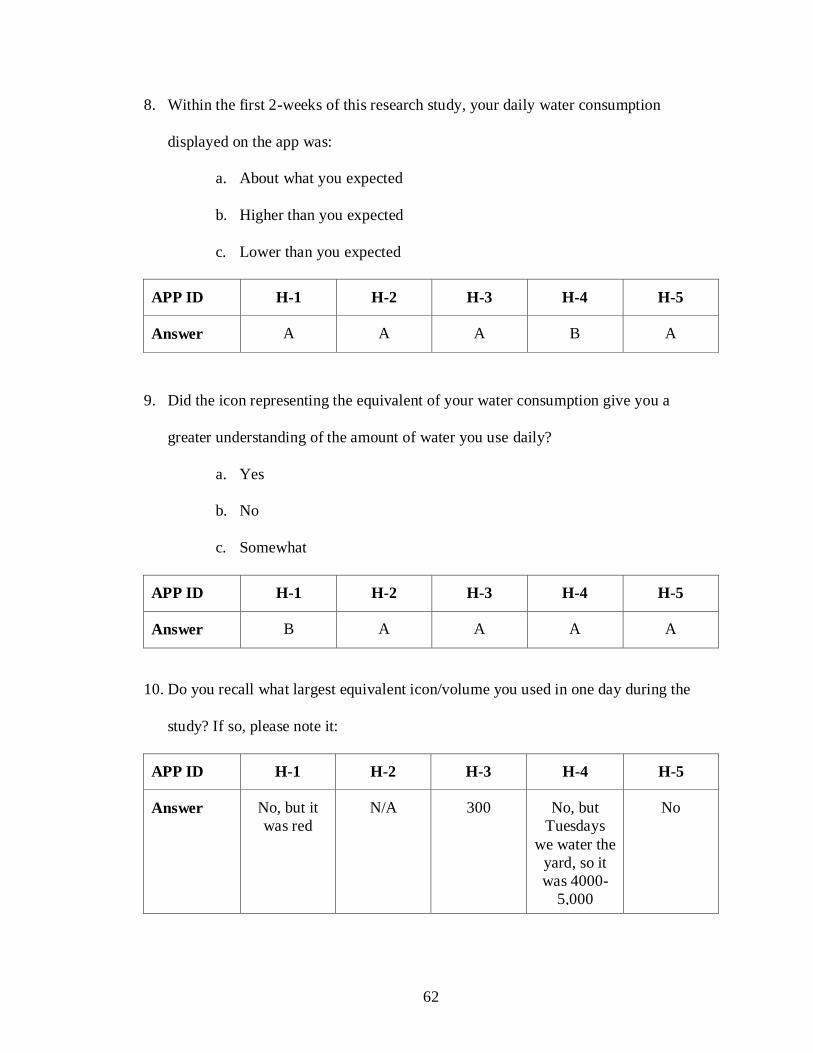
62
8. Within the first 2-weeks of this research study, your daily water consumption
displayed on the app was:
a. About what you expected
b. Higher than you expected
c. Lower than you expected
APP ID H-1 H-2 H-3 H-4 H-5
Answer A A A B A
9. Did the icon representing the equivalent of your water consumption give you a
greater understanding of the amount of water you use daily?
a. Yes
b. No
c. Somewhat
APP ID H-1 H-2 H-3 H-4 H-5
Answer B A A A A
10. Do you recall what largest equivalent icon/volume you used in one day during the
study? If so, please note it:
APP ID H-1 H-2 H-3 H-4 H-5
Answer No, but it
was red
N/A 300 No, but
Tuesdays
we water the
yard, so it
was 4000-
5,000
No
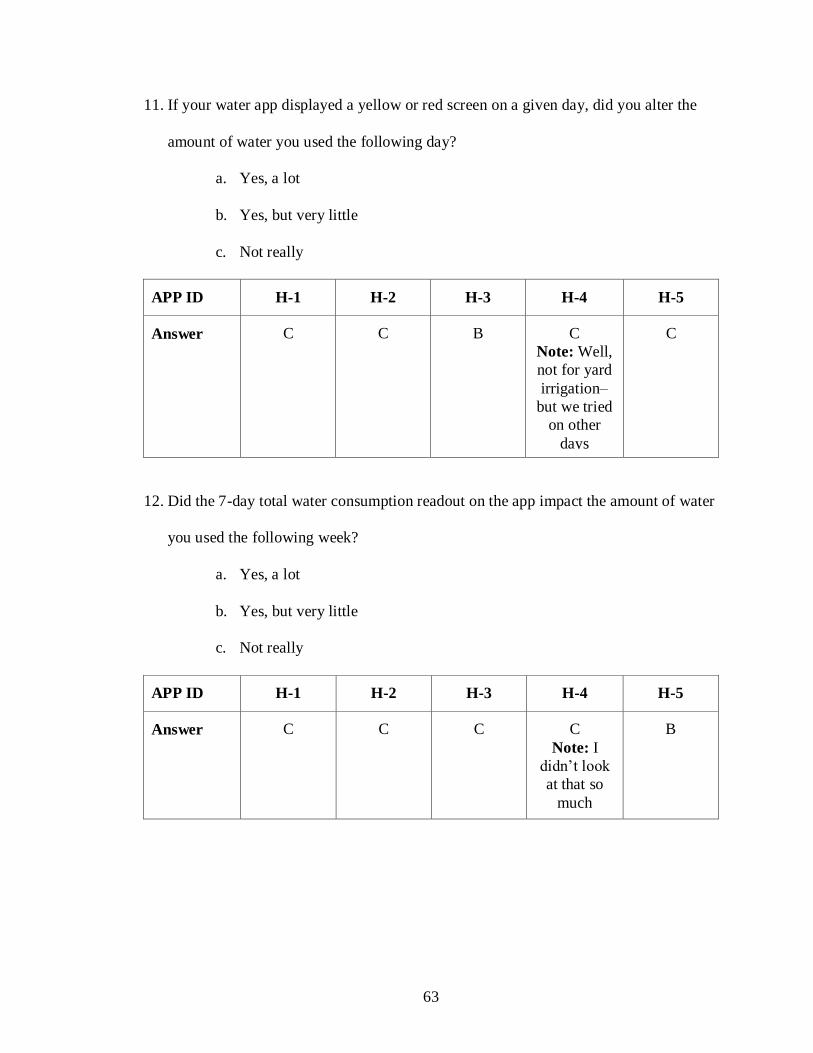
63
11. If your water app displayed a yellow or red screen on a given day, did you alter the
amount of water you used the following day?
a. Yes, a lot
b. Yes, but very little
c. Not really
APP ID H-1 H-2 H-3 H-4 H-5
Answer C C B C
Note: Well,
not for yard
irrigation–
but we tried
on other
days
C
12. Did the 7-day total water consumption readout on the app impact the amount of water
you used the following week?
a. Yes, a lot
b. Yes, but very little
c. Not really
APP ID H-1 H-2 H-3 H-4 H-5
Answer C C C C
Note: I
didn‘t look
at that so
much
B
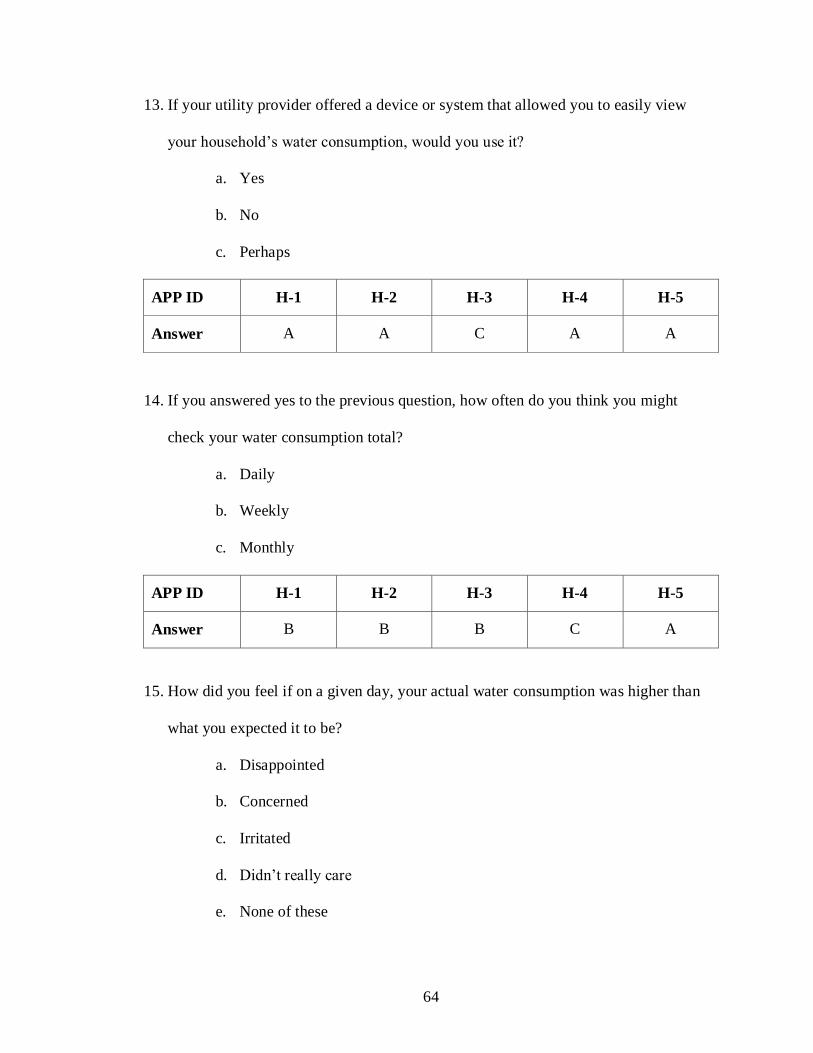
64
13. If your utility provider offered a device or system that allowed you to easily view
your household‘s water consumption, would you use it?
a. Yes
b. No
c. Perhaps
APP ID H-1 H-2 H-3 H-4 H-5
Answer A A C A A
14. If you answered yes to the previous question, how often do you think you might
check your water consumption total?
a. Daily
b. Weekly
c. Monthly
APP ID H-1 H-2 H-3 H-4 H-5
Answer B B B C A
15. How did you feel if on a given day, your actual water consumption was higher than
what you expected it to be?
a. Disappointed
b. Concerned
c. Irritated
d. Didn‘t really care
e. None of these
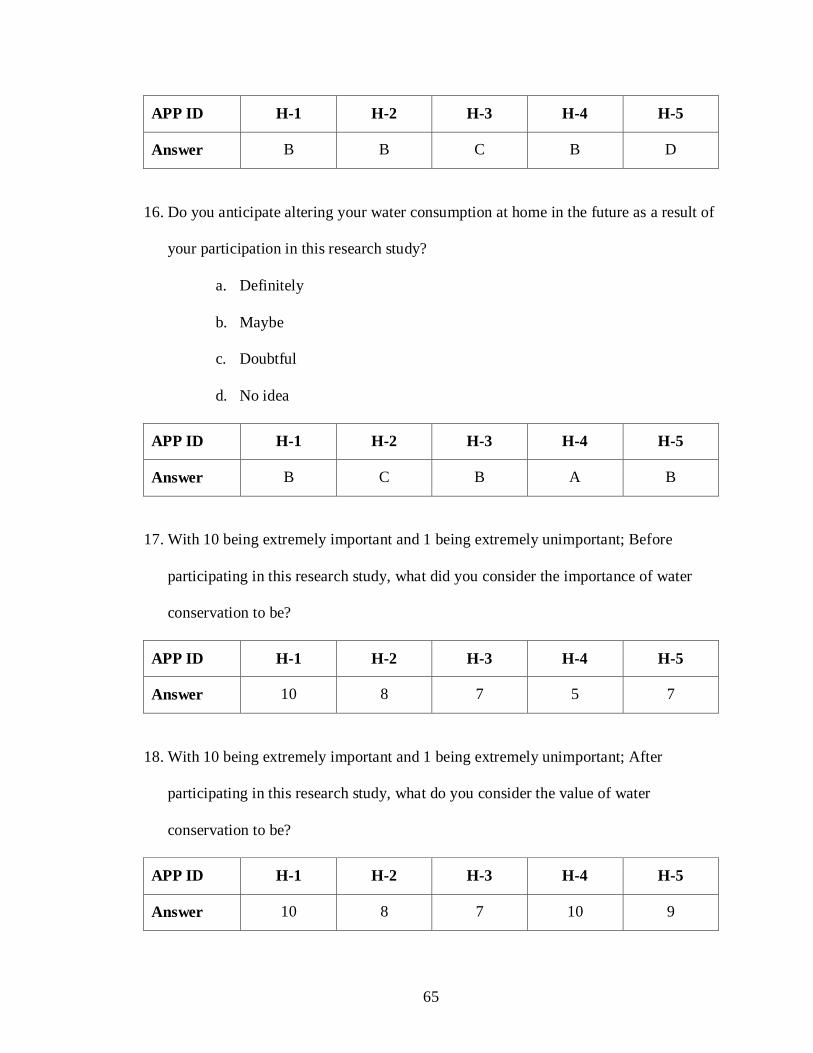
65
APP ID H-1 H-2 H-3 H-4 H-5
Answer B B C B D
16. Do you anticipate altering your water consumption at home in the future as a result of
your participation in this research study?
a. Definitely
b. Maybe
c. Doubtful
d. No idea
APP ID H-1 H-2 H-3 H-4 H-5
Answer B C B A B
17. With 10 being extremely important and 1 being extremely unimportant; Before
participating in this research study, what did you consider the importance of water
conservation to be?
APP ID H-1 H-2 H-3 H-4 H-5
Answer 10 8 7 5 7
18. With 10 being extremely important and 1 being extremely unimportant; After
participating in this research study, what do you consider the value of water
conservation to be?
APP ID H-1 H-2 H-3 H-4 H-5
Answer 10 8 7 10 9
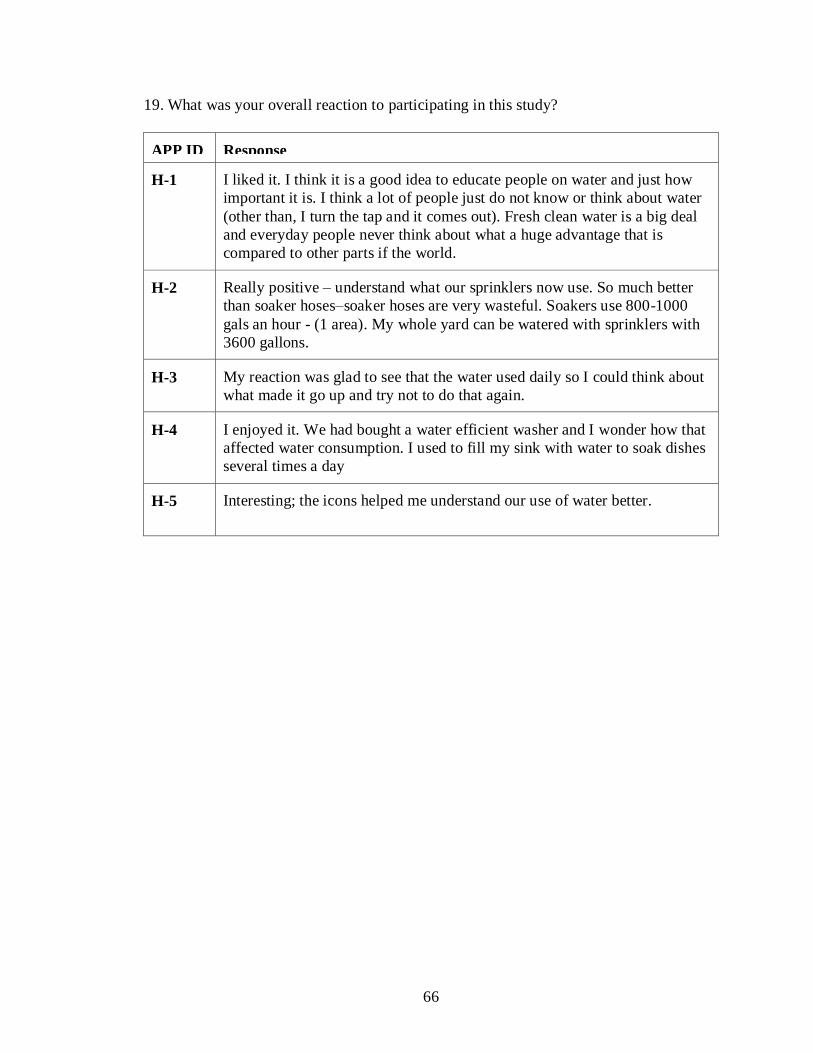
66
19. What was your overall reaction to participating in this study?
APP ID Response
H-1 I liked it. I think it is a good idea to educate people on water and just how
important it is. I think a lot of people just do not know or think about water
(other than, I turn the tap and it comes out). Fresh clean water is a big deal
and everyday people never think about what a huge advantage that is
compared to other parts if the world.
H-2 Really positive – understand what our sprinklers now use. So much better
than soaker hoses–soaker hoses are very wasteful. Soakers use 800-1000
gals an hour - (1 area). My whole yard can be watered with sprinklers with
3600 gallons.
H-3 My reaction was glad to see that the water used daily so I could think about
what made it go up and try not to do that again.
H-4 I enjoyed it. We had bought a water efficient washer and I wonder how that
affected water consumption. I used to fill my sink with water to soak dishes
several times a day
H-5 Interesting; the icons helped me understand our use of water better.
67
REFERENCES
Alois, P. (2007, April). Global water crisis overview. The Arlington Institute. Retrieved
March 3, 2013, from http://www.arlingtoninstitute.org/wbp/global-water-
crisis/441
Baumann, K., Thomas, B. (2001). User Interface Design for Electronic Appliances. New
York: CRC Press.
Biswas, A. Kirchherr, J. (2013, March 29) Shale gas: Black hole for water. Huffington
Post. Retrieved August 20, 2013, from http://www.huffingtonpost.com/asit-
biswas/fracking-water_b_2837779.html
Boag, P. (2011, February 4). Business objectives vs. user experience. Smashing
Magazine. Retrieved September 10, 2013, from:
http://uxdesign.smashingmagazine.com/2011/02/04/business-objectives-vs-user-
experience/
Cardwell, D. (2012, July 23). Save energy, win a prize. The New York Times. Retrieved
August 22, 2013, from http://www.nytimes.com/2012/07/24/business/in-energy-
conservation-utilities-focus-on-bragging-rights.html?pagewanted=all
Census. (2012, August 28) World population: 1950-2050. Retrieved August 18, 2013,
from http://www.census.gov/population/international/data/idb/worldpopgraph.php
Chowdhury, Z., Means, E. Passantino, L., Ruettan, J., Westerhoff, G. (2008).
Communicating the value of water: An introductory guide for water utilities.
Awwa Research Foundation.
de Villiers, M. (2001). Water: The fate of our most precious resource. Wilmington, MA:
Houghton Mifflin Harcourt.
Denscombe, M. (2010). Good research guide: For small-scale social research projects
(4th Edition). Berkshire, GBR: McGraw-Hill Professional Publishing.
Environmental Protection Agency. (2013, August 1). Climate change indicators in the
United States. Retrieved August 18, 2013, from
http://www.epa.gov/climatechange/science/indicators/weather-
climate/temperature.html
Environmental Protection Agency. (2010, March). Texas Water Fact Sheet. doc: EPA
832-F-10-002.
Environmental Protection Agency. (2013, September 19). Water use today. Retrieved
September 23, 2013, from
http://www.epa.gov/watersense/our_water/water_use_today.html
68
Gardner, H. E. (1999). Intelligence reframed: Multiple intelligences for the 21st century.
New York: Basic Books.
Global Water Cycle. (n.d.) Global Hydrology & Climate Center. Coexploration.
Retrieved August 18, 2013, from
http://www.coexploration.org/howsthewater/html/body_earth.html
Gube J. (2010, October 5). What is user experience design? Overview, tools and
resources.http://uxdesign.smashingmagazine.com/2010/10/05/what-is-user-experience-design-overview-tools-and-resources/ Smashing Magazine.
Retrieved March 20, 2013, from
http://uxdesign.smashingmagazine.com/2010/10/05/what-is-user-experience-
design-overview-tools-and-resources/
Guerra Santin, O. (2010). Sustainable urban areas: Actual energy consumption in
dwellings: The effect of energy performance regulations and occupant behaviour.
Amsterdam, NLD: IOS Press.
Hartson, R., Pyla, Pardha S. (2012). UX book: Process and guidelines for ensuring a
quality user experience. St. Louis, MO: Morgan Kaufmann.
Hoffman, D. (1998). Visual intelligence: How we create what we see. New York: W.W.
Norton & Company, Inc.
Home Energy Saver. (n.d.) The hidden cost of home energy use. Retrieved September 15,
2013, from http://homeenergysaver.lbl.gov/consumer/learn-triple/
Hyman, M., Sierra, J. J. (2010). Marketing research kit for dummies. Hoboken, NJ: For
Dummies.
Icon. (n.d.). Dictionary.com Unabridged. Retrieved September 13, 2013, from
http://dictionary.reference.com/browse/icon
iOS Human Interface Guidelines. (2011). Apple Inc.
Johnson, J. (2010). Designing with the mind in mind: Simple guide to understanding user
interface design rules. Burlington, MA: Morgan Kaufmann
Kenny, J.F., Barber, N. L., Hutson, S. S., Linsey, K. S., Lovelace, J. K., Maupin, M. A.,
(2009). Estimated use of water in the United States in 2005: U.S. Geological
Survey Circular 1344, 52 p.
Kenworthy, T. (2013, June 15). Fracking is already straining U.S. water supplies.
Retrieved August 20, 2013, from
http://thinkprogress.org/climate/2013/06/15/2163531/fracking-is-already-
straining-us-water-supplies/
69
Knight, R.L. (2008). Conservation for a new generation: Redefining natural resources
management. Washington, DC: Island Press.
Kuehni, R. G. (2012) Color: An introduction to practice and principles (3rd ed).
Somerset, NJ: Wiley.
Levy, S. (2011, October 25). Brave new thermostat: How the iPod‘s creator is making
home heating sexy. Wired. Retrieved August 25, 2013, from
http://www.wired.com/gadgetlab/2011/10/nest_thermostat/3/
Lundin, B.V. (2011, July 11). Opower and first utility partner for home energy
management program. FierceEnergy. Retrieved August 25, 2013, from
http://www.fierceenergy.com/story/opower-and-first-utility-partner-home-energy-
management-program/2011-07-11
Madnani, M. (2013, March 27). Forecast.io — When good design meets scarily accurate
data. Beautiful Pixels. Retrieved September 10, 2013, from:
https://beautifulpixels.com/iphone/forecast-io-when-good-design-meets-scarily-
accurate-data/
Maxwell, S., Yates, S. (2011). Future of water: A startling look ahead. Denver, CO:
American Water Works Association.
McCoy, K. (2012, September 28-30). Nation‘s water costs rushing higher. USA Today, p.
1A.
Nest Thermostat. (2013, May 20). Nest thermostats give you total control. Eco Rehab
Reviews. Retrieved August 25, 2013, from http://ecorehabreviews.com/tag/nest-
thermostat/
Pew Research Center. (2007, January 24). We try hard. We fall short. Americans assess
their saving habits. Retrieved September 15, 2013, from
http://www.pewsocialtrends.org/2007/01/24/we-try-hard-we-fall-short-americans-
assess-their-saving-habits/
Prud‘Homme, A. (2011). The ripple effect: The fate of freshwater in the twenty-first
century. New York: Scribner.
Samsel, A., Seneff, S. (2013). Glyphosate’s suppression of cytochrome p450 enzymes
and amino acid biosynthesis by the gut microbiome: Pathways to modern diseases
(Entropy 2013, 15, 1416-1463; doi:10.3390/e15041416).
Sobey, E. (2007). Field guide to household technology. Chicago: Chicago Review Press.
Spiegel, A. (Reporter). (2003) No mercy for robots: Experiment tests how humans relate
to machines (Podcast). Morning Edition: National Public Radio.
70
Sutter, J.D. (2010, December 3). Energy efficiency -- with a digital smile. CNN.
Retrieved March 21, 2013, from
http://www.cnn.com/2010/TECH/innovation/12/03/opower.energy/index.html
User Interface. (n.d.). The Free On-line Dictionary of Computing. Retrieved September
09, 2013, from: http://dictionary.reference.com/browse/user interface
Walton, B. (2010, April 26). The price of water: A comparison of water rates, usage in 30
U.S. cities. Circle of Blue. Retrieved March 3, 2013, from
http://www.circleofblue.org/waternews/2010/world/the-price-of-water-a-
comparison-of-water-rates-usage-in-30-u-s-cities/
Ward, D.R. (2002). Water wars: Drought, flood, folly, and the politics of thirst. New
York: Riverhead Books.
Water On The Home Front. (2013, March). Clean Water Fund.
United States Drought Monitor. (2013). National Drought Mitigation Center. Retrieved
March 27, 2013, from http://droughtmonitor.unl.edu/
United States Geological Survey. (2013, August 14). Water science school. Retrieved
March 3, 2013, from http://ga.water.usgs.gov/edu/earthwherewater.html
United States Geological Survey. (2013, January 10). Water science school. Retrieved
March 3, 2013, from http://ga.water.usgs.gov/edu/qa-home-percapita.html
Wheeler, A. (2013). Designing brand identity: An essential guide for the whole branding
team (4th ed.). Hoboken, NJ: John Wiley & Sons Inc.
Wilde O., Murray, I. (2000). Oscar Wilde - The major works: Including the picture of
Dorian Gray. Oxford University Press.