Embed Size (px)
Citation preview
The Impact of Women's Schooling on Fertilityand Contraceptive Use: A Study of Fourteen
Sub-Saharan African Countries
Martha Ainsworth, Kathleen Beegle, and Andrew Nyamete
This article examines the relationship between female schooling and two behav-iors—cumulative fertility and contraceptive use—in fourteen Sub-Saharan Africancountries where Demographic and Health Surveys (DHS) have been conducted sincethe mid-1980s. Average levels of schooling among women of reproductive age arevery low, from less than two years to six. Controlling for background variables, thelast years of female primary schooling have a negative relation with fertility in abouthalf the countries, while secondary schooling is associated with substantially lowerfertility in all countries. Female schooling has a positive relationship with contracep-tive use at all levels. Among ever-married women, husband's schooling exerts a smallereffect than does female schooling on contraceptive use and, in almost all cases, onfertility. Although the results suggest commonalities among these Sub-Saharan coun-tries, they also reveal intriguing international differences in the impact of femaleschooling, which might reflect differences in the quality of schooling, labor markets,and family planning programs, among others.
There is considerable debate in the literature as to whether high fertility andhigh desired family size in Africa are caused by low levels of economic devel-opment that favor large families (see World Bank 1984, 1986), or by uniquecultural features (see Caldwell and Caldwell 1987, 1990). Without denying thepossibility that cultural traits may contribute to higher demand for children inAfrica than in other developing regions, most studies have found differentials incurrent or total fertility by socioeconomic class, even in high-fertility countries
Martha Ainsworth is with the Policy Research Department at the World Bank; Kathleen Beegle iswith the Department of Economics at Michigan State University; and Andrew Nyamete is with AIDSControl and Prevention (AIDSCAP). This article was written as background for the research project on"The Economic and Policy Determinants of Fertility in Sub-Saharan Africa," financed by the World BankResearch Committee (RPO 67691) and sponsored by the Africa Technical Department and the PolicyResearch Department of the World Bank. The authors are grateful to the World Bank Research Committeeand the Africa Region for financial assistance and to John Caldwell, Cynthia Cook, David Cornelius, Joyde Beyer, Barbara Herz, Cynthia LJoyd, Gora M'Boup, Amolo Ngwero, Lant Pritchett, Fred Sai, GuillermeSeladcek, David Shapiro, Paul Shaw, Duncan Thomas, and Barbara Torrey for comments on earlierdrafts. The authors also acknowledge Evina Akam, Clara Fayorsey, Mouhamadou Gueye, Alice Kouadio,Katharine Namuddu, and others who offered comments at dissemination seminars in Cameroon, Coted'lvoire, Ghana, Kenya, and Mali. A special debt of gratitude is extended to Susmita Ghosh and KathyBurke for assistance.
O 1996 The International Bank for Reconstruction and Development / THE WORLD BANK
85
Pub
lic D
iscl
osur
e A
utho
rized
Pub
lic D
iscl
osur
e A
utho
rized
Pub
lic D
iscl
osur
e A
utho
rized
Pub
lic D
iscl
osur
e A
utho
rized
Pub
lic D
iscl
osur
e A
utho
rized
Pub
lic D
iscl
osur
e A
utho
rized
Pub
lic D
iscl
osur
e A
utho
rized
Pub
lic D
iscl
osur
e A
utho
rized
8 6 THE WORLD BANK ECONOMIC REVIEW, VOL. 10, NO. 1
(see Cochrane and Farid 1990 and United Nations 1987, for example). Amongthe faaors thought to be the most conducive to the high demand for childrenare high child mortality and low levels of female schooling.
This article estimates the relationships between female schooling and fertilityand between female schooling and contraceptive use in fourteen Sub-SaharanAfrican countries where Demographic and Health Surveys (DHS) were conductedfrom the mid-1980s to the early 1990s. Mulrivariate analysis of the determi-nants of fertility and contraceptive use allows a precise exploration of the rela-tionship with women's schooling, while controlling for variables like age, areaof residence, wealth, ethnicity, and religious affiliation. Results across the coun-tries, for both national and subnational samples, are compared and form thebasis for future research to explain international differences.
Section I describes the posited relationships between women's schooling andfertility and between women's schooling and contraceptive use and summarizesthe evidence to date on these relationships in Sub-Saharan Africa. Section IIpresents the empirical model and describes the data sets. Section III providesdescriptive statistics—both from the data sets and from outside sources—oneconomic and demographic indicators for the fourteen countries under study.Section IV describes the results for determinants of fertility, and section Vdescribes the results for the determinants of contraceptive use. Section VI re-views the results and proposes areas for additional research.
I. WOMEN'S SCHOOLING, FERTILITY, AND CONTRACEPTIVE USE
Women's schooling is posited to result in lower fertility and, by inference,higher contraceptive use, through four main channels.
• Wage effects. By raising the opportunity cost of women's time in rearingchildren, schooling raises the "price" of children (who are time-intensive)as well as the wage that women can earn in the work force. The wagebenefits of schooling may also induce women to get more schooling, therebydelaying the onset of childbearing. This is likely to result in lower fertilityand higher rates of female participation in the labor force.
• Higher demand for child schooling. Women with more schooling maydevelop higher aspirations for their own children's schooling. Theseaspirations may lead them to have fewer children and to invest in moreschooling per child. This is the quantity-quality tradeoff observed in otherparts of the world but examined only recently in Sub-Saharan Africa (Kelleyand Nobbe 1990; Montgomery, Kouame, and Oliver 1995). There are manyinitiating factors for this tradeoff, including the levels of wages andemployment expected by graduates and the quality and price of schooling.
• Lower child mortality. Women with more schooling are likely to be moreeffective in producing healthy children, which lowers child mortality. Asthe "wedge" between live births and surviving children is narrowed, couplesfind that they can have fewer children to reach a target number of surviving
Ainsworth, Beegle, and Nyamete 8 7
children.1 In a cross-national study, Schultz (1994) found that fully half ofthe effect of female schooling in lowering fertility was operating throughits effect in lowering child mortality.
• More effective use of contraception. Educated women can learn about anduse contraception more effectively than uneducated women, reducing thenumber of unanticipated pregnancies.
It has been suggested that female schooling can indirectly raise fertility byimproving maternal health, reducing pathological sterility, and reducing the du-ration of breastfeeding and its contraceptive benefits (Alam and Casterline 1984;Bongaarts, Frank, and Lesthaeghe 1984; Casterline and others 1984; Clelandand Rodriguez 1988; Cochrane 1979, 1988; Jejeeboy 1992; and World Bank1984). Female education is also thought to facilitate fertility decline by increas-ing the bargaining power of women, allowing them greater control over theirdestiny, and improving husband-wife communication (Jejeeboy 1992; UnitedNations 1987).
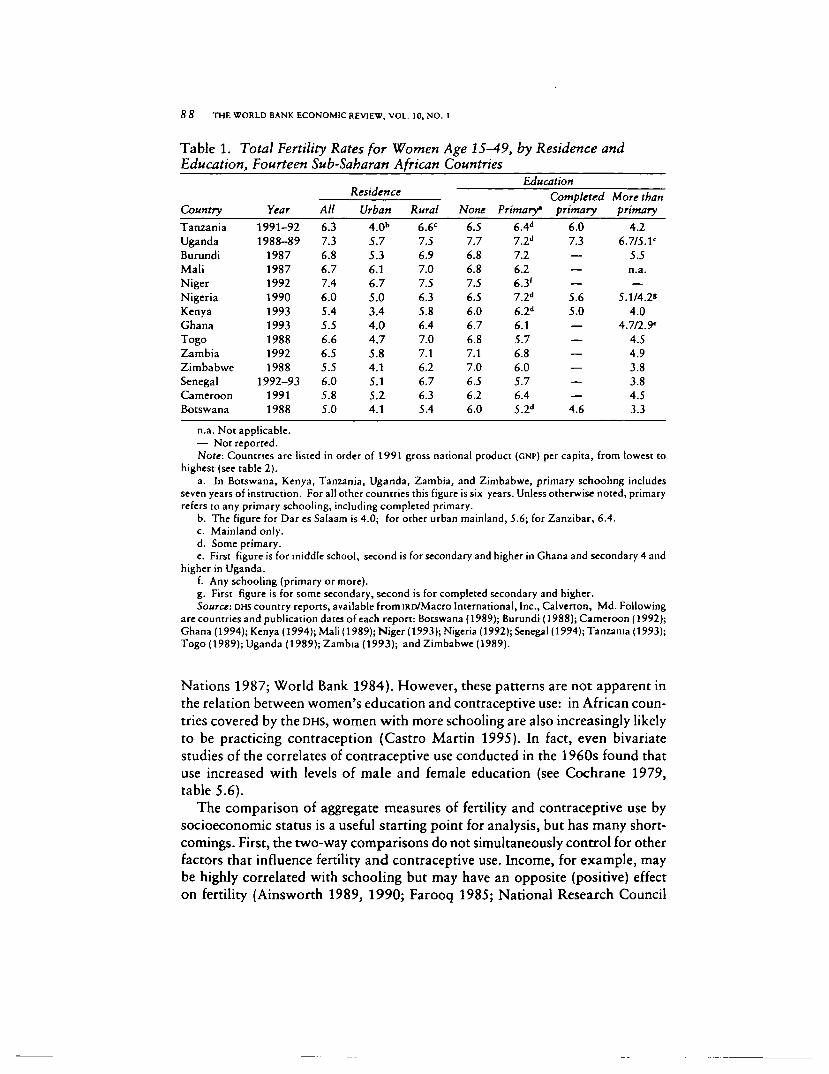
There have been several studies of the differentials in aggregate measures offertility between urban and rural areas and among women according to theirlevel of schooling, using data from the World Fertility Survey (WFS) (Alam andCasterline 1984; Cleland and Rodriguez 1988; Cochrane 1988; Cochrane andFarid 1990; and United Nations 1987). The total fertility rate (TFR) is the num-ber of children a woman would have in her lifetime if she bore children accord-ing to current age-specific fertility rates. Table 1 presents differentials in the TFRby area of residence and female education for African countries that partici-pated in the more recent DHS. The TFR measured in these fourteen countries isvery high—generally in the range of six to seven children. However, in everycountry it is significantly lower in urban than in rural areas.
One reason for these urban-rural differentials is the concentration of womenwith secondary and higher levels of schooling in urban areas. Women who havecompleted primary schooling or who have some secondary schooling univer-sally have a lower TFR than women without schooling. The differential betweenthe fertility of women with primary schooling and those with no schooling issmaller and sometimes follows an unanticipated direction: in Burundi, Cameroon,Kenya, and Nigeria, women with some primary schooling actually have a higherTFR than those with no schooling. Note, however, that the TFR for those whocompleted the primary cycle is substantially lower than for women with noschooling in all cases, including Kenya and Nigeria. Results that indicate a posi-tive relation between some primary schooling and the TFR cast doubt on theeffectiveness of less-than-complete female primary schooling in lowering fertil-ity, suggesting that schooling does not have a depressing effect on fertility untilthe secondary level (Cleland and Rodriguez 1988; Cochrane 1979,1988; United
1. See Benefo and Schultz (1994) and Pitt (1995) for evidence of the relation between female schoolingand child mortality in Sub-Saharan Africa.
8 8 THE WORLD BANK ECONOMIC REVIEW, VOL. 10, NO. 1
Table 1. Total Fertility Rates for Women Age 15-49, by Residence andEducation, Fourteen Sub-Saharan African Countries
Country
TanzaniaUgandaBurundiMaliNigerNigeriaKenyaGhanaTogoZambiaZimbabweSenegalCameroonBotswana
Year
1991-921988-89
198719871992199019931993198819921988
1992-9319911988
All
6.37.36.86.77.46.05.45.56.66.55.56.05.85.0
ResidenceUrban
4.0b
5.75.36.16.75.03.44.04.75.84.15.15.24.1
Rural
6.6C
7.56.97.07.56.35.86.47.07.16.26.76.35.4
None
6.57.76.86.87.56.56.06.76.87.17.06.56.26.0
Education
Primary'
6.V1.2'116.26.3'7.2"6.2d
6.15.76.86.05.76.45.2d
Completedprimary
6.07.3———5.65.0——————4.6
More thanprimary
4.26.7/5.1'
5.5n.a.—
5.1/4.2*4.0
4.7/2.9'4.54.93.83.84.53.3
n.a. Not applicable.— Not reported.Note: Countries are listed in order of 1991 gross national product (GNP) per capita, from lowest to
highest (see table 2).a. In Botswana, Kenya, Tanzania, Uganda, Zambia, and Zimbabwe, primary schooling includes
seven years of instruction. For all other countries this figure is six years. Unless otherwise noted, primaryrefers to any primary schooling, including completed primary.
b. The figure for Dar es Salaam is 4.0; for other urban mainland, 5.6; for Zanzibar, 6.4.c. Mainland only.d. Some primary.e. First figure is for middle school, second is for secondary and higher in Ghana and secondary 4 and
higher in Uganda.f. Any schooling (primary or more).g. First figure is for some secondary, second is for completed secondary and higher.Source: DHS country reports, available from IRD/Macro International, Inc., Calverton, Md. Following
are countries and publication dates of each report: Botswana (1989); Burundi (1988); Cameroon (1992);Ghana (1994); Kenya (1994); Mali (1989); Niger (1993); Nigeria (1992); Senegal (1994);Tanzania (1993);Togo (1989); Uganda (1989); Zambia (1993); and Zimbabwe (1989).
Nations 1987; World Bank 1984). However, these patterns are not apparent inthe relation between women's education and contraceptive use: in African coun-tries covered by the DHS, women with more schooling are also increasingly likelyto be practicing contraception (Castro Martin 1995). In fact, even bivariatestudies of the correlates of contraceptive use conducted in the 1960s found thatuse increased with levels of male and female education (see Cochrane 1979,table 5.6).
The comparison of aggregate measures of fertility and contraceptive use bysocioeconomic status is a useful starting point for analysis, but has many short-comings. First, the two-way comparisons do not simultaneously control for otherfactors that influence fertility and contraceptive use. Income, for example, maybe highly correlated with schooling but may have an opposite (positive) effecton fertility (Ainsworth 1989, 1990; Farooq 1985; National Research Council
Ainsworth, Beegle, and Nyamete 89
1993). Failure to control for these other correlated variables may confound theindependent effects of schooling, other policy variables, and exogenous factorslike ethnicity.
Second, the total fertility rate does not represent the completed fertility ofany individual or cohort of women; rather, it is the number of children a womanwould have over her reproductive lifetime if she were to bear children at prevailingage-specific fertility rates. Thus, cohort effects of schooling on the timing ofbirths over the life cycle are not reflected in the comparisons of TFR for schooledand unschooled women. As a larger share of each successive cohort is educated,the relation between schooling and fertility for any given cohort is likely tochange.
Third, the policy objective is to lower aggregate measures of fertility by influ-encing individual decisions on the number of children. At the individual level,the policy objective is therefore to influence cumulative and completed fertility.
Finally, if there are any nonlinearities in the relationship between policy vari-ables and fertility, they will not necessarily be reflected in, and cannot be studiedwith, aggregates like the total fertility rate (Anker 1985; Schultz 1992). For thesereasons, multivariate analysis of individual data may yield greater insights on thelikely impact of policies, such as female schooling, on cumulative fertility.
A number of multivariate studies have examined the relation between femaleschooling and cumulative fertility in Sub-Saharan countries, controlling for thewoman's age, area of residence, and sometimes her religion, ethnic group, andhousehold income (see Ainsworth, Beegle, and Nyamete 1995, table 2). Six studiesthat controlled for household permanent income—using proxies such as husband'sschooling, husband's income, household consumption, land ownership, andcattle—found either a significant negative relation (Ainsworth 1989; Okojie 1990,1991; Snyder 1974) or no relation (Anker and Knowles 1982; Farooq 1985)between women's schooling and cumulative fertility at low levels of female school-ing. At higher levels, female schooling was correlated with substantially lowerfertility. Burafuta and Shapiro (1992) found a positive relation between primaryschooling and fertility in Burundi, but secondary schooling was associated withlower fertility relative to women with no schooling. They were, however, unableto control for income. Shapiro and Tambashe (1994) found similar results inKinshasa, Zaire, while controlling for "economic status." Fairlamb andNieuwoudt (1991) found a large and significant negative effect of the years offemale schooling on children ever born, but the results were confounded byendogenous regressors, and the study had no control for exogenous income.
Ahn and Shariff (1994) found that seven or more years of schooling reducethe progression to first birth in Togo and Uganda. Husband's education had apositive relation with cumulative fertility in four studies that did not have anyother measures of income (Okojie 1990, 1991; Snyder 1974; United Nations1987), but had a negative relation when women's education and a proxy forhousehold permanent income were controlled for (Ainsworth 1989). A UnitedNations (1987) study of twelve African countries in the World Fertility Survey
9 0 THE WORLD BANK ECONOMIC REVIEW, VOL. 10, NO. 1
found a negative relation between schooling and fertility for women with ten ormore years of schooling and who had been married for at least three years. Forlevels of schooling less than ten years, the relationship was cited as positive.However, the statistical significance of the coefficients on lower years is notreported and female schooling was significant in only five to six of the countries.Husband's schooling at all levels had a positive relation with fertility, but wassignificant in only six of the countries.
Multivariate studies of Sub-Saharan Africa at the individual level have showna consistently positive relation between female schooling and contraceptive usein Sub-Saharan Africa.2 In comparing the determinants of contraceptive use overtime using data from the 1977-78 Kenya Fertility Survey and the 1989 KenyaDemographic and Health Survey, Njogu (1991) found that educated women atall levels are significantly more likely to use contraception compared with womenwith no education, and that the impact of education rises with its level. Anunpublished study of contraceptive use in Ouagadougou, Burkina Faso, showedsimilar positive effects of women's literacy and schooling on ever use of moderncontraception (Fenn, McGinn, and Charbit 1987). All levels of schooling, in-cluding primary schooling, significantly raised the probability of contraceptionamong a sample of nonpregnant women in Kinshasa, Zaire (Shapiro andTambashe 1994). Similar results were found for a sample of all women of re-productive age in Burundi (Burafuta and Shapiro 1992). Castro Martin's (1995)results indicated, even at low levels of female schooling, statistically significanteffects on contraceptive use among currently married women in ten Africancountries. Beegle (1995), Feyisetan and Ainsworth (1994), Oliver (1995), andThomas and Maluccio (1995) found strong effects of female schooling on con-traceptive use when controlling for the availability (in Tanzania), quality (inNigeria), and price of family planning services (in Ghana and Zimbabwe). Inmultivariate studies in other regions, women's education has a uniformly directrelation with contraceptive use and husband's education also has a direct butless powerful relation (Castro Martin 1995; Cochrane 1979).
These studies suggest a negative but nonlinear relation between women's school-ing and fertility and demonstrate the potentially confounding effects of other vari-ables correlated with schooling (such as household income) in interpreting the re-sults. However, many of the studies included potentially endogenous regressors inthe analysis of fertility, variables such as the age at first birth, child spacing inter-vals, child schooling, and women's labor force participation (Snyder 1974); con-traceptive use, breastfeeding, child survival, and the desired level of child schooling(Anker and Knowles 1982); and age at marriage (United Nations 1987). In multi-variate analysis of contraceptive use, endogenous regressors have included fertility,
2. The National Research Council (1993) study conducted a multivariate analysis of the determinantsof contraceptive use in sixty-eight regions of Sub-Saharan Africa using as regressors mean completedfemale schooling, urban residence, the percentage of women in polygamous unions, and the percentage ofwomen who practiced Muslim and traditional religions. The results confirmed the very strong effect offemale schooling relative to other factors.
Ainsworth, Beegle, and Nyamete 91
women's labor force participation, current enrollment status (Burafuta and Shapiro1992; Castro Martin 1995; and Shapiro and Tambashe 1994); marital status(Fairlamb and Nieuwoudt 1991; Fenn, McGinn, and Charbit 1987; Shapiro andTambashe 1994); and fertility intentions (Fairlamb and Nieuwoudt 1991; Njogu1991; Shapiro and Tambashe 1994). Decisions concerning marriage, timing of firstbirths, child schooling, and labor force participation are jointly determined withfertility. Their inclusion will lead to biased results.
An additional problem is that most of the studies used samples of currentlymarried women. By conditioning on marriage, they have not captured the fulleffect of socioeconomic variables on fertility (through delayed marriage) or con-traceptive use (before marriage). Further, since marriage and childbearing couldbe thought of as a joint decision, studies that use married samples have introduceda potential sample selection bias in favor of women with higher demand forchildren. Snyder (1974) and Chernichovsky (1985) studied an even more selec-tive sample—women with children. Shapiro and Tambashe (1994) studied con-traceptive use in a sample of nonpregnant women and Castro Martin (1995) ina sample of currently married nonpregnant women. United Nations (1987) stud-ied marital fertility in a group of women married for at least three years.
We seek to avoid many of these pitfalls by using a common set of exogenousregressors on samples of all women, regardless of marital status. Further, byexamining similar specifications, results can be compared across countries usingthe most up-to-date data.
II. EMPIRICAL MODEL AND DATA SETS
The empirical model of fertility determinants regresses a measure of cumula-tive fertility—children ever born to each woman—on a set of independent vari-ables that are assumed to be exogenous to fertility decisions but that influenceeither the demand for or supply of children. This reduced-form model of fertilitydeterminants can be written as
V = A) + 011*1 + Al*!2 + 02*2 + 03*3 + Al*4 + 05*5 + 06*6 + 07*7 + M
where y is the dependent variable, children ever born; j30 is an intercept; x, is thewoman's age, entered in quadratic form to control for biological factors affect-ing the supply of births; x2 is the woman's schooling, in various specifications;x3 indicates urban residence; x4 is the woman's ethnic group; x5 is the woman'sregion of residence; x6 is the woman's religion; and x7 is a group of variablesproxying the household's income or wealth. The empirical models for contra-ceptive use are identical, except for the dependent variable, which is a dichoto-mous (dummy) variable that takes on the value zero or one, indicating currentuse of modern contraception.
To examine in more detail the nonlinearities of schooling effects and fertility,the results from four different specifications of female schooling are presented:(a) years of completed schooling as a linear term; (b) years of completed school-
9 2 THE WORLD BANK ECONOMIC REVIEW, VOL. 10, NO. 1
ing in quadratic form (schooling and schooling squared); (c) linear splines forthe level of schooling reached—lower primary (one to three years), upper pri-mary (four to six years or four to seven), lower secondary (seven to ten years oreight to ten) and higher levels (eleven years and more); and (d) dummy variablesfor individual years of completed schooling.3 Relationships for the national sampleas well as for urban and rural subsamples are presented here. Results by cohortare presented in Ainsworth, Beegle, and Nyamete (1995).
The choice of independent regressors has been influenced by the availabilityof information in the data sets. The analysis uses data from fourteen Sub-Saharan African countries collected by the DHSs in the late 1980s and early1990s. The DHS samples are large—from 3,000 to 9,000 women aged fifteen toforty-nine. The large size of the samples is important because in many countriesonly a small proportion of women have had any schooling (fewer than a third ofwomen in Burundi, Mali, and Senegal, for example). There are, unfortunately,no measures of household income or consumption in the DHS data sets. We useinstead four variables that serve as proxies for income and wealth: householdownership of a radio, a television, or a bicycle, and the quality of housing. Thelatter is a dichotomous variable that indicates whether the floor of the household'sresidence is cement, tile, polished wood, or parquet; the default categories aremud, sand, or clay in most countries.
The number of children ever born is censored from below at zero, and cantake on only zero or positive integer values. Under these conditions, least squaresregression coefficients are inconsistent and, when the dependent variable andregressors are normally distributed, are biased downward in proportion to thedegree of censoring in the sample (Greene 1981). Depending on the data set,roughly a quarter of the women in the samples (ranging from 16 percent in Malito 30 percent in Burundi) have had no live births. Although there are econometricmodels capable of dealing with this problem, we have opted to use the easier-to-interpret ordinary least squares (OLS) estimation for the fertility regressions.4
This censoring problem does not arise for the contraceptive use regressions, inwhich the dependent variable is dichotomous. Maximum likelihood logit is usedin estimation of the parameters (Maddala 1983).5
3. In six countries the primary cycle is completed in seven years (Botswana, Kenya, Tanzania, Uganda,Zambia, and Zimbabwe). In these instances the upper primary and lower secondary variables are setequal to four to seven and eight to ten years, respectively. Cameroon has a dual system, with those in theFrancophone areas completing primary schooling in six years, and those in the Anglophone areas inseven years. The upper primary school spline used in Cameroon is set to reflect incomplete or completeprimary schooling for the system in which the woman was enrolled.
4. The Tobit model, for example, takes into account the censoring of the dependent variable at zero,although not its integer nature. A Poisson count model takes into account both the censoring and integernature of the dependent variable, and the coefficients would be unbiased, even if the mean and varianceof the dependent variable are not equal (as is implied by the Poisson model). For all subsamples exceptyoung women and possibly urban women, Tobit and Poisson models produce results identical in sign andsignificance and very similar in magnitude to OLS coefficients (Ainsworth 1989).
5. Standard errors in both the fertility and contraceptive use regressions are corrected forheteroskedasticity and cluster effects.
Ainsworth, Beegle, and Nyamete 93
A second censoring issue involves the inclusion of women who have not com-pleted their fertility. One way of dealing with this problem would be to predictthe completed fertility of younger women on the basis of the determinants offertility found among women who had already completed or nearly completedchildbearing. However, in most African countries this would restrict the analy-sis to an older sample of women (over forty) that has had very little schooling.Further, we anticipate that the relation between schooling (as well as other in-dependent variables) and fertility may be changing over time. As the aggregateproportion of schooled women increases, the quality and price of schoolingchange, family planning becomes more widely available to younger women, andother socioeconomic conditions (such as income) evolve. To account for the factthat women in the samples have been exposed to the risk of pregnancy for dif-fering amounts of time and for the fact that fecundity over the fifteen-to-forty-nine age range rises with age, peaks, and then declines, we control for the woman'sage and age squared.
A third censoring issue of unknown magnitude, relevant to both the fertilityand contraceptive use regressions, is the possibility that some of the youngerwomen in the sample may not have completed their schooling. The DHS datasets did not record whether the women in the sample were currently enrolled inschool. However, given the limited amount of schooling in all of the nationalsamples at the primary and especially the secondary level, we do not anticipatethat upper censoring of the completed schooling variable is a major problem inthis analysis.
III. DESCRIPTIVE STATISTICS
The fourteen Sub-Saharan African countries included in this study span thecontinent in terms of their geographic location, colonial heritage, and level ofeconomic development. Half of the countries are West African, four are in Easternand Central Africa, and three are in Southern Africa. Five countries are French-speaking (Burundi, Mali, Niger, Senegal, Togo); eight are English-speaking, andCameroon uses both as official languages. The countries range in size fromBotswana, with slightly more than one million people, to Nigeria, the largestcountry in Sub-Saharan Africa, with a population of nearly 100 million (table2). Most of these countries have very low incomes; as shown in table 2, sevenhad incomes per capita of less than US$400 in 1991. Among the twelve coun-tries for which data are available, eight had negative rates of growth of grossnational product (GNP) per capita in the 1980s, and for two others GNP per capitagrew at less than 1 percent a year. Scribner (1995) has characterized the popula-tion policies of most of the countries in this study, including policies on familyplanning, child health, and women's legal status.
There are wide divergences in female enrollment and infant mortality rates.As recently as 1990, for example, female primary enrollments representedonly 17 percent of primary-age girls in Mali, 21 percent in Niger, and only
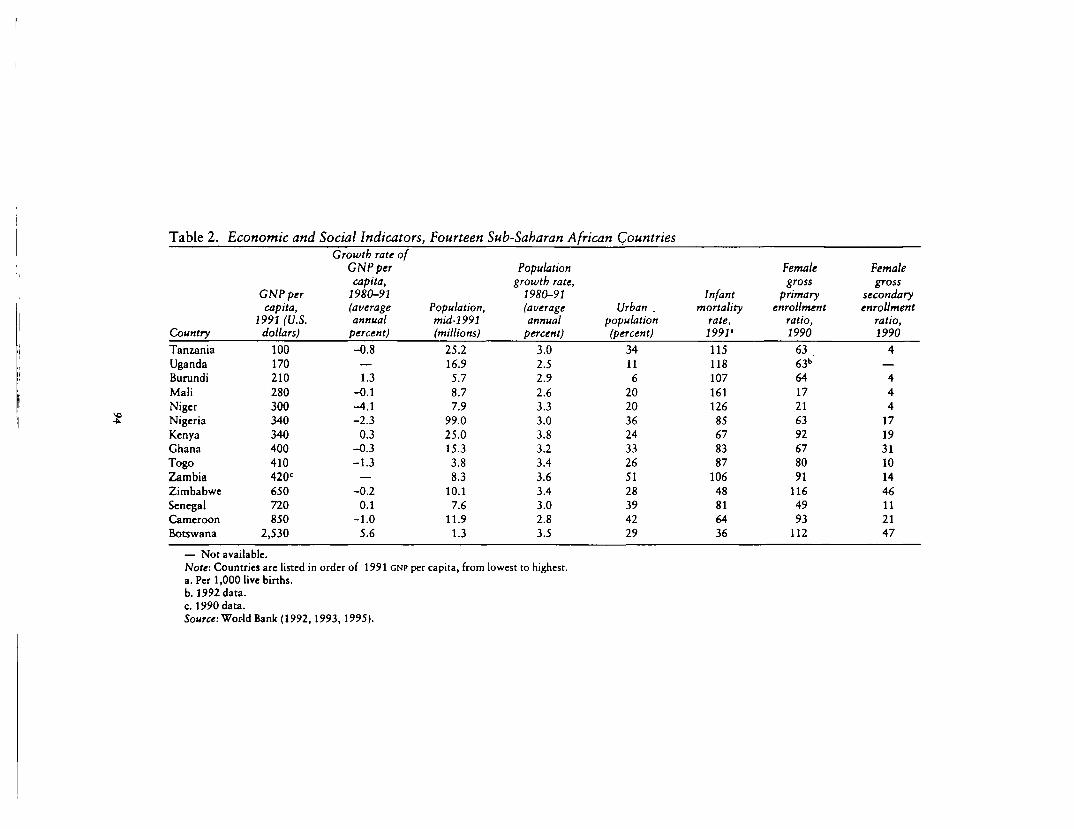
Table 2. Economic and Social Indicators, Fourteen Sub-Saharan African Countries
Country
TanzaniaUgandaBurundiMaliNiger
•*. NigeriaKenyaGhanaTogoZambiaZimbabweSenegalCameroonBotswana
GNP percapita,
1991 (U.S.dollars)
100170210280300340340400410420c
650720850
2,530
Growth rate ofGNP percapita,
1980-91(averageannual
percent)
-0.8—1.3
-0.1-4.1-2.3
0.3-O.3-1.3
—-0.2
0.1-1.0
5.6
Population,mid-1991(millions)
25.216.95.78.77.9
99.025.015.33.88.3
10.17.6
11.91.3
Popubtiongrowth rate,
1980-91(averageannual
percent)
3.02.52.92.63.33.03.83.23.43.63.43.02.83.5
Urban _population(percent)
34116
2020362433265128394229
Infantmortality
rate,1991'
11511810716112685678387
10648816436
femalegross
primaryenrollment
ratio,1990
6363b
6417216392678091
1164993
112
Femalegross
secondaryenrollment
ratio,1990
4—444
171931101446112147
— Not available.Note: Countries are listed in order of 1991 GNP per capita, from lowest to highest.a. Per 1,000 live births.b. 1992 data.c. 1990 data.Source: World Bank (1992,1993,1995).
Ainsworth, Beegle, and Nyamete 95
half of the primary-age girls in Senegal (table 2). By comparison, the inclu-sion of over-age girls in primary enrollments in Botswana and Zimbabweraises their gross female primary enrollment rates to over 100 percent. Inonly three countries—Botswana, Ghana, and Zimbabwe—do female second-ary enrollments equal or exceed 30 percent of the women in that age group.Perhaps not coincidentally, demographers believe that fertility decline is un-der way in two of these three countries—Botswana and Zimbabwe (van deWalle and Foster 1990). Infant mortality rates (iMRs) also show great varia-tion. Botswana and Zimbabwe have IMRS lower than 50 per 1,000, but sixcountries have rates greater than 100 per 1,000 (table 2). Despite thesedifferences in economic and social indicators, levels of fertility and popula-tion growth rates in the fourteen countries are high and remarkably similar.With the exception of four countries, population growth rates were between3 and 4 percent per year during the 1980s. Recall from table 1 that the totalfertility rates were between 5.0 and 7.4 children per woman.
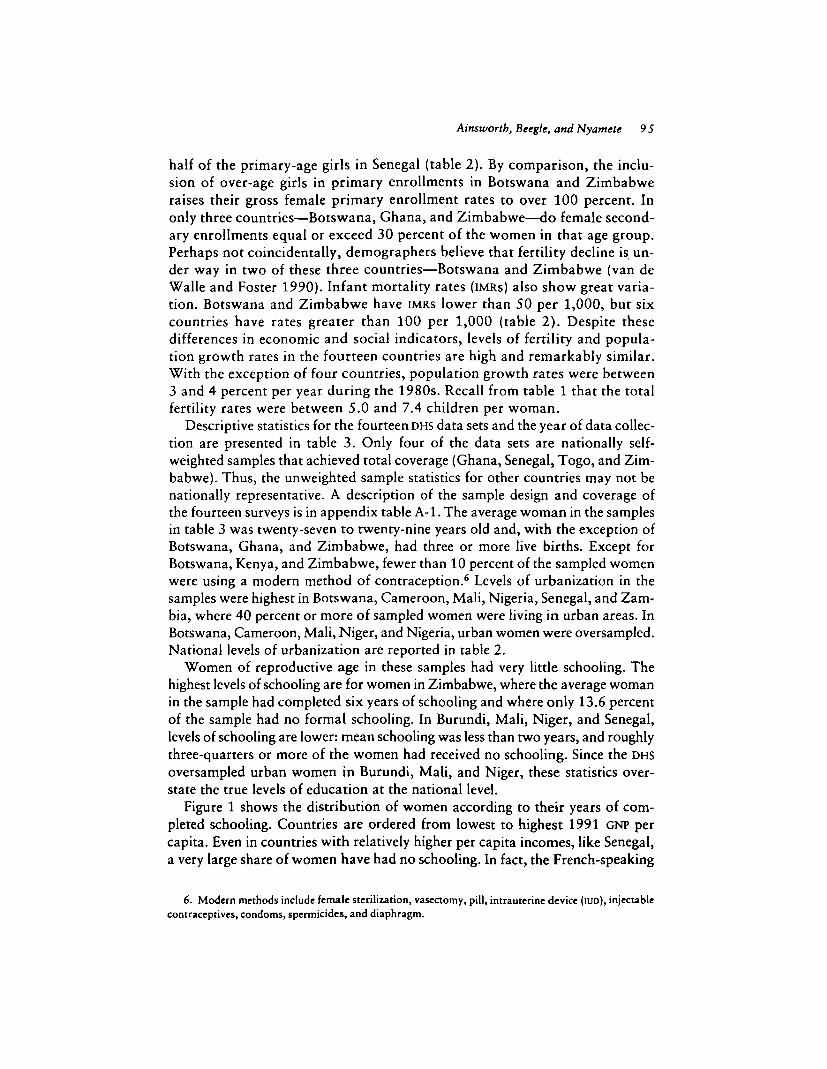
Descriptive statistics for the fourteen DHS data sets and the year of data collec-tion are presented in table 3. Only four of the data sets are nationally self-weighted samples that achieved total coverage (Ghana, Senegal, Togo, and Zim-babwe). Thus, the unweighted sample statistics for other countries may not benationally representative. A description of the sample design and coverage ofthe fourteen surveys is in appendix table A-l. The average woman in the samplesin table 3 was twenty-seven to twenty-nine years old and, with the exception ofBotswana, Ghana, and Zimbabwe, had three or more live births. Except forBotswana, Kenya, and Zimbabwe, fewer than 10 percent of the sampled womenwere using a modern method of contraception.6 Levels of urbanization in thesamples were highest in Botswana, Cameroon, Mali, Nigeria, Senegal, and Zam-bia, where 40 percent or more of sampled women were living in urban areas. InBotswana, Cameroon, Mali, Niger, and Nigeria, urban women were oversampled.National levels of urbanization are reported in table 2.
Women of reproductive age in these samples had very little schooling. Thehighest levels of schooling are for women in Zimbabwe, where the average womanin the sample had completed six years of schooling and where only 13.6 percentof the sample had no formal schooling. In Burundi, Mali, Niger, and Senegal,levels of schooling are lower: mean schooling was less than two years, and roughlythree-quarters or more of the women had received no schooling. Since the DHSoversampled urban women in Burundi, Mali, and Niger, these statistics over-state the true levels of education at the national level.
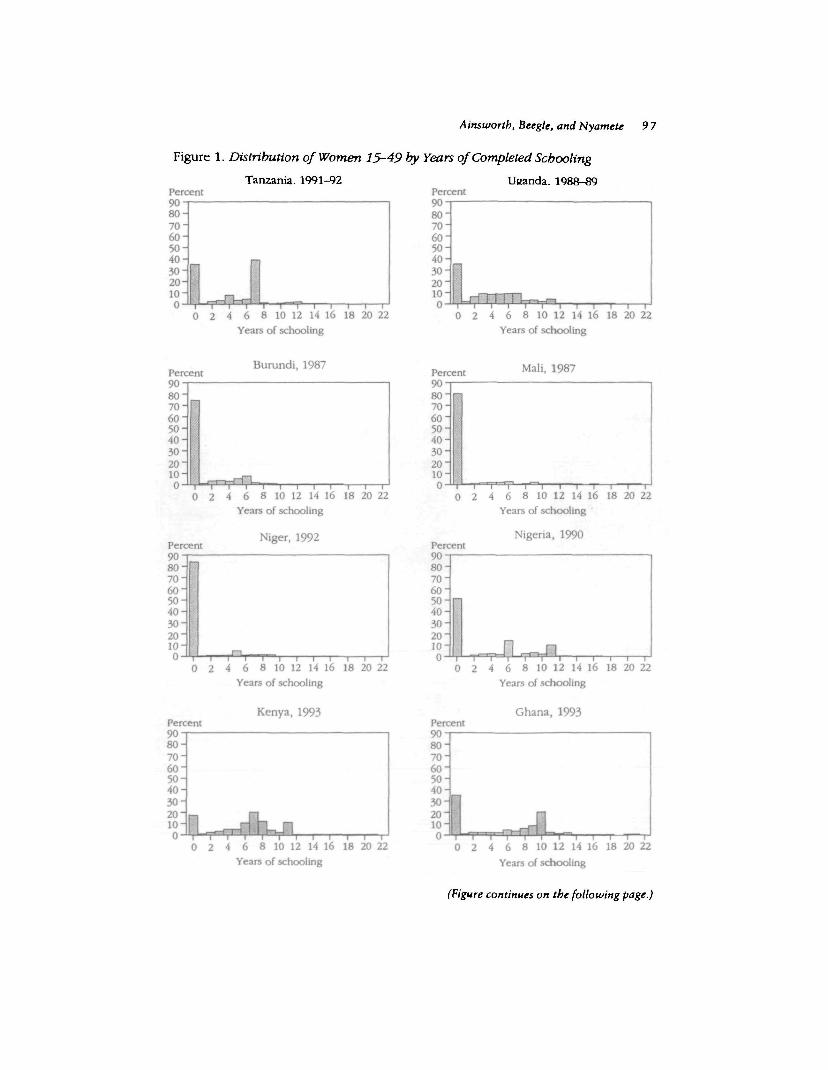
Figure 1 shows the distribution of women according to their years of com-pleted schooling. Countries are ordered from lowest to highest 1991 GNP percapita. Even in countries with relatively higher per capita incomes, like Senegal,a very large share of women have had no schooling. In fact, the French-speaking
6. Modern methods include female sterilization, vasectomy, pill, intrauterine device (IUD), injectablecontraceptives, condoms, spermicides, and diaphragm.
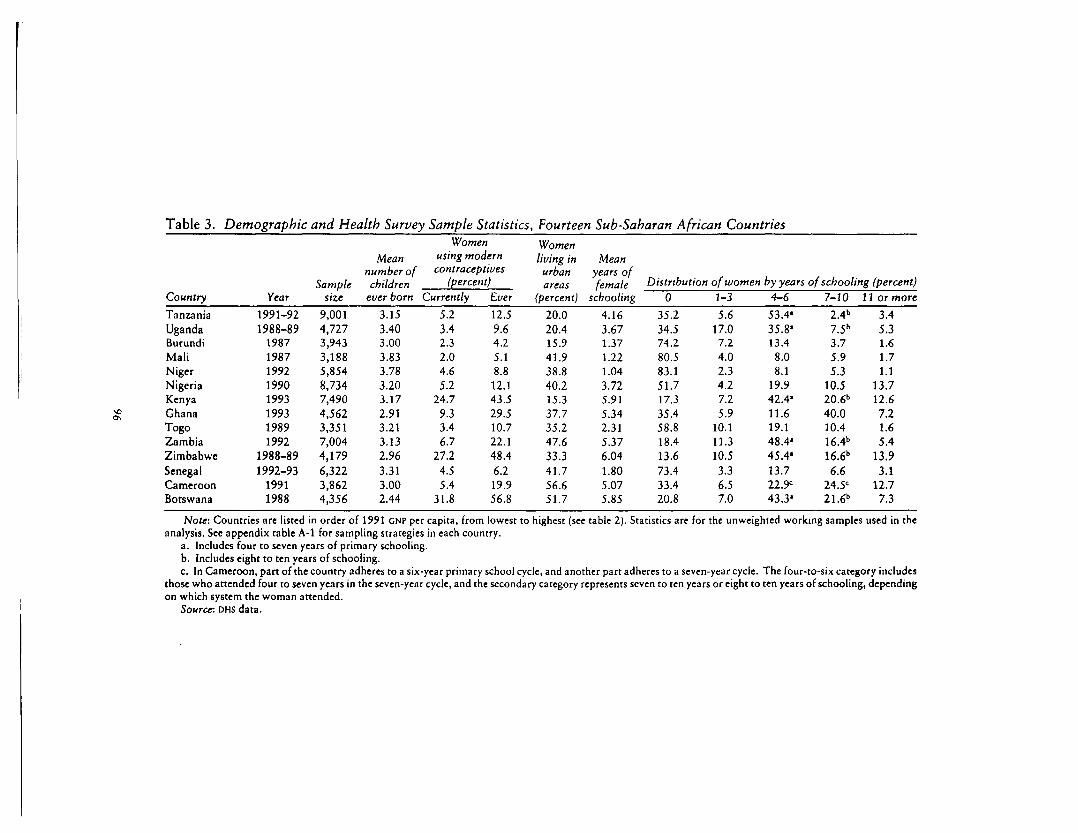
Table 3.
Country
TanzaniaUgandaBurundiMaliNigerNigeriaKenyaGhanaTogoZambiaZimbabweSenegalCameroonBotswana
Demographic and Health Survey Sample
Year
1991-921988-89
19871987199219901993199319891992
1988-891992-93
19911988
Samplesize
9,0014,7273,9433,1885,8548,7347,4904,5623,3517,0044,1796,3223,8624,356
Meannumber ofchildren
ever born
3.153.403.003.833.783.203.172.913.213.132.963.313.002.44
Statistics,Women
using moderncontraceptives
(percent)Currently
S.I3.42.32.04.65.2
24.79.33.46.7
27.24.55.4
31.8
Ever
12.59.64.25.18.812.143.529.510.722.148.46.219.956.8
Fourteen Sub-Saharan African CountriesWomenliving inurbanareas
(percent)
20.020.415.941.938.840.215.337.735.247.633.341.756.651.7
Meanyears offemale
schooling
4.163.671.371.221.043.725.915.342.315.376.041.805.075.85
Distribution of women0
35.234.574.280.583.151.717.335.458.818.413.673.433.420.8
1-3
5.617.0
7.24.02.34.27.25.9
10.111.310.53.36.57.0
by years of schooling (percent)4-6
53.41
35.8'13.48.08.1
19.942.4-11.619.148.4"45.4'13.722.SK
43.3'
7-102.4b
7.5b
3.75.95.3
10.520.6b
40.010.416.4b
16.6b
6.624.5C
21.6b
11 or more
3.45.31.61.71.1
13.712.67.21.65.4
13.93.1
12.77.3
Note: Countries are listed in order of 1991 GNP per capita, from lowest to highest (see table 2). Statistics are for the unweighted working samples used in theanalysis. See appendix table A-1 for sampling strategies in each country.
a. Includes four to seven years of primary schooling.b. Includes eight to ten years of schooling.c. In Cameroon, part of the country adheres to a six-year primary school cycle, and another part adheres to a seven-year cycle. The four-to-six category includes
those who attended four to seven years in the seven-year cycle, and the secondary category represents seven to ten years or eight to ten years of schooling, dependingon which system the woman attended.
Source'. DHS data.
Ainswonh, Beegle, and NyameU 9 7
Figure 1. Distribution of Women 15-49 by Years of Completed Schooling
Tanzania. 1991-92
' I T ' 'I' I I I I—I 1 1 1 r
0 2 4 6 8 10 12 14 16 18 20 22Years of schooling
PercentUganda. 1988-89
0 2 4 b 8 10 12 14 16 18 20 22Years of schooling
PercentBurundi, 1987
Percent
8 10 12 14 16 18 20 22Years of schooling
Niger, 1992
8 10 12 14 16 18 20 22Years of schooling
PercentMali, 1987
0 2 4 6 8 10 12 14 16 18 20 22Years of schooling '
Percent9080-70-60"50-40-30-2010-0
0 2
Nigeria, 1990
8 10 12 14 16 18 20 22Years of schooling
PercentKenya, 1993
8 10 12 14 16 18 20 22Years of schooling
Ghana, 1993
6 8 10 12 14 16 18 20 22Years of schooling
(Figure continues on the following page.)
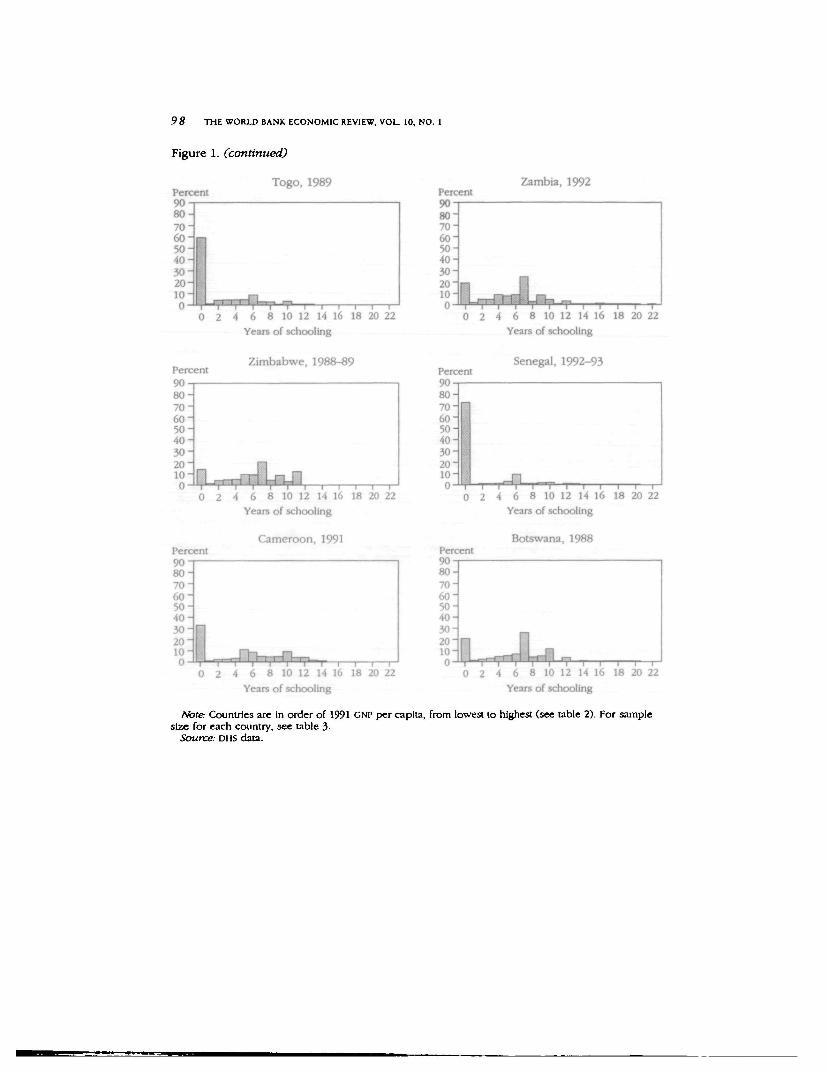
9 8 THE WORLD BANK ECONOMIC REVIEW, VOL 10, NO. 1
Figure 1. (continued)
Percentyu8070605040302010
1H1HP I .0 —I 1—0 2
Percent
8 0 -7 0 "6 0 "5 0 -4 0 -3 0 -2 0 "1 0 -
0 —I 1—0 2
Percent908 0 -7 0 -60"50-40 -30 -\U20 HI1O1L.0 lip —p-
0 2
Togo, 1989
-r-r-TU- ™t t i i i i i i i i
4 6 8 10 12 14 16 18 20 22Years of schooling
Zimbabwe, 1988-89
4 6 8 10 12 14 16 18 20 22Years of schooling
Cameroon, 1991
^-n"T-r-r-n-r-l_T
4 6 8 10 12 14 16 18 20 22Years of schoolinc
Percent
80-70-60-50-40-30-20"io-
m
0 —i—i—0 2
Percentony\J -
80-70"60"50-40-30-2 0 "10-
HH111Bn0 2
PercentVv8 0 -70"60-50-40-30-20"10- •L0-H—r—
0 2
Zambia, 1992
4 6 8 10 12 14 16Years of schooling
Senegal, 1992-93
i-FlA 6 8 10 12 14 16
Years of schooling
Botswana, 1988
•, 1*, T . :4 6 8 10 12 14 16
Years of schooling
I I I18 20 22
18 20 22
18 20 22
Note: Countries are In order of 1991 GNP per capita, from lowest to highest (see table 2). For samplesize for each country, see table 3-
Source: DHS data.
Ainsworth, Beegle, and Nyamete 99
and Sahelian countries have by far the lowest schooling of women of reproduc-tive age. But even in Ghana and Nigeria, thought to have strong educationalpolicies in the past, 35 and 50 percent of all women in these samples, respec-tively, have had no schooling. In Tanzania, once thought to have achieved uni-versal primary education, about 35 percent of women never attended school. Ofcourse, figure 1 groups together women of many different birth cohorts. Whenthe distribution of schooling is compared across cohorts, substantial progresshas been made in raising female schooling over time in Botswana, Cameroon,Ghana, Kenya, Tanzania, Zimbabwe, and Zambia. However, in Burundi, Mali,Niger, and Senegal there has been little or no change in the level of femaleeducation over time.7
The distribution of schooling among educated women is often uneven. InGhana, for example, about 35 percent of women had no schooling, and about25 percent had exactly ten years. In Botswana, Kenya, Nigeria, and Zimbabwe,"spikes" are observed in the distribution at seven years of schooling. The lumpi-ness of the distribution of schooling in some of these data sets—including therelative scarcity of observations with less than complete primary schooling—isimportant to consider in interpreting the regression results. While the mean levelof schooling may be two to three years, very few women are commonly foundwith exactly that number.
IV. WOMEN'S SCHOOLING AND FERTILITY
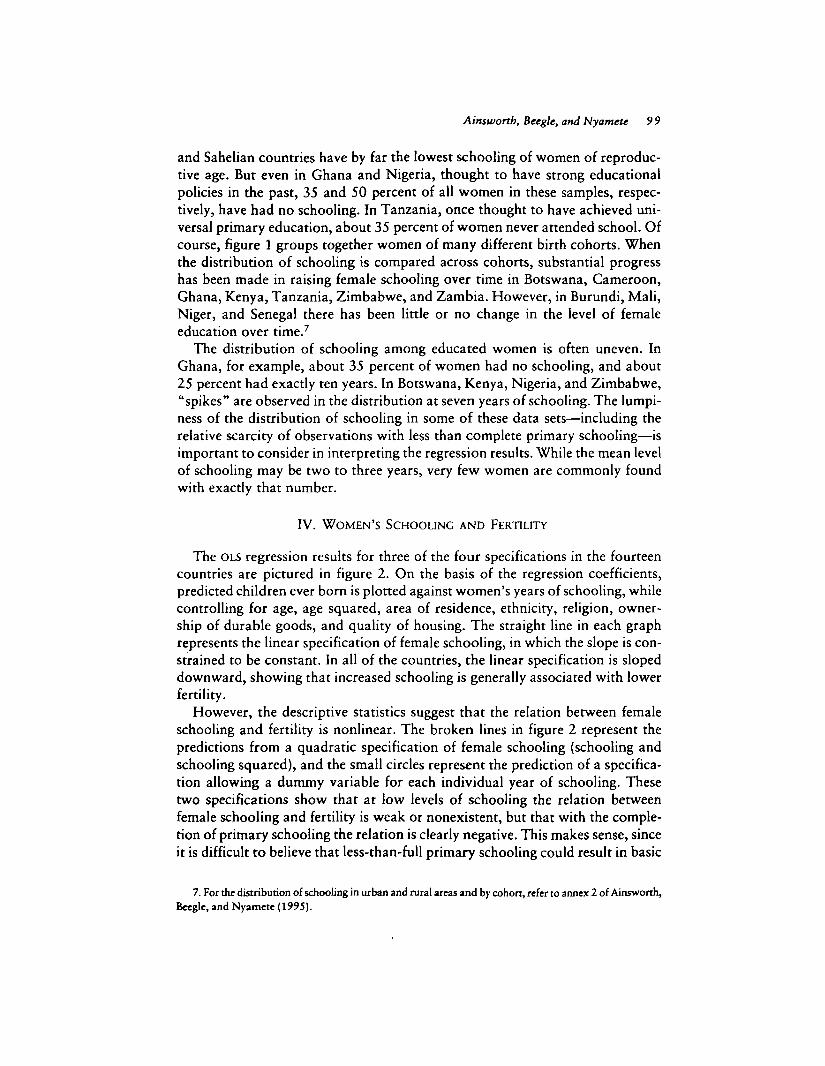
The OLS regression results for three of the four specifications in the fourteencountries are pictured in figure 2. On the basis of the regression coefficients,predicted children ever born is plotted against women's years of schooling, whilecontrolling for age, age squared, area of residence, ethnicity, religion, owner-ship of durable goods, and quality of housing. The straight line in each graphrepresents the linear specification of female schooling, in which the slope is con-strained to be constant. In all of the countries, the linear specification is slopeddownward, showing that increased schooling is generally associated with lowerfertility.
However, the descriptive statistics suggest that the relation between femaleschooling and fertility is nonlinear. The broken lines in figure 2 represent thepredictions from a quadratic specification of female schooling (schooling andschooling squared), and the small circles represent the prediction of a specifica-tion allowing a dummy variable for each individual year of schooling. Thesetwo specifications show that at low levels of schooling the relation betweenfemale schooling and fertility is weak or nonexistent, but that with the comple-tion of primary schooling the relation is clearly negative. This makes sense, sinceit is difficult to believe that less-than-full primary schooling could result in basic
7. For the distribution of schooling in urban and rural areas and by cohort, refer to annex 2 of Ainsworth,Beegle, and Nyamete (1995).
1 00 THE WORLD BANK ECONOMIC REVIEW, VOL. 10, NO. I
Figure 2. Predicted Cumulative Fertility by Female Schooling Using ThreeSpecifications
TanzaniaChildren ever bom5
4 6 8 10 12 14 16Years of schooling
Children ever bom5
Burundi
4 6 8 10 12 14 16Years of schooling
Children ever bom5
Niger
2 4 6 8 10 12 14 16Years of schooling
Children ever bomKenya
0 2 4 6 8 10 12 14 16Years of schooling
Children ever born5
Uganda
4 6 8 10 12Years of schooling
14 16
Children ever bom5
Mali
4 6 8 10 12Years of schooling
14 16
NigeriaChildren ever bom5
4 6 8 10 12Years of schooling
14 16
GhanaChildren ever bom
0 2 4 6 8 10 12Years of schooling
14 16
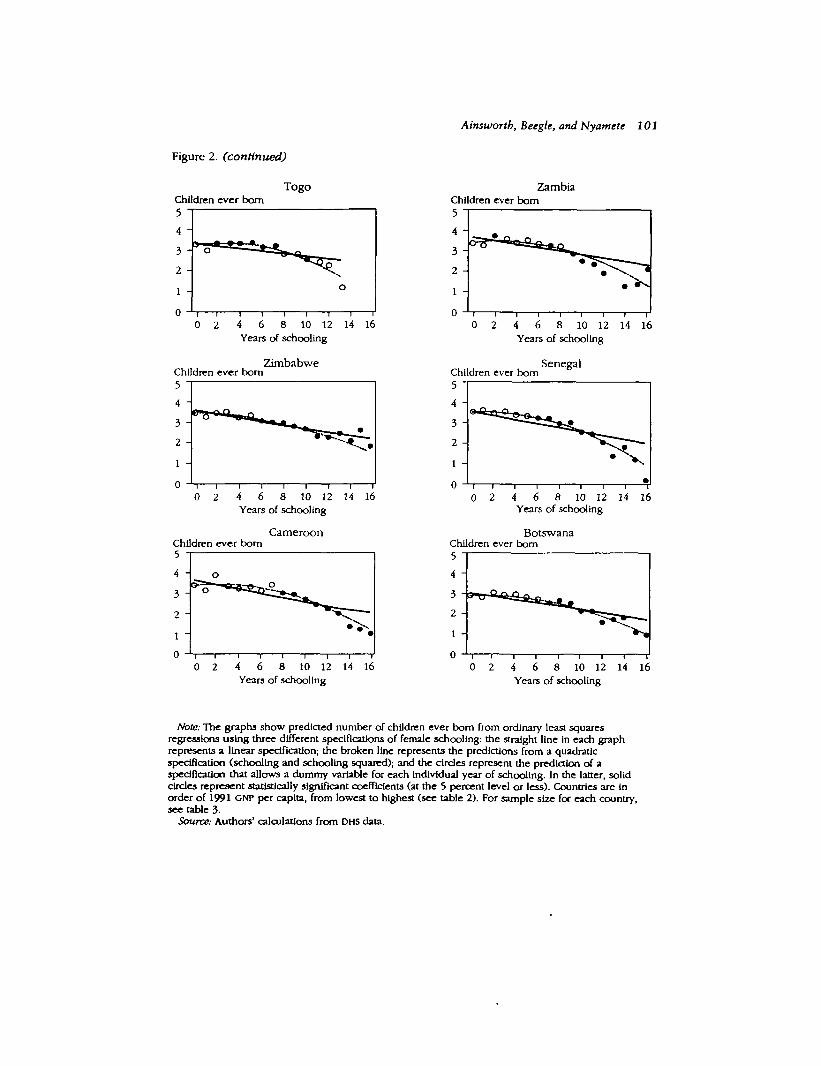
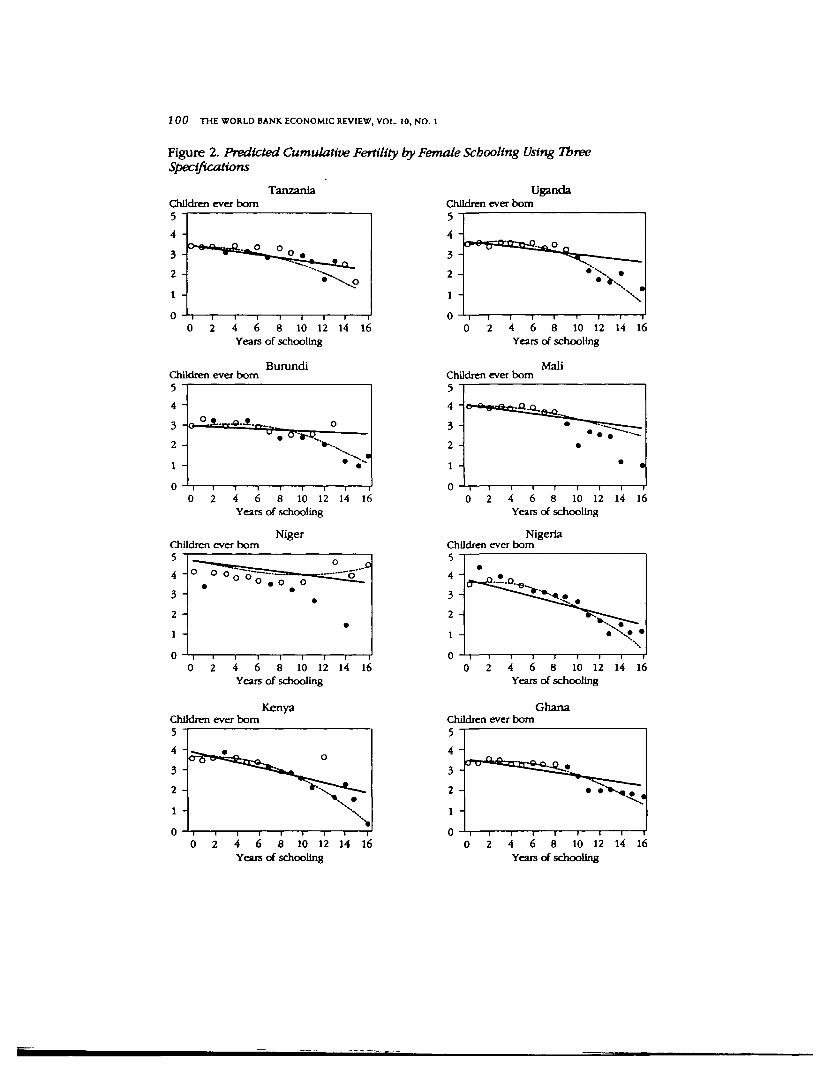
Figure 2. (continued)
Ainsworth, Beegle, and Nyamete 101
Children ever bornTogo Zambia
0 2 4 6 8 10 12 14 16Years of schooling
Children ever bornZimbabwe
0 2 4 6 8 10 12 14 16Years of schooling
Children ever bom5
Cameroon
0 2 4 6 8 10 12 14 16Years of schooling
Children ever born
2 4 6 8 10 12 14 16Years of schooling
Children ever bomSenegal
0 2 4 6 8 10 12 14 16Years of schooling
BotswanaChildren ever bom
4 6 8 10 12 14 16Years of schooling
Note: The graphs show predicted number of children ever bom from ordinary least squaresregressions using three different specifications of female schooling: the straight line in each graphrepresents a linear specification; the broken line represents the predictions from a quadraticspecification (schooling and schooling squared); and the cirdes represent the prediction of aspecification that allows a dummy variable for each individual year of schooling. In the latter, solidcirdes represent statistically significant coefficients (at the 5 percent level or less). Countries are inorder of 1991 GNP per capita, from lowest to highest (see table 2). For sample si2e for each country,see table 3.
Source: Authors' calculations from DHS data.
1 02 THE WORLD BANK ECONOMIC REVIEW, VOL. 10, NO. 1
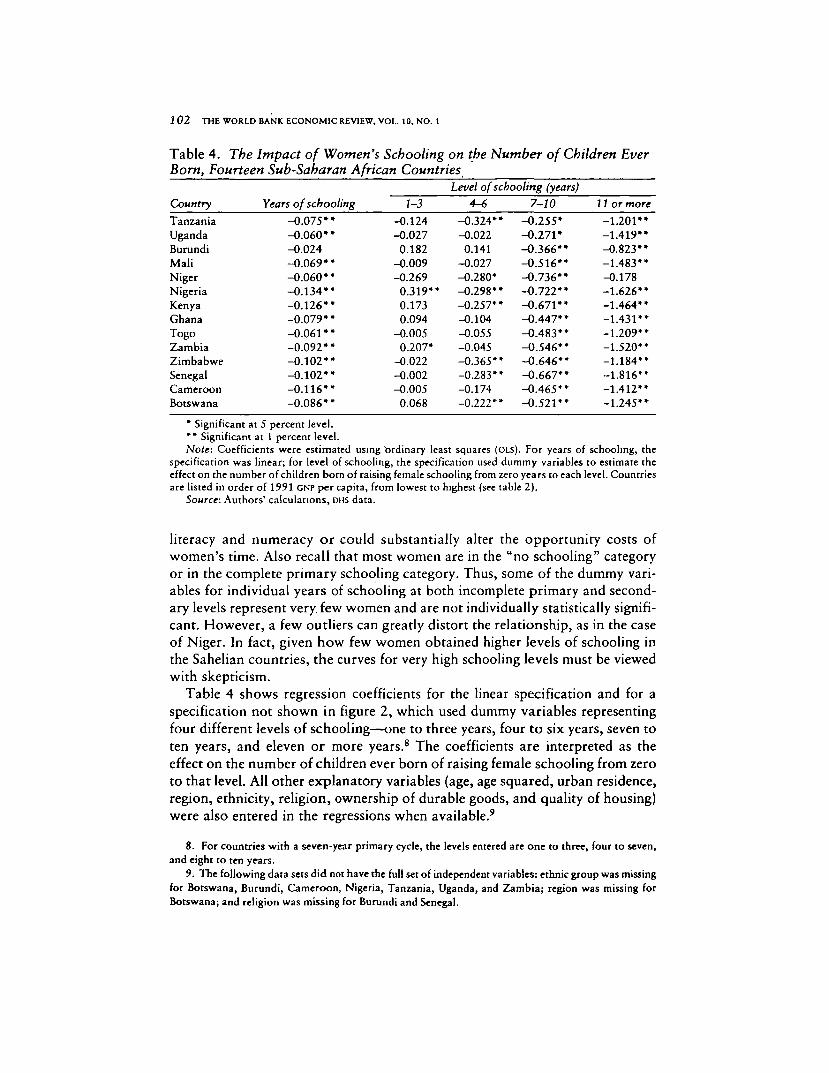
Table 4. The Impact of Women's Schooling on the Number of Children EverBorn, Fourteen Sub-Saharan African Countries
CountryTanzaniaUgandaBurundiMaliNigerNigeriaKenyaGhanaTogoZambiaZimbabweSenegalCameroonBotswana
Years of schooling-0.075**-0.060**-0.024-0.069**-0.060**-0.134**-0.126**-0.079**-0.061**-0.092**-0.102**-0.102**-0.116**-0.086**
1-3
-0.124-0.0270.182
-0.009-0.2690.319**0.1730.094
-0.0050.207*
-0.022-0.002-0.0050.068
Level of schooling (years)4-6
-0.324**-0.0220.141
-0.027-0.280*-0.298**-0.257**-0.104-0.055-0.045-0.365**-0.283**-0.174-0.222**
7-10-0.255*-0.271*-0.366**-0.516**-0.736**-0.722**-0.671**-0.447**-0.483**-0.546**-0.646**-0.667**-0.465**-0.521**
11 or more-1.201**-1.419**-0.823**-1.483**-0.178-1.626**-1.464**-1.431**-1.209**-1.520**-1.184**-1.816**-1.412**-1.245**
* Significant at 5 percent level.** Significant at 1 percent level.Note: Coefficients were estimated using "ordinary least squares (OLS). For years of schooling, the
specification was linear; for level of schooling, the specification used dummy variables to estimate theeffect on the number of children born of raising female schooling from zero years to each level. Countriesare listed in order of 1991 CNP per capita, from lowest to highest (see table 2).
Source: Authors' calculations, DHS data.
literacy and numeracy or could substantially alter the opportunity costs ofwomen's time. Also recall that most women are in the "no schooling" categoryor in the complete primary schooling category. Thus, some of the dummy vari-ables for individual years of schooling at both incomplete primary and second-ary levels represent very, few women and are not individually statistically signifi-cant. However, a few outliers can greatly distort the relationship, as in the caseof Niger. In fact, given how few women obtained higher levels of schooling inthe Sahelian countries, the curves for very high schooling levels must be viewedwith skepticism.
Table 4 shows regression coefficients for the linear specification and for aspecification not shown in figure 2, which used dummy variables representingfour different levels of schooling—one to three years, four to six years, seven toten years, and eleven or more years.8 The coefficients are interpreted as theeffect on the number of children ever born of raising female schooling from zeroto that level. All other explanatory variables (age, age squared, urban residence,region, ethnicity, religion, ownership of durable goods, and quality of housing)were also entered in the regressions when available.9
8. For countries with a seven-year primary cycle, the levels entered are one to three, four to seven,and eight to ten years.
9. The following data sets did not have the full set of independent variables: ethnic group was missingfor Botswana, Burundi, Cameroon, Nigeria, Tanzania, Uganda, and Zambia; region was missing forBotswana; and religion was missing for Burundi and Senegal.
Ainsworth, Beegle, and Nyamett 103
The number of years of female schooling is significant and negatively relatedto cumulative fertility in thirteen of the countries, despite their different levelsof female schooling and economic characteristics. With the exception of Senegal,the largest linear female schooling coefficients occur in countries in which thesamples have large shares of women with postprimary schooling (Cameroon,Kenya, Nigeria, and Zimbabwe; refer to table 3). However, Ghana has the larg-est share of sample women with postprimary education (47 percent; see the lasttwo columns in table 3) and the linear relation there is relatively small.
The results for the levels-of-schooling specification in table 4 indicate thatlower primary schooling (one to three years) is not related to cumulative fertil-ity in twelve countries and has a positive relation in two (Nigeria and Zambia).In half of the countries, women with four to six years of primary schooling have0.2 to 0.4 fewer children ever born, compared to women with no schooling, andin the other half there is no relationship. On average, controlling for covariates,women in the samples with seven to ten years of schooling had from 0.2 to0.7 fewer children ever born, and women with eleven years of schooling ormore had 0.8 to 1.8 fewer children ever born, compared with women with noschooling.
Much has been made in the literature of the sometimes-observed positiverelation between a few years of schooling and fertility. This is often explained asinadvertent outcomes of changes in proximate determinants of fertility. A posi-tive relation would imply that even one year of primary schooling is sufficient toinduce a quite large change in behaviors and outlooks that indirectly affect fertil-ity. The realities of primary schooling in most Sub-Saharan countries—in termsof poor infrastructure, extremely limited availability of reading and instructionalmaterials, inadequate teacher training and salaries, and the resulting high ab-senteeism and dropout rates—cast doubt on this interpretation (Lockheed andVerspoor 1991). Literacy is certainly not achieved in a single year of schoolingand, under the circumstances that prevail, may not even be achieved until comple-tion of primary school. A more plausible explanation is that the (small group of)women who completed only a few years of schooling are those who becamepregnant, whose families wanted them to get married, or who simply could notkeep up and therefore stopped their schooling.
Another plausible explanation for the sometime nonrelation between primaryschooling and fertility or a positive relationship is the exclusion of variables likehousehold income from the regressions. If, as incomes rise, parents want morechildren, holding wages and other prices constant, then higher incomes shouldbe associated with higher fertility. If there is a strong association between schooledwomen and higher incomes, and if income is not properly controlled for, thenthe schooling coefficients may be absorbing both the negative schooling andpositive income effects, which cancel out. This would also imply that the co-efficients on women's schooling are underestimates of the negative relation withfertility. This was found to be the case in Cote d'lvoire, where omitting incomefrom fertility regressions notably weakened the schooling coefficient in magni-
1 04 THE WORLD BANK ECONOMIC REVIEW, VOL. 10, NO. 1
tude (Ainsworth 1989). The controls for household assets—durable goods.andquality of housing—may not have completely alleviated this problem in thisstudy.
By the later years of primary schooling, however, some degree of literacyshould have been achieved, even for women who did not complete primary school.Thus, we expect a negative relation in these cases. However, the last years ofprimary schooling are associated with lower fertility in only half of the countriesand have no association in the other half. Understanding why this relation existsin some countries and not others is important to policymaking. It might reflectdifferences in the quality of instruction or differences in labor market conditionsacross countries, for example. Part of the explanation may also lie withcomplementarity between schooling and the availability of family planning ser-vices; Botswana, Kenya, and Zimbabwe have the strongest family planning pro-grams and also show negative relations between female primary schooling andfertility.
The strong negative association between women's higher secondary school-ing and cumulative fertility evidenced in figure 2 and table 4 persists across allof the countries in the sample, regardless of their level of development, distribu-tion of schooling, or intensity of family planning programs. (Niger is an excep-tion; fewer than 0.1 percent of women had eleven or more years of schooling.)These results suggest that, with or without easy access to family planning, highlyeducated women do manage to lower their fertility. When supplies are scarce,highly educated women have the greatest access to contraceptive services byvirtue of their education and probable income levels. However, in three coun-tries with more active family planning programs, even women with only pri-mary instruction are able to lower their fertility.
There is no obvious relation between the size of the linear schooling coefficientsin table 4 and GNP per capita. This is not surprising, because cumulative fertilityis likely to reflect past levels of income. Nigeria's income levels, for example,are vastly lower now than they were during the oil boom of the 1970s. In addi-tion, GNP per capita hides differences in the distribution of income that mayaccount for differential effects of schooling. Within countries, the regressionresults for ownership of assets revealed a negative relation between income andfertility in Botswana, Ghana, Tanzania, and Togo, but a positive relation inNigeria. Results for other countries were ambiguous (see Ainsworth, Beegle,and Nyamete 1995).
Urban and Rural Samples
In the Botswana, Cameroon, Mali, Nigeria, Senegal, and Zambia data sets, 40percent or more of women were living in urban areas. The least urbanized samplesare in Burundi, Kenya, Tanzania, and Uganda, with 20 percent or fewer womenin urban areas. Figure 3 shows predicted cumulative fertility using a linear splinespecification of female schooling at zero to three, four to six , seven to ten, andeleven or more years of schooling, in urban and rural areas (Greene 1993). The
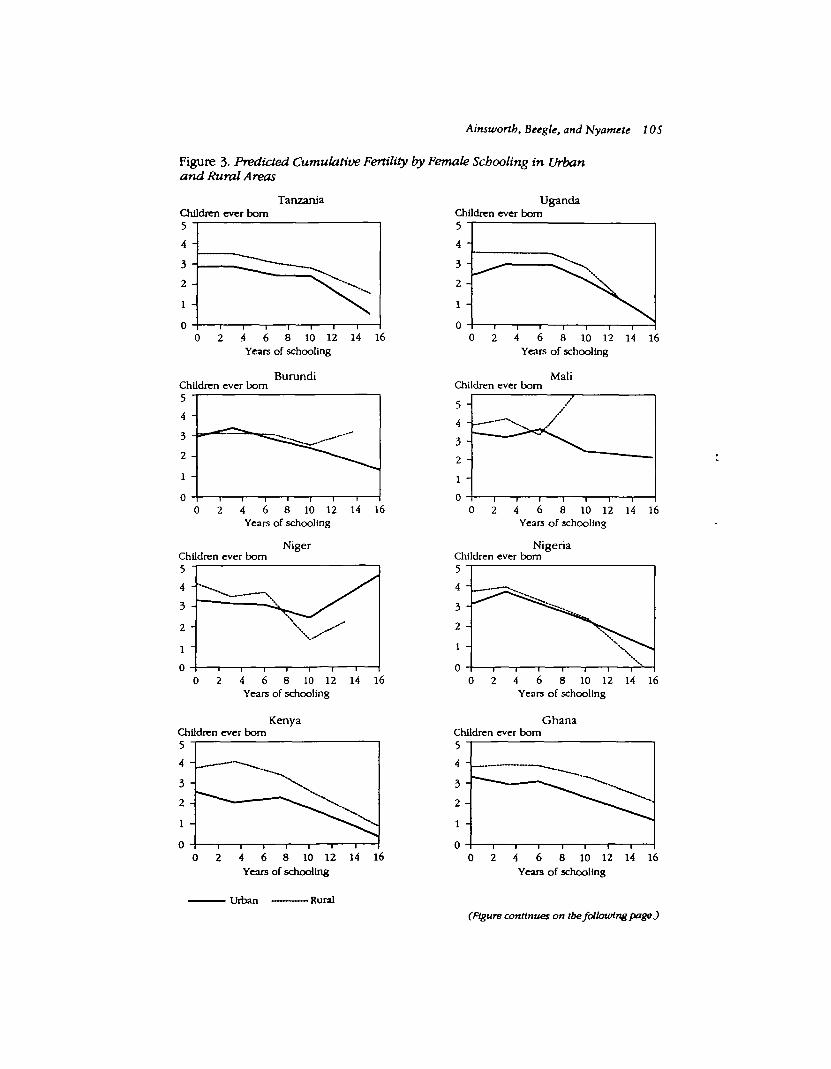
Ainswortb, Beegle, and Nyamete 105
Figure 3- Predicted Cumulative Fertility by Female Schooling in Urbanand Rural Areas
TanzaniaChildren ever born
.4 6 8 10 12 14 16Years of schooling
Children ever bornBurundi
2 4 6 8 10 12 14 16Years of schooling
Children ever bomNiger
2 4 6 8 10 12 14 16Years of schooling
Children ever bornKenya
2 4 6 8 10 12 14 16Years of schooling
Children ever born5
Uganda
4 6 8 10 12 14 16Years of schooling
Children ever bornMali
4 6 8 10 12 14 16Years of schooling
NigeriaChildren ever bom
4 6 8 10 12 14 16Years of schooling
GhanaChildren ever bom
4 6 8 10 12 14 16Years of schooling
Urban -Rural
(Figure continues on tbe following page.)
1 06 THE WORLD BANK ECONOMIC REVIEW, VOL. 10, NO. 1
Figure 3- (continued)
Children ever bomTogo Zambia
2 4 6 8 10 12 14 16Years of schooling
Children ever bornZimbabwe
2 4 6 8 10 12 14 16Years of schooling
Children ever born5
Cameroon
4 6 8 10 12 14 16Years of schooling
Children ever born
4 6 8 10 12 14 16Years of schooling
Children ever bornSenegal
0 2 4 6 8 10 12 14 16Years of schooling
BotswanaChildren ever born
2 4 6 8 10 12 14 16Years of schooling
Urban -Rural
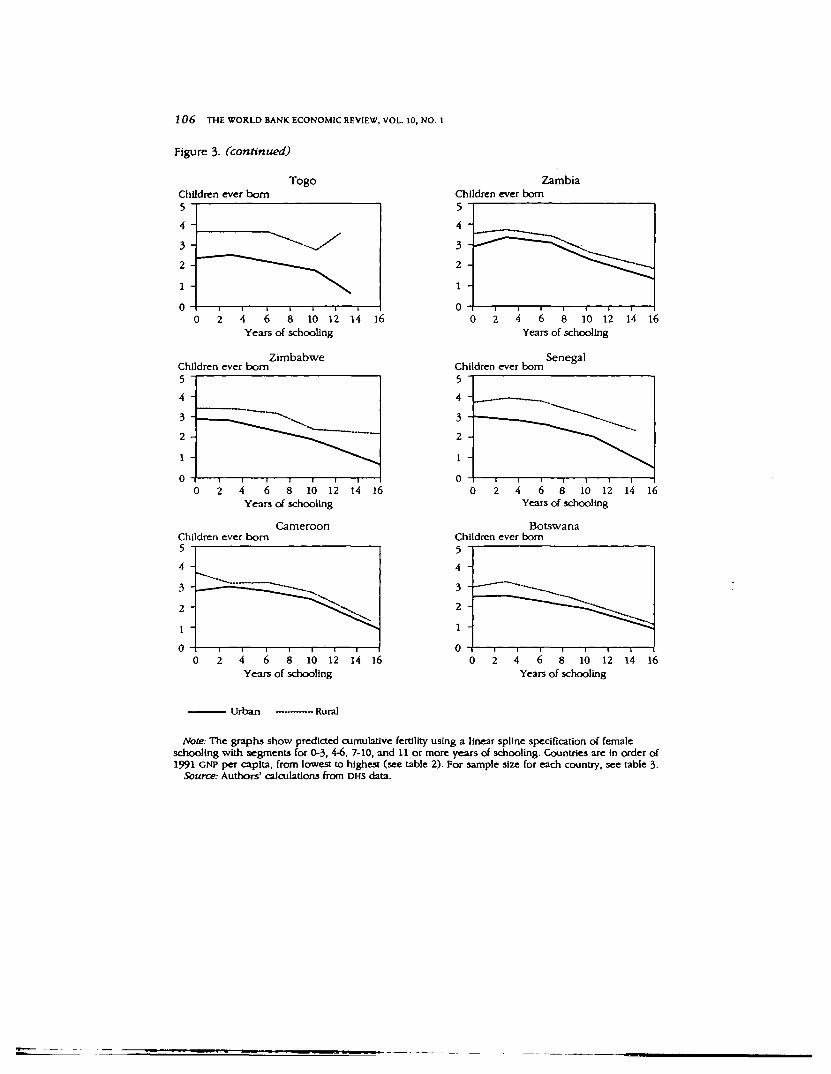
Note: The graphs show predicted cumulative fertility using a linear spline specification of femaleschooling with segments for 0-3, 4-6, 7-10, and 11 or more years of schooling. Countries are In order of1991 GNP per capita, from lowest to highest (see table 2). For sample size for each country, see table 3.
Source: Authors' calculations from DHS data.
Ainsworth, Beegle, and Nyamete 107
linear spline specification is jointly significant for all countries in urban and ruralareas, with the exception of urban areas in Niger and rural areas in Burundi.However, specific segments of many of these curves are not statistically signifi-cant. The coefficients underlying figure 3 can be obtained from the authors.
In interpreting the results, it is important to keep in mind that 90 percent ormore of rural women in Mali, Niger, and Senegal, and 64 percent of urban womenin Mali and Niger, had no schooling. Thus, the results for higher-order splinesare based on very few cases and the results are highly sensitive to outliers. Withthese caveats in mind, differences between urban and rural women within andacross countries are nevertheless interesting. Fertility declines with increases infemale schooling in both urban and rural areas, particularly after primary school-ing. The early years of primary schooling are associated with higher fertility inurban Nigeria and Uganda, but are otherwise insignificant. In most of the coun-tries, family "planning services are not easily available in rural areas, yet veryeducated rural women (there are few of them) nevertheless have lower fertility.In fact, the differential between women with eleven or more years of schoolingand those with no schooling is often greater in rural than urban areas (Cameroon,Kenya, Niger, Nigeria, Uganda, and Zambia) (see figure 3).
In general, at every level of schooling urban women have lower fertility thanrural women. This may be due to a variety of factors, including more labormarket opportunities, higher costs of children, and more readily available healthand family planning services in urban areas. Nigeria is an important excep-tion—at the highest levels of schooling, fertility declines more rapidly in ruralareas and is in fact lower than in urban areas. Fertility in urban and rural areasalso converges at higher levels of female schooling in Botswana, Kenya, andUganda. When controlling for female schooling, differentials between urbanand rural fertility are quite small in Botswana, Cameroon, Nigeria, and Zam-bia, but remain large in Ghana, Senegal, and Togo.
Results by Cohort
The relation between women's schooling and fertility may change over time.As female enrollment rates rise, a greater percentage of each successive cohorthas had schooling. The level of schooling of the woman relative to the schoolingof her cohort may alter the returns to schooling and thus the relation betweenschooling and fertility. Even if enrollment rates were to remain constant, changesin the quality and content of schooling over time might result in changes in theeffectiveness of women's schooling in altering fertility behavior. Finally, overtime other variables in the environment may also change, enhancing or detractingfrom the relationship. For example, making family planning more available mightalter the effea of schooling on cumulative fertility by substituting for the schoolingof poor women (lowering fertility even for women with no schooling) or byavailing more educated women of the means to keep their fertility low.
Regressions run by cohort (ages fifteen to twenty-four, twenty-five to thirty-four, and thirty-five to forty-nine) reveal that the overall relation between
1 08 THE WORLD BANK ECONOMIC REVIEW, VOL. 10, NO. 1
women's schooling and cumulative fertility is negative in the youngest and middle-age cohorts in all of the countries and in the oldest cohort in more than half ofthe countries (results are available from the authors). The negative relation be-tween schooling and cumulative fertility is almost always larger in the middlecohort than in the youngest cohort. The results suggest that the effect of women'sschooling on fertility increases with the woman's age, and middle-aged edu-cated women are not "catching up" with the fertility of others in their cohort tocompensate for lower fertility while young. The association of partial or com-pleted primary schooling with lower cumulative fertility is observed to a greaterextent among the youngest cohort. However, Botswana, Ghana, and Zambia,which have relatively high levels of schooling, show no significant effect of pri-mary schooling in any of the cohorts. The higher levels of schooling are asso-ciated with significantly lower fertility in all cohorts, even in countries with lowlevels of schooling in the older cohort.
Women's Schooling Compared with Men's
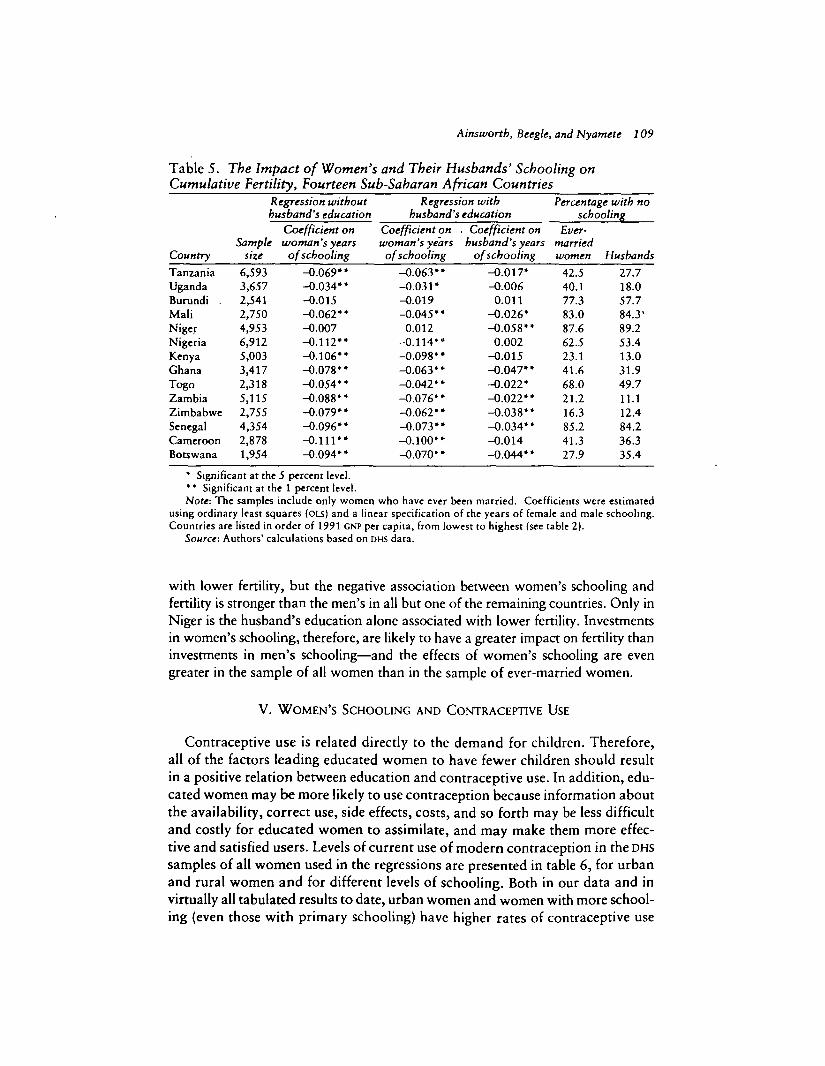
An issue of policy interest is the relative impact of men's and women's schoolingon cumulative fertility. Because child rearing is not generally intensive in thetime of the father in these countries, we do not expect higher education andearning capacity of husbands to raise the "price" of children, as does women'seducation. More often, husband's education is used as a proxy for householdincome, and it may be a better proxy for income than the ownership of durablegoods, which are already controlled for. Inclusion of an income proxy may alterthe size of the woman's schooling coefficients to the extent that they are corre-lated with income or husband's education. However, to examine these issues wemust restrict ourselves to the sample of ever-married women in each data set.Depending on the country, the sample of ever-married women may be as smallas 45 percent of the total sample (Botswana) or as large as 86 percent (Mali).The restricted sample, conditioned on marital status, can be expected to show asmaller schooling effect for ever-married women than for all women, becausethe influence of schooling on delayed age at first birth of the unmarried womenin the sample will not be included. Table 5 presents the OLS regression results ofchildren ever born on the linear specification of woman's schooling, with andwithout the husband's schooling.
The woman's schooling coefficients for the sample of ever-married women intable 5 (second column) are generally smaller than for the sample of all womenin table 4, and in Uganda and Zimbabwe the difference is considerable. Thisresult confirms the point made earlier that studies restricted to samples of ever-married women may understate the relation between female schooling and fertility.
In table 5, controlling for husband's education generally acts to reduce slightlythe woman's education coefficient (column three). In four countries (Cameroon,Kenya, Nigeria, and Uganda) only the woman's schooling is associated with lowerfertility; the coefficients on husband's schooling (column four) are not significant.When statistically significant, increases in the husband's schooling are associated
Ainsworth, Beegle, and Nyamete 109
Table 5. The Impact of Women's and Their Husbands' Schooling onCumulative Fertility, Fourteen Sub-Saharan African Countries
CountryTanzaniaUgandaBurundi .MaliNigerNigeriaKenyaGhanaTogoZambiaZimbabweSenegalCameroonBotswana
Regression withouthusband's education
Coefficient onSample woman's years
size6,5933,6572,5412,7504,9536,9125,0033,4172,3185,1152,7554,3542,8781,954
of schooling- 0 . 0 6 9 "-0.034**-0.015-0.062**-0.007-0.112**-0.106**-0.078**-0.054**-0.088**-0.079**-0.096**-0.111**-0.094**
Regression withhusband's education
Coefficient onwoman's yearsof schooling
-0.063**-0.031*-0.019-0.045**
0.012-0.114**-0.098**-0.063**-0.042**-0.076**-0.062**-O.073**-0.100**-0.070**
. Coefficient onhusband's years
of schooling-0.017*-0.006
0.011-0.026*-0.058**
0.002-0.015-0.047**-0.022*-0.022**-0.038**-0.034**-0.014-0.044**
Percentage with noschooling
Ever-marriedwomen
42.540.177.383.087.662.523.141.668.021.216.385.241.327.9
Husbands27.718.057.784.3'89.253.413.031.949.711.112.484.236.335.4
* Significant at the 5 percent level.* * Significant at the 1 percent level.Note: The samples include only women who have ever been married. Coefficients were estimated
using ordinary least squares (OLS) and a linear specification of the years of female and male schooling.Countries are listed in order of 1991 CNP per capita, from lowest to highest (see table 2).
Source: Authors' calculations based on DHS data.
with lower fertility, but the negative association between women's schooling andfertility is stronger than the men's in all but one of the remaining countries. Only inNiger is the husband's education alone associated with lower fertility. Investmentsin women's schooling, therefore, are likely to have a greater impact on fertility thaninvestments in men's schooling—and the effects of women's schooling are evengreater in the sample of all women than in the sample of ever-married women.
V. WOMEN'S SCHOOLING AND CONTRACEPTIVE USE
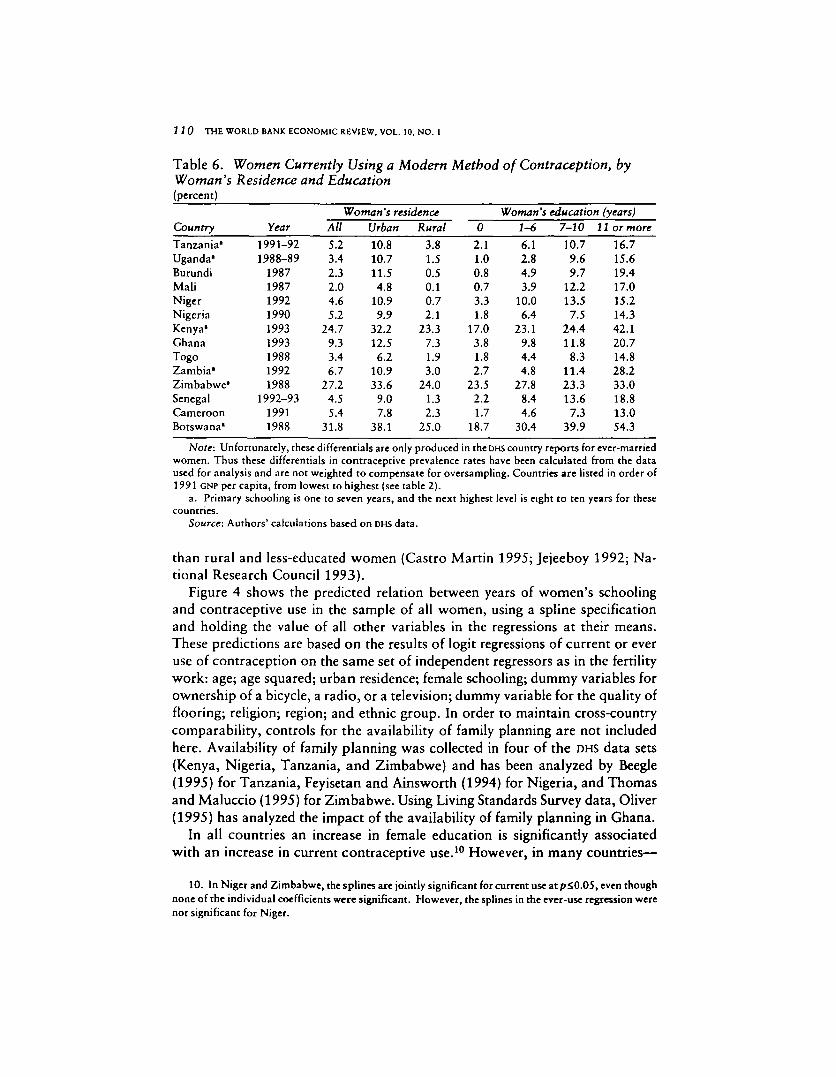
Contraceptive use is related directly to the demand for children. Therefore,all of the factors leading educated women to have fewer children should resultin a positive relation between education and contraceptive use. In addition, edu-cated women may be more likely to use contraception because information aboutthe availability, correct use, side effects, costs, and so forth may be less difficultand costly for educated women to assimilate, and may make them more effec-tive and satisfied users. Levels of current use of modern contraception in the DHSsamples of all women used in the regressions are presented in table 6, for urbanand rural women and for different levels of schooling. Both in our data and invirtually all tabulated results to date, urban women and women with more school-ing (even those with primary schooling) have higher rates of contraceptive use
110 THE WORLD BANK ECONOMIC REVIEW, VOL. 10, NO. 1
Table 6. Women Currently Using a Modern Method of Contraception, byWoman's Residence and Education(percent)
Country
Tanzania*Uganda"BurundiMaliNigerNigeriaKenya'GhanaTogoZambia"Zimbabwe"SenegalCameroonBotswana'
Year
1991-921988-89
198719871992199019931993198819921988
1992-9319911988
All
5.23.42.32.04.65.2
24.79.33.46.7
27.24.55.4
31.8
Woman's residence
Urban
10.810.711.54.8
10.99.9
32.212.56.2
10.933.6
9.07.8
38.1
Rural
3.81.50.50.10.72.1
23.37.31.93.0
24.01.32.3
25.0
0
2.11.00.80.73.31.8
17.03.81.82.7
23.52.21.7
18.7
Woman's education (years)
1-6
6.12.84.93.9
10.06.4
23.19.84.44.8
27.88.44.6
30.4
7-1010.7
9.69.7
12.213.57.5
24.411.8
8.311.423.313.6
7.339.9
11 or more
16.715.619.417.015.214.342.120.714.828.233.018.813.054.3
Note: Unfortunately, these differentials are only produced in the DHS country reports for ever-marriedwomen. Thus these differentials in contraceptive prevalence rates have been calculated from the dataused for analysis and are not weighted to compensate for oversampling. Countries are listed in order of1991 GNP per capita, from lowest to highest (see table 2).
a. Primary schooling is one to seven years, and the next highest level is eight to ten years for thesecountries.
Source: Authors' calculations based on DHS data.
than rural and less-educated women (Castro Martin 1995; Jejeeboy 1992; Na-tional Research Council 1993).
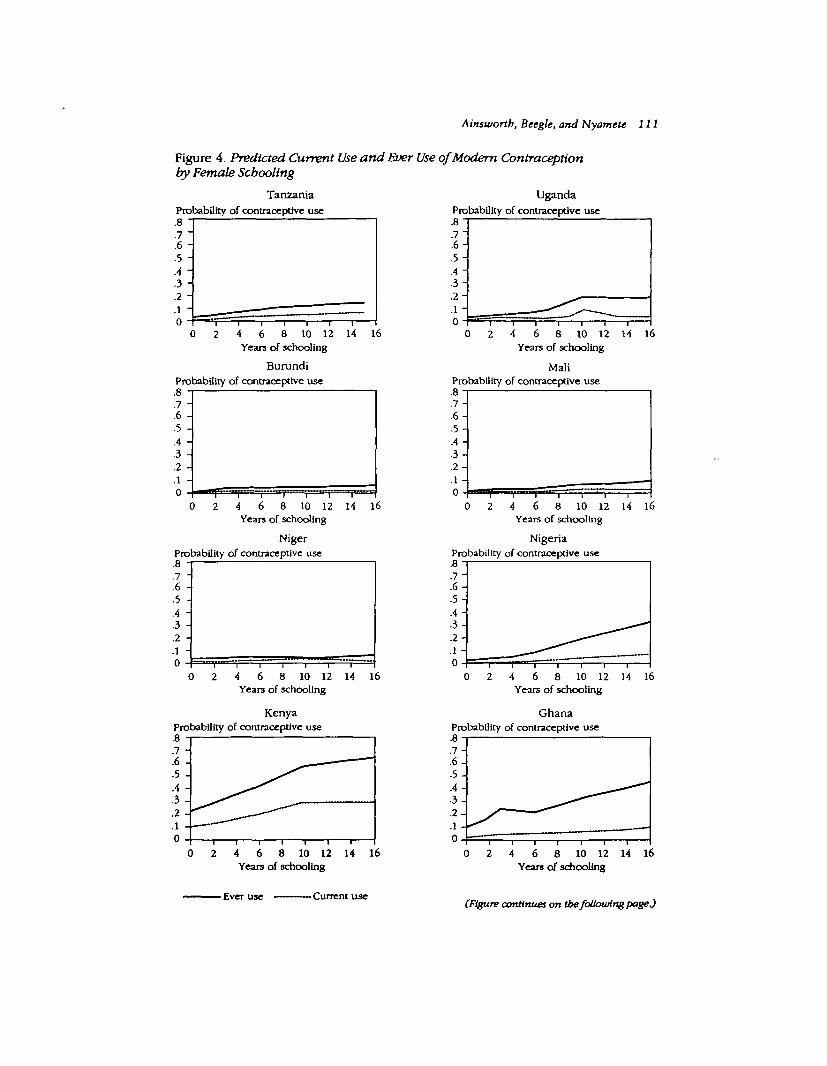
Figure 4 shows the predicted relation between years of women's schoolingand contraceptive use in the sample of all women, using a spline specificationand holding the value of all other variables in the regressions at their means.These predictions are based on the results of logit regressions of current or everuse of contraception on the same set of independent regressors as in the fertilitywork: age; age squared; urban residence; female schooling; dummy variables forownership of a bicycle, a radio, or a television; dummy variable for the quality offlooring; religion; region; and ethnic group. In order to maintain cross-countrycomparability, controls for the availability of family planning are not includedhere. Availability of family planning was collected in four of the DHS data sets(Kenya, Nigeria, Tanzania, and Zimbabwe) and has been analyzed by Beegle(1995) for Tanzania, Feyisetan and Ainsworth (1994) for Nigeria, and Thomasand Maluccio (1995) for Zimbabwe. Using Living Standards Survey data, Oliver(1995) has analyzed the impact of the availability of family planning in Ghana.
In all countries an increase in female education is significantly associatedwith an increase in current contraceptive use.10 However, in many countries—
10. In Niger and Zimbabwe, the splines are jointly significant for current use atp£0.05, even thoughnone of the individual coefficients were significant. However, the splines in the ever-use regression werenot significant for Niger.
Ainsworth, Beegle, and Nyamete 111
Figure 4. Predicted Current Use and Ever Use of Modem Contraceptionby Female Schooling
TanzaniaProbability of contraceptive use
0 2 4 6 8 10 12Years of schooling
BurundiProbability of contraceptive use
14
0 2 4 6 8 10 12Years of schooling
NigerProbability of contraceptive use
14
0 2 4 6 8 10 12 14Years of schooling
KenyaProbability of contraceptive use
2 4 6 8 10 12 14 16Years of schooling
UgandaProbability of contraceptive use
0 2 4 6 8 10 12 14 16Years of schooling
MaliProbability of contraceptive use.8.7 -.6-. 5 -.4 -. 3 -.2 -.1 -0
0 2 4 6 8 10 12Years of schooling
NigeriaProbability of contraceptive use
14 16
I I i 1 1 r
0 2 4 6 8 10 12 14 16Years of schooling
GhanaProbability of contraceptive use
2 4 6 8 10 12 14 16Years of schooling
• Ever use - Current use (Figure continues on the following page J
112 THE WORLD BANK ECONOMIC REVIEW, VOL. 10, NO. 1
Figure 4. (continued)
Togo
Probability of contraceptive use
0 2 4 6 8 10 12 14Years of schooling
Zimbabwe
Probability of contraceptive use
0 2 4 6 8 10 12 14Years of schooling
Cameroon
Probability of contraceptive use
4 6 8 10 12Years of schooling
14
Zambia
Probability of contraceptive use
0 2 4 6 8 10 12Years of schooling
SenegalProbability of contraceptive use
0 2 4 6 8 10 12 14 16Years of schooling
Botswana
Probability of contraceptive use
0 2 4 6 8 10 12 14 16Years of schooling
• Ever use -Current use
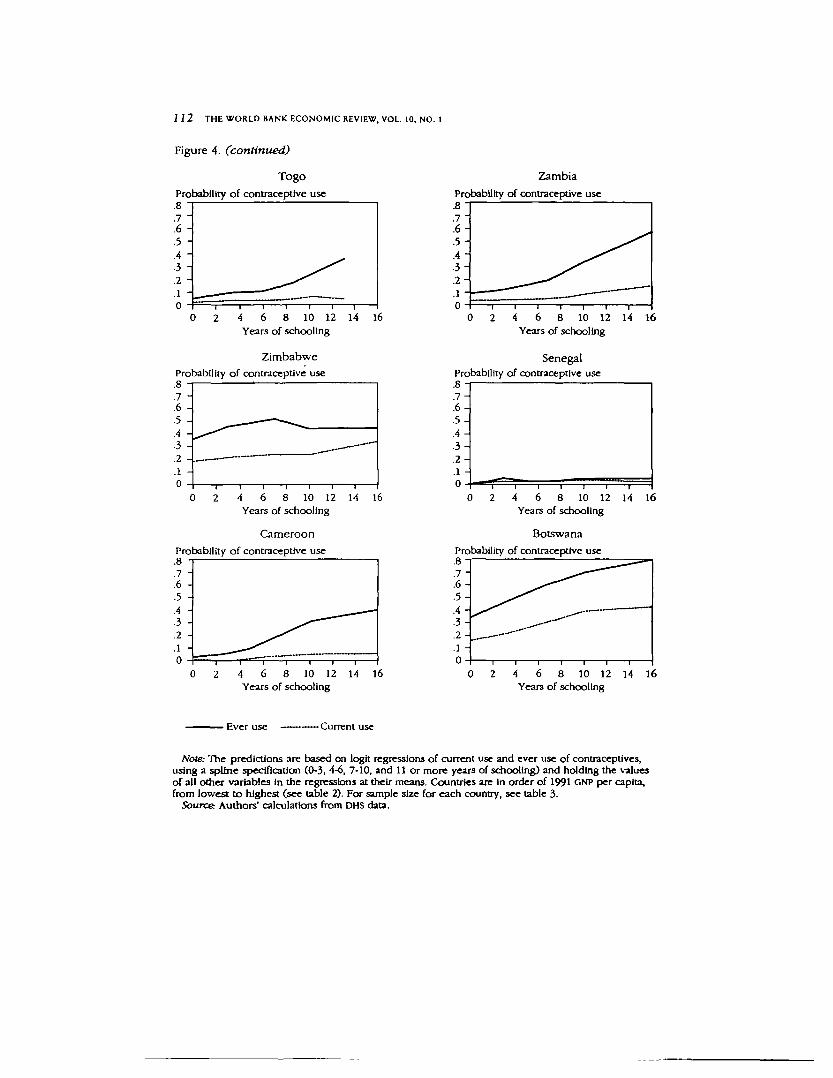
Note: The predictions are based on logit regressions of current use and ever use of contraceptives,using a spline specification (0-3, 4-6, 7-10, and 11 or more years of schooling) and holding the valuesof all other variables In the regressions at their means. Countries are In order of 1991 GNP per capita,from lowest to highest (see table 2). For sample size for each country, see table 3.
Source: Authors' calculations from DHS data.
A i n s w o r t h , Beegle, and Nyamett 113
most with very low levels of female schooling and limited availability of familyplanning—both current and ever use are low, even among women with highlevels of schooling. The major increase in current contraceptive use in Burundi,Ghana, Niger, Senegal, and Tanzania occurs at the early years of female school-ing, and there is very little increase in contraceptive use with additional school-ing beyond primary. In fact, even in countries where higher levels of femaleschooling show positive gradients (Botswana, Cameroon, Kenya, and Zambia),the slope of the relationship at earlier years of schooling is steeper. Only inZimbabwe does the relationship between female schooling and current con-traceptive use seem to steepen with increased schooling levels. However, it isimportant to remember that there are very few women with high levels of school-ing in the majority of these countries. Thus, this last segment of the spline maybe very sensitive to outliers and responsible for seemingly weaker (or contrary)results for higher levels of schooling in some of the countries. The education-contraceptive use gradient is steeper for ever use of contraception as educationrises, with the exception of Niger (where there is no significant relation for everuse) and Senegal and Zimbabwe (where the relationship is basically flat for allbut the early levels of schooling). The relationship between female schoolingand contraceptive use does not seem to have any relation to the level of GNP percapita. For example, Senegal and Zimbabwe have the same GNP per capita, butthe relationship is quite different in the two countries. Within countries, owner-ship of assets was associated with higher contraceptive use, particularly in Kenya,Nigeria, Tanzania, Zambia, and Zimbabwe (Ainsworth, Beegle, and Nyamete1995).
These results represent the relationship between female schooling and con-traceptive use at the time of the surveys, holding all other factors constant.However, they do not represent an immutable relationship or law unique andunchanging for every country. As the average level and quality of female school-ing and the returns to education rise in countries like Burundi, Mali, and Niger,if the experience of other countries is a guide, their curves will very likely shiftupward. Likewise, the steepness and height of the relationship should also berelated to the availability of contraception. In Zimbabwe, for example, the slopeof the curve is fairly flat. It may be that the greater availability of contraceptionmutes differentials in contraceptive use by education in Zimbabwe relative toKenya, which shows sharp curvature upward. Figures for Zimbabwe andBotswana thirty years ago would have looked quite different than they do now,following major investments in female schooling and better contraceptive services.
Urban and Rural Samples
The effect of schooling on contraceptive use is generally greater in urban thanin rural areas (not shown). At the mean level of female schooling in the samples,an additional year of schooling is associated with 0.4 to 2.6 percentage pointsincrease in current contraceptive use in urban areas and 0.1 to 1.8 percentagepoints increase in rural areas. In urban areas the early years of primary school-
114 THE WORLD BANK ECONOMIC REVIEW, VOL. 10, NO. 1
ing are associated with higher contraceptive use only in Mali. However, in nineof the countries the later years of primary schooling have an impact; amongthose for which this is not the case are countries with relatively high averageschooling levels—Cameroon, Ghana, Zambia, and Zimbabwe. The only coun-try for which higher levels of schooling do not significantly affect contraceptiveuse in urban areas is Zimbabwe. Possibly the relatively wider availability ofcontraceptives in urban areas of that country mutes differentials in contracep-tive use by female schooling. Contraceptive use is so low in rural areas thatregressions could be run on rural data from only eight countries. The early yearsof primary schooling are more likely to be associated with increased contracep-tive use in rural areas than in urban areas.
Women's Schooling Compared with Men's
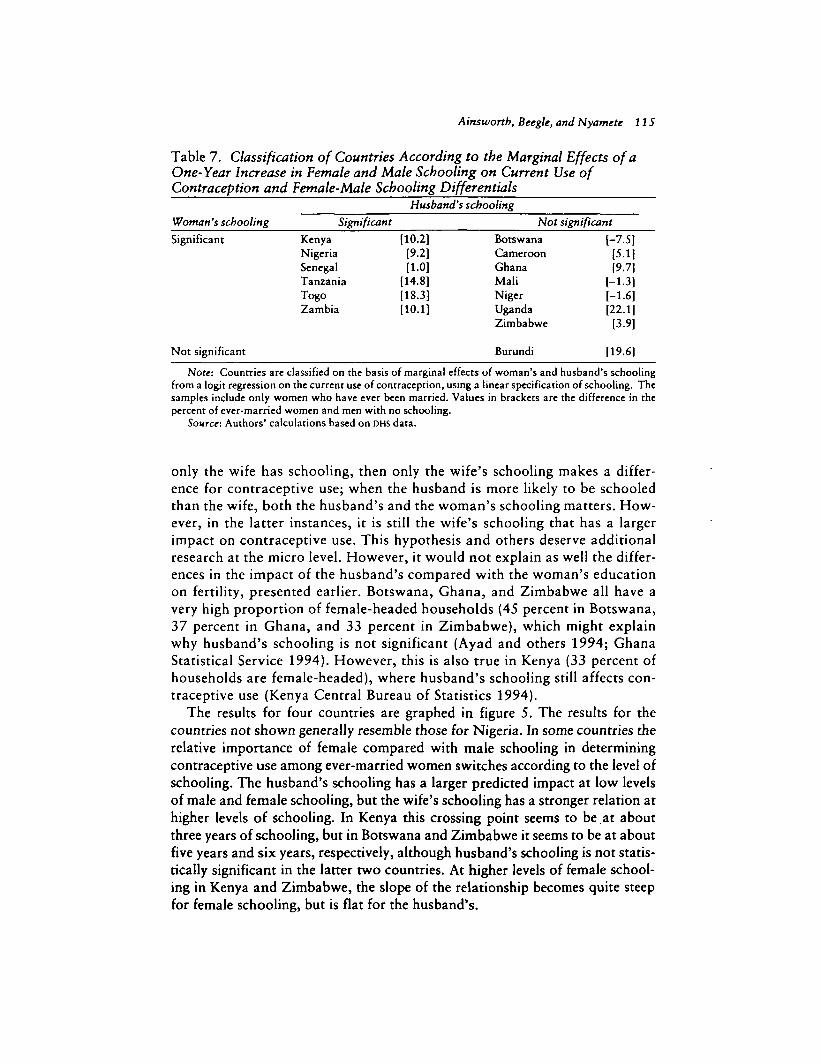
Table 7 classifies countries according to the relative strength of the relation-ship between the woman's and husband's schooling and current contraceptiveuse, among the sample of ever-married women. In half the countries, only thewoman's schooling is a statistically significant determinant of current contracep-tive use. This group includes countries with both the highest and lowest averagelevels of female schooling, income, and availability of contraceptives (for ex-ample, Botswana and Zimbabwe, as well as Mali and Niger). In six countries,both the woman's and husband's schooling are significant. However, in all ofthese countries the coefficient on the woman's schooling is greater in absolutevalue than the husband's schooling coefficient.
What can explain the unusual grouping of seemingly different countries? Thecountries for which only female schooling is a statistically significant determi-nant of contraceptive use are those for which husbands and wives have roughlyequal probabilities of having received instruction. In Mali and Niger, for ex-ample, from table 5, the percentage of wives and husbands without any school-ing is high and roughly equal, while in Cameroon and Zimbabwe the percentageis lower but still similar between husbands and wives. In Botswana, fewer hus-bands than wives have any schooling. The most important exception is Uganda,which has a spread of 22 percentage points between wives and husbands in thepercent with any schooling. In the countries where both husband's and wife'sschooling are significant determinants of contraceptive use, the differential be-tween the percentage of husbands and wives with any schooling is generallygreater. An important exception is Burundi, where the differential between thepercentage of husbands and wives with no schooling is great, but neither is signifi-cant. Another important exception is Senegal, where there is basically nodifference between the percentage of husbands and wives with no schooling, butboth the wife's and husband's schooling coefficients are significant.
The observation that women and their husbands have similar schoolinglevels in countries where only the woman's schooling is a significant deter-minant of contraceptive use would be consistent with a bargaining powerexplanation. That is, when husbands and wives have both been schooled or
Ainsworth, Beegle, and Nyamete US
Table 7. Classification of Countries According to the Marginal Effects of aOne-Year Increase in Female and Male Schooling on Current Use ofContraception and Female-Male Schooling Differentials
Woman's schooling
Significant
Not significant
Significant
KenyaNigeriaSenegalTanzaniaTogoZambia
Husband's schooling
[10.2][9.2][1.0]
[14.8][18.3][10.1]
Not significant
BotswanaCameroonGhanaMaliNigerUgandaZimbabwe
Burundi
[-7.5][5.1][9.7]
[-1.3][-1.6][22.1]
[3.9]
[19.6]
Note: Countries are classified on the basis of marginal effects of woman's and husband's schoolingfrom a logit regression on the current use of contraception, using a linear specification of schooling. Thesamples include only women who have ever been married. Values in brackets are the difference in thepercent of ever-married women and men with no schooling.
Source: Authors' calculations based on DHS data.
only the wife has schooling, then only the wife's schooling makes a differ-ence for contraceptive use; when the husband is more likely to be schooledthan the wife, both the husband's and the woman's schooling matters. How-ever, in the latter instances, it is still the wife's schooling that has a largerimpact on contraceptive use. This hypothesis and others deserve additionalresearch at the micro level. However, it would not explain as well the differ-ences in the impact of the husband's compared with the woman's educationon fertility, presented earlier. Botswana, Ghana, and Zimbabwe all have avery high proportion of female-headed households (45 percent in Botswana,37 percent in Ghana, and 33 percent in Zimbabwe), which might explainwhy husband's schooling is not significant (Ayad and others 1994; GhanaStatistical Service 1994). However, this is also true in Kenya (33 percent ofhouseholds are female-headed), where husband's schooling still affects con-traceptive use (Kenya Central Bureau of Statistics 1994).
The results for four countries are graphed in figure 5. The results for thecountries not shown generally resemble those for Nigeria. In some countries therelative importance of female compared with male schooling in determiningcontraceptive use among ever-married women switches according to the level ofschooling. The husband's schooling has a larger predicted impact at low levelsof male and female schooling, but the wife's schooling has a stronger relation athigher levels of schooling. In Kenya this crossing point seems to be at aboutthree years of schooling, but in Botswana and Zimbabwe it seems to be at aboutfive years and six years, respectively, although husband's schooling is not statis-tically significant in the latter two countries. At higher levels of female school-ing in Kenya and Zimbabwe, the slope of the relationship becomes quite steepfor female schooling, but is flat for the husband's.
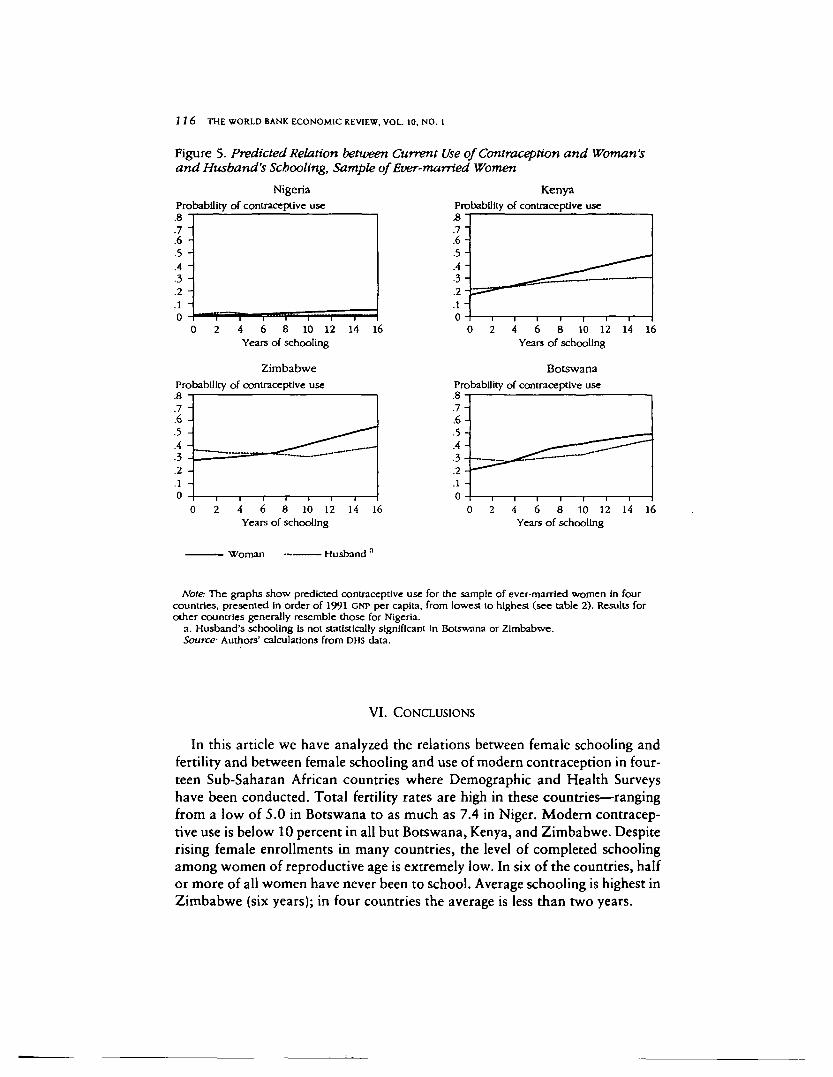
116 THE WORLD BANK ECONOMIC REVIEW, VOL. 10, NO. 1
Figure 5. Predicted Relation between Current Use of Contraception and Woman'sand Husband's Schooling, Sample of Ever-married Women
NigeriaProbability of contraceptive use
0 2 4 6 8 10 12 14Years of schooling
ZimbabweProbability of contraceptive use
4 6 8 10 12Years of schooling
KenyaProbability of contraceptive use
0 2 4 6 8 10 12 14 16Years of schooling
BotswanaProbability of contraceptive use
4 6 8 10 12 14 16Years of schooling
Woman • Husband :
Note: The graphs show predicted contraceptive use for the sample of ever-married women In fourcountries, presented In order of 1991 GNP per capita, from lowest to highest (see table 2). Results forother countries generally resemble those for Nigeria.
a. Husband's schooling is not statistically significant In Botswana or Zimbabwe.Source- Authors' calculations from DHS data.
VI. CONCLUSIONS
In this article we have analyzed the relations between female schooling andfertility and between female schooling and use of modern contraception in four-teen Sub-Saharan African countries where Demographic and Health Surveyshave been conducted. Total fertility rates are high in these countries—rangingfrom a low of 5.0 in Botswana to as much as 7.4 in Niger. Modern contracep-tive use is below 10 percent in all but Botswana, Kenya, and Zimbabwe. Despiterising female enrollments in many countries, the level of completed schoolingamong women of reproductive age is extremely low. In six of the countries, halfor more of all women have never been to school. Average schooling is highest inZimbabwe (six years); in four countries the average is less than two years.
A i n s w o r t h , Beegle, a n d Nyamete 1 1 7
We find strong support for the negative correlation between female schoolingand cumulative fertility in virtually all of the countries, in both urban and ruralareas. However, the relationship is nonlinear. The first three years of primaryschooling have no relation with fertility in twelve of the fourteen countries.Children are unlikely to become literate in the first three years, and given thestate of schooling systems on the continent, it is unlikely that a single year ortwo of schooling would be enough to radically transform a child's world out-look. Thus, we interpret the two instances of a significant positive effect of earlyprimary schooling on fertility as evidence of some type of selectivity operatingamong those who dropped out with only a year or two of schooling, rather thanas a schooling effect. The last years of primary schooling have a negative rela-tion with fertility in about half of the countries and no relation in the remainder.Secondary schooling is universally associated with lower fertility, even in coun-tries with less-vigorous family planning programs.
Jejeeboy (1992:3), reviewing the evidence on education and fertility prima-rily from the World Fertility Survey, characterized the evidence for "a uniformlyinverse relationship" in the poorest countries as "shaky": "a little educationappears to lead to higher fertility and we are likely to observe a curvilinear orreversed U-shaped relationship." In fact, she points to an inverted-U shape inten of twelve African countries, implying that at low levels of schooling fertilityrises. In this article, we use different and more recent data sets, control for manymore factors simultaneously (including wealth), and use microanalysis of actualfertility (as opposed to the TFR). We find very limited evidence of a positiverelation between female schooling and fertility in these countries, and at suchlow levels of schooling that we question the line of causation.
The most intriguing difference among the results for women's schooling andfertility is that for half of the countries upper primary schooling has a negativerelation with fertility, and it has no effect in others. Could this reflect differencesin the quality of instruction (with a time lag), differences in the labor marketsthat affect the returns to upper primary schooling, or perhaps differences in theavailability of family planning? Unfortunately, exogenous measures of theseexplanatory variables are not among those available in the individual data sets.Internationally comparable data at the national level are hard to come by andare of varying quality. In additional country-level regressions (with a samplesize of fourteen), the infant mortality rate, GNP per capita, percentage of female-headed households, and various representations of the distribution or averagelevels of female schooling were not statistically significant predictors of thosecountries in which four to six years of primary schooling has a negative relationwith fertility. Additional research to explain these differences would be veryuseful to schooling and population policies.
Female schooling has also been found to greatly raise the likelihood of con-traceptive use, even among women with primary schooling only. However, aswith fertility, the relation is nonlinear. While women with higher levels of school-ing are increasingly more likely to use contraceptives, an important finding is
118 THE WORLD BANK ECONOMIC REVIEW, VOL. 10, NO. 1
that often the marginal relation between an additional year of female schoolingand contraceptive use is greatest at the primary schooling level. Again, under-standing why this is observed in some countries and not others, and the relationof these results to the availability of contraception, could lead to new policyinsights.
Another important difference to be explained across countries is the relativeimpact of male and female schooling on fertility and contraceptive use, amongthe sample of ever-married women. Husband's schooling has no significant rela-tion with fertility in about one-third of the countries. In countries where bothwomen's and men's schooling matter, women's schooling exerts a much largernegative effect on fertility than does men's schooling. The analysis also con-firmed that female schooling effects are lower when the samples are restrictedto ever-married women. This means that studies that are based on married womenunderstate the effects of schooling on fertility and contraceptive use. Husband'sschooling is associated with higher contraceptive use in only half of the fourteencountries. In cases where men's schooling is statistically significant, it generallyexerts a smaller influence than female schooling. These results are additionalevidence of the importance of investing in female education to lower fertilityand raise contraceptive use. However, attempts to explain why only femaleschooling matters in some countries but both male and female schooling matterin others were not successful, either for fertility or contraceptive use.11
This study used multivariate analysis of cross-sectional data to examine mar-ginal relationships—such as the relation in the cross-section of altering school-ing by a small amount. However, the levels of female schooling in these coun-tries are so low that more than just marginal increases in female schooling willbe necessary. The multivariate regression results do not help us to infer thelikely impact of large changes in female schooling—such as ensuring that the 40percent of women with no schooling complete seven years of primary educa-tion. Further, other factors held constant in these regressions—like income—might also change as a result of large increases in schooling. The experience ofBotswana, Kenya, and Zimbabwe—where major investments in schooling andfamily planning have been made in the past decade—may be better indicators ofthe likely effect of similar policies in other countries. These investments willimprove the quality of life for women and children and enhance their futurecontribution to development, in addition to lowering fertility.
11. Regressors included GNP per capita, the infant mortality rate, the difference between the percentageof males and females with no education, the percentage of female-headed households, and various measuresof the level and distribution of female schooling. Unfortunately, there are no good measures of exogenousavailability of family planning services across countries that do not somehow incorporate actual levels ofcontraceptive use.
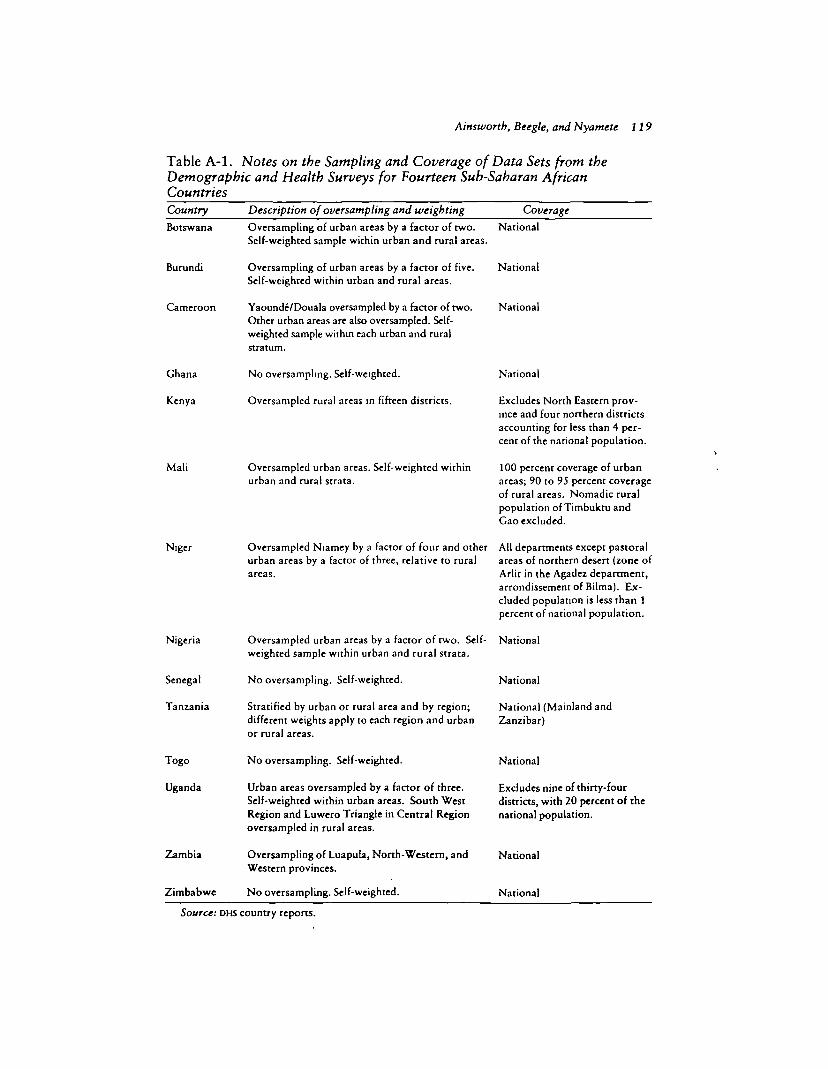
A i n s w o r t h , Beegle, and Nyamete 1 1 9
Table A-l. Notes on the Sampling and Coverage of Data Sets from theDemographic and Health Surveys for Fourteen Sub-Saharan AfricanCountriesCountry Description of oversampling and weighting Coverage
Botswana Oversampling of urban areas by a factor of two. NationalSelf-weighted sample within urban and rural areas.
Burundi Oversampling of urban areas by a factor of five. NationalSelf-weighted within urban and rural areas.
Cameroon Yaounde/Douala oversampled by a factor of two. NationalOther urban areas are also oversampled. Self-weighted sample within each urban and rural
Ghana No oversampling. Self-weighted.
Kenya Oversampled rural areas in fifteen districts.
Mali
Niger
Nigeria
Senegal
Tanzania
Togo
Uganda
Zambia
Zimbabwe
Oversampled urban areas. Self-weighted withinurban and rural strata.
Oversampled Niamey by a factor of four and otherurban areas by a factor of three, relative to ruralareas.
Oversampled urban areas by a factor of two. Self-weighted sample within urban and rural strata.
No oversampling. Self-weighted.
Stratified by urban or rural area and by region;different weights apply to each region and urbanor rural areas.
No oversampling. Self-weighted.
Urban areas oversampled by a factor of three.Self-weighted within urban areas. South WestRegion and Luwero Triangle in Central Regionoversampled in rural areas.
Oversampling of Luapula, North-Western, andWestern provinces.
No oversampling. Self-weighted.
National
Excludes North Eastern prov-ince and four northern districtsaccounting for less than 4 per-cent of the national population.
100 percent coverage of urbanareas; 90 to 95 percent coverageof rural areas. Nomadic ruralpopulation of Timbuktu andGao excluded.
All departments except pastoralareas of northern desert (zone ofArlit in the Agadez department,arrondissement of Bilma). Ex-cluded population is less than 1percent of national population.
National
National
National (Mainland andZanzibar)
National
Excludes nine of thirty-fourdistricts, with 20 percent of thenational population.
National
National
Source: DHS country reports.
120 THE WORLD BANK ECONOMIC REVIEW, VOL. 10, NO. 1
REFERENCES
The word "processed" describes informally reproduced works that may not be com-monly available through library systems.
Ahn, Namkee, and Abusaleh Shariff. 1994. "A Comparative Study of Fertility Determi-nants in Togo and Uganda." International Family Planning Perspectives 20(l):14—17.
Ainsworth, Martha. 1989. Socioeconomic Determinants of Fertility in Cote d'lvoire.LSMS Working Paper 53. Washington, D.C.: World Bank.
. 1990. "The Demand for Children in Cote d'lvoire: Economic Aspects of Fertil-ity and Child Fostering." Ph.D. dissertation. Yale University, Department of Eco-nomics, New Haven, Conn. Processed.
Ainsworth, Martha, Kathleen Beegle, and Andrew Nyamete. 1995. The Impact of Fe-male Schooling on Fertility and Contraceptive Use: A Study of Fourteen Sub-Saharan Countries. LSMS Working Paper 110. Washington, D.C.: World Bank.
Alam, Iqbal, and J. B. Casterline. 1984. Socio-Economic Differentials in Recent Fertil-ity. WFS Comparative Studies 33. Voorburg, Netherlands: International StatisticalInstitute.
Anker, Richard. 1985. "Problems of Interpretation and Specification in Analyzing Fertil-ity Differentials: Illustrated with Kenyan Survey Data." In Ghazi Farooq and GeorgeSimmons, eds., Fertility in Developing Countries. London: Macmillan Press.
Anker, Richard, and James C. Knowles. 1982. Fertility Determinants in DevelopingCountries: A Case Study of Kenya. Liege, Belgium: Ordina Editions.
Ayad, Mohamed, Andrea Piani, Bernard Barrere, Koffi Ekouevi, and James Otto. 1994."Demographic Characteristics of Households." Demographic and Health SurveysComparative Studies 14. Macro International, Inc., Calverton, Md. Processed.
Beegle, Kathleen. 1995. The Quality and Availability of Family Planning Services andContraceptive Use in Tanzania. LSMS Working Paper 114. Washington, D.C.: WorldBank.
Benefo, Kofi Darkwa, and T. Paul Schultz. 1994. Determinants of Fertility and ChildMortality in Cote d'lvoire and Ghana. LSMS Working Paper 103. Washington, D.C.:World Bank.
Bongaarts, John, Odile Frank, and Ron Lesthaeghe. 1984. "The Proximate Determi-nants of Fertility in Sub-Saharan Africa." Population and Development Review10(3):511-37.
Burafuta, Jean-Paul, and David Shapiro. 1992. "Les determinants de la fecondite auBurundi: Analyse des donnees de PEnquete Demographique et de Sante du Burundi(1987)." Universite de Burundi, Centre Universitaire de Recherche pour le Develop-pement Economique et Social (CURDES). Bujumbura, Burundi. Processed.
Caldwell, John C , and Pat Caldwell. 1987. "The Cultural Context of High Fertility inSub-Saharan Africa." Population and Development Review 13(3):409-37.
. 1990. "High Fertility in Sub-Saharan Africa." Scientific American 262(May):118-24.
Casterline, John B., Sushella Singh, John Cleland, and Hazel Ashurst. 1984. The Proxi-mate Determinants of Fertility. WFS Comparative Studies 39. Voorburg, Netherlands:International Statistical Institute.
Castro Martin, Teresa. 1995. "Women's Education and Fertility: Results from TwentyDemographic and Health Surveys." Studies in Family Planning 26(4): 187-202.
Ainswortb, Beegle, and Nyamete 121
Chernichovsky, Dov. 1985. "Socio-Economic Correlates of Fertility Behavior in RuralBotswana." In Dov Chernichovsky, Robert E. B. Lucas, and Eva Mueller, TheHousehold Economy of Rural Botswana. World Bank Staff Working Paper 715.Washington, D.C.
Cleland, John, and German Rodriguez. 1988. "The Effect of Parental Education onMarital Fertility in Developing Countries." Population Studies 42:419-42.
Cochrane, Susan Hill. 1979. Fertility and Education: What Do We Really Know} WorldBank Staff Occasional Papers 26. Baltimore: Johns Hopkins University Press.
. 1988. "The Effects of Education, Health and Social Security on Fertility inDeveloping Countries." WPS 93. World Bank, Washington, D.C. Processed.
Cochrane, Susan H., and Samir Farid. 1990. "Socioeconomic Differentials in Fertilityand Their Explanation." In George T. F. Acsadi, Gwendolyn Johnson-Acsadi, andRodolfo Bulatao, eds., Population Growth and Reproduction in Sub-Saharan Af-rica: Technical Analyses of Fertility and Its Consequences. A World Bank Sympo-sium. Washington, D.C.
Fairlamb, Cheryl D., and Wilhelmus L. Nieuwoudt. 1991. "Economic Factors AffectingHuman Fertility in the Developing Areas of Southern Africa." Agricultural Econom-ics 6:185-200.
Farooq, Ghazi M. 1985. "Household Fertility Decision-Making in Nigeria." In GhaziFarooq and George Simmons, eds., Fertility in Developing Countries. London:Macmillan Press.
Fenn, Thomas, Therese McGinn, and Yves Charbit. 1987. "Direct and Indirect Det-erminants of Fertility in Burkina Faso." Paper presented at the Annual Meetings ofthe Population Association of America, Chicago, April 30-May 2. Processed.
Feyisetan, Bamikale J., and Martha Ainsworth. 1994. Contraceptive Use and the Qual-ity, Price, and Availability of Family Planning in Nigeria, LSMS Working Paper 108.Washington, D.C: World Bank.
Ghana Statistical Service and Macro International, Inc. 1994. "Ghana Demographicand Health Survey 1993." Accra, Ghana, and Calverton, Md. Processed.
Greene, William H. 1981. "On the Asymptotic Bias of the Ordinary Least SquaresEstimator of the Tobit Model." Econometrica 49(2):505-13.
. 1993. Econometric Analysis. New York: Macmillan Press.Jejeeboy, Shireen. 1992. "Women's Education, Fertility and the Proximate Determi-
nants of Fertility." Paper for the Expert Group Meeting on Population and Women.Gaborone, Botswana. June 22-26, 1992. International Conference on Populationand Development 1994 (UNFPA). Document ESD/P/ICPD.1994/EG.III/13. Processed.
Kelley, Allen C , and Charles E. Nobbe. 1990. Kenya at the Demographic TurningPoint} World Bank Discussion Paper 107. Washington, D.C.
Kenya Central Bureau of Statistics, National Council for Population and Development,and Macro International, Inc. 1994. "Demographic and Health Survey." Nairobi,Kenya, and Macro International, Inc., Calverton, Md. Processed.
Lockheed, Marlaine E., and Adriaan M. Verspoor. 1991. Improving Primary Educa-tion in Developing Countries. New York: Oxford University Press.
Maddala, G. S. 1983. Limited-Dependent and Qualitative Variables in Econometrics.New York: Cambridge University Press.
Montgomery, Mark, Aka Kouame, and Raylynn Oliver. 1995. The Tradeoff betweenNumbers of Children and Child Schooling: Evidence from Cote d'lvoire and Ghana.LSMS Working Paper 112. Washington, D.C: World Bank.
1 2 2 THE WORLD BANK ECONOMIC REVIEW, VOL. 10, NO. 1
National Research Council, Committee on Population. 1993. Factors Affecting Con-traceptive Use in Sub-Saharan Africa. Washington, D.C.: National Academy Press.
Njogu, Wamucii. 1991. "Trends and Determinants of Contraceptive Use in Kenya."Demography 28(l):83-99.
Okojie, Christiana E. E. 1990. "Women's Status and Fertility in Bendel State of Ni-geria." Economic Growth Center Discussion Paper 597. Yale University, New Ha-ven, Conn. Processed.
. 1991. "Fertility Response to Child Survival in Nigeria: An Analysis of Microdatafrom Bendel State." In T. Paul Schultz, ed., Research in Population Economics. Vol.7. Greenwich, Conn.: JAI Press.
Oliver, Raylynn. 1995. Contraceptive Use in Ghana: The Role of Service Availability,Quality, and Price. LSMS Working Paper 111. Washington, D.C.: World Bank.
Pitt, Mark. 1995. Women's Education, the Selectivity of Fertility, and Child Mortalityin Sub-Saharan Africa. LSMS Working Paper 119. Washington, D.C.: World Bank.
Schultz, T. Paul. 1992. "Assessing Family Planning Cost-Effectiveness: Applicability ofIndividual Demand-Program Supply Framework." In J. R. Phillips and J. A. Ross,eds., Family Planning Programmes and Fertility. Oxford, U.K.: Oxford UniversityPress.
. 1994. "Sources of Fertility Decline in Modern Economic Growth." Yale Uni-versity, Department of Economics, New Haven, Conn. Processed.
Scribner, Susan. 1995. Policies Affecting Fertility and Contraceptive Use: An Assess-ment of Twelve Sub-Saharan Countries. World Bank Discussion Paper 259. Wash-ington, D.C.
Shapiro, David, and Oledo Tambashe. 1994. "Education, Employment, and Fertility inKinshasa and Prospects for Changes in Reproductive Behavior." Penn State Depart-ment of Economics Working Paper. Pennsylvania State University, State College, Pa.Processed.
Snyder, Donald W. 1974. "Economic Determinants of Family Size in West Africa."Demography 11(4):613-27.
Thomas, Duncan, and John Maluccio. 1995. Contraceptive Choice, Fertility, and Pub-lic Policy in Zimbabwe. LSMS Working Paper 109. Washington, D.C: World Bank.
United Nations. 1987. Fertility Behavior in the Context of Development: Evidence fromthe World Fertility Survey. Population Studies 100, ST/ESA/SER.A//100. New York.
van de Walle, Etienne, and Andrew Foster. 1990. Fertility Decline in Africa: Assess-ments and Prospects. World Bank Technical Paper 125. Washington, D.C: WorldBank.
World Bank. 1984. World Development Report 1984. New York: Oxford UniversityPress.
. 1986. Population Growth and Policies in Sub-Saharan Africa. Washington, D.C.
. 1992. World Development Report 1992: Development and the Environment.New York: Oxford University Press.
-. 1993. World Development Report 1993: Investing in Health. New York: Ox-ford University Press.
-. 1995. World Development Report 1995: Workers in an Integrating World.New York: Oxford University Press.