Embed Size (px)
Citation preview
i
Addis Ababa University
Ethiopian Institute of Architecture, Building Construction and City
Development (EIABC), Environmental Planning Program
The Impacts of Industrialization on Farmer’s Livelihoods,
Land Use and the Environment in Ethiopia: The Cases of
Gelan and Dukem Towns
Diriba Dadi Debela
Addis Ababa University
Addis Ababa, Ethiopia
June 2016
i
The Impacts of Industrialization on Farmer’s Livelihoods, Land Use
and the Environment in Ethiopia: The Cases of Gelan and Dukem
Towns
Diriba Dadi Debela
―A thesis submitted to the School of Graduate Studies of Addis Ababa University
in fulfillment for the requirement of the degree of Doctor of Philosophy (PhD) in
Environmental Planning at Ethiopian institute of Architecture, Building construction
and City development (EIABC), Addis Ababa University
Dissertation Supervisors:
Ketema Abebe (Asst. Prof), EiABC, Addis Ababa University, Ethiopia
Feyera Senbeta (Assoc. Prof), College of Development Studies (CDS), Addis
Ababa University, Ethiopia
Till Stellmacher (Assoc. Prof), Center for Development Research (ZEFa),
Bonn University, Germany
Addis Ababa University
Addis Ababa, Ethiopia
June 2016
ii
Signed declarations
I, the undersigned, declare that this thesis is my original work and has never been
submitted at any university for any degree or other purpose. All references have been
fully acknowledged and cited in the text.
Name: Diriba Dadi Debela
Signature: ---------------------
Date: 27 June 2016
Declaration
As thesis supervisor, I hereby certified that I have read and evaluated this thesis
entitled ―The impacts of industrialization on farmer‟s livelihoods, land use and the
environment in Ethiopia: The cases of Gelan and Dukem towns‖. I confirm that this
PhD thesis has been submitted with my approval as a thesis supervisor.
Name and signature of the Supervisors
Name of Supervisors Signature Date
1. Ketema Abebe (PhD): --------------------- -------------------
2. Feyera Senbeta (PhD): -------------------- --------------------
3. Till Stellmacher (PhD): -------------------- --------------------
iii
Addis Ababa University
School of Graduate Studies
This is to certify that the thesis prepared by Diriba Dadi Debela entitled ―The impacts
of industrialization on farmer‟s livelihoods, land use and the environment in Ethiopia:
The cases of Gelan and Dukem towns” submitted in fulfillment of the requirements
for the Degree of Doctor of Philosophy in Environmental Planning complies with
the regulations of the university and meets the accepted standards with respect to
originality and quality.
Board of Examiners
Name Signature Date
_______________________________ _____________ ________
External Examiner
_______________________________ ______________ _________
Internal Examiner
_______________________________ _____________ _________
Supervisor
_______________________________ _____________ _________
Supervisor
_______________________________ _____________ _________
Supervisor
_______________________________ _____________ _________
iv
Abstract
Industrial expansion and urbanization usually overtake large area of potential or real
agricultural lands. The conversion of agricultural land to these systems has impact on
the farming households who may lose a part or all of their agricultural land. This
dissertation deals with the effects of agricultural land conversion on the livelihoods of
farming households, land use as well as on the local environment (surface water
quality) in five peri-urban kebeles of Gelan and Dukem towns in central Ethiopia. The
objectives of the study were to explore the extents of agricultural lands converted to
industrial uses, the processes and procedures involved in the expropriation of the
lands and examine the main livelihood strategies adopted by the affected households.
As industrialization is often accompanied with pollution, liquid effluents were also
characterized to determine the quality of surface water. Both quantitative and
qualitative approaches were used to gather socioeconomic data. Data collections
tools like focus group discussion, household survey, interviews and observation were
employed. On top of this, Land use/Land Cover changes of the study areas were
analyzed using satellite images with the help of GIS and Remote sensing software.
Water samples were collected from different points following industrial effluent to
assess and determine the concentration level of physicochemical and biological
pollutants. Most of the quantitative data or inferential statistics such as Ch-square
test and t-tests were analyzed using SPSS V. 20, while, MS-Excel was also used to
draw bar graphs and line charts to study the trends and patterns of a few variables
Qualitative data were analyzed qualitatively through the employment of content and
context analysis. The analysis and discussion of quantitative and qualitative data
were done by triangulating results to either supplement the result or verify qualitative
responses and/or quantitative results. The results of the quantitative and qualitative
data for the socioeconomic parts reveals that, the processes of rapid industrial
expansion has caused an extensive Agricultural Land Conversion (ALC) that has
seriously affected the livelihoods smallholder farmers through reducing farmland
size and ownership which lead to the inability of the households to produce enough
food for household consumption and increased landless households since the
launching of the industrialization program in the area since 2004/5. Similarly, the
processes and procedures implemented by the government lacks transparency at all
v
stages of land expropriation in which local people were neither consulted nor allowed
to take part in the development planning and the valuation and estimation of
compensation which lead to deep grievances among the affected households for the
inadequacy of the compensation amount. In contrast with government policies and
community expectations, most converted lands are underdeveloped and
demonstrating leapfrog sprawling in which the prospect of benefiting from
employment opportunity remains slim. Furthermore, the educational levels and
working skills of farm household are generally low, which makes it difficult for them
to find new stable employment opportunities outside the agricultural sector. As a
result, local communities are developing antagonistic view against the development of
Industrial Zones and consider it as „exo-genic‟ and of little or no importance for their
livelihoods. Most of the affected households still prefer to earn limited livelihood
income from agricultural activities. The sampled effluents reveals the presence of
some pollutants in high concentration that can affect the quality of surface water,
health of the residents and their livestock mainly in the kebeles not supplied with
potable water. Based on the study results, the researcher therefore recommend for the
responsible governmental body to re-examine the actual implementation of the legal
investment procedures, and re-adjust them in a way that allows the development of
IZs in a more efficient and rational manner and with a much lower consumption of
land resources. This would also mean to give priority to developing already converted
lands instead of looking for new farmlands, so as not to further affect the livelihoods
of many more farming households. There is also a need to assist (ex-) farmers who
had lost (parts or all of) their land due to industrialization, and to help them to
develop abilities and capacities to cope with the new situation.
Diriba Dadi Debela
EiABC, Addis Ababa University
May 2016
vi
Acknowledgements
A PhD project is undeniably long and difficult to undertake alone. Therefore, this
thesis could not have been completed without the involvement and support of many
people in one way or another. Had I had the space and time to say thank you to
everyone, I would have listed the names of all the people along with their specific
contribution during the course my PhD career. As this is not possible or allow me to
thank some of the most important contributors for their continuous guidance,
intellectual inspiration, encouragement and support during the long and hard
processes of completing this thesis
My PhD supervisors and co-supervisors take precedence. Therefore, I would like to
express my deepest gratitude to my supervisor, Dr. Ketema Abebe, who has always
conveyed a spirit of adventure, and inspired me to enter the world of academia and in
my research with his guidance throughout my PhD studies. Dr. Ketema is a friendly,
positive minded and humble man who used every opportunity to share his experience
and to encourage me to work hard towards the successful completion of my study.
Also, the successful completion of my PhD career would not have been possible
without the active involvement of my co-supervisors. The contribution of Dr. Feyera
Senbeta, in this regard, was invaluable. Dr. Feyera spent his precious time and
energy to shape all of the draft papers (i.e. proposal, manuscripts and the
dissertation) and to assist me with his insightful reviews, comments, feedback and
tutoring.
My deepest appreciation and gratitude also goes to Dr. Till Stellmacher for his
multiple roles before and after I was admitted to the PhD program at EiABC, Addis
Ababa University. It was because of Dr. Till that I became aware of their plan to
launch a joint PhD Program in “Environmental Planning” at EiABC. His immense
contribution to the draft PhD proposal and in the preparation of my dissertation as
co-supervisor brought me to the level of being able to complete my PhD study. He
had also offered me multiple opportunities to visit ZEF (University of Bonn) in
Germany, where I managed to access some of the resources that are almost
inaccessible in the library of my host institution and to attend short courses, seminars,
lecture series and a weekly colloquium. My short and long-term research periods at
vii
ZEF had also created an opportunity to interact and share experiences with high
profile senior and junior scientific communities. He is also responsible for initiating
my preparation of a monograph, which was later published at a well-known
publishing house in Germany. Also, I would like to extend my heartfelt gratitude to
Dr. Girma Kelboro (senior researcher and a Postdoc fellow at ZEFa) for his warm
reception, advice and support he offered me during my stay in Bonn. I would also like
to thank Mr. Francis Mwambo (junior researcher at ZEFc from Cameroon) for his
kindness and support. Moral and material support from my longtime friend, Tola
Gemechu (PhD), Stockholm University, Sweden will remain unforgettable.
I would also like to reserve a special space for Dr. Hossein Azadi. It was because of
his hard work and for the publication of a considerable number of articles, most of
which relate to my PhD dissertation title and were one of the reasons that I decided to
work with him. Thank you, Dr. Hossein for accepting my call and for promoting and
mentoring me during the entire process of my long journey. Thank you for your role
in teaching me how to write scientific papers to be published in high impact factor
journals. Your role in facilitating my stay at the Hasselt University in Belgium and
for the intense care you demonstrated for my security, health and academic success
when I was in Belgium is unforgettable. Along this same vein of thought, I would like
to extend my deepest gratitude to Prof. Dr. Steven Van Passel, head of the department
of Environmental Economic, Hasselt University for his invitation letter and
mentorship role during my three month stay in Hasselt. I would also like to say thank
you to Dr. Sarah ELSHOUT and Dr. Sebastian LIZIN for their warm welcome and
support from the day of my arrival to the last day of my departure from Hasselt
University.
My research could not have come to fruition without the cooperation and assistance
of the farmers from the research sites, with whom I met and spoke to for hours and
those who were selected for the household survey. I thank all of them for generously
offering their time and for sharing their knowledge, experiences and encounters.
Dukem and Gelan town officials and different department heads, the executive
committee and the development agents, assigned in all the studied rural kebeles also
deserve their due respect and appreciation. They all deserve special thanks for their
viii
time and energy in creating conducive environment for me and the data collectors
during our extended stay in their respective areas.
I would like to thank my family for their enormous support. They have helped me in
countless ways. My love and dedication goes to my dear parents, who have always
been my biggest supporters. Special thanks go to my brothers and sisters: Degefa
Dadi and his wife Xurunesh Lata, Rabira Degefa, Getu Dadi and Alemayehu Dadi
and Darartu Dadi for their moral, material and financial support. I am proud of my
brothers for spending their time, energy, money and the unreserved care they offered
to my family during my long absences. I would also like to reserve a special thanks to
my lovely wife „Addee‟ Zinash Birhanu and my wonderful children, Bekam Diriba and
Niyana Diriba who have encouraged my strength and perseverance throughout the
long and lonely processes towards achieving a PhD. They have been my „guardian
angels‟ who inspired me every day and night while I juggled PhD and family. I
promise you that it is now my turn to take care of you all. I will give you my time,
energy and money; even though it cannot compensate the paternal love, affection and
comfort you missed because of my long absence.
Finally, let me take time and space to say thank you to the following national and
international higher learning and funding institutions and organizations. I would like
to thank Madawalabu University for their permission to pursue my PhD and for their
material and financial support throughout my study. EiABC and Addis Ababa
University also deserve special thanks for their financial and material support.
Hasselt University in Belgium and ZEF (Bonn University) in Germany are among the
prestigious learning institutions in Europe that, without limit, offered me access to all
the resources that I required. Therefore, they deserve my respect and appreciation.
My special thanks goes to DAAD for granting me full In-Country Scholarship grants,
including travel and accommodation costs during my multiple visits and long stay at
Bonn University. It is also a privilege and honor for me to say thank you to UNWHO
for its financial support that covered the costs related to characterizing the sample
effluents taken from the textile industries in the studied areas. „Obboo‟ Waltaji Terfa
deserves special thanks for his role, time and energy in facilitating the approval of the
grant and the transfer of the grants from WHO to its proper destination.
ix
Table of Contents
Abstract ....................................................................................................... iv
Acknowledgements ....................................................................................................... vi
List of Tables ..................................................................................................... xiii
List of Figures .......................................................................................................xv
Acronym .................................................................................................... xvii
1 CHAPTER ONE: Introduction ...............................................................................1
1.1 Background ........................................................................................................1
1.2 Statement of the Problem ...................................................................................4
1.3 General Objective of the study ........................................................................10
1.3.1 Specific Objectives ...................................................................................10
1.3.2 Research Questions ..................................................................................11
1.4 Scope of the Study ...........................................................................................12
1.5 Relevance of the Study ....................................................................................12
1.6 Limitations of the Study...................................................................................14
1.7 Organization of the thesis ................................................................................15
1.8 Ethical considerations ......................................................................................15
2 CHAPTER TWO: Methods and Materials ...........................................................16
2.1 Description of the study area ...........................................................................16
2.2 Description of Finfine Surrounding Oromia Special Zone ..............................20
2.2.1 Introduction ..............................................................................................20
2.2.2 Establishment ...........................................................................................21
2.2.3 Biophysical environment (Relief, Climate and rainfall) ..........................21
2.2.4 Land use type ............................................................................................23
2.2.5 Socioeconomic attributes of the FSZ .......................................................25
2.2.6 Economic Activities .................................................................................27
2.3 Research Design for Socioeconomic study ......................................................28
2.3.1 The study population and Sample design .................................................30
2.3.2 Field data collection and data collection tools .........................................33
2.3.3 Data analysis tools ....................................................................................37
2.4 Sample size and sampling procedures for biophysical study...........................40
2.4.1 Why textile industries are selected? .........................................................40
x
2.4.2 Field Procedures .......................................................................................41
2.4.3 Location of the studied textile industries .................................................43
3 CHAPTER THREE: Review of Related Literatures ............................................45
3.1 Theories of Industrial Location ........................................................................45
3.2 Debates on Agricultural Land Conversions: Urbanism VS Ruralism .............48
3.3 Rural-urban interactions and the Spillover effects of industrial expansion .....50
3.3.1 Socio-economic effects ............................................................................54
3.3.2 Environmental consequences: surface water pollution ............................59
3.4 Industrial Development in Ethiopia: Before EPRDF.......................................64
3.5 EPRDF and the Industrial Development: Manufacturing Industry .................65
3.6 The process of land conversion: Consultation, valuation and compensation ..71
3.7 Legal and institutional set up to protect the environment in Ethiopia .............74
3.8 Effects of Industrial sprawling on the agricultural lands surrounding Addis
Ababa ...............................................................................................................77
3.9 Sustainable livelihood ......................................................................................79
3.10 The Conceptual Framework of the Study ........................................................83
RESULTS .......................................................................................................85
CHAPTER FOUR: Characteristic of the Sample population and Eextent of
agricultural lands converted into industrial developments and the
effects of these changes on the livelihoods of affected farmers ....85
3.11 Characteristic of the Sample population ..........................................................85
3.11.1 Sex and Age of the Informants ...............................................................85
3.11.2 Household Size .......................................................................................86
3.11.3 Religious affiliation of the informants ....................................................86
3.11.4 Ethnic group of the informants ...............................................................87
3.11.5 Type of housing units of the informants .................................................87
3.11.6 Marital Status of Informants ...................................................................87
3.11.7 Level of formal Education of the Informants .........................................88
3.12 Eextent of agricultural lands converted ...........................................................89
3.12.1 Size of farmlands converted to other land uses ......................................89
3.12.2 Farmland conversion at the study kebele level .......................................91
3.12.3 Effects of land conversion on the Livelihoods of the households ..........92
3.12.4 Major purpose of agricultural land conversions in the study areas ......108
xi
3.12.5 Land Use Changes between 2005 and 2013 .........................................109
3.12.6 The Current State of Industrial Investments in the towns of Gelan and
Dukem ....................................................................................................111
4 CHAPTER FIVE: The processes and procedures involved in agricultural land
expropriation and the perception of the farming households
towards the amounts of compensation money .............................115
4.1.1 Introduction ............................................................................................115
4.1.2 Trend in the farmland holding size since the introduction of
industrialization ......................................................................................115
4.1.3 The processes of agricultural land expropriation ...................................118
4.1.4 Compensation types and the determination of compensation amounts .127
4.1.5 Terms of compensation installment and the views of the beneficiaries .130
4.1.6 Living standard of the households after compensation installment .......139
5 CHAPTER SIX: The concentration level of selected pollutants and their health
effects on residents and the environment .....................................141
5.1.1 Physico-chemical properties of the effluents .........................................141
5.1.2 The concentration level of pollutants among the industries ...................143
5.1.3 Effects of industrial effluents in the study areas ....................................148
5.1.4 Aesthetic values and quality of local environment ................................148
5.1.5 Impact of effluents on peoples‘ health ...................................................149
5.1.6 Health effects on livestock .....................................................................153
5.1.7 Economic costs of human and livestock treatments ...............................157
5.1.8 Community trainings and consultations .................................................160
5.1.9 Management and monitoring of the quality of local environment .........162
6 CHAPTER SEVEN: The main livelihood strategies adopted in order to cope with
the negative outcomes of agricultural land expropriation............166
6.1 Introduction ....................................................................................................166
6.2 Coping and Adaptation Strategies of the affected households ......................167
6.3 Employment and income diversification opportunities .................................171
6.3.1 Job type available ...................................................................................173
6.3.2 Amount of salary or wage ......................................................................176
6.4 Use of incomes derived from off-farm/non-farm employment activities ......178
6.5 Infrastructure provision ..................................................................................179
xii
6.6 Coping strategies of informants towards grazing land shortages ..................180
6.7 Perception of farmers on the low development level of industries and the
promised ‗trickle-down‘ effects .....................................................................183
7 CHAPTER EIGHT: Discussion and Synthesis .................................................187
7.1 Introduction ....................................................................................................187
7.2 The processes of industrialization: Registration and Licensing ....................187
7.3 The effects of industrialization on agricultural activities ..............................189
7.3.1 Farmland loss and reduction in food crop production at household level
189
7.3.2 Increase in landlessness and food crop price hike ..................................190
7.4 The process of land conversion and the amount of compensation money ....192
7.5 Environmental and health problems arising from textile industries ..............195
7.5.1 Major pollutants and their concentration levels .....................................197
7.5.2 The environmental implication of wastewater from textile industries ...199
7.5.3 Textile waste water and its effects human and livestock health .............200
7.6 Livelihood strategies of the affected households ...........................................201
7.6.1 Attachment to the farming activities ......................................................202
7.6.2 Non-farm activities: employment/job opportunities and informal business
203
8 CHAPTER NINE: Conclusions and Recommendations ....................................206
8.1 Conclusions ....................................................................................................206
8.2 Recommendations ..........................................................................................209
8.3 The Planning Framework (see Appendix A) ..................................................212
Reference .....................................................................................................214
Appendixes .....................................................................................................233
xiii
List of Tables
Table 1: Major Land Use Land Cover Types in Finfine Special Zone ........................ 24
Table 2: The mean farmland size owned by the informants, 2004/05-2012/13 .......... 89
Table 3: The mean household farmland size: 2004/05-2012/13 .................................. 91
Table 4: Mean cultivated land size per household in the study kebeles ...................... 95
Table 5: The mean of the total crop production in ‗quintals........................................ 97
Table 6: Status of household food crop production, 2012/13 .................................... 107
Table 7: Purposes of agricultural land conversions ................................................... 108
Table 8: The status of informants‘ farmland size since 2005 .................................... 116
Table 9: Farmland size ceded by household in the kebeles of Gelan and Dukem ..... 117
Table 10: Level of people participation in the process of land expropriation ........... 120
Table 11: How decisions to cede the landholding are perceived by the farmers ....... 124
Table 12: Payments of compensation or the expropriated/lost properties ................. 129
Table 13: Terms of compensation Installment ........................................................... 131
Table 14: Farmers‘ assessment of compensation amount.......................................... 138
Table 15: The effect of compensation payments on the living standard of farmers .. 140
Table 16: Physico-chemical and bacteriological characteristics of effluents samples
from textile industries ................................................................................................ 142
Table 17: Access to potable water for domestic uses, Gelan and Dukem towns....... 150
Table 18: Industrial effluents and health problems in Gelan and Dukem ................. 152
Table 19: Main sources of water for livestock drinking ............................................ 154
Table 20: Assumed cases of sick livestock due to exposure to surface effluents ...... 155
Table 21: Estimated treatment cost at local health posts ($USD) ............................. 158
Table 22: Estimated treatment costs of a sick cattle at a local clinic (in US$) .......... 158
Table 23: Estimated mean market prices of sick cattle at local market (US$) .......... 159
Table 24: Proportion of farmers who attended trainings on industrial effluents ....... 160
Table 25: Main livelihood strategies pursued by the households .............................. 168
Table 26: Employment history of informants in the nearby investments projects .... 172
Table 27: Job type available by their category .......................................................... 174
Table 28: Major problem (s) in getting employment opportunities in industries ...... 175
Table 29: Average salary (in USD) of the informants employed in the industry ...... 177
xiv
Table 30: Average monthly saving from non-farm or off-farm sources of income in
USD............................................................................................................................ 178
Table 31: Uses of incomes derived from non-farm/off-farm jobs ............................. 179
Table 32: Coping strategies of grazing land shortages .............................................. 181
Table 33: Planning framework................................................................................... 233
xv
List of Figures
Figure 1: Trend of population in the Finfine Special Zone, 2008 – 2013 ................... 16
Figure 2: Trends of urban population in Dukem and Gelan, 2013 .............................. 17
Figure 3: The study kebeles & the drainage directions in Gelan and Dukem .............. 18
Figure 4: Dried Rivers: Dongora (left) and Dukem (right) in Gelan and Dukem ....... 19
Figure 5: Trend of population in the Finfine Special Zone, 2008 – 2013 ................... 26
Figure 6: Trend of urban population in the Finfine Special Zone, 2008 - 2013 .......... 27
Figure 7: Research approach followed ........................................................................ 29
Figure 8: Summary of research design for the household surveys .............................. 39
Figure 9: Location of sample collection sites .............................................................. 44
Figure 10: Share of industry in the GDP, 2004-2012 .................................................. 68
Figure 11: Real GDP growth rate industry sectors, 2004 -2013 .................................. 69
Figure 12: Conceptual framework ............................................................................... 84
Figure 13: Mean farmland owned in (ha), Dukem (R) and Gelan (L) ......................... 90
Figure 14: Farmland ownership in (ha) and the number of holders in Gelan town ..... 93
Figure 15: Farmland ownership in (ha) and the number of holders in Dukem town... 93
Figure 16: Mean crop production in ‗quintal‘ in Dukem (L) and Gelan (R) ............... 96
Figure 17: Mean Teff yield per household in Gelan and Dukem towns ...................... 99
Figure 18: Mean Wheat crop yield per household in Gelan and Dukem towns ........ 101
Figure 19: Mean Livestock holding size per household in Gelan and Dukem towns 102
Figure 20: Mean grazing land size (ha) per household in Gela and Dukem .............. 105
Figure 21: Grazing lands left for livestock in Dukem (L) and Gelan (R) .................. 105
Figure 22: Land use changes in Gelan, 2005 (L)–2013 (R) ...................................... 109
Figure 23: Land use changes in Gelan, 2005 – 2013 ................................................. 110
Figure 24: Land use in Dukem in 2005(L) and in 2013 (R) ...................................... 110
Figure 25: Land use changes in Dukem, 2005 – 2013 ............................................... 111
Figure 26: Status of industrial investments on converted lands, Gelan and Dukem . 114
Figure 27: Formal land conversion procedures ......................................................... 119
Figure 28: Demolished (bulldozed) private houses and properties in Dukem town.. 125
Figure 29: De facto implementation of land conversion in Gelan and Dukem ......... 125
Figure 30: Concentrations level of BOD5, Gelan (L) and Dukem (R) ...................... 144
Figure 31: COD concentrations in sampled effluents ................................................ 145
xvi
Figure 32: TSS concentrations in the sampled effluents ........................................... 146
Figure 33: Coli concentrations, Gelan (L) and Dukem (R) ....................................... 147
Figure 34: Effluents from textile industries in Gelan (L) and Dukem (R) ................ 148
Figure 35: Sources of water for domestic uses in Gelan and Dukem towns ............. 149
Figure 36: Livestock drinking effluents in Dukem (L) and Gelan (R) ...................... 154
Figure 37: Informal business as a livelihood strategy ............................................... 171
Figure 38: Job seekers in front of the EIZ in Dukem ................................................ 175
Figure 39: Type and quality of access road constructed in the study kebeles ........... 180
Figure 40: Straw stored at the back yards in Gelan (L) and Dukem (R) ................... 182
Figure 41: Development level of converted lands, Dukem (L) and Gelan(R)........... 184
xvii
Acronym
AAEPA Addis Ababa Environmental Protection Authority
ADLI Agricultural Development Led Industrialization
ALCs Agricultural Land Conversions
ALs Agricultural Lands
APHA American Public Health Association
CSA Central Statistical Agency
DAO Department of Agricultural Office
DAs Development Agents
DFID Department of Foreign and International Development
EIA Environmental Impact Assessment
EIZ Eastern Industry Zone
EPA Environmental Protection Authority of Ethiopia
EPO Environmental Protection Organ
EPRDF Ethiopian Peoples Republic Democratic Front
FAO Food and Agricultural Organization
FDI Foreign Direct Investment
FDRE Federal Democratic Republic of Ethiopia
FO Field Observation
FSOSZ Finfine Surrounding Oromia Special Zone
FSZ Finfine Special Zone
GDP Gross Domestic Product
GIS Global Positioning System
GNP Gross National Product
GTP Growth and Transformation Plan
HHHs Household Heads
HHs Households
IC Investment Commission
IDS Industrial Development Strategy
IPS Industrial Project Service
IPs Industrial Parks
ISI Import Substituting Industries
xviii
IZs Industrial Zones
KII Key Informant Interview
LULCC Land Use Land Cover Change
LUP Land Use Plan
MDGs Millennium Development Goals
MLI Medium and Large Scale Industries
MoFED Ministry of Finance and Economic Development
MWUD Ministry of Works and Urban Development
NUDI National Urban Planning Institute
NUDP National Urban Development Policy
OLAB Oromia Land Administration Bureau
OLEPB Oromia Land and Environmental Protection Bureau
OLUCA Oromia Investment Land Use contractual Agreement
ORS Oromia Regional State
OWWDSE Oromia Water Works Design and Supervision Enterprise
PAO Population Affairs Office
PASDEP Plan for Sustainable Development to End Poverty
SDPRP Sustainable Development and Poverty Reduction Program
SID Sustainable Industrial Development
SLF Sustainable Livelihood Frame
SME Small and Medium Enterprises
SNNPR Southern Nations Nationalities and Peoples Region
UNEP United Nations Environmental Program
UNIDO United Nations Industrial Development Organization
UNWHO United Nations World Health Organization
WHO World Health Organization
1
1 CHAPTER ONE: Introduction
“A family without land in a peasant society may be deeply handicapped …to
be without land may seem like being without a limb of one‟s own. But,
whether or not a family attaches direct value to its relation with its “own
land”, landlessness can also help to generate economic and social
deprivations.” Amartya Sen (2000: 14)
1.1 Background
As the main source of employment opportunities within Ethiopia, agriculture holds
the lion‘s share of the country‘s GDP and remains the backbone of the nation‘s
economy. This sector employs 83% of the country‘s labor force and accounts for
close to 45% of the national GDP while nearly 95% of Ethiopia‘s export earnings
come from agricultural goods such as coffee, livestock skins and oil seeds (Gudeta,
2009; MoFED, 2012). The country is also home to more than 12 million smallholder
farmers that make up 95% of the agricultural population (Heady, et al., 2014;
Kefyalew, 2014) The agricultural sector in Ethiopia is overwhelmingly dominated by
low-input/output cycles and structural poverty.
The use of ―modern‖ agricultural technologies such as selected seeds, fertilizers,
pesticides and crop diseases and irrigation agriculture are generally very low by the
smallholder farmers in the studied areas. Farmers predominantly rely on rain fed
agriculture, a practice that is greatly affected by rainfall variability and food crop
production remains insufficient to meet yearlong food security demands for the
majority of the households (Yesuf and Kohlin, 2008). The major cereals cultivated
2
that constitute the core of Ethiopia‘s crop production are teff (Eragrostis tef), wheat,
maize, sorghum, and barley (CSA, 2014; Taffesse, et al., 2011).
Realizing this underdevelopment, the government of Ethiopia initiated the Sustainable
Development and Poverty Reduction Program (SDERP) in 2002. The SDERP and the
subsequent development plans, aimed to use enhanced technology to build an industry
led economy with a productive agricultural sector. In addition to modernizing the
agricultural sector, the Ethiopian government gave the industrial sector due attention
as an alternative tool to ensure rapid economic growth. Yet, despite the government‘s
efforts to increase the role of industry in achieving rapid economic development, the
contribution of the industrial sector to the national GDP has shown little growth in
Ethiopia and still lags far behind terms of its contribution to the GDP. National
Sectoral economic report show that the contribution of industrial sector in the national
economy is relatively small - with value added of less than 10% until 2001(CSA,
2001) and around 13% between 2010 and 2013 (CSA, 2010; MoFED, 2013).
In 2002, the government adopted an Industrial Development Strategy as part of its
efforts to revitalize the manufacturing sector. The strategy clearly identifies the
priority areas of the manufacturing sub-sectors and suggested ways to ensure the
development of vibrant industries in the country. Ever since, 14 years now, the
Ethiopian government has made numerous successive and proactive adjustments to
the countries‘ structural, institutional and financial systems in order to encourage
domestic and foreign private investments. To encourage these investments and the
inflow of foreign capital and technology into Ethiopia, numerous incentives have also
been put in place, such as tax holidays of between 3-5 years depending on the location
3
of investment area, percentage of exports and capitals. The proposed incentives also
include the withholding of profit tax, duty-free imports and access to credit services,
as indicated in the investment proclamation No. 280/2002 (Negarit Gazeta, 2002).
Against this backdrop, in 2004 the Federal government nominated around 32 towns
and cities to establish industrial development corroders within four regions (i.e.
Oromia, Amhara, Tigrai and SNNPRS) and two city administrations (i.e. Addis
Ababa and Dire Dawa). As of 2004, all eight small towns located around Addis
Ababa in the Oromia Regional State (ORS) were selected to host the establishment of
those industrial development corridors (IPS, 2004). The towns of Gelan and Dukem
were among the ones selected and designated to establish the modern Industrial Zones
(IZs) as well as private investors of the government‘s priority areas of the
manufacturing sector. Their selection was mainly due to their proximity to Addis
Ababa/Finfine: the federal and Oromia National Regional State (ORS) capital- and
their relative location to the highway that connects Addis Ababa and Djibouti –
Ethiopia‘s export and import mainline.
Prior to the establishment of the IZs, the land surrounding the towns of Gelan and
Dukem was intensively used for agricultural production, teff and wheat in particular,
for years. Most of the farmland was used by the smallholders and was administered
in six rural kebeles before it was re-integrated into the towns of Gelan (i.e. Tullu
Guracha, Moreno and Café Tumaa) and Dukem (i.e. Xadacha, Gogecha and Koticha).
The re-integration of the rural kebeles was accompanied by land use changes in which
agricultural lands (ALs) that used to be smallholder farmers only means of their
household‘s livelihood and survival, were converted to other land use types.
4
Therefore, those kebeles that were most affected by agricultural land conversion
(ALCs) initiated by industrial and other investment activities were considered in this
study. Accordingly, five kebeles namely the Tulu Guracha and Gelan kebeles in the
town of Gelan and Koticha, Gogecha and Xadacha kebeles in the town of Dukem
were specifically selected for this study.
1.2 Statement of the Problem
A large body of empirical evidences indicates that industries play a ―catalytic‖ role in
the transformation of agrarian communities. The economies of some of today‘s fast
growing industrial countries in Asia, such as South Korea, China, Malaysia, Taiwan
and Vietnam were once dominated by subsistence agriculture (UNIDO, 2012). During
this period, the average contribution of agriculture to the national GDP of these
countries was close to 40% while that of industrial sector was less than 14%. In one
instance, the economic transformation program initiated by the ‗Doi Moi‟ in 1986 in
Vietnam enabled the country to reverse the dominance of subsistence agriculture in
the national GDP to the industrial sector. For instance, the share of agriculture in the
GDP was 40% in 1980s, but a decade later the contribution of agriculture to the GDP
fell sharply to 23% in the early 1990s (UNIDO, 2012).
In spite of the ―catalytic” role that industries play in the processes of realizing rapid
economic growth, this sector, however, incurs heavy costs on the part of the
livelihood of agricultural communities. Rapid industrialization accompanied by rapid
urbanization triggers sustained demands on lands in urban areas, which in turn puts
pressure on agricultural lands in the outskirts, which urban territories often encroach
5
upon in these lands (Cárdenas, 1996; Tariq, 2006; Azadi, et al., 2011). Thus, the
conversion of agricultural lands often threatens the livelihoods of farming households
as the process inevitably involves major and irreversible changes in the
socioeconomic dynamics and environmental consequences (Tan, 2015).
Synonymous to the experiences of some of the countries discussed above, Ethiopia,
whose economy is dominated by agrarian societies, planned to modernize the
economy by promoting the development of industrial sectors. Since the 2000s, the
Government of Ethiopia has taken a number of steps to promote industrial
development as an alternative means to ensure rapid economic growth and to
campaign poverty reduction. In order to realize the ambition of boosting national
economic growth and meet one of the MDG goals of eradicating poverty, the
government has taken several proactive measures. Some of the most important were
the gradual shifts from the economic dominance from an agriculture led to an industry
led economy by promoting investments in the industry sector: manufacturing industry
in particular.
One of the strategies designed was to encourage the role of private sectors (i.e. foreign
and domestic) by arranging a large number of incentives, including the provision of
investment lands at very cheap prices. However, the preparation of land for an
investment in the manufacturing industry (a priority sector of the government)
involved the expropriation of agricultural lands owned by smallholder substance
farmers. These developments carry several implications for the people partly or
entirely losing their agricultural land, especially when looking at factors such as
poverty, landlessness, and the level of compensation and the ability of the farmers to
6
shift to other types of livelihood. Furthermore, industries are always associated with
the generation and discharge of wastes (solid/liquid) so that in situations where there
is an inadequate supply of safe water, industrial wastes, liquid effluent in particular,
remain major causes of health problems for the majority of the rural farming
households.
In order to implement an industrial development program, some towns were selected
and designated as industrial development corridors and Industrial towns. There are
eight small towns that were designated to establish industrial development corridors
in Finfine Surrounding Oromia Special Zone (FSOSZ/FSZ1) in ORS, in which are the
towns of Gelan and Dukem. The selection of these towns was based on a number of
suitable natural resources. Some of the most important of which were cheap land
prices, cheap and available labor, promising underground water potential and low
costs of investment in land preparation for construction. As well as better physical
amenities such as roads and railway lines that enhance the import and/or export of
both raw materials and/or finished or semi-finished industrial products. Thus, the
comparative advantage of these towns over many other similar towns coupled with a
number of incentives was that these towns most favored becoming investment
destinations for ―investors‖ that were willing to invest in government priority areas
with medium and large scale manufacturing industries.
As a result, a large number of investors (mostly domestic) were licensed and given
investment lands in the areas. Data obtained from the investment offices of the study
towns indicated that between 2005 and 2013, more than 800 projects were approved
1 FSOSZ is also called Finfine Special Zone (FSZ) and the later is used in this thesis
7
in both towns shortly after they were designated as industrial development centers. Of
these, around 460 projects were located in the town of Dukem while the remaining
350 were licensed in Gelan. Most of the applicants showed interest in the
manufacturing sector, mainly in textile and apparel, agro-processing, food and
beverage, pharmaceuticals and other manufactured goods. In order to meet the
investment land requirement for the applicants during the years indicated, data
obtained from the investment and land administration offices of the respective city
administration indicate that more than 850 hectares of prime agricultural lands (i.e.
331.5 ha in Gelan and 515.7ha in Dukem) were distributed among the applicants.
Because the program did not sufficiently provide a guideline to assist decisions on
plot size, preliminary data obtained from investment offices shows a lack of
uniformity in the sizes of different plots for similar projects, even without taking the
size of investment capital or project type proposed into account (Dadi, et al., 2016).
Hence, urban land exhaustion was followed by sprawling developments and private
housing, which consumed hundreds of hectares of peripheral agricultural land. In
Dukem, 80.6 hectares of land was initially allocated in the LUP of the town for
industrial development (OWWDSE, 2011). In spite of the LUP, which is supposed to
guide proper urban land use, over 400 hectares of land, most of which were prime and
fertile agricultural lands, were converted and granted to ―prospective investors‖.
The proposed research areas are known to have some of the most fertile farmlands in
Ethiopia. The land is mainly used to grow teff (Eragrostis tef) and wheat of high
quality and quantity for household use and sale on the local, regional and national
market. Urban residents including those in Addis Ababa depend on the cereals
8
produced in this ‗Ethiopian grain basket‘. Preliminary data obtained from the Akaki
District Agricultural Department (DAO, 2013), where the study sites are situated,
shows that rapid investment inflow and the subsequent transformation of agricultural
lands for investment uses in the urban fringe, reduced cultivated land by 11.4% and
crop production by 18.3% between the 2005/06-2009/10 harvesting seasons (Dadi, et
al., 2015, 2016). Equally, the total hectares of cultivated land that grow teff2 and
wheat crops (stable food crops) shrank by about 26.3% in the same period (Dadi, et
al., 2015, 2016). Decline in the size of cultivated land and total production implies not
only the reduction of farmland holdings and production but also a decline in
traditional farming jobs, leading to household food insecurity and vulnerability.
In this study, emphasis is placed upon the ways in which the lives of household
members have changed due to land conversion processes, and whether or not land is
still seen as a crucial livelihood asset for the security and sustainability of people‘s
livelihoods. A closer look was taken at two kebeles in Gelan and three kebeles in
Dukem, where large areas of agricultural land are expropriated to facilitate the
expansion of investments and the provision of the infrastructural system. Gaining
knowledge about the living situations of the local people before and after land
conversion provides useful insights into the impact land conversion practices have on
the lives of the people who are directly affected.
In addition to studying the consequences of ALCs in the peri-urban areas, this study
focuses on the poorly planned industrialization processes and the impact of the
9
absence of effluent treatment plants or the inefficiency of the existing ones has on the
local environment and human health. As the discharges of untreated or inefficiently
treated industrial effluents threaten local farmers and their environment, exposure to
unclean surface water could also affect these people economically through farm labor
reduction and treatment and medical expenses for the treatments (Khan and Malik,
2014).
In general, this dissertation focused on s tudying the impacts of rap id
indus t r ia l iza t ion on se lec ted l ive l ihood capi ta l s , l and uses and the
qual i t y of envi ronments . To th i s end , I hypothesize that the unsustainable
appropriations of agricultural land for industrialization and the accompanied
municipal land uses during the past eight years have created significant and
serious negative socio-economic impacts on smallholder farmers in the study areas.
10
1.3 General Objective of the study
The general objective of the study is to assess the effects of agricultural land
conversion on the livelihoods of farming households, land use as well as on the local
environment (surface water quality) in five kebeles of Gelan and Dukem towns.
1.3.1 Specific Objectives
The specific objectives of the study are to:
1. Explore the extent of agricultural lands converted into industrial developments
and the effects of these changes on the livelihoods of affected farmers.
2. Find out the processes and procedures involved in agricultural land
expropriation and assess the perception of the farming households towards the
amounts of compensation money.
3. Assess the concentration level of selected pollutants and analyze their health
effects on residents and the environment.
4. Examine the main livelihood strategies adopted in order to cope with the
negative outcomes of agricultural land expropriation.
11
1.3.2 Research Questions
The specific research questions are:
1. How many hectares of agricultural lands were converted for industrialization
and how have these changes influenced the livelihoods of the affected
households in terms of livelihood assets?
2. What processes and procedures were involved during land conversion and
how do the affected households understand and respond to major loss/gains in
livelihood assets and compensation money?
3. What amounts of the physicochemical and bacteriological loads of pollutants
are discharged and how they are affecting the quality of the local environment
and of human and livestock health in the study kebeles?
4. What are the main livelihoods strategies used for coping with land losses by
the affected households?
12
1.4 Scope of the Study
This study was conducted in five rural kebeles situated in the peripheries of the towns
of Dukem and Gelan located in the Finfine Special Zone. The decision to limit this
research to Gelan and Dukem was solely based on the scale of the development of the
manufacturing industries taking place in and around these towns compared to similar
small towns in the special zone. Of the total eight small towns in the special zone,
these towns are specifically selected to serve as the national and regional economic
development corridors to host the establishment of manufacturing industries. The
location of these towns along the only railway line and highways connecting Addis
Ababa with Djibouti, adequate and cheap labor, promising underground water
reserve, etc are among the most important assets the government used to promote the
establishment of manufacturing industries in these areas. On this basis, the decision to
identify the eligible rural kebeles included in the study was made based on the level of
industrialization and farmland expropriations. Accordingly, three rural kebeles in
Dukem (i.e. Koticha, Xadacha and Gogecha) and two towns in Gelan (Gelan kebele
and Tulu Guracha kebele) were selected.
1.5 Relevance of the Study
Globally, there are a considerable number of studies that have been carried out
focusing on the conversion of agricultural land for industrialization and urbanization
in the peri-urban areas of many cities and its effects on the quality of the local
environment and the livelihoods of agricultural households. In Ethiopia, studies
focusing on the effects of rapid urbanization on the livelihoods of rural communities
13
within Addis Ababa are common. Yet, a comprehensive study on the effects of
agricultural land expropriation for industrial and urban uses and its impacts on the
livelihoods of farming households and the environments are not generally available in
Ethiopia and are not available in the proposed study areas in particular. Therefore,
contributing to the prevailing knowledge gap regarding the consequences of
indiscriminate conversion of agricultural lands for non-agricultural uses on the
livelihoods of farming households and local food crop availability is the priority of
this study. In addition to this, industries are often associated with the generation and
discharge of solid and liquid waste that is harmful to biophysical resources. On this
basis, the baseline information about the content and concentration levels of pollutants
was felt to be necessary to study.
Thus, the results of the study are summarized in such a way as to be used as a source
of valuable information or inputs for policy designers, development planners, land use
planners and decision makers. A proper understanding of the result of the study and
suggestions forwarded by the research would be an asset in preparing development
plans that can address the tradeoffs between industrialization and agricultural land
conversion. Finally, yet importantly, this study will also initiate both senior and/or
junior researchers to reveal the uncovered or overlooked aspect of this study in their
current or future proposals.
14
1.6 Limitations of the Study
Acknowledging the presence of research limitations helps one to reflect upon the
choices made during the preparation phase and the actual fieldwork and helps to
identify possible unanswered or unaddressed questions that could be considered in the
future research (Lodder, 2012; Desai and Potter 2006). Moreover, doing research on a
specific subject matter is always a subjective enterprise, from the visualization of a
research problem through the selected research methods and the identification of
certain relationships between different variables. This makes it important to take a
step back and consider how to improve the research design, which I did during the
preparation and the fieldwork phases.
Some of the most important limitations encountered during the whole processes of
this study include difficulties to obtain information that is considered as sensitive by
the local officials, for instance, expropriated land size, issues related to compensation
money, etc. Moreover, obtaining accurate, up-to-date and complete data on the total
size of farming households whose farmlands where expropriated, the number and
origin of investors and their proposed project type, land use types (i.e. for residence,
industry, business, real estate, etc.) was a big challenge due to poor, inefficient and
insufficient data management systems (i.e. storage and retrieval) and lack of
willingness to disclose these data. In order to address the problem, I was forced to
visit multiple line offices (local to regional bureau levels) in order to generate
information that is more reliable.
15
Moreover, one of the tools used to collect qualitative data for this study was by
carrying out formal and informal interviews with different stakeholders. As it was not
possible to rely on hearing the discourses, retrieving and working on it later on a
desktop, recording them in an audio-video form was the best practice. However,
although I was able to record some of the interviews, some of the informants (i.e.
local government officials and investors) were not willing to be recorded. Thus, I am
forced to rely on the notes I took in the notebook that I used later.
1.7 Organization of the thesis
The research is organized into nine chapters. The first chapter presents introductory
and background information, problem statements, objectives and research questions
of the study. The second chapter deals with Methods and Materials used in the study,
while the third chapter presents the review of pertinent literatures. Results are
presented in the chapters four, five, six and seven. The discussions of the results was
presented in the eighth while last chapter. Last but not least, the conclusions and
recommendations of the study were presented in chapter nine.
1.8 Ethical considerations
At all stages of this study, the following ethical issues were adhered. Relations
between researcher and respondents: seeking consents, not to provide any form of
incentives, reducing or avoiding sensitive information, keeping information and data
obtained from respondents confidential. Also, avoiding bias, inappropriate reporting
and related was understood and taken care of them from the start.
16
2 CHAPTER TWO: Methods and Materials
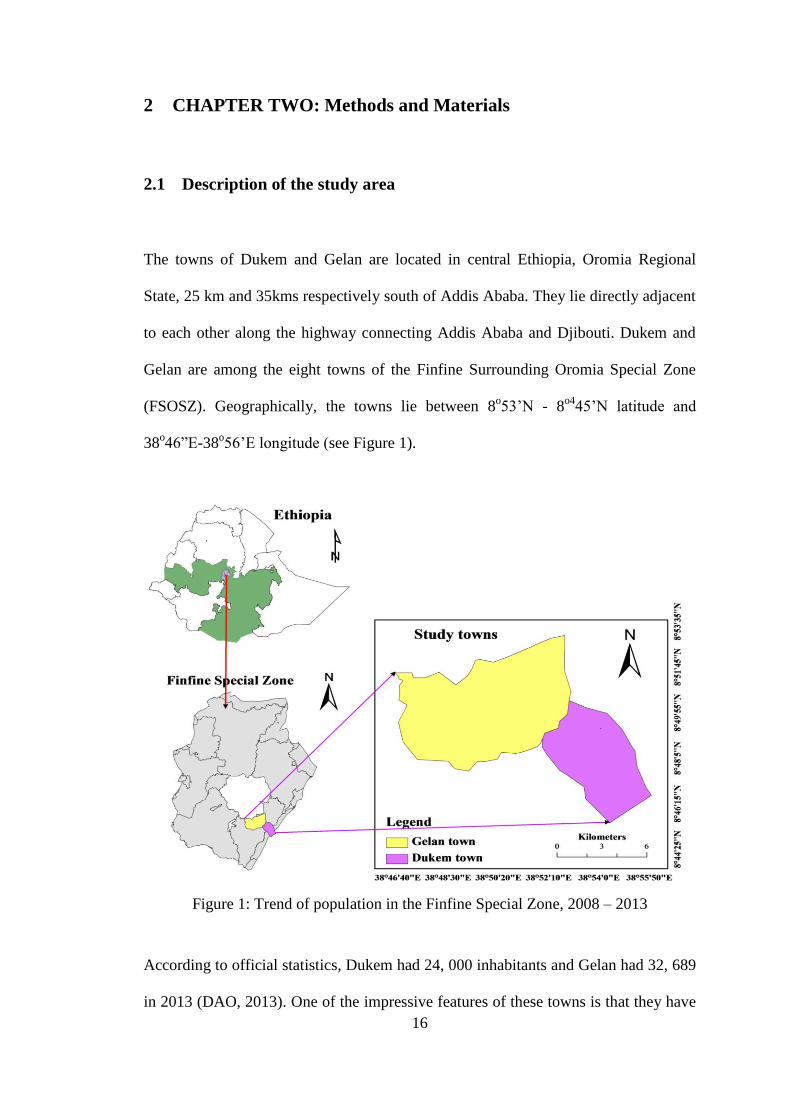
2.1 Description of the study area
The towns of Dukem and Gelan are located in central Ethiopia, Oromia Regional
State, 25 km and 35kms respectively south of Addis Ababa. They lie directly adjacent
to each other along the highway connecting Addis Ababa and Djibouti. Dukem and
Gelan are among the eight towns of the Finfine Surrounding Oromia Special Zone
(FSOSZ). Geographically, the towns lie between 8o53‘N - 8
o445‘N latitude and
38o46‖E-38
o56‘E longitude (see Figure 1).
Figure 1: Trend of population in the Finfine Special Zone, 2008 – 2013
According to official statistics, Dukem had 24, 000 inhabitants and Gelan had 32, 689
in 2013 (DAO, 2013). One of the impressive features of these towns is that they have
17
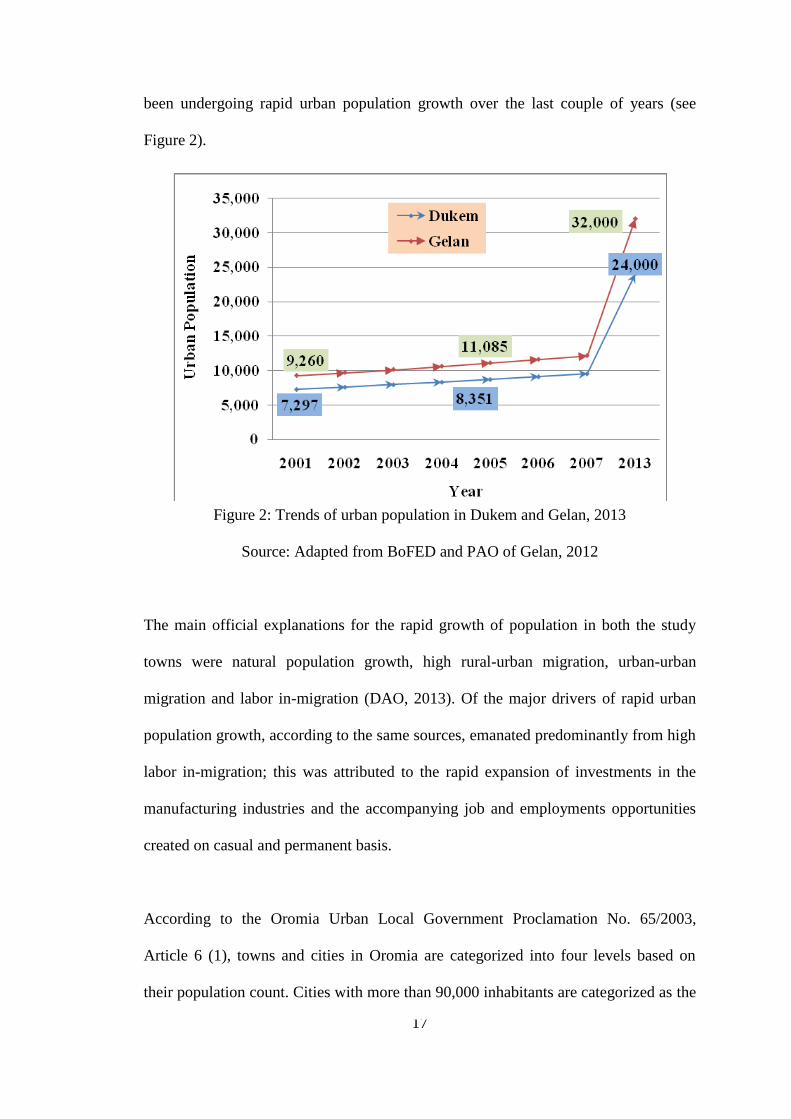
been undergoing rapid urban population growth over the last couple of years (see
Figure 2).
Figure 2: Trends of urban population in Dukem and Gelan, 2013
Source: Adapted from BoFED and PAO of Gelan, 2012
The main official explanations for the rapid growth of population in both the study
towns were natural population growth, high rural-urban migration, urban-urban
migration and labor in-migration (DAO, 2013). Of the major drivers of rapid urban
population growth, according to the same sources, emanated predominantly from high
labor in-migration; this was attributed to the rapid expansion of investments in the
manufacturing industries and the accompanying job and employments opportunities
created on casual and permanent basis.
According to the Oromia Urban Local Government Proclamation No. 65/2003,
Article 6 (1), towns and cities in Oromia are categorized into four levels based on
their population count. Cities with more than 90,000 inhabitants are categorized as the
18
1st level. Cities or towns with residents between 45,000 and 89,000, 10,000 and
44,999 and 2,000 and 9,999 are categorized as the 2nd
, 3rd
and 4th
levels, respectively
(Megeleta Oromia, 2003). Based on these classifications, Galen and Dukem, with
respective populations of 32,689 and 24,000 people, (PAO, 2013) fall within the 3rd
category.
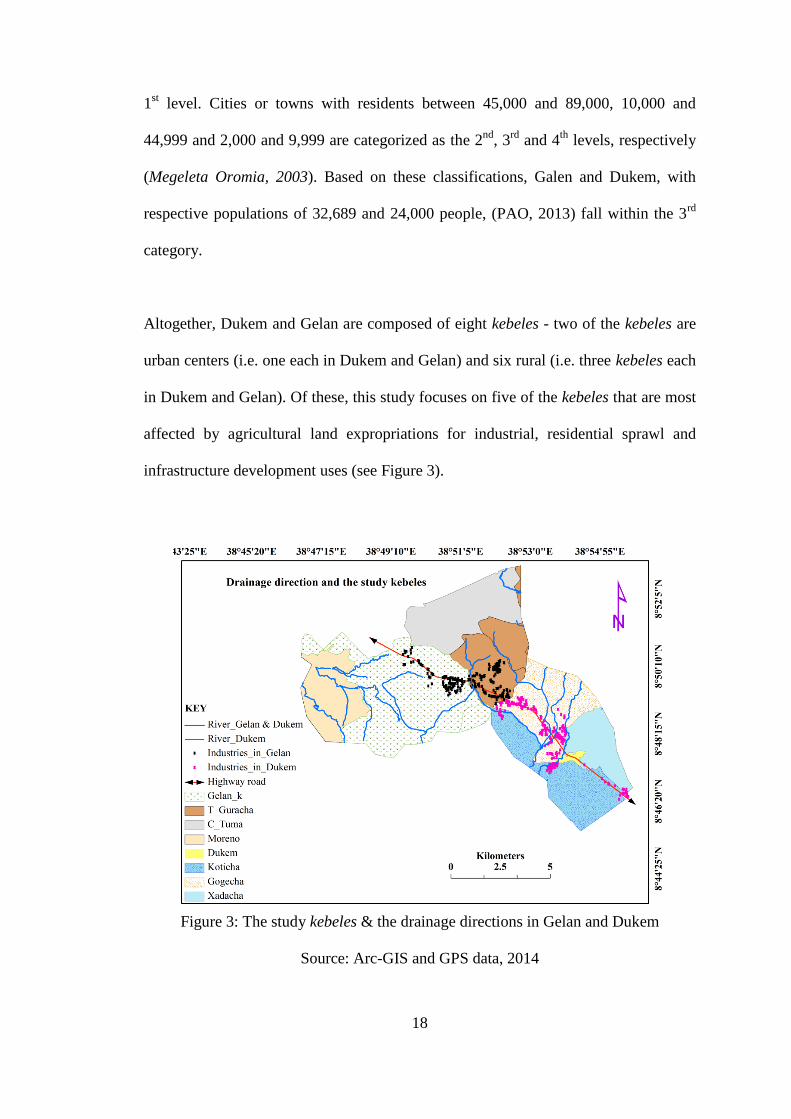
Altogether, Dukem and Gelan are composed of eight kebeles - two of the kebeles are
urban centers (i.e. one each in Dukem and Gelan) and six rural (i.e. three kebeles each
in Dukem and Gelan). Of these, this study focuses on five of the kebeles that are most
affected by agricultural land expropriations for industrial, residential sprawl and
infrastructure development uses (see Figure 3).
Figure 3: The study kebeles & the drainage directions in Gelan and Dukem
Source: Arc-GIS and GPS data, 2014
19
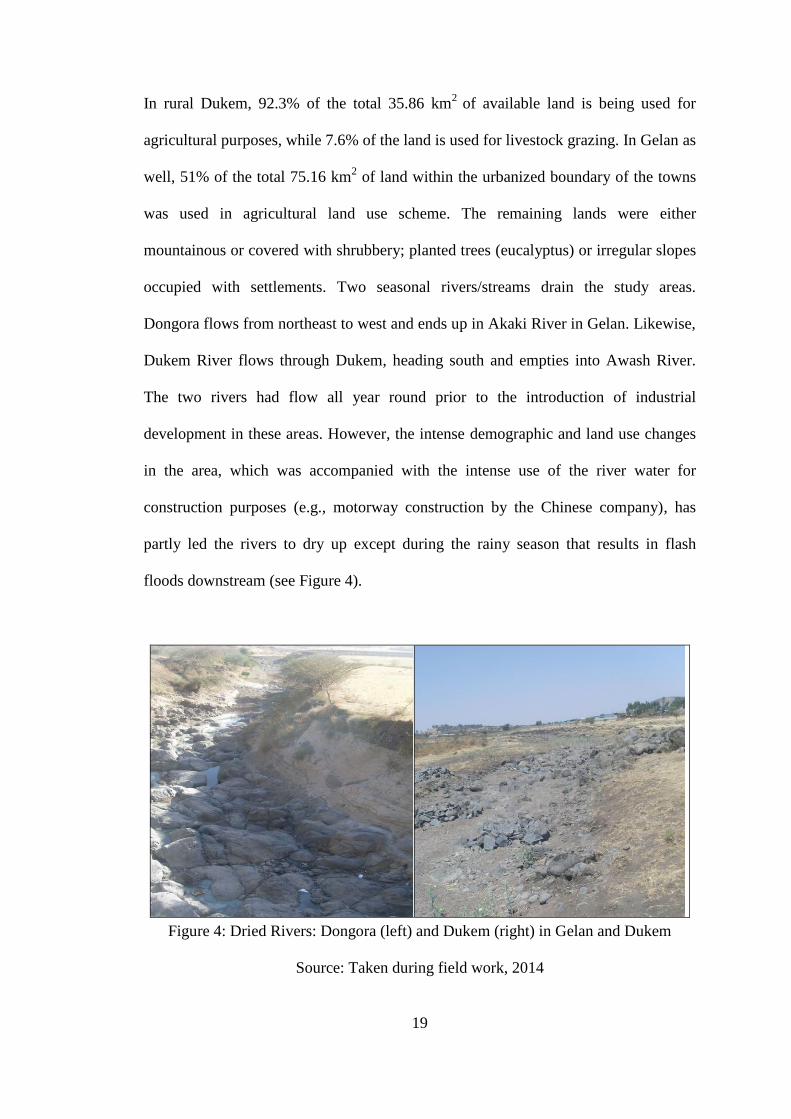
In rural Dukem, 92.3% of the total 35.86 km2
of available land is being used for
agricultural purposes, while 7.6% of the land is used for livestock grazing. In Gelan as
well, 51% of the total 75.16 km2 of land within the urbanized boundary of the towns
was used in agricultural land use scheme. The remaining lands were either
mountainous or covered with shrubbery; planted trees (eucalyptus) or irregular slopes
occupied with settlements. Two seasonal rivers/streams drain the study areas.
Dongora flows from northeast to west and ends up in Akaki River in Gelan. Likewise,
Dukem River flows through Dukem, heading south and empties into Awash River.
The two rivers had flow all year round prior to the introduction of industrial
development in these areas. However, the intense demographic and land use changes
in the area, which was accompanied with the intense use of the river water for
construction purposes (e.g., motorway construction by the Chinese company), has
partly led the rivers to dry up except during the rainy season that results in flash
floods downstream (see Figure 4).
Figure 4: Dried Rivers: Dongora (left) and Dukem (right) in Gelan and Dukem
Source: Taken during field work, 2014
20
2.2 Description of Finfine Surrounding Oromia Special Zone
2.2.1 Introduction
The Finfine Surrounding Oromia Special Zone (FSOSZ), hereafter called Finfine
Special Zone (FSZ), is one of the 18 zones in Oromia Regional State. FSZ is the
smallest zone in terms of its total area (4808km2) (BoFED, 2013) and is neighbored
with North Shewa, West Shewa, South West Shewa and East Shewa zones in the
north, west, southwest and east directions respectively (OWWDE, 2011; BoFED,
2012).
According to the regional government reports, there two major reasons were
responsible for its creation. The first and overt objective was to create suitable
conditions for the regional political administration on one hand and to better plan for
the provision of ‗social and physical infrastructures‘ of the residents in the small
towns and the rural kebeles that are poorly supplied with basic infrastructure. Second
and probably the most driving covert factor for the establishment of the special zone
was the need to create a buffer zone as a way to address the continued expansion of
Addis Ababa: the spillover of urban, industrial and real estate sprawl into agricultural
lands used by the small holder indigenous people (BoFED, 2011).
According to Feyera (2005), the uncontrolled and sustained horizontal expansion of
Addis Ababa, or Finfine, has led to the sprawling of business and residential units
over the agricultural lands owned by the indigenous Oromo people who have been
living in the area for centuries. Therefore, although the explicit objective of creating a
21
new zone surrounding Finfine/Addis Ababa has political or infrastructure provision,
the implicit goal seemed to draw or establish an arbitrary boundary to stop continuous
expansion of Addis Ababa into the surrounding farmlands that has posed serious
problems for the livelihoods of local people and the environment.
2.2.2 Establishment
FSZ was established in 2008 by Proclamation No. 115/2008, on December 2008. The
establishment of FSZ was made possible by re-integrating some of the districts once
part of the nearby zones bordering Addis Ababa/Finfine in all geographic directions.
Accordingly, three rural districts (Sululta, Mulo and Berak) and two towns (Lege-
Tafo Lege-Dadi and Sendafa-Beke) were acquired from the north Shewa zone. Also,
one district (Sebeta-Hawas) and two towns (Sebeta and Burayu) were taken from the
west Shewa zone while a district (Welmera) and a town (Holleta) was obtained from
the southwest Shewa zone. Another district (Akaki) and two other towns (Gelan and
Dukem) were acquired from east Shewa zone. Thus, the Finfine Special Zone is
composed of eight towns (i.e. Gelan, Dukem, Lege-Tafo-Lege-Dadi, Sendafa–Beke,
Sululta, Holota, Burayu and Sebeta) and six rural woredas/districts/ (i.e. Welmera,
Sebeta-Hawas, Akaki, Sululta, Mulo and Berak).
2.2.3 Biophysical environment (Relief, Climate and rainfall)
The landscape of the special zone is generally dominated by plateau lands though
hilly areas and mountains also make up a significant part of the physiographic
attributes of the zone. According to data obtained from the Special Zones Land and
22
Environmental Protection Bureau (2011), plateau lands cover slightly more than 64%
of the entire landscape of the zone while hills and patches of mountains make up
about 20% and 16% respectively. Generally, the altitude of the special zone ranges
between 1500 to 3300masl. The lowest point of the zone is around 1500 meters,
which is found in the Mogor gorges of Sululta and Mulo districts. The remaining 4%
represents a landscape covered with bodies of water, mainly rivers, streams and
wetlands. The majorities of the plateau lands are fertile and are therefore used for
mixed agriculture. Annual food crop production is the dominant activity in all of the
rural kebeles of the special zone.
On the other hand, the mountain peak of Foyata and Entoto are the highest point in
the special zone with a height of more than 3500 masl. In line with the topography of
the areas, the special zone experiences three of the five major agro-climatic divisions
in the country. The three agro-climatic zones include high land/Baddaa that covers
50% of the total area of the special zone. The other two climatic zones are
temperate/Baddadaree and low land/Gammoojjii, which make up about 49% and 1%
of the zone, respectively. According to data obtained from the National
Meteorological Station (NMS), FSZ has an annual temperature that ranges between
<10° to over 25°C. The variation in the mean annual temperature of the special zone
is influenced by the altitudinal location of a specific location.
Accordingly, parts of the special zone that are located at altitudes of less than
1500masl, have a mean annual temperature ranging between 20° and 25ºC, while
those on the hilly sides (>1500masl) have a temperature that varies between <10° to
20°C (OWWDE, 2011). Finfine Special Zone has a uni-modal rainy season that lasts
23
between June and September. This season also marks the main harvesting season of
annual food crops in all parts of the Special Zone. Information obtained from the
NMS (2014) indicates that the mean annual rainfall ranges between 800 to 1240 mm,
depending on the location and altitude of the area.
2.2.4 Land use type
Land use type in the special zone is undergoing rapid changes due to the ongoing
dynamic demographic and economic changes in this area. The physical proximity of
the special zone to the national capital makes these more attractive than many other
places for the establishment of investment projects. Above all, the government policy
of establishing different investment projects and the use of scarce natural resources
such as agricultural and underground water reserves with cheap price tags as an
inventive to attract private enterprises plays a key role for the prevailing rapid social
and economic dynamism in this zone.
Finfine Special Zone is long inhabited by the Oromo people and others who have
engaged in mixed agriculture (crop production and livestock rearing) in the area for
centuries. Recently, the federal government‘s ambition to establish modern industry
zones has become the main driver of change and the special zone came under
intensive land use changes mainly the shift from an agriculture-dominated landscape
to built-up areas. As a result, the land use types in most parts of the Special Zone
have passed through considerable changes over the last couple of years.
24
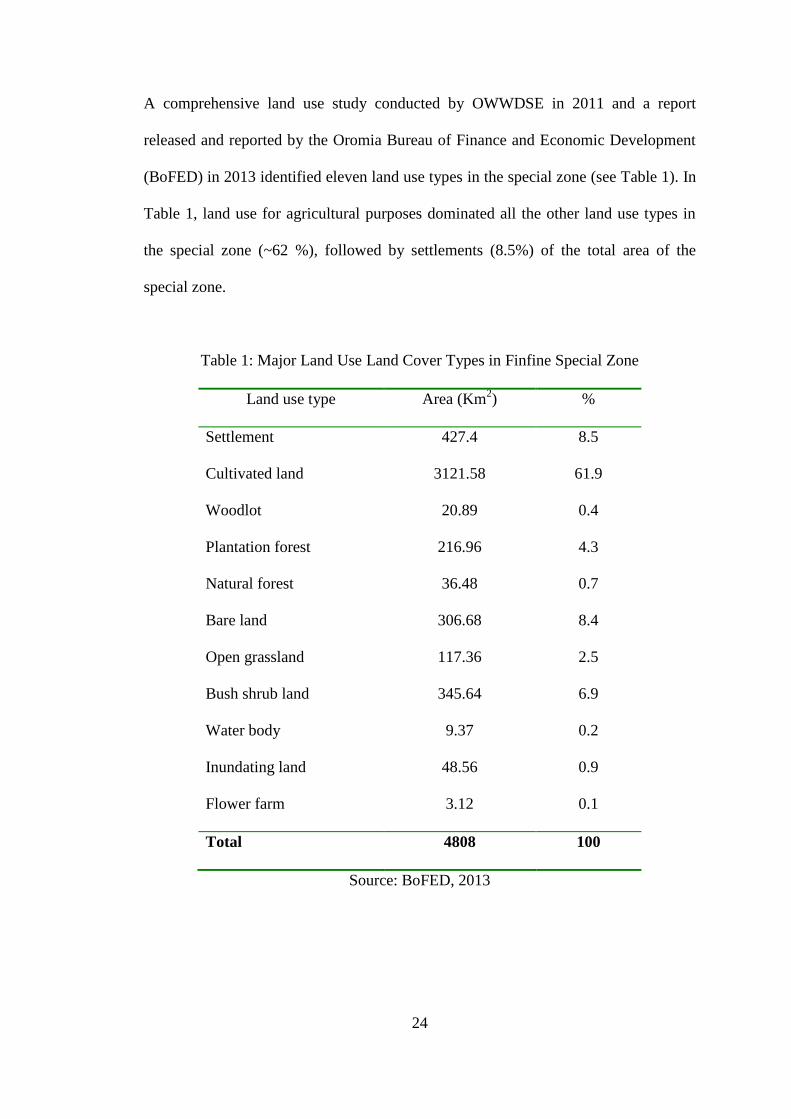
A comprehensive land use study conducted by OWWDSE in 2011 and a report
released and reported by the Oromia Bureau of Finance and Economic Development
(BoFED) in 2013 identified eleven land use types in the special zone (see Table 1). In
Table 1, land use for agricultural purposes dominated all the other land use types in
the special zone (~62 %), followed by settlements (8.5%) of the total area of the
special zone.
Table 1: Major Land Use Land Cover Types in Finfine Special Zone
Land use type Area (Km2) %
Settlement 427.4 8.5
Cultivated land 3121.58 61.9
Woodlot 20.89 0.4
Plantation forest 216.96 4.3
Natural forest 36.48 0.7
Bare land 306.68 8.4
Open grassland 117.36 2.5
Bush shrub land 345.64 6.9
Water body 9.37 0.2
Inundating land 48.56 0.9
Flower farm 3.12 0.1
Total 4808 100
Source: BoFED, 2013
25
2.2.5 Socioeconomic attributes of the FSZ
2.2.5.1 Population
The special zone was established a year later after the national population and housing
census was conducted in 2007. Prior to the establishment of the special zone, all the
small towns and the adjacent districts were administered under the zones from which
they were detached. Furthermore, some of the presently existing towns did not have a
municipal administration, meaning that that there was no separate enumeration of the
urban or rural residents in these areas. Therefore, the principal source of data on the
total population in the study towns and the hinterlands were obtained from the
respective Population Affair Office (PAO) of each municipality. Accordingly,
702,539 people were estimated to have lived in the special zone, out of which 24.4%
were urban residents. However, owing to the ongoing dynamic economic activities
related to the investment sectors, such as flower farms, the establishments of various
manufacturing industries has raised the stake of labor immigration from all corners of
the country such that the special zone is experiencing one of the most rapid
demographic changes since 2008 (see Figure 5).
26
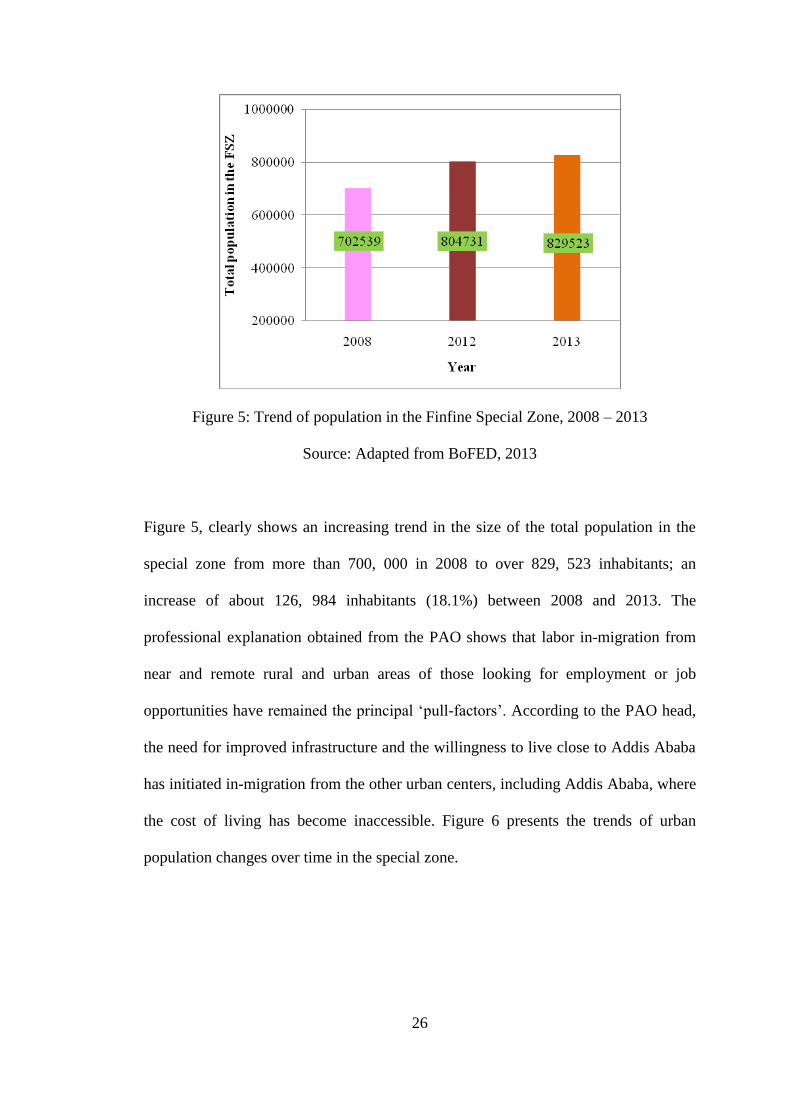
Figure 5: Trend of population in the Finfine Special Zone, 2008 – 2013
Source: Adapted from BoFED, 2013
Figure 5, clearly shows an increasing trend in the size of the total population in the
special zone from more than 700, 000 in 2008 to over 829, 523 inhabitants; an
increase of about 126, 984 inhabitants (18.1%) between 2008 and 2013. The
professional explanation obtained from the PAO shows that labor in-migration from
near and remote rural and urban areas of those looking for employment or job
opportunities have remained the principal ‗pull-factors‘. According to the PAO head,
the need for improved infrastructure and the willingness to live close to Addis Ababa
has initiated in-migration from the other urban centers, including Addis Ababa, where
the cost of living has become inaccessible. Figure 6 presents the trends of urban
population changes over time in the special zone.
27
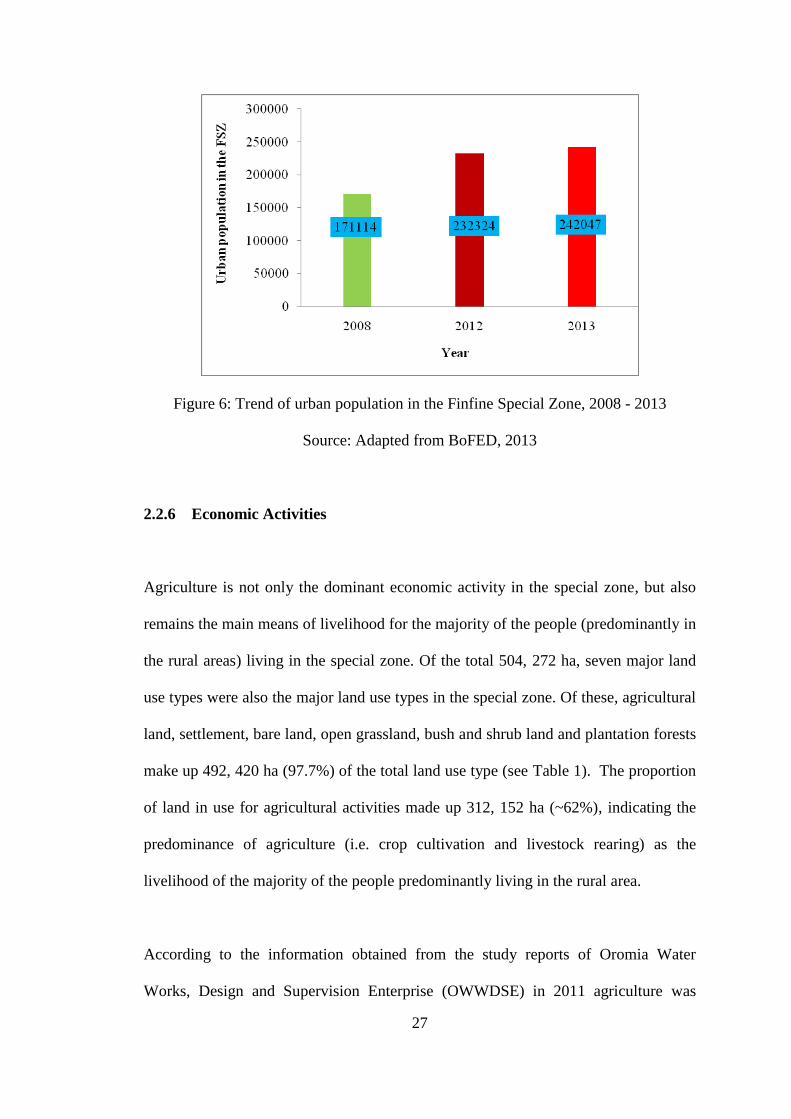
Figure 6: Trend of urban population in the Finfine Special Zone, 2008 - 2013
Source: Adapted from BoFED, 2013
2.2.6 Economic Activities
Agriculture is not only the dominant economic activity in the special zone, but also
remains the main means of livelihood for the majority of the people (predominantly in
the rural areas) living in the special zone. Of the total 504, 272 ha, seven major land
use types were also the major land use types in the special zone. Of these, agricultural
land, settlement, bare land, open grassland, bush and shrub land and plantation forests
make up 492, 420 ha (97.7%) of the total land use type (see Table 1). The proportion
of land in use for agricultural activities made up 312, 152 ha (~62%), indicating the
predominance of agriculture (i.e. crop cultivation and livestock rearing) as the
livelihood of the majority of the people predominantly living in the rural area.
According to the information obtained from the study reports of Oromia Water
Works, Design and Supervision Enterprise (OWWDSE) in 2011 agriculture was
28
practiced by 97% of small holder farmers who earn their livelihoods on farmlands
much smaller than a hectare. Based on the same source, the majority of the
households (~35%) hold farmlands up to or less than a hectare, while 30% hold
farmlands ranging between 1 ha and 3ha in size. The numbers of famer households
who own farmland of more than two hectares make up 30% of the total-farming
households in the zone
2.3 Research Design for Socioeconomic study
The study was carried out by using a mixed method approach (i.e. qualitative and
quantitative). According to Creswell et al., (2003), the use of mixed methods helps to
overcome the shortfalls of using single methods and strengthens the trustfulness and
reliability of the outcome of the study. A quantitative approach will capture
substantial measurable and countable social, economic and environmental
characteristics of the study population (Tolossa, 2005) which would otherwise be
inefficient to capture by other means. Equally, a qualitative approach helps to explore
in-depth and comprehensive ‗processes‘ of a household‘s behavioral traits; such as
perceptions, attitudes, practices and reactions to social, economic and physical
environment of their surroundings. In order to make a visual understanding of the
extent of land conversion and take measurements of the sizes, Satellite images Land
Sat TM
with a resolution of 15m was used to produce LULC maps in order to display
changes on major land use types in the study towns between 2005 and 2013.
In addition to studying the social and economic importance of agricultural land
conversion for industrialization, this study has also looked into the negative outcomes
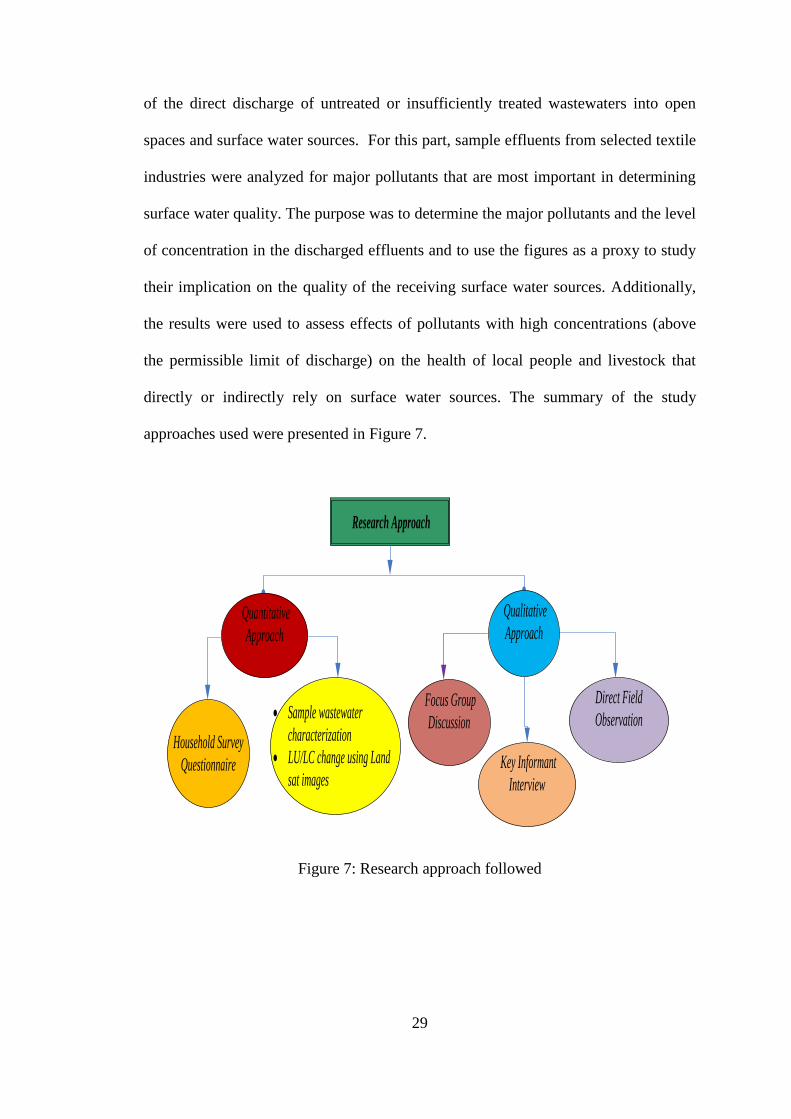
29
of the direct discharge of untreated or insufficiently treated wastewaters into open
spaces and surface water sources. For this part, sample effluents from selected textile
industries were analyzed for major pollutants that are most important in determining
surface water quality. The purpose was to determine the major pollutants and the level
of concentration in the discharged effluents and to use the figures as a proxy to study
their implication on the quality of the receiving surface water sources. Additionally,
the results were used to assess effects of pollutants with high concentrations (above
the permissible limit of discharge) on the health of local people and livestock that
directly or indirectly rely on surface water sources. The summary of the study
approaches used were presented in Figure 7.
Research Approach
Direct Field
Observation
Key Informant
Interview
Focus Group
Discussion
Sample wastewater
characterization
LU/LC change using Land
sat images
Quantitative
Approach
Qualitative
Approach
Household Survey
Questionnaire
Figure 7: Research approach followed
30
2.3.1 The study population and Sample design
2.3.1.1 The Study Population
The primary sources of data for the study were generated from households living in
the five kebeles most affected by sustained agricultural land conversion since
introduction of the establishment of industrial development corridors in 2005. The
other sample was drawn from industrial effluents to understand its effects on the
biophysical environments (i.e. surface water and livestock and human health) within
and surrounding the study population.
2.3.1.2 Sample size and sampling procedures for socio-economic study
Probability and non-probability sampling methods were used to determine sample
sizes in this study. Probability sampling was used to determine the optimal sample
size required to administer household surveys. In determining the representative
sample sizes for the study, the following steps and procedures were applied.
Kothar i ‘s (2004) simplified formula designed to determine proportionate sample
sizes for household surveys was used to compute the sample size required. In this
formula, the following assumptions were made: a 95% confidence level and P = 0.5.
The equation is presented as follows:
Where, n= sample size
Z= Values of standard variant at 95% confidence interval, (Z = 1.96).
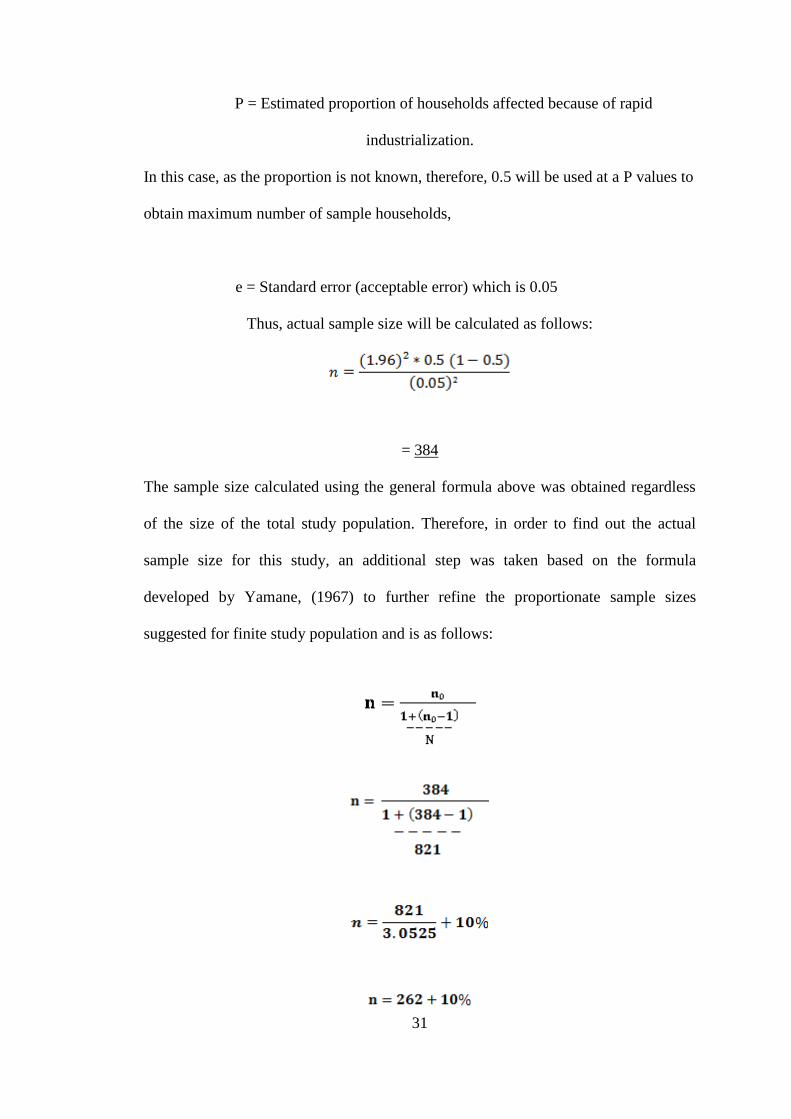
31
P = Estimated proportion of households affected because of rapid
industrialization.
In this case, as the proportion is not known, therefore, 0.5 will be used at a P values to
obtain maximum number of sample households,
e = Standard error (acceptable error) which is 0.05
Thus, actual sample size will be calculated as follows:
= 384
The sample size calculated using the general formula above was obtained regardless
of the size of the total study population. Therefore, in order to find out the actual
sample size for this study, an additional step was taken based on the formula
developed by Yamane, (1967) to further refine the proportionate sample sizes
suggested for finite study population and is as follows:
32
Accordingly, 262 sample informants out of 821 household heads were fixed for
household surveys. Furthermore, an additional 10% of the total population was also
reserved for replacements in order to overcome unexpected uncertainties during the
actual fieldwork. After that, samples were proportionally shared between the study
districts. Accordingly, 118 samples were assigned to Gelan, which had a total study
population of 369 HHs while the remaining 144 samples were assigned to Dukem,
which had 452 HHs. The process of proportionally distributing the samples was
repeated until we reached kebele levels. According to Fincham (2008),
representativeness refers to how well the sample drawn for the questionnaire research
compares with the population of interest.
Concurrently, the qualitative data used in this study was generated by recruiting
sample participants using non-probability sampling method. The decision to make the
selection of key informants for the qualitative data collection could be made
purposefully and/or judgmentally, so that the informants are fit to the purpose (Patton,
2002; Ritchie and Lewis, 2003). Accordingly, 6 heads of households were selected
from each study town. In other words, six participants were selected, two from each
three kebeles in Dukem for the focus group discussion (FGD). In a similar manner,
six participants were selected, three each from the two kebeles, for the study. Also, 13
key government officials and experts from different sectors (i.e. 7 in Gelan and 8 in
Dukem) were selected for interview. There were also participants who were selected
for interviews as illustrative cases on whether or not they were consulted by the
government prior to expropriating their farmlands, determination of compensation
amounts and whether or not they were able to transform their livelihoods with the
compensation money.
33
Furthermore, key informants such as the department of agriculture, development
agents, department of health, environmental and land administration unit, the
investment office, and the appropriate government and public institutions were
interviewed for supplementary qualitative data. Focal persons from private land
developers (investors), farmer tenants (who were/are employed by landowner
farmers) and local agricultural/crop venders were contacted for additional and
supplementary information.
2.3.2 Field data collection and data collection tools
2.3.2.1 Field data collection
The actual fieldwork took place from January 2014 to June 2014. The fieldwork had
been made in three phases: Household surveys were conducted between January 2014
and February 2014. Based on the preliminary results of the surveys, the second phase
of qualitative data collection was conducted through the FGD with purposefully
selected participants (i.e. two female HHHs and four male HHHs) from the study
kebele. The FGD was organized in two phases: first in Dukem and then in Gelan, on
two separate holydays during the month of March 2014. The third phase was mainly
related to interviewing relevant government and local actors. Between April and May
2014, during the third phase of fieldwork, formal and informal interviews and
discussions with grain dealers and rural residents were also made. Finally, yet
importantly, regular field visits and the recording of important data using digital data
storage systems (audio-video) were made until June 2014. Some of the still
photographs are posted in different sections of the thesis with the aim of triangulating
34
the results and enhancing visualization of the object that is presented verbally or
numerically.
2.3.2.2 Data Collection tools
2.3.2.2.1 Structured household survey
The household survey was conducted in order to generate quantitative data. Some of
the information collected through household surveys count or measure the
demographic characteristics, access to resources, agricultural land ownership and size,
crop cultivation and amount of crop harvest, livestock holding size, employment and
income from off-farm and non-farm activities and monthly/yearly savings, if any were
collected from the sampled informants (see Appendix B). Furthermore, compensation
money, human and livestock health problems cost of treatment and the amount of
compensation money and terms of installment were also included.
To this end, 7 data collectors (i.e. 4 in Dukem and 3 in Gelan) were selected based on
their educational status (Diploma and above) and knowledge of the area and received
a day of training for the purpose of the study and to learn how to approach informants
and administer the survey questions. On top of this, data collectors were given a
chance to familiarize themselves with the survey questions so that they were able to
manage data collection within the allocated minimum time of (40‘) per informant. In
order to closely monitor, as well as assist the data collectors during my absence, 2
assistant supervisors (one for each town) and who hold fist degree and has previous
experience in the field data collection were also involved. Furthermore, the
questionnaires were framed in the language spoken by the informants and knowledge
35
of Afan Oromo (i.e. reading and writing) was considered in selecting the data
collectors and supervisors.
2.3.2.2.2 Focus Group Discussion (FGD)
FGDs give people the chance to be active agents in research where they can interact
with each other, share opinions and discuss the topics posed during the discussion
(Desai and Potter 2006). FGD was used to carry out in-depth discussions on how
exactly the lives of the people changed before and after agricultural land conversion
in order to learn more about their emotions and the specific decisions they made to
improve their lives and to adapt to changing living circumstances. FGD was
organized on two different days for each of the study towns. The participants in the
FGD were purposefully selected from each kebele (4 male and 2 female headed HHs
in each group).
The FGD was conducted on major areas such as the environmental history, farmland
ownership and crop production in the past, present and future, change and continuity
in social, cultural and economic realities of the people, opportunities and challenges
on industrial expansion, and relationships between local farmers and the development
owners in their locality. Furthermore, information on their knowledge and perception
towards industrial sprawling into agricultural land, how they feel, understand and the
processes involved in the land conversion, valuation of their property and the amounts
of compensation money (see Appendix C) were also discussed.
36
2.3.2.2.3 Interviews – semi-structured interviews (SSI)
Interviews were another method that I used to collect qualitative data that could not be
obtained by other means (see Appendix D). Semi structured interviews were made
with selected elderly and affected HHs from the study kebeles and with key
informants purposefully selected from investment offices, environmental protection
unit officers, the office of urban/rural land administration, the agricultural department
and development agents (DAs). The intension of the interview with the selected
farmers was to get an in-depth knowledge and understanding of people‘s past and
present livelihood situation, role and level of local people participating in the
development plan, benefits from the trickle-down effect, hope in the future, feelings
and attitudes towards the development activities and pollution. Informal interviews
with non-structured questionnaires was also conducted with residents, investors and
local government officials on several issues related to industrial investment, valuation
and compensation money and the developmental levels of several projects over the
converted lands were also discussed.
2.3.2.2.4 Observation
Every day of fieldwork was an opportunity to observe what is going on in the study,
especially in relation to the new developments (i.e. construction, waste disposal,
activities of affected households, etc.) in the study area. Therefore, observing to the
new realities and recording them provided first-hand information; enabling deeper
insights into the issue under consideration. According Tolossa (2005), walking around
and informally talking with people in different contexts during the fieldwork enabled
37
corroboration of the data and considerably helped to avoid unnecessary speculations
and generalizations about the study population.
2.3.3 Data analysis tools
This study is based on both quantitative and qualitative data. A Mixed Methods
Approach (MMA) was used to analyze the data. Equally, qualitative approach helps
to explore an in-depth and comprehensive processes of a household‘s
behavioral traits such as perceptions, attitudes, practices of understanding reactions
to social, economic and physical environment of their surroundings.
Most of the quantitative data or inferential statistics such as Chi-square test and t-tests
were analyzed using SPSS V. 20. SPSS was also used to generate bar graphs, tables,
charts used to enhance visualization as well as description of some quantitative data.
In addition to SPSS, MS-Excel is also used to draw bar graphs and line charts to study
the trends and patterns of a few variables such as farmland holding sizes, cultivated
farmland sizes and crop production between 2004/05 and 2012/13. Qualitative data
were analyzed through content and context analysis. Generally, the analysis and
discussion of quantitative and qualitative data were done by triangulating results to
either supplement the result or verify qualitative responses and/or quantitative results.
Land Sat TM
and the GIS software was utilized to generate a location map of the study
area, mapping the spatial distribution of industries and their development level out of
field data collected using Geographic Positioning System (GPS). Also, a digital
camera was utilized to take still pictures of industrial establishments, waste storage
and disposal mechanisms of industries in general and textile industries in particular

38
and the patterns of residential expansions over the converted lands. In the study of the
textile effluents and the laboratory test results for the concentration level of selected
pollutants, R software was used to draw line graphs both to enhance analysis of the
results and visualization. Summary of the research design is presented in the figure 8.
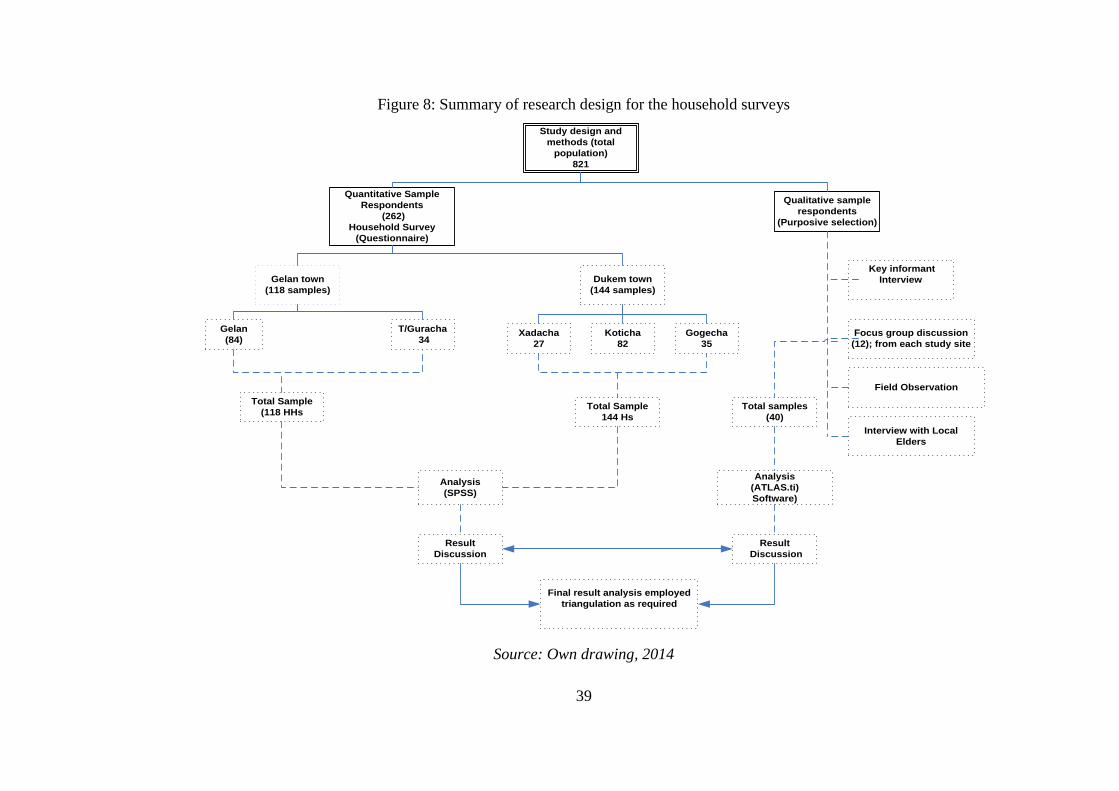
39
Figure 8: Summary of research design for the household surveys Study design and
methods (total
population)
821
Quantitative Sample
Respondents
(262)
Household Survey
(Questionnaire)
Qualitative sample
respondents
(Purposive selection)
Gelan town
(118 samples)
Dukem town
(144 samples)
Gelan
(84)
T/Guracha
34
Total Sample
(118 HHs
Koticha
82
Gogecha
35
Xadacha
27
Total Sample
144 Hs
Analysis
(SPSS)
Key informant
Interview
Focus group discussion
(12); from each study site
Field Observation
Interview with Local
Elders
Total samples
(40)
Analysis
(ATLAS.ti)
Software)
Result
Discussion
Result
Discussion
Final result analysis employed
triangulation as required
Source: Own drawing, 2014
40
2.4 Sample size and sampling procedures for biophysical study
2.4.1 Why textile industries are selected?
The textile industry is one of the oldest industries in the world and one of the top
emitters of polluting effluents into the local environment. The environmental
pollution of textile industries is attributed to its consumption of large volumes of
water and chemicals at different stages of the wet processing phases. It is widely
reported that a textile industry could use as many as 2000 different chemicals from
dyes to transfer agents (Khan and Malik, 2014). In spite of its shortfalls, the textile
industry is one of the top priority areas of investment for which the government
allocated special incentives.
The rationale for promoting the sector was related to availing more employment
opportunities and establishing a link between domestic raw material producers (large-
scale commercial agricultures that produce cotton) and the textile industries, while
also encouraging the export of value added products. In addition, textile industries
have become the government favorite as its expansion would also initiate the
establishment of sister industries called chemical industries that could produce raw
materials (chemicals) used by the textile industries for dying and bleaching of fibers
or yarns.
The selection of these industries was based on the size of the project in terms of
capital and employment opportunities and the location of these industries relative to
water sources at the time when this research was designed. All the selected textile
41
industries bleach fibers and yarns that are used as raw material for the production of
polyesters (e.g. ALSAR, ALMHADI), blankets (NOYA) and supply of acrylic yarns
for domestic markets (e.g. DHG). All other small textile and garment factories in the
study areas were limited to knitting or dry processing of finished textiles that did not
involve the use and discharge of liquid wastes.
2.4.2 Field Procedures
2.4.2.1 Preparation for field sample collection (Phase I)
Phase I dealt exclusively with the identification and preparation of the sample sites
and all of the necessary materials required for the sample collection in the field. To
this end, the preliminary preparations were made in close consultation with laboratory
personnel from Addis Ababa Environmental Protection Authority. Such consultation
is essential and is considered as an appropriate measure to ensure the standards of the
sample collection and analytical methods (APHA, 1999). The researcher first
identified effluent discharge points for all industries and recorded its particular
coordinates using the ‗Global Positioning System‘ (GPS) device. Besides, all the
required tools used to collect, preserve and transport the samples were sorted and the
cleaning and the disinfection processes were done at the laboratory station. An Icebox
was also prepared to handle and keep the samples at a temperature of 40C and taken to
the laboratory within the standard time frame of less than eight hours of sample
collection. Furthermore, codes, names and source of the samples (industry name)
were written on a paper and fixed to each polyethylene can in order to guarantee the
chain of custody of the samples.
42
2.4.2.2 Field work (Phase II)
At this stage, the actual samples were collected in the field in June 2013 using grab
and composite methods. The grab method was utilized to take in-situ measurements
for some parameters that otherwise would change in their characteristics. A total of
200ml was taken from effluent discharge points of the sampled textile industries and
measurements for pH, EC, TDS and temperature were taken using HANAN
Instrument Model HI 98129.HI98130. In determining these parameters, an
appropriate calibration and adjustments was made at each stage for all parameters
before taking measurements. The Color and Turbidity level of the samples were
determined with a Photometer 8000 (Palintest 8000 models). The next step was
collecting samples for laboratory testing and this was done using the composite
method from which 250ml samples were collected five times within half an hour
intervals. The samples were then mixed and put into one-liter airtight polyethylene
cans (GEMS/WATER Operational Guide-3rd
edition, 1992) and stored in an icebox at
a temperature of 40C and transported to AAEPA for the physico-chemical and
microbial analysis.
2.4.2.3 Analytical Procedure (Phase III)
This phase entirely represented laboratory-based activities for all the samples. As it
was the case for determining the physical, chemical and biological parameters, the
laboratory test methods and procedures applied were based on the standard methods
outlined and recommended by APHA (1999) and WHO/UNEP (1996).
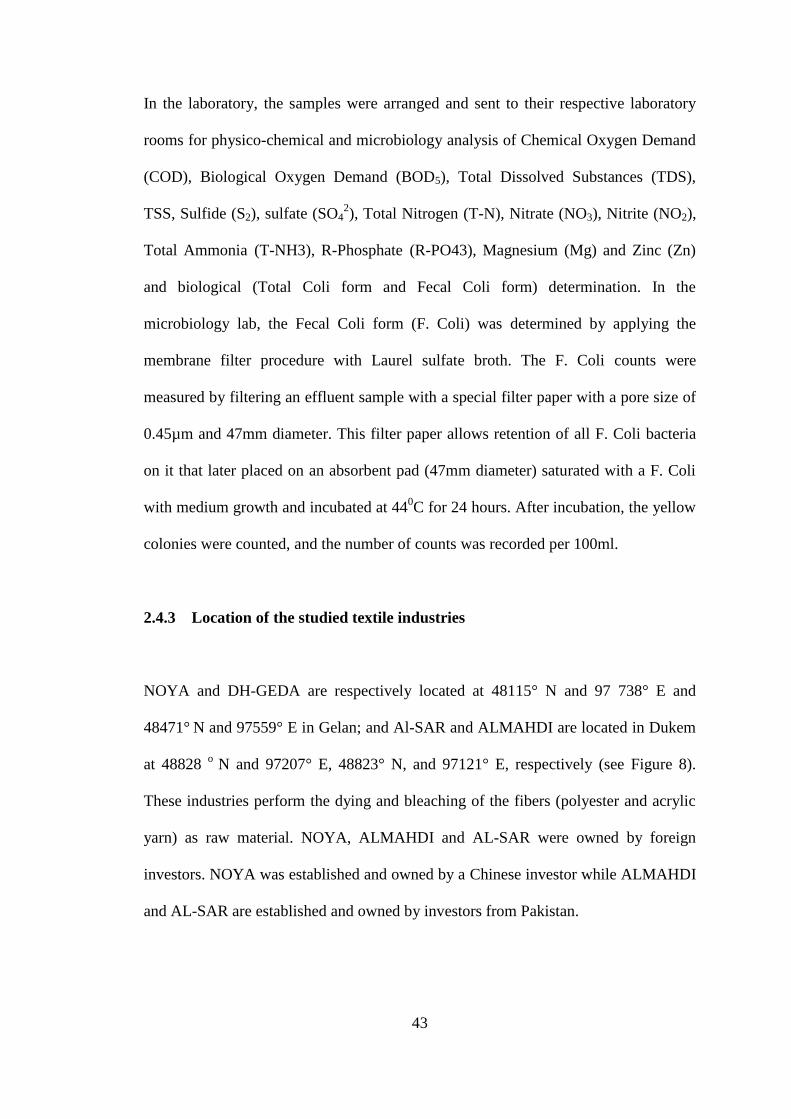
43
In the laboratory, the samples were arranged and sent to their respective laboratory
rooms for physico-chemical and microbiology analysis of Chemical Oxygen Demand
(COD), Biological Oxygen Demand (BOD5), Total Dissolved Substances (TDS),
TSS, Sulfide (S2), sulfate (SO42), Total Nitrogen (T-N), Nitrate (NO3), Nitrite (NO2),
Total Ammonia (T-NH3), R-Phosphate (R-PO43), Magnesium (Mg) and Zinc (Zn)
and biological (Total Coli form and Fecal Coli form) determination. In the
microbiology lab, the Fecal Coli form (F. Coli) was determined by applying the
membrane filter procedure with Laurel sulfate broth. The F. Coli counts were
measured by filtering an effluent sample with a special filter paper with a pore size of
0.45µm and 47mm diameter. This filter paper allows retention of all F. Coli bacteria
on it that later placed on an absorbent pad (47mm diameter) saturated with a F. Coli
with medium growth and incubated at 440C for 24 hours. After incubation, the yellow
colonies were counted, and the number of counts was recorded per 100ml.
2.4.3 Location of the studied textile industries
NOYA and DH-GEDA are respectively located at 48115° N and 97 738° E and
48471° N and 97559° E in Gelan; and Al-SAR and ALMAHDI are located in Dukem
at 48828 o
N and 97207° E, 48823° N, and 97121° E, respectively (see Figure 8).
These industries perform the dying and bleaching of the fibers (polyester and acrylic
yarn) as raw material. NOYA, ALMAHDI and AL-SAR were owned by foreign
investors. NOYA was established and owned by a Chinese investor while ALMAHDI
and AL-SAR are established and owned by investors from Pakistan.
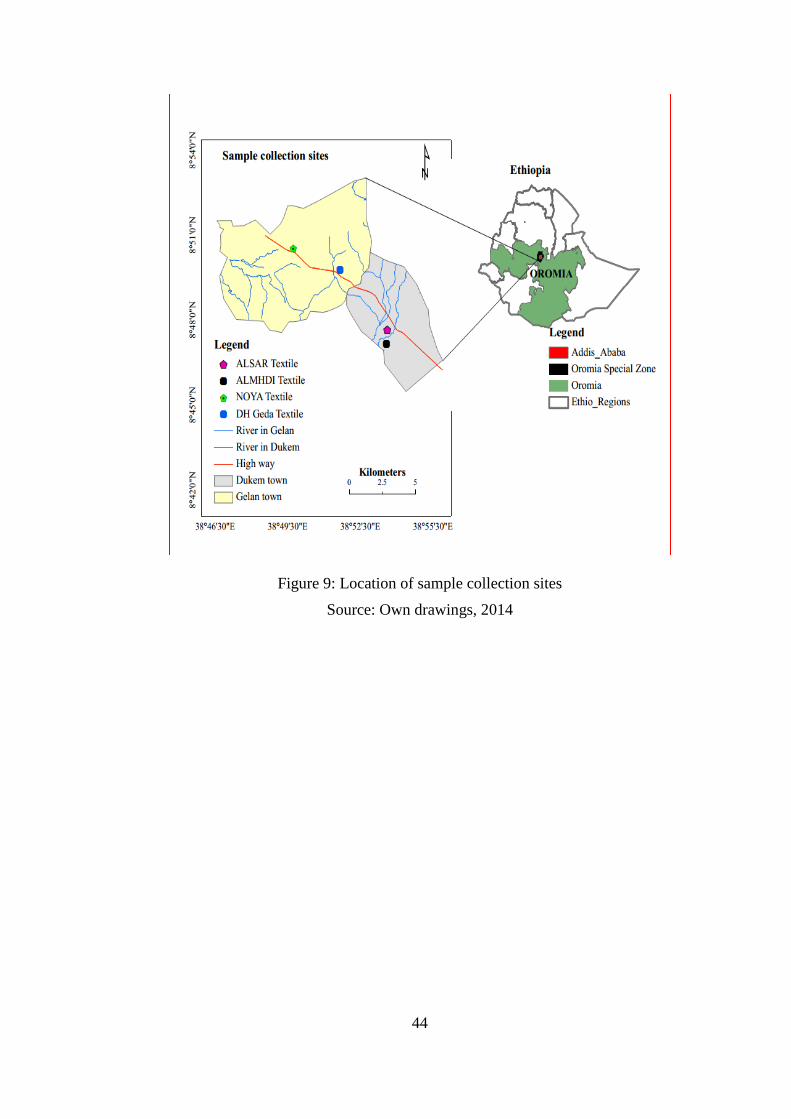
44
Figure 9: Location of sample collection sites Source: Own drawings, 2014
45
3 CHAPTER THREE: Review of Related Literatures
3.1 Theories of Industrial Location
In establishing a new plant, the first question that comes to mind is where to locate the
facility. Economists generally consider selection of suitable sites as an important
criterion for reducing the cost of production and maximizing profits (Sambidi, 2003).
The purpose of the location theory is to determine the reasons for and explain why a
particular factor is important to one industry and not to another. There are different
types of costs, such as transportation cost, labor cost, raw material cost, land cost,
utility cost, etc., associated with the production of a particular product. Different
literature indicates that a decision related to the location of industry is based on four
major areas of interests: cost factor, locational interdependency, demand and profit.
Decision makers consider these costs, and try to minimize them all, but the nature of
the decision often requires that trade-offs be considered before deciding to locate the
secondary industry at a particular site.
Generally, all the theories relate the importance of cost advantage to the selection of a
site. The leading theories of plant location begin with the Von Thünen‘s Theory of
Location (Greenhut, 1982). Von Thünen‘s theory of plant location was based on
agricultural farm produce. His theory was based on distance and transportation costs,
farm produce and the price of renting land. In his theory, Von Thünen assumed
homogenous land in all respects and in all directions from the city center (consumer
center). In his theory, he also looked into the trade-offs between the effects of
transportation cost and the land rent. In other words, the prices of land rent decreases
46
with increasing distance away from city while transportation cost increases with
increasing distance away from the city center. This implies that an agricultural
product that is grown on plots of land closer to the city is charged more land rent than
the product that is grown further away from the city. Conversely, agricultural products
grown closer to the city are associated with less transportation costs (from the plot to
the market) than the product that is produced on a plot farther away from the city.
Von Thünen‘s theory tried to explain the location of agricultural produce in terms of
the trade-off between transportation cost and land rent while trying to make a profit.
Von Thünen‘s theory of finding the appropriate place to establish farm produce
emphasized on primary industry (i.e. agriculture). However, other theorists have
emerged with the idea of identifying the best place to establish manufacturing
industries, also called secondary industries. Any attempt to establish a model for the
location of a secondary industry runs into complications greater than those
confronting Von Thünen, who dealt with primary industries (agricultural land use).
The location of secondary industries depends, to an important extent, on human
behavior and decision making and on cultural, political and economic factors.
One of the personalities known for formulating location theories of secondary
industries was Alfred Weber. Unlike Von Thünen, Weber came out with a theory of
‗least cost‘ as a basis to determine the location of a specific industry. In this section,
we will discuss two theories of industrial location that are more relevant to this study:
―least cost factor‘ by Alfred Weber and ‗Profit‘ by Smith and Pred (1971). The
theory for which ‗cost factors‘ was considered as the basis for any decision related to
the location of an industrial plant was developed by Alfred Weber in 1929 while his
47
‗least cost‘ theory emerged in 1909. Alfred Weber was an Economic Geographer
from Germany and lived between 1868 and 1958. According to Weber, the decision
on where to establish an industry should be entirely based on the ‗minimum‘ cost
required to transport the raw material and the final product to the end consumer.
The three pillars of the ‗least cost‘ theory are to reduce the costs of transportation
(fuel and raw materials), ‗labor cost‘ and ‗agglomeration costs‘. By the ‗labor cost‘,
he tried to justify that an increase in the cost of labor would have a negative effect
against maximizing ‗profit‘, meaning that an industrialist should locate their factories
in a place where ‗cheap labor‘ is available. The labor factor exerts a locational pull,
where in some cases it attracts an industry from a point of low transportation cost to a
point where transportation cost is high. This change occurs as long as the savings in
the labor cost are greater than the additional transportation costs incurred due to the
shift from the point of minimum transportation. The third point raised in the ‗least
cost‘ theory was ‗agglomeration of enterprises in a given area‘ (i.e. can draw an
industry closer together or away from each other).
The agglomeration economies such as, proximity to auxiliary industries, proximity to
markets, and economies of size attract an industry together, whereas the de-
agglomerating factor such as high land cost tends to offset industry concentration. In
his discussion, ‗transportation‘ and ‗labor costs‘ are considered to be general factors
and the agglomeration forces are regarded as general local factors. In this theory, the
clustering of industries were considered as an opportunity for maximizing ‗profit‘ by
reducing the costs of purchasing materials. In other words, agglomeration benefits
sharing available resources, both material and human.
48
Although, Weber‘s ‗least cost‘ theory has some credibility on the basis of present
global social and economic order, scholars argue that the theory did not represent the
industrial activities going on today (Sambidi, 2003). Albeit, these two theories of
industrial location have something to do with the recent processes and strategies
designed to attract international investors over the last couple of years in Ethiopia.
The federal government made concessions to encourage Foreign Direct Investment
(FDI) by using incentives to attract both domestic and foreign private sectors to the
priority areas of the manufacturing industries. As discussed in the previous sections,
the government availed investment land at a very cheap price and that could also be
leased for an extended period of time, while also considering the availability of cheap
labor that could compromise employment and reduce wages to less than $1US a day
(<$30US/month). The measures taken by the federal government were viewed
positively by most foreign investors who were working in a country where the price
of land lease and labor costs were very high (i.e. in Asia countries such as China,
Pakistan; Turkey, etc).
3.2 Debates on Agricultural Land Conversions: Urbanism VS Ruralism
While agriculture and subsistence farming have always been important to sustain the
livelihoods of families and whole communities worldwide, more and more attention is
drawn to the role of the non-agricultural sectors for development (Tan 2015). There
are two divergent views and ongoing debates among stakeholders grouped under
pro-urbanism and pro-ruralism, whether to convert agricultural lands in urban
peripheries to non-agricultural uses or not. Pro-urbanism favors the conversion and
development of lands adjacent to urban fringes.
49
They argue that in the faces of rapid urbanization and industrialization, transforming
agricultural lands in the urban periphery is not an alternative but a necessity to
facilitate rapid and sustained growth of the modern economy (Cardnas, 1996; Azadi,
et al., 2012). According to pro-urbanist view, industrialization has remained and will
remain essential and desirable in boosting national economic growth and in the
processes of poverty reduction. According to pro-urbanist views, emphasis on the
industrial sector by transforming agricultural lands in the urban fringes would help to
stimulate economic growth. The focus upon developing the ‗modern‘ sectors within
countries ultimately resulted in an urban bias in terms of developmental thinking and
government policies as argued by Dethier and Effenberger (2011).
The prioritization of industry over agriculture is explained by the power relations at
play in society, where power resides in the urban rather than the rural sector.
Moreover, urban areas and industrialization are linked with modernity, whereas rural
areas and the agricultural sector are again seen as traditional and conservative (Cypher
and Dietz 2008). On the other hand, pro-ruralists stood against this move (Moffat,
2006; Azadi, et al., 2012). They object to the successive conversion of agricultural
land, which wreaks havoc on the livelihood of agricultural communities by reducing
farmland and causing the subsequent decline in agricultural production. With
considerable attention and money flowing to the urban sector, support for the rural
sector lags behind; perpetuating or else causing debilitative livelihood losses in
agricultural communities (Cypher and Dietz, 2008). Lipton‘s theory of urban bias
highlights that poverty is still more concentrated in rural areas. Industrialization alone
will not reduce underdevelopment without redistributive policies and synergies
between both sectors.
50
As argued by Bernstein and Byres (2001), agricultural transformations do not only
rely upon economic factors, but political and socio-ecological factors need to be
considered as well. Political considerations and governmental policies heavily
contribute to changes taking place on the ground, particularly in those situations
where governments openly favor industrial development over rural development.
Ecological factors such as the availability and quality of (natural) resources also play
an important role in relation to changes taking place in the rural sector, where
agricultural activities regularly form the most important economic activities for many
households (Tan, 2015). In the context of these research, the researcher accepts the
inevitability of transforming agricultural lands to industrial development in order to
stimulate economic growths. Yet, the level of wisdom in terms of adequate and
sufficient land use planning on the one hand and the rational and efficient uses of
converted lands are major areas of concern in order reduce the negative outcome of
agricultural land conversion of the land losers both in the short and long terms time
laps.
3.3 Rural-urban interactions and the Spillover effects of industrial expansion
In a rapidly urbanizing world, the traditional distinction between rural and urban areas
is no longer applicable to the unfolding processes in many of the developing countries
today (Tan, 2015). This emanates from sustained horizontal expansion of urban
boundaries and the growing interlinkages between the two areas for social and
economic reasons. Many farming households especially those who are located in the
peri-urban areas opt for an alternative manses of employment and sources of income
in the urban centers. Furthermore, there are cases where farmers establish their
51
settlements in the urban centers but spend days in the rural areas working on their
farmlands. This creates problems for policy-makers, who regularly do not take these
changes into account and ―divide their policies along spatial and sectoral lines‖
(Sheng, 2002).
According to Tan (2015), farmers practices increasingly rely on employment
activities in the agricultural as well as the non-agricultural sectors, which creates new
configurations that further blur the traditional rural-urban divide in many parts of the
urban centers in developing countries. Rigg (2006) argues that rural areas are turning
into ―mixed-interest-spaces‖ where activities in both the rural and the urban sector are
highly interrelated and complementary. Emphasis is also placed on the creation of so
called ‗transition‘ or ‗peri-urban‘ areas where rural and urban meet face-to-face
(Lodder, 2012). In these areas, rural and urban activities overlap. However, rural
activities no longer dictate the ways of earning a living as non-agricultural activities
become more important (Tan, 2015).
This leads to agrarian transformations, agricultural land conversion for urban
expansion and industrial and infrastructure developments that cause immense pressure
on the livelihoods of the agricultural households and the environment as noted by
Phuong (2007) and Hoang (2009). Nguyen, et al (2011) and Ellis (in Potter et al.,
2008) describe this process as livelihood diversification, whereby ―the process by
which rural households construct an increasingly diverse portfolio of activities and
assets in order to survive and improve their standard of living‖. The interrelation
between rural and urban areas in the context of industrialization and urbanization
results in changing roles for both geographical areas. Evidence from several Asian
52
countries shows how farming is only one activity among many and how the growth of
the non-agricultural sector increases the potential of de-agrarianization (Rigg, 2006).
In spite of the growing interaction between people in the rural and urban areas, the
socioeconomic statuses of the people in the rural areas fall prey to the ever expanding
urban boundaries in a bid to meet their housing unit, economic and infrastructure
development. According to Sheng (2002), Start and Johnson (2004), the highest
income and most secure activities are characterized by a high entry barrier, which
increases the possibility of social differentiation and makes farming households more
vulnerable and less secure to the changes (Rigg, 2006).
Ethiopia is overwhelmingly an agrarian economy, where the agricultural sector
absorbs around 83% of the labor force and adds more than 40% into the national
GDP. The country is currently experiencing rapid urbanization and economic
transformation processes in which small and medium sized towns have become
vibrant. The spillover of rapid urbanization and industrialization happening in many
parts of these towns: the peripheries of Addis Ababa in particular have become
sources of concern as they are expanding into of prime agricultural lands and, hence,
at a cost to the livelihoods of farmers.
Investment deals to promote industrial and commercial agriculture, including flower
farms across many parts of Ethiopia, are raising concerns about the livelihoods of the
agricultural community. This is true in most of the peri-urban areas of Addis Ababa
where active land deals have been taking place for private industrial development and
for the construction of industrial zones/parks and have consumed considerable
hectares of land in the Finfine Special Zone.
53
According to a report by Oromia Land and Environmental Protection Bureau
(OLEPB) in 2011, more than 4500 hectares of agricultural lands were converted in the
peri-urban areas of FSZ for investment promotion mainly to manufacturing industries.
On a national level, an estimated area of more than 3500 hectares were either partly or
wholly converted for construction of industrial zones/parks on the outskirts of Addis
Ababa, FSZ, Dire Dawa, Hawassa and Combolcha, most of which are agricultural
lands (EIA, 2015) . So far, 650 hectares of formerly agricultural land have been
transformed and allocated for the construction of industrial parks in two sites (i.e.
Bole-Lemi and Qilinxo areas) in the periphery of Addis Ababa.
In Dukem, 250 hectares of converted lands were used to establish the ―Eastern
Industry Zone‖, with a proposed investment capital of $333,333,333 USD and
employment opportunities for 46, 000 people nearly 10 years ago. More than 800 ha
of agricultural lands were converted in order to create an economic zone in two of the
eight small towns in the special zone: Gelan and Dukem, in which the lands were
distributed for the establishment of private firms between 2005 and 2013. Critics of
land use changes argue that the scramble for land (domestic or foreign origins) does
not always benefit the local people who cede their land (Nguyen, 2009; Cardnas,
2009). This will remain the central assumption and argument throughout this study.
Thus, I hypothesize that the unsustainable appropriations of considerable size of
agricultural land for industrialization and accompanied municipal land uses during
the past eight years have created significant and serious negative socio-
economic impacts on smallholder farmers.
54
3.3.1 Socio-economic effects
Empirical evidence shows that rapid industrial growth and the persistent growth of
urban populations are considered as the principal driving factors that trigger urban
sprawling outward into agricultural lands located in urban fringes (Li Jiang, et al.,
2012; Cárdenas, 1996). The effects of ALCs on the livelihoods of affected households
and the quality of local environments in many parts of developing countries,
especially among the countries undergoing rapid industrialization and urbanization,
have been studied by many researchers in Asia (Wu, et al., 2004; Azadi, et al., 2011;
Lodder, 2012; Valeria, et al., 2012; Quang, 2013). In China, 1.5 million farmers lost
their farmlands due to urban encroachment and pressure from industrial expansion in
the 2000s alone (Lu, et al., 2013). Liua, et al., (2009)‘s study based on the analysis of
land cover, maps the years between 1990 and 2006 and found that most arable lands
were lost to urban and rural settlement development in China‘s Southern Jiangsu
province.
A similar study by Tran (2013), shows that Vietnam has lost close to half a million
hectares to industrialization and urbanization processes in the sub-urban areas over a
period of 15 years, 1993 to 2008. Likewise, Vietnam lost close to 73,000 hectares of
fertile agricultural lands each year between 2000 and 2005 directly due to
industrialization and the accompanying urbanization and infrastructure provisions
(Minh, K., 2009); Nguyen, 2011; Tran, 2013). Dien, et al. (2011) had also studied the
effects of land conversions in Vietnam based on the data obtained from government
reports and the results indicated that, around 4 percent of Vietnam‘s total cultivated
land has been converted in a period of less than 5 years, between 2000 and 2005.
55
Thus, the large-scale conversion of ALs in Vietnam (over 70, 000 hectares annually)
has been affecting the lives of more than 2 million people whose entire livelihood was
based on agricultural activities (Dien et al., 2011; Dien, et al., 2010). A study by Tan
(2015) has also revealed that about 459 million hectares of agricultural land have been
designated for conversion to establish Industrial Zones (IZs) and Industrial Parks (IPs)
in Vietnam in the Mekong Delta3 areas alone, while a plan to convert an additional
881 million hectares is pending government decision. If the plan to convert 30 million
hectares of potentially fertile land in the Mekong Delta ALs proceeds would be
converted into empty industrial zones, it would mean many negative outcomes to
those that would lose their land (Lodder, 2012).
Another country in Asia that experienced rapid agricultural land conversions in favor
of industrial expansion and the accompanying non-agricultural activities was
Indonesia. Indonesia lost about 382,416 ha of prime agricultural land to industrial
developments within a short period of three years between 2000 and 2002 (Azadi, et
al., 2010). Coupled with industry derived land conversions in these countries, the
development policies set by governments to provide infrastructures and the
proliferation of private housing units were also documented as another driver for LCs
in peri-urban areas (Fazal, 2000; Minghong, et al., 2004; Wu, et al., 2004; Xu, 2004;
Azadi, et al., 2010; Zhong, et al., 2011 and Nguyen, 2011). Likewise, the Netherlands
lost close to 25,296 ha of agricultural lands between 1996 and 2000, while Germany
lost close to 42,408 ha each year during the same period.
3 Location of major industrial development zones and Industrial parks in Vietnam
56
With regard to the effects of ALCs, numerous studies concluded that ALC for non-
agricultural uses has significantly contributed to the overall real GDP. However,
controversies exist when it comes to the livelihoods of the local people who lose the
land. Some studies reported positive outcomes of ALCs in terms of the trickle-down
effect for the local people, while others report the opposite, where affected households
were marginalized and in most cases, their livelihoods were ruined. International
experience shows that, unsustainable and unregulated land conversion undermines
secure land tenure and employment in agriculture in peri-urban areas and initiates or
aggravates livelihood vulnerability among subsistent farming households (Cardenas,
1996; Eila, 2000; Van Suu, 2009; Chen, 2009; Azadi, et al., 2009, 2010; Nguyen,
2011 and Rudi, et al., 2012).
Furthermore, different studies have documented that ALCs have affected the
livelihoods of farming HHs by making them landless and/or by reducing employment
opportunities in the agricultural sector (Van Suu 2009; Chen 2009; Nguyen, 2011,
2009; Azadi, et al. 2011; Rudi, et al. 2012). A study conduc ted by Fazal ( 2000)
indicated that, the conversion of nearly 24 million hectares (i.e., nearly 2% of the
world cropland) for industrial and urban uses was estimated to have fed up to 84
million people in the world.
Likewise, another study indicated that the conversion of nearly 1 .5 million
hectares of agricultural lands in India over a period of 30 years (i.e.1955 to
1985) had raised widespread food insecurity across many agricultural families
(Cardenas, 1996). Continued land conversion in favor of industrial expansion in
China has significantly reduced agricultural land availability and other rural
57
livelihood options (Yuri, 2010). Yuri (2010) has identified those local communities,
especially poorer farmers for whom land is the only means of livelihood were the
primary victims and shouldered the burden. Empirical studies conducted in
Vietnam, Philippines, India and China revealed the negative outcomes the
indiscriminate conversion of ALs that pushed the affected HHs into social and
economic stress (Eila, 2000; Mohammed, 2000; Wu, 2008; Yuri, 2009 and Lodder,
2012) and advised the rely on a well formulated development and implementation
plan while also preserving prime agricultural lands.
According to their arguments, the negative outcomes of ALCs emanates partly from
the inadequacy of appropriate development planning prior to land use changes and
partly from the lack of sufficient implementation tools: legal, institutional and
adequate human power (Cárdenas, 1996; Azadi, et al., 2010; Siyanbola, et al., 2011
and Valeria, et al., 2012). The effectiveness of proper land use planning and
implementation tools was also witnessed in the study outputs of different scholars.
The success or failure of household livelihood strategies is influenced by the quality
of early planning and management tools and the level of legal application for any
divergences in relation to land uses (Chen, 2009; Azadi, et al., 2012). Government
bias towards development and investors is also raised as a major cause for the
marginalization of powerless agricultural households (Tan, 2015).
Major problems associated with ALCs are related to the availability and quality of the
LUP and the processes involved in the decision to make land use changes and the
strength of implementation and monitoring strategies and tools in place. LUP is the
systematic assessment of physical, social and economic factors of the land in such a
58
way as to encourage and assist land users in selecting options that are sustainable and
meet the needs of society (FAO, 1993). According to FAO (1993), the purpose of
LUP is to select and put into practice those land uses that will best meet the needs of
the people while safeguarding resources for the future. In this respect, most urban
centers in developing countries, mainly in sub-Saharan Africa, lack practical and
effective LUPs and are characterized by the lack of equity and efficiency in land uses
to address the negative outcomes of rapid industrialization on the peri-urban
agricultural lands (Aribigbola, 2008). In spite of these, however, a we l l - s t u d i e d
a n d w e l l -planned, w e l l -implemented a n d m o n i t o r e d industrial development
projects were found to benefit local communities from the ‗trickle-down‘ effects
such as physical and social infrastructures, created opportunities by diversifying
potential sources of income from off-farm and non-farm employment opportunities.
According to Lewis, the Dual Sector model, or the expansion of the modern industrial
sector could benefit traditional local people in four major ways. The first and the
second merits are employment opportunities and off-farm/non-farm employment
opportunities respectively for urban unemployed and the farming households. This
helps to absorb surplus labor while also reducing pressure on agricultural lands. The
third benefit associated with industrial development, according to the model, is
benefiting from infrastructure development such as roads, safe water, power, health
centers, etc. and modernization/change over time in the living standards and styles of
local people. The fourth benefit would be inter-linkage between rural and urban or
agriculture and industry (Meier, 1995). In this respect, studies made in Vietnam,
Bangladesh, Sub-Saharan Africa and China by Van Suu, (2009), Wu, et al. (2011),
Rudi, et al. (2012) and Tran (2013), argues that establishing industrial developments
59
created opportunities by diversifying potential sources of income from ‗off-farm‘ and
‗non-farm‘ employment (Nguyen and Philippe, 2011; Nguyen and Ho, 2013).
3.3.2 Environmental consequences: surface water pollution
Industries have long been considered as an ‗engine‟ of economic growth (Azadi, et
al., 2011; Siyanbola, et al., 2011) by which many countries promote their rapid
economic growth. The textile and garment industry is one of the most important sub-
sector of the manufacturing industry that also transformed the economies of some of
the developing countries, such as China, Bangladesh, India, Vietnam, Turkey and
Nigeria (Islam, et al., 2011; UNIDO, 2012; Tran, 2013; Singh, et al., 2013). In
Bangladesh, the textile and garment sector contributes to about 77% of the country‘s
foreign earnings and employs 50% of the industrial work force (Islam, et al., 2011).
Albeit, the textile industry has high environmental impacts, mainly pollution related
problems. Studies (e.g., Islam, et al., 2011) have shown that textile industries are
widely known as the leading source of global environmental pollutants next to
agriculture. The environmental problems associated with the textile industry are
typically those associated with water pollution (Islam, et al., 2011; Siyanbola, et al.,
2011; Khan and Malik, 2014). Most textile industries operating in developing and
underdeveloped countries such as China, India, Turkey, Bangladesh, Vietnam and
Nigeria do not have a proper or efficient wastewater treatment plants and thus
discharge untreated or insufficiently treated effluents into the adjacent environment
(Islam, et al., 2011; Siyanbola, et al., 2011; Paul, et al., 2012).
60
Textile industries consume large volumes of water and chemicals at different stages of
the wet processing phases. It is widely reported that a textile industry could use as
many as 2000 different chemicals from dyes to transfer agents (Khan and Malik,
2014). It also uses close to 2270 liters of water to complete the production of enough
fabrics for covering a sofa (Islam, et al., 2011). Furthermore, it uses water during
bleaching; and conveying chemicals used in the dying process. Large amounts of
water are also required for cleaning the machines after all the phases of textile
production are completed.
According to Govindarajalu‘s (2003) report, the daily water consumption of an
average-sized textile mill having a production of around 8,000 kg of fabric per day is
about 1.6 million liters. Such textile plants could also generate up to 200-350 m3 of
effluents per ton of finished product (Ranganathan, et al., 2007; Gozálvez-Zafrilla, et
al., 2008), resulting in an average pollution of 100 kg chemical oxygen demand
(COD) per ton of fabric (Jekel, 1997). Similar studies have also revealed the presence
of high amounts of pollutants in the wastewater. For instance, the effluent from the
dye bath had a COD of 5000–6000 mg/l, Total Dissolved Solids (TDS) of
52,000mg/l, Suspended Solids (SS) of 2,000 mg/l, and pH 9 (Verma, et al. 2012;
Khan and Malik, , 2014).
One of the major areas of critique in relation to industrial development parallel to
agricultural land losses was likelihood of the deterioration of environmental qualities.
Advocates of environmental protection suggest that any plan to expand or establish
new industrial development programs must be healthy and sustainable economically,
socially and environmentally. One of the main concerns of environmentalists in
61
relation to industrialization is associated with the risk of the pollution that could lead
to degradation of scarce natural resources, such as water (Mark, 2004).
Water is one of the scarce resources that support life provided by nature. Globally, the
proportion of available fresh water to man is hardly 0.3 to 0.5% of the total water (2.4
%) supply on earth (Manunatha, 2008). Population growth, massive urbanization,
rapid rates of increased industrialization have led to water pollution, which
subsequently results in the gradual deterioration of the quality of water both on the
surface and underground, undermining their importance and use by humans and
animals (Ayotamuno, 1993; Hollander, 2003; Siddiqui, et al., 2009, Gebre and
Rooijen, 2009).
Viewed from social and economic points, toxic pollutants reaching surface water
could yield negative outcomes by risking human and livestock health. Moreover, high
loads of certain pollutants such as BOD5, COD and some hazardous metals,
undermine the self-purifying ability of wetlands by reducing the healthy interaction of
wetland biodiversity thus causing harms to wetland ecosystem services such as the
supply of pure water sources. Various studies (e.g., Mark, 2004; Manunatha, 2008;
Kumer, et al., 2012) have shown that some industrial effluents can pollute the soil and
affect plant growth, including agricultural crops which obviously, affect the
livelihoods of farmers in the area.
Therefore, other than the biological impacts on soil and crops, industrial effluents can
affect the incomes of local farmers‘ directly through-reduced production and seed
quality and indirectly through medical expenses and reduced agricultural labor forces.
62
Water pollution is a serious threat to current economic and human health. Health
problems such as skin allergies, respiratory infections, general allergies, gastritis and
ulcers were common among the families directly using polluted water for drinking,
washing and other domestic purposes (Khan and Malik, 2014).
In terms of its economic implications, some industrial effluents can pollute soils,
leading to toxicity to the seedlings and at higher concentration, affecting harvests. For
example, the effects of undiluted textile industrial effluents on the germinability of
cereal seedlings showed an inhibitory effect of 28.9% (Kumer et al., 2006;
Manunatha, 2008). A similar study conducted on the performances of five varieties of
groundnut crop grown on soils polluted by pharmaceutical effluents by Arumagam
(2007) showed that, undiluted or less diluted effluents affect crop performances by
reducing germination and slowing growth. Moreover, vegetables grown with waste
water can cause health problems in humans due to the likelihood of toxic substances
such as heavy metals concentrating in the leafy vegetables (Gebre and Rooijen, 2009).
A study has also revealed its effects on the rice crop production where chemical
effluents from textile industries led to rice productivity yield losses of 10-13% in Can
Tho City of the Mekong Delta in Vietnam (Huynh Viet Khai and Yabe, 2012).
Some pollutants at higher levels are likely to damage the quality of local
environments, either directly or indirectly, by affecting the physical and biological
environments, such as land, water and living organisms, including human health. For
instance, high BOD5 concentration increases demands for dissolved oxygen (DO) by
decomposers, leading to the depletion of O2 required by other aquatic organisms to
survive. From a health perspective, some pollutants could suppress the immune
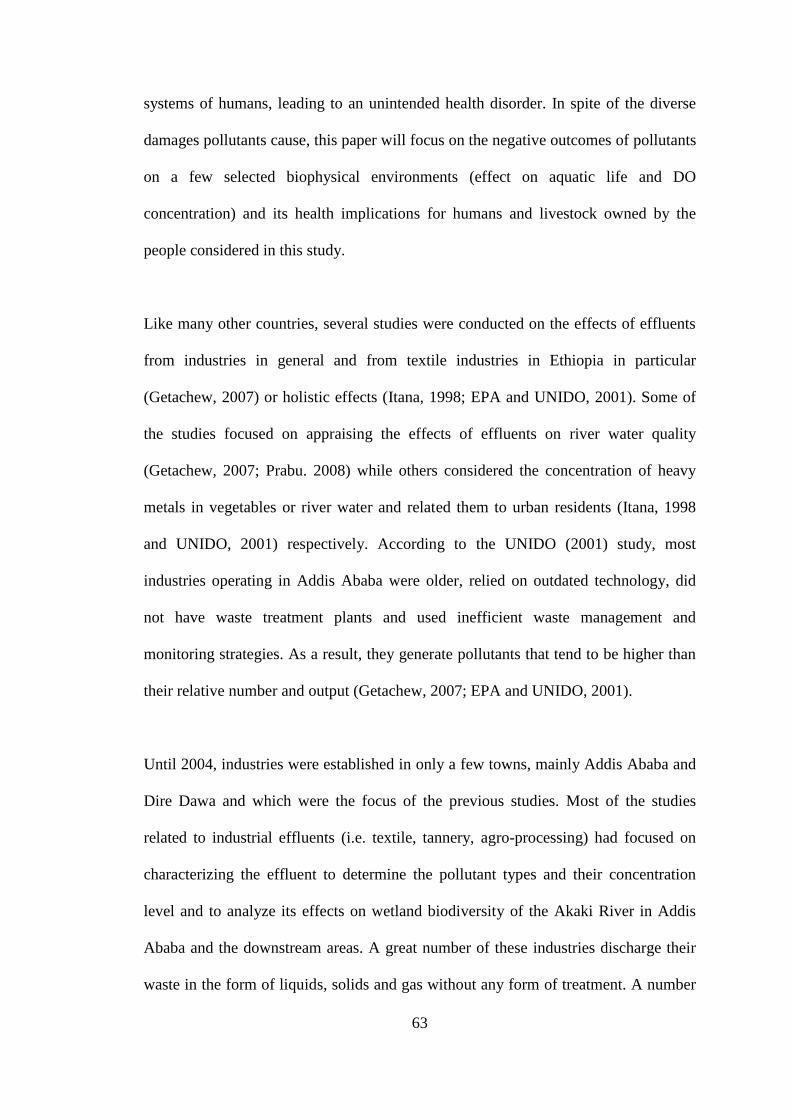
63
systems of humans, leading to an unintended health disorder. In spite of the diverse
damages pollutants cause, this paper will focus on the negative outcomes of pollutants
on a few selected biophysical environments (effect on aquatic life and DO
concentration) and its health implications for humans and livestock owned by the
people considered in this study.
Like many other countries, several studies were conducted on the effects of effluents
from industries in general and from textile industries in Ethiopia in particular
(Getachew, 2007) or holistic effects (Itana, 1998; EPA and UNIDO, 2001). Some of
the studies focused on appraising the effects of effluents on river water quality
(Getachew, 2007; Prabu. 2008) while others considered the concentration of heavy
metals in vegetables or river water and related them to urban residents (Itana, 1998
and UNIDO, 2001) respectively. According to the UNIDO (2001) study, most
industries operating in Addis Ababa were older, relied on outdated technology, did
not have waste treatment plants and used inefficient waste management and
monitoring strategies. As a result, they generate pollutants that tend to be higher than
their relative number and output (Getachew, 2007; EPA and UNIDO, 2001).
Until 2004, industries were established in only a few towns, mainly Addis Ababa and
Dire Dawa and which were the focus of the previous studies. Most of the studies
related to industrial effluents (i.e. textile, tannery, agro-processing) had focused on
characterizing the effluent to determine the pollutant types and their concentration
level and to analyze its effects on wetland biodiversity of the Akaki River in Addis
Ababa and the downstream areas. A great number of these industries discharge their
waste in the form of liquids, solids and gas without any form of treatment. A number
64
of studies have indicated that, among the industries located in Addis Ababa, 90 to
96% discharge their waste into nearby water bodies and open spaces without any form
of treatment (Mohammed, 2002; EPA, 2005; Tamiru, Alemayehu, et al., 2005).
3.4 Industrial Development in Ethiopia: Before EPRDF4
A look at the limited literatures the researcher reviewed on the historical modern
industrial development in Ethiopia did not allow the researcher to learn the exact time
modern industry was introduced into the country or the type of industry introduced
first. Some sources indicated the introduction of the ‗grain mill‘ in present day Holleta
in 1896 (Getachew, 2007), while others bring it to mid-20th
c during the imperial
regime and following the construction of Ethio-Djibouti railway line (Mohammed,
2002; Ayele, 2003; Moti, 2004). Here the completion of the railway line that reached
Addis Ababa in 1917 was seen as major driver/stimuli for the introduction of modern
industries. The railway line brought a new horizon of communication to the external
world (mainly Italy, Greece and Armenians) that signified the beginning of trade and
the flourishing of new urban centers along the new line, mainly for commercial
reasons (Befekadu and Birhanu, 2000). According to Ayele (2003) and Chole (2004),
untapped resources and local markets attracted these countries to establish
manufacturing industries with the aim of producing goods for domestic markets.
However, the overall assessment of industrial development during these periods was
limited in number (< 50), location and its contribution to the national economy. Most
of the industries were owned by the private investors, mostly ex-patriots, who
4 EPRDF: Ethiopian People Republic Democratic Front
65
established their firms in the cities of Addis Ababa and Dire Dawa. Some other textile
industries were also established in Combolcha and Hawassa, while a Beer and Malt
factories were established in Bedele and Asalla towns during the Derg regime that
ruled the country 1974-1991 under the socialist ideology (command economy), which
confiscated and nationalized most of the private companies (Befekadu and Birhanu,
2000). Hence, the role of the private sector in the industrial sectors was limited by the
government and all of the Small and Medium Scale industries were put under state
rule. Therefore, as was the case of its predecessor, the industrial sector during the
Derg regime did not develop and neither did its contribution to the national economy.
3.5 EPRDF and the Industrial Development: Manufacturing Industry
The collapse of the Derg regime and the assuming of political power by the EPRDF
regime have come with opportunities for the industrial sectors and to those interested
in the sector. The EPRDF replaced the command economy of the Derg with a ‗free
market economy‘ that left the door open to all interested private sectors (domestic and
foreign) in a bid to modernize the economy. The federal government crafted well
elaborated industrial development strategy in 2002 (IDS, 2002). The IDS consists of
eight major principles or pillars in which the industrial development would be based
on. Some of the most important pillars outlined in the IDS promote the Agricultural
Development Led Industrialization (ADLI), export oriented development and the
expansion of labor-intensive industries (IDS, 2002).
In the strategy, the private sectors were in the premium position where they were
considered as ‗an engine of industrial growth‘. According to this strategy, government
66
responsibility was limited to a leadership role that involved coordinating and
strengthening the participation of the public in the sector: in the government priority
areas of the manufacturing industries in particular. To realize the full implementation
of the strategy and to enhance the role of the private sectors, it was boldly stated in the
strategy that the federal or regional government bodies, at all levels of administration,
would discharge their responsibilities in creating the most conducive environments. In
the IDS, the following were listed as a top government priority objective in the whole
process of establishing sustainable industrial developments. These are: (i) labor
intensive industry; (ii) industries that use agricultural products as input; (iii) export-
oriented and import substituting industries and (iv) Contribute to faster technology
transfer. Industries that fulfill these are eligible to receive incentives and special
supports for those who are willing to invest in the sub-sectors of the manufacturing
industry.
The government favors investors in the following areas: Small and Micro Enterprises
(AME) development and the Medium and Large Industries (MLI) developments. The
MLI are composed of the following manufacturing sub-sectors: Textile and Apparel
Industry; Leather and Leather Products Industry; Sugar and Sugar Related Industries;
Cement Industry; Metal and Engineering Industry; Chemical Industry; Pharmaceutical
Industry; and Agro-Processing Industry are among the top priority sub-sectors that are
eligible to benefit from incentives and special supports arranged at federal and
regional government levels.
In order to materialize the ambition of boosting the participation of the private sectors,
the federal government has taken successive and proactive measures since the
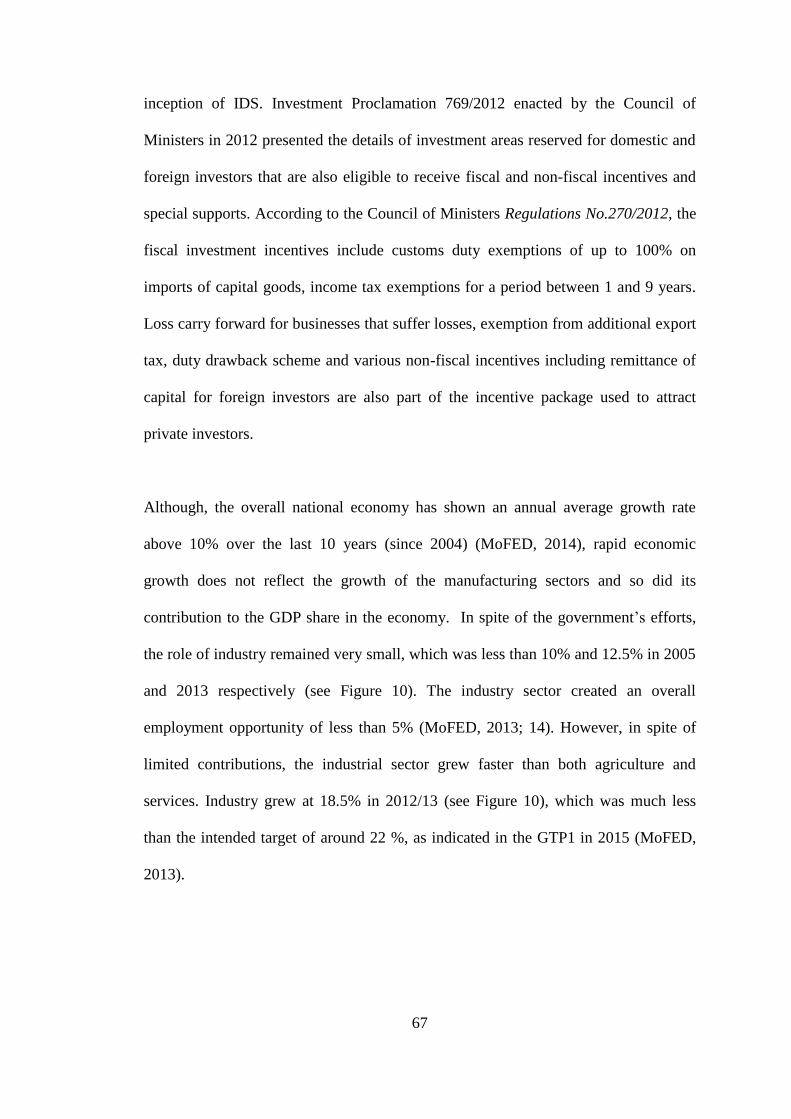
67
inception of IDS. Investment Proclamation 769/2012 enacted by the Council of
Ministers in 2012 presented the details of investment areas reserved for domestic and
foreign investors that are also eligible to receive fiscal and non-fiscal incentives and
special supports. According to the Council of Ministers Regulations No.270/2012, the
fiscal investment incentives include customs duty exemptions of up to 100% on
imports of capital goods, income tax exemptions for a period between 1 and 9 years.
Loss carry forward for businesses that suffer losses, exemption from additional export
tax, duty drawback scheme and various non-fiscal incentives including remittance of
capital for foreign investors are also part of the incentive package used to attract
private investors.
Although, the overall national economy has shown an annual average growth rate
above 10% over the last 10 years (since 2004) (MoFED, 2014), rapid economic
growth does not reflect the growth of the manufacturing sectors and so did its
contribution to the GDP share in the economy. In spite of the government‘s efforts,
the role of industry remained very small, which was less than 10% and 12.5% in 2005
and 2013 respectively (see Figure 10). The industry sector created an overall
employment opportunity of less than 5% (MoFED, 2013; 14). However, in spite of
limited contributions, the industrial sector grew faster than both agriculture and
services. Industry grew at 18.5% in 2012/13 (see Figure 10), which was much less
than the intended target of around 22 %, as indicated in the GTP1 in 2015 (MoFED,
2013).
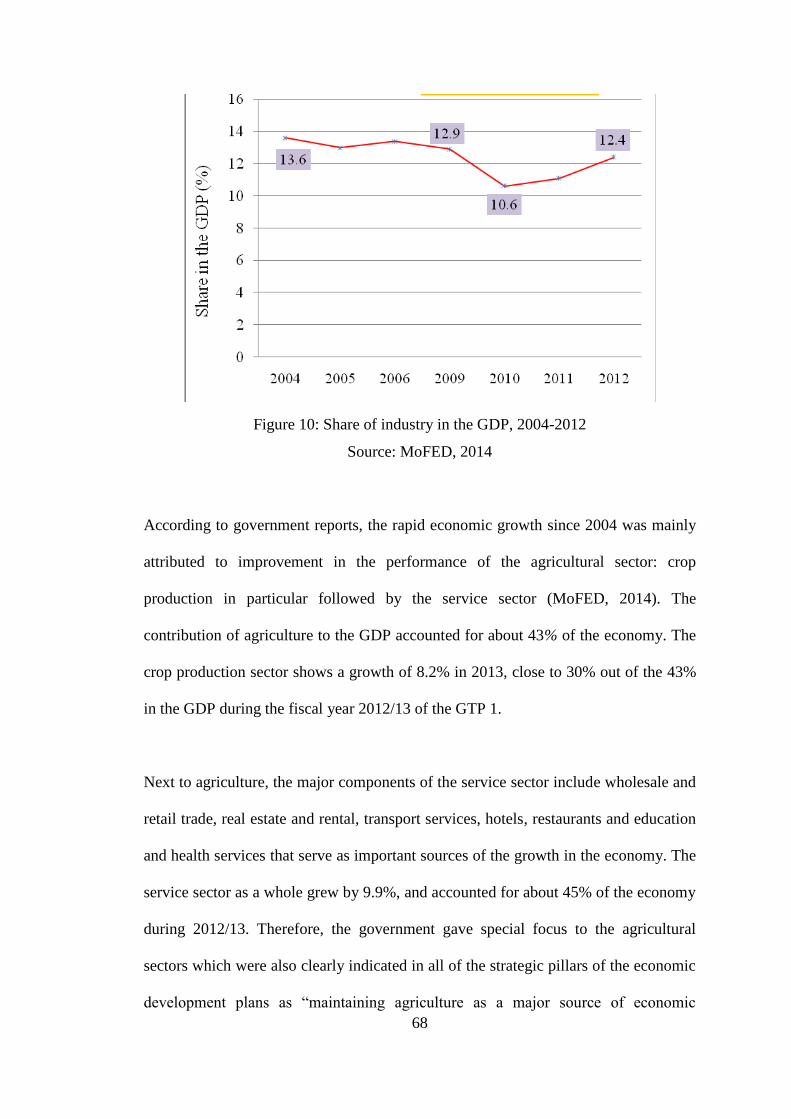
68
Figure 10: Share of industry in the GDP, 2004-2012
Source: MoFED, 2014
According to government reports, the rapid economic growth since 2004 was mainly
attributed to improvement in the performance of the agricultural sector: crop
production in particular followed by the service sector (MoFED, 2014). The
contribution of agriculture to the GDP accounted for about 43% of the economy. The
crop production sector shows a growth of 8.2% in 2013, close to 30% out of the 43%
in the GDP during the fiscal year 2012/13 of the GTP 1.
Next to agriculture, the major components of the service sector include wholesale and
retail trade, real estate and rental, transport services, hotels, restaurants and education
and health services that serve as important sources of the growth in the economy. The
service sector as a whole grew by 9.9%, and accounted for about 45% of the economy
during 2012/13. Therefore, the government gave special focus to the agricultural
sectors which were also clearly indicated in all of the strategic pillars of the economic
development plans as ―maintaining agriculture as a major source of economic
69
growth‖ in the short as well as long term until industry improves and gradually
replaces the sector. Hence, well thought out planning against any development that
destroys or alters the scarce and fertile prime agricultural lands also helps ensure the
sustainable rapid economic growth achieved so far.
The industrial sector is still small, accounting for less than 13% of the economy in
2012/13. Manufacturing and the construction sub sectors are major components of the
industry sector. According to the government report, the growth of the construction
sub-sector of the industry sector was more important than the manufacturing sector,
from which much was expected in the economy. The construction industry accounted
for 5.6% of the economy and on average grew at about 22% per annum during the
first three years of the GTP1 period though it was only 4.2% of the economy. On
average it grew at 11.6% per annum during the same period.
Figure 11: Real GDP growth rate industry sectors, 2004 -2013
Source: MoFED, 2015
70
Industries are generally capital and resource intensive. Besides, investment in the
manufacturing industries requires adequate infrastructure development. Conversely,
government encourages all potential investors to join the sector where at least some of
the basic infrastructures such as power supply, water and communication facilities are
inefficiently developed or are non-existent. In spite of the seemingly increasing
number of investors joining the sector, the manufacturing sector did not grow
according to the government ambitions. The government also acknowledged the
failures in the report released by MoFED in 2014, the assessment results of the annual
economic performances focusing on the manufacturing sectors.
“…, the industrial sector grew faster than both agriculture and
services. …Yet the growth rate registered still falls short of the target
of about 22 percent. ….The narrow base of the industrial sector is a
challenge with significant implication on the country‟s capacity to
generate foreign exchange and create job opportunities for its growing
labor force (MoFED, 2014). …. Therefore, in order to increase the
role of manufacturing industry in the economy and eventually realize
the long-term vision of industrialization and economic transformation,
the growth rate of the manufacturing sector has to be accelerated by
tackling the bottlenecks in the new five years planning period (i.e.
GTP2:2015/16-2019/20) (MoFED, 2014)”.
According to this report, the slow growth of manufacturing industries, posed
considerable limits to the national ambition of boosting foreign exchanges and
creating job opportunities for the huge labor forces in the country. For instance, in the
GTP1, the government planned to create employment opportunities for up to 40,000
laborers in the manufacturing sector; yet the sector only managed to create new jobs
for only 12,490 (31%) in the year before the due date of GTP1. Therefore, the sector
71
needs more work in order to meet the long-term core objective of ―poverty
eradication‖. The government has also failed to meet its target of collecting $60mln
from export earnings in six months but collected $41mln (68%) from the exports of
textile industry products that was supposed to lead all other priority industries
(http://diretu.be/1SE3Ufi, accessed on 08/2/2016).
3.6 The process of land conversion: Consultation, valuation and
compensation
The phenomenon of agricultural land conversion reflects the change in the land use
system and relates closely to the land tenure and policies (Dien, et al, 2010).
Historically, the land conversion process had accompanied the great social
transformation of industrialization and the expansion of metropolis such as the land
expropriation in industrial revolutions in England and other Western countries since
the 19th
century. Although, developed countries have managed to limited pressure on
agricultural lands (Azadi, et al., 2011), some countries in East Asia have been
undergoing rapid agricultural land losses due to economic growth initiated by
industrialization (Tan, 2015; Tran, 2013; Lodder, 2012; Dien , et al, 2010; Nguyen,
2011, 2009).
As there would be no justification to resist industrial development and urbanization,
the transformation of agricultural lands in the urban environs are unavoidable as it is
happening in many parts of the peri-urban areas of developing countries. The decision
of land conversion should be supported with viable study and healthier
implementation tools so that all the aftermath negative outcomes of land conversion
72
on the livelihood of land losers and the quality of local environment should be
addressed properly. Yet, empirical evidences show that the negative outcomes of land
conversion out weigh on the livelihood of the land losers and the quality of local
environment. This is due to the missing of essential components in land use planning
processes aimed at preserving agricultural lands, while giving priority to economic
growth (Leblond, 2008). The Industrial Development Policy of China for instance
gave more attention towards promoting rapid industrial developments, while giving
little regards for the environmental quality in which the entire situations sounds,
―pollute first and clean later‖ (Azadi, et al., 2012).
Based on the nature of land ownership, the processes of land conversion vary from
country to country. Globally, there are two forms of land ownership and control:
government controlled (e.g. Vietnam, Ethiopia) and private ownership (e.g. Thailand,
Brazil and Cameroon) (Dien, et al, 2010). Therefore, the process of land
expropriation, valuation of property and payments of compensation money goes in
line with the type of ownership right of over the land. In Vietnam for instance, the
land is owned by the government and therefore all the decisions were made by the
state while farmers in Thailand could make their own voluntary decision on the
conversion of agricultural lands to non-agricultural uses (Leblond, 2008).
According to Nguyen, et al, (2010), the state in Vietnam is also in charge of allocating
the land for individuals, households, organizations and communities to use the land
for a specified period (20 years) that ends with the offering of compensation. In this
situation, the land losers are disadvantaged in many ways. The amount of
compensation money is decided by the state so that farmers do not have the power to
73
either refuse land conversion or complain the amount of compensation. Under these
circumstances, investors and private land developers are on the advantageous side as
they are most favored by the government (Tan, 2015; Lodder, 2012; Nguyen, et al,
2010). The reason is that the land belongs to the state and these industrial companies
got the permission of the government to carry out their projects under the state
policies.
In Ethiopia too, land is considered as the property of the people and the state where
the government has full control over the land. Article 40 (3) of the constitution of
Ethiopia states that the right to ownership of rural and urban land, as well as of all
natural resources, is exclusively vested in the State and in the peoples of Ethiopia. It
further declares that, ―land is a common property of the Nations, Nationalities and
Peoples of Ethiopia that shall not be subject to sale or to other means of exchange‖.
Unlike it was in Vietnam where the land use right are fixed to 20 years, land owners
have a use right over the land they possess indefinitely. The indefinite use right of
their land by the owners is however, subject to expropriation provided that the land is
needed for public uses or development purposes by the government or private
developers (Proclamation no. 455/2005). According to this proclamation, woreda and
the urban administration hold the power of expropriating landholding, yet, decision on
the expropriation of the land holds could also be made at the federal and regional
government levels. However, one also has to bear in mind that large parts of the lands
in Ethiopia, especially in the rural areas, is used under legal pluralism situations
largely based on informal use rights (Stellmacher 2007; Stellmacher 2013).
74
Another important aspect in the processes of land expropriation is related to taking
measurements on the land size converted and the type of properties on the land. In this
regard, the following is stated in Article 10 (1) of Proclamation no. 455/2005:
“Where the land to be expropriated is located in a rural area, the
property situated thereon shall be valued by a committee of not more
than five experts- having the relevant qualification and to be
designated by the woreda administration.”
One of the biggest questions here is, how far can the respective officials and the
concerned organs involved at all stages of land conversion make sure that the rules
and procedures indicated in this proclamation are adhered to during the processes of
land conversion in the study areas? How should the farmers/landholders react to the
processes of agricultural land conversion in the study areas? All the details are
discussed in sub-section two of Chapter 4.
3.7 Legal and institutional set up to protect the environment in Ethiopia
Industrial wastes can be characterized as solid or liquid based on their physical
character, or as hazardous or non-hazardous based on the toxicity level of the wastes.
Although literature suggests that the majority of industrial waste generated in
developing countries is non-hazardous, hazardous wastes still represents serious
environmental and health threats to these countries (Polprasert and Liyanage, 1996).
More often, industrial wastes in most developing countries are untreated or
insufficiently treated as the business owners intend to avoid the huge costs of
establishing and running waste treatment plants. Therefore, they usually follow the
75
‗end of the pipe‘ strategy while also disposing wastes in unsafe ways such as illegal
dumping, open dumping or discharge to rivers or streams. Additionally, hazardous
and non-hazardous wastes are often not segregated and are mixed together with
domestic waste at disposal sites (Mato and Kaseva, 1999).
Like many other countries in Africa, environmental pollution caused by municipal
and industrial wastes has become a point of concern in cities and small towns that
host certain types of industries. In order to establish a harmonized and symbiotic
relationship between economic growth, environmental protection and the health of the
people, the federal government has given special attention at least in establishing
institutions and legal tools. For instance, the issue of the environment is clearly
documented in the constitution of the country. Article 43 of the constitution stipulates
the right of the people to develop, yet underline the importance of ensuring its
sustainability of development activities. Article 44 of the constitution also states the
environmental rights and the rights of the citizens to live in a clean and healthy
environments and the right to claim appropriate compensation (i.e. monetary or non-
monetary), provided that development induced activities cause damages to human
health, assets, property or eviction from their residence.
The federal government has also crafted comprehensive sectoral and inter-sectoral
environmental policies, institutions that are responsible for the implementation of
those policies and legal framework. The main goals of the Environmental Policy as
stated in the policy document are to improve and enhance the health and quality of
life of all citizens and promote sustainable social and economic development. In order
to establish a system that enables coordination but differentiates responsibilities
76
among environmental protection agencies at federal and regional level the federal
government enacted a proclamation for the establishment of the Environmental
Protection Authority (EPA) through proclamation no. 295/2002.
A critical element in creating a functioning regulatory system is giving a specific
agency (or agencies) the power to regulate. In this respect, the Ethiopian government
has adopted considerable regulatory frameworks to enhance the implementation of
environmental protection from serious degradation and pollutions. Some of the most
important ones are the ―Environmental Impact Assessment Proclamation (Proc. no.
299/2002) and the ―Environmental Pollution Controls Proclamation (Proc. no.
300/2002). In processing environmental management and pollution control, Proc. no.
299/2002 makes Environmental Impact Assessment (EIA) a mandatory legal
prerequisite for the implementation of major development projects, programs and
plans that cause harm to biophysical resources, including human health. Therefore, it
is a proactive tool and a backbone to harmonizing and integrating environmental,
economic, cultural, and social considerations into a decision making process in a
manner that promotes sustainable development. Conversely, the main objective of
proc. no. 300/2002 was to address a way out for the management: storage and
disposal of pollutants in a desired and more preferred manner so as to eliminate them
or when not possible, to mitigate the undesirable effects/consequences of pollutants
on social and healthy economic developments.
77
3.8 Effects of Industrial sprawling on the agricultural lands surrounding
Addis Ababa
Ethiopia is not only the least industrialized but also one of the least urbanized
countries in Africa, with 15,100,075 million (17.4%) out of the projected 86 million
people living in 973 towns and cities until July 2013 (MWUD, 2013). Yet, with an
average rate of 4.1% annual urbanization, the country is experiencing a rapid
urbanization rate higher than 3.2% of the average in Africa (Tolossa, 2008). As the
processes of rapid urbanization and increase in investment led to increased
competition for land ownership and higher prices of lands in urban and sub-urban
settings, an appropriate LUP designed to balance conflicting interests is useful. In this
regard, although the government tried to address land issues by developing LUP of its
kind during the deposed regime, success was not achieved due to failure in translating
it into a detailed and workable land use plan at the local levels (Forum for Social
Studies, 2012).
Under the current government, a watershed based LUP was developed for 12 major
rivers so that regions use it as a base map to prepare LUPs of their own. Furthermore,
the government has made efforts to address rural and urban land administration by
strengthening land administration and the development of LUP at national and
regional levels. The government considered the re-developed land policy and the
establishment of the National Urban Development Policy (NUDP) in March 2005 and
replaced the Federal Urban Planning Institute (FUPI) with the National Urban
Planning Institute (NUPI) in the same year through Proclamation No. 450/2005
(Negarit Gazeta, 2005).
78
In spite of government efforts, however, the process of agricultural land conversion is
taking place at a fast rate in Ethiopia due to the changes in the economic structure in
the country over the last two decades. The changes are apparent in the peripheries of
major urban centers partly due to the processes of rapid urbanization and partly due to
growing demands for investment land in manufacturing and commercial agriculture.
The expansion of cut flowers, for instance, has transformed considerable sizes of
agricultural land in many parts of the country while investment in the manufacturing
sector has initiated an extensive conversion of agricultural lands in the peri-urban
areas of the major urban centers particularly in Oromia Regional State.
Birhanu (2006) study the effects of horizontal expansion of Finfine on the agricultural
lands and the livelihoods of farmers in the periphery before the FZS was formally
established as a zone in order to check the continued expansion. According to their
findings, the continued expansion of Addis derived from population growth, poor
urban land use and development planning led to the incorporation of large tracts of
land owned by farmers. The expansion also resulted in the full integration of areas
such as Bole Kotebe, Bole Bulbula, Makkanisa Labu and Keraniyo Booke in order to
meet land demands for residential expansion by evicting poor farmers (Feyera, 2005).
Oromia Regional State (ORS) has formulated a watershed based General Master Land
Use Plan of the region at the scale of 1:50,000 [www.ffe.ethiopia.org, accessed on
12/9/12]. From this Master Plan, ORS has developed an integrated LUP for Finfine
surrounding Oromia Special Zone that consists of 8 towns and 6 rural woredas in
2011. The main objective of this plan was ―to save the loss of prime agricultural
lands‖ and to assist farmers in the woreda in producing non-cash crops once a year;
79
and in doing so to improve their livelihoods and to develop land use zoning. The
efforts were to remedy accelerated land losses in the peri-urban interfaces of the entire
town within the special zone. In this respect, all the towns in the FSZ: Dukem and
Gelan in particular, have experienced the highest level of land conversion for private
owned scattered warehouses used for industrial purposes and the construction of
IZs/IPs compared to all other towns in the central highlands of Ethiopia since 2004.
Until 2013, more than 840 hectares of prime agricultural lands were converted for
industrial uses, excluding the lands converted for residential expansion and all other
municipal uses in these towns.
3.9 Sustainable livelihood
Livelihood is defined as a set humans inherently develop and implement strategies to
ensure their survival (Scoones, 1998; Tolossa, 2005). Some of these activities involve
securing water, food, fodder, medicine, shelter, clothing and the capacity to acquire
the necessities working either individually or as a group by using endowments to meet
the requirements of the self and his/her household on a sustainable basis with dignity.
A livelihood is only considered sustainable when it is able to deal with and recover
from external factors introduced under the ‗vulnerability context‘ (Tolossa, 2005;
Nguyen, et al., 2010; Lodder, 2012).
A livelihood comprises the capabilities, assets (including both material
and social resources) and activities required for a means of living. A
livelihood is sustainable when it can cope with and recover from stress
and shocks and maintain or enhance its capabilities and assets both
now and in the future, while not under mining the natural resource
base. (Chambers & Conway, 1991)
80
The sustainable livelihood approach gained attention in the late 1980s, at a time when
developmental thinking was heavily influenced by the neo-liberal and dependency
approaches towards poverty and development (Scoones, 2009). The concept has
become important in the study of development debates since it was formally coined
and published by Chambers and Conway in 1991 (Lodder, 2015). At the start of the
concept of livelihood, micro-economic approaches were used to address poverty
issues, as it is largely explained from the point of lack of income and low levels of
Gross National Product (GNP) per capita (Lodder, 2012).
The definition used by the UK's Department of Foreign and International
Development (DFID) is also widely used in the study of SLF, which understands
livelihood in the following manner.
“A livelihood comprises the capabilities, assets (including both
material and social resources), and activities required for a means of
living. A livelihood is sustainable when it can cope with and recover
from stresses and shocks and maintain or enhance its capabilities and
assets both now and in the future, while not undermining the natural
resource base' (Chambers and Conway, 1992)”.
In sustainable livelihood studies, research outputs often came up with four major
ways in which vulnerable household address the problems in the short or long term.
For instance, Carney (1998), Scoones (1998), Ellis (2000a), Tolossa (2005) and
Lodder (2012), had identified four different approaches in which the affected families
respond to household food insecurity caused by natural (climate change) or human
made (unsustainable development) factors. According to these sources, the four
81
commonly observed coping and adaptation strategies are: ‗extensification‘,
‗intensification‘, ‗diversification‟ and ‗migration‘ to other places.
Extensification is the process by which the affected household engages in expanding
his/her farmland size through purchase, lease or sharecropping so that they produce
enough food crops. This is, however, greatly influenced by the socio-economic status
of the farmers and extensification is mostly limited to the well-off households who are
able to pay for farmland. Intensification on the other hand, is another coping or
adaptation strategy option that involves enhancing crop production on the existing
farmlands either by investing in modern agricultural inputs or by utilizing household
labor. Therefore, this seems more accessible to families with more labor force at
home, provided that they are left with plots of farmland to work on. The last but not
least coping and adaptation strategy identified was migration of the entire household
to either escape the cause of the livelihood crisis or to look for employment or job
opportunities elsewhere, so that families at home receive support in the form of
remittances.
Ethiopia has set an ambitious economic development goal of eradicating poverty and
achieving the middle-income status by 2020. In order to achieve that goal, it has
begun to implement far-reaching structural, economic and institutional
transformations since the 2000s. The grand economic development policy is part of
the Agriculture Led Industrial Development (ADLI). According to ADLI, agriculture
remained the backbone of the economy in the past and will remain the lifeline of the
majority of the people and the basis for the intended economic prosperity. Therefore,
agriculture remained the main strategy for all the five-year national development
82
plans since it was crafted by the end of 1999 (MoFED, 2013). Yet, significant
attention has not been given to the conversion or loss of a considerable size of prime
agricultural lands that are highly productive and easily accessible in all three five-year
development plans (SDPRP5, PASDEP
6and GTP
7). On the contrary, the pace at which
agricultural lands are converted for non-agricultural purposes in the FZS in Oromia
and those in the peri-urban areas of major cities and small towns in the country
remains high.
The consequences of land conversions in these areas explained in terms of the
breaking up of social fabrics, ruining the only means of livelihood of farming
households. Macro-economic growth does not necessarily represent, indicate or
guarantee improvement in the living status of the people at micro-
economic/household levels. Therefore, it is important to study the effect the size of
land conversion has on the livelihoods of affected households.
Livelihood capital is the asset base used by the people to construct their livelihood
and their livelihood trajectories. Livelihood capital covers a broader range of the
human aspect that includes five major categories, which, however, hold strong
interrelationships that determine the livelihood status of a household. Livelihood
capitals include natural capital (access to environmental resources), human capital
(access to education, training, skills and quality of health), social capital (access to
social resources), political capital (access to power and ability to influence decision-
5Sustainable Development and Poverty Reduction Program: (2002-2005;
6 Plan for Accelerated and Sustainable Development to End Poverty: 2005/06-2009/10
7 Growth and Transformation Plan: 20010/11-2014/15
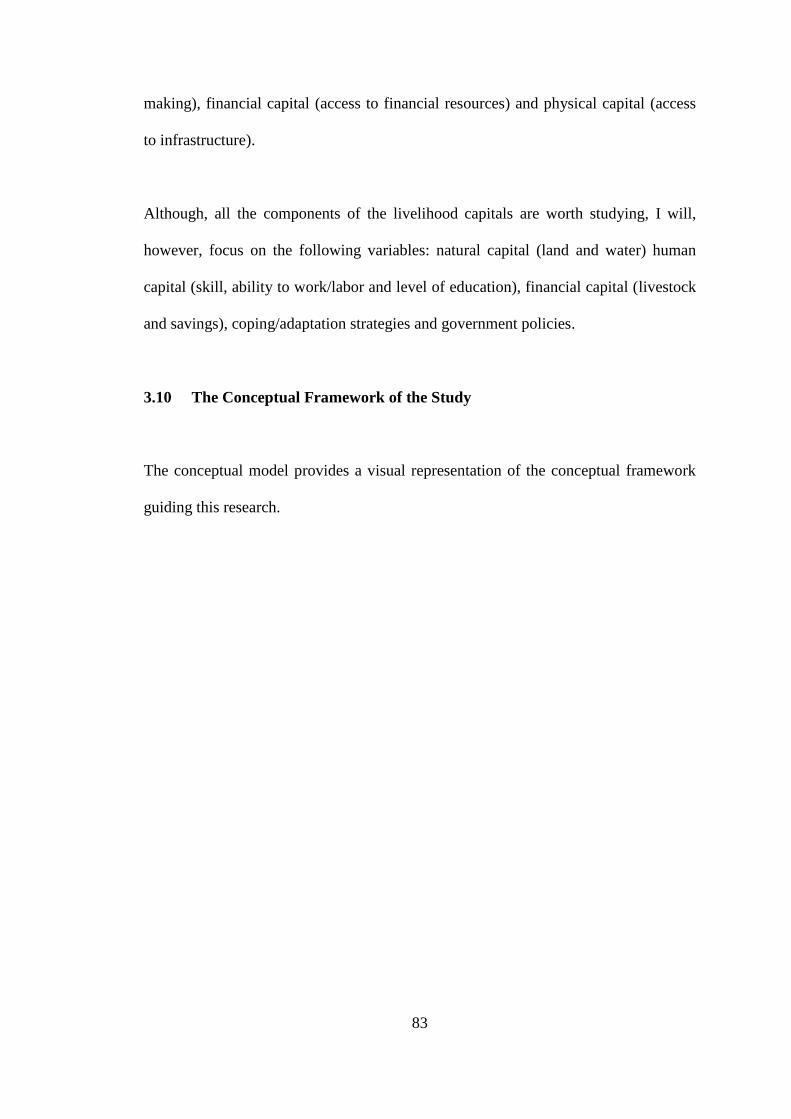
83
making), financial capital (access to financial resources) and physical capital (access
to infrastructure).
Although, all the components of the livelihood capitals are worth studying, I will,
however, focus on the following variables: natural capital (land and water) human
capital (skill, ability to work/labor and level of education), financial capital (livestock
and savings), coping/adaptation strategies and government policies.
3.10 The Conceptual Framework of the Study
The conceptual model provides a visual representation of the conceptual framework
guiding this research.
84
Industrialization
Agricultural land conversion)
Socioeconomic impact
Environmental impact
Effluent
discharge
Human
health
Livestock
health
Reduced production
Reduce farm labor
Agricultural land
loss/reduction
Eviction of farming
households
Increased
unemployment
Reduced farm
income
Reduce HH food
availability
Production decline
Reduced farm
employment
Reduced livelihood capitals
Natural capital
Financial capital
Human capital
Figure 12: Conceptual framework
Source: Own drawing, 2013
85
RESULTS
CHAPTER FOUR: Characteristic of the Sample population and
Eextent of agricultural lands converted into industrial
developments and the effects of these changes on the
livelihoods of affected farmers
3.11 Characteristic of the Sample population
At the early stages of fieldwork planning, 262 heads of households (HHs) were
selected from five kebeles and were included in this study. Altogether, 118 HHs and
144 HHs were selected from two peri-urban kebeles in Gelan and three other kebeles
in Dukem. Of these, about 85% of the informants replied to the whole questions. The
remaining 39 (15%) of the HHs were either refused to sit for the interview or broke
the interviews before completing the questionnaires. Therefore, the views and
experiences used in this study are based on the reflection of 223 informants who share
their reflections and experiences to field data collectors.
3.11.1 Sex and Age of the Informants
About 41 (18.4%) of the informants who returned the questionnaire were female
headed HHs. On the other hand, the sex category of 5 (2.2%) informants was not
indicated at all. Together with this, an attempted was also made to assess the age
distribution of the informants, with the age range categorized based on the concepts of
dependent (under 16 and >64 years of age) and active work forces (i.e. 16-64 years of
86
age). The age range of the majority of the informants fall within the productive age
category (79.4%) and is followed by the elderly (9%).
3.11.2 Household Size
The average household size of the informants in Gelan and Dukem were 4.69 and
6.24 respectively. The average household size of 6.2 for Dukem is higher than the
national and Oromia average of 4.7 and 4.8 (CSA, 2008) respectively. Conversely,
the mean household size of 4.7 for Gelan was below the national and regional
averages. However, the mean household size for Gelan and Dukem combined was
5.5 which were well below the national and Oromia average. On the other hand, the
minimum and maximum family size per household head are quite different; some
informants included extended family, with sizes up to 12 and 14 heads in Gelan and
Dukem respectively.
3.11.3 Religious affiliation of the informants
The compiled data indicates that the majority of the informants were followers of
Orthodox religion at 86.5% (193). Protestants with 17 (7.6%), while 8 (3.6%) and 1
respondent were followers of Waqefata and Islam respectively. Conversely, 4 (1.8%)
of the informants did not specify the religion they were affiliated to.
87
3.11.4 Ethnic group of the informants
Oromo was recorded as the largest ethnic group (84%) that participated in the
household survey followed by Amhara (13%). Only 2 (0.9%) of the informants
belong to the other of ethnic groups in the country. Conversely, 5 (2.2%) of the
informants did not explain their ethnicity in the questionnaire.
3.11.5 Type of housing units of the informants
The compiled result shows that the majority of the informants 157 (71%) lived in a
house constructed from wood and mud walls and a roof covered with thatched grass.
Conversely, slightly more than a quarter of informants, 65 (29%) lived in a house
made from wood and mud wall and a roof covered with corrugated iron sheets.
A look at the study town level indicates that more people live in a house built from
wood and mud wall covered with corrugated iron sheet in Gelan 65 (48.9%),
compared to those who lived in the similar housing units in Dukem. Given the rapid
industrialization and urbanization process going on in these study towns, the housing
units owned by the majority of the informants could be used as an indicator of the low
socioeconomic status of these people.
3.11.6 Marital Status of Informants
The overwhelming majority of the informants (83%) were married. Equally, a
significant number of informants never married at all. Yet, 20 (~10%) of the
informants were widowed, separated or had legally terminated their marriage.
Conversely, the marriage status of 3 (1.3%) of the informants were not explained at
all.
88
3.11.7 Level of formal Education of the Informants
In the face of growing industrialization in and around the study areas, the role of
education and holding skills is important from the point of getting employment in the
non-agricultural sector or to use their skills as an alternative option/means to diversify
sources of income. According to the survey result, 40 (36.7%) in Gelan and 56
(49.1%) in Dukem did not receive formal education. Similarly, only 21 (19.3%) and
22 (19.3%) of the informants attended grades between 5th
and 8th
in Gelan and Dukem
respectively. On the other hand, very few of the informants had had either attended
grades between 11th
-12th
(i.e., preparatory school): 6 (6%) in Gelan and 13 (11.4%)
in Dukem. This shows that, although the study towns are less than 40 km from to
Addis Ababa, the level of education of the informants in general are very low that
likely to make them less competent in the non-farm employment markets. Therefore,
the majority of the informants lack the basic skills that allow them to write, read and
understand information on paper. And do not have any special skills other than
farming that would allow them fit into better paying positions in the highly
competitive labor market in their localities.
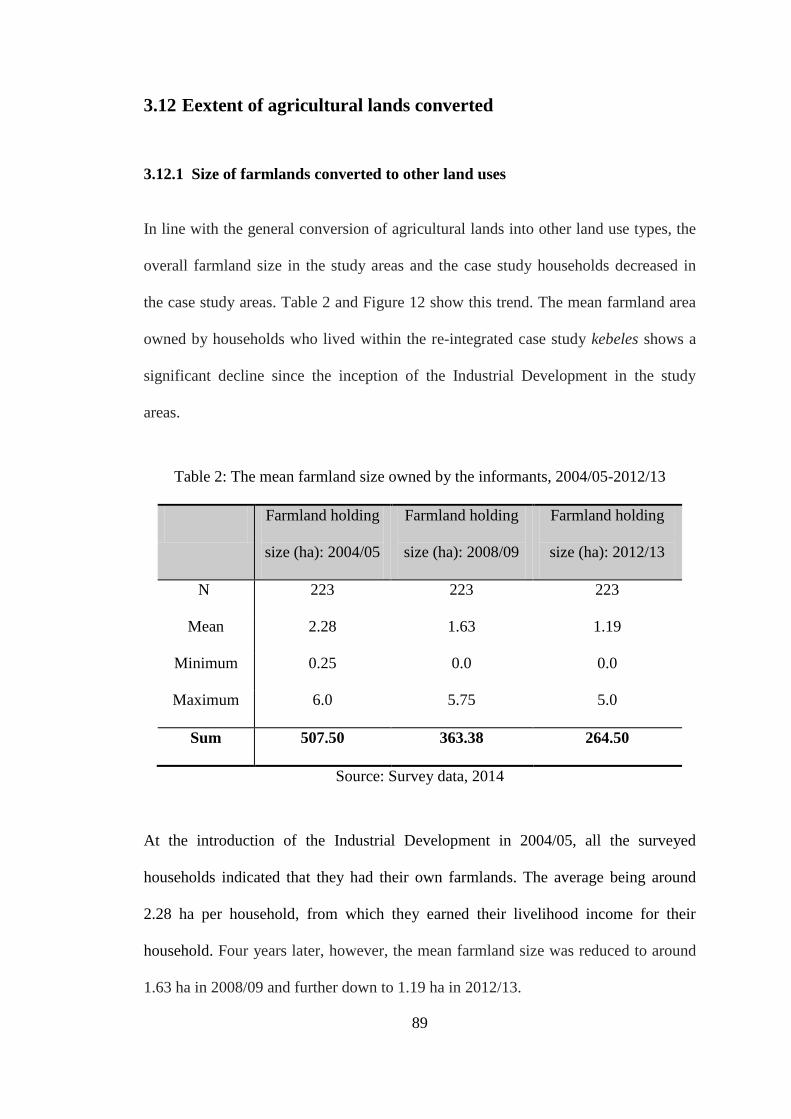
89
3.12 Eextent of agricultural lands converted
3.12.1 Size of farmlands converted to other land uses
In line with the general conversion of agricultural lands into other land use types, the
overall farmland size in the study areas and the case study households decreased in
the case study areas. Table 2 and Figure 12 show this trend. The mean farmland area
owned by households who lived within the re-integrated case study kebeles shows a
significant decline since the inception of the Industrial Development in the study
areas.
Table 2: The mean farmland size owned by the informants, 2004/05-2012/13
Farmland holding
size (ha): 2004/05
Farmland holding
size (ha): 2008/09
Farmland holding
size (ha): 2012/13
N 223 223 223
Mean 2.28 1.63 1.19
Minimum 0.25 0.0 0.0
Maximum 6.0 5.75 5.0
Sum 507.50 363.38 264.50
Source: Survey data, 2014
At the introduction of the Industrial Development in 2004/05, all the surveyed
households indicated that they had their own farmlands. The average being around
2.28 ha per household, from which they earned their livelihood income for their
household. Four years later, however, the mean farmland size was reduced to around
1.63 ha in 2008/09 and further down to 1.19 ha in 2012/13.
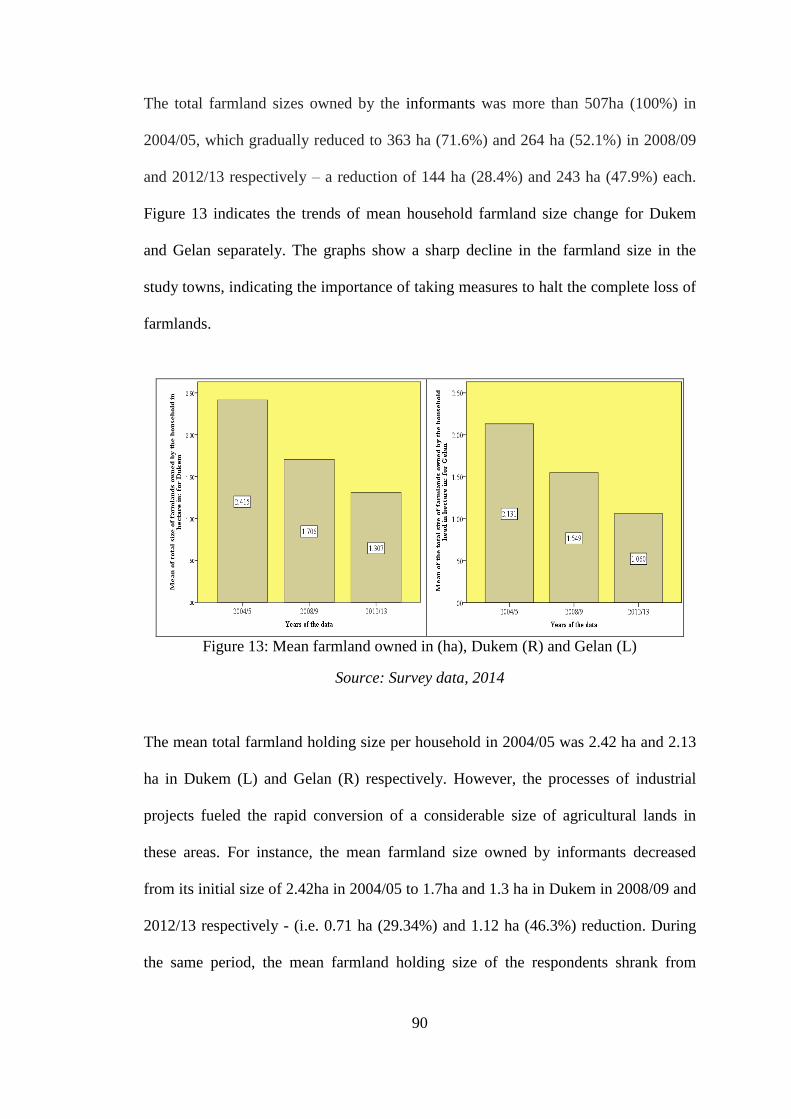
90
The total farmland sizes owned by the informants was more than 507ha (100%) in
2004/05, which gradually reduced to 363 ha (71.6%) and 264 ha (52.1%) in 2008/09
and 2012/13 respectively – a reduction of 144 ha (28.4%) and 243 ha (47.9%) each.
Figure 13 indicates the trends of mean household farmland size change for Dukem
and Gelan separately. The graphs show a sharp decline in the farmland size in the
study towns, indicating the importance of taking measures to halt the complete loss of
farmlands.
Figure 13: Mean farmland owned in (ha), Dukem (R) and Gelan (L)
Source: Survey data, 2014
The mean total farmland holding size per household in 2004/05 was 2.42 ha and 2.13
ha in Dukem (L) and Gelan (R) respectively. However, the processes of industrial
projects fueled the rapid conversion of a considerable size of agricultural lands in
these areas. For instance, the mean farmland size owned by informants decreased
from its initial size of 2.42ha in 2004/05 to 1.7ha and 1.3 ha in Dukem in 2008/09 and
2012/13 respectively - (i.e. 0.71 ha (29.34%) and 1.12 ha (46.3%) reduction. During
the same period, the mean farmland holding size of the respondents shrank from
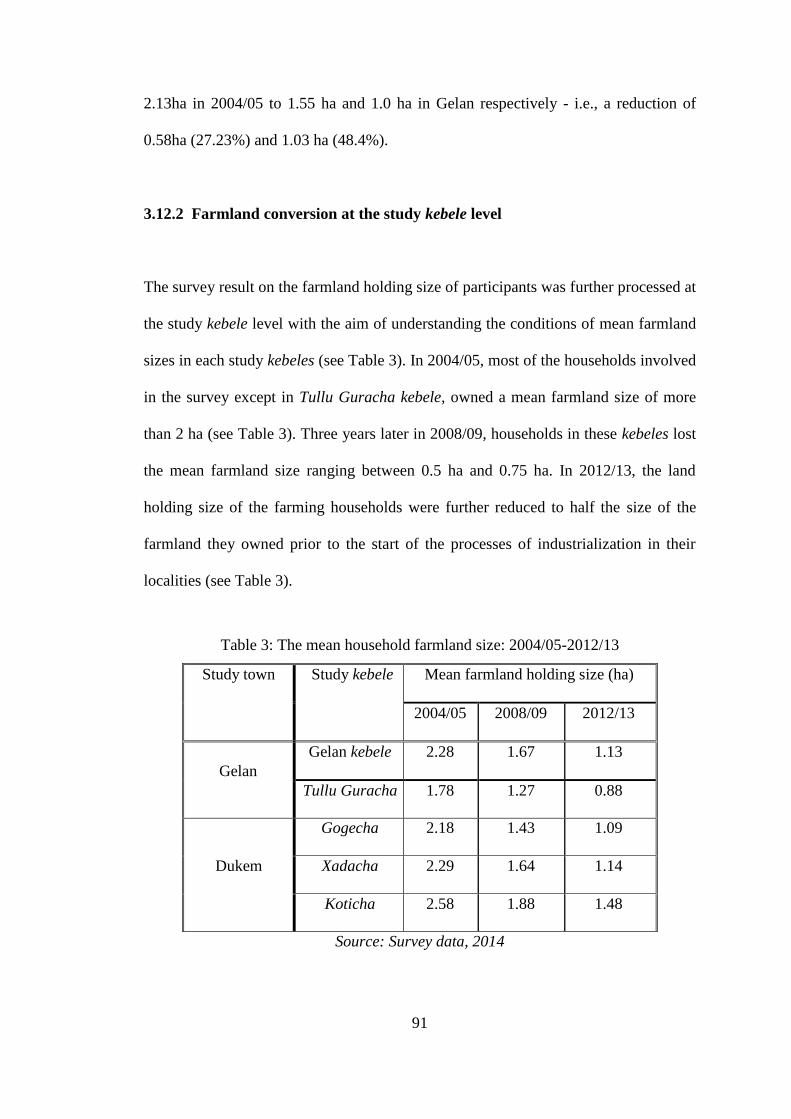
91
2.13ha in 2004/05 to 1.55 ha and 1.0 ha in Gelan respectively - i.e., a reduction of
0.58ha (27.23%) and 1.03 ha (48.4%).
3.12.2 Farmland conversion at the study kebele level
The survey result on the farmland holding size of participants was further processed at
the study kebele level with the aim of understanding the conditions of mean farmland
sizes in each study kebeles (see Table 3). In 2004/05, most of the households involved
in the survey except in Tullu Guracha kebele, owned a mean farmland size of more
than 2 ha (see Table 3). Three years later in 2008/09, households in these kebeles lost
the mean farmland size ranging between 0.5 ha and 0.75 ha. In 2012/13, the land
holding size of the farming households were further reduced to half the size of the
farmland they owned prior to the start of the processes of industrialization in their
localities (see Table 3).
Table 3: The mean household farmland size: 2004/05-2012/13
Study town Study kebele Mean farmland holding size (ha)
2004/05 2008/09 2012/13
Gelan
Gelan kebele 2.28 1.67 1.13
Tullu Guracha 1.78 1.27 0.88
Dukem
Gogecha 2.18 1.43 1.09
Xadacha 2.29 1.64 1.14
Koticha 2.58 1.88 1.48
Source: Survey data, 2014
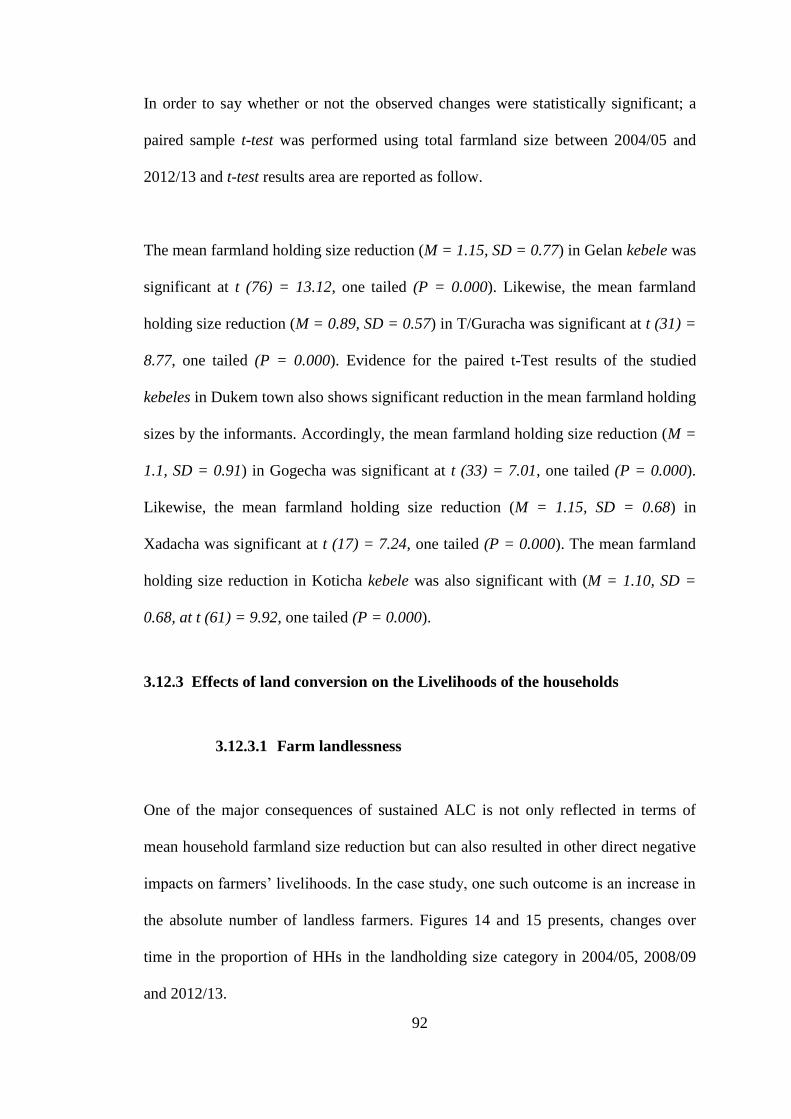
92
In order to say whether or not the observed changes were statistically significant; a
paired sample t-test was performed using total farmland size between 2004/05 and
2012/13 and t-test results area are reported as follow.
The mean farmland holding size reduction (M = 1.15, SD = 0.77) in Gelan kebele was
significant at t (76) = 13.12, one tailed (P = 0.000). Likewise, the mean farmland
holding size reduction (M = 0.89, SD = 0.57) in T/Guracha was significant at t (31) =
8.77, one tailed (P = 0.000). Evidence for the paired t-Test results of the studied
kebeles in Dukem town also shows significant reduction in the mean farmland holding
sizes by the informants. Accordingly, the mean farmland holding size reduction (M =
1.1, SD = 0.91) in Gogecha was significant at t (33) = 7.01, one tailed (P = 0.000).
Likewise, the mean farmland holding size reduction (M = 1.15, SD = 0.68) in
Xadacha was significant at t (17) = 7.24, one tailed (P = 0.000). The mean farmland
holding size reduction in Koticha kebele was also significant with (M = 1.10, SD =
0.68, at t (61) = 9.92, one tailed (P = 0.000).
3.12.3 Effects of land conversion on the Livelihoods of the households
3.12.3.1 Farm landlessness
One of the major consequences of sustained ALC is not only reflected in terms of
mean household farmland size reduction but can also resulted in other direct negative
impacts on farmers‘ livelihoods. In the case study, one such outcome is an increase in
the absolute number of landless farmers. Figures 14 and 15 presents, changes over
time in the proportion of HHs in the landholding size category in 2004/05, 2008/09
and 2012/13.
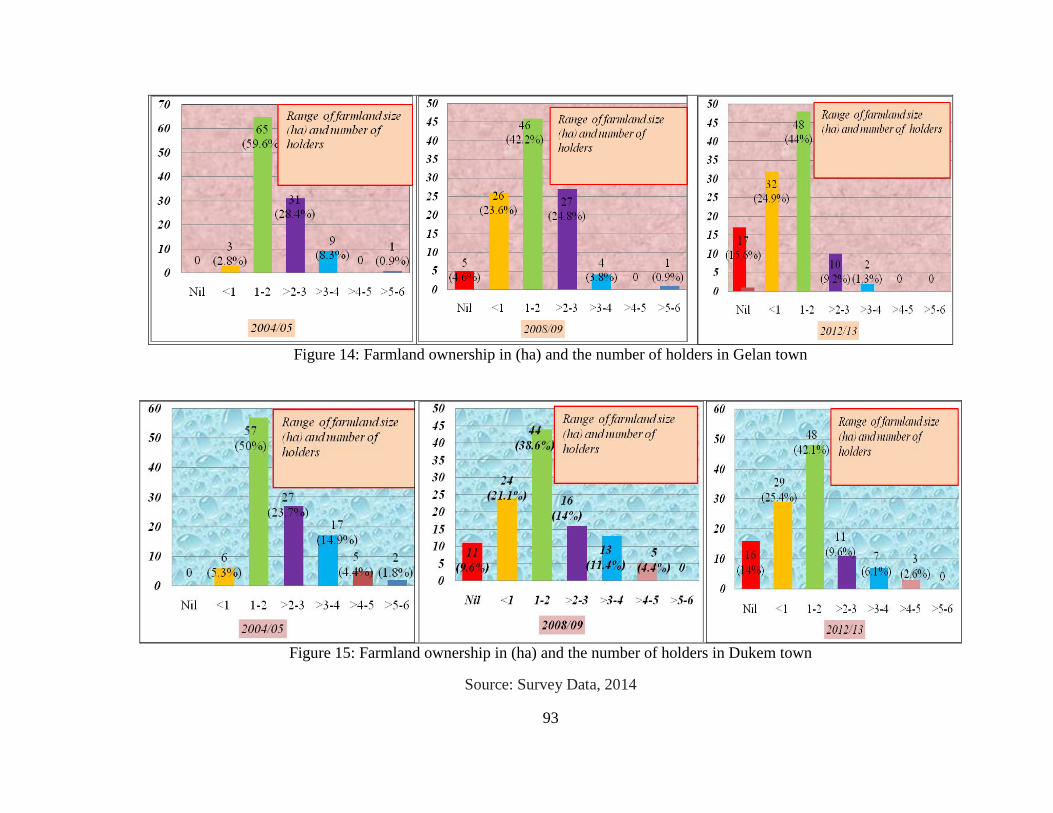
93
Figure 14: Farmland ownership in (ha) and the number of holders in Gelan town
Figure 15: Farmland ownership in (ha) and the number of holders in Dukem town
Source: Survey Data, 2014
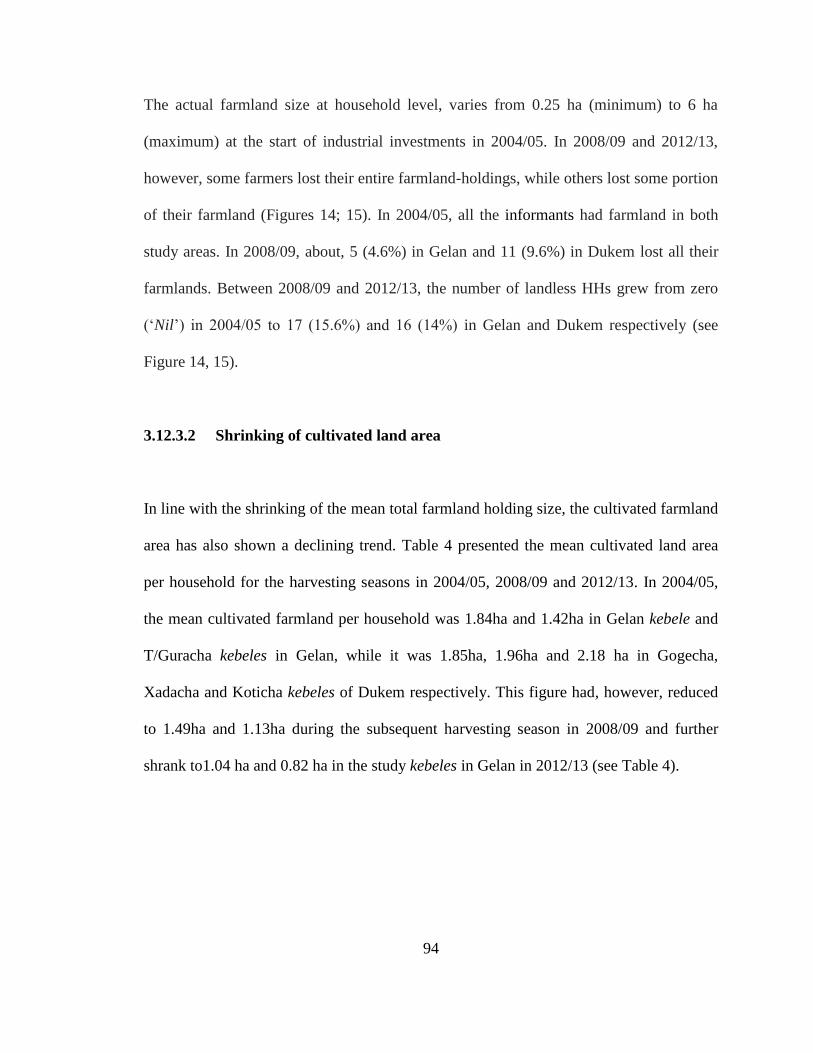
94
The actual farmland size at household level, varies from 0.25 ha (minimum) to 6 ha
(maximum) at the start of industrial investments in 2004/05. In 2008/09 and 2012/13,
however, some farmers lost their entire farmland-holdings, while others lost some portion
of their farmland (Figures 14; 15). In 2004/05, all the informants had farmland in both
study areas. In 2008/09, about, 5 (4.6%) in Gelan and 11 (9.6%) in Dukem lost all their
farmlands. Between 2008/09 and 2012/13, the number of landless HHs grew from zero
(‗Nil‘) in 2004/05 to 17 (15.6%) and 16 (14%) in Gelan and Dukem respectively (see
Figure 14, 15).
3.12.3.2 Shrinking of cultivated land area
In line with the shrinking of the mean total farmland holding size, the cultivated farmland
area has also shown a declining trend. Table 4 presented the mean cultivated land area
per household for the harvesting seasons in 2004/05, 2008/09 and 2012/13. In 2004/05,
the mean cultivated farmland per household was 1.84ha and 1.42ha in Gelan kebele and
T/Guracha kebeles in Gelan, while it was 1.85ha, 1.96ha and 2.18 ha in Gogecha,
Xadacha and Koticha kebeles of Dukem respectively. This figure had, however, reduced
to 1.49ha and 1.13ha during the subsequent harvesting season in 2008/09 and further
shrank to1.04 ha and 0.82 ha in the study kebeles in Gelan in 2012/13 (see Table 4).
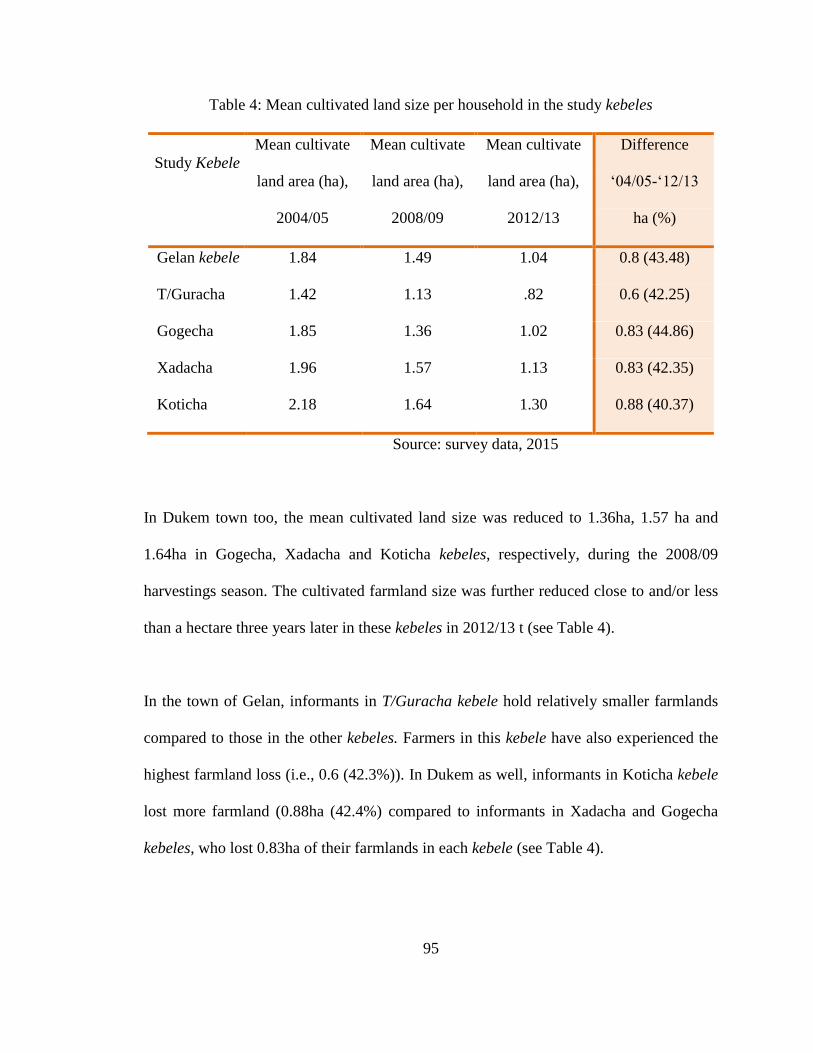
95
Table 4: Mean cultivated land size per household in the study kebeles
Study Kebele
Mean cultivate
land area (ha),
2004/05
Mean cultivate
land area (ha),
2008/09
Mean cultivate
land area (ha),
2012/13
Difference
‗04/05-‗12/13
ha (%)
Gelan kebele 1.84 1.49 1.04 0.8 (43.48)
T/Guracha 1.42 1.13 .82 0.6 (42.25)
Gogecha 1.85 1.36 1.02 0.83 (44.86)
Xadacha 1.96 1.57 1.13 0.83 (42.35)
Koticha 2.18 1.64 1.30 0.88 (40.37)
Source: survey data, 2015
In Dukem town too, the mean cultivated land size was reduced to 1.36ha, 1.57 ha and
1.64ha in Gogecha, Xadacha and Koticha kebeles, respectively, during the 2008/09
harvestings season. The cultivated farmland size was further reduced close to and/or less
than a hectare three years later in these kebeles in 2012/13 t (see Table 4).
In the town of Gelan, informants in T/Guracha kebele hold relatively smaller farmlands
compared to those in the other kebeles. Farmers in this kebele have also experienced the
highest farmland loss (i.e., 0.6 (42.3%)). In Dukem as well, informants in Koticha kebele
lost more farmland (0.88ha (42.4%) compared to informants in Xadacha and Gogecha
kebeles, who lost 0.83ha of their farmlands in each kebele (see Table 4).
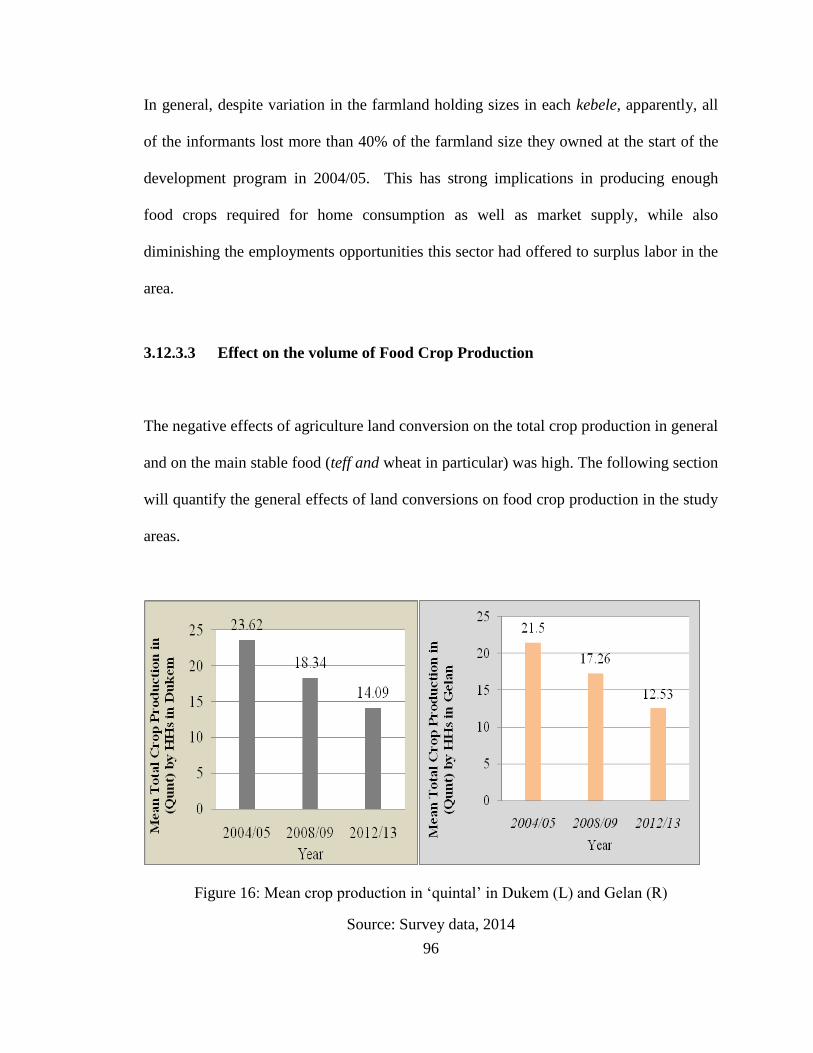
96
In general, despite variation in the farmland holding sizes in each kebele, apparently, all
of the informants lost more than 40% of the farmland size they owned at the start of the
development program in 2004/05. This has strong implications in producing enough
food crops required for home consumption as well as market supply, while also
diminishing the employments opportunities this sector had offered to surplus labor in the
area.
3.12.3.3 Effect on the volume of Food Crop Production
The negative effects of agriculture land conversion on the total crop production in general
and on the main stable food (teff and wheat in particular) was high. The following section
will quantify the general effects of land conversions on food crop production in the study
areas.
Figure 16: Mean crop production in ‗quintal‘ in Dukem (L) and Gelan (R)
Source: Survey data, 2014
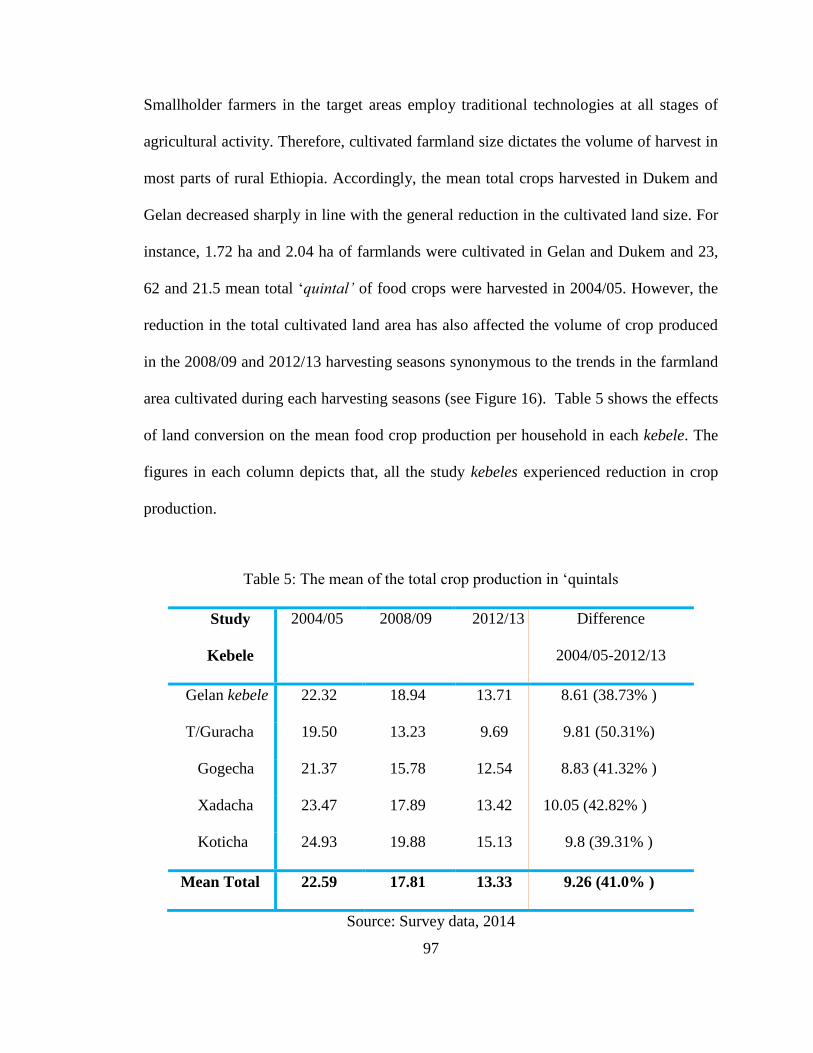
97
Smallholder farmers in the target areas employ traditional technologies at all stages of
agricultural activity. Therefore, cultivated farmland size dictates the volume of harvest in
most parts of rural Ethiopia. Accordingly, the mean total crops harvested in Dukem and
Gelan decreased sharply in line with the general reduction in the cultivated land size. For
instance, 1.72 ha and 2.04 ha of farmlands were cultivated in Gelan and Dukem and 23,
62 and 21.5 mean total ‗quintal‟ of food crops were harvested in 2004/05. However, the
reduction in the total cultivated land area has also affected the volume of crop produced
in the 2008/09 and 2012/13 harvesting seasons synonymous to the trends in the farmland
area cultivated during each harvesting seasons (see Figure 16). Table 5 shows the effects
of land conversion on the mean food crop production per household in each kebele. The
figures in each column depicts that, all the study kebeles experienced reduction in crop
production.
Table 5: The mean of the total crop production in ‗quintals
Study
Kebele
2004/05 2008/09 2012/13 Difference
2004/05-2012/13
Gelan kebele 22.32 18.94 13.71 8.61 (38.73% )
T/Guracha 19.50 13.23 9.69 9.81 (50.31%)
Gogecha 21.37 15.78 12.54 8.83 (41.32% )
Xadacha 23.47 17.89 13.42 10.05 (42.82% )
Koticha 24.93 19.88 15.13 9.8 (39.31% )
Mean Total 22.59 17.81 13.33 9.26 (41.0% )
Source: Survey data, 2014
98
From Table 5, all the households in each kebele were affected by crop production
reduction; T/Guracha and Gogecha kebeles seem to be more affected by the reduction as
shown by the mean total production. In Gelan kebele, crop production declined from
nearly 23 ‗quintals‟ in 2004/05 to less than 14 ‗quintals‟, while the reduction was from
nearly 22 ‗quintals‟ in 2004/05 to 13 ‗quintals‟ in 2012/13 for Gogecha in Dukem.
Likewise, all the other kebeles lost 40% or 1/3rd
of their annual crop production over a
period of less than seven years. In order to see whether or not the reduction in the mean
total crop production discussed under Table 5 is statistically significant, a paired sample
t-test was run using the mean total crop produced in 2004/05 and 2012/13 harvesting
seasons.
In Gelan, reduction in the mean total food crop production (M = 8.62, SD = 9.34) in
Gelan kebele was significant at t (76) =8.09, one tailed (P = 0.000). Likewise, the mean
farmland holding size reduction (M = 9.81, SD = 6.25) in T/Guracha was significant at t
(31) = 8.88, one tailed (P = 0.000). In Dukem town too, the paired t-test results show
significant reduction in the mean total food crop production with (M = 8.82 SD = 8.00)
in Gogecha was significant at t (33) = 6.43, one tailed (P = 0.000). Likewise, the mean
total food crop production in Xadacha kebele with (M = 10.06, SD = 5.41) was
significant at t (17) = 7.89, one tailed (P = 0.000). The mean farmland holding size
reduction in Koticha kebele was also significant with (M = 9.80, SD = 15.07, t (61) =
5.12, one tailed (P = 0.000).
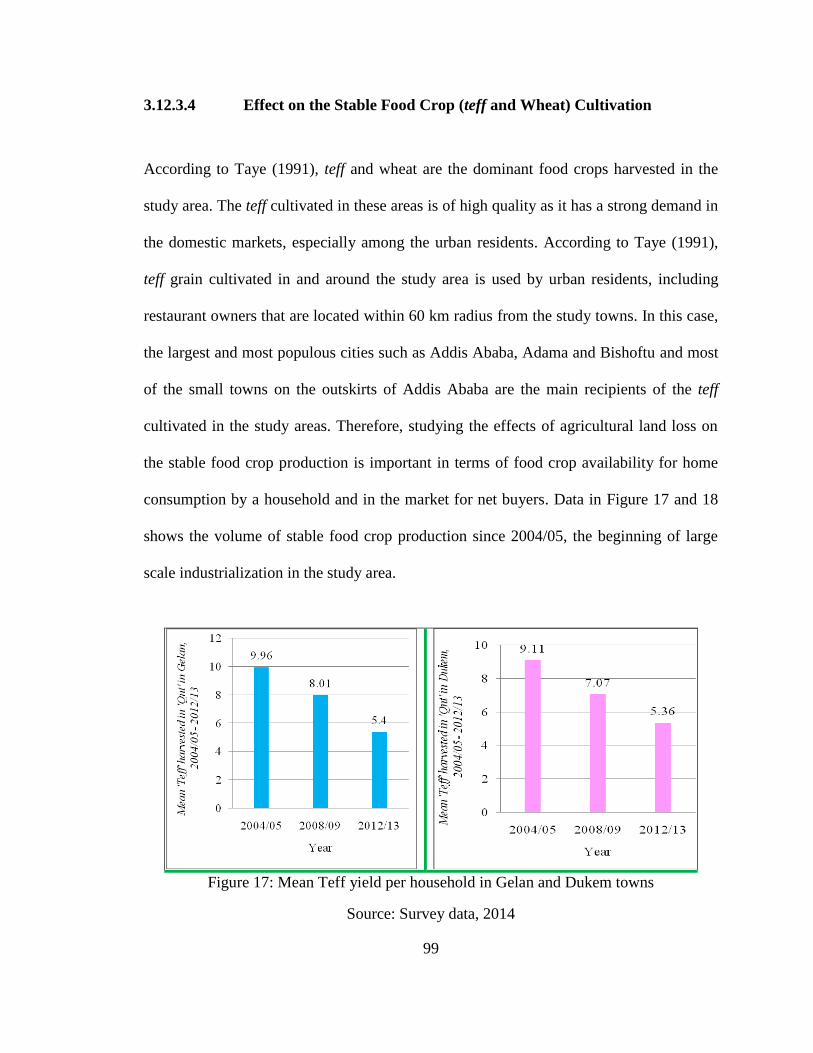
99
3.12.3.4 Effect on the Stable Food Crop (teff and Wheat) Cultivation
According to Taye (1991), teff and wheat are the dominant food crops harvested in the
study area. The teff cultivated in these areas is of high quality as it has a strong demand in
the domestic markets, especially among the urban residents. According to Taye (1991),
teff grain cultivated in and around the study area is used by urban residents, including
restaurant owners that are located within 60 km radius from the study towns. In this case,
the largest and most populous cities such as Addis Ababa, Adama and Bishoftu and most
of the small towns on the outskirts of Addis Ababa are the main recipients of the teff
cultivated in the study areas. Therefore, studying the effects of agricultural land loss on
the stable food crop production is important in terms of food crop availability for home
consumption by a household and in the market for net buyers. Data in Figure 17 and 18
shows the volume of stable food crop production since 2004/05, the beginning of large
scale industrialization in the study area.
Figure 17: Mean Teff yield per household in Gelan and Dukem towns
Source: Survey data, 2014
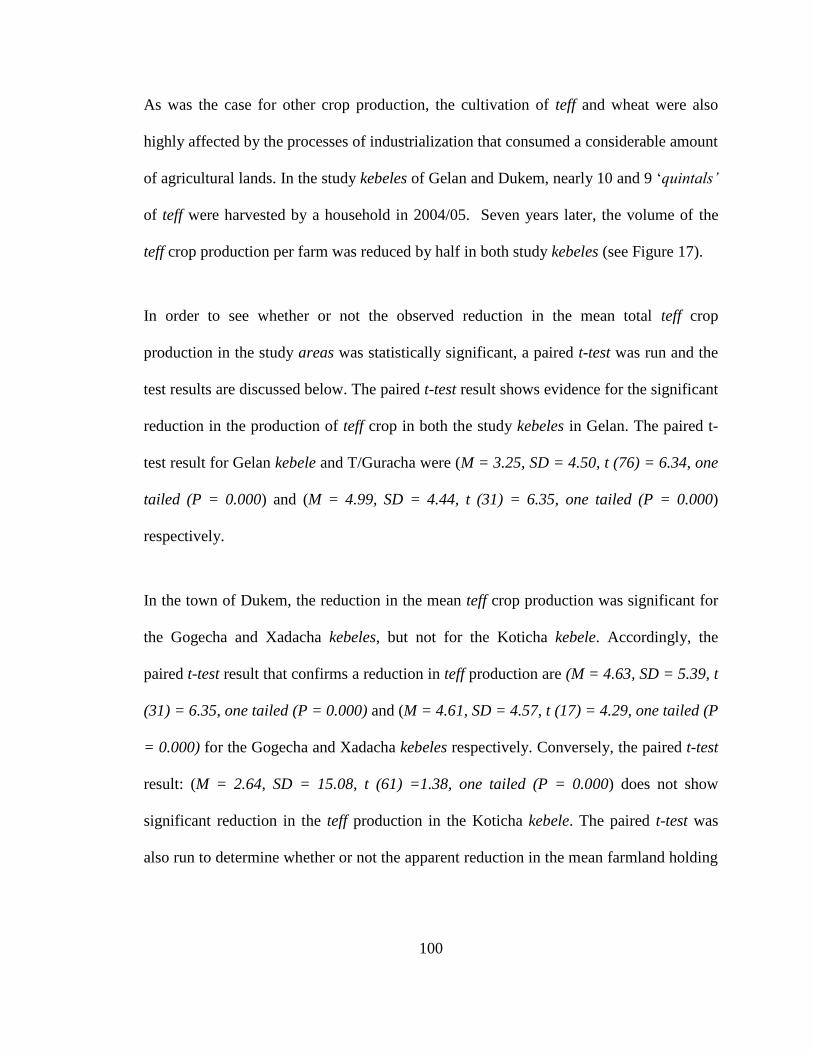
100
As was the case for other crop production, the cultivation of teff and wheat were also
highly affected by the processes of industrialization that consumed a considerable amount
of agricultural lands. In the study kebeles of Gelan and Dukem, nearly 10 and 9 ‗quintals‟
of teff were harvested by a household in 2004/05. Seven years later, the volume of the
teff crop production per farm was reduced by half in both study kebeles (see Figure 17).
In order to see whether or not the observed reduction in the mean total teff crop
production in the study areas was statistically significant, a paired t-test was run and the
test results are discussed below. The paired t-test result shows evidence for the significant
reduction in the production of teff crop in both the study kebeles in Gelan. The paired t-
test result for Gelan kebele and T/Guracha were (M = 3.25, SD = 4.50, t (76) = 6.34, one
tailed (P = 0.000) and (M = 4.99, SD = 4.44, t (31) = 6.35, one tailed (P = 0.000)
respectively.
In the town of Dukem, the reduction in the mean teff crop production was significant for
the Gogecha and Xadacha kebeles, but not for the Koticha kebele. Accordingly, the
paired t-test result that confirms a reduction in teff production are (M = 4.63, SD = 5.39, t
(31) = 6.35, one tailed (P = 0.000) and (M = 4.61, SD = 4.57, t (17) = 4.29, one tailed (P
= 0.000) for the Gogecha and Xadacha kebeles respectively. Conversely, the paired t-test
result: (M = 2.64, SD = 15.08, t (61) =1.38, one tailed (P = 0.000) does not show
significant reduction in the teff production in the Koticha kebele. The paired t-test was
also run to determine whether or not the apparent reduction in the mean farmland holding
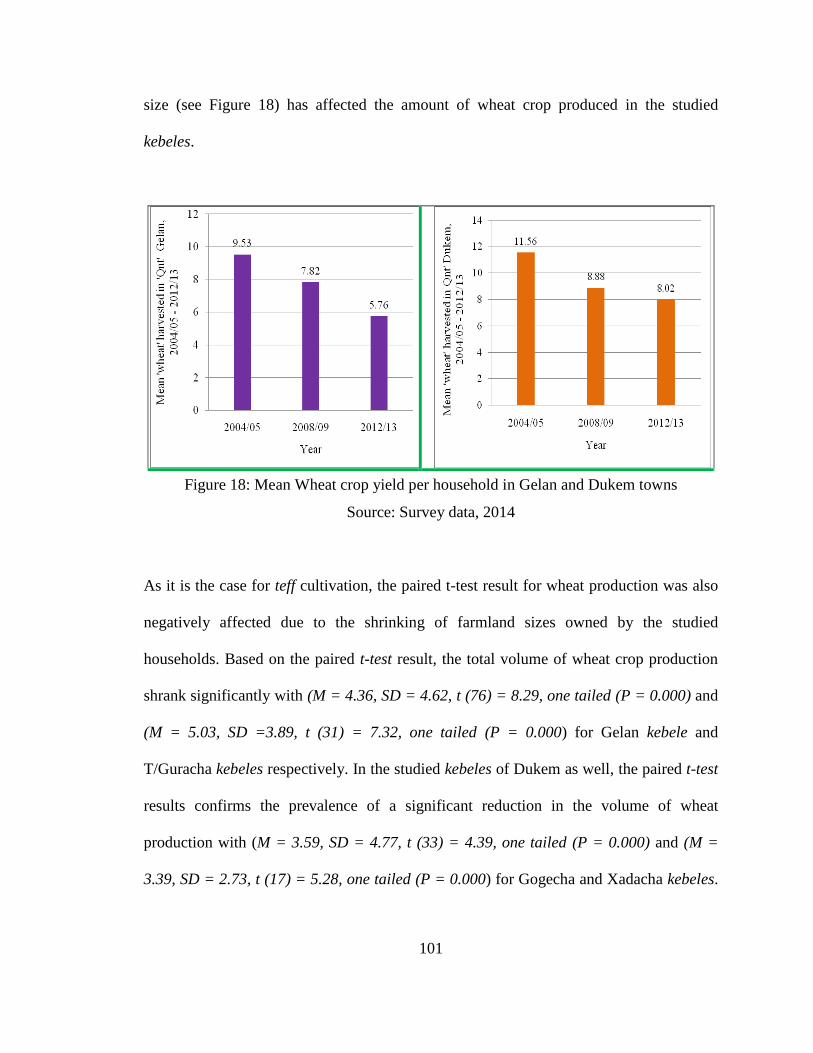
101
size (see Figure 18) has affected the amount of wheat crop produced in the studied
kebeles.
Figure 18: Mean Wheat crop yield per household in Gelan and Dukem towns
Source: Survey data, 2014
As it is the case for teff cultivation, the paired t-test result for wheat production was also
negatively affected due to the shrinking of farmland sizes owned by the studied
households. Based on the paired t-test result, the total volume of wheat crop production
shrank significantly with (M = 4.36, SD = 4.62, t (76) = 8.29, one tailed (P = 0.000) and
(M = 5.03, SD =3.89, t (31) = 7.32, one tailed (P = 0.000) for Gelan kebele and
T/Guracha kebeles respectively. In the studied kebeles of Dukem as well, the paired t-test
results confirms the prevalence of a significant reduction in the volume of wheat
production with (M = 3.59, SD = 4.77, t (33) = 4.39, one tailed (P = 0.000) and (M =
3.39, SD = 2.73, t (17) = 5.28, one tailed (P = 0.000) for Gogecha and Xadacha kebeles.
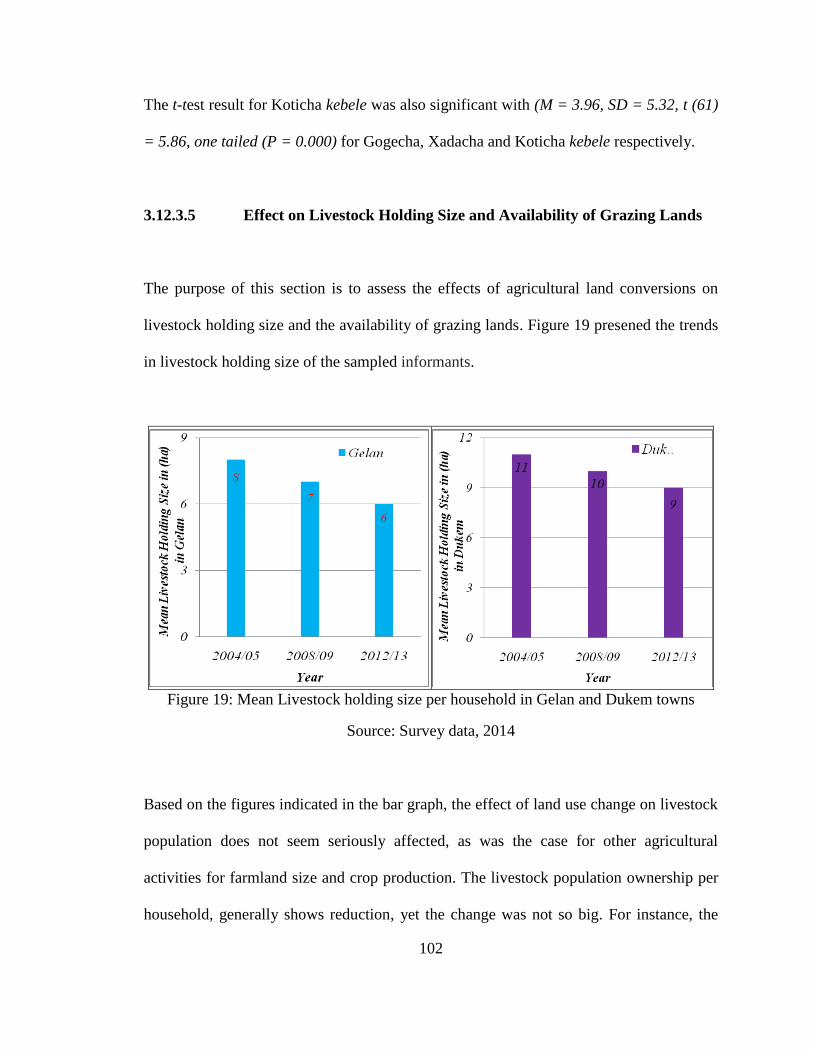
102
The t-test result for Koticha kebele was also significant with (M = 3.96, SD = 5.32, t (61)
= 5.86, one tailed (P = 0.000) for Gogecha, Xadacha and Koticha kebele respectively.
3.12.3.5 Effect on Livestock Holding Size and Availability of Grazing Lands
The purpose of this section is to assess the effects of agricultural land conversions on
livestock holding size and the availability of grazing lands. Figure 19 presened the trends
in livestock holding size of the sampled informants.
Figure 19: Mean Livestock holding size per household in Gelan and Dukem towns
Source: Survey data, 2014
Based on the figures indicated in the bar graph, the effect of land use change on livestock
population does not seem seriously affected, as was the case for other agricultural
activities for farmland size and crop production. The livestock population ownership per
household, generally shows reduction, yet the change was not so big. For instance, the
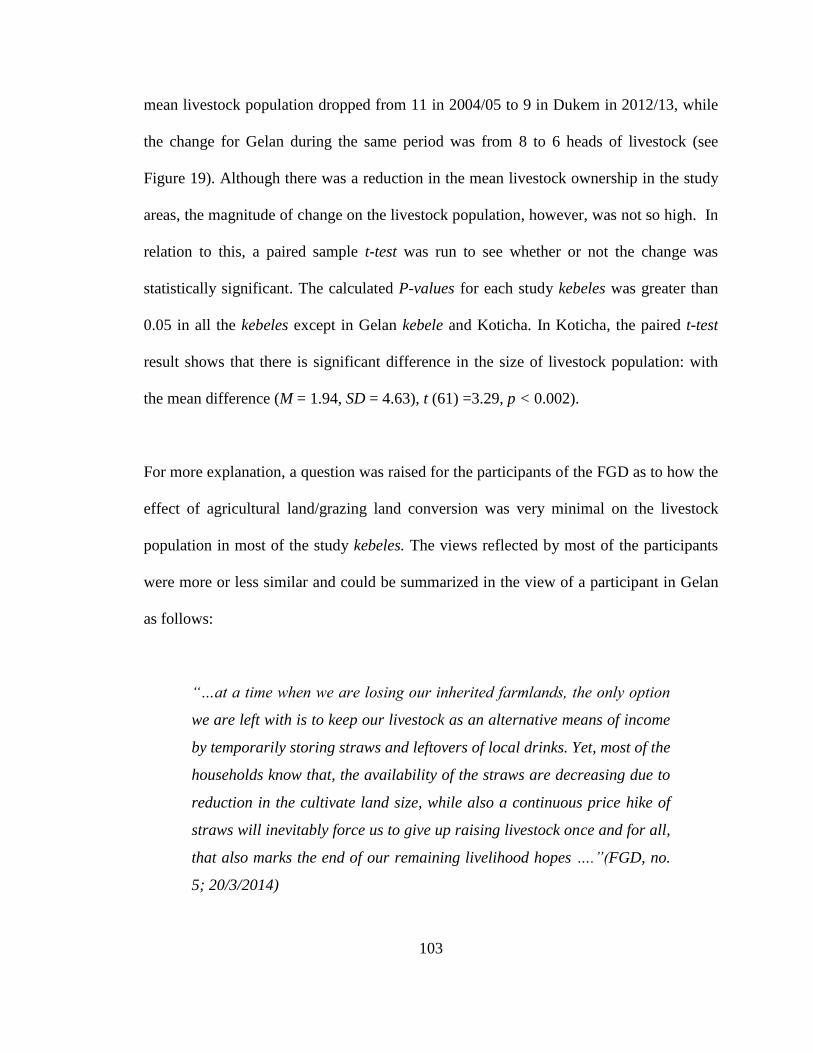
103
mean livestock population dropped from 11 in 2004/05 to 9 in Dukem in 2012/13, while
the change for Gelan during the same period was from 8 to 6 heads of livestock (see
Figure 19). Although there was a reduction in the mean livestock ownership in the study
areas, the magnitude of change on the livestock population, however, was not so high. In
relation to this, a paired sample t-test was run to see whether or not the change was
statistically significant. The calculated P-values for each study kebeles was greater than
0.05 in all the kebeles except in Gelan kebele and Koticha. In Koticha, the paired t-test
result shows that there is significant difference in the size of livestock population: with
the mean difference (M = 1.94, SD = 4.63), t (61) =3.29, p < 0.002).
For more explanation, a question was raised for the participants of the FGD as to how the
effect of agricultural land/grazing land conversion was very minimal on the livestock
population in most of the study kebeles. The views reflected by most of the participants
were more or less similar and could be summarized in the view of a participant in Gelan
as follows:
“…at a time when we are losing our inherited farmlands, the only option
we are left with is to keep our livestock as an alternative means of income
by temporarily storing straws and leftovers of local drinks. Yet, most of the
households know that, the availability of the straws are decreasing due to
reduction in the cultivate land size, while also a continuous price hike of
straws will inevitably force us to give up raising livestock once and for all,
that also marks the end of our remaining livelihood hopes ….”(FGD, no.
5; 20/3/2014)
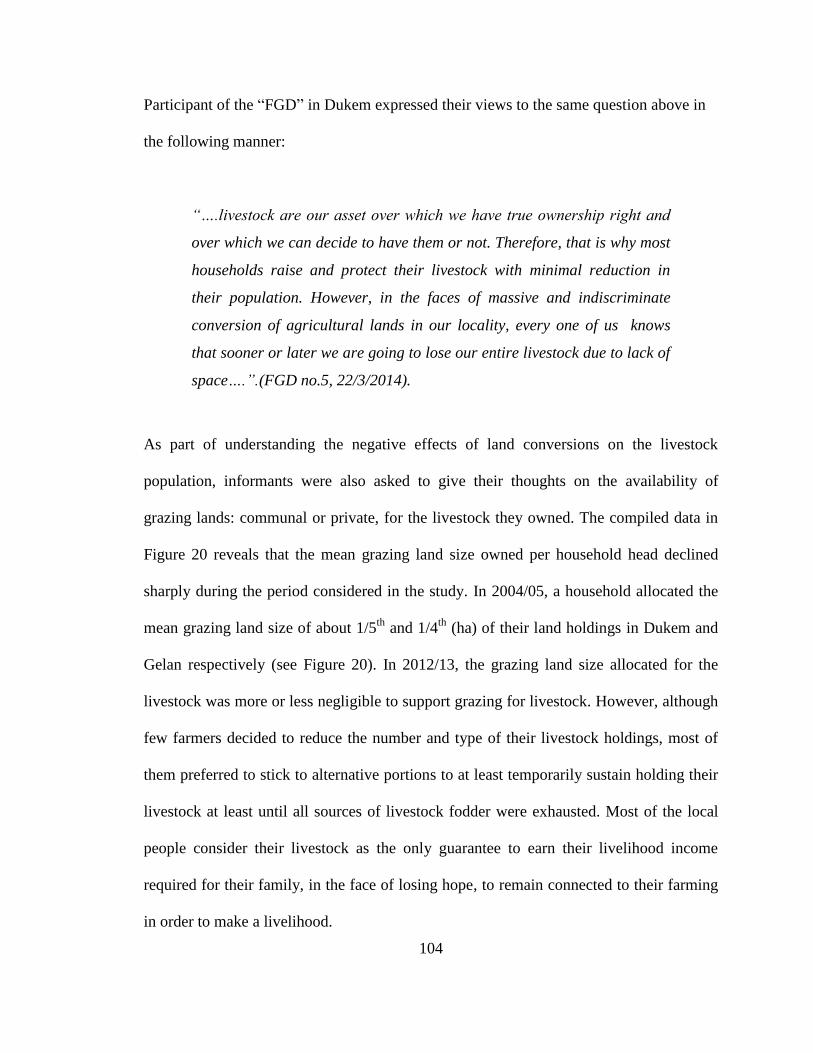
104
Participant of the ―FGD‖ in Dukem expressed their views to the same question above in
the following manner:
“….livestock are our asset over which we have true ownership right and
over which we can decide to have them or not. Therefore, that is why most
households raise and protect their livestock with minimal reduction in
their population. However, in the faces of massive and indiscriminate
conversion of agricultural lands in our locality, every one of us knows
that sooner or later we are going to lose our entire livestock due to lack of
space….”.(FGD no.5, 22/3/2014).
As part of understanding the negative effects of land conversions on the livestock
population, informants were also asked to give their thoughts on the availability of
grazing lands: communal or private, for the livestock they owned. The compiled data in
Figure 20 reveals that the mean grazing land size owned per household head declined
sharply during the period considered in the study. In 2004/05, a household allocated the
mean grazing land size of about 1/5th
and 1/4th
(ha) of their land holdings in Dukem and
Gelan respectively (see Figure 20). In 2012/13, the grazing land size allocated for the
livestock was more or less negligible to support grazing for livestock. However, although
few farmers decided to reduce the number and type of their livestock holdings, most of
them preferred to stick to alternative portions to at least temporarily sustain holding their
livestock at least until all sources of livestock fodder were exhausted. Most of the local
people consider their livestock as the only guarantee to earn their livelihood income
required for their family, in the face of losing hope, to remain connected to their farming
in order to make a livelihood.
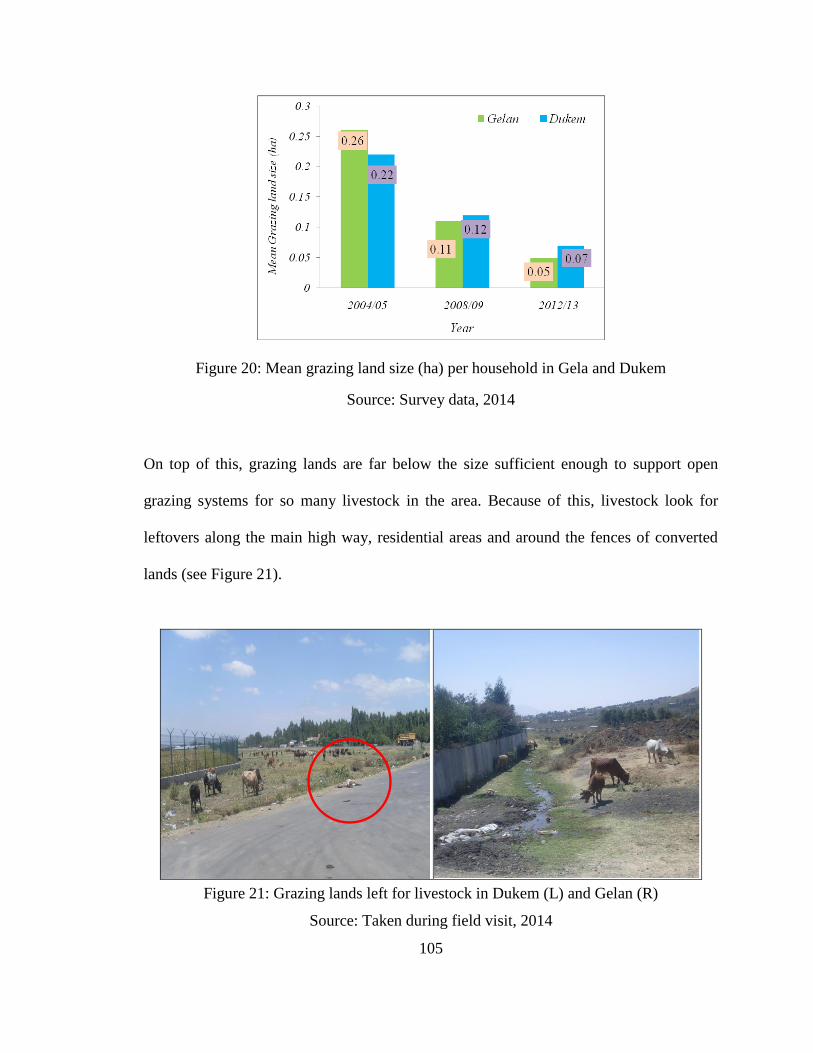
105
Figure 20: Mean grazing land size (ha) per household in Gela and Dukem
Source: Survey data, 2014
On top of this, grazing lands are far below the size sufficient enough to support open
grazing systems for so many livestock in the area. Because of this, livestock look for
leftovers along the main high way, residential areas and around the fences of converted
lands (see Figure 21).
Figure 21: Grazing lands left for livestock in Dukem (L) and Gelan (R)
Source: Taken during field visit, 2014
106
In such grazing systems, livestock often faces the risk of contracting health problems due
to unsafe discharge of industrial effluents or of being hit by a vehicle as shown in Figure
21, where a dead donkey hit by a vehicle was seen lying on the asphalt road in Dukem.
3.12.3.6 Production of sufficient food crops for home consumption
According to the survey result, only 37 (16.6%) replied that they were producing enough
food crops to feed their family all year long. In Gelan, only 15 (20%) in Gelan and 8
(25%) in T/Guracha kebeles were able to produce enough food for their families, while
others reported seasonal variation depending on the condition of the crop harvested.
Conversely, 123 (55.2%) of the total informants could not produce enough food crop to
feed their families for 12 months (i.e. until the next harvesting season comes). The
proportion of households who produce less than what is required for a year were higher
in Dukem kebeles compared to those in Gelan town (see Table 6). The majority of
informants in Xadacha (17 (94.4%)) produced small amount of food crops, which are
insufficient to cover yearlong food requirements for home use in households in Koticha
and Gogecha kebeles (see Table 6).
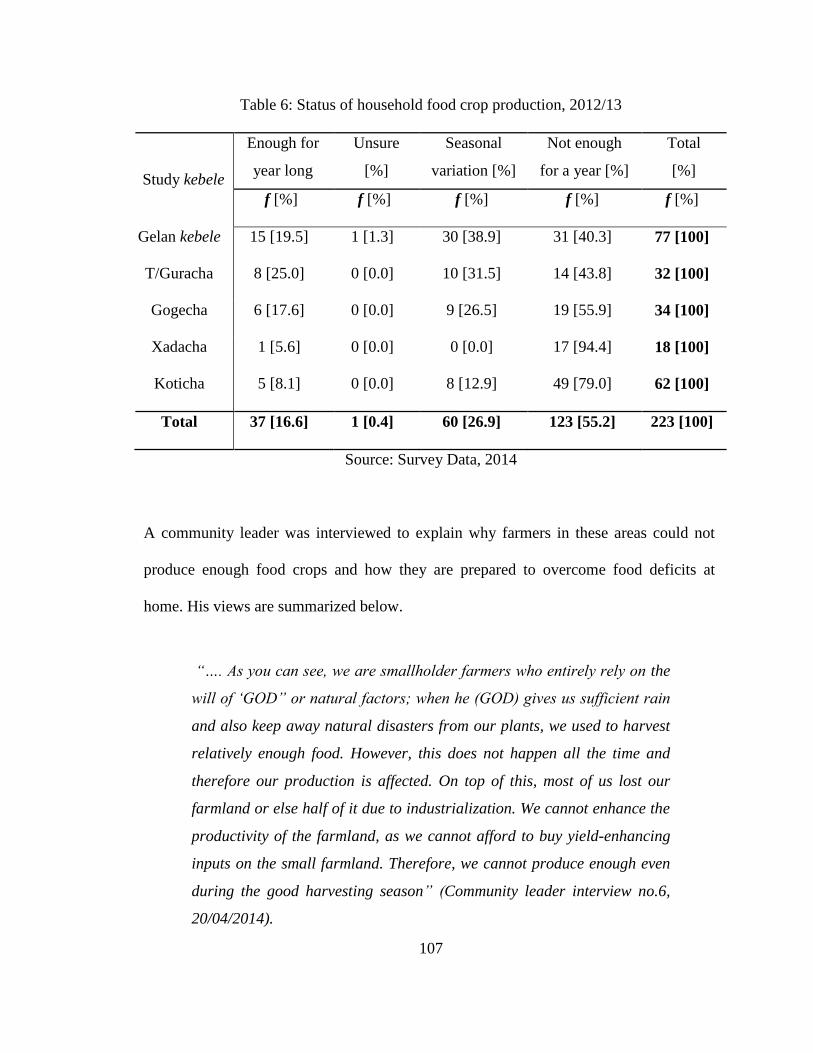
107
Table 6: Status of household food crop production, 2012/13
Study kebele
Enough for
year long
Unsure
[%]
Seasonal
variation [%]
Not enough
for a year [%]
Total
[%]
f [%] f [%] f [%] f [%] f [%]
Gelan kebele 15 [19.5] 1 [1.3] 30 [38.9] 31 [40.3] 77 [100]
T/Guracha 8 [25.0] 0 [0.0] 10 [31.5] 14 [43.8] 32 [100]
Gogecha 6 [17.6] 0 [0.0] 9 [26.5] 19 [55.9] 34 [100]
Xadacha 1 [5.6] 0 [0.0] 0 [0.0] 17 [94.4] 18 [100]
Koticha 5 [8.1] 0 [0.0] 8 [12.9] 49 [79.0] 62 [100]
Total 37 [16.6] 1 [0.4] 60 [26.9] 123 [55.2] 223 [100]
Source: Survey Data, 2014
A community leader was interviewed to explain why farmers in these areas could not
produce enough food crops and how they are prepared to overcome food deficits at
home. His views are summarized below.
“…. As you can see, we are smallholder farmers who entirely rely on the
will of „GOD” or natural factors; when he (GOD) gives us sufficient rain
and also keep away natural disasters from our plants, we used to harvest
relatively enough food. However, this does not happen all the time and
therefore our production is affected. On top of this, most of us lost our
farmland or else half of it due to industrialization. We cannot enhance the
productivity of the farmland, as we cannot afford to buy yield-enhancing
inputs on the small farmland. Therefore, we cannot produce enough even
during the good harvesting season” (Community leader interview no.6,
20/04/2014).
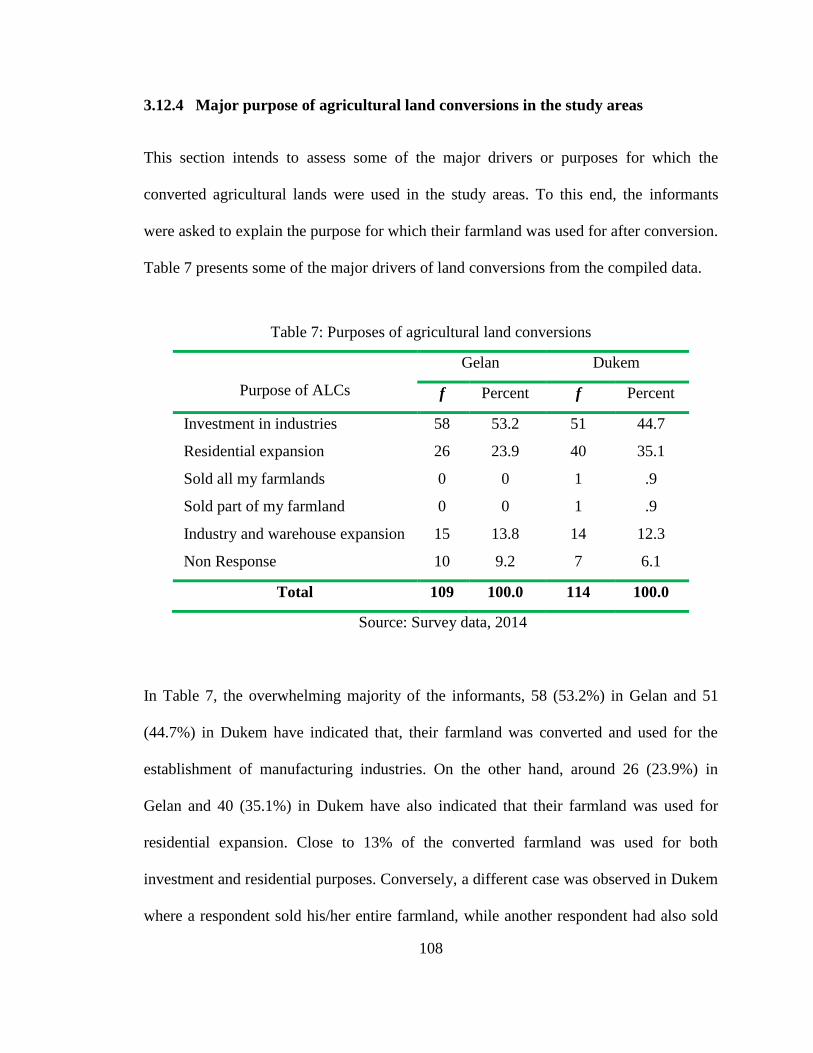
108
3.12.4 Major purpose of agricultural land conversions in the study areas
This section intends to assess some of the major drivers or purposes for which the
converted agricultural lands were used in the study areas. To this end, the informants
were asked to explain the purpose for which their farmland was used for after conversion.
Table 7 presents some of the major drivers of land conversions from the compiled data.
Table 7: Purposes of agricultural land conversions
Purpose of ALCs
Gelan Dukem
f Percent f Percent
Investment in industries 58 53.2 51 44.7
Residential expansion 26 23.9 40 35.1
Sold all my farmlands 0 0 1 .9
Sold part of my farmland 0 0 1 .9
Industry and warehouse expansion 15 13.8 14 12.3
Non Response 10 9.2 7 6.1
Total 109 100.0 114 100.0
Source: Survey data, 2014
In Table 7, the overwhelming majority of the informants, 58 (53.2%) in Gelan and 51
(44.7%) in Dukem have indicated that, their farmland was converted and used for the
establishment of manufacturing industries. On the other hand, around 26 (23.9%) in
Gelan and 40 (35.1%) in Dukem have also indicated that their farmland was used for
residential expansion. Close to 13% of the converted farmland was used for both
investment and residential purposes. Conversely, a different case was observed in Dukem
where a respondent sold his/her entire farmland, while another respondent had also sold
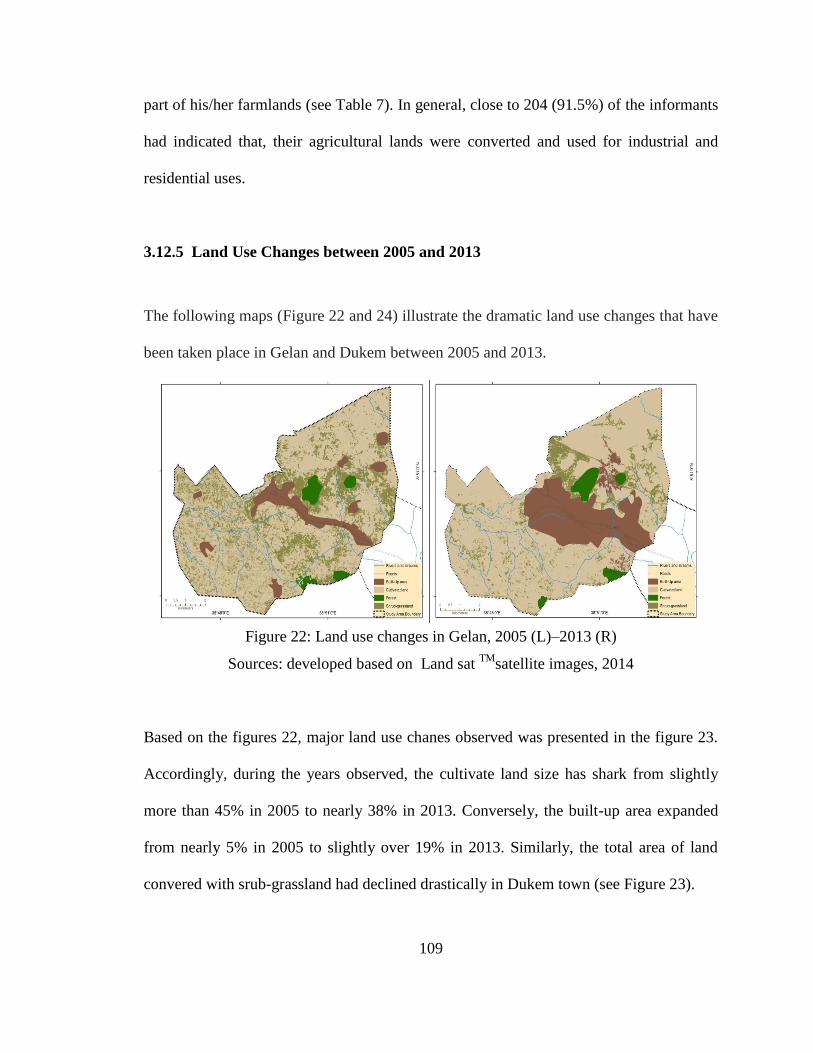
109
part of his/her farmlands (see Table 7). In general, close to 204 (91.5%) of the informants
had indicated that, their agricultural lands were converted and used for industrial and
residential uses.
3.12.5 Land Use Changes between 2005 and 2013
The following maps (Figure 22 and 24) illustrate the dramatic land use changes that have
been taken place in Gelan and Dukem between 2005 and 2013.
Figure 22: Land use changes in Gelan, 2005 (L)–2013 (R)
Sources: developed based on Land sat TM
satellite images, 2014
Based on the figures 22, major land use chanes observed was presented in the figure 23.
Accordingly, during the years observed, the cultivate land size has shark from slightly
more than 45% in 2005 to nearly 38% in 2013. Conversely, the built-up area expanded
from nearly 5% in 2005 to slightly over 19% in 2013. Similarly, the total area of land
convered with srub-grassland had declined drastically in Dukem town (see Figure 23).
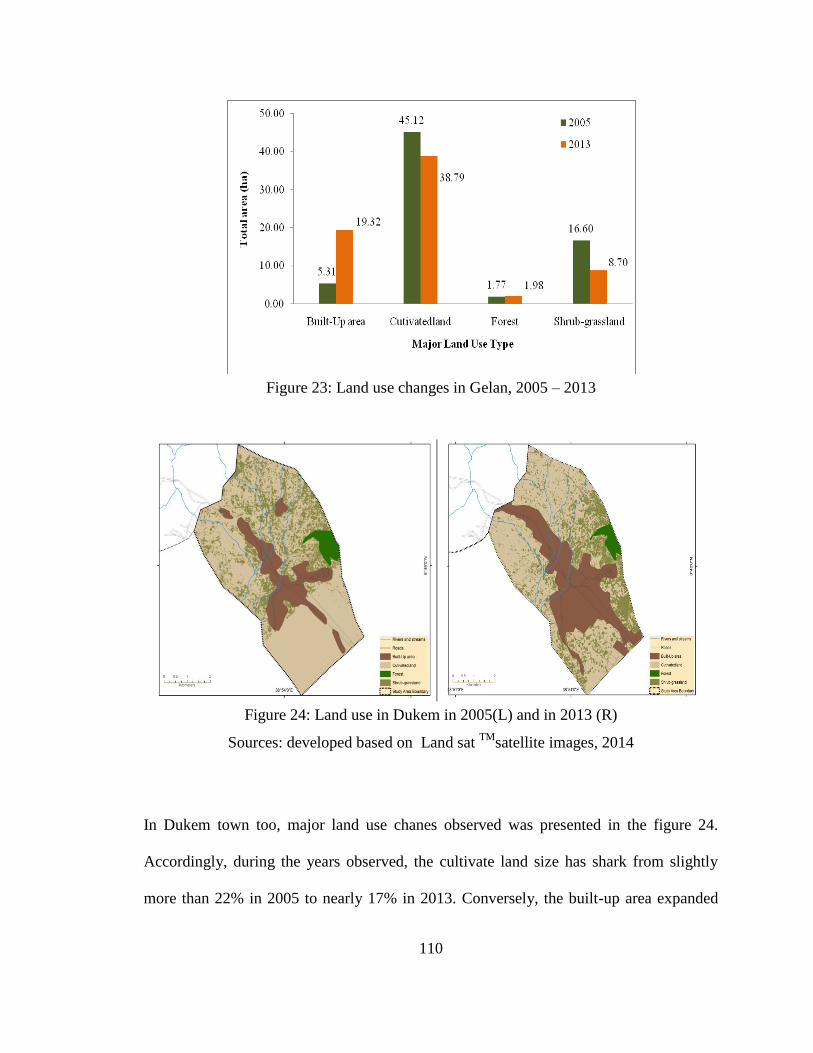
110
Figure 23: Land use changes in Gelan, 2005 – 2013
Figure 24: Land use in Dukem in 2005(L) and in 2013 (R)
Sources: developed based on Land sat TM
satellite images, 2014
In Dukem town too, major land use chanes observed was presented in the figure 24.
Accordingly, during the years observed, the cultivate land size has shark from slightly
more than 22% in 2005 to nearly 17% in 2013. Conversely, the built-up area expanded
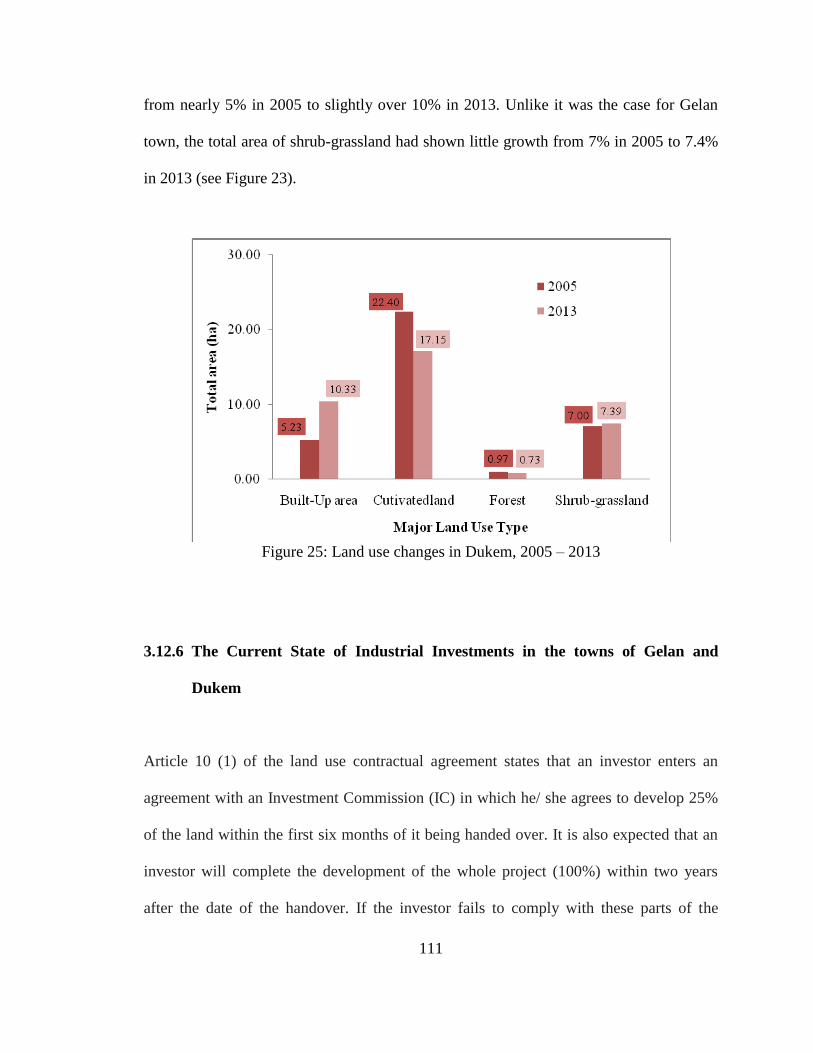
111
from nearly 5% in 2005 to slightly over 10% in 2013. Unlike it was the case for Gelan
town, the total area of shrub-grassland had shown little growth from 7% in 2005 to 7.4%
in 2013 (see Figure 23).
Figure 25: Land use changes in Dukem, 2005 – 2013
3.12.6 The Current State of Industrial Investments in the towns of Gelan and
Dukem
Article 10 (1) of the land use contractual agreement states that an investor enters an
agreement with an Investment Commission (IC) in which he/ she agrees to develop 25%
of the land within the first six months of it being handed over. It is also expected that an
investor will complete the development of the whole project (100%) within two years
after the date of the handover. If the investor fails to comply with these parts of the
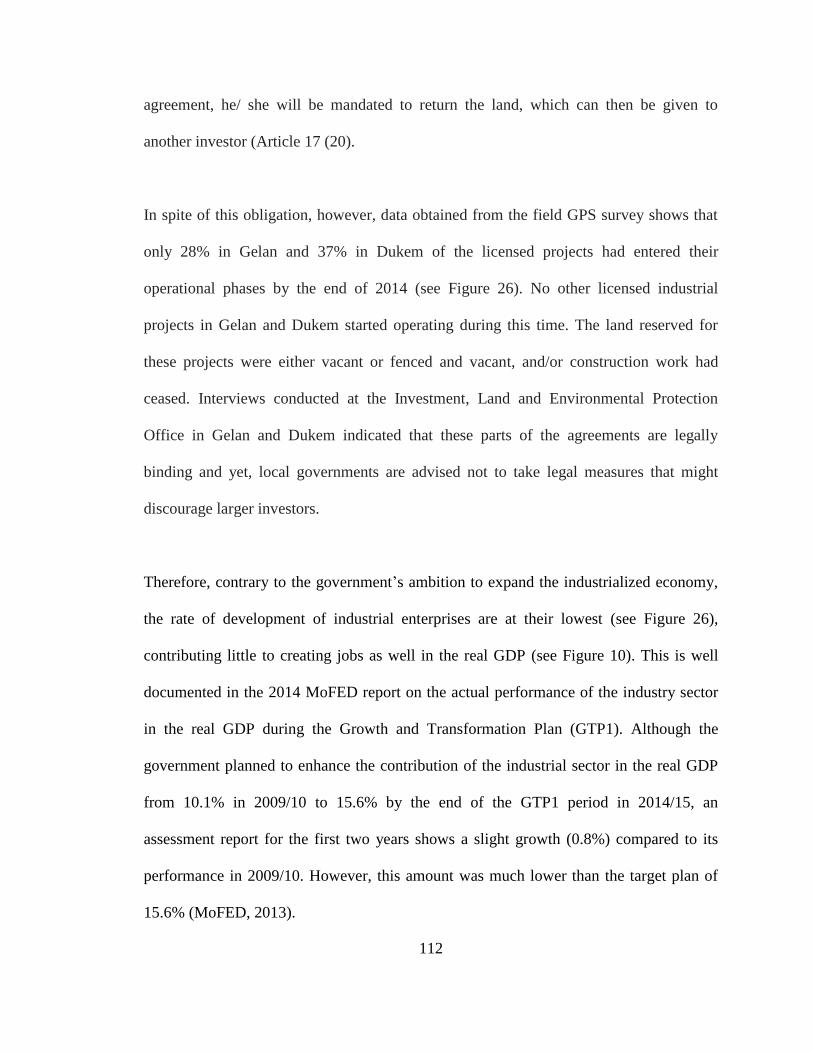
112
agreement, he/ she will be mandated to return the land, which can then be given to
another investor (Article 17 (20).
In spite of this obligation, however, data obtained from the field GPS survey shows that
only 28% in Gelan and 37% in Dukem of the licensed projects had entered their
operational phases by the end of 2014 (see Figure 26). No other licensed industrial
projects in Gelan and Dukem started operating during this time. The land reserved for
these projects were either vacant or fenced and vacant, and/or construction work had
ceased. Interviews conducted at the Investment, Land and Environmental Protection
Office in Gelan and Dukem indicated that these parts of the agreements are legally
binding and yet, local governments are advised not to take legal measures that might
discourage larger investors.
Therefore, contrary to the government‘s ambition to expand the industrialized economy,
the rate of development of industrial enterprises are at their lowest (see Figure 26),
contributing little to creating jobs as well in the real GDP (see Figure 10). This is well
documented in the 2014 MoFED report on the actual performance of the industry sector
in the real GDP during the Growth and Transformation Plan (GTP1). Although the
government planned to enhance the contribution of the industrial sector in the real GDP
from 10.1% in 2009/10 to 15.6% by the end of the GTP1 period in 2014/15, an
assessment report for the first two years shows a slight growth (0.8%) compared to its
performance in 2009/10. However, this amount was much lower than the target plan of
15.6% (MoFED, 2013).

113
Figure 26 shows the location map and the status of most of the manufacturing industrial
establishments registered in the study areas in two categories (operating and non-
operating), for which data was collected in the town of Dukem.
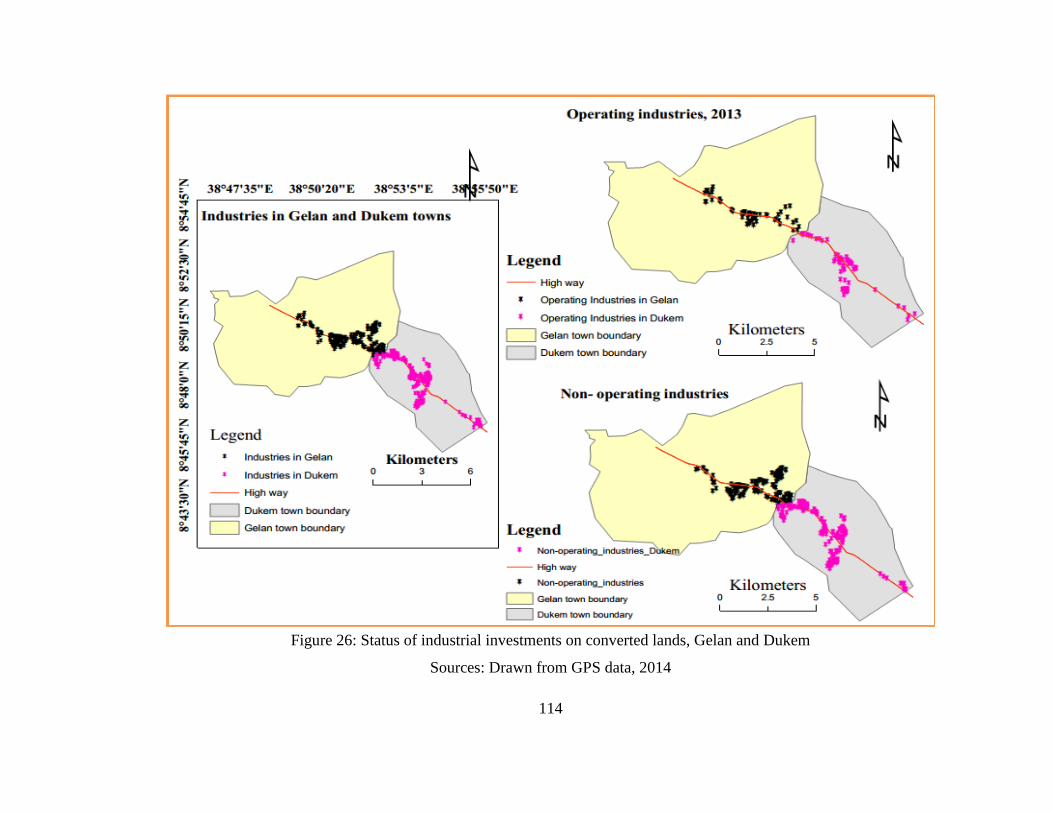
114
Figure 26: Status of industrial investments on converted lands, Gelan and Dukem
Sources: Drawn from GPS data, 2014
115
4 CHAPTER FIVE: The processes and procedures involved in
agricultural land expropriation and the perception of the farming
households towards the amounts of compensation money
4.1.1 Introduction
Land conversion is widely defined as a process characterized by the transference of land
from one type of use to another. In this case, conversion involves transforming
agricultural land to industrial and the accompanied urban uses. Land conversion is a
global phenomenon that cannot be avoided. The process of land conversion is widely
implemented in countries that are undergoing rapid economic development and
population growth (Azadi and Hasfiati, 2011) and, at times, when governments plan to
achieve certain socio-economic goals (Nguyen et al., 2013). According to World Bank
(2011), nearly 1 million hectares of farmland was converted to non-agricultural uses
between 2001 and 2010. This chapter assesses the procedures involved in the valuation
and determination of compensation for the affected households and the perceptions of
affected households‘ towards the entire process and the outcome of land conversion
during the course of action.
4.1.2 Trend in the farmland holding size since the introduction of industrialization
In order to get relevant information about the study areas, local informants were asked to
indicate their thoughts on what has happened to their farmland size since the inception of
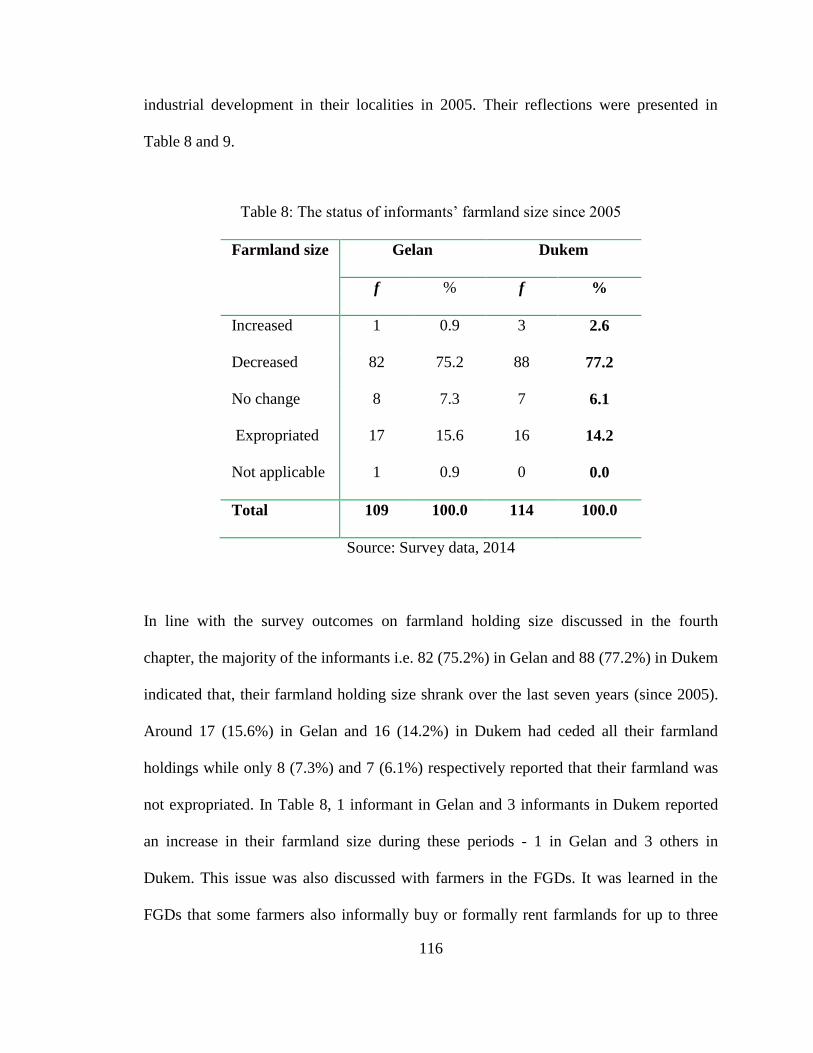
116
industrial development in their localities in 2005. Their reflections were presented in
Table 8 and 9.
Table 8: The status of informants‘ farmland size since 2005
Farmland size Gelan Dukem
f % f %
Increased 1 0.9 3 2.6
Decreased 82 75.2 88 77.2
No change 8 7.3 7 6.1
Expropriated 17 15.6 16 14.2
Not applicable 1 0.9 0 0.0
Total 109 100.0 114 100.0
Source: Survey data, 2014
In line with the survey outcomes on farmland holding size discussed in the fourth
chapter, the majority of the informants i.e. 82 (75.2%) in Gelan and 88 (77.2%) in Dukem
indicated that, their farmland holding size shrank over the last seven years (since 2005).
Around 17 (15.6%) in Gelan and 16 (14.2%) in Dukem had ceded all their farmland
holdings while only 8 (7.3%) and 7 (6.1%) respectively reported that their farmland was
not expropriated. In Table 8, 1 informant in Gelan and 3 informants in Dukem reported
an increase in their farmland size during these periods - 1 in Gelan and 3 others in
Dukem. This issue was also discussed with farmers in the FGDs. It was learned in the
FGDs that some farmers also informally buy or formally rent farmlands for up to three
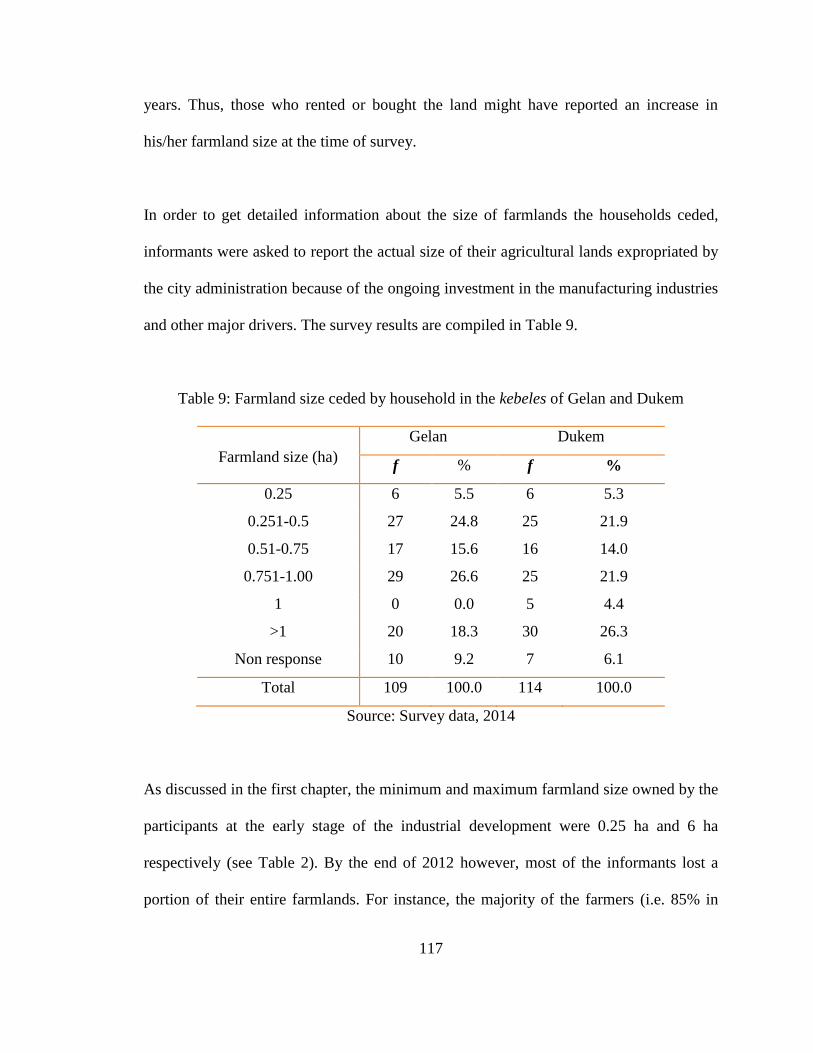
117
years. Thus, those who rented or bought the land might have reported an increase in
his/her farmland size at the time of survey.
In order to get detailed information about the size of farmlands the households ceded,
informants were asked to report the actual size of their agricultural lands expropriated by
the city administration because of the ongoing investment in the manufacturing industries
and other major drivers. The survey results are compiled in Table 9.
Table 9: Farmland size ceded by household in the kebeles of Gelan and Dukem
Farmland size (ha)
Gelan Dukem
f % f %
0.25 6 5.5 6 5.3
0.251-0.5 27 24.8 25 21.9
0.51-0.75 17 15.6 16 14.0
0.751-1.00 29 26.6 25 21.9
1 0 0.0 5 4.4
>1 20 18.3 30 26.3
Non response 10 9.2 7 6.1
Total 109 100.0 114 100.0
Source: Survey data, 2014
As discussed in the first chapter, the minimum and maximum farmland size owned by the
participants at the early stage of the industrial development were 0.25 ha and 6 ha
respectively (see Table 2). By the end of 2012 however, most of the informants lost a
portion of their entire farmlands. For instance, the majority of the farmers (i.e. 85% in
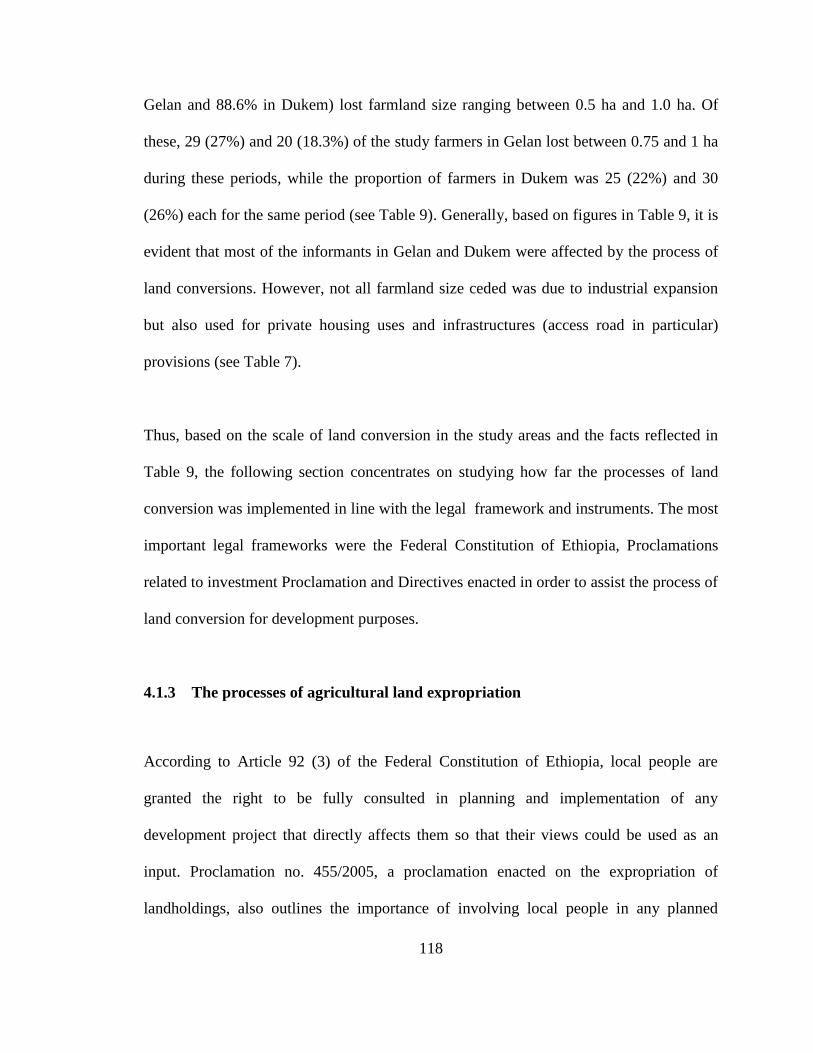
118
Gelan and 88.6% in Dukem) lost farmland size ranging between 0.5 ha and 1.0 ha. Of
these, 29 (27%) and 20 (18.3%) of the study farmers in Gelan lost between 0.75 and 1 ha
during these periods, while the proportion of farmers in Dukem was 25 (22%) and 30
(26%) each for the same period (see Table 9). Generally, based on figures in Table 9, it is
evident that most of the informants in Gelan and Dukem were affected by the process of
land conversions. However, not all farmland size ceded was due to industrial expansion
but also used for private housing uses and infrastructures (access road in particular)
provisions (see Table 7).
Thus, based on the scale of land conversion in the study areas and the facts reflected in
Table 9, the following section concentrates on studying how far the processes of land
conversion was implemented in line with the legal framework and instruments. The most
important legal frameworks were the Federal Constitution of Ethiopia, Proclamations
related to investment Proclamation and Directives enacted in order to assist the process of
land conversion for development purposes.
4.1.3 The processes of agricultural land expropriation
According to Article 92 (3) of the Federal Constitution of Ethiopia, local people are
granted the right to be fully consulted in planning and implementation of any
development project that directly affects them so that their views could be used as an
input. Proclamation no. 455/2005, a proclamation enacted on the expropriation of
landholdings, also outlines the importance of involving local people in any planned
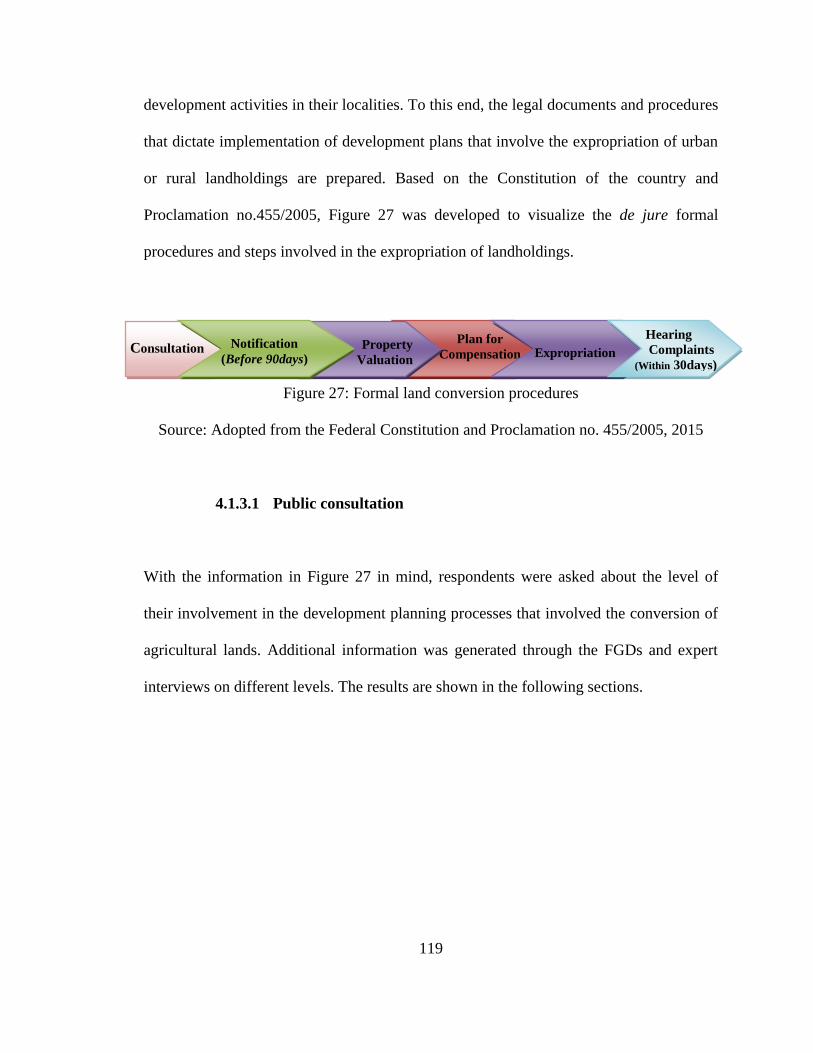
119
development activities in their localities. To this end, the legal documents and procedures
that dictate implementation of development plans that involve the expropriation of urban
or rural landholdings are prepared. Based on the Constitution of the country and
Proclamation no.455/2005, Figure 27 was developed to visualize the de jure formal
procedures and steps involved in the expropriation of landholdings.
Figure 27: Formal land conversion procedures
Source: Adopted from the Federal Constitution and Proclamation no. 455/2005, 2015
4.1.3.1 Public consultation
With the information in Figure 27 in mind, respondents were asked about the level of
their involvement in the development planning processes that involved the conversion of
agricultural lands. Additional information was generated through the FGDs and expert
interviews on different levels. The results are shown in the following sections.
Consultation
Plan for
Compensation
Property
Valuation
Notification
(Before 90days)
Expropriation
Hearing
Complaints
(Within 30days)
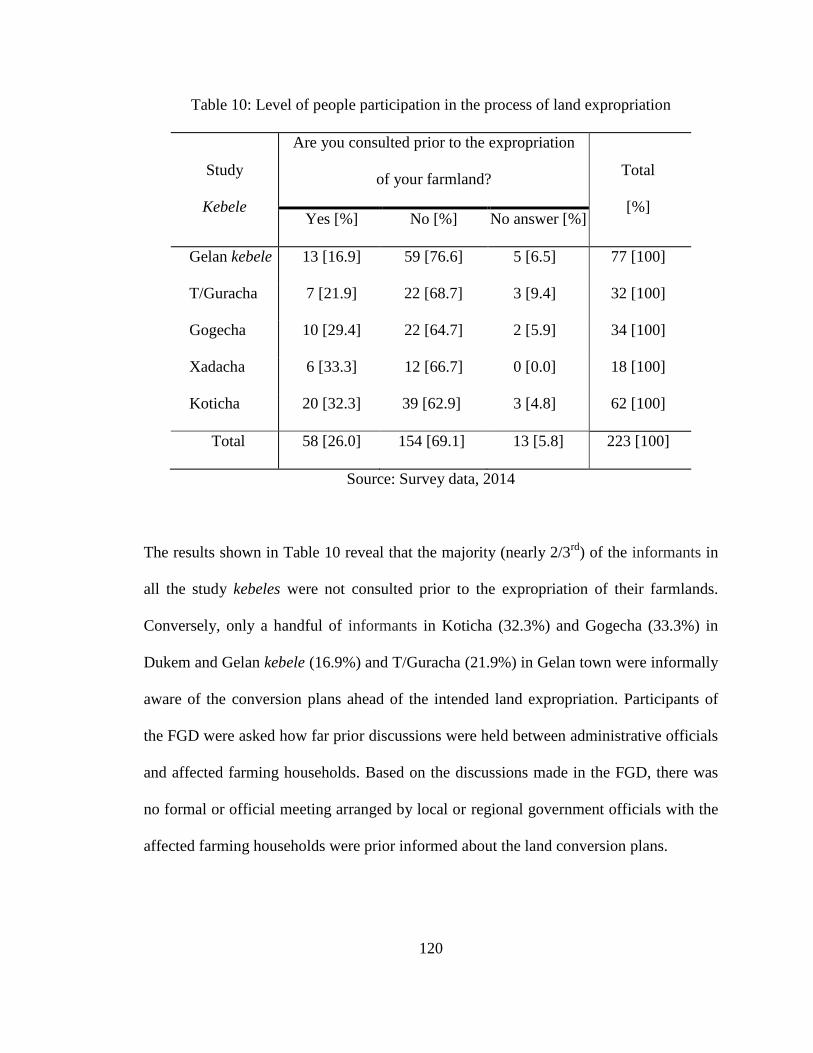
120
Table 10: Level of people participation in the process of land expropriation
Study
Kebele
Are you consulted prior to the expropriation
of your farmland?
Total
[%] Yes [%] No [%] No answer [%]
Gelan kebele 13 [16.9] 59 [76.6] 5 [6.5] 77 [100]
T/Guracha 7 [21.9] 22 [68.7] 3 [9.4] 32 [100]
Gogecha 10 [29.4] 22 [64.7] 2 [5.9] 34 [100]
Xadacha 6 [33.3] 12 [66.7] 0 [0.0] 18 [100]
Koticha 20 [32.3] 39 [62.9] 3 [4.8] 62 [100]
Total 58 [26.0] 154 [69.1] 13 [5.8] 223 [100]
Source: Survey data, 2014
The results shown in Table 10 reveal that the majority (nearly 2/3rd
) of the informants in
all the study kebeles were not consulted prior to the expropriation of their farmlands.
Conversely, only a handful of informants in Koticha (32.3%) and Gogecha (33.3%) in
Dukem and Gelan kebele (16.9%) and T/Guracha (21.9%) in Gelan town were informally
aware of the conversion plans ahead of the intended land expropriation. Participants of
the FGD were asked how far prior discussions were held between administrative officials
and affected farming households. Based on the discussions made in the FGD, there was
no formal or official meeting arranged by local or regional government officials with the
affected farming households were prior informed about the land conversion plans.
121
4.1.3.2 Notification of the Expropriation Order
According to Article 3 (1) of Proclamation no 455/2005, a woreda or an urban
administration (i.e. local administration) has the power to expropriate land under their
administration. It is also stated in the same article that, the first step in the processes of
land expropriation begins with the final decisions being made at woreda or an urban
administration level. The next step is to notify the landholder, in writing, about the
expropriation and the time when land should be vacated. At the same time, the respective
local administration is supposed to notify the landholder in writing, indicating the time
when the land has to be vacated and the amount of compensation to be paid (Article
4(1)). In the same proclamation, Article 4 (2) indicates that the minimum time limit
required to handover the land after receiving the notification letter or order is to be not
less than three months (90 days) before the due date of vacating the land.
Given the legal tools in place, the processes of land expropriation in the case study area
largely contradict with the procedures formulated by the implementing officials. In this
regard, participants in the FGD were asked to share their experiences in the procedure of
land conversion in their localities. The reflections of participants (i.e. one each from
Dukem and Gelan town) are presented below. A ―FGD‖ participant from Dukem said
(with tears in his eyes) that:
“… I received a call from one of the teams involved in the valuation and
compensation estimation team that they were taking measurements on the
122
total areas of confiscated land and told me to avail at the sight before they
depart from the sight. When I arrived at my farmland, they have already
finished taking the measurement of the portion of my farmland in my
absence. I asked them to tell me how they took the measurement and the
total areas of the land I am going to cede. Let alone inviting me for
consolation or handing me an expropriation order in advance, they were
not even willing to let me know what they had exactly done about my
farmland. I knew that I have no power to make my voices heard at the
higher official levels; I left all the matters to GOD…” (FGD no. 2:
22/3/2014).
In a similar manner, another participant in the ―FGD‖ in Gelan said that:
“…. the head of our kebele told me that there is a plan about the
expropriation of farmlands and my name and farmland was within the list.
Therefore, he told me to avail myself at the time when the team takes
measurements of the total area of the land in the field. Enough! Finished!
This was how I was notified or ordered to handover the land and how the
final decision on my land was made. Well, we all know that, refusing to
accept the decision or suing complaint yields nothing at all levels.
Therefore, I accepted it with lasting pain inside…agreed to starve my
family….” (FGD no. 2, 3, 4: 20/3/2014).
In order to get more information on the processes involved and the procedures followed
in the land conversions, I had also conducted focal person interviews with respective
officials: one each from the investment departments and urban land administration offices
in both study towns. It was possible to learn from the interviews that, their offices
sometimes receive urgent orders from higher officials (i.e. region and/or federal level) to
123
prepare investment lands in the best interest areas of some investors: sometimes outside
the areas, they prepared for the new investment applicants in their land use plan. Under
these circumstances, they did not have enough time to stick to the procedures in place.
On top of this, the smaller towns in the special zone compete among each other to attract
more investors. Therefore, if successful, they can sometimes only give the farmers a short
notice to vacate the land, especially if there are no annual or perennial crops on the land.
The reflection of one of the participants from an investment agency in Dukem said the
following:
“…we often rush to meet the demands of the investors or obey the order of
higher officials bypassing some of the rules and procedures in place….
honestly speaking this make us biased, at all government administrative
levels, toward the investors than sticking to the procedure or than
prioritizing the affected households ….” (Expert Interview no. 1,
12/05/2014).
In connection with the processes of land expropriation, informants were also asked to
share their views on how they were convinced/made the decision to cede their
landholdings in their respective kebeles. The responses of the informants are compiled
and presented in Table 11 below.
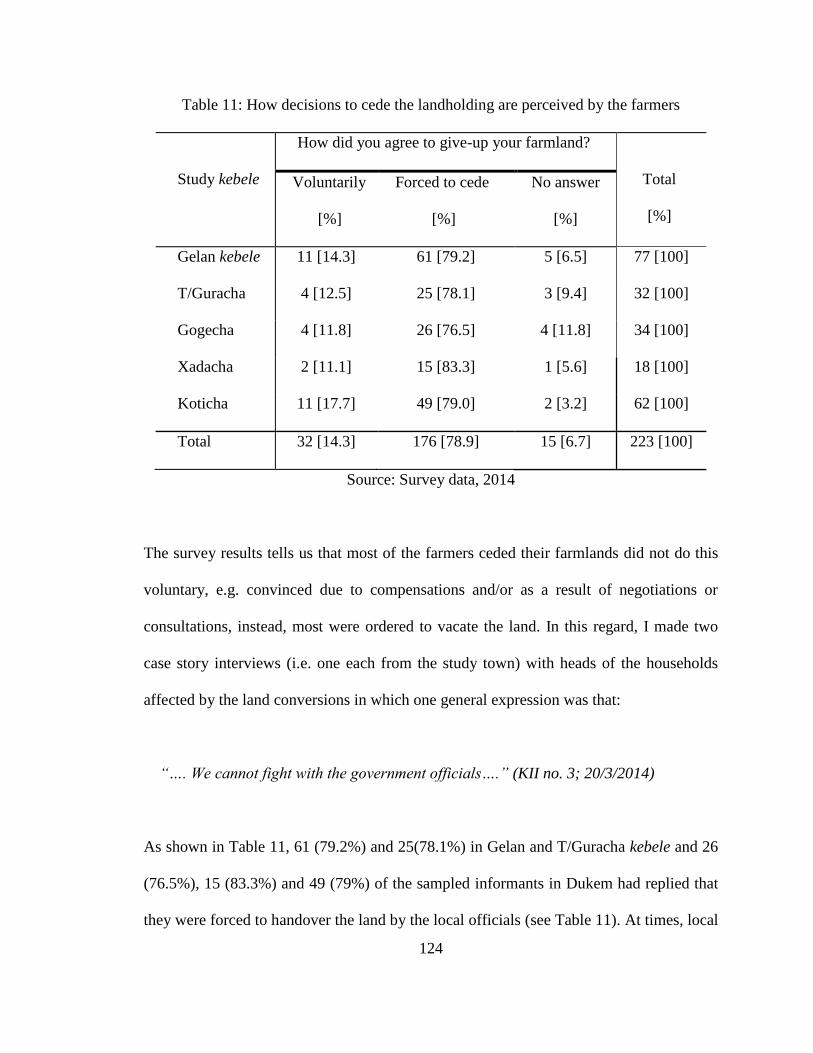
124
Table 11: How decisions to cede the landholding are perceived by the farmers
Study kebele
How did you agree to give-up your farmland?
Total
[%]
Voluntarily
[%]
Forced to cede
[%]
No answer
[%]
Gelan kebele 11 [14.3] 61 [79.2] 5 [6.5] 77 [100]
T/Guracha 4 [12.5] 25 [78.1] 3 [9.4] 32 [100]
Gogecha 4 [11.8] 26 [76.5] 4 [11.8] 34 [100]
Xadacha 2 [11.1] 15 [83.3] 1 [5.6] 18 [100]
Koticha 11 [17.7] 49 [79.0] 2 [3.2] 62 [100]
Total 32 [14.3] 176 [78.9] 15 [6.7] 223 [100]
Source: Survey data, 2014
The survey results tells us that most of the farmers ceded their farmlands did not do this
voluntary, e.g. convinced due to compensations and/or as a result of negotiations or
consultations, instead, most were ordered to vacate the land. In this regard, I made two
case story interviews (i.e. one each from the study town) with heads of the households
affected by the land conversions in which one general expression was that:
“…. We cannot fight with the government officials….” (KII no. 3; 20/3/2014)
As shown in Table 11, 61 (79.2%) and 25(78.1%) in Gelan and T/Guracha kebele and 26
(76.5%), 15 (83.3%) and 49 (79%) of the sampled informants in Dukem had replied that
they were forced to handover the land by the local officials (see Table 11). At times, local
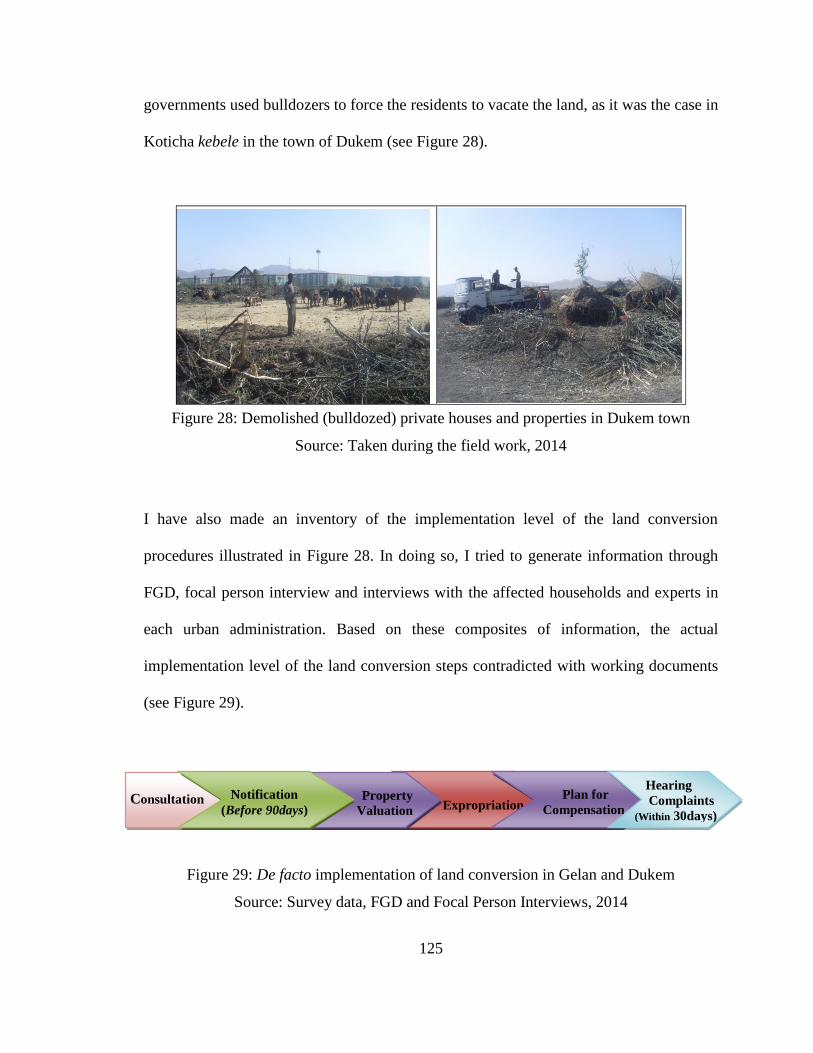
125
governments used bulldozers to force the residents to vacate the land, as it was the case in
Koticha kebele in the town of Dukem (see Figure 28).
Figure 28: Demolished (bulldozed) private houses and properties in Dukem town
Source: Taken during the field work, 2014
I have also made an inventory of the implementation level of the land conversion
procedures illustrated in Figure 28. In doing so, I tried to generate information through
FGD, focal person interview and interviews with the affected households and experts in
each urban administration. Based on these composites of information, the actual
implementation level of the land conversion steps contradicted with working documents
(see Figure 29).
Figure 29: De facto implementation of land conversion in Gelan and Dukem
Source: Survey data, FGD and Focal Person Interviews, 2014
Consultation
Expropriation
Property
Valuation
Notification
(Before 90days)
Plan for
Compensation
Hearing
Complaints
(Within 30days)
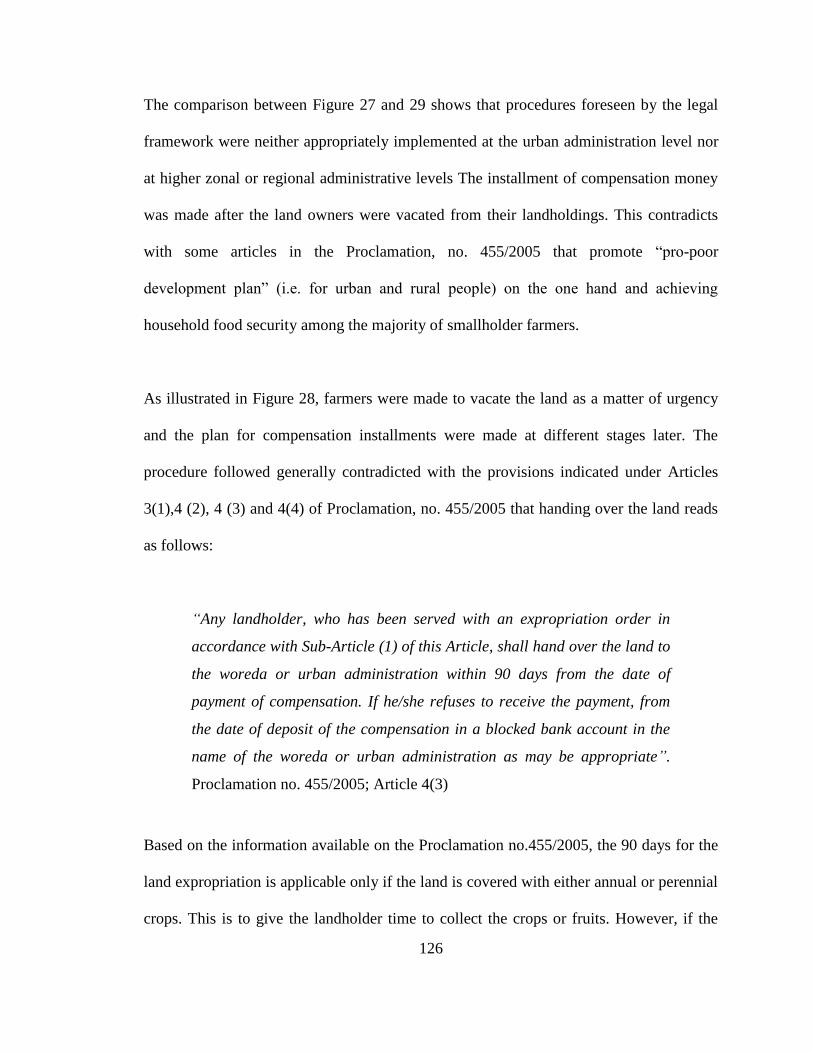
126
The comparison between Figure 27 and 29 shows that procedures foreseen by the legal
framework were neither appropriately implemented at the urban administration level nor
at higher zonal or regional administrative levels The installment of compensation money
was made after the land owners were vacated from their landholdings. This contradicts
with some articles in the Proclamation, no. 455/2005 that promote ―pro-poor
development plan‖ (i.e. for urban and rural people) on the one hand and achieving
household food security among the majority of smallholder farmers.
As illustrated in Figure 28, farmers were made to vacate the land as a matter of urgency
and the plan for compensation installments were made at different stages later. The
procedure followed generally contradicted with the provisions indicated under Articles
3(1),4 (2), 4 (3) and 4(4) of Proclamation, no. 455/2005 that handing over the land reads
as follows:
“Any landholder, who has been served with an expropriation order in
accordance with Sub-Article (1) of this Article, shall hand over the land to
the woreda or urban administration within 90 days from the date of
payment of compensation. If he/she refuses to receive the payment, from
the date of deposit of the compensation in a blocked bank account in the
name of the woreda or urban administration as may be appropriate”.
Proclamation no. 455/2005; Article 4(3)
Based on the information available on the Proclamation no.455/2005, the 90 days for the
land expropriation is applicable only if the land is covered with either annual or perennial
crops. This is to give the landholder time to collect the crops or fruits. However, if the
127
land is not covered with any crop types or other properties, the landholder is expected to
hand over the land within 30 days from the date of the recipient of notification order
(article 4(4)) or from the date of collecting compensations for the expropriated land
(Article 3(1) in accordance with Proclamation no.455/2005).
4.1.4 Compensation types and the determination of compensation amounts
The arrangement of compensation payments for landholders or other individuals whose
property or landholdings are to be confiscated is generally important in all land
conversion schemes. This is well stated in the Federal Constitution of Ethiopia, Article 40
(8). According to this article, the expropriation of landholdings or private properties in
Ethiopia should take place only after the compensation payment is made in advance to
the lost/damaged or properties on the confiscated landholdings.
According to Article 7 and 8 of Proclamation no. 455/2005, there are two cases when an
individual is entitled to claim compensation payments. These are a) compensation to be
paid for lost/damaged/confiscated property and b) compensation for displacement (i.e.
provided that expropriations involve evictions). Compensation for the earlier will be paid
if individual‘s or a group of individuals‘ landholdings is (are) being expropriated (Article
7 (1) and for his/her protection or improvements he/she made on the land against likely
degradation. Compensation amounts for this part are calculated based on the ―value of
capital and labor expended by the landholder on the land‖ (Article 7 (4) of Proclamation
no. 455/2005). Compensation for the later will only be paid if the expropriation of
128
landholders does also involve permanent displacement of the landholder from his/her
original place of residence (Article 8 (1)).
The first step in the valuation of the lost/damaged properties on the converted land as
well as for the land to be confiscated is to carry out field identification of the types of
properties on the land and taking field measurements. According to Proclamation no.
455/2005, the field identification and recordings of the property types on the land is
carried out by a certified private or public institution or an individual consultant (Article
9 (1); or by a committee of five experts designated by the woreda or urban administration
(Article 10 (1). An independent yet certified private or public consultant sounds more
logical than a team of committees assigned by their manager to ensure impartiality. Yet,
information obtained from farmers and focal persons in the urban administration shows
that, the latter has been in charge of property valuation and taking measurements of
farmland size in the field. In the context of this study it was not possible to get access to
reliable information related to the compensation amounts paid to farmers in the study
area.
However, interviewed farmers were asked if they had received compensation payments
or not for their farmlands. According to the findings (see Table 12), the majority of
respondents affected by land conversion had already received compensation payments at
the time of the study. Accordingly, 65 (84.4%) and 28 (87.5%) of the interviewed farmers
in the study kebeles in Gelan had collected their compensation money. In Dukem, 28
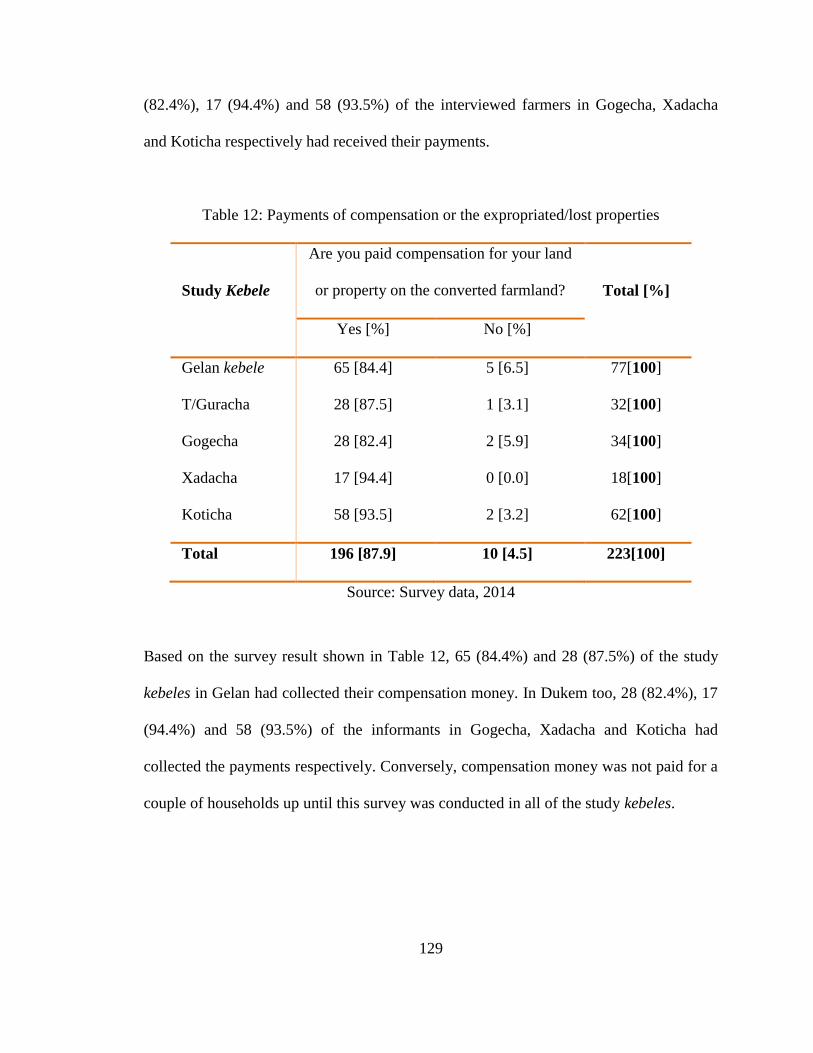
129
(82.4%), 17 (94.4%) and 58 (93.5%) of the interviewed farmers in Gogecha, Xadacha
and Koticha respectively had received their payments.
Table 12: Payments of compensation or the expropriated/lost properties
Study Kebele
Are you paid compensation for your land
or property on the converted farmland?
Total [%]
Yes [%] No [%]
Gelan kebele 65 [84.4] 5 [6.5] 77[100]
T/Guracha 28 [87.5] 1 [3.1] 32[100]
Gogecha 28 [82.4] 2 [5.9] 34[100]
Xadacha 17 [94.4] 0 [0.0] 18[100]
Koticha 58 [93.5] 2 [3.2] 62[100]
Total 196 [87.9] 10 [4.5] 223[100]
Source: Survey data, 2014
Based on the survey result shown in Table 12, 65 (84.4%) and 28 (87.5%) of the study
kebeles in Gelan had collected their compensation money. In Dukem too, 28 (82.4%), 17
(94.4%) and 58 (93.5%) of the informants in Gogecha, Xadacha and Koticha had
collected the payments respectively. Conversely, compensation money was not paid for a
couple of households up until this survey was conducted in all of the study kebeles.
130
4.1.5 Terms of compensation installment and the views of the beneficiaries
4.1.5.1 Terms of compensation installment
One of the main problems noticed during the FGDs and focal person interviews with
different stakeholders regarding compensation payments was the delay and the terms in
which payments were made. According to the existing legal tools and the land
expropriation procedures (see Figure 27), the expropriation of landholding are only made
after the installments of all the compensation packages to the affected farmers. Contrary
to the working procedures, the land was confiscated first and the compensation paid later
(see Figure 29). On top of this, individuals are entitled to receive compensation payments
in bloc; yet in the study areas, the compensation money was also paid in different
installments. While some of farmers received their money in one installment, others were
paid in two or three terms (see Table 13).
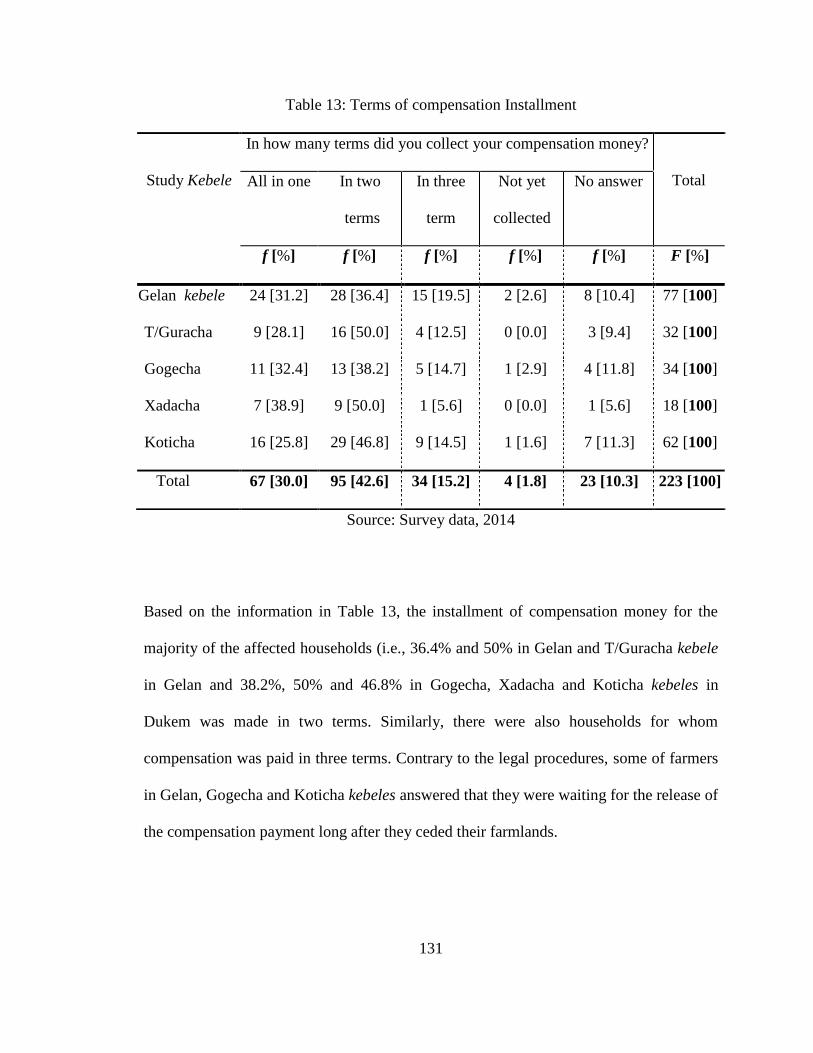
131
Table 13: Terms of compensation Installment
Source: Survey data, 2014
Based on the information in Table 13, the installment of compensation money for the
majority of the affected households (i.e., 36.4% and 50% in Gelan and T/Guracha kebele
in Gelan and 38.2%, 50% and 46.8% in Gogecha, Xadacha and Koticha kebeles in
Dukem was made in two terms. Similarly, there were also households for whom
compensation was paid in three terms. Contrary to the legal procedures, some of farmers
in Gelan, Gogecha and Koticha kebeles answered that they were waiting for the release of
the compensation payment long after they ceded their farmlands.
Study Kebele
In how many terms did you collect your compensation money?
Total All in one In two
terms
In three
term
Not yet
collected
No answer
f [%] f [%] f [%] f [%] f [%] F [%]
Gelan kebele 24 [31.2] 28 [36.4] 15 [19.5] 2 [2.6] 8 [10.4] 77 [100]
T/Guracha 9 [28.1] 16 [50.0] 4 [12.5] 0 [0.0] 3 [9.4] 32 [100]
Gogecha 11 [32.4] 13 [38.2] 5 [14.7] 1 [2.9] 4 [11.8] 34 [100]
Xadacha 7 [38.9] 9 [50.0] 1 [5.6] 0 [0.0] 1 [5.6] 18 [100]
Koticha 16 [25.8] 29 [46.8] 9 [14.5] 1 [1.6] 7 [11.3] 62 [100]
Total 67 [30.0] 95 [42.6] 34 [15.2] 4 [1.8] 23 [10.3] 223 [100]
132
4.1.5.2 Views of the affected households on the process of land expropriation and
compensation payments
As part of the process involved in the determination of the compensation amount, four
important points were found as the cause of grievances between those involved in the
expropriation of landholdings and the local beneficiaries. These are the price set per m2
of converted farmland (i.e. the terms used to calculate compensation amounts), the
accuracy of the field measurements and the limited role farmers play in the entire phases
of property valuation and the determination of compensation amounts.
From these four important points, the main grievances of the households‘ interviewed in
the survey and those individuals involved in the FGD were related to the conversation
rate of their land and the compensation amount. Other things being kept normal, the
amount of compensation money paid to the affected farmers was not uniform throughout
the period under observation. At the start of the industrial development in this area in
2004 and 2005, the prices set to calculate compensation payments for converted land
were very low: around 2.10 birr/m2
farmland size (i.e. ~0.1US$8) plus ‗compensation for
lost income based on the average annual income secured during the five years preceding
the expropriation of the land‘ (Proclamation no. 455/2005). With regard to calculating the
average annual income of the affected farmers, the farmers themselves were not
consulted in the process. Instead, valuation teams based their assessment on their
estimations of the average annual income of the farmer from the land.
8 1USD ~20.0 Birr in2014
133
Between 2005 and 2010, the number of investment applicants and the magnitude of land
conversion increased strongly in the study areas. Therefore, most of the households
affected had received compensation payments when the land conversion rate was very
low (~0.1US$/m2). However, following strong complaints from farmers affected on one
hand and criticism by different media outlets, the amount of compensation payments for
land rose over time. In 2011/12 around 18 birr/m2 were paid.
In this regard, most of the households with whom I made conversations wanted the
government to re-calculate the amount of compensation money with the higher
conversion rates (i.e., amount of birr used to calculate compensation per square meter of
converted farmlands) for the converted farmland per square meter and refund them (i.e.
those whose compensation was calculated by 2.10 birr/m2 or 0.1US$/m
2). Similarly, most
of the participants in the ―case story‖ interviews were also asking the following question
seriously. The views of the households interviewed and those involved in the FGDs are
presented below. A 60-year-old father of 8 children in Gelan said the following:
“….over the last 30 years, I had worked on my farmland and was able to
produce enough food for my family. My farmlands were all located close
to the main highway road (~around 200m). I was one of the local farmers
to cede my farmland the moment Gelan town was designed for the
establishment of industrial development corridor. I was ordered to
handover the land by the urban administration for the expanding private
investors. A group of people came to my ex-farmland and took
measurements. I had no knowledge on how measurements were taken. On
top of this, I was also not informed about the total area of my farmland
134
confiscated. They told me that they would pay compensation for the
expropriated land when the price for a m2 of land area was only 2 birr
(0.1USD). They gave me some money but they did not give me any advice
or support on how to use the money towards sustainable livelihood. I am
illiterate but had rich experience only in agriculture. When they took away
my farmland, I was left with no other option. I turned from net producer to
net buyer of food with a small amount of money I make as gate keeper for
an investor on my own ex-farmland. Now, I turned 60. My livelihood is
ruined. I heard that the price of the land conversion rate now is higher
than it was when they expropriated our farmlands…... Therefore, I would
beg our government to re-calculate compensation for our land and make
payments for us too with the current price of 18 birr/m2
(~0.86USD/m2) as
they did for others recently. (KII no.1, 6: 20/3/2014).
A female farmer from Dukem said:
“…. most of the people in my area cannot read and understand what so
ever is on the paper. Our sources of information are government media
and local officials. The local officials told us that investors are coming
with many opportunities for the local people (i.e., employment, better
wage, infrastructure, etc). To this end, they told us that they were going to
expropriate some of the farmlands for which they make compensation. At
the very beginning, some of the farmers including myself were happy to
hear that opportunities are coming to our vicinities and the compensation
money as well. We thought that the amount of compensation money was
big that would allow us improve our livelihood status. Unfortunately, they
did not tell us how the compensation money was calculated and the
amount of compensation money was too small. On top of this, the
installments of compensation were made at different terms. At a time when
135
payment for the second term was made, all the money collected during the
first term was gone. Had they given me all at once, I would have bought a
house or a land in Dukem so that I will benefit from the rent. (KII no. 1, 6;
22/3/204)
According to the views of focal persons in the urban administration, the decision to
breaking the installments of the compensation money was made intentionally as a
strategy to allow the beneficiaries use the money appropriately. One of the focal persons
in Dukem said the following:
“….usually the installment of compensation was not made in phases for
all the beneficiaries; households whose compensation money was often
less than 50, 000 birr (2380 USD) were allowed to collect all in one term.
However, if the amount is bigger than this, the government decided to
make the payments phase by phase for two reasons. Firstly, we need some
time to prepare the money to be paid; on the other hand, most of the
beneficiaries were not educated and had little or no knowhow on how to
use the money in non-agricultural activities or business sectors.
Therefore, making all the payments at once was thought to protect the
beneficiaries from using the money inappropriately as they lack
experience in managing large sums of money.” (Expert Interview no. 5;
15/04/2014).
The reflection given by an official in the finance department of Gelan was similar:
“…. some of the beneficiaries were not good in the management of large
amounts money … at the very start, farmland losers were allowed to
136
collect all the compensation money in one installment. However, an
assessment made had indicated that, most of the benefiters exhausted the
money without translating at least part of it into a fixed asset that would
help them restore their livelihood. In fact, the amount of compensation
money was not that big due to the small conversation rate of the converted
land size. In order to avoid unsustainable use of compensation money, the
payment was deposited on their bank account (i.e., after they were made
to open bank accounts) so that they could not withdraw all the money at
once. This was also proofed less effective; the account holders were busy
visiting the bank to withdraw their money more or less every next
morning. Although, some of the beneficiaries used the money properly (i.e.
built a house, while others rented a farmland to cultivate food crop), most
of them finished the money. The third strategy used was, deposition of
compensation money into a joint bank account of the couples (i.e., for
those who were married) hoping to limit withdrawal of the money by a
single party-mostly husbands. In a male dominated family, a husband has
the power to force their partner to obey his order. Thus, although it was
not as simple as withdrawing money it was before, most of the wives did
not influence their husband‟s command over the money. On the
government side, breaking payments into phases was also considered to
avoid unnecessary delay for the installment of compensation (i.e., not to
wait until all the required money is available at once” (Expert Interview
no. 5, 12/05/2014).
In relation to the compensation payment, focal persons (i.e. small and micro enterprise
offices; finance departments) were asked if they have given assistance or advice to
compensated farmers on how to effectively and sustainably use their compensation
payments, e.g. how to design a business plan or to launch their own micro-business.
137
However, it was learned from the discussions that none of them assisted or advised local
farmers in this regard.
4.1.5.3 Compensation amount in the eyes of beneficiaries
The survey results in Table 14 show the beneficiaries own assessment of the
compensation amounts in relation to the aggregated benefits they were reaping from their
expropriated farmlands. Accordingly, the amount of money paid in compensation to the
expropriated farmlands and properties on it were evaluated to be smaller than the benefits
the farmers used to obtain from it. For instance, 55 (71.4%) and 25 (78.1%) in Gelan
kebele and T/Guracha kebeles in Gelan indicated that the compensation amount was
generally smaller than all the benefits obtained from their expropriated lands. Likewise,
in Dukem too, 22 (64.7%), 17 (94.4%) and 46 (74.2%) of the respondents in Gogecha,
Xadacha and Koticha kebeles respectively rated the compensation payments lower that
the aggregated benefits they obtained from the land (see Table 14).
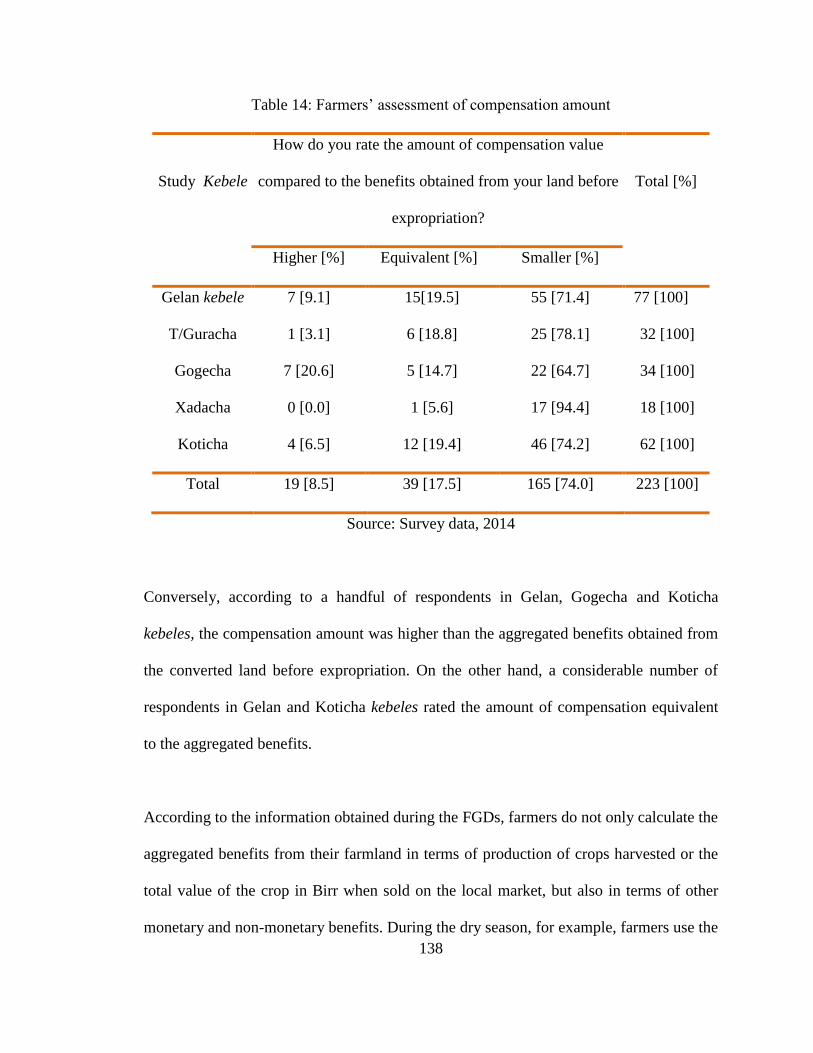
138
Table 14: Farmers‘ assessment of compensation amount
Study Kebele
How do you rate the amount of compensation value
compared to the benefits obtained from your land before
expropriation?
Total [%]
Higher [%] Equivalent [%] Smaller [%]
Gelan kebele 7 [9.1] 15[19.5] 55 [71.4] 77 [100]
T/Guracha 1 [3.1] 6 [18.8] 25 [78.1] 32 [100]
Gogecha 7 [20.6] 5 [14.7] 22 [64.7] 34 [100]
Xadacha 0 [0.0] 1 [5.6] 17 [94.4] 18 [100]
Koticha 4 [6.5] 12 [19.4] 46 [74.2] 62 [100]
Total 19 [8.5] 39 [17.5] 165 [74.0] 223 [100]
Source: Survey data, 2014
Conversely, according to a handful of respondents in Gelan, Gogecha and Koticha
kebeles, the compensation amount was higher than the aggregated benefits obtained from
the converted land before expropriation. On the other hand, a considerable number of
respondents in Gelan and Koticha kebeles rated the amount of compensation equivalent
to the aggregated benefits.
According to the information obtained during the FGDs, farmers do not only calculate the
aggregated benefits from their farmland in terms of production of crops harvested or the
total value of the crop in Birr when sold on the local market, but also in terms of other
monetary and non-monetary benefits. During the dry season, for example, farmers use the
139
land as grazing land for their livestock. Crop residues are used as livestock feed, fuel
wood, or for the construction of houses. On the other hand, farmers define the benefits
they obtain from their land in terms of social and intrinsic cultural values as well.
The FGDs and focal person interviews showed that farmland is also an essential
component of farmers‘ identity. Owning a farmland contributes to status and confidence,
and makes farmers feel secure. Therefore, losing a land for them is not necessarily losing
property alone that could be translated/ measured and compensated in terms of money. It
is also about losing identity, home and hope that in the short or long term can led to
permanent distraction of social structures and livelihoods. In this respect, the information
obtained from the FGDs was found to coincide with the works of Amartya Sen who
wrote the following:
“A family without land in a peasant society may be deeply handicapped
…to be without land may seem like being without a limb of one‟s own. But,
whether or not a family attaches direct value to its relation with its “own
land”, landlessness can also help to generate economic and social
deprivations.” Amartya Sen (2000: 14).
4.1.6 Living standard of the households after compensation installment
According to Carney (1998), a livelihood is sustainable when it can cope with and
recover from stresses and shocks and maintain or enhance its capabilities and assets both
now and in the future, while not undermining the natural resource base. The intention of
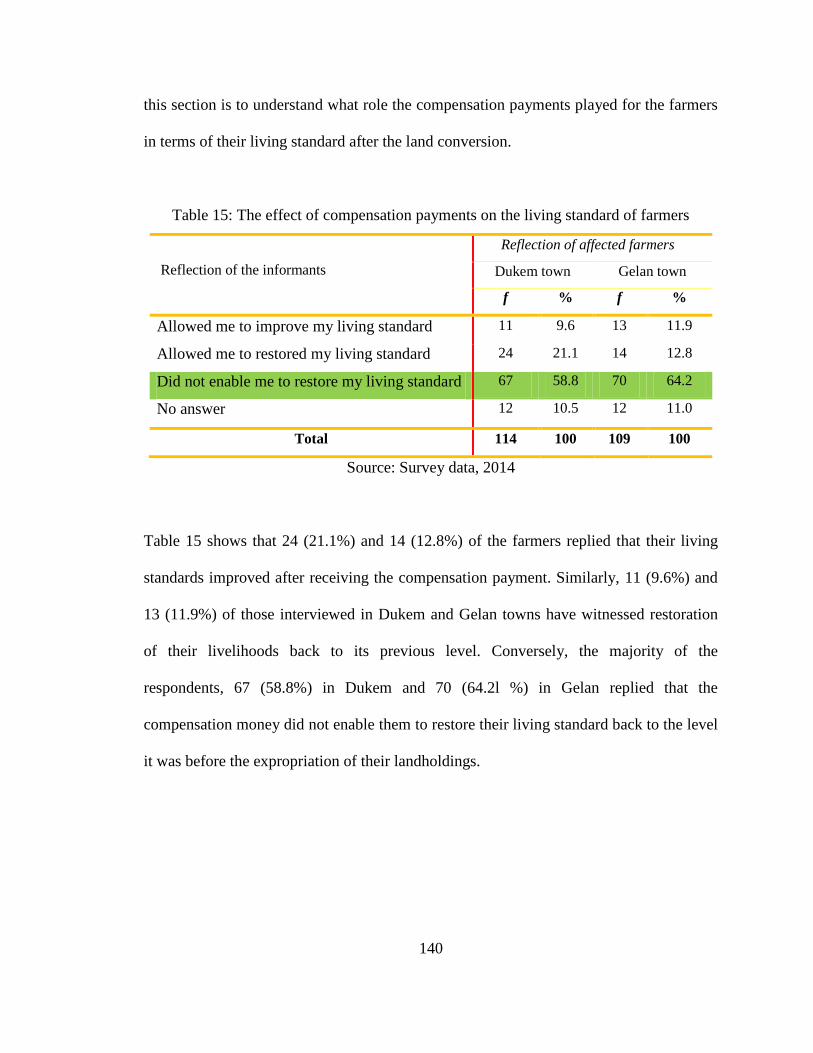
140
this section is to understand what role the compensation payments played for the farmers
in terms of their living standard after the land conversion.
Table 15: The effect of compensation payments on the living standard of farmers
Reflection of the informants
Reflection of affected farmers
Dukem town Gelan town
f % f %
Allowed me to improve my living standard 11 9.6 13 11.9
Allowed me to restored my living standard 24 21.1 14 12.8
Did not enable me to restore my living standard 67 58.8 70 64.2
No answer 12 10.5 12 11.0
Total 114 100 109 100
Source: Survey data, 2014
Table 15 shows that 24 (21.1%) and 14 (12.8%) of the farmers replied that their living
standards improved after receiving the compensation payment. Similarly, 11 (9.6%) and
13 (11.9%) of those interviewed in Dukem and Gelan towns have witnessed restoration
of their livelihoods back to its previous level. Conversely, the majority of the
respondents, 67 (58.8%) in Dukem and 70 (64.2l %) in Gelan replied that the
compensation money did not enable them to restore their living standard back to the level
it was before the expropriation of their landholdings.
141
5 CHAPTER SIX: The concentration level of selected pollutants and
their health effects on residents and the environment
5.1.1 Physico-chemical properties of the effluents
The empirical results of this study reveal that concentrations of some of the physico-
chemical and bacteriological pollutants in the textile effluents in Gelan and Dukem are
higher than the permissible limit defined by the Ethiopian Federal Environmental
Protection Authority (EPA). Concentrations of other pollutants, however, were below
that limit. Table 16 presents a list of the parameters for physico-chemical and
bacteriological characteristics of textile effluents in Gelan and Dukem. Those parameters,
whose values exceed the permissible limits of discharge into the inland surface water
sources as outlined in the EPA guidelines and are highlighted in yellow. Accordingly, of
the total 16 observed parameters in the samples from all investigated industries, three
parameters (COD, BOD5 and TSS) were found higher than the permissible discharge
limit. Conversely, a high level of T. coli was recorded in effluents from ALSAR and
ALMHADI while S2 was observed in effluents from DH-GEDA.
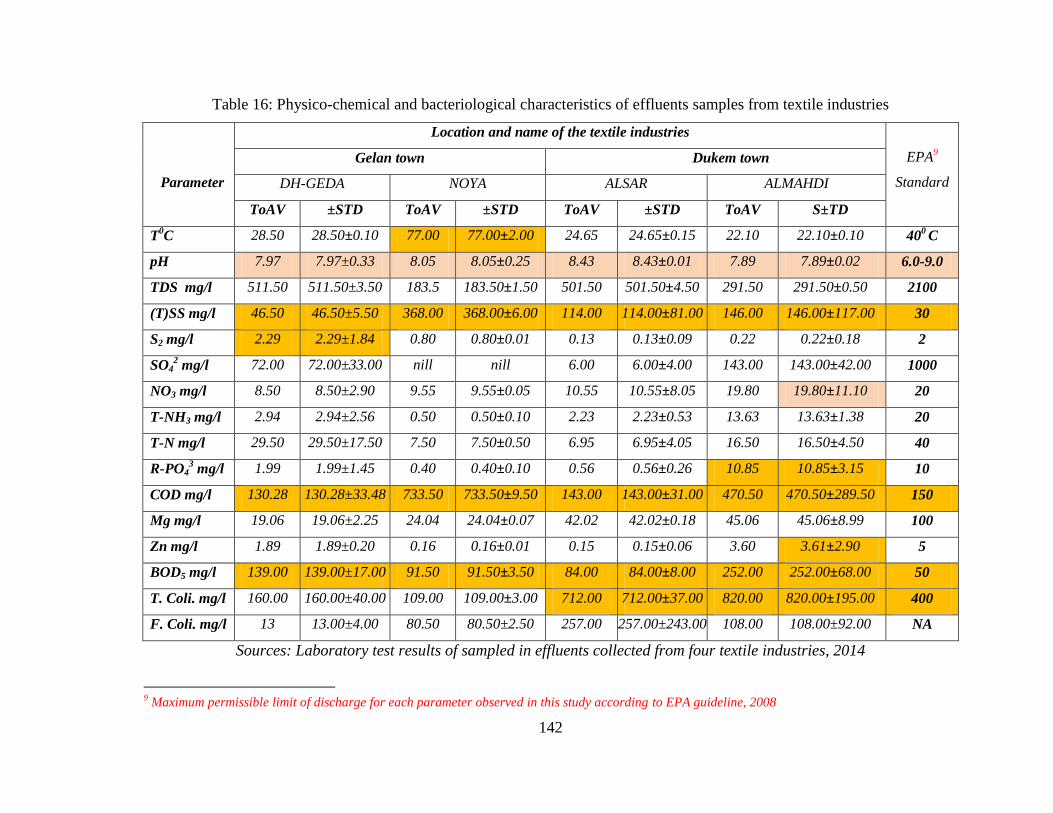
142
Table 16: Physico-chemical and bacteriological characteristics of effluents samples from textile industries
Parameter
Location and name of the textile industries
EPA9
Standard
Gelan town Dukem town
DH-GEDA NOYA ALSAR ALMAHDI
ToAV ±STD ToAV ±STD ToAV ±STD ToAV S±TD
T0C 28.50 28.50±0.10 77.00 77.00±2.00 24.65 24.65±0.15 22.10 22.10±0.10 40
0 C
pH 7.97 7.97±0.33 8.05 8.05±0.25 8.43 8.43±0.01 7.89 7.89±0.02 6.0-9.0
TDS mg/l 511.50 511.50±3.50 183.5 183.50±1.50 501.50 501.50±4.50 291.50 291.50±0.50 2100
(T)SS mg/l 46.50 46.50±5.50 368.00 368.00±6.00 114.00 114.00±81.00 146.00 146.00±117.00 30
S2 mg/l 2.29 2.29±1.84 0.80 0.80±0.01 0.13 0.13±0.09 0.22 0.22±0.18 2
SO42 mg/l 72.00 72.00±33.00 nill nill 6.00 6.00±4.00 143.00 143.00±42.00 1000
NO3 mg/l 8.50 8.50±2.90 9.55 9.55±0.05 10.55 10.55±8.05 19.80 19.80±11.10 20
T-NH3 mg/l 2.94 2.94±2.56 0.50 0.50±0.10 2.23 2.23±0.53 13.63 13.63±1.38 20
T-N mg/l 29.50 29.50±17.50 7.50 7.50±0.50 6.95 6.95±4.05 16.50 16.50±4.50 40
R-PO43 mg/l 1.99 1.99±1.45 0.40 0.40±0.10 0.56 0.56±0.26 10.85 10.85±3.15 10
COD mg/l 130.28 130.28±33.48 733.50 733.50±9.50 143.00 143.00±31.00 470.50 470.50±289.50 150
Mg mg/l 19.06 19.06±2.25 24.04 24.04±0.07 42.02 42.02±0.18 45.06 45.06±8.99 100
Zn mg/l 1.89 1.89±0.20 0.16 0.16±0.01 0.15 0.15±0.06 3.60 3.61±2.90 5
BOD5 mg/l 139.00 139.00±17.00 91.50 91.50±3.50 84.00 84.00±8.00 252.00 252.00±68.00 50
T. Coli. mg/l 160.00 160.00±40.00 109.00 109.00±3.00 712.00 712.00±37.00 820.00 820.00±195.00 400
F. Coli. mg/l 13 13.00±4.00 80.50 80.50±2.50 257.00 257.00±243.00 108.00 108.00±92.00 NA
Sources: Laboratory test results of sampled in effluents collected from four textile industries, 2014
9 Maximum permissible limit of discharge for each parameter observed in this study according to EPA guideline, 2008
143
5.1.2 The concentration level of pollutants among the industries
This section graphically presents the actual measured values of selected pollutants in all
four observed textile industries. It aims to enhance the (visual) understanding of the
concentration levels of pollutants against the limits10
allowed by the EPA guideline.
Graphs show the differences between our measured values (the straight black lines in the
Figures) and the tolerable concentrations for discharge into inland water sources as
permitted in the EPA guideline (the broken blue lines).
5.1.2.1 Pollutants observed in high concentration in all selected industries
The Biological Oxygen Demands (BOD5), Chemical Oxygen Demands (COD) and Total
Suspended Solids (TSS) were found in high concentration in samples from all four
selected industries (see Table 29). Analyzing the concentration level of BOD5 is vital, as
BOD5 is one of the most important water quality indicators (WHO, 2008). Figure 30
shows that the concentration level of BOD5 in all samples taken from the four textile
industries in Gelan and Dukem are above the permitted concentration limit of this
pollutant into the inland water sources (see broken horizontal line).
10
The maximum limit of discharge varies from one pollutant to the other one as it was stated in the EPA
guideline (e.g., EPA Standard indicated in the last column of table 1).
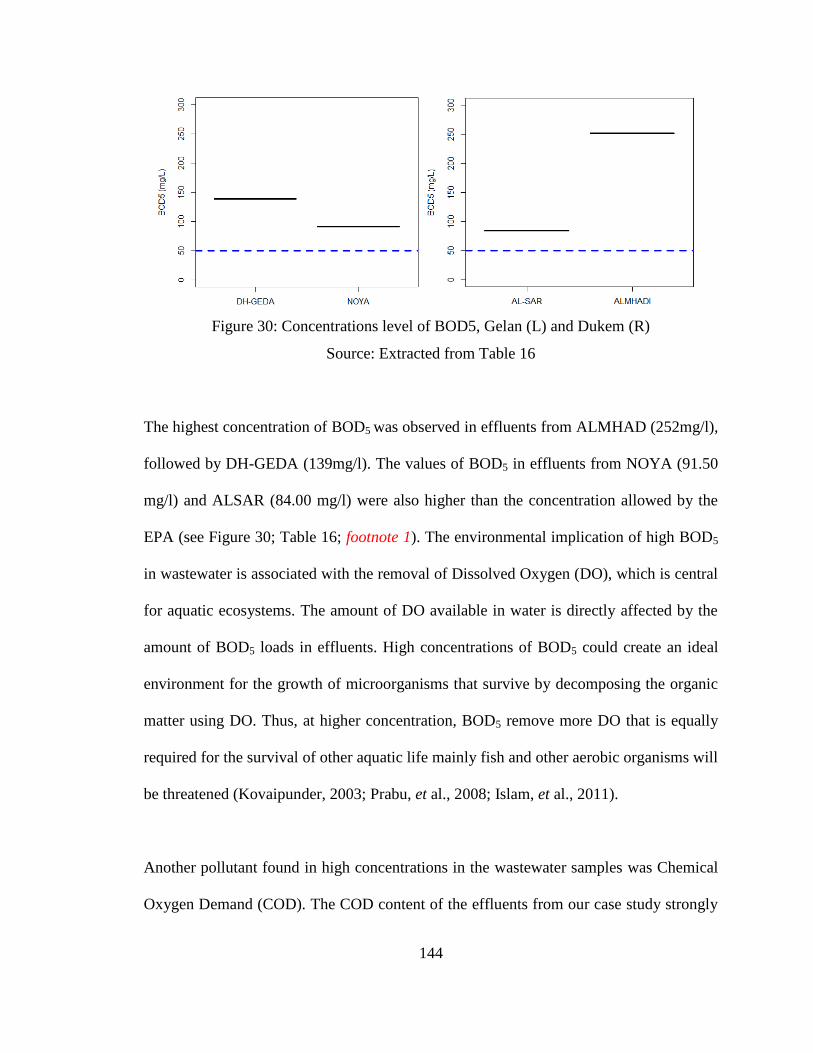
144
Figure 30: Concentrations level of BOD5, Gelan (L) and Dukem (R)
Source: Extracted from Table 16
The highest concentration of BOD5 was observed in effluents from ALMHAD (252mg/l),
followed by DH-GEDA (139mg/l). The values of BOD5 in effluents from NOYA (91.50
mg/l) and ALSAR (84.00 mg/l) were also higher than the concentration allowed by the
EPA (see Figure 30; Table 16; footnote 1). The environmental implication of high BOD5
in wastewater is associated with the removal of Dissolved Oxygen (DO), which is central
for aquatic ecosystems. The amount of DO available in water is directly affected by the
amount of BOD5 loads in effluents. High concentrations of BOD5 could create an ideal
environment for the growth of microorganisms that survive by decomposing the organic
matter using DO. Thus, at higher concentration, BOD5 remove more DO that is equally
required for the survival of other aquatic life mainly fish and other aerobic organisms will
be threatened (Kovaipunder, 2003; Prabu, et al., 2008; Islam, et al., 2011).
Another pollutant found in high concentrations in the wastewater samples was Chemical
Oxygen Demand (COD). The COD content of the effluents from our case study strongly
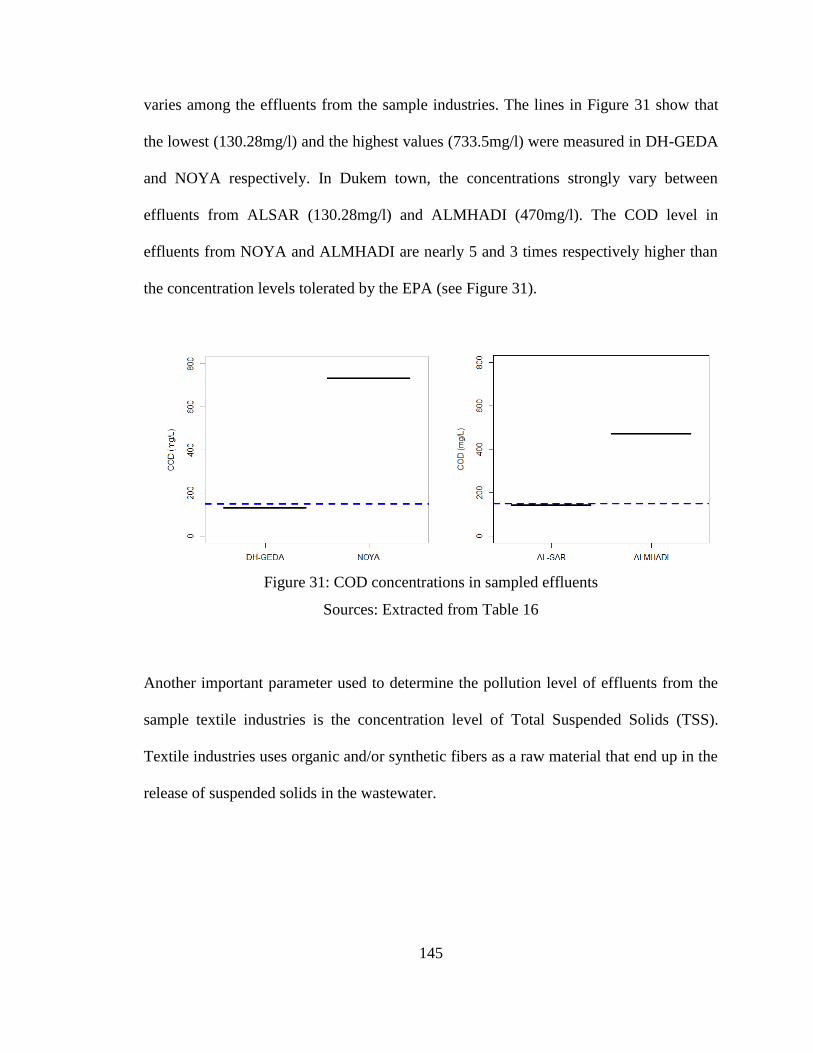
145
varies among the effluents from the sample industries. The lines in Figure 31 show that
the lowest (130.28mg/l) and the highest values (733.5mg/l) were measured in DH-GEDA
and NOYA respectively. In Dukem town, the concentrations strongly vary between
effluents from ALSAR (130.28mg/l) and ALMHADI (470mg/l). The COD level in
effluents from NOYA and ALMHADI are nearly 5 and 3 times respectively higher than
the concentration levels tolerated by the EPA (see Figure 31).
Figure 31: COD concentrations in sampled effluents
Sources: Extracted from Table 16
Another important parameter used to determine the pollution level of effluents from the
sample textile industries is the concentration level of Total Suspended Solids (TSS).
Textile industries uses organic and/or synthetic fibers as a raw material that end up in the
release of suspended solids in the wastewater.
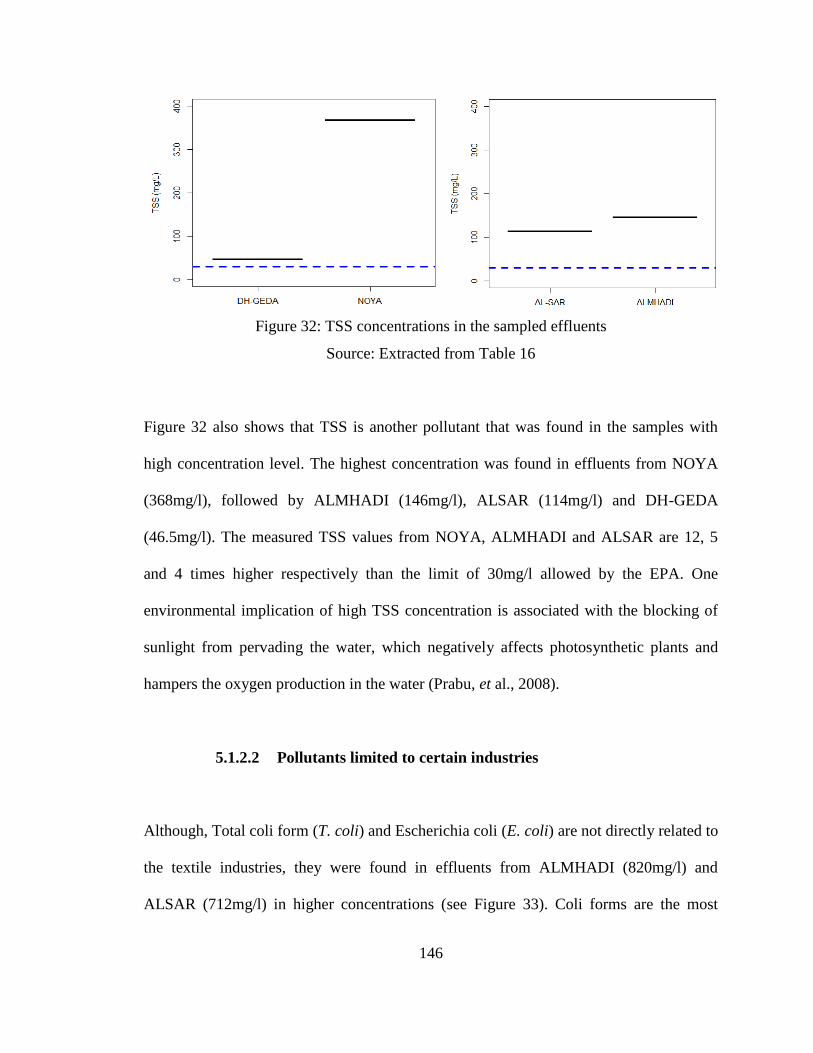
146
Figure 32: TSS concentrations in the sampled effluents
Source: Extracted from Table 16
Figure 32 also shows that TSS is another pollutant that was found in the samples with
high concentration level. The highest concentration was found in effluents from NOYA
(368mg/l), followed by ALMHADI (146mg/l), ALSAR (114mg/l) and DH-GEDA
(46.5mg/l). The measured TSS values from NOYA, ALMHADI and ALSAR are 12, 5
and 4 times higher respectively than the limit of 30mg/l allowed by the EPA. One
environmental implication of high TSS concentration is associated with the blocking of
sunlight from pervading the water, which negatively affects photosynthetic plants and
hampers the oxygen production in the water (Prabu, et al., 2008).
5.1.2.2 Pollutants limited to certain industries
Although, Total coli form (T. coli) and Escherichia coli (E. coli) are not directly related to
the textile industries, they were found in effluents from ALMHADI (820mg/l) and
ALSAR (712mg/l) in higher concentrations (see Figure 33). Coli forms are the most
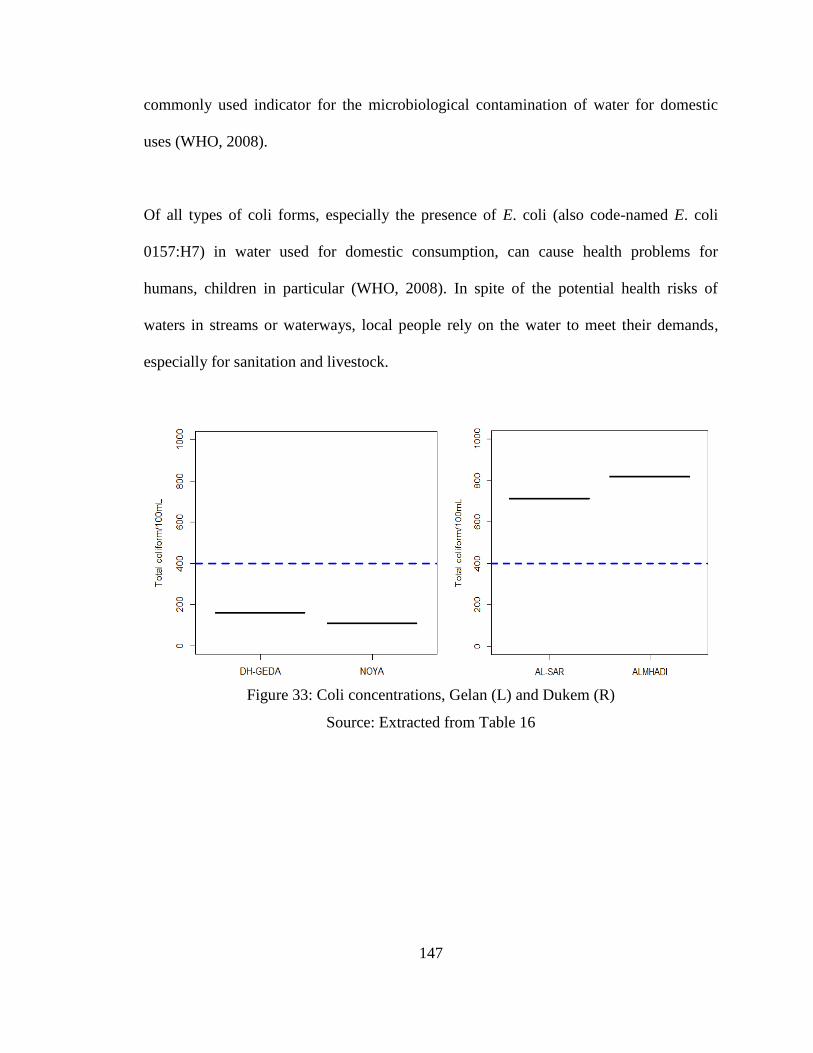
147
commonly used indicator for the microbiological contamination of water for domestic
uses (WHO, 2008).
Of all types of coli forms, especially the presence of E. coli (also code-named E. coli
0157:H7) in water used for domestic consumption, can cause health problems for
humans, children in particular (WHO, 2008). In spite of the potential health risks of
waters in streams or waterways, local people rely on the water to meet their demands,
especially for sanitation and livestock.
Figure 33: Coli concentrations, Gelan (L) and Dukem (R)
Source: Extracted from Table 16
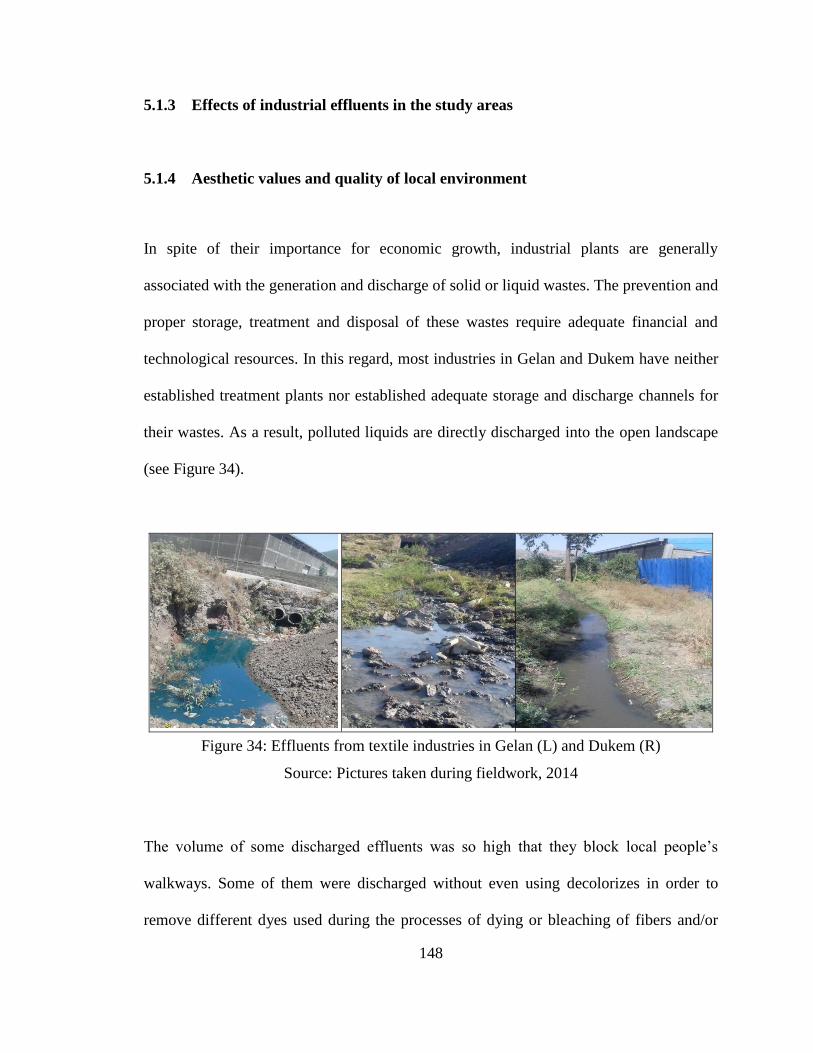
148
5.1.3 Effects of industrial effluents in the study areas
5.1.4 Aesthetic values and quality of local environment
In spite of their importance for economic growth, industrial plants are generally
associated with the generation and discharge of solid or liquid wastes. The prevention and
proper storage, treatment and disposal of these wastes require adequate financial and
technological resources. In this regard, most industries in Gelan and Dukem have neither
established treatment plants nor established adequate storage and discharge channels for
their wastes. As a result, polluted liquids are directly discharged into the open landscape
(see Figure 34).
Figure 34: Effluents from textile industries in Gelan (L) and Dukem (R)
Source: Pictures taken during fieldwork, 2014
The volume of some discharged effluents was so high that they block local people‘s
walkways. Some of them were discharged without even using decolorizes in order to
remove different dyes used during the processes of dying or bleaching of fibers and/or
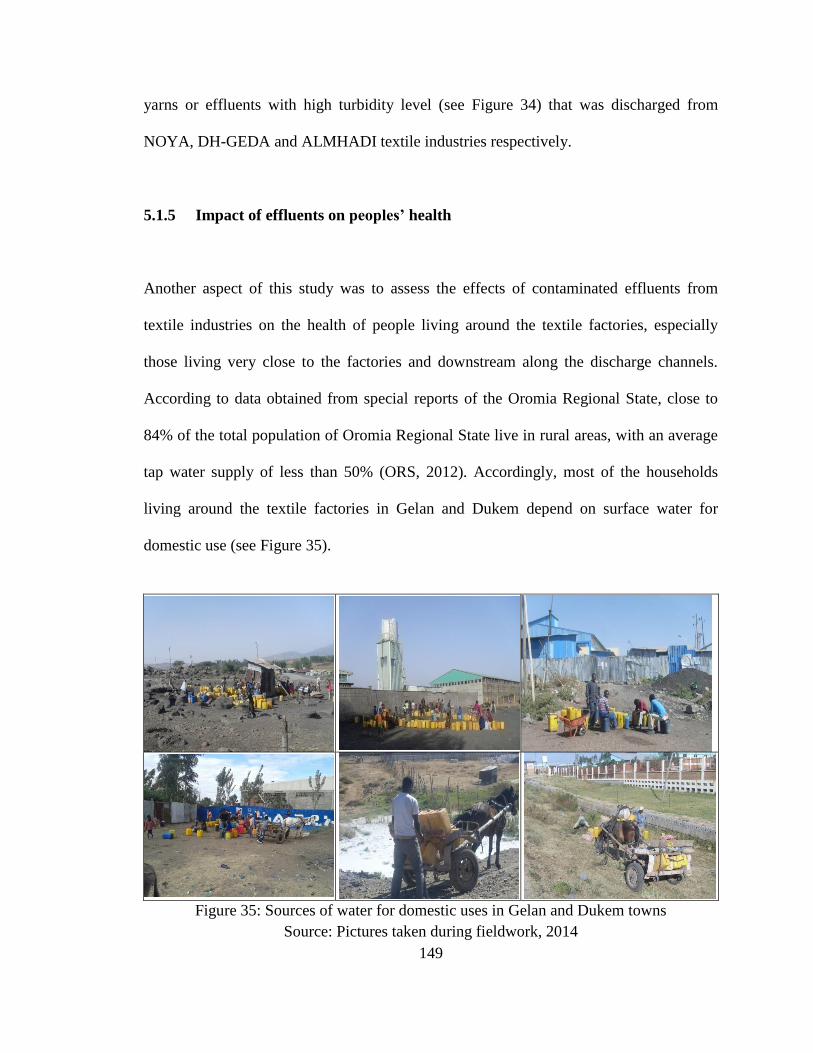
149
yarns or effluents with high turbidity level (see Figure 34) that was discharged from
NOYA, DH-GEDA and ALMHADI textile industries respectively.
5.1.5 Impact of effluents on peoples’ health
Another aspect of this study was to assess the effects of contaminated effluents from
textile industries on the health of people living around the textile factories, especially
those living very close to the factories and downstream along the discharge channels.
According to data obtained from special reports of the Oromia Regional State, close to
84% of the total population of Oromia Regional State live in rural areas, with an average
tap water supply of less than 50% (ORS, 2012). Accordingly, most of the households
living around the textile factories in Gelan and Dukem depend on surface water for
domestic use (see Figure 35).
Figure 35: Sources of water for domestic uses in Gelan and Dukem towns Source: Pictures taken during fieldwork, 2014
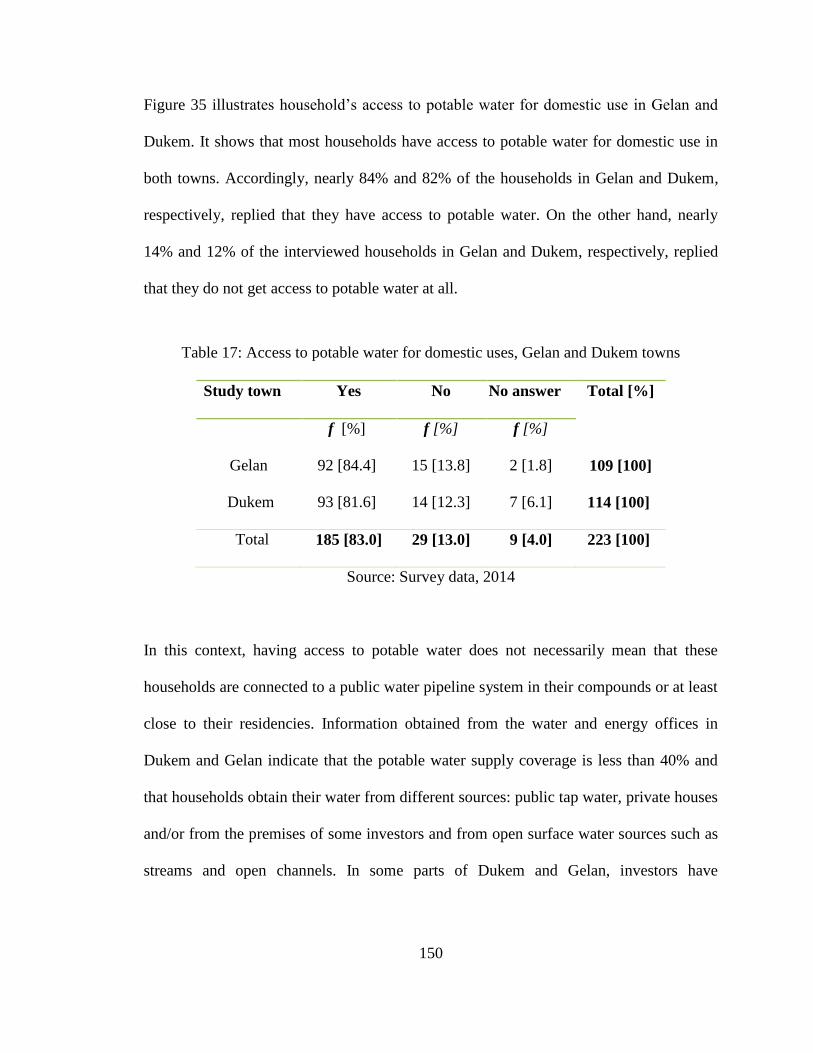
150
Figure 35 illustrates household‘s access to potable water for domestic use in Gelan and
Dukem. It shows that most households have access to potable water for domestic use in
both towns. Accordingly, nearly 84% and 82% of the households in Gelan and Dukem,
respectively, replied that they have access to potable water. On the other hand, nearly
14% and 12% of the interviewed households in Gelan and Dukem, respectively, replied
that they do not get access to potable water at all.
Table 17: Access to potable water for domestic uses, Gelan and Dukem towns
Study town Yes No No answer Total [%]
Gelan
f [%] f [%] f [%]
92 [84.4] 15 [13.8] 2 [1.8] 109 [100]
Dukem 93 [81.6] 14 [12.3] 7 [6.1] 114 [100]
Total 185 [83.0] 29 [13.0] 9 [4.0] 223 [100]
Source: Survey data, 2014
In this context, having access to potable water does not necessarily mean that these
households are connected to a public water pipeline system in their compounds or at least
close to their residencies. Information obtained from the water and energy offices in
Dukem and Gelan indicate that the potable water supply coverage is less than 40% and
that households obtain their water from different sources: public tap water, private houses
and/or from the premises of some investors and from open surface water sources such as
streams and open channels. In some parts of Dukem and Gelan, investors have
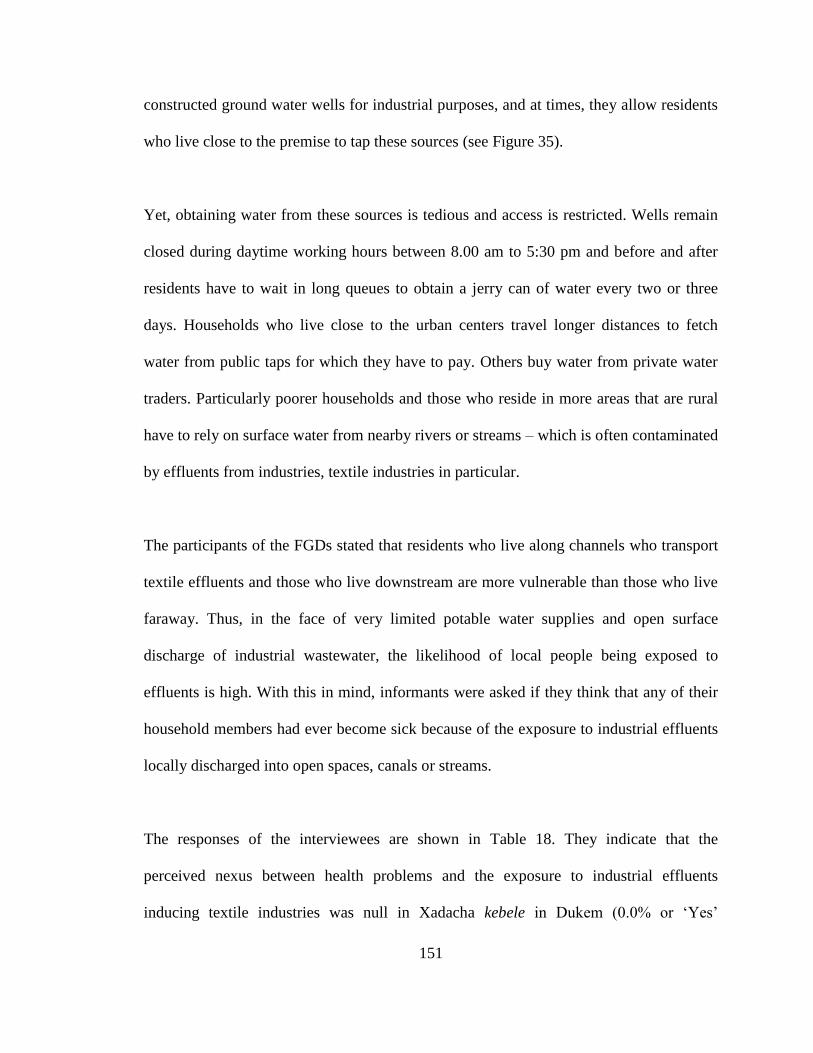
151
constructed ground water wells for industrial purposes, and at times, they allow residents
who live close to the premise to tap these sources (see Figure 35).
Yet, obtaining water from these sources is tedious and access is restricted. Wells remain
closed during daytime working hours between 8.00 am to 5:30 pm and before and after
residents have to wait in long queues to obtain a jerry can of water every two or three
days. Households who live close to the urban centers travel longer distances to fetch
water from public taps for which they have to pay. Others buy water from private water
traders. Particularly poorer households and those who reside in more areas that are rural
have to rely on surface water from nearby rivers or streams – which is often contaminated
by effluents from industries, textile industries in particular.
The participants of the FGDs stated that residents who live along channels who transport
textile effluents and those who live downstream are more vulnerable than those who live
faraway. Thus, in the face of very limited potable water supplies and open surface
discharge of industrial wastewater, the likelihood of local people being exposed to
effluents is high. With this in mind, informants were asked if they think that any of their
household members had ever become sick because of the exposure to industrial effluents
locally discharged into open spaces, canals or streams.
The responses of the interviewees are shown in Table 18. They indicate that the
perceived nexus between health problems and the exposure to industrial effluents
inducing textile industries was null in Xadacha kebele in Dukem (0.0% or ‗Yes‘
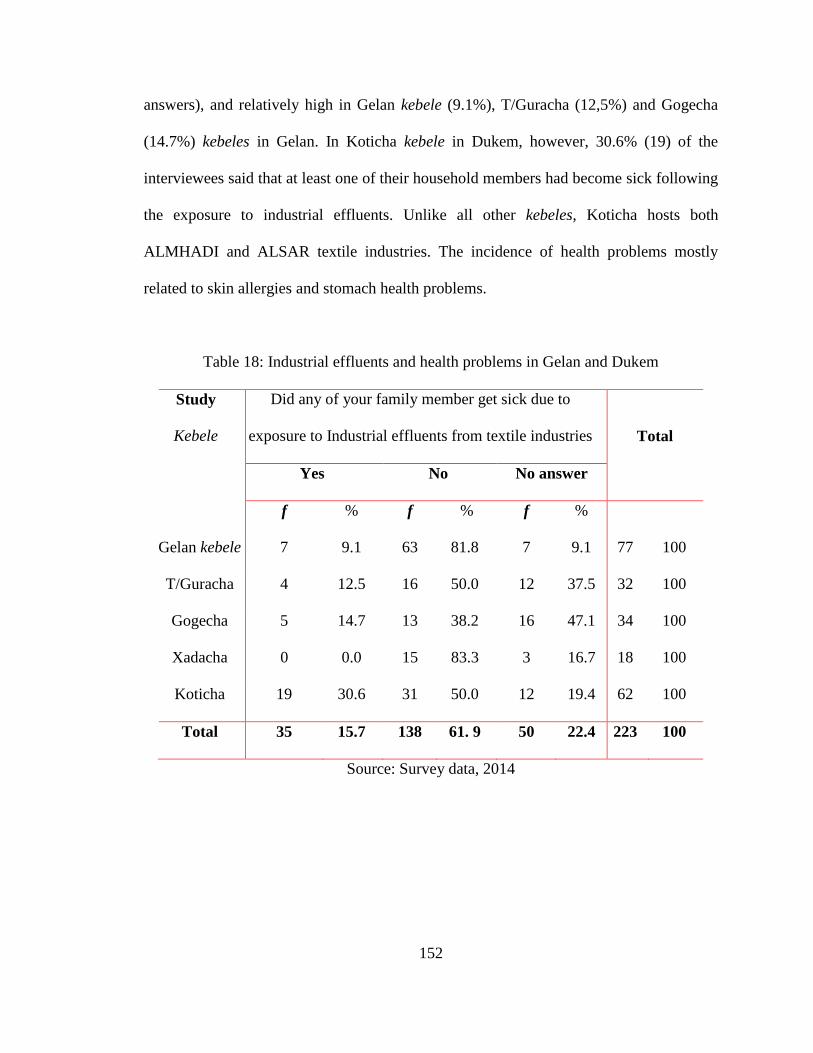
152
answers), and relatively high in Gelan kebele (9.1%), T/Guracha (12,5%) and Gogecha
(14.7%) kebeles in Gelan. In Koticha kebele in Dukem, however, 30.6% (19) of the
interviewees said that at least one of their household members had become sick following
the exposure to industrial effluents. Unlike all other kebeles, Koticha hosts both
ALMHADI and ALSAR textile industries. The incidence of health problems mostly
related to skin allergies and stomach health problems.
Table 18: Industrial effluents and health problems in Gelan and Dukem
Study
Kebele
Did any of your family member get sick due to
exposure to Industrial effluents from textile industries
Total
Yes No No answer
f % f % f %
Gelan kebele 7 9.1 63 81.8 7 9.1 77 100
T/Guracha 4 12.5 16 50.0 12 37.5 32 100
Gogecha 5 14.7 13 38.2 16 47.1 34 100
Xadacha 0 0.0 15 83.3 3 16.7 18 100
Koticha 19 30.6 31 50.0 12 19.4 62 100
Total 35 15.7 138 61. 9 50 22.4 223 100
Source: Survey data, 2014
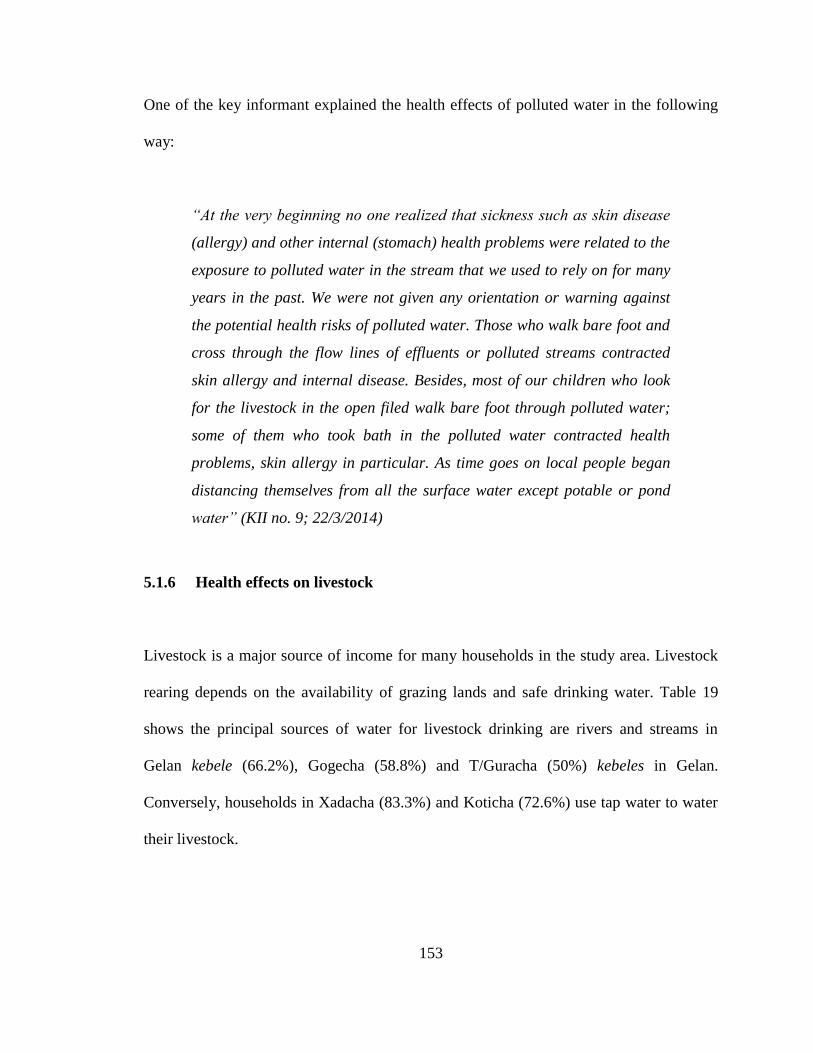
153
One of the key informant explained the health effects of polluted water in the following
way:
“At the very beginning no one realized that sickness such as skin disease
(allergy) and other internal (stomach) health problems were related to the
exposure to polluted water in the stream that we used to rely on for many
years in the past. We were not given any orientation or warning against
the potential health risks of polluted water. Those who walk bare foot and
cross through the flow lines of effluents or polluted streams contracted
skin allergy and internal disease. Besides, most of our children who look
for the livestock in the open filed walk bare foot through polluted water;
some of them who took bath in the polluted water contracted health
problems, skin allergy in particular. As time goes on local people began
distancing themselves from all the surface water except potable or pond
water” (KII no. 9; 22/3/2014)
5.1.6 Health effects on livestock
Livestock is a major source of income for many households in the study area. Livestock
rearing depends on the availability of grazing lands and safe drinking water. Table 19
shows the principal sources of water for livestock drinking are rivers and streams in
Gelan kebele (66.2%), Gogecha (58.8%) and T/Guracha (50%) kebeles in Gelan.
Conversely, households in Xadacha (83.3%) and Koticha (72.6%) use tap water to water
their livestock.
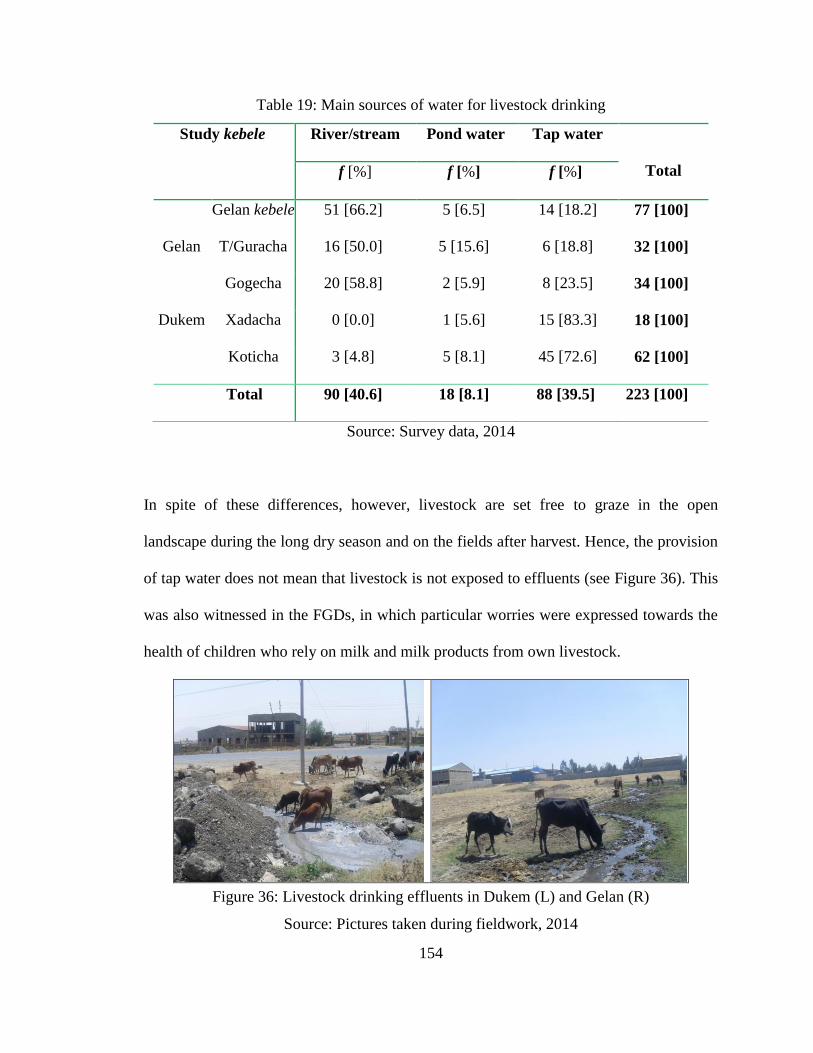
154
Table 19: Main sources of water for livestock drinking
Study kebele
River/stream Pond water Tap water
Total f [%] f [%] f [%]
Gelan
Gelan kebele 51 [66.2] 5 [6.5] 14 [18.2] 77 [100]
T/Guracha 16 [50.0] 5 [15.6] 6 [18.8] 32 [100]
Dukem
Gogecha 20 [58.8] 2 [5.9] 8 [23.5] 34 [100]
Xadacha 0 [0.0] 1 [5.6] 15 [83.3] 18 [100]
Koticha 3 [4.8] 5 [8.1] 45 [72.6] 62 [100]
Total 90 [40.6] 18 [8.1] 88 [39.5] 223 [100]
Source: Survey data, 2014
In spite of these differences, however, livestock are set free to graze in the open
landscape during the long dry season and on the fields after harvest. Hence, the provision
of tap water does not mean that livestock is not exposed to effluents (see Figure 36). This
was also witnessed in the FGDs, in which particular worries were expressed towards the
health of children who rely on milk and milk products from own livestock.
Figure 36: Livestock drinking effluents in Dukem (L) and Gelan (R)
Source: Pictures taken during fieldwork, 2014
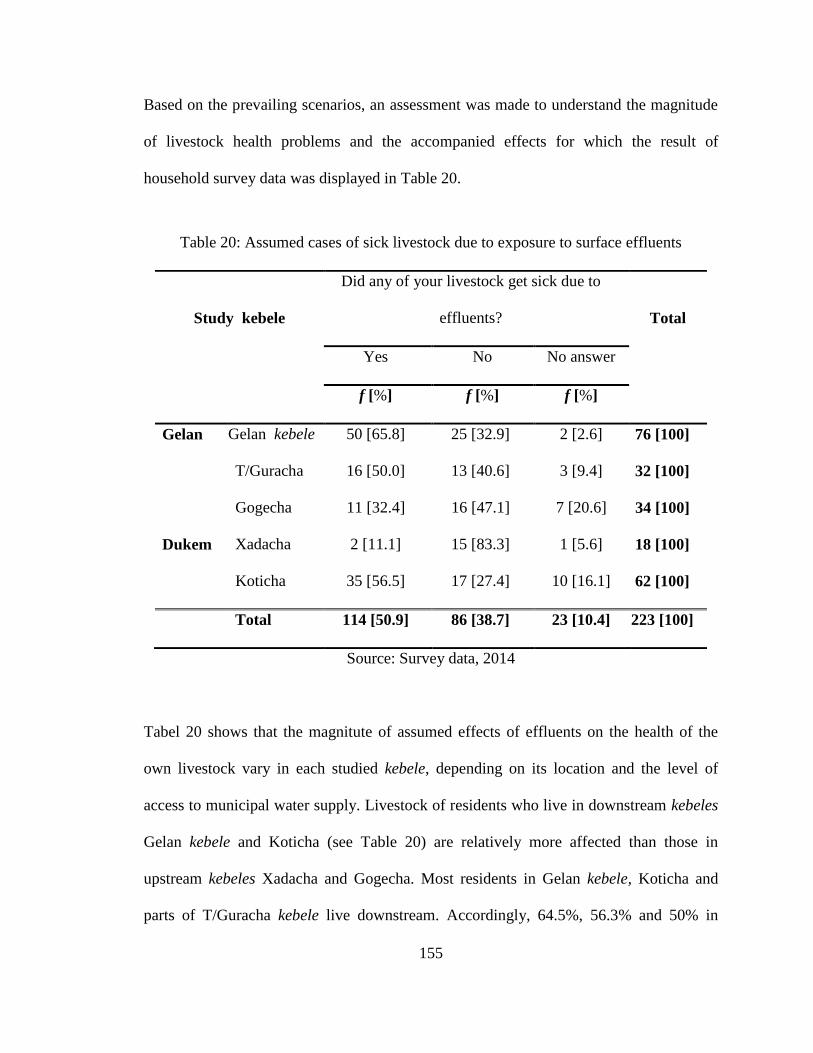
155
Based on the prevailing scenarios, an assessment was made to understand the magnitude
of livestock health problems and the accompanied effects for which the result of
household survey data was displayed in Table 20.
Table 20: Assumed cases of sick livestock due to exposure to surface effluents
Source: Survey data, 2014
Tabel 20 shows that the magnitute of assumed effects of effluents on the health of the
own livestock vary in each studied kebele, depending on its location and the level of
access to municipal water supply. Livestock of residents who live in downstream kebeles
Gelan kebele and Koticha (see Table 20) are relatively more affected than those in
upstream kebeles Xadacha and Gogecha. Most residents in Gelan kebele, Koticha and
parts of T/Guracha kebele live downstream. Accordingly, 64.5%, 56.3% and 50% in
Study kebele
Did any of your livestock get sick due to
effluents?
Total
Yes No No answer
f [%] f [%] f [%]
Gelan
Gelan kebele 50 [65.8] 25 [32.9] 2 [2.6] 76 [100]
T/Guracha 16 [50.0] 13 [40.6] 3 [9.4] 32 [100]
Dukem
Gogecha
Xadacha
11 [32.4] 16 [47.1] 7 [20.6] 34 [100]
2 [11.1] 15 [83.3] 1 [5.6] 18 [100]
Koticha 35 [56.5] 17 [27.4] 10 [16.1] 62 [100]
Total 114 [50.9] 86 [38.7] 23 [10.4] 223 [100]
156
Gelan kebele, Koticha and T/Guracha kebeles reported cases of sick livestock compared
to 11.1% and 32.4% in Xadacha and Gogecha kebele.
In order to assess the sources of water for livestock and livestock health condition at
kebele level, a Chi-Square test was conducted and the results shows that there is a link
between the location of the study kebeles and the sickness of livestock: (Χ2 = 122.45, df
= 6, P < 0.05) .
In order to identify the livestock types that are more vulnerable to health problems
assumed to be due to polluted water, informants were asked to give their reflection from
their past experiences. Accordingly, of the five livestock categories considered in this
study (cattle, donkey, horse, sheep and goat) cattle were identified as most vulnerable
followed by donkey in all study kebeles. Furthermore, in an expert interview, a
veterinarian expressed his view on the nexus between livestock sicknesses and effluents
as follows:
―Generally, microorganisms, pathogens are known for causing human or
livestock health problems and that some of the effluents discharged from
industries hold high amounts of organic loads: textile, food and beverage,
tannery, etc. The presence of high organic loads amounts to the presence
of microorganisms (aerobic/anaerobic) that survive by decomposing
organic loads. Therefore, the use of water infected with pathogens means
high risks of contracting disease by the livestock. Based on this fact, most
of the livestock that were brought to the veterinary clinics for treatment
were diagnosed for bacterial infections mainly “Salmonella”. Based on
157
our recorded data, more cases were reported for cattle and donkeys than
other livestock which were in fact much less in number among the
livestock types owned by most households” (Expert Interview no. 8;
12/05/2014).
The role of livestock for the livelihoods of households in the study area is immense.
Therefore, their long lasting sickness or even death can easily disrupt the economic
situation of a household.
5.1.7 Economic costs of human and livestock treatments
5.1.7.1 Cost of medical treatment for a family member
Section 6.1.7.1 shows the perceived nexus between human health problems and industrial
effluents in the study area. Upon this backdrop, this section shows the estimated costs a
household might pay for a medical treatment at a kebele health post that is needed due to
the exposure to industrial effluents. The mean costs for a treatment for a sick person were
more or less similar in Gelan (5.9 US$) and Dukem (4.0 US$) (see Table 21). Based on
the interviews made with drug dealers in Gelan and Dukem, the lowest costs arise when
sick persons purchase ‗Paracetamol‘ (also called ―pain-killer‖) to get relieve from his/her
ache or from an itching skin due to skin alleger. In extreme cases, however, a patient may
pay total costs up to 11.5 US$ (and Dukem) and 15 US$ (in Gelan) respectively (see
Table 21).
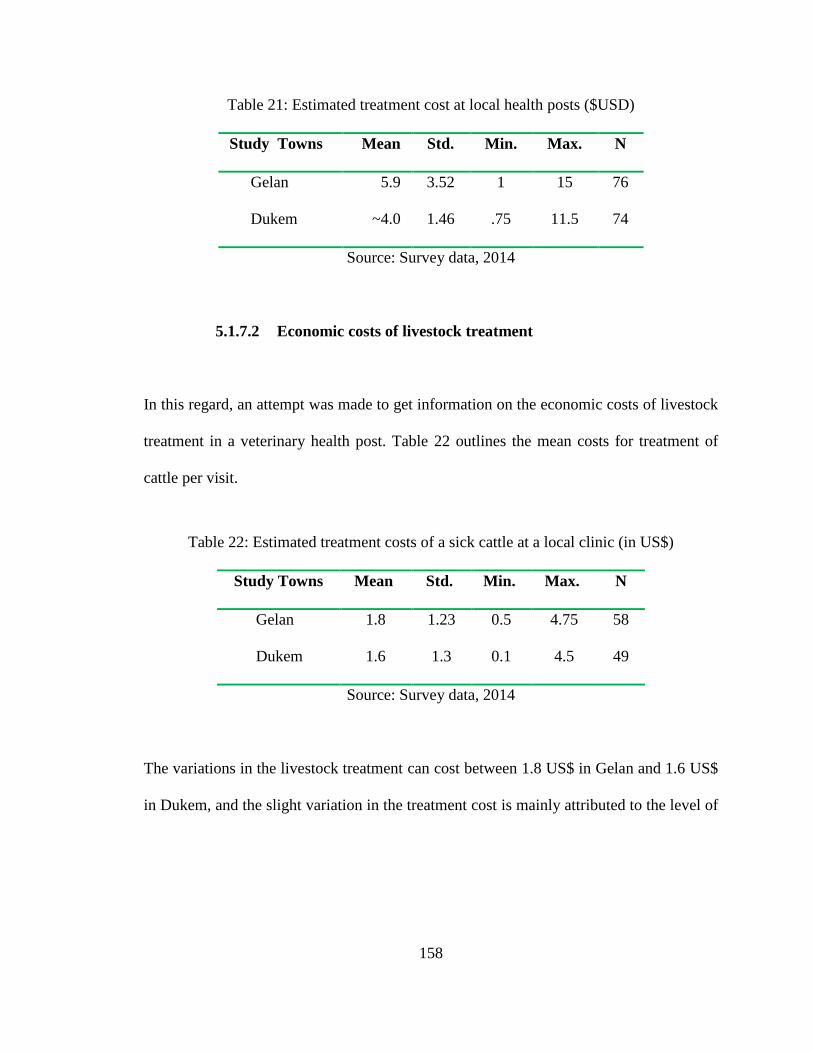
158
Table 21: Estimated treatment cost at local health posts ($USD)
Study Towns Mean Std. Min. Max. N
Gelan
Dukem
5.9 3.52 1 15 76
~4.0 1.46 .75 11.5 74
Source: Survey data, 2014
5.1.7.2 Economic costs of livestock treatment
In this regard, an attempt was made to get information on the economic costs of livestock
treatment in a veterinary health post. Table 22 outlines the mean costs for treatment of
cattle per visit.
Table 22: Estimated treatment costs of a sick cattle at a local clinic (in US$)
Study Towns Mean Std. Min. Max. N
Gelan
Dukem
1.8 1.23 0.5 4.75 58
1.6 1.3 0.1 4.5 49
Source: Survey data, 2014
The variations in the livestock treatment can cost between 1.8 US$ in Gelan and 1.6 US$
in Dukem, and the slight variation in the treatment cost is mainly attributed to the level of
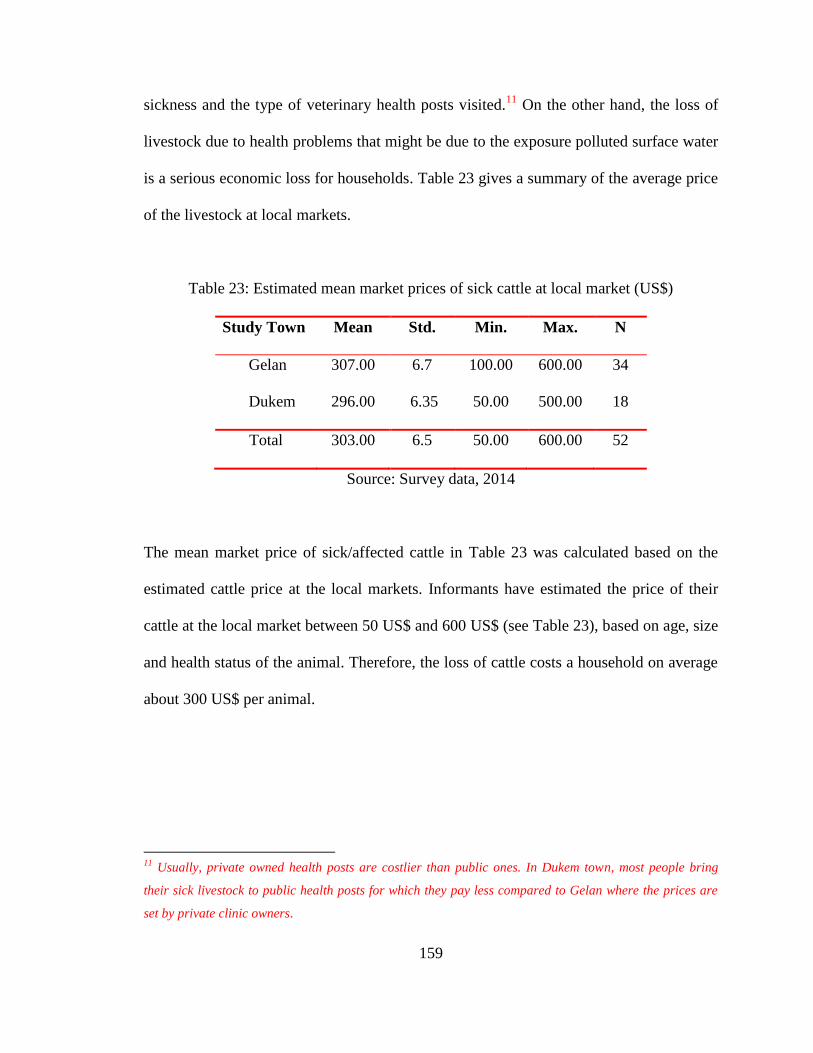
159
sickness and the type of veterinary health posts visited.11
On the other hand, the loss of
livestock due to health problems that might be due to the exposure polluted surface water
is a serious economic loss for households. Table 23 gives a summary of the average price
of the livestock at local markets.
Table 23: Estimated mean market prices of sick cattle at local market (US$)
Study Town Mean Std. Min. Max. N
Gelan 307.00 6.7 100.00 600.00 34
Dukem 296.00 6.35 50.00 500.00 18
Total 303.00 6.5 50.00 600.00 52
Source: Survey data, 2014
The mean market price of sick/affected cattle in Table 23 was calculated based on the
estimated cattle price at the local markets. Informants have estimated the price of their
cattle at the local market between 50 US$ and 600 US$ (see Table 23), based on age, size
and health status of the animal. Therefore, the loss of cattle costs a household on average
about 300 US$ per animal.
11
Usually, private owned health posts are costlier than public ones. In Dukem town, most people bring
their sick livestock to public health posts for which they pay less compared to Gelan where the prices are
set by private clinic owners.
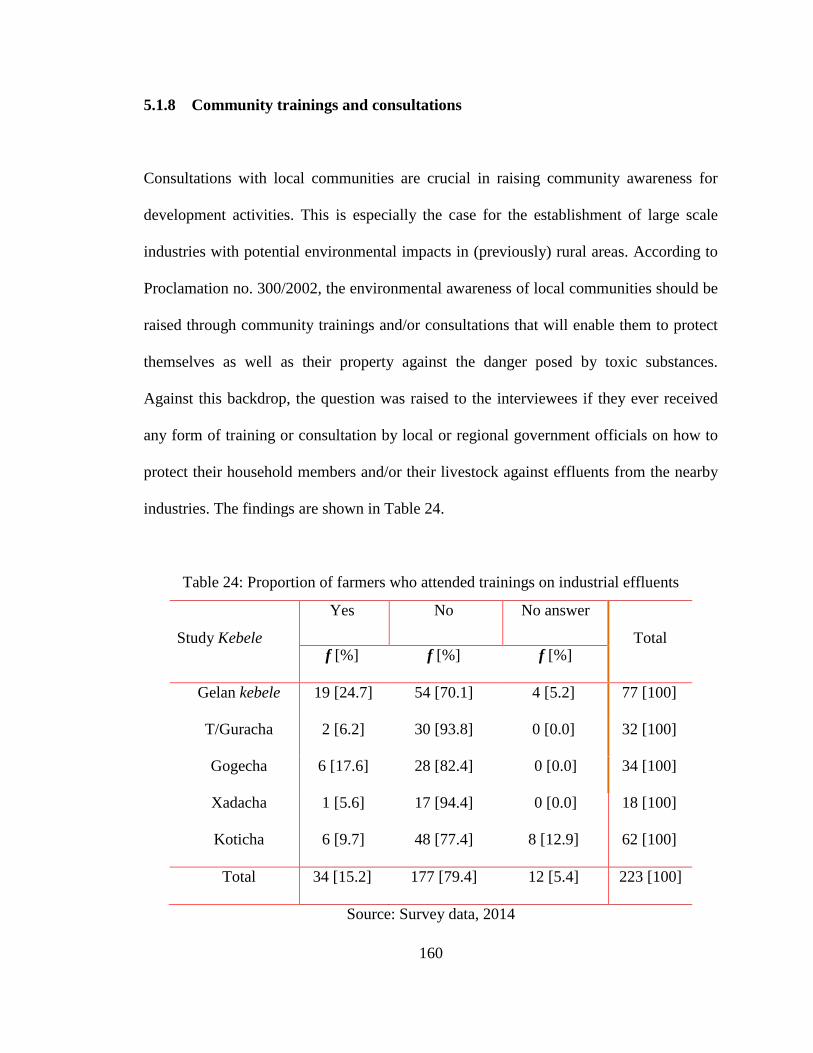
160
5.1.8 Community trainings and consultations
Consultations with local communities are crucial in raising community awareness for
development activities. This is especially the case for the establishment of large scale
industries with potential environmental impacts in (previously) rural areas. According to
Proclamation no. 300/2002, the environmental awareness of local communities should be
raised through community trainings and/or consultations that will enable them to protect
themselves as well as their property against the danger posed by toxic substances.
Against this backdrop, the question was raised to the interviewees if they ever received
any form of training or consultation by local or regional government officials on how to
protect their household members and/or their livestock against effluents from the nearby
industries. The findings are shown in Table 24.
Table 24: Proportion of farmers who attended trainings on industrial effluents
Study Kebele
Yes No No answer
Total f [%] f [%] f [%]
Gelan kebele 19 [24.7] 54 [70.1] 4 [5.2] 77 [100]
T/Guracha 2 [6.2] 30 [93.8] 0 [0.0] 32 [100]
Gogecha 6 [17.6] 28 [82.4] 0 [0.0] 34 [100]
Xadacha 1 [5.6] 17 [94.4] 0 [0.0] 18 [100]
Koticha 6 [9.7] 48 [77.4] 8 [12.9] 62 [100]
Total 34 [15.2] 177 [79.4] 12 [5.4] 223 [100]
Source: Survey data, 2014
161
It is evident from Table 24 that the large majority of the respondents (79.4%) did not
receive any form of information, trainings and/or consultation on industrial effluents at
all. This is an astonishingly high figure, in the faces of the widespread discharge of
effluents into the open environment in the area, 15.2% of the interviewees reported that
they received information on the potential harm caused by the industrial effluents.
I had also raised a question to for an expert in the department of environmental protection
unit of each town to verify whether or not any of the responsible offices (e.g.
environmental protection unit) had organized community awareness creation training or
consultation on the dangers of certain type industrial wastes. The reflections of the
expertise of both towns are more or less the same and that, their response was: ―No, not
at all‖. According to the explanation of these interviewees, organizing such issues are not
considered as relevant for the fact that some line officials consider it ―waking up the
communities on the investors‖. The purpose of limiting community based awareness
creation on the danger of exposure to industrial wastes could cause (i.e. solid and/or
liquid), is likely to avoid any action that might discourage investors, which covertly
means protecting them from installing waste storage and disposal/treatment plants that
incur unnecessary costs on them, or causes them abandon their project.
On this basis, the appointment of the environmental protection office is on the level of a
political commitment and not by holding the required minimum knowledge and skills on
the issue. For instance, of the three staff members assigned to the department of
environmental unit as an environmental expert in Dukem, one of them studied law and
162
mathematics that have nothing to do with the technical aspects of industry, industrial
wastes or the basic knowhow on pollutants and their characteristics. One of the staff
members who studied law was assigned the head of the office in Dukem, while an ex-
police officer was assigned to head the environmental unit in Gelan. According to the
interviewee, they are not willing to allow any of us do any action or raise any idea
(including those outlined in the legal tools) that would ‗disappoint‘ investors, their
activities and the government policy is to attract as many investors as they can.
5.1.9 Management and monitoring of the quality of local environment
In order to facilitate the protection of the environment for the reasons stipulated in the
Ethiopian Federal Constitution under Article 44 (1) and 92 (1 & 2) on the one-hand and
to promote the sustainable use of natural resources for economic growth, the
Environmental Protection Organ (EPO) was established in 2002 by Proclamation no.
295/2002. The main objective of establishing the EPO was to assign a responsible
institution that formulates environmental policies, strategies, laws and standards that
assist the implementation of environmental protection. According to the same
proclamation, the environmental protection institution is also responsible in promoting
the sustainable use of scarce natural resources in a manner that fosters social and
economic development
On this basis, Article 14 and 15 of the Proclamation No.295/2002, all sectors and regions
in Ethiopia were entitled to establish their respective environmental protection unit and
163
agencies respectively. Accordingly, Environmental Protection Offices were established at
regional, zonal, woreda and kebele levels. Yet, realizing environmental protection and
promoting suitable economic growth is greatly influenced by the level of implementation
of the legal tools and the quality of human expertise assigned to the offices.
According to Article 8 (1) of the Pollution control Proclamation no. 300/2002,
environmental inspectors working at the woreda levels holds the mandate to enter into
any land or premises in their administrational unit at any time to ensure the compliance of
the projects or firms with the environmental standards outlined. Regarding the technical
aspects of environmental inspection, environmental inspectors are also allowed to take
samples of any material and carry out or cause to be carried out tests to determine
whether or not it causes harm to humans and/or the environment. Based on the
information captured during field inspections or based on the results of a test, inspectors
shall order corrective measures to be taken; or could order the immediate cessation of the
activity.
In the case study area, there were five environmental inspectors all together at the time of
this study (i.e. 2 in Gelan and 3 in Dukem) assigned to carry out the inspection activities.
One of the inspectors in Gelan was a police officer by profession but was assigned to the
position by the authority as an environmental expert. The second inspector in Gelan holds
an educational background in urban management. In Dukem; one environmental
inspector had a degree in geography and environmental studies while the other one
studied law and mathematics.
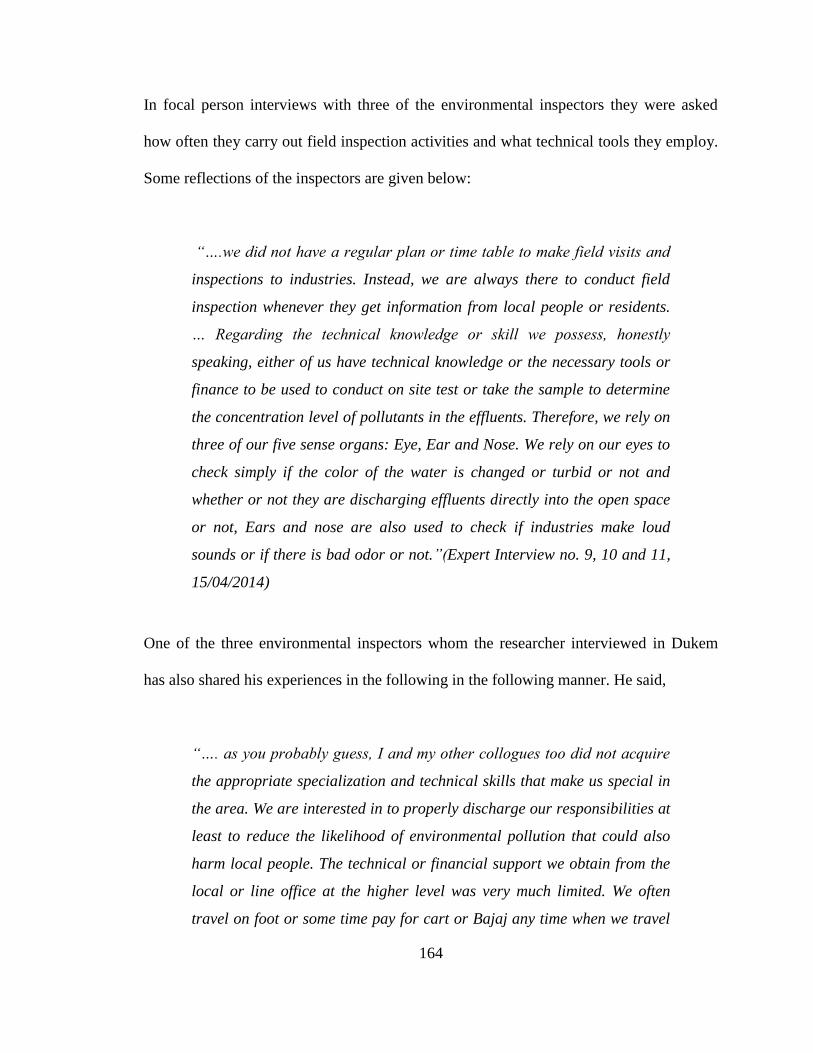
164
In focal person interviews with three of the environmental inspectors they were asked
how often they carry out field inspection activities and what technical tools they employ.
Some reflections of the inspectors are given below:
“….we did not have a regular plan or time table to make field visits and
inspections to industries. Instead, we are always there to conduct field
inspection whenever they get information from local people or residents.
… Regarding the technical knowledge or skill we possess, honestly
speaking, either of us have technical knowledge or the necessary tools or
finance to be used to conduct on site test or take the sample to determine
the concentration level of pollutants in the effluents. Therefore, we rely on
three of our five sense organs: Eye, Ear and Nose. We rely on our eyes to
check simply if the color of the water is changed or turbid or not and
whether or not they are discharging effluents directly into the open space
or not, Ears and nose are also used to check if industries make loud
sounds or if there is bad odor or not.”(Expert Interview no. 9, 10 and 11,
15/04/2014)
One of the three environmental inspectors whom the researcher interviewed in Dukem
has also shared his experiences in the following in the following manner. He said,
“…. as you probably guess, I and my other collogues too did not acquire
the appropriate specialization and technical skills that make us special in
the area. We are interested in to properly discharge our responsibilities at
least to reduce the likelihood of environmental pollution that could also
harm local people. The technical or financial support we obtain from the
local or line office at the higher level was very much limited. We often
travel on foot or some time pay for cart or Bajaj any time when we travel
165
to sites for inspection. Regarding the technical skill or facilities used to
take measurements of the waste, we have nothing to rely on and therefore
we make inspection visually by looking at the volume and color of the
effluents discharged…” (Expert Interview no. 9, no. 10 and no. 11,
25/3/2014)
The interviewed environmental inspectors were also asked about the administrative
support and backing they receive from different levels of the line higher officials. The
responses obtained from both respondents were very similar. In spite of the legal tools in
place and the strong official promotion for a sustainable use of natural resources at
various platforms, the actual implementation on the ground is very limited. Officials were
less attracted to the strict interferences of environmental inspectors or other
environmentally concerned stakeholders, but rather try to avoid any activities that could
go against the interests of current or potential future investors.
166
6 CHAPTER SEVEN: The main livelihood strategies adopted in order
to cope with the negative outcomes of agricultural land
expropriation
6.1 Introduction
Livelihood assessment is a way of looking at how an individual, a household or a
community behaves under certain specific conditions. One of the ways that assists in
understanding the livelihood systems is to analyze the coping and adaptive strategies
pursued by individuals and communities as a response to external shocks and stresses.
Studies by Watt (1983), Dessalegn (1988), Davis (1996) and Yared (1999) discussed
coping and adaptation strategies as the short-term or long-term strategies employed
overwhelmingly by the affected rural households as a way out to bring a secure means of
livelihood conditions. On this basis, this section covers coping and adaptation strategies
developed by the affected household to the new situation.
Ellis (2000) discusses livelihood strategies as any activities that generate the means of
household survival. In the present study, the overwhelming majority of the study
populations were used to earn their livelihood incomes entirely from agricultural
activities, mainly farming. These sources of livelihood incomes were greatly eroded
following the introduction of investment activities, as a result of which, local farmers
were forced to break their attachments to their farmlands. Generally, anthropogenic
factors are the main driving forces for the declining in the household livelihood incomes
167
in the study areas (i.e. government policy of industrial developments and the
unsustainable conversion of large scale ALs). Hence, this section tried to understand the
‗coping‘ and ‗adaptive‘ strategies being employed by affected people in the study area.
6.2 Coping and Adaptation Strategies of the affected households
Given the loss of farmland, household informants were asked to share the strategies
pursued as an alternative means of livelihood sources. The intention of generating
information on the livelihood strategies was partly hoping to understand if the current
strategy is a reliable option to address household food security in the short-term and
partly whether or not the preferred strategy is realistic options that will enable them
restore a secure livelihood for the long-term. The experiences of the informants and their
reflections are displayed in Table 25.
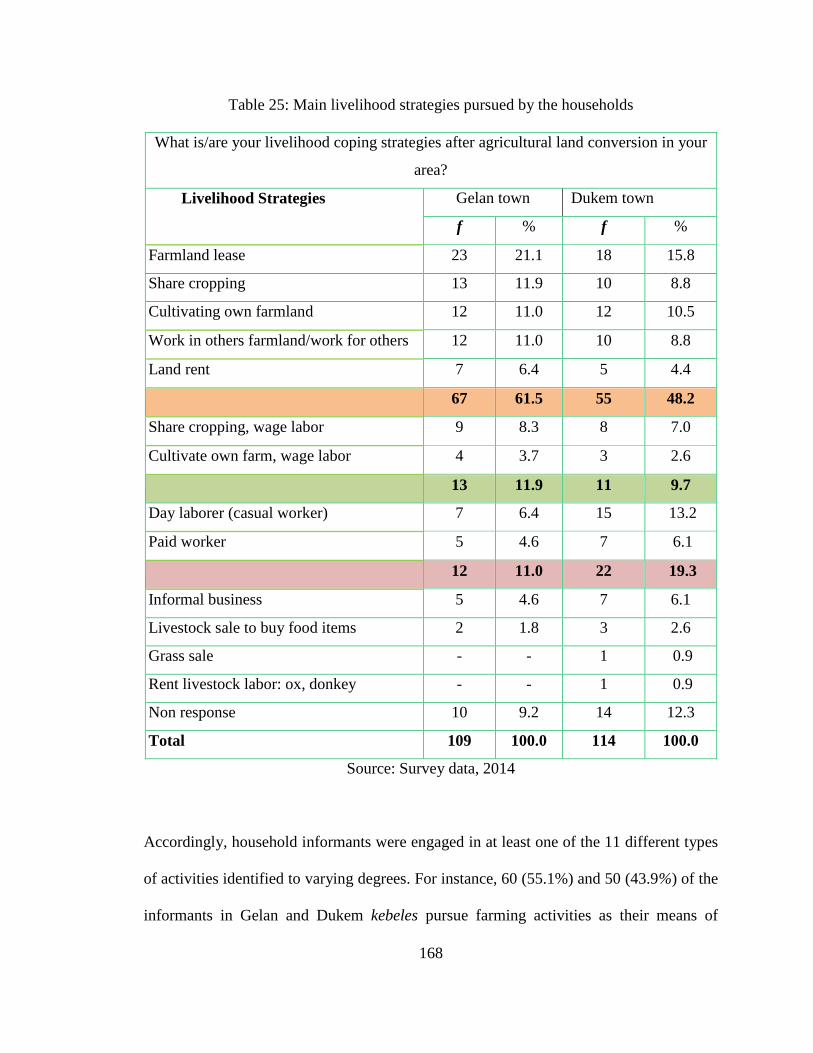
168
Table 25: Main livelihood strategies pursued by the households
What is/are your livelihood coping strategies after agricultural land conversion in your
area?
Livelihood Strategies Gelan town Dukem town
f % f %
Farmland lease 23 21.1 18 15.8
Share cropping 13 11.9 10 8.8
Cultivating own farmland 12 11.0 12 10.5
Work in others farmland/work for others 12 11.0 10 8.8
Land rent 7 6.4 5 4.4
67 61.5 55 48.2
Share cropping, wage labor 9 8.3 8 7.0
Cultivate own farm, wage labor 4 3.7 3 2.6
13 11.9 11 9.7
Day laborer (casual worker) 7 6.4 15 13.2
Paid worker 5 4.6 7 6.1
12 11.0 22 19.3
Informal business 5 4.6 7 6.1
Livestock sale to buy food items 2 1.8 3 2.6
Grass sale - - 1 0.9
Rent livestock labor: ox, donkey - - 1 0.9
Non response 10 9.2 14 12.3
Total 109 100.0 114 100.0
Source: Survey data, 2014
Accordingly, household informants were engaged in at least one of the 11 different types
of activities identified to varying degrees. For instance, 60 (55.1%) and 50 (43.9%) of the
informants in Gelan and Dukem kebeles pursue farming activities as their means of
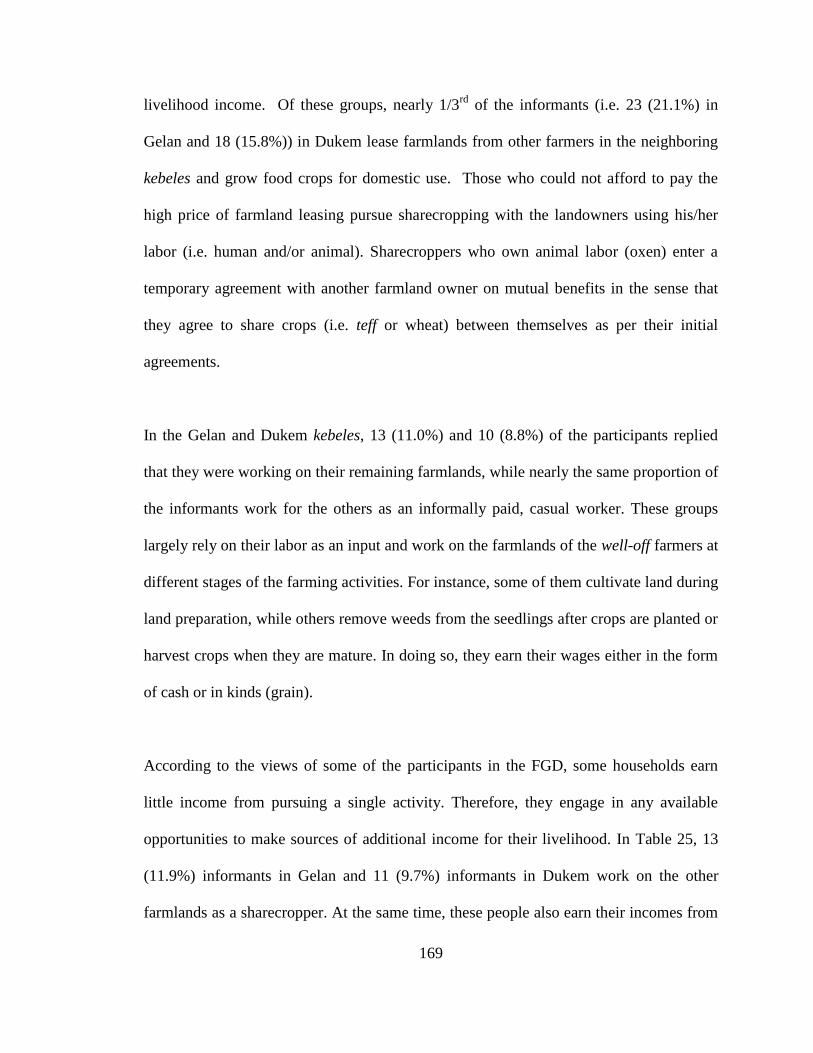
169
livelihood income. Of these groups, nearly 1/3rd
of the informants (i.e. 23 (21.1%) in
Gelan and 18 (15.8%)) in Dukem lease farmlands from other farmers in the neighboring
kebeles and grow food crops for domestic use. Those who could not afford to pay the
high price of farmland leasing pursue sharecropping with the landowners using his/her
labor (i.e. human and/or animal). Sharecroppers who own animal labor (oxen) enter a
temporary agreement with another farmland owner on mutual benefits in the sense that
they agree to share crops (i.e. teff or wheat) between themselves as per their initial
agreements.
In the Gelan and Dukem kebeles, 13 (11.0%) and 10 (8.8%) of the participants replied
that they were working on their remaining farmlands, while nearly the same proportion of
the informants work for the others as an informally paid, casual worker. These groups
largely rely on their labor as an input and work on the farmlands of the well-off farmers at
different stages of the farming activities. For instance, some of them cultivate land during
land preparation, while others remove weeds from the seedlings after crops are planted or
harvest crops when they are mature. In doing so, they earn their wages either in the form
of cash or in kinds (grain).
According to the views of some of the participants in the FGD, some households earn
little income from pursuing a single activity. Therefore, they engage in any available
opportunities to make sources of additional income for their livelihood. In Table 25, 13
(11.9%) informants in Gelan and 11 (9.7%) informants in Dukem work on the other
farmlands as a sharecropper. At the same time, these people also earn their incomes from
170
‗off-farm‟ employment opportunities as a causal/wage labor when he/she is ‗off-duty‟ on
the farming job. This is generally known as an attempt of diversifying sources of
livelihood income so that the aggregate daily or monthly income would help them meet
the household basic demands, including food requirements.
The numbers of the households driving their incomes from the wage labor were higher in
Dukem kebeles (i.e. 15 (13.2%)) than the number of households involved in the same
activity in Gelan (i.e. 7 (6.4%)) in 2012/13. It was also possible to learn from the data
shown in Table 25 that most of the informants were earning their livelihood incomes
from the ‗casual work‘ and ‗low paying formal jobs‘ (i.e. most of them gate/property
keepers (see Table 27).
Apart from pursuing ‗farming‘ or ‗off-farm‘ activities as a livelihood strategy to farmland
loss, a handful of the informants involved in the ‗informal business‟ activities as their
livelihood strategies. Figure 37 shows the number of households who pursue ‗informal
businesses‟ as a coping strategy. In the pictures below, some farmers engaged in the sale
of ‗food and local drinks (i.e. farso12
or dadhi13
) for employees in the nearby factories or
casual workers (see Figure 37).
12
Locally brewed black, blue or semi while colored drink with relatively weak alcoholic content 13
Locally brewed yellow colored drink with relatively strong alcoholic content
171
Figure 37: Informal business as a livelihood strategy
Source: Taken during field work, 2014
Informants were further asked if the informal business owners could make enough money
or income or not, most of them replied ―NO‖. According to their explanation, more than
half of their customers are unemployed youth, some of the farmers are landless, who does
not have secure sources of income, and they could not visit them regularly. Most of the
interviewed informal business owners‘ reply that, they pursue this activity not to make
more money or profit, rather to generate some amount of money so that they could cover
some of the basic needs.
6.3 Employment and income diversification opportunities
As indicated earlier, one of the anticipated positive outcomes of rapid industrial
development is associated with the creation of employment opportunities for local
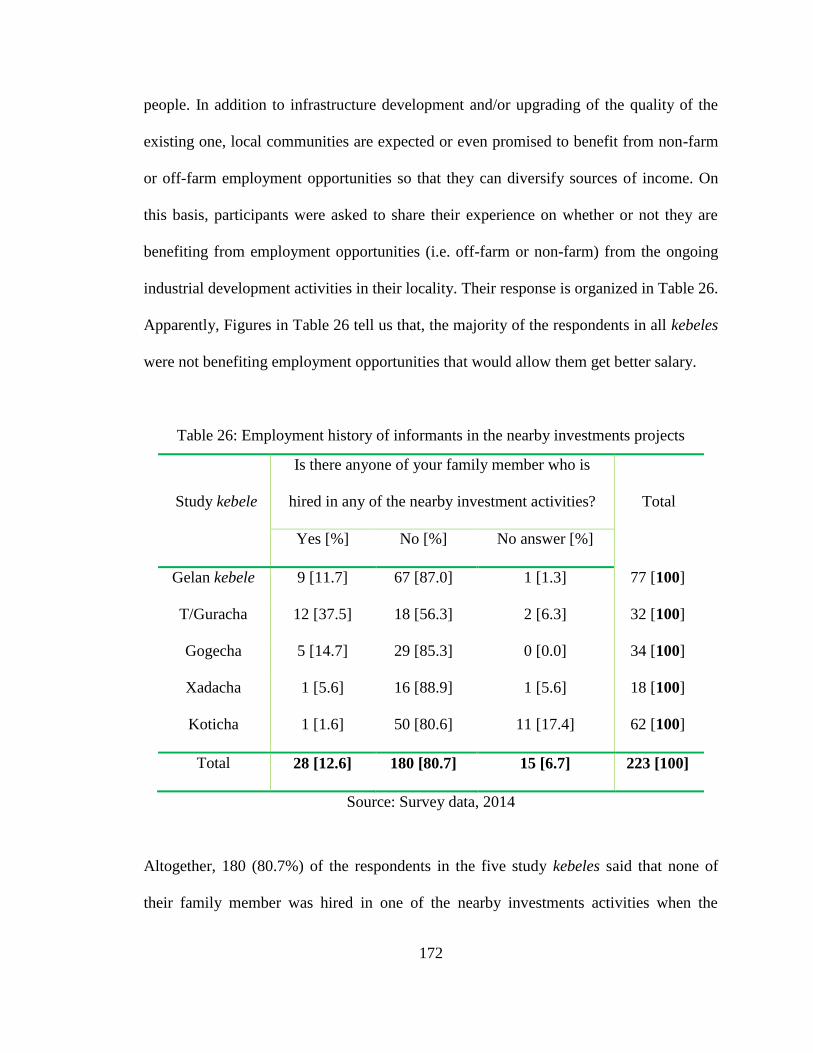
172
people. In addition to infrastructure development and/or upgrading of the quality of the
existing one, local communities are expected or even promised to benefit from non-farm
or off-farm employment opportunities so that they can diversify sources of income. On
this basis, participants were asked to share their experience on whether or not they are
benefiting from employment opportunities (i.e. off-farm or non-farm) from the ongoing
industrial development activities in their locality. Their response is organized in Table 26.
Apparently, Figures in Table 26 tell us that, the majority of the respondents in all kebeles
were not benefiting employment opportunities that would allow them get better salary.
Table 26: Employment history of informants in the nearby investments projects
Study kebele
Is there anyone of your family member who is
hired in any of the nearby investment activities?
Total
Yes [%] No [%] No answer [%]
Gelan kebele 9 [11.7] 67 [87.0] 1 [1.3] 77 [100]
T/Guracha 12 [37.5] 18 [56.3] 2 [6.3] 32 [100]
Gogecha 5 [14.7] 29 [85.3] 0 [0.0] 34 [100]
Xadacha 1 [5.6] 16 [88.9] 1 [5.6] 18 [100]
Koticha 1 [1.6] 50 [80.6] 11 [17.4] 62 [100]
Total 28 [12.6] 180 [80.7] 15 [6.7] 223 [100]
Source: Survey data, 2014
Altogether, 180 (80.7%) of the respondents in the five study kebeles said that none of
their family member was hired in one of the nearby investments activities when the
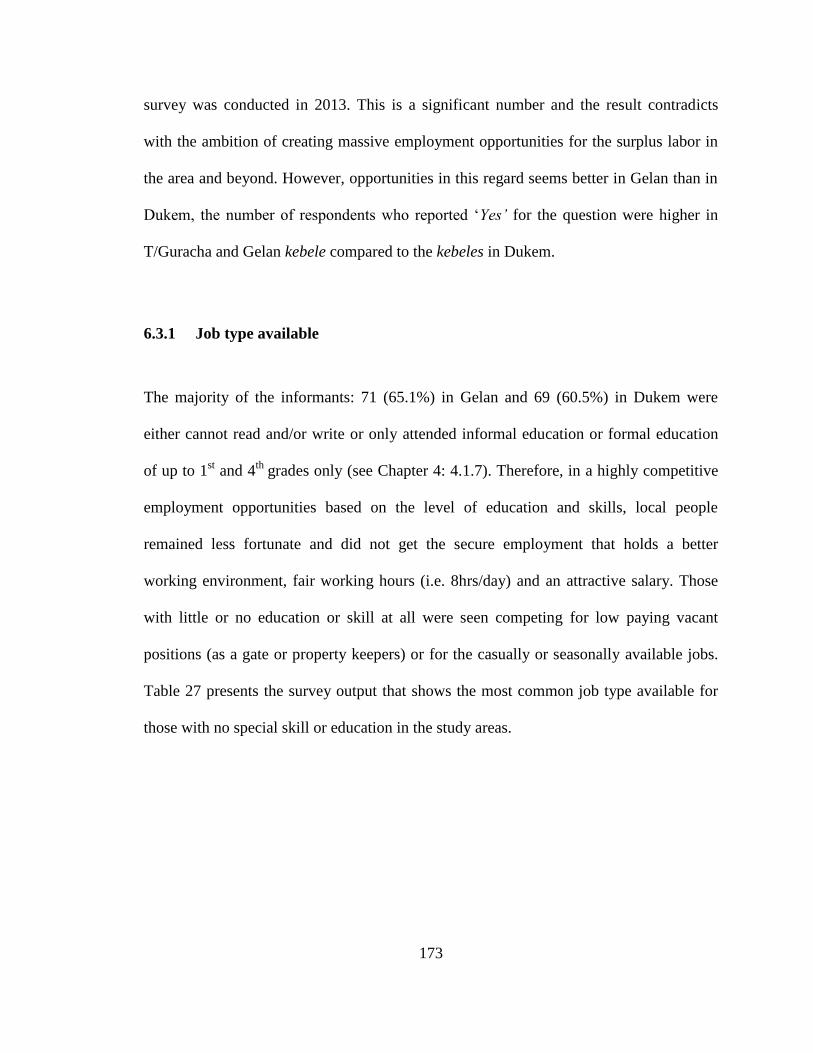
173
survey was conducted in 2013. This is a significant number and the result contradicts
with the ambition of creating massive employment opportunities for the surplus labor in
the area and beyond. However, opportunities in this regard seems better in Gelan than in
Dukem, the number of respondents who reported ‗Yes‟ for the question were higher in
T/Guracha and Gelan kebele compared to the kebeles in Dukem.
6.3.1 Job type available
The majority of the informants: 71 (65.1%) in Gelan and 69 (60.5%) in Dukem were
either cannot read and/or write or only attended informal education or formal education
of up to 1st and 4
th grades only (see Chapter 4: 4.1.7). Therefore, in a highly competitive
employment opportunities based on the level of education and skills, local people
remained less fortunate and did not get the secure employment that holds a better
working environment, fair working hours (i.e. 8hrs/day) and an attractive salary. Those
with little or no education or skill at all were seen competing for low paying vacant
positions (as a gate or property keepers) or for the casually or seasonally available jobs.
Table 27 presents the survey output that shows the most common job type available for
those with no special skill or education in the study areas.
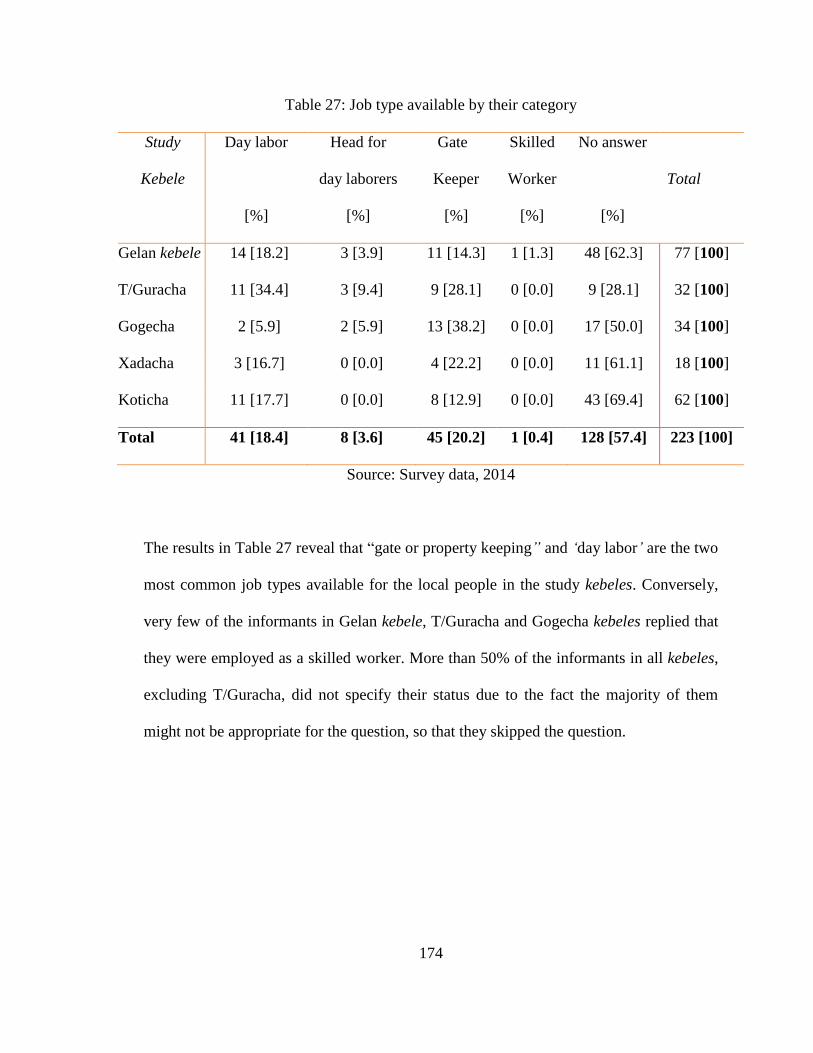
174
Table 27: Job type available by their category
Study
Kebele
Day labor
[%]
Head for
day laborers
[%]
Gate
Keeper
[%]
Skilled
Worker
[%]
No answer
[%]
Total
Gelan kebele 14 [18.2] 3 [3.9] 11 [14.3] 1 [1.3] 48 [62.3] 77 [100]
T/Guracha 11 [34.4] 3 [9.4] 9 [28.1] 0 [0.0] 9 [28.1] 32 [100]
Gogecha 2 [5.9] 2 [5.9] 13 [38.2] 0 [0.0] 17 [50.0] 34 [100]
Xadacha 3 [16.7] 0 [0.0] 4 [22.2] 0 [0.0] 11 [61.1] 18 [100]
Koticha 11 [17.7] 0 [0.0] 8 [12.9] 0 [0.0] 43 [69.4] 62 [100]
Total 41 [18.4] 8 [3.6] 45 [20.2] 1 [0.4] 128 [57.4] 223 [100]
Source: Survey data, 2014
The results in Table 27 reveal that ―gate or property keeping” and „day labor‟ are the two
most common job types available for the local people in the study kebeles. Conversely,
very few of the informants in Gelan kebele, T/Guracha and Gogecha kebeles replied that
they were employed as a skilled worker. More than 50% of the informants in all kebeles,
excluding T/Guracha, did not specify their status due to the fact the majority of them
might not be appropriate for the question, so that they skipped the question.
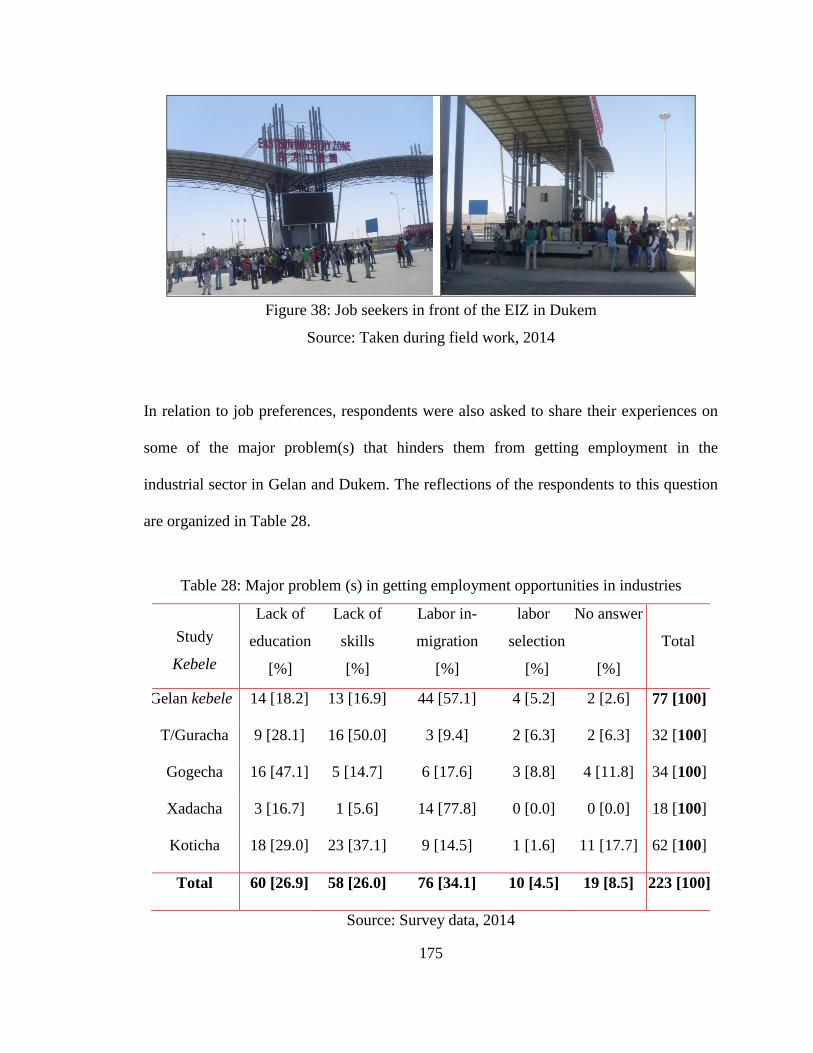
175
Figure 38: Job seekers in front of the EIZ in Dukem
Source: Taken during field work, 2014
In relation to job preferences, respondents were also asked to share their experiences on
some of the major problem(s) that hinders them from getting employment in the
industrial sector in Gelan and Dukem. The reflections of the respondents to this question
are organized in Table 28.
Table 28: Major problem (s) in getting employment opportunities in industries
Study
Kebele
Lack of
education
[%]
Lack of
skills
[%]
Labor in-
migration
[%]
labor
selection
[%]
No answer
[%]
Total
Gelan kebele 14 [18.2] 13 [16.9] 44 [57.1] 4 [5.2] 2 [2.6] 77 [100]
T/Guracha 9 [28.1] 16 [50.0] 3 [9.4] 2 [6.3] 2 [6.3] 32 [100]
Gogecha 16 [47.1] 5 [14.7] 6 [17.6] 3 [8.8] 4 [11.8] 34 [100]
Xadacha 3 [16.7] 1 [5.6] 14 [77.8] 0 [0.0] 0 [0.0] 18 [100]
Koticha 18 [29.0] 23 [37.1] 9 [14.5] 1 [1.6] 11 [17.7] 62 [100]
Total 60 [26.9] 58 [26.0] 76 [34.1] 10 [4.5] 19 [8.5] 223 [100]
Source: Survey data, 2014
176
Table 28 shows that there are multiple factors related to getting employment
opportunities in the industrial sector in the study areas. Of these reasons, in-migration by
surplus migrant workers - 76 (34.1%), lack of formal education - 60 (26.9%) and skills -
58 (26.0%) were identified as the most problematic factors. At the study kebele level,
however, the sequences of these major problems were different. For the majority of
respondents in Gelan kebele, 44 (57.1%) and Xadacha, 14 (77.8%), labor in-migration
was identified by far stronger problem than in the other kebeles
On the other hand, for 14 (18.2%) in Gelan kebele, 16 (47.1%) in Gogecha and 18 (29%)
in Koticha kebele, the lack of education was the main limit while lack of any skill
remained the main limit to seek employment in the industries. Therefore, they were
forced to look for employment opportunities that are less competitive or need no working
skills at all.
6.3.2 Amount of salary or wage
In connection with the employment opportunities, an attempt was made to understand the
amount of salary or wage paid to those locals who were employed in industries in Gelan
and Dukem (see Table 29).
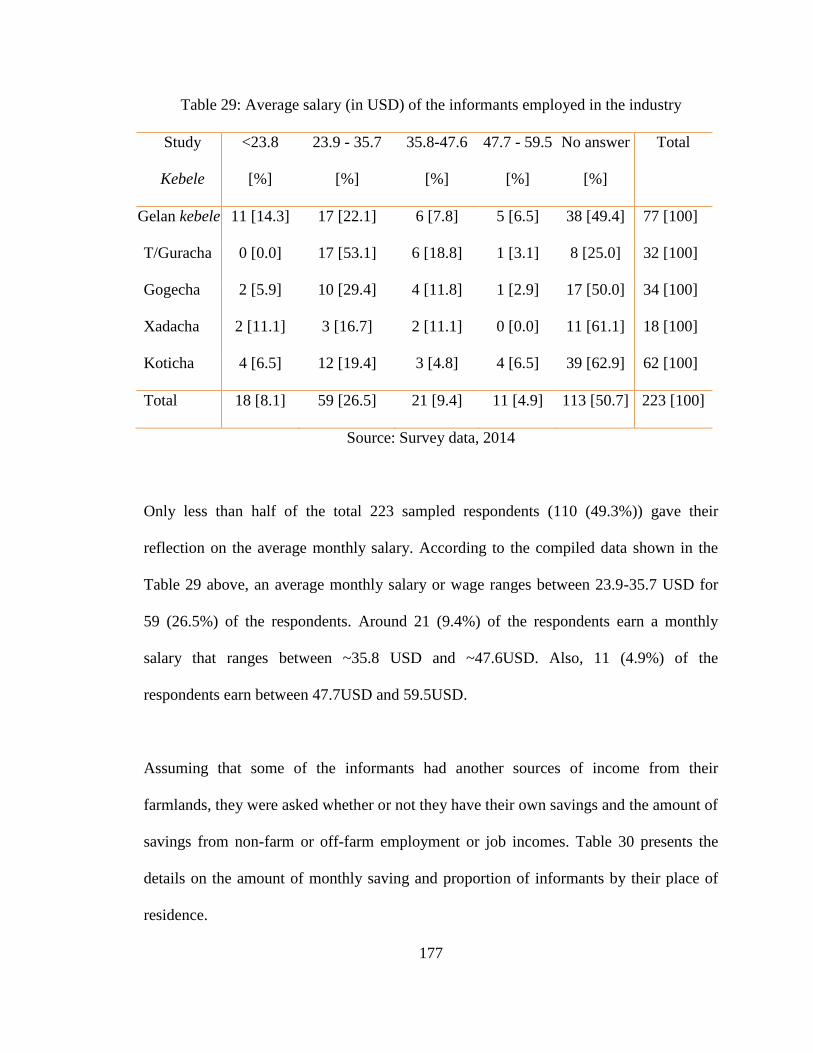
177
Table 29: Average salary (in USD) of the informants employed in the industry
Study
Kebele
<23.8
[%]
23.9 - 35.7
[%]
35.8-47.6
[%]
47.7 - 59.5
[%]
No answer
[%]
Total
Gelan kebele 11 [14.3] 17 [22.1] 6 [7.8] 5 [6.5] 38 [49.4] 77 [100]
T/Guracha 0 [0.0] 17 [53.1] 6 [18.8] 1 [3.1] 8 [25.0] 32 [100]
Gogecha 2 [5.9] 10 [29.4] 4 [11.8] 1 [2.9] 17 [50.0] 34 [100]
Xadacha 2 [11.1] 3 [16.7] 2 [11.1] 0 [0.0] 11 [61.1] 18 [100]
Koticha 4 [6.5] 12 [19.4] 3 [4.8] 4 [6.5] 39 [62.9] 62 [100]
Total 18 [8.1] 59 [26.5] 21 [9.4] 11 [4.9] 113 [50.7] 223 [100]
Source: Survey data, 2014
Only less than half of the total 223 sampled respondents (110 (49.3%)) gave their
reflection on the average monthly salary. According to the compiled data shown in the
Table 29 above, an average monthly salary or wage ranges between 23.9-35.7 USD for
59 (26.5%) of the respondents. Around 21 (9.4%) of the respondents earn a monthly
salary that ranges between ~35.8 USD and ~47.6USD. Also, 11 (4.9%) of the
respondents earn between 47.7USD and 59.5USD.
Assuming that some of the informants had another sources of income from their
farmlands, they were asked whether or not they have their own savings and the amount of
savings from non-farm or off-farm employment or job incomes. Table 30 presents the
details on the amount of monthly saving and proportion of informants by their place of
residence.
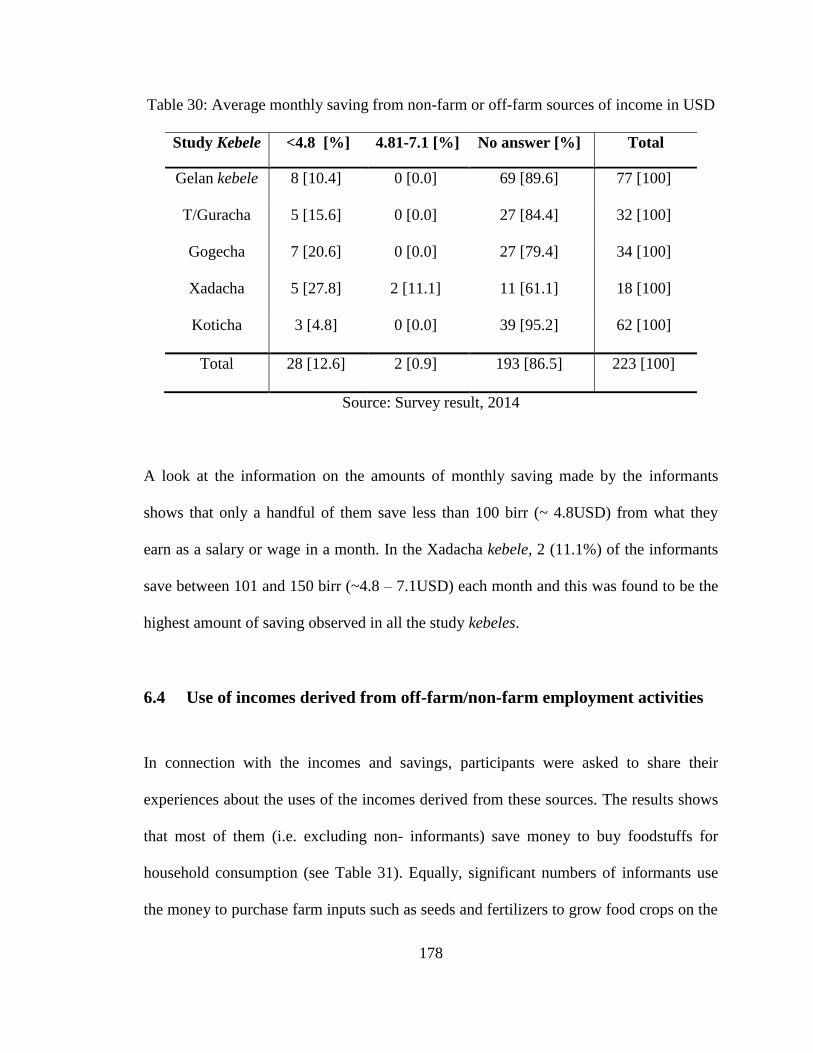
178
Table 30: Average monthly saving from non-farm or off-farm sources of income in USD
Study Kebele <4.8 [%] 4.81-7.1 [%] No answer [%] Total
Gelan kebele 8 [10.4] 0 [0.0] 69 [89.6] 77 [100]
T/Guracha 5 [15.6] 0 [0.0] 27 [84.4] 32 [100]
Gogecha 7 [20.6] 0 [0.0] 27 [79.4] 34 [100]
Xadacha 5 [27.8] 2 [11.1] 11 [61.1] 18 [100]
Koticha 3 [4.8] 0 [0.0] 39 [95.2] 62 [100]
Total 28 [12.6] 2 [0.9] 193 [86.5] 223 [100]
Source: Survey result, 2014
A look at the information on the amounts of monthly saving made by the informants
shows that only a handful of them save less than 100 birr (~ 4.8USD) from what they
earn as a salary or wage in a month. In the Xadacha kebele, 2 (11.1%) of the informants
save between 101 and 150 birr (~4.8 – 7.1USD) each month and this was found to be the
highest amount of saving observed in all the study kebeles.
6.4 Use of incomes derived from off-farm/non-farm employment activities
In connection with the incomes and savings, participants were asked to share their
experiences about the uses of the incomes derived from these sources. The results shows
that most of them (i.e. excluding non- informants) save money to buy foodstuffs for
household consumption (see Table 31). Equally, significant numbers of informants use
the money to purchase farm inputs such as seeds and fertilizers to grow food crops on the
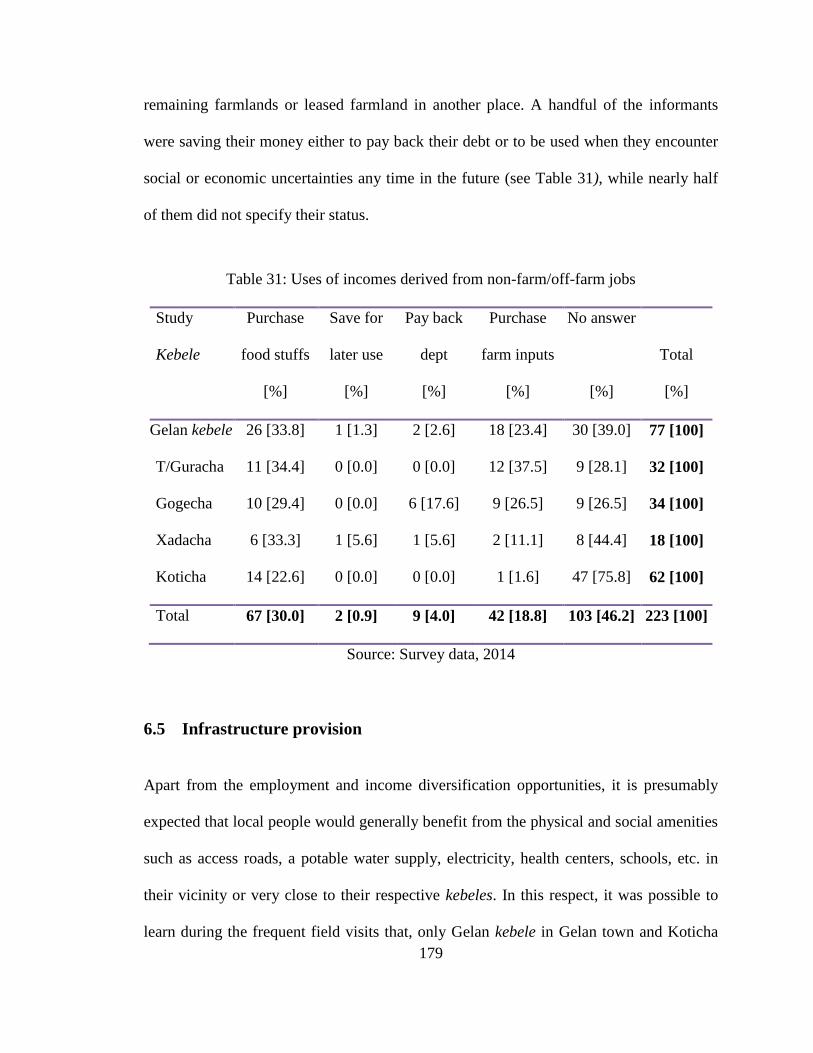
179
remaining farmlands or leased farmland in another place. A handful of the informants
were saving their money either to pay back their debt or to be used when they encounter
social or economic uncertainties any time in the future (see Table 31), while nearly half
of them did not specify their status.
Table 31: Uses of incomes derived from non-farm/off-farm jobs
Study
Kebele
Purchase
food stuffs
[%]
Save for
later use
[%]
Pay back
dept
[%]
Purchase
farm inputs
[%]
No answer
[%]
Total
[%]
Gelan kebele 26 [33.8] 1 [1.3] 2 [2.6] 18 [23.4] 30 [39.0] 77 [100]
T/Guracha 11 [34.4] 0 [0.0] 0 [0.0] 12 [37.5] 9 [28.1] 32 [100]
Gogecha 10 [29.4] 0 [0.0] 6 [17.6] 9 [26.5] 9 [26.5] 34 [100]
Xadacha 6 [33.3] 1 [5.6] 1 [5.6] 2 [11.1] 8 [44.4] 18 [100]
Koticha 14 [22.6] 0 [0.0] 0 [0.0] 1 [1.6] 47 [75.8] 62 [100]
Total 67 [30.0] 2 [0.9] 9 [4.0] 42 [18.8] 103 [46.2] 223 [100]
Source: Survey data, 2014
6.5 Infrastructure provision
Apart from the employment and income diversification opportunities, it is presumably
expected that local people would generally benefit from the physical and social amenities
such as access roads, a potable water supply, electricity, health centers, schools, etc. in
their vicinity or very close to their respective kebeles. In this respect, it was possible to
learn during the frequent field visits that, only Gelan kebele in Gelan town and Koticha
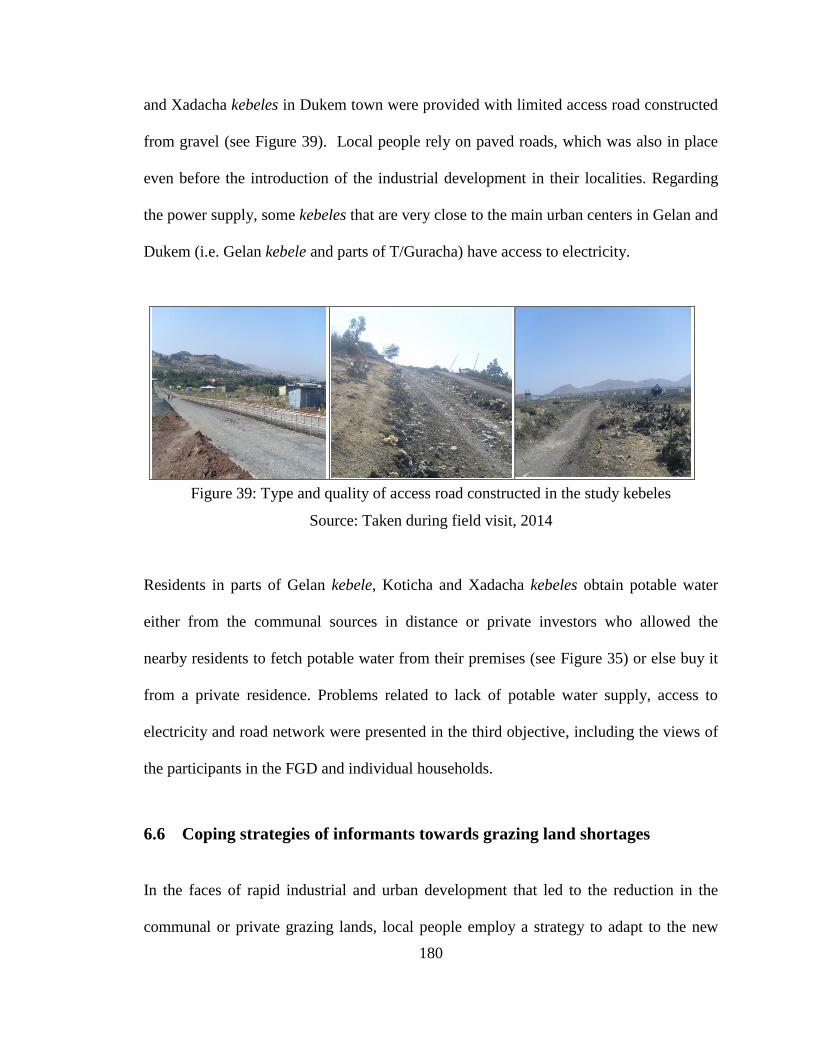
180
and Xadacha kebeles in Dukem town were provided with limited access road constructed
from gravel (see Figure 39). Local people rely on paved roads, which was also in place
even before the introduction of the industrial development in their localities. Regarding
the power supply, some kebeles that are very close to the main urban centers in Gelan and
Dukem (i.e. Gelan kebele and parts of T/Guracha) have access to electricity.
Figure 39: Type and quality of access road constructed in the study kebeles
Source: Taken during field visit, 2014
Residents in parts of Gelan kebele, Koticha and Xadacha kebeles obtain potable water
either from the communal sources in distance or private investors who allowed the
nearby residents to fetch potable water from their premises (see Figure 35) or else buy it
from a private residence. Problems related to lack of potable water supply, access to
electricity and road network were presented in the third objective, including the views of
the participants in the FGD and individual households.
6.6 Coping strategies of informants towards grazing land shortages
In the faces of rapid industrial and urban development that led to the reduction in the
communal or private grazing lands, local people employ a strategy to adapt to the new
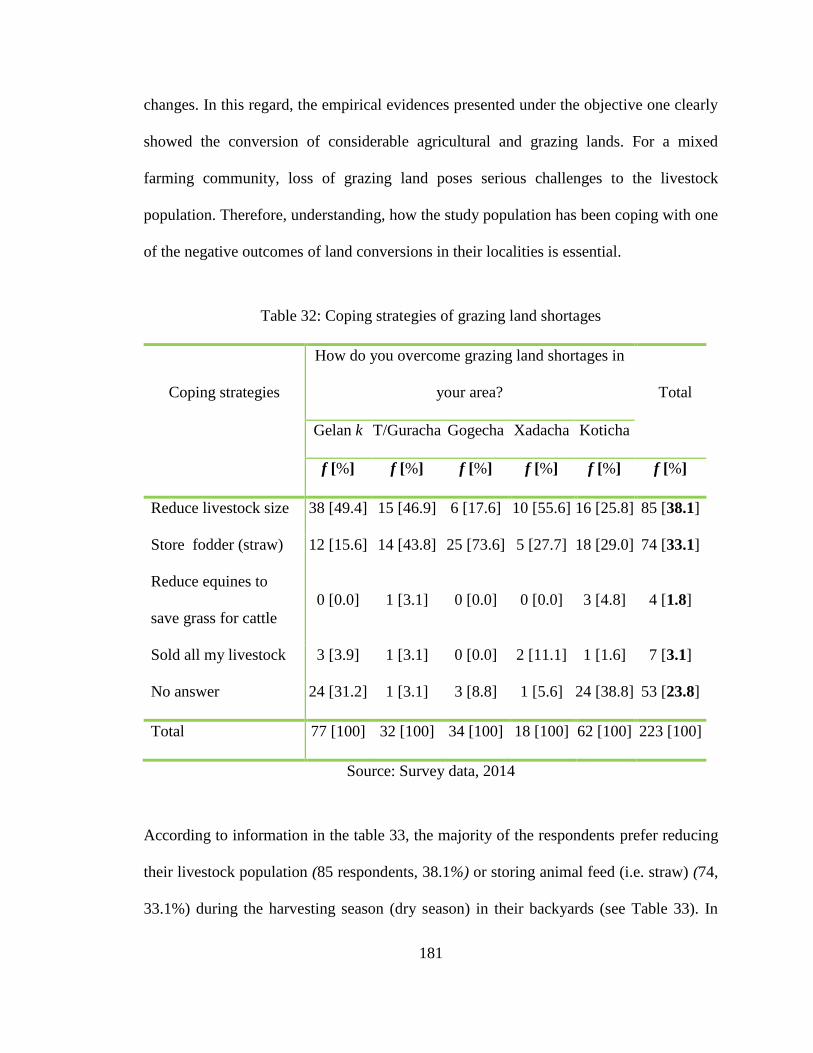
181
changes. In this regard, the empirical evidences presented under the objective one clearly
showed the conversion of considerable agricultural and grazing lands. For a mixed
farming community, loss of grazing land poses serious challenges to the livestock
population. Therefore, understanding, how the study population has been coping with one
of the negative outcomes of land conversions in their localities is essential.
Table 32: Coping strategies of grazing land shortages
Coping strategies
How do you overcome grazing land shortages in
your area?
Total
Gelan k T/Guracha Gogecha Xadacha Koticha
f [%] f [%] f [%] f [%] f [%] f [%]
Reduce livestock size 38 [49.4] 15 [46.9] 6 [17.6] 10 [55.6] 16 [25.8] 85 [38.1]
Store fodder (straw) 12 [15.6] 14 [43.8] 25 [73.6] 5 [27.7] 18 [29.0] 74 [33.1]
Reduce equines to
save grass for cattle
0 [0.0] 1 [3.1] 0 [0.0] 0 [0.0] 3 [4.8] 4 [1.8]
Sold all my livestock 3 [3.9] 1 [3.1] 0 [0.0] 2 [11.1] 1 [1.6] 7 [3.1]
No answer 24 [31.2] 1 [3.1] 3 [8.8] 1 [5.6] 24 [38.8] 53 [23.8]
Total 77 [100] 32 [100] 34 [100] 18 [100] 62 [100] 223 [100]
Source: Survey data, 2014
According to information in the table 33, the majority of the respondents prefer reducing
their livestock population (85 respondents, 38.1%) or storing animal feed (i.e. straw) (74,
33.1%) during the harvesting season (dry season) in their backyards (see Table 33). In
182
Gelan kebele (38 respondents (49.4%)), T/Guracha (15 respondents (46.9%)) and
Xadacha (10 respondents (55.6%)), respondents‘ preference in coping with grazing land
shortage were addressed by reducing the number of their livestock, while those in
Gogecha (25 respondents (73.6%)) and Koticha (18 respondents (29.0%)) rely on storing
‗straw‘ during the harvesting season.
Figure 40: Straw stored at the back yards in Gelan (L) and Dukem (R)
Source: Taken during field visits, 2014
There was also another strategy developed by a handful of informants to respond to
grazing land scarcity and that was by reducing or excluding the number of equines (i.e.
horse, donkey or mules) from their livestock so that the pressure on limited private
grazing lands is addressed to a certain level (see Table 3). It was learnt from the views of
the participants that, farmers whose entire land holdings are expropriated often sell their
livestock. According to the FGD, some of these households shifted from ‗food
producers/suppliers‘ to ‗food buyers‘, or else changed from leading decent and
sustainable livelihoods, to a livelihood based on ‗food first‘ to meet the daily meal
required for their families.
183
6.7 Perception of farmers on the low development level of industries and the
promised ‘trickle-down’ effects
In the FGDs, people were asked about their perception regarding rapid industrial
expansion and the conversion of agricultural lands in the study areas. There was
consensus that most local people supported the industrialization program from the
beginning. They expected to benefit from the trickle-down effects of industrial
development, including additional income opportunities and improved infrastructure (e.g.
access to public water and electrical power supply). However, in the FDGs it was also
reported that after years, local people started to complain that many of the expected
benefits did not emerge, and the developments still do not seem to be moving in favor of
their expectations.
Many grievances were associated with the unexpectedly slow industrial development of
the converted lands. Informants complained that some of the buildings that were
constructed on previously agricultural land are already dilapidated and abandoned and
have become safe places where ―criminals‖ hide during the daytime. Equally, some of the
fenced lands reserved for industrial development attracted wild birds over the years,
especially ducks that feed on teff seed when it matures on the nearby farmland. A father
of 16 children who participated in the FGD said:
“I am very much worried about the fate of my children as most of the
converted lands are left undeveloped and the chance of getting
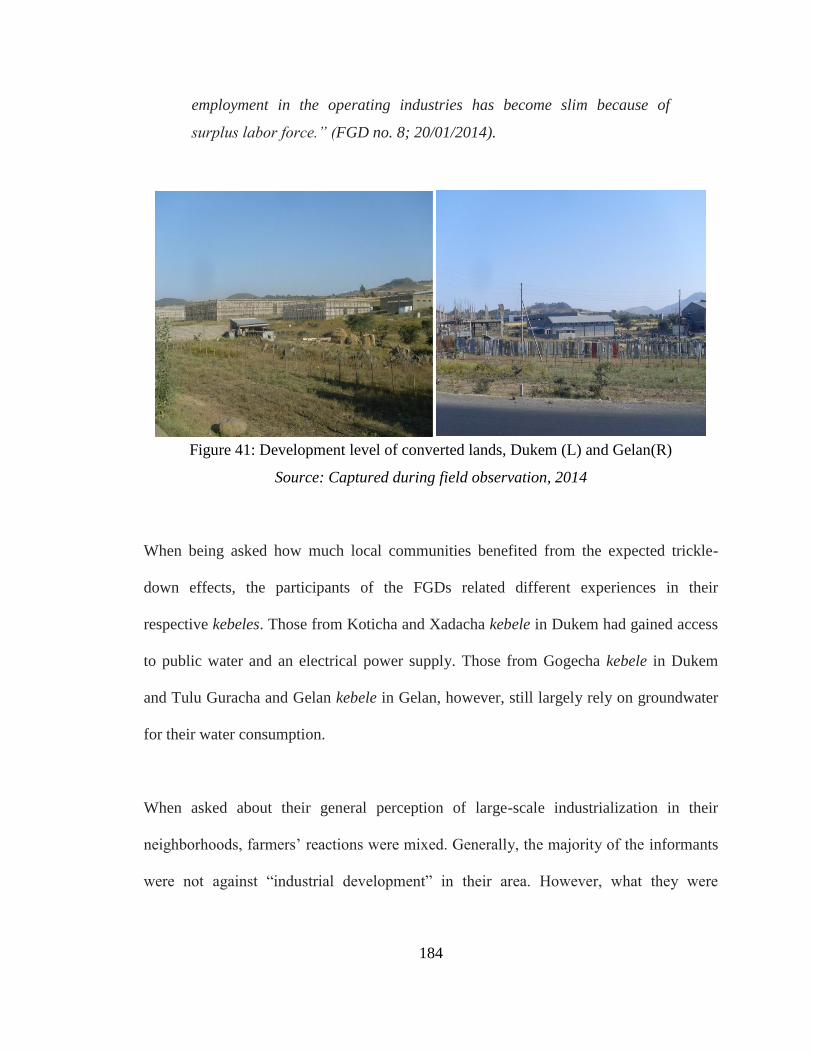
184
employment in the operating industries has become slim because of
surplus labor force.” (FGD no. 8; 20/01/2014).
Figure 41: Development level of converted lands, Dukem (L) and Gelan(R)
Source: Captured during field observation, 2014
When being asked how much local communities benefited from the expected trickle-
down effects, the participants of the FGDs related different experiences in their
respective kebeles. Those from Koticha and Xadacha kebele in Dukem had gained access
to public water and an electrical power supply. Those from Gogecha kebele in Dukem
and Tulu Guracha and Gelan kebele in Gelan, however, still largely rely on groundwater
for their water consumption.
When asked about their general perception of large-scale industrialization in their
neighborhoods, farmers‘ reactions were mixed. Generally, the majority of the informants
were not against ―industrial development‖ in their area. However, what they were
185
seriously concerned about was the loss of their farmlands. This is exemplified by the
words of one farmer who participated in the ―FGD‖ from the Xadacha kebele:
“We were born in the middle of farmlands in rural areas, grew up tilling
the land, and gave birth to children while working on our inherited
farmlands. Thus, for us loss of farmland is not only explained as a loss of
food, but also as a loss of our identity.” (FGD no. 7; 20/01/2014)
Farmers also expressed their skepticism as to the availability of employment
opportunities for them in the industrial sectors in the near future. They criticized the slow
industrial development of the converted lands. In this regard, one farmer from Tulu
Guracha kebele said:
“Our hope fades, and we have lost trust even in the developed lands, as
some of the operating industries have failed to meet their promises of
creating the proposed job opportunities. The salary of 25 US$/ month set
for those employed is not sufficient even to buy the food required by our
households.” (KII no. 8; 20/01/2014).
The perceptions of the local people as expressed during the FGDs are in some ways
mirrored in the official data. For instance, the largest investment project in Dukem, with
an investment capital of 350 million US$ and a land size of 250 ha, started with the goal
to generate employment opportunities for 46,000 people. However, six years later, at the
end of 2013, the total developed land was less than 20 ha (i.e. 8%) of the converted
farmland over a period 10 years. The EIZ planned to open employment opportunities for
up to 46,000 of the labor forces in its project plan, yet they were not even able to employ
186
10,000 people (i.e. 21.7%) in 2014, seven years after the IZ launched operation. This
contradicted the government‘s objective of using expropriated lands for ―better
development projects” by the private investors stipulated in the Proclamation no.
455/2005. The EIZ and many other similar projects kept large tracts of undeveloped land
vacant and idle for up to 10 years, yet protected them with fences so that local people
have been denied temporary access (i.e. until the land is developed) either to grow some
food crops/vegetables or use grasses for the starving livestock.
187
7 CHAPTER EIGHT: Discussion and Synthesis
7.1 Introduction
All over the world, although there are differences in land tenure related to land access,
land property and land use, agricultural land conversion has happened as the result of
socio –economic and political changes in the last centuries (Leblond, 2008). There has
also been large amounts agricultural land conversion in developing countries in their
efforts to transform from agricultural-based economies to industrial-based economies
(Barnett, 1991).
7.2 The processes of industrialization: Registration and Licensing
Studies indicate that agriculture is one of the single most dominant sectors that affect the
livelihoods and income of the greatest proportion of people on the surface of the Earth
(Ohlsson, 2000; Eija, 2006). At the same time, agricultural activities that are used to
make livelihoods are influenced by the availability and quality of the land: the scarcest
natural resources globally (Scherr, 2000; Liekens, et al., 2013).
The formal small-scale establishment of factories in Dukem and Gelan towns began as of
2005 following the deceleration of these towns as the hub for the manufacturing
industries in Oromia Region. One of the main problems associated with the registration
and granting of investment licenses and investment land at all levels of government
188
administration, was the absence of a mechanism to differentiate ‗real investors‘ from
‗speculative land dealers‘, lack of proper plans that could have allowed for coordination
as well as transparency among the line offices in the processes of registration and the
issuance of investment licenses. This led to the exhaustion of investment lands in the old
urbanized territory and initiated the sprawling of industrial developments into the
agricultural lands on the outskirts. The sporadic incursion of urban sprawl into
agricultural lands finally resulted in the Integration of six rural kebeles (i.e. three each)
under municipal town administrations of Dukem and Gelan.
In relation to the registration, licensing and granting of the converted lands, one problem
observed was the ambiguity and inconsistency of investment rules. According to
Proclamation No.147/2009, the responsibility for urban land administration is vested in
the Oromia Land Administration Bureau (OLAB). However, Directive No. 03/2011 gives
investors the full mandate to propose the location and size of the plot he/she demands.
Article 9 of the Oromia Land Use Contractual Agreement (OLUCA) says that ―the lessee
has the right to transfer the use right of the land leased to any other third party who has
the capacity to develop the land‖ (Art. 9, OLUCA). Although Article 9 of the OLUCA is
intended to give maximum rights and flexibilities to investors, given the realities on the
ground, it offers opportunities for speculative brokers to acquire land without investing
on it.
189
7.3 The effects of industrialization on agricultural activities
7.3.1 Farmland loss and reduction in food crop production at household level
The massive conversion of land use change for industrialization, residential and
infrastructure construction has caused a sharp reduction of the cultivated farmland size
that in turn negatively affected the total crop production both in the studied kebeles and
per households. The study results clearly shows that large scale appropriation of
agricultural lands has led to complex and diverse socio-economic impacts directly on
their livelihoods through insufficient production of crop required to feed their family and
meet other basic needs.
In connection with this, the processes of land conversion were also exacerbated by the
excessive demands for housing expansion as industrialization often acted as a stimulus in
attracting more people (i.e. labor and those who need better infrastructure) to the areas
(Dadi, et al., 2016, 2015; Lodder, 2012; Azadi, et al., 2011). Some of the farmers left
with part of their farmland could in no way be able to buy yield-enhancing inputs (i.e.
chemical fertilizers, pesticides or insecticides, etc.) in order to improve the productivity
of the land.
The change in the farmland holding size was more or less similar in both the studied
towns/kebeles. Of the food crops cultivated in these areas, teff and wheat are most
affected by the land conversions. As the result of these reductions, farmers who once
190
used to supply surplus food crops, mainly teff, to the urban residents (Taye, 1991) has
become unable to meet their own yearlong food requirements for their family (Dadi. et
al., 2015). This shows a clear indication of the gaps in the government policy of
economic growth strategies by attempting to promote industrialization at the expense of
using limited fertile agricultural lands as an incentive to attract investors.
7.3.2 Increase in landlessness and food crop price hike
Studies by Nguyen et al., (2009, 2010); Nguyen (2009, 2011), Lodder (2012), Tan (2015)
in Vietnam and Li (2011) in China reveal that the process of economic modernization
was considered as a success in boosting national economic growth. Yet, the process of
rapid industrialization accompanied with urbanization has initiated a widespread
conversion of fertile agricultural lands that seriously affect the livelihoods of agricultural
households and agricultural outputs at national and local levels. According to the findings
of these studies, many farmers were left without farmland and exposed to serious
household food insecurity.
Apparently, the results of this study also coincide with the negative outcomes of
agricultural land conversion identified in most developing countries. Derived solely by
the ambition of attracting as many investors as they can, the government‘s strategy of
using land as one of the incentives has deprived local farmers‘ access to their farmland. A
good demonstration for this is that, prior to the launching investment land preparation in
2005 (i.e. farmland expropriation), all of the household heads involved in the survey had
191
farmland on which they grew food crops. As time goes on, however, the number of
landless farmers had shown a sharp increase in all the studied towns/kebeles. Of the total
surveyed households, the majority of them lost more than half of the farmland they own
and now earn nothing from this sector.
The reduction in farmland size and crop production not only harmed the livelihood of the
local farmers in the study areas, but civil servant and urban residents were also subject to
shortages of preferred supplies and sky-rocking prices even at the farm gate (local)
market shops. Food security on national or global levels is often related to macro level
production, marketing, distribution and acquisition of food by the population as a whole,
while household food availability is related to the household assets, of which land is
crucial.
In the face of the rapid loss agricultural land to the point of exhausting the remaining few
hectares of land in the study areas and the sharp rise in the price of food crops has been
causing grim livelihood situations in these areas. Landless households are drastically
affected by the gradual deterioration of their living situation, contradicting unfulfilled
promise by the government and investors in creating employment opportunities and other
―trickle-down‖ effects for local people. The level of human capital development (level of
education and skill) in the study area is very low; most of the affected household miss
limited employment opportunities except for working as low paying wage laborer or
gatekeeper- some of them on their expropriated ex-farmlands.
192
In this respect, studies in other countries indicate similar experiences of industrialization
efforts and its correlated decline in agricultural land have complex consequences on
peasant households. According to Nguyen Van Suu (2009), where land is State-owned,
land conversion remains tremendously challenging for affected peasant households
resulting in landless and jobless peasantry (Cardnas, 2009), household food insecurity
and population mobilization (Dien, et al., 2011), environmental pollution (O'Rourke
2004), income disparity and social conflicts (Tan, 2015; Lodder, 2012) are among the
most prominent issues arising from this process.
7.4 The process of land conversion and the amount of compensation money
According to the existing literature, the type of land use right determines the methods of
acquiring or purchasing the land and the allocation or lease/sale of the land developers
(Tan, et al., 2009). In countries where the land is privately owned, the landholder decides
on whether to sale/lease or not and holds the privilege of setting the last price for his land,
while it is the other way around when the land is under the control of the government. In
these countries, the government not only has the right to confiscate the land, but also is
able to decide on the amount of compensation to be paid to the affected households
(Nguyen, 2010; Tan, et al., 2009). Furthermore, the government reserves the right to
acquire any land, from any place, regardless of the opinion or the livelihood situation of
the landholders. Usually the government sets explicit land expropriation procedures; yet
seem either unable or not willing to abide by them in many parts of the world such as in
Vietnam (Tan, 2015; Lodder, 2012; Dien, et al., 2010, 11)
193
In Ethiopia too, the government holds the right to confiscate any land, at any time for
public purposes or other development purposes (Article 40 (3)) of the constitution.
Proclamation no. 455/2005 was also enacted in 2005 to assist the process of expropriating
landholdings from private or communal users. The procedure does not offer consultation
or negotiation with the local people as part of the process of expropriating landholdings.
Instead, it states that local governments could write a letter to the landholders indicating
the date of the handover the land, and he/she is obliged to vacate the area without
hesitation or face forced eviction.
The study results tells us that the very short notification period (i.e. 30 days), did not
allow the families to adapt to the change of living circumstances when they lose their
land. Most of the households seriously complained about the lack of transparency among
the team involved in the valuation of their property, as the process did not involve any of
the affected households. Moreover, most of them are not happy with the amount of
compensation money and the lack of information on the amount determined in the office.
On top of this, the grievances of the local farmers became intense when the compensation
money was not paid on time, before handing over of their farmland as it is stipulated in
the proclamation no. 455/2005, article 7 (1) and article 42 (2) of the constitution.
Furthermore, they were also not happy with the processes and terms of the installment of
compensation money phase by phase. Dissatisfied by the process of land appropriation
and compensation amount along with the law development level of the converted lands
most of the people consider the spontaneous blossoming of new projects as ‗exo-genic‟
194
and a threat to their current and future means of livelihoods and identity (i.e. socio-
cultural and economically).
According to the views of the participants in the FGDs and informal interviews, most of
the households could not plan a business with the money and exhausted the small amount
of money paid to them before the second or third term. There is no formal or agreed upon
time frame set by the government on ‗when‘ or ‗how much money‘ to release to the
beneficiaries. The local people cannot negotiate in any way on the compensation amount.
This is quite a different experience in other countries. In Vietnam for instance, farmers
can negotiate with three actors in determining the compensation amount: the industrial
company, the farmer households and the local government for the land use right, property
on their land and for job change/finding (Dien, et al., 2011). In addition to these,
landholders are also encouraged to benefit from additional payments in the form of a
bonus if they quickly handover the land.
In Ethiopia, however, compensation is paid only for the land uses right (i.e. property and
labor) and/or compensation for displacement if and only if land expropriation causes
displacement (Articles 7 and 8, Proclamation no. 455/2005). In the researched
communities, the government uses force, such as demolishing private houses or
properties on the land with bulldozers (e.g. in Koticha kebele in Dukem) if the farmers
show their dissatisfaction with the compensation amount or other related issues, let alone
arranging extra benefits in the form of bonus or job finding money.
195
A study carried out by Dien et al., (2011) has also reported similar problems in the Hung
Yen Province, which is most affected by land conversion in Vietnam. In the study areas,
farmers and those involved in the FGDs revealed that farmers could not say ‗no‟ to land
conversion, nor could they refuse to hand over of the land; even if they are not paid
compensation for the land or dissatisfied by the amount of compensation money.
Transparency regarding land deals remains dubious in many cases and there is a clear
lack of checks and balances in contract negotiations and the actual scale of allocations
and compensation schemes. This was also identified as a loophole for the infiltration of
speculative land dealers and rent seekers in Vietnam (Lam, 2006).
7.5 Environmental and health problems arising from textile industries
The environmental problems arising from industrial effluents are mainly related to the
lack of well-planned blueprints that set up the Industrial Zones (IZs) or clusters as it was
initially stipulated. The perceived objective to establishing IZs or clusters of similar
industries or factories was to facilitate the establishment of shared industrial waste
treatment plants. Yet, in the researched areas, all the industries or factories are privately
owned and are small both in term of capital investment and the number of wage laborers.
These enterprises are established in a highly dispersed manner across the converted
agricultural lands. Failure to establish zones or clusters and lack of effluent treatment
plants by most of the factories as well as the inefficiency of the very few treatment plants
(i.e. poor design of the treatment plants and the quality of chemicals used for in the
treatment process) are to blame for the pollution. The looseness of control over these
196
activities by the government, whether due to the lack of its ability or by corruption, has
been the cause of serious environmental pollution.
The regional or local government accepts all investors without considering what kind of
products the enterprises will produce and where they can locate their factories. For
example, some textile industries are located next to enterprises, which produce
construction materials or food and beverage processing factories, while other companies
are surrounded by residential areas. The environmental pollution caused by
industrialization in other parts of the country and those in the researched areas sound as if
the government implementing policies of ―growth first and clean up later‖, a common
problem studied in China and Vietnam (Azadi, et al., 2010; Dien, et al., 2011). This
contradicts what the government advocates for the establishment of sustainable economic
growth and a ‗pollution free economy‘ or ‗green economy‘ on different national and
international platforms.
As textile effluents consisting of high concentrations of toxic chemicals and organic loads
– often beyond the permissible limit - can alter the physico-chemical characteristics of
humans, animals and plants, as well as whole ecosystems (Zaharia, et al., 2012). By this,
they produce multiple indirect economic costs, e.g. through a reduction of agricultural
production, or by an increase in the costs for drinkable water and health treatment.
Despite the fact that the country has established legal and institutional setups responsible
to ensure the environmental quality at macro and micro levels, the reality on the ground
contradicts with the existing legal procedures. According to the study result, the open
197
discharge of effluents from the textile industries has damaged the aesthetic value of the
researched areas. The researched communities have also strongly complained about the
price they have been paying due to health problems from exposure to pollutants and the
subsequent treatment costs and at times due to loss of their livestock they suspect died
from drinking wastewaters polluted with chemicals. Cardnas (2009) and Van Suu (2009)
have also reported similar cases in Philippines and in Vietnam, which prioritize economic
growth in these countries and have affected the health of many people who live close to
industries and those downstream.
7.5.1 Major pollutants and their concentration levels
In all samples collected from effluents from the four case study textile industries, six
variables were measured as much higher than the permissible limit of discharge. Three of
them (BOD5, COD and TSS) were observed in all the four textile plants while the others
were plant specific. On the other hand, an exceptionally high temperature of 77°C was
measured in effluents from the NOYA textile industry in Gelan. This is nearly double of
the national and international permissible limit with a maximum temperature of 40° C for
discharged effluents, and the highest temperature measured in effluents from textile
industries worldwide.
In this context, several other studies conducted in developing countries (e.g.
Govindarajalu, 2003; Tüfekci, et al., 2007; Islam, et al., 2011; Siyanbola, et al., 2011;
Singh, et al., 2013; Khan and Malik, 2014) revealed that COD, BOD5, and TSS are some
198
of the most common pollutants found in high concentrations in effluents from textile
factories. For instance, Islam, et al., (2011) has found BOD5, COD, TSS and T° values of
573.89mg/l, 1223.33mg/l, 1123.11mg/l and 5022°C respectively from samples taken
from textile industry effluents in the cities Gazipur and Narayanganj in Bangladesh.
Likewise, Singh, et al., (2013) had conducted a study on effluents from eight textile
factories in Punjab, India. Their results show BOD5 concentrations between 156mg/l and
790mg/l, while the measured values for COD and TSS concentration levels range from
120mg/l to 3050mg/l and 898mg/l to 5145mg/l respectively.
The results of a study conducted by Siyanbola, et al. (2011) on effluents from five textile
industries in Nigeria show similar results. They found high concentrations of BOD5,
COD and TSS, between 340mg/l and 560mg/l for BOD5, between 615mg/l and 1245mg/l
for COD and between 0.11mg/l and 310mg/l for COD. Islam, et al., (2011) also measured
an exceptionally high temperature (i.e. around 50°C) in effluents discharged from a
textile industry in Narayanganj city in Bangladesh.
The main reason for the presence of these pollutants in large quantities is attributed to the
fact that most textile industries use organic materials and fibers as raw materials. More
importantly, the absence of effluent treatment and/or the low quality of effluent treatment
techniques used (e.g., due to age or model) results in an inefficient removal of pollutants
below the level expected. Furthermore, the type and quality of chemicals used in the
effluent treatment plant would also affect the pollutant removal efficiency
(Govindarajalu, 2003; Khan and Malik, 2014). It is important to say that all industries
199
investigated in this study, except NOYA, have their own effluent treatment plants and yet
discharge highly polluted effluents.
The measured values of the sampled effluent taken from NOYA industry showed that 8
of the 16 parameters are much higher than the national limits. According to a technician
who works on the effluent treatment plant and the manager of the company (i.e.
ALMAHDI), the design of the treatment plant and the chemicals they use in the treatment
process were not effective. In an expert interview, the ALMHADI manager indicated that
they are aware of the problem, but refer to the expensiveness of more effective
wastewater treatment measures, indicating profit as the priority of their company.
7.5.2 The environmental implication of wastewater from textile industries
Studies indicate that the environmental consequences of disposing untreated or
inefficiently treated wastewater into ambient environments damages aquatic biodiversity
(Shaikh, 2009; Merzouk, et al., 2010; Kanu, et al., 2011; Kant, 2012; Odjegba and
Bamgbose, 2012). According to Kant (2012), effluents with high temperatures and pH
values above the tolerable limit (as proven in this study for effluents from NOYA) could
cause the extinction of important microorganism. Likewise, the presence of high amounts
of BOD5 in wastewater led to the depletion of DO, which is important for the survival of
wetland ecosystems.
200
The main problem related to high COD concentrations is the depletion of available
dissolved oxygen. In this case, anaerobic microorganisms use DO to oxidize inorganic
loads in the water. Hence, sustained removal of DO has a destructive effect on aquatic
biodiversity by reducing metabolism and recharging water with oxygen. According to
WHO/UNEP (1999), pH values between 6.5 and 8.5 are the typical range for most major
drainage basins around the world and are usually indicate good water quality. According
to our results, the concentration of Sulfate in effluents from DH-GEDA was slightly
higher than the permitted discharge limit (Table 1) showing that its higher levels in the
surface water would have a health risk for human beings. Earlier studies have also
demonstrated that high sulfate concentrations in water used by humans could increase the
chances of exposure to diarrhea (Khan and Malik, 2014).
7.5.3 Textile waste water and its effects human and livestock health
One of the critical problems of textile industries in developing countries is the
management of the vast amounts of waste generated (Khan and Malik, 2014). Challenges
those are particularly associated with the disposal of wastewater into the ambient
environment (Imoobe and Koye, 2011). Households who reside far away from potable
water sources in the towns of Dukem and Gelan and those who live downstream are
found to be most susceptible to health problems. Generally, the relative number of human
health problems associated with polluted surface water was much lower than the figures
indicated for livestock.
201
While verification of the principal causes of human health problems would of course,
demand medicinal diagnoses and specialized laboratory tests, the high contamination of
wastewater with different chemicals and the high T. Coli content as well as the high
temperature of effluents are considered as factors that can contribute to human health
problems. The main water-related problem for households is the insufficient availability
of public and private potable water sources to cover domestic household demands. Coli
forms are the most commonly used indicators of contaminated drinking water.
An important point observed in this study is the prevalence of livestock health problems
to those observed in humans. The results reveal that livestocks of the households in
kebeles situated downstream were affected more than those situated upstream. This was
primarily due to the absence of any alternative sources of drinking water for the
livestock and the people in the study kebeles.
7.6 Livelihood strategies of the affected households
Livelihood strategies are mechanisms developed by a household that includes an activity
or set of activities employed by the affected households to find alternative ways of
making income to sustain life. In the context of this research, the ill planned and rushed
implementation of the government drive and ambition to industrialize, initiated the
indiscriminate expropriation of agricultural lands for both industrial and other land use
purposes, are the mirror through which the ‗coping‘ and ‗adaptation‘ strategies of the
farming households are viewed. Based on the survey results, employment in the
202
‗farming‘, ‗off-farm‘ and ‗non-farm‘ activities were pursued by the affected households
to earn their livelihood incomes.
7.6.1 Attachment to the farming activities
Despite reduction in the total area of agricultural lands in the study town and/or farmland
size, most of the affected households still prefer to rely on farming activities as their
means of income. The study result shows that, the affected households preferences were
still employment in the farming sector, although it is greatly influenced by the availability
of farmlands, the ability of the households to afford to pay high farmland prices and the
household‘s financial status except the ‗well-off‘ households.
In spite of the land losers‘ ambition to maintain farming as their viable option of
livelihood strategies, the existing scenarios related to sharp rise in the price of farmland
lease, skyrocketing yield enhancing inputs mainly the price of chemical fertilizers) did
not allow ‗intensification‘ as an alternative option to increase the productivity of the
remaining farmlands at all. Synonymously, farmlands to be leased is hardly available
within the studied kebeles. Therefore, some of the affected farmers travel long distances
to neighboring kebeles to work on leased land or as a share cropper. Farmers have to
walk these long distances, which limits the working hours on the land lease
The possibilities of diversifying incomes for the farming households in the case study
areas is slim - unlike it was the case for the affected households in Vietnam (Suu, 2009;
Dien, et al., 2011; Lodder, 2012; Tan, 2015) and China (Liua, et al., 2009; Lu, et al.,
203
2013). Most of the farmer households are less likely to change their jobs into non-farm
activities or adapt a more ‗urban way of life‘. A similar study was conducted by Feyera
(2005) revealed that most of the dislocated families were exposed to impoverishment and
fall prey to grim livelihood situations caused by the outward sprawling of Addis Ababa.
In Vietnam, 67% of landless households continue their farming activities and only 13%
of the households can get a new job other than staying in the industrialization area (Le
Han 2007; Vu Huu Su 2008).
7.6.2 Non-farm activities: employment/job opportunities and informal business
Creating employment and job opportunities for the local people was high on the agenda
of the government at the start of the industrial projects in the study areas. Most of the
licensed industrial projects promised to create employment opportunities in their business
plans. Yet, only a few of the projects were able to keep their promises as most of the
lands distributed for the ‗prospective investors‘ were not fully developed or were
completely undeveloped. Most companies in the researched areas do not have any
reasons that the researcher could explore for their activities, while others openly hinted
that they took the land in the name of an investment or to establish a factory. The real
reasons, however, was that they were waiting for higher prices to sell a portion of or the
entire land they acquired. As a result, most of the prospective investors were not able to
provide employment or job opportunities for the affected households.
204
On the other hand, labor selection and surplus labor forces (i.e. skilled and unskilled)
were observed to have limited the likelihood of benefiting non-farm employment
opportunities, that were also reported by many researchers in other countries (Minh k,
2009; Nguyen, et al., 2009; Tran, 2011; Nguyen, 2011; Lodder, 2012; Tan, 2015) and in
Nepal (Vivekananda, 2009). The main problem observed by the government has been the
failure or lack of willingness to implement or enforce the legal tools in place on the
investors who failed to develop the land in accordance with the contractual agreement
signed. Insufficient and inefficient land and project management and monitoring
practices due to complex and insufficient information storage and retrieval systems has
also created a loophole for the inefficient enforcement of the legal investment procedures.
Participants of the FGD explain this situation as follows:
“Lafti keenya harka investeraa osoo hin taanee harka dalaalaa jira” Meaning:
―our land is not given to investors but acquired by speculative land dealers‖
Regarding pursuing small-scale formal or informal businesses as alternative means of
livelihood strategy, it was learnt in this study that most of the farmers did not have the
formal education or the skills to do so. Most farmers were not used to manage larger
sums of money and invest them sustainably. Lack of experience in running a business or
managing large amounts of money (i.e. in relation to their earlier exposure to money)
coupled with the erratic installment of small compensation payments limited their
possibilities to engage in business activities. There is no unit in any of the government
administrative structure who is responsible to handle or follow the proper restoration of
the livelihood of these people. Therefore, most of the farmers exhausted their
205
compensation money, which they describe it as ―small amount of money in relation to the
total income from their land or lost property” without translating into a tangible asset due
to the lack of support or follow up on the government side.
In the context of the results of this study, none of the affected households are pursuing
effective livelihood strategies, be it be in the farming sector, ‗off-farm‘ or from „non-
farm‘ income generating activities, including the informal business owners. Therefore,
most of them earn a monthly income that is too low to cover all living expenses required
for their families at the time information was collected. The outcome of the economic
development plan of industrializing the economy pursued during the GTP1 period
(2009/10 -2014/15) and the drive that involved the considerable expropriation of
agricultural lands, was reported as an unsuccessful during the planning period. This is
presented in the annual performance reported (GTP1) presented by the MoFED in 2014
in the following manner:
“…Yet the growth rate registered still falls short of the target of about 22
percent. ….The narrow base of the industrial sector is a challenge with
significant implication on the country‟s capacity to generate foreign exchange
and create job opportunities for its growing labor force (MoFED, 2014). ….
Therefore, in order to increase the role of manufacturing industry in the
economy and eventually realize the long-term vision of industrialization and
economic transformation, the growth rate of the manufacturing sector has to be
accelerated by tackling the bottlenecks in the new five years planning period
(i.e. GTP2:2015/16-2019/20) (MoFED, 2014)”
206
8 CHAPTER NINE: Conclusions and Recommendations
8.1 Conclusions
In this study, the researcher focused on the industry-agriculture interface in which the
impacts of land conversion policies to ward the livelihood of the farming households are
emphasized. This research contributes to the debates on the dynamic interactions between
pro-urbanist views of using agricultural lands in the urban hinterlands and those arguing
against it by the pro-muralists. To this end, the results of the study conforms with the
views of the pro-ruralist, where lack of adequate planning led to the irrational and in-
efficient use of limited lands for industrialization has seriously affected the livelihoods of
the farming households in the studied areas.
The goal industrialization, according to the Ethiopian government is to achieve effective
economic development. Toward the households, industrialization is thought to provide
greater opportunities to have higher incomes, job opportunities, movement of labor from
agriculture to the industrial sector and join urban way of life by running own business
outside the traditional agricultural sector using the compensation money. However, in
reality, the development of industries and the industrialization process has instead created
a new class structure, in which there is the rapidly rising of rural landless peasants who
are largely separated from the means of production, who survive by intermittently selling
their labor for a casual and/or low paying jobs or employment opportunities.
207
Another grievance by the affected households was related to the low development level
of the converted lands and lack of the promised off-farm or non-farm employment
opportunities for the households where the income derived from agricultural activities is
simply too low to cover all living expenses; either due to the farmland being too small in
size or by being turned into landless farmers.
This research also helps to avoid the bias and top down perspective in analyzing the
phenomenon of land conversion and its consequences through the explanations about the
voluntary and mandatory motives and motions of the involved actors. The study result
shows that local communities were not only excluded in the development planning
processes but also have little knowledge about the process involved in the valuation of
property and determination of compensation amounts. On top of this, many of the
farming households are not comfortable with the procedures involved in the land
conversion processes. They complain about a lack of transparency during field
measurements of the expropriated farmland size, the elements considered in estimating
the values of their properties and in the final compensation amounts. The grievances of
most of the affected households are so intense in relation to the inadequacy of the
compensation money and the manner in which compensation money was paid to them.
In relation to job and/ or employment opportunities, high labor migration to the area
coupled with labor selection reduced the local people‘s chances of getting opportunities
in places where the level of human capital development is very low and when most of the
208
unemployed people have no specific acquired skill except for activities related to
farming.
Finally, yet importantly, the Federal government has formulated legal procedures for
industrial pollution control with the hope of protecting the environment and the well-
being of its citizens from potential damages caused by this sector. Yet, in spite of these
clear-cut legal tools, this study shows that the reality looks different, and that local people
and their livestock are exposed to highly contaminated effluents.
209
8.2 Recommendations
Based on the findings of the study, the following areas of improvements are suggested for
consideration along with the planning and implementation strategies:
1. Government should develop tailored land use policy and implementation strategy
in the urban-rural interfaces based on the local contexts: taking social and
economic situation of the affected households and those likely to be affected in
the near future. This should involve the preparation of strong comprehensive
spatial planning along with strict implementation and management of land uses,
rules and legal enforcements.
2. Some of the land enclosed for the sake of development has remained idle since
their conversion some 6-10 years ago. Therefore, seeking ways to use land more
rationally and intensively is strictly advised to minimize the impact on farmer‘s
livelihoods. The researcher therefore recommends that the responsible
governmental bodies at woreda, regional and federal levels should re-examine the
actual implementation of the legal investment procedures, and re-adjust them in a
way that allows development of industrialization over a converted land in a more
efficient, rational and sustainable manner.
3. A major problem of contemporary development policy concerns is compensation
paid to those whose traditional livelihoods are affected by industrial expansion.
In this respect, the research findings reveal that, the participation of the affected
210
households in the development planning, processes of land conversion and
valuation of properties are very much restricted. The result also tells us that, there
is a lack of transparency regarding agricultural land conversion, and people have
no chance to discuss the compensation packages they receive for their seized land.
Therefore, involvement of local people in the process of agricultural land
conversion and estimation of compensation amounts is of paramount importance
in terms of enhancing the positive outcome of industrialization. In this regard, the
procedure involved and the amount of compensation paid to the affected
households are inadequate and strong grievances are reported among the studied
communities. This is not only the result of the logic of economic efficiency but
also distributive justice and political sustainability of the industrialization process.
Therefore, the responsible body is strongly advised to re-examine the process of
estimating compensation amount, while also advised to re-examine the additional
payments for the majority of the affected households for whom inadequate
compensation could not restore their original livelihood, for those in disparate
living conditions.
4. The bulk of the former peasant households are excluded from agricultural
livelihood, have been economically marginalized and they increasingly vulnerable
owing to lack of better education or skills to apply to even low paying jobs due to
highly competitive labor force. As a result, they end up in desperate survival
strategies. Therefore, the government should create supportive policies (i.e.
independent institution and/or organ) to assist the restoration and rehabilitation of
211
the livelihoods of the affected households. On top of this, the government should
provide skills training for the farmers to be evicted for industrial development to
make them qualify for any new jobs or employment opportunities. Tailored
vocational training, for example for the children of the affected households could
help them fit for employment opportunities in their localities. Likewise, it is
strongly advised that, the government should consider creation of more non-
agricultural jobs so that, a local person who lacks the skill or appropriate level of
education, female and elderly households could benefit from.
5. The Ethiopian government has formulated a couple of legal procedures for
industrial pollution control with the hope of protecting the environment and the
well-being of its citizens from potential damages caused by this sector. For
instance, proclamation no, 300/2002 of the federal government aims at controlling
and addressing all matters arising from environmental pollution. Sub-article 1 and
4 of the proclamation states that every person is strictly prohibited from polluting
or causing others to pollute the environment and discharging of pollutants beyond
the environmental standards are subject to cleaning or covering the cost of
cleaning the pollutants. Sub-article 4 and 5 of the same proclamation give the
regional authorities to take appropriate legal measures in line with the damage
level they caused on the environment. The legal measures range from monetary
penalties of up to 2500 US$ to the closing or relocation of the whole enterprise.
212
In spite of these clear-cut legal tools related to the control and protection of the
environment, this study show that the reality looks different, and that local people
and their livestock are exposed to highly contaminated effluents. We therefore
recommend that the respective federal and regional government bodies should re-
examine the compliance to and actual implementation of the existing legal
procedures and regulations, and respond appropriately. In the face of expanding
textile industries (and other industries) in Ethiopia, the health of households living
around the plants and downstream and their livestock are at risk. In most parts of
Ethiopia, local people do not have sufficient access to potable water for domestic
and livestock consumption; many wait hours and days for a jerry can of potable
water from a public or a private provider. Therefore, responsible federal and/or
regional government bodies should consider prioritizing the planning and
construction of potable water systems in kebeles that are most seriously affected
by industrial wastewater. Furthermore, the authors suggest the increased provision
of community awareness building measures on industrial effluents in order to
reduce the potential health and livelihood impacts in these localities.
Finally, yet importantly, the researcher suggests that the respective federal and regional
government bodies should re-examine the compliance to and actual implementation of
the existing legal procedures and regulations pertinent to land acquisition and
compensation procedures, investment rules, control of environmental pollution and
respond appropriately.
8.3 The Planning Framework (see Appendix A)
213
Suggestions for further research
The following issues emerged from the study are suggested for further research.
Issues related to the pros and cons of migration of labor from outside the study
towns into the commune from the socio-cultural context could be a potential
research area;
The ongoing development in the study areas is shaping the perceptions and social
relations of the local people. This research showed that the importance of farming
as source of livelihood income is decreasing due to widespread land use changes.
Therefore, researchers could look in more detail at this issue, what it means for
farming activities in the study areas and what possible future implications might
arise if this trend is not supported with proper land use planning.
The impacts of land use change (expansion of built up areas) on the biodiversity
due to habitat conversion during land clearing to prepare it for construction
The effects of generation and discharge of toxic pollutants on downstream
wetland biodiversity (flora and fauna) and on the wetland ecosystem services
The effects of toxic pollutants on the physicochemical properties of soils used for
crop production and irrigation agriculture in the downstream areas (including, the
germinability and quality of the stable food crops harvested).
214
Reference
Adekoya, J. A. (2011). Physico-chemical characteristics of industrial effluents in Lagos
state, Nigeria. GJ P&A Sc and Tech, 1, 49-54.
Agriculture Organization of the United Nations. Soil Resources, Management,
Conservation Service, & Agriculture Organization of the United Nations.
Interdepartmental Working Group on Land Use Planning. (1993). Guidelines for
land-use planning (Vol. 1). Food & Agriculture Org.
Amare, Y. (1999). Household Resources strategies and Food Security: A study of
Households in wagada: North Shewa. AAU Printing, Press Addis Ababa.
Anonymous (1999). Standard Analytical Procedures for Water Analysis, Laboratory
Manual, Version 2(Indian and The Netherlands)
APHA (1999). ―Standard Methods for the Examination of Water and Wastewater‖ 18th
Edn., Washington DC, USA.
Aribigbola, A. (2008). Improving Urban Land Use Planning And Management In
Nigeria: The Case Of Akure. Theoretical and empirical researches in urban
management, (9), 1.
Athar, H., & Tribe, K. (1981). Marxism and the agrarian question. Vol. 1 of German
social democracy and the peasantry, 1890–1907. Atlantic Highlands, NJ:
Humanities Press.
Azadi, H., Ho, P., Hasfiati, L. (2010). Agricultural land conversion drivers: A
comparison between less developed, developing and developed countries. Land
Degradation and Development, 22, 596–604.
Azadi, H., Verheijke, G. and Witlox, F. (2011), Pollute first, clean up later? Global and
Planetary Change, vol. 78 (3-4), p. 77-82.
Azadi, H., Veronique, V. Acker. Zarafshani, K., and Witlox, F. (2012). Food Systems:
New-Ruralism versus New-Urbanism, Journal of the Science of Food and
Agriculture, 92, 2224–2226. (IF: 1.436)
Berke, P., & Kaiser, E. J. (2006). Urban land use planning. University of Illinois Press.
Bernstein, H., & Byres, T. J. (2001). From peasant studies to agrarian change. Journal of
Agrarian Change, 1(1), 1-56.
215
Bhikkhu Vivekananda (2009). Negative Impact of Industrialization along Lumbini Road,
Nepal (http://zencohen.us/wp-content/uploads/2010/04/Negative-Impact-of-
Industrialization.pdf, accessed, 28.02.2016
Birhanu, G. (2007). The Post 1991 Industrial Development and Its Role in Diversifying
the livelihood of the local people in Oromia Regional State. The case of East
African Industrial Park (EIP) in Ada‘a district. MA Thesis, Addis Ababa
University, Ethiopia
BoFED (2012). The Regional Government of Oromia; Bureau of Finance and Economic
Development, Annual report, Finfine (Addis Ababa), Ethiopia,
BoFED (2013). The Regional Government of Oromia; Bureau of Finance and Economic
Development, Annual report, Finfine, Addis Ababa
Cairncross, A. K. (1961). The Stages of Economic Growth. The Economic History
Review, 13(3), 450-458.
Cardenas, D. C. (1996). Effects of Land-Use Conversion on Local Agriculture: The Case
of Cavite, Philippines. Food and Agriculture Organization.
Carney, D. (1998). Sustainable rural livelihoods: what contribution can we make? Papers
presented at the Department for International Development's Natural Resources
Advisers' Conference, July 1998. In Sustainable rural livelihoods: what
contribution can we make? Papers presented at the Department for International
Development's Natural Resources Advisers' Conference, July 1998. Department
for International Development (DFID).
Chambers, R. (1995). Poverty and livelihoods: whose reality counts? Environment and
urbanization, 7(1), 173-204.
Chen, Y., Li, X., Tian, Y., Tan, M. (2009): Structural change of agricultural land use
intensity and its regional disparity in China. Journal of Geographical Sciences
Vol. 19, 545–556.
Chole, E. (2004). Under Development in Ethiopia, OSSREA, Addis Ababa University,
United Printers, Addis Ababa, Ethiopia
Creswell, J.W., Clark, V.L.P., Gutmann, M.L. & Hanson, W.E. 2003. Advanced mixed
methods research designs. Tashakkori, A. & Teddlie, C. (eds.) Handbook of
216
Mixed Methods in Social and Behavioral Research, 209–240. Thousand Oaks &
London: Sage.
CSA (2008). Central Statistical Agency, Summary and the Statistical report of the 2007
Population and housing census, Addis Ababa, Ethiopia
CSA (2010). Central Statistical Agency, Statistical Abstract on National Economy, Addis
Ababa, Ethiopia
CSA (2014). Central Statistical Agency, Statistical Abstract on National Economy, Addis
Ababa, Ethiopia
DAO (2013): Gelan and Dukem town Agricultural Department, Oromia Regional State,
Ethiopia. Unpublished document
Davies, S. (1996). Adaptable livelihoods: coping with food insecurity in the Malian
Sahel. Macmillan Press Ltd.
Degaga, D. T. (2005). Rural Livelihoods, Poverty and Food Security in Ethiopia. A Case
Study at Erenssa and Garbi Communities in Oromiya Zone, Amhara National
Regional State (Doctoral dissertation, Doctoral Thesis, Department of Geography,
Faculty of Science and Technology Management, Norwegian University of
Science and Technology. Doctoral theses at NTNU 2005: 106. NTNU,
Trondheim).
Degefe. B and Nega. B. (2000). Ethiopian Economic Association Annual report on the
Ethiopian economy (Vol. 1). The Association.
Department for International Development (DFID), (2001). Sustainable livelihoods
guidance sheets, Section 2. Department for International Development, London.
http://www.livelihoods.org/info/guidance_sheets_pdfs/section2.pdf
Dethier, J. J., & Effenberger, A. (2011). Agriculture and development: a brief review of
the literature. World Bank Policy Research Working Paper Series, Vol.
Diriba, D, Hossein, A., Feyera, S., Ketema, A., Fatemeh, T., and Till, S. (2016): Urban
sprawl and its impacts on land use change in Central Ethiopia. Journal of Urban
Forestry & Urban Greening. Vol. 16, pages 132–141, Elsevier
Diriba, D., Till, S., Hossein, A., Ketema, A. and Feyera, S. (2015): The Impact of
Industrialization on Land Use and Livelihoods in Ethiopia: Agricultural Land
217
Conversion around Gelan and Dukem Town, Oromia Region. In: Stellmacher,
Till (ed). Socio-economic Change in Rural Ethiopia. Understanding Local
Dynamics in Environmental Planning and Natural Resource Management. Peter
Lang. Frankfurt.
Elasha, B. O., Elhassan, N. G., Ahmed, H., & Zakieldin, S. (2005). Sustainable livelihood
approach for assessing community resilience to climate change: case studies from
Sudan. Assessments of Impacts and Adaptations to Climate Change (AIACC)
Working Paper, 17.
Eliane, T. (2013). The agricultural, environmental and sociopolitical repercussions of
Brazil‘s land governance system. Land Use Policy, 36, 134-144.
Ellis F, and Biggs S (2001). Development Policy Review, 19(4): 437-448.
Ellis, F. (2000) ―The Determinants of Rural Livelihood Diversification in Developing
Countries‖, Journal of Agricultural Economics, Vol. 51 (2): 289-302.
EPA and UNEP, (2003). Standards for Industrial Pollution Control in Ethiopia, Addis
Ababa, Ethiopia
EPA. (2008). Environmental Protection Authority of Ethiopia, Addis Ababa, Ethiopia
Fazal, S. (2000). Urban expansion and loss of agricultural land-a GIS based study of
Saharanpur City, India. Environment and Urbanization, 12(2), 133-149.
Fazal, S. (2001). The need for preserving farmland: A case study from a predominantly
agrarian economy (India). Landscape and Urban Planning, 55(1), 1-13.
FDRE (2002). Federal Democratic Republic of Ethiopia: Industrial Development
Strategy, Ministry of Trade and Industry, Addis Ababa Ethiopia,
FDRE (2002): Negarit Gazeta, Investment Proclamation No, 456/2005. Federal
Democratic Republic of Ethiopia, Addis Ababa, Ethiopia.
FDRE (2013). Ethiopian Investment Agency: An investment guide to Ethiopia:
Opportunities and Conditions 2013, Addis Ababa, Ethiopia
Feyera, A. (2005). Urban Expansion and the Livelihood of the Peri-urban Agricultural
Community: The Case of Addis Ababa (M.A. Thesis, aau).
Fincham, J. E. (2008). Response rates and responsiveness for surveys, standards, and the
Journal. American Journal of Pharmaceutical Education, 72 (2).
218
Fisseha, I. (1998). Metal concentrations of some Vegetables irrigated with industrial
liquid waste at Akaki, Ethiopia. Sinet, 21(1), 133-144.
Gazeta, F. N. (1995). The constitution of the Federal Democratic Republic of Ethiopia.
Addis Ababa.
Gebre, G., Rooijen, D. V., & Shaw, R. (2009). Urban water pollution and irrigated
vegetable farming in Addis Ababa. In Water, sanitation and hygiene: sustainable
development and multisectoral approaches. Proceedings of the 34th WEDC
International Conference, United Nations Conference Centre, Addis Ababa,
Ethiopia, 18-22 May 2009 (pp. 216-221). Water, Engineering and Development
Centre (WEDC) Loughborough University of Technology.
Gemechu, P. D. (2012). Decentralization in Ethiopia: The case of Dendi District, West
Shoa Zone, Oromia; concept and process (Doctoral dissertation, Dortmund,
Technische Universität, Diss., 2012).
Getachew, T. (2007). Industrial Waste Management Practices in Addis Ababa: aCase
Study on Akaki-Kality Industrial Zone, Ethiopia (M.Sc Thesis, aau).
Govindarajalu, K. (2003, December). Industrial effluent and health status: A case study
of Noyyal river basin. In Proceedings of the Third International Conference on
Environment and Health, Chennai, India (Vol. 15, No. 17, pp. 150-157).
Gozálvez-Zafrilla, J., Sanz-Escribano, D., Lora-García, J., León Hidalgo, M. (2008).
Nanofiltration of secondary effluent for wastewater reuse in the textile industry.
Desalination 222:272–279
Greenhut, M.L. (2012). A Theory of the Firm in Economic Space, Austin: Lone Star
Publisher
Gudeta, Z. (2009). How Successful the Agricultural Development Led Industrialization
Strategy (ADLI) Will Be Leaving the Existing Land Holding System Intact – A
Major Constraints for the Realization of ADLI‘s Targets? Ethiopian e-journal for
Research and Innovation foresight, Vol. 1, No 1, pp. 19-35
Haan de, L. J., and Zoomers A. (2005). Exploring the frontier of livelihoods research.
Development and Change, Vol. 36 (1): 27–47.
219
Headey, D., Dereje, M., & Taffesse, A. S. (2014). Land constraints and agricultural
intensification in Ethiopia: A village-level analysis of high-potential areas. Food
Policy, 48, 129-141.
http://sodere.com/profiles/blogs/10-reasons-why-teff-isthe-new-
quinoa?xg_source=msg_mes_network, accessed 11 Oct. 2014)
http://www.aljazeera.com/indepth/features/2014/12/ethiopia-booming-business-
underpaid-workers-20141228732485264.html , 30/12/2014
http://www.ifpri.org/sites/default/files/pu publications/esspwp58.pdf (accessed on
17/09/2014).
https://people.hofstra.edu/geotrans/eng/ch6en/conc6en/burgess.html, 12/07/2015
IDS. (2002). Industrial Development Strategy of Ethiopia, Addis Ababa, Ethiopia
Imoobe, T. O. T., & Koye, P. I. O. (2011). Assessment of the Impact of Effluent from a
Soft Drink Processing Factory on the Physico-Chemical Parameters of Eruvbi
Stream Benin City, Nigeria. Bayero Journal of Pure and Applied Sciences, 4(1),
126-134.
IPS, (2004). Study on The Establishment of Model Industrial Zoned in Selected Regional
Towns. Policy Options and Strategic Framework for Development and Operation
of Industrial Zones, Volume II, IPS/MOTI, Addis Ababa, Ethiopia
Islam, M. M., Mahmud, K., Faruk, O., & Billah, M. S. (2011). Textile dyeing industries
in Bangladesh for sustainable development. International Journal of
Environmental Science and Development, 2(6), 428.
Jekel, M. (1997). Wastewater treatment in the textile industry. In: Treatment of
wastewaters from textile processing. TU Berlin. Schriftenreihe Biologische
Abwasserreiigung des Sfb 193, Berlin, pp. 15–24
Jewell, T. (2003). Sustainability, Land Use and Environment: A Legal Analysis. Journal
of Environmental Law, 15(2), 268-270.
Jiang, L., Deng, X., & Seto, K. C. (2012). Multi-level modeling of urban expansion and
cultivated land conversion for urban hotspot counties in China. Landscape and
Urban Planning, 108(2), 131-139.
220
Kaag, M.M.A., van Berkel, R., Brons, J., de Bruijn, M., van Dijk, H., de Haan, L.,
Nooteboom, G. and Zoomers, A. (2004). Ways Forward in Livelihood Research‘,
in: D. Kalb; W. Pansters; H. Siebers (eds.) Globalization and development:
Themes and concepts in current research, Dordrecht: Kluwer, pp. 49-74.
Kant, R. (2012). Textile dying industry and environmental hazard, Journal of Natural
Science. Vol. 4 (1): 22-26
Kanu I., Achi OK. (2011). Industrial effluents and their impact on water quality of
receiving rivers in Nigeria. Journal Applied Technology Environment Sanit
1(1):75–86
Kanupriya Chaturvedi (2013). Sampling Methods, (www.pitt.edu/~super7/43011-
44001/43911.ppt), 09.06.2015
Kassahun, S., & Tiwari, A. (1990). Urban Development in Ethiopia: Challenges and
Policy Responses. Development, 2(1), 10.
Kefyalew, G. (2013). Determinants of smallholder farmers‘ participation in sesame
production: Evidence from Diga, Ethiopia. Rainwater management for resilient
livelihoods in Ethiopia, 171.
Kendall, D. (2006). Sociology in our times: The essentials. Cengage Learning.
Kenneth, G. Willis. (2001). Sustainability in Urban Planning and Management: In:
Kenneth G. Willis, Kerry R. Turner, Ian J. Baleman (Ed.), Urban Planning and
Management. Edward Elgar Publishing Ltd, William Pratt House, Northampton,
USA
Khai, H. V., & Yabe, M. (2012). Rice Yield Loss Due to Industrial Water Pollution in
Vietnam. Journal of US-China Public Administration, 9(3), 248-256.
Khan, S., & Malik, A. (2014). Environmental and health effects of textile industry
wastewater. In Environmental Deterioration and Human Health (pp. 55-71).
Springer Netherlands.
Khun, Alex (2008). "Inform Educate Action: Critical Review of Modernization Theory".
Ourdevelopment.blogspot.nl. Retrieved 2013-05-24.
221
Kirkpatrick, C. (1990). Export-Oriented Industrialization and Income Distribution in the
Asian Newly Iitdustrializing Countries. Industrialization in the Third World: The
Need for Alternative Strategies, Marcussen, HS: Frank Cass.
Kothari, C. R. (2004). Research methodology: Methods and techniques. New Age
International.
Kumar, V., Chopra, A. K., & Chauhan, R. K. (2012). Effects of Textile Effluents
Disposal on water quality of sub canal of upper Ganga canal at Haridwar
(Uttarakhand), India. Journal of Chemical and Pharmaceutical, 4(9), 4206-4211.
Kuris, A. (2006). The Ethiopian Economy: Principles and Practices. Birhanena Selam
Printing Press, Addis Ababa, Ethiopia
Kusa, G. B. (2007). The Post 1991 –Industrial Development and Its Role in diversifying
the livelihood of the local People in Oromia Regional State: The case of East
African Industrial Park (EAIP) in Ada‘a District, Unpublished MA Thesis, Addis
Ababa University, Ethiopia
Lanjouw, J. O., & Lanjouw, P. (2001). The rural non‐farm sector: issues and evidence
from developing countries. Agricultural economics, 26(1), 1-23.
Leblond, J. P. (2008). The retreat of agricultural lands in Thailand. Canada Research
Chair in Asian Studies, Université de Montréal.
Li, J., Xiangzheng, D., Karen, S. (2013). The impact of urban expansion on agricultural
land use Intensity in China. Land Use Policy, 35, 33-39.
Li, Y., Long, H., & Liu, Y. (2010). Industrial development and land use/cover change
and their effects on local environment: a case study of Changshu in eastern
coastal China. Frontiers of Environmental Science & Engineering in China, 4(4),
438-448.
Liekens, I., Schaafsma, M., De Nocker, L., Broekx, S., Staes, J., Aertsens, J., Brouwer,
R., (2013). Developing a value function for nature development and land use
policy in Flanders, Belgium. Land Use Policy, Vol. 30 (1), 549–559.
Lin, J. Y., Cai, F., & Li, Z. (1996). The China Miracle: Development Strategy and
Economic Reform, the Hong Kong Centre for Economic Research and the
International Center for Economic Growth.
222
Liu, Y. S., Wang, J. Y., & Long, H. L. (2010). Analysis of arable land loss and its impact
on rural sustainability in Southern Jiangsu Province of China. Journal of
Environmental Management, 91(3), 646-653.
Lodder, E. (2012). Pressure on Land in Peri-urban Vietnam: The impact of agricultural
land conversion and the need for livelihood diversification in Thuy Duong
commune.
Long, H. (2014). Land use policy in China: Introduction. Land Use Policy, 40, 1-5.
Lu, C. H., Li, X. B., & Tan, M. H. (2003). China's farmland changed and trend: a
scenarios analysis. In Economic Transition and Sustainable Agricultural
Development in East Asia. International seminar (pp. 20-22).
Manunatha, N. (2008). Effect of industrial effluents on seed quality attributes of cereal
crops (Doctoral dissertation, M. Sc. thesis. University of Agricultural Sciences,
Dharwad).
Mass Media (2016). Dire Tube: (http://diretu.be/1SE3Ufi, accessed on 08/2/2016)
Mato, R. R. A. M., & Kaseva, M. E. (1999). Critical review of industrial and medical
waste practices in Dar es Salaam City. Resources, Conservation and Recycling,
25(3), 271-287.
Matunhu, J. (2011). A critique of modernization and dependency theories in Africa:
Critical assessment, African Journal of History and Culture Vol. 3(5), pp. 65-72
Megeleta Oromia, (2003). The Oromia Regional State: ―The Urban Local Government
Proclamation, Proclamation No. 65/2OO3‖, Finfine, Ethiopia
Megeleta Oromia, (2003). The Oromia Regional State: ―The Urban Local Government
Proclamation, Proclamation No. 65/2OO3‖, Finfine, Ethiopia
Megeleta Oromia, (2009). The Oromia Regional State: the ―Bureau of Land and
Environmental Protection Proclamation, Proclamation No. 147/2009‖, Finfine,
Ethiopia
Melitz, Marc J. (2005). “When and how should infant industries be protected?” Journal
of International Economics 66: 177–96.
223
Mengistae, T., Doss, C. R., & Olson, C. (1991). Social accounts of three Ethiopian
villages: a study of institutions and policy. Issues in African rural development
1991. 1-20.
Merzouk B, Madani K, Sekki A (2010). Using eclectrocogulation-electrofication
technology to treat synthetic solution and textile wastewater, two case studies.
Desalination 250: 573-577
Michael, B., and Collin, F. (2001). Towards More Sustainable Land uses: Advice to the
European Commission for Policy and Action. A Working Group on Sustainable
Land Use
Minghong, T., Xiubin L., Hui, X., Changhe, L. (2004). Urban land expansion and arable
land loss in China: A Case study in Tianjin-Hebel region: Land Use Policy, 22,
187-196.
Minh Khanh (2009). ―Protection of Ice land‖.
http//.www.vovnews.vn?Utilities/PrintView.aspx?ID=117933. Retrieved:
17/2/2014
Mo FED (2012). Federal Democratic Republic of Ethiopia: Ministry of Finance and
Economic Development: Annual Progress Report for F.Y. 2011/12. Growth and
Transformation Plan, Addis Ababa, Ethiopia
MoFED (2010). The Federal Democratic Republic of Ethiopia, Ministry of Finance and
Economic Development: Growth and Transformation Plan (GTP) 2010/11-
2014/15, Addis Ababa, Ethiopia.
MoFED (2012). Annual Progress Report for F.Y. 2011/12. Growth and Transformation
Plan. Ministry of Finance and Economic Development, Federal Democratic
Republic of Ethiopia, Addis Ababa, Ethiopia.
MoFED (2014). FDRE, Ministry of Finance and Economic Development: Growth and
Transformation Plan Annual Progress Report for F.Y. 2012/13, Addis Ababa,
Ethiopia
MoFED, (2013). Federal Democratic Republic of Ethiopia: Ministry of Finance and
Economic Development: Annual Progress Report for F.Y. 2011/12 Growth and
Transformation Plan, Addis Ababa, Ethiopia
224
Mohammed, A. (2002). Industrial Pollution and Its Impact on the Little Akaki River, Msc
Thesis, Faculty of Engineering, Loughborough University, UK.
MoLSA (2009). Federal Democratic Republic of Ethiopia, Ministry of Labor and Social
Affairs (MoLSA): National Employment Policy and Strategy of Ethiopia, Addis
Ababa, Ethiopia
MoTI (2004). Ministry of Trade and Industry Final Report on Creation of Sub-
contracting and Networking Arrangement for the Manufacturing Sector.
Industrial Policies and Strategies, V III, MOTI, Addis Ababa, Ethiopia
MWU D (2013). The Federal Democratic Republic of Ethiopia: Ministry of Works and
Urban Development, Plan for Urban Development and Good Governance, Addis
Ababa, Ethiopia
Negarit Gazeta (2002). A Proclamation on the “Environmental Pollution Control
Proclamation No.300/2002", Addis Ababa, Ethiopia
Negarit Gazeta (2002). A proclamation on the “Environmental Impact Assessment
Proclamation No. 299/2002‖ Addis Ababa, Ethiopia
Negarit Gazeta (2002). Federal Democratic Republic of Ethiopia, ―The Investment
Proclamation, No, 456/2005”, Addis Ababa, Ethiopia
Negarit Gazeta (2005). ―Expropriation of Landholdings for Public Purposes and Payment
of Compensation Proclamation‖; Proclamation no. 455/2005, Addis Ababa,
Ethiopia. Pp. 3122-3132
Negarit Gazeta (2012). Re-enacted Investment Proclamation No. 769/2012. Proclamation
on Investment by the Councils of Ministers, Addis Ababa, Ethiopia
Negarit Gazeta (2012). Regulations No.270/2012: Investment Incentives and Investment
areas reserved for –Domestic investors, Addis Ababa, Ethiopia
Negarit Gazeta, (2005). ―The Establishment of the Federal Urban Planning Institute,
Proclamation‖, Proclamation No, 456/2005”, Addis Ababa, Ethiopia
Nguyen Thi, D., Lebailly, P., & Vu Dinh, T. (2010). Land conversion to industrialization
and its impacts on household food security in Red River Delta, Vietnam.
225
Nguyen Thi, D., Lebailly, P., & Vu Dinh, T. (2012). Agricultural land conversion for
industrialization: livelihood along rural-urban continuum and mechanism of social
differentiation in Hung Yen province, Vietnam.
Nguyen, T. H. H., Nguyen, T. T., & Ho, T. L. T. (2013). Effects of recovery of
agricultural land to life, the jobs of farmers in Van Lam distric, Hung Yen
province. Journal of Science and development, 11(1), 59-67.
Niemand, B. (2011). Transformation of agricultural and undeveloped land in the Boland
region of the Western Cape (MA Thesis; Stellenbosch University, South Africa).
NMS, (2013). Federal Democratic Republic of Ethiopia, National Meteorological Station
Report, Addis Ababa, Ethiopia
Odjegba, V. J., & Bamgbose, N. M. (2013). Toxicity assessment of treated effluents from
a textile industry in Lagos, Nigeria. African Journal of Environmental Science
and Technology, 6(11), 438-445.
Ohlsson, L. (2000). Livelihood conflicts: Linking poverty and environment as causes of
conflict (p. 16). Swedish International Development Cooperation Agency (SIDA).
OWWDSE, 2011. Finfine Surrounding Special Zone of Oromia, Integrated Land
Use Planning Study Project; final report (Unpublished document). Finfine
(Addis Ababa), Ethiopia.
Pagiola, S., & Holden, S. (2001). Farm household intensification decisions and the
environment In: Lee DR and Barrett CB (eds.) Tradeoffs or Synergies:
Agriculture Intensification, Economic Development and the Environment. CAB
International.
Pang, Y. L., & Abdullah, A. Z. (2013). Current status of textile industry wastewater
management and research progress in Malaysia: a review. Clean–Soil, Air, Water,
41(8), 751-764.
Paul, S. A., Chavan, S. K., & Khambe, S. D. (2012). Studies on characterization of textile
industrial waste water in Solapur city. International Journal of Chemical
Sciences, 10(2), 635-642.
226
Pauleit, S., Ennos, R., & Golding, Y. (2005). Modeling the environmental impacts of
urban land use and land cover change—a study in Merseyside, UK. Landscape
and urban planning, 71(2), 295-310.
Phuc, N. Q., Van Westen, A. C. M., & Zoomers, A. (2014). Agricultural land for urban
development: The process of land conversion in Central Vietnam. Habitat
International, 41, 1-7.
Polprasert, C., & Liyanage, L. R. J. (1996). Hazardous waste generation and processing.
Resources, conservation and recycling, 16(1), 213-226.
Porter, M. E., & Porter, M. P. (1998). Location, Clusters, and the" New" Microeconomics
of Competition. Business Economics, 7-13.
Prabu, P. C. (2008). Characterization of sewage wastewater and assessment of
downstream pollution along Huluka River of Ambo, Ethiopia.
Prakash and Sachidananda, (2004). Ground Water Pollution and Emerging
Environmental Challenges of Industrial Effluent Irrigation: A Case Study of
Mettupalayam Taluk, Tamilnadu; Madras School of Economics, India.
Preston, P. W. (1999). Development theory: An introduction. Siglo XXI.
Rahmato, D. (1991). Famine and survival strategies: A case study from Northeast
Ethiopia (No. 1). Nordic Africa Institute.
Ranganathan, K., Jeyapaul, S., & Sharma, D. C. (2007). Assessment of water pollution in
different bleaching based paper manufacturing and textile dyeing industries in
India. Environmental monitoring and assessment, 134(1-3), 363-372.
RDPS, (2003). Federal Democratic Republic of Ethiopia, Rural Development Policy and
Strategy, Addis Ababa, Ethiopia
Realization of ADLI‘s Targets? Ethiopian e-journal for Research and Innovation
Foresight 1(1), 19–35.
Regulations No.270/2012: Investments Incentives, Addis Ababa, Ethiopia
Regulations No.270/2014: Amendments made to the original Regulations No.270/2012
by the councils of ministers of Ethiopia
Renzaho, A. M., & Mellor, D. (2010). Food security measurement in cultural pluralism:
Missing the point or conceptual misunderstanding?. Nutrition, 26(1), 1-9.
227
Rigg, J. (2006). "Land, farming, livelihoods, and poverty: rethinking the links in the rural
South." World Development 34(1): 180-202.
Ritchie, J., Lewis, J., Nicholls, C. M., & Ormston, R. (Eds.). (2013). Qualitative research
practice: A guide for social science students and researchers. Sage.
Rostow, W. W. (1990). The stages of economic growth: A non-communist manifesto.
Cambridge university press.
Rudi, L. M., Azadi, H., & Witlox, F. (2012). Reconcilability of socio-economic
development and environmental conservation in Sub-Saharan Africa. Global and
Planetary Change, 86, 1-10.
Samat, N. (2006). Applications of geographic information systems in urban land use
planning in Malaysia.
Sambidi, P. R., & Harrison, R. (2003). Analysis of Site-Specific Determinants of
Location Decisions for the US Broiler Industry. Agriculture Economics
Association, Mobile, AL.
Scherr, S. J. (2000). A downward spiral? Research evidence on the relationship between
poverty and natural resource degradation. Food policy, 25(4), 479-498.
Scherr, S.J., Yadav, S., (1996). Land Degradation in the Developing World: Implications
for Food, Agriculture and the Environment to 2020. In: Food, agriculture and the
environment, discussion paper 14. International Food Policy Research Institute,
Washington.
Scoones, I. (1998). Sustainable rural livelihoods: a framework for analysis.
Scoones, I. (2009). Livelihoods perspectives and rural development. The Journal of
Peasant Studies, 36(1), 171-196.
Shaikh, M. A. (2009). Environmental issues related with textile sector. Pakistan Textile
Journal, 10, 36-40.
Shaikh, M. A. (2009). Environmental issues related with textile sector. Pakistan Textile
Journal, 10, 36-40.
Silberstein, J., Maser, C. (2000). Land-Use Planning for Sustainable Development,
Sustainable Urban Form, E and FN Spon, Taylor and Francis, London
228
Singh, D., Singh, V., & Agnihotri, A. K. (2013). Study of textile effluent in and around
Ludhiana district in Punjab, India. International Journal of Environmental
Sciences, 3(4), 1271-1277
Smith, V. L. (1971). The borrower‐lender contract under uncertainty. Economic Inquiry,
9(1), 52-56.
Soini, E. (2006). Livelihood, land use and environment interactions in the highlands of
East Africa.
Stellmacher, Till (2007): The historical development of local forest governance in
Ethiopia. From imperial times to the military regime of the Derg. In: Afrika
Spectrum 42(3). GIGA Institute of African Affairs, Hamburg
Stellmacher, Till (2013): Local forest governance in Ethiopia: Between legal pluralism
and livelihood realities. ZEF Working Paper 110, Center for Development
Research, Bonn
Tadele, F. (2009). Urban development and the displacement of rural communities around
Addis Ababa. Moving People in Ethiopia: Development, Displacement & the
State, 102.
Taffesse, A. S., Dorosh, P., & Asrat, S. (2011). Crop production in Ethiopia: regional
patterns and trends. International Food Policy Research Institute, Washington
DC.
Tan, M., Li. X., Xie, H. and Lu, Ch., (2004). Urban Land Expansion and Arable Land
Loss in China: A case study of Beijing-Tianjin - Hebei Region. Land Use Policy,
Vol. 22, 187-196
Tan, R., Beckmann, V., Berg, L., Qu, F. (2008). Governing farmland conversion:
Comparing China with the Netherlands and Germany. Land Use Policy, 26, 961–
974
Tan, S. (2015). Wastewater Management in Industrial Zones of the Vietnamese Mekong
Delta: A Socio-spatial Analysis of Environmental Management in a Transition
Economy (Doctoral dissertation, Bonn, Rheinische Friedrich-Wilhelms-
Universität Bonn, Diss., 2015).
229
Tariq, M., Ali, M., & Shah, Z. (2006). Characteristics of industrial effluents and their
possible impacts on quality of underground water. Soil Environ, 25(1), 64-69.
Thinh, H. B. (2009). Rural employment and life: challenges to gender roles in Vietnam‘s
agriculture at present. In FAOIFAD-ILO workshop on Gaps, trends and current
research in gender dimensions of agricultural and rural employment:
differentiated pathways out of poverty, Rome (Vol. 31).
Tian, X. (1999). China's regional economic disparities since 1978: main trends and
determinants (Vol. 21). World Scientific.
Tolossa, D. (2008). Development Theories: Modernization, Dependency and World
Systems Theories. Alternative Development: From Basic- Needs To
Empowerment. Lecture Notes, Department of Geography, NTNU, Norway
Tolossa, D. (2008). Understanding the Realities of Urban Poor and Their Food Security
Situations: A Case Study at Berta Gibi and Gemachu Safar in Addis Ababa City,
Ethiopia. Institute of Developing Economies, Japan External Trade Organization.
Toufique, K. A., & Turton, C. (2002). Hands not land: how livelihoods are changing in
rural Bangladesh.
Tüfekci, N., Sivri, N., and Toroz, I. (2007). Pollutants of Textile Industry Wastewater and
Assessment of its Discharge Limits by Water Quality Standards. Turkish Journal
of Fisheries and Aquatic Sciences Vol. 7: 97-103
Tuyen, T. Q. (2013). Livelihood Strategies for Coping with Land Loss among
Households in Vietnam's Sub-Urban Areas. Asian social science, 9(15), 33-46.
UNEP (1992). GEMS/ Water Operational Guide, 3rd
Edition, GEMS/W 92.1
UNIDO (2012). Making it: Industry for Development, A Quarterly Magazine,
Stimulating, critical and constructive forum for discussion and exchange about
the intersection of industry
https//:www.unido.org/fileadmin/user_media_upgrade/Resources/Publications/M
aking_It/MakingIt_11 single-pages_web.pdf (accessed on 16/09/2014).
USEPA (1997). Handbook for Monitoring Industrial Wastewater, Nashville, Tennessee,
USA
230
Valerial, P., Fiona, H. (2012). Peri-urban land conservation and development of
alternative food networks: Insights from a case study area in metropolitan
Barcelona (Catalonia), Spain. Land Use Policy 30, 94-105.
Van Dijk (1990). ―World bank and Alternative Industrialization Strategies‖ in Van Dijk,
Meine Pieter and Henrik Secher Marcuse (eds). Industrialization in the third
world: the need for alternative strategies, Frank Cass and co. ltd, England
Van Ha, N. T., Ananth, A. P., Visvanathan, C., & Anbumozhi, V. (2009). Techno policy
aspects and socio-economic impacts of eco-industrial networking in the fishery
sector: experiences from An Giang Province, Vietnam. Journal of Cleaner
Production, 17(14), 1272-1280.
Van Suu, N. (2009). Agricultural land conversion and its effects on farmers in
contemporary Vietnam. Focaal, 2009(54), 106-113.
Van Suu, N. (2009). Industrialization and Urbanization in Vietnam: How Appropriation
of Agricultural Land Use Rights Transformed Farmers‘ Livelihoods in a Peri-
Urban Hanoi Village? Final Report of an EADN Individual Research Grant
Project, EADN Working Paper, (38).
Verma, A. K., Dash, R. R., & Bhunia, P. (2012). A review on chemical
coagulation/flocculation technologies for removal of colour from textile
wastewaters. Journal of Environmental Management, 93(1), 154-168.
Vernengo, M. (2006). Technology, finance, and dependency: Latin American radical
political economy in retrospect. Review of Radical Political Economics, 38(4),
551-568.
Vidová, J. (2010). Industrial Parks-History, Present and it‘s Influence to the Employment.
Review of economic perspectives, 10(1), 41-58.
Watts, M (1983). Silent Violence: Food, Famine and Peasantry in Northern Nigeria.
Berkeley: University of California Press.
WHO (2008). Water pollutants: biological agents, dissolved chemicals, non-dissolved
chemicals, sediments, heat. WHO CEHA, Amman
231
WHO (2014). Global Database on the Implementation of Nutrition Action (GINA);
(https://extranet.who.int/nutrition/gina/en/policies/summary#E), accessed:
5/1/2014
Wikipedia free encyclopedia: Definition of Livelihood and Sustainable Livelihood;
https://en.wikipedia.org/wiki/Livelihood, 28/7/2015
Wilbard, J. Kombe. (2002). Institutionalizing the Concept of Environmental Planning
and Management: Successes and Challenges in Dar es Salaam. Ahmed, A.
(2011). Some of the major environmental problems relating to land use changes in
the coastal areas of Bangladesh: Journal of Geography and Regional Planning,
Vol. 4(1)
World Bank. (2011). Recognizing and reducing corruption risks in land management in
Vietnam. Hanoi: The National Political Publishing House. Su That.
Wu, J. (2008). Land Use Changes: Economic, Social and Environmental Impacts. A
Magazine of Food, Farm and Resource issues: 4th
Quarter • 23(4).
Wu, J., Fisher, M., Pascual, U. (2011): Urbanization and the viability of local agricultural
economies. Land Economics 87, 109–125.
www.ffe.ethiopia.org, 12/9/12
www.oecotextile.com (21/7/2014)
Xie, A. and Ahya, C. (2004). New tigers of Asia. India and China, A special economic
analysis. Morgan Stanley, Economic Trends, 26
Xu, W. (2004). The changing dynamics of land-use change in rural China: a case study of
Yuhang, Zhejiang Province. Environment and Planning A, 36(9), 1595-1615.
Yamane, T. (1967). Statistics: An Introductory Analysis, 2nd Ed., New York: Harper and
Row.
Yesuf, M., & Köhlin, G. (2009). Market Imperfections and Farm Technology Adoption
Decisions-A Case Study from the Highlands of Ethiopia.
Zaharia, C., Suteu, D., & Muresan, A. (2012). Options and solutions for textile effluent
decolorization using some specific physico-chemical treatment steps.
Environmental Engineering and Management Journal, 11(2), 493-509.
232
Zeleke, B. (2006). Impacts of urban development on the livelihoods of displaced people
in Addis Ababa: The case of Casanchis. Unpublished MA thesis, Addis Ababa
University, Addis Ababa.
Zhang, X., Mount, T. D., & Boisvert, R. N. (2004). Industrialization, urbanization and
land use in China. Journal of Chinese Economic and Business Studies, 2(3), 207-
224.
Zhen, N., Fu, B., Lü, Y., & Zheng, Z. (2014). Changes of livelihood due to land use
shifts: A case study of Yanchang County in the Loess Plateau of China. Land Use
Policy, 40, 28-35.
Zhong, T. Y., Huang, X. J., Zhang, X. Y., & Wang, K. (2011). Temporal and spatial
variability of agricultural land loss in relation to policy and accessibility in a low
hilly region of southeast China. Land Use Policy, 28(4), 762-769.
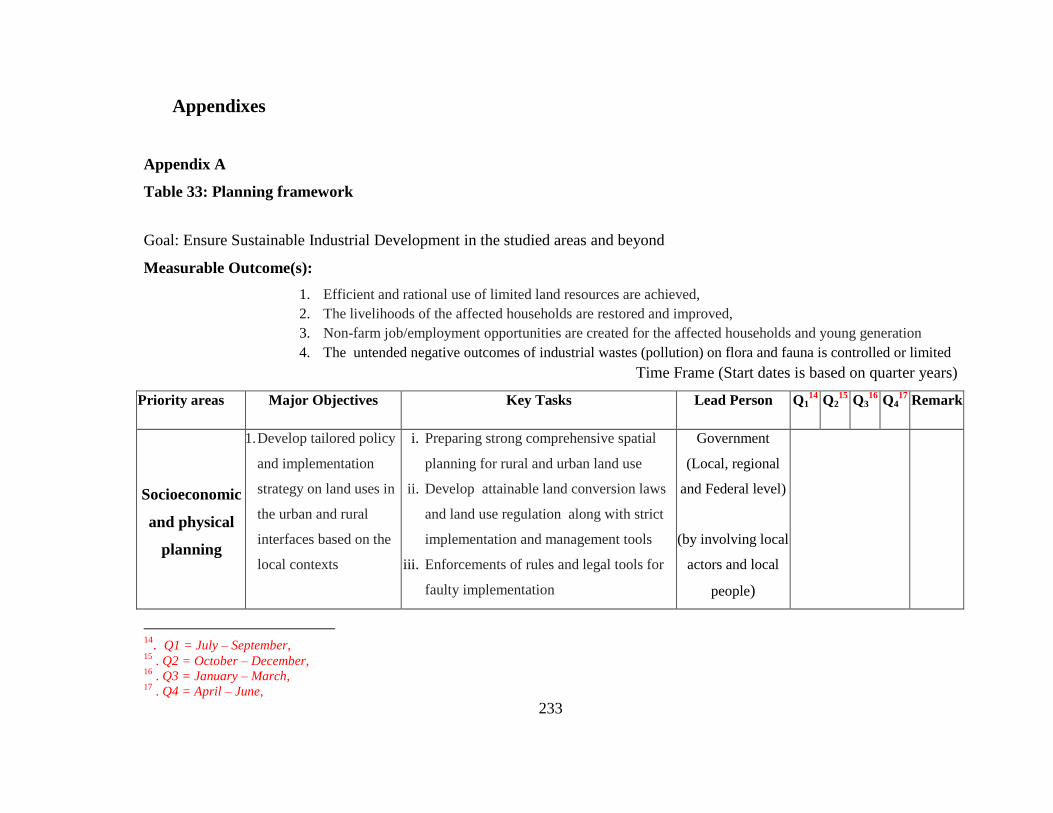
233
Appendixes
Appendix A
Table 33: Planning framework
Goal: Ensure Sustainable Industrial Development in the studied areas and beyond
Measurable Outcome(s):
1. Efficient and rational use of limited land resources are achieved,
2. The livelihoods of the affected households are restored and improved,
3. Non-farm job/employment opportunities are created for the affected households and young generation
4. The untended negative outcomes of industrial wastes (pollution) on flora and fauna is controlled or limited
Time Frame (Start dates is based on quarter years)
Priority areas Major Objectives Key Tasks Lead Person Q114
Q215
Q316
Q417
Remark
Socioeconomic
and physical
planning
1. Develop tailored policy
and implementation
strategy on land uses in
the urban and rural
interfaces based on the
local contexts
i. Preparing strong comprehensive spatial
planning for rural and urban land use
ii. Develop attainable land conversion laws
and land use regulation along with strict
implementation and management tools
iii. Enforcements of rules and legal tools for
faulty implementation
Government
(Local, regional
and Federal level)
(by involving local
actors and local
people)
14
. Q1 = July – September, 15
. Q2 = October – December, 16
. Q3 = January – March, 17
. Q4 = April – June,
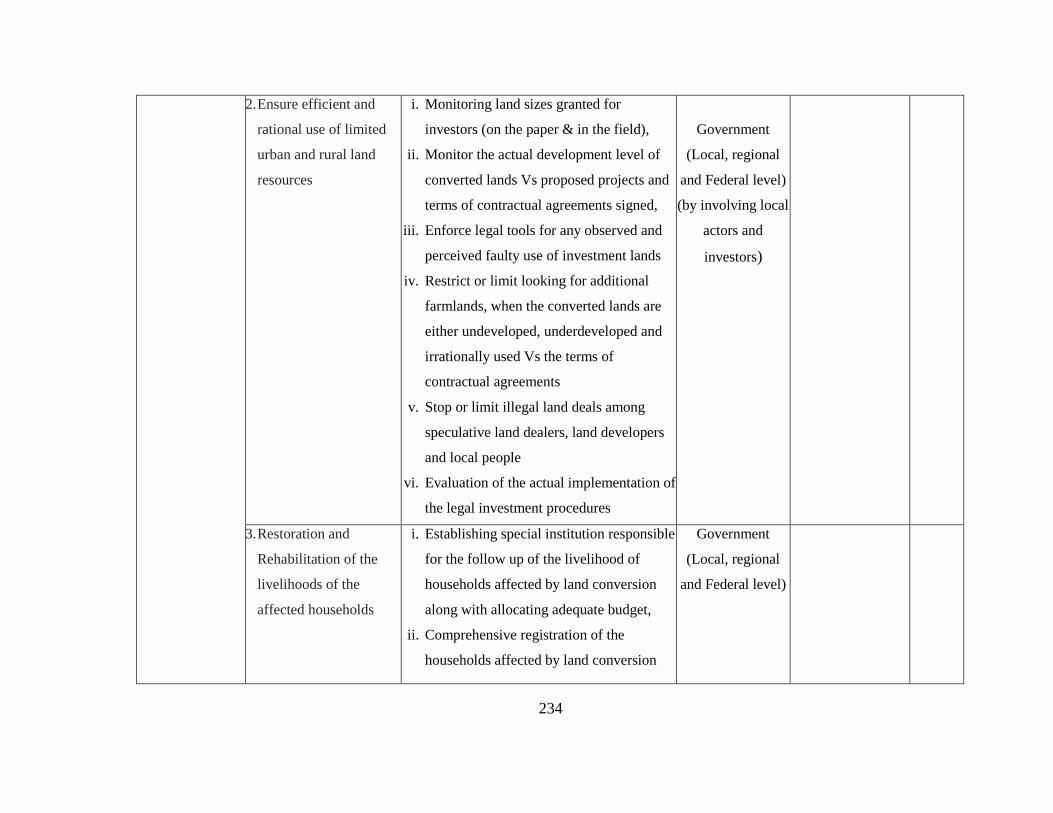
234
2. Ensure efficient and
rational use of limited
urban and rural land
resources
i. Monitoring land sizes granted for
investors (on the paper & in the field),
ii. Monitor the actual development level of
converted lands Vs proposed projects and
terms of contractual agreements signed,
iii. Enforce legal tools for any observed and
perceived faulty use of investment lands
iv. Restrict or limit looking for additional
farmlands, when the converted lands are
either undeveloped, underdeveloped and
irrationally used Vs the terms of
contractual agreements
v. Stop or limit illegal land deals among
speculative land dealers, land developers
and local people
vi. Evaluation of the actual implementation of
the legal investment procedures
Government
(Local, regional
and Federal level)
(by involving local
actors and
investors)
3. Restoration and
Rehabilitation of the
livelihoods of the
affected households
i. Establishing special institution responsible
for the follow up of the livelihood of
households affected by land conversion
along with allocating adequate budget,
ii. Comprehensive registration of the
households affected by land conversion
Government
(Local, regional
and Federal level)
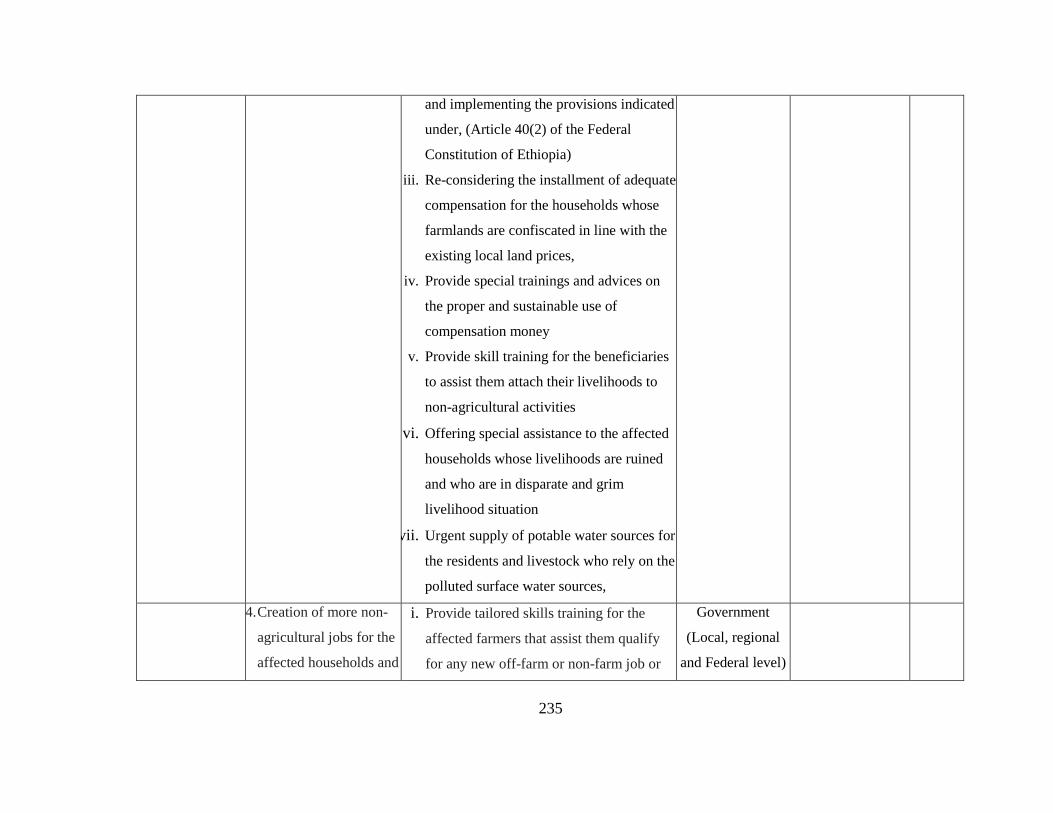
235
and implementing the provisions indicated
under, (Article 40(2) of the Federal
Constitution of Ethiopia)
iii. Re-considering the installment of adequate
compensation for the households whose
farmlands are confiscated in line with the
existing local land prices,
iv. Provide special trainings and advices on
the proper and sustainable use of
compensation money
v. Provide skill training for the beneficiaries
to assist them attach their livelihoods to
non-agricultural activities
vi. Offering special assistance to the affected
households whose livelihoods are ruined
and who are in disparate and grim
livelihood situation
vii. Urgent supply of potable water sources for
the residents and livestock who rely on the
polluted surface water sources,
4. Creation of more non-
agricultural jobs for the
affected households and
i. Provide tailored skills training for the
affected farmers that assist them qualify
for any new off-farm or non-farm job or
Government
(Local, regional
and Federal level)
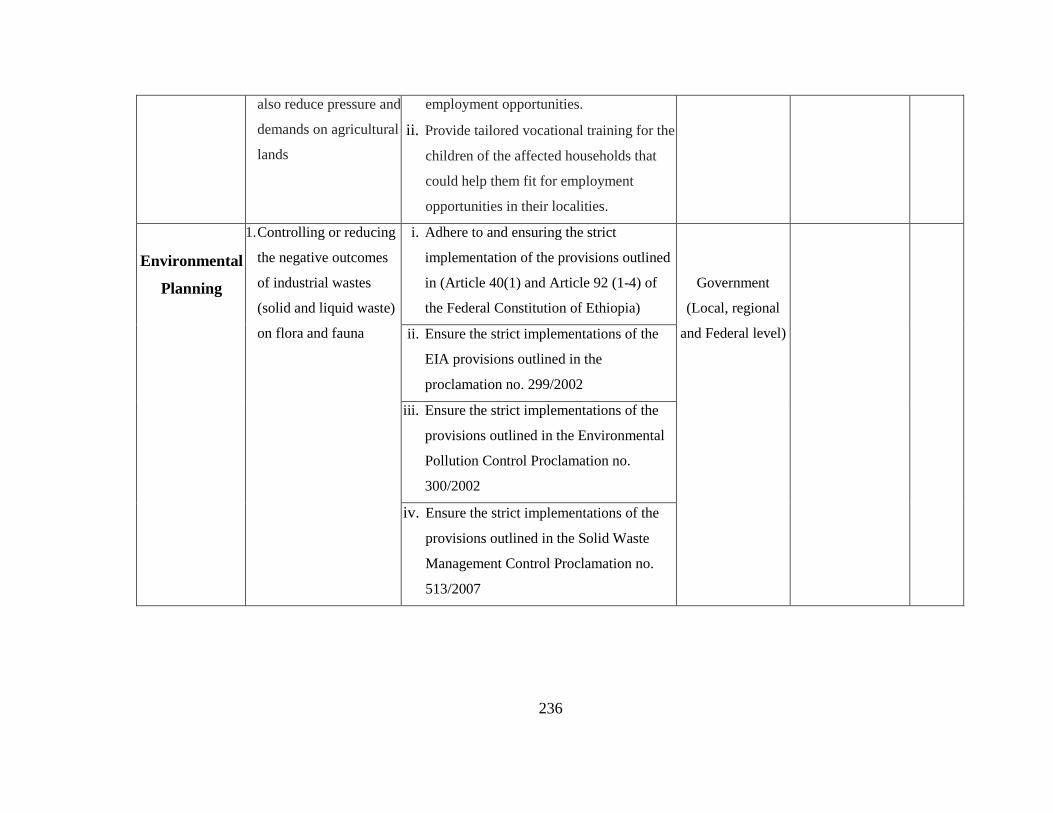
236
also reduce pressure and
demands on agricultural
lands
employment opportunities.
ii. Provide tailored vocational training for the
children of the affected households that
could help them fit for employment
opportunities in their localities.
Environmental
Planning
1. Controlling or reducing
the negative outcomes
of industrial wastes
(solid and liquid waste)
on flora and fauna
i. Adhere to and ensuring the strict
implementation of the provisions outlined
in (Article 40(1) and Article 92 (1-4) of
the Federal Constitution of Ethiopia)
Government
(Local, regional
and Federal level)
ii. Ensure the strict implementations of the
EIA provisions outlined in the
proclamation no. 299/2002
iii. Ensure the strict implementations of the
provisions outlined in the Environmental
Pollution Control Proclamation no.
300/2002
iv. Ensure the strict implementations of the
provisions outlined in the Solid Waste
Management Control Proclamation no.
513/2007
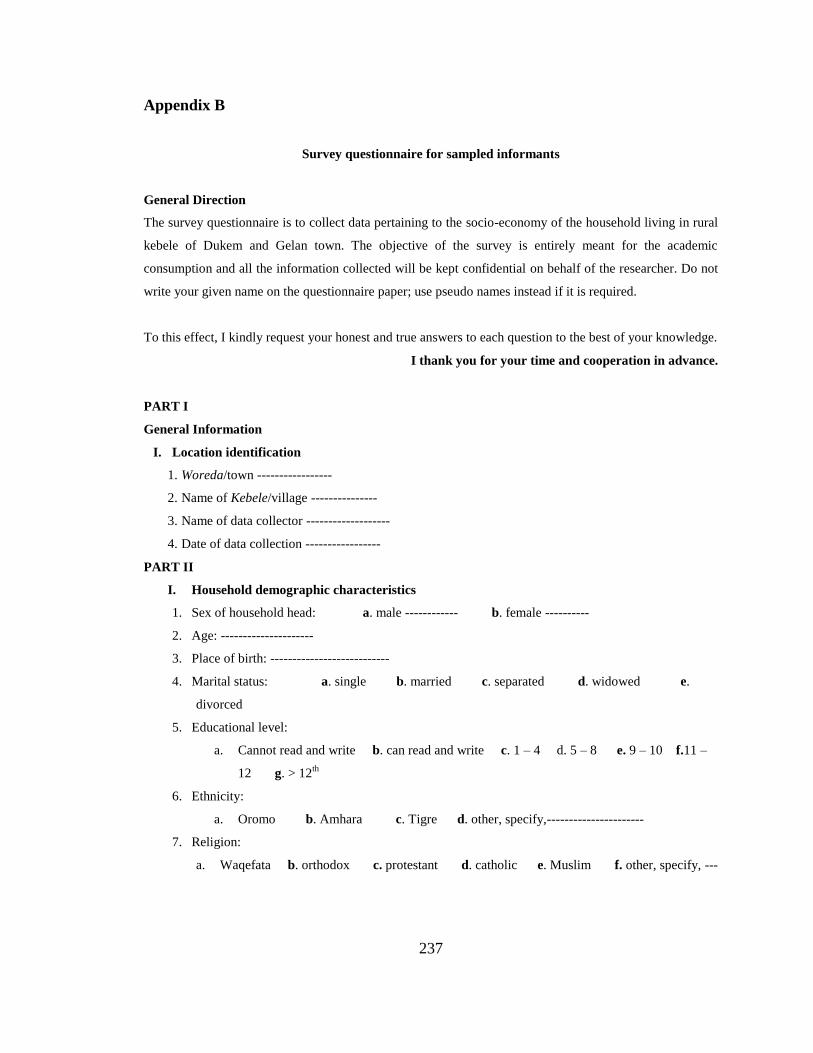
237
Appendix B
Survey questionnaire for sampled informants
General Direction
The survey questionnaire is to collect data pertaining to the socio-economy of the household living in rural
kebele of Dukem and Gelan town. The objective of the survey is entirely meant for the academic
consumption and all the information collected will be kept confidential on behalf of the researcher. Do not
write your given name on the questionnaire paper; use pseudo names instead if it is required.
To this effect, I kindly request your honest and true answers to each question to the best of your knowledge.
I thank you for your time and cooperation in advance.
PART I
General Information
I. Location identification
1. Woreda/town -----------------
2. Name of Kebele/village ---------------
3. Name of data collector -------------------
4. Date of data collection -----------------
PART II
I. Household demographic characteristics
1. Sex of household head: a. male ------------ b. female ----------
2. Age: ---------------------
3. Place of birth: ---------------------------
4. Marital status: a. single b. married c. separated d. widowed e.
divorced
5. Educational level:
a. Cannot read and write b. can read and write c. 1 – 4 d. 5 – 8 e. 9 – 10 f.11 –
12 g. > 12th
6. Ethnicity:
a. Oromo b. Amhara c. Tigre d. other, specify,----------------------
7. Religion:
a. Waqefata b. orthodox c. protestant d. catholic e. Muslim f. other, specify, ---
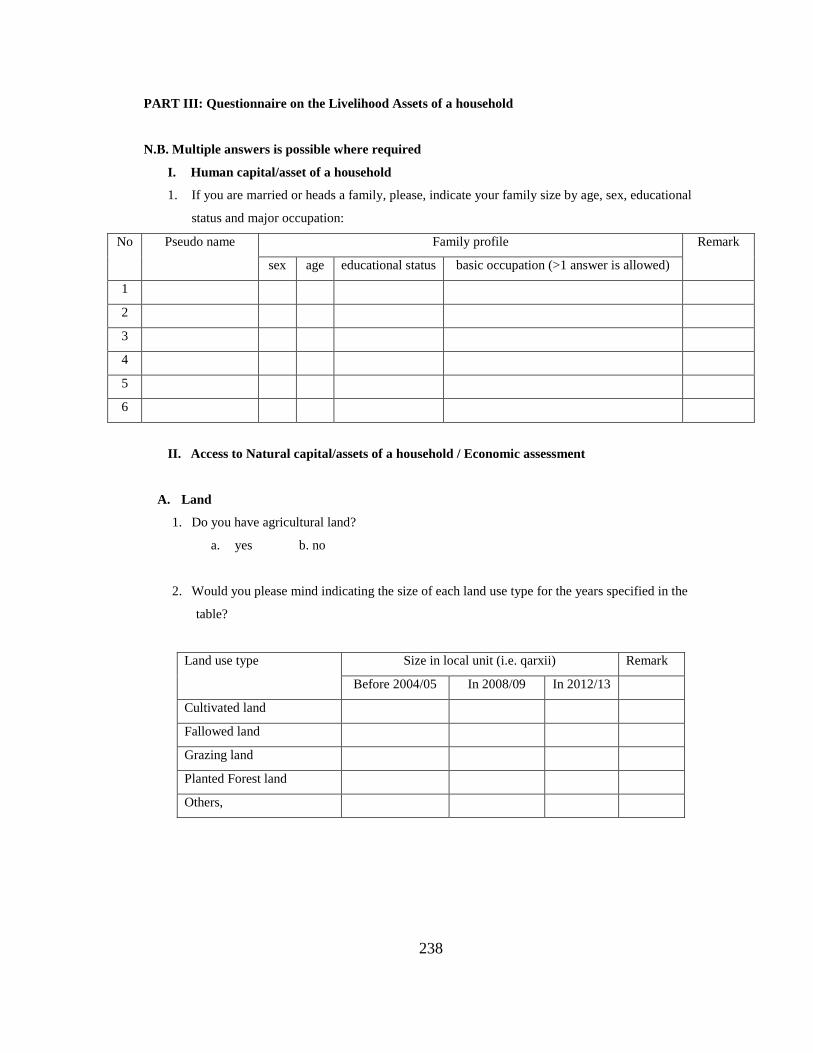
238
PART III: Questionnaire on the Livelihood Assets of a household
N.B. Multiple answers is possible where required
I. Human capital/asset of a household
1. If you are married or heads a family, please, indicate your family size by age, sex, educational
status and major occupation:
No
Pseudo name
Family profile Remark
sex age educational status basic occupation (>1 answer is allowed)
1
2
3
4
5
6
II. Access to Natural capital/assets of a household / Economic assessment
A. Land
1. Do you have agricultural land?
a. yes b. no
2. Would you please mind indicating the size of each land use type for the years specified in the
table?
Land use type Size in local unit (i.e. qarxii) Remark
Before 2004/05 In 2008/09 In 2012/13
Cultivated land
Fallowed land
Grazing land
Planted Forest land
Others,
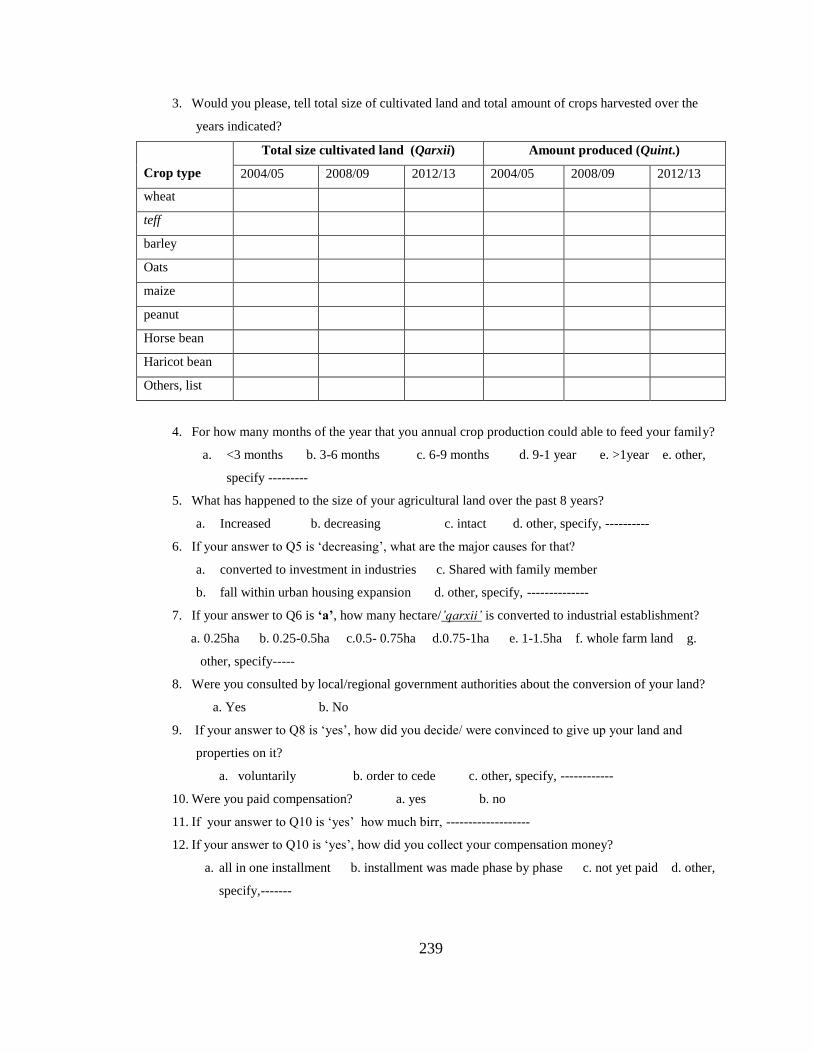
239
3. Would you please, tell total size of cultivated land and total amount of crops harvested over the
years indicated?
Crop type
Total size cultivated land (Qarxii) Amount produced (Quint.)
2004/05 2008/09 2012/13 2004/05 2008/09 2012/13
wheat
teff
barley
Oats
maize
peanut
Horse bean
Haricot bean
Others, list
4. For how many months of the year that you annual crop production could able to feed your family?
a. <3 months b. 3-6 months c. 6-9 months d. 9-1 year e. >1year e. other,
specify ---------
5. What has happened to the size of your agricultural land over the past 8 years?
a. Increased b. decreasing c. intact d. other, specify, ----------
6. If your answer to Q5 is ‗decreasing‘, what are the major causes for that?
a. converted to investment in industries c. Shared with family member
b. fall within urban housing expansion d. other, specify, --------------
7. If your answer to Q6 is ‘a’, how many hectare/‟qarxii‟ is converted to industrial establishment?
a. 0.25ha b. 0.25-0.5ha c.0.5- 0.75ha d.0.75-1ha e. 1-1.5ha f. whole farm land g.
other, specify-----
8. Were you consulted by local/regional government authorities about the conversion of your land?
a. Yes b. No
9. If your answer to Q8 is ‗yes‘, how did you decide/ were convinced to give up your land and
properties on it?
a. voluntarily b. order to cede c. other, specify, ------------
10. Were you paid compensation? a. yes b. no
11. If your answer to Q10 is ‗yes‘ how much birr, -------------------
12. If your answer to Q10 is ‗yes‘, how did you collect your compensation money?
a. all in one installment b. installment was made phase by phase c. not yet paid d. other,
specify,-------
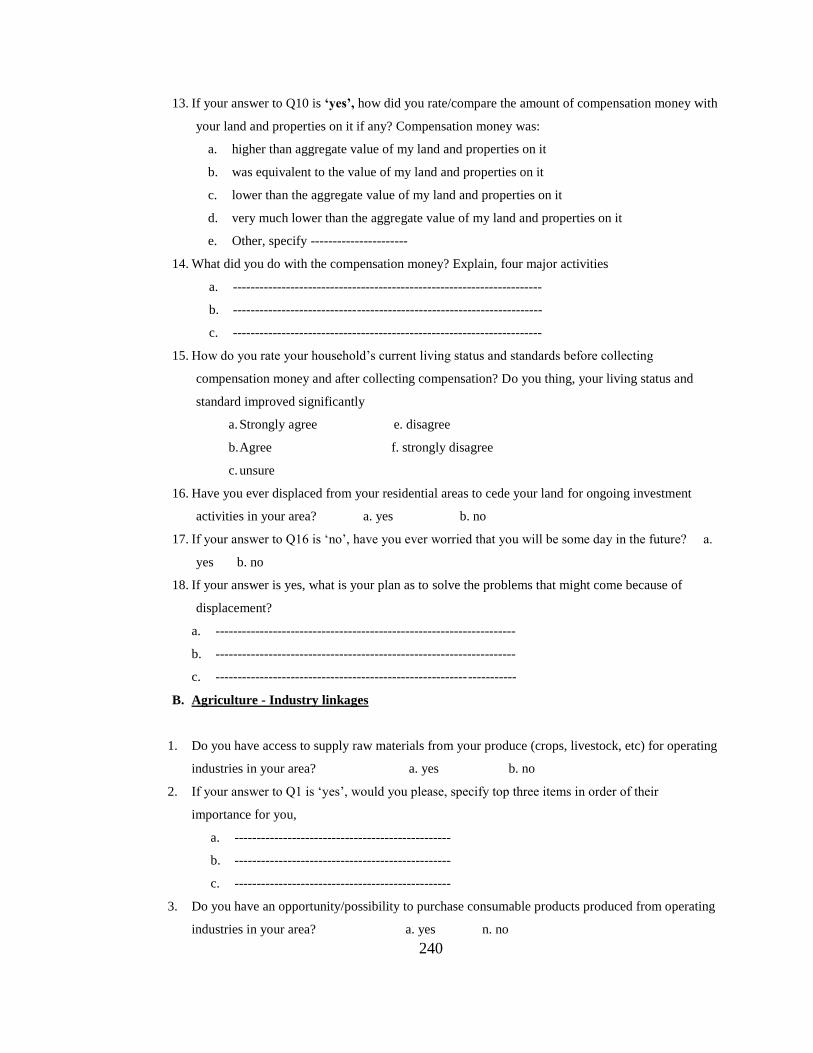
240
13. If your answer to Q10 is ‘yes’, how did you rate/compare the amount of compensation money with
your land and properties on it if any? Compensation money was:
a. higher than aggregate value of my land and properties on it
b. was equivalent to the value of my land and properties on it
c. lower than the aggregate value of my land and properties on it
d. very much lower than the aggregate value of my land and properties on it
e. Other, specify ----------------------
14. What did you do with the compensation money? Explain, four major activities
a. ----------------------------------------------------------------------
b. ----------------------------------------------------------------------
c. ----------------------------------------------------------------------
15. How do you rate your household‘s current living status and standards before collecting
compensation money and after collecting compensation? Do you thing, your living status and
standard improved significantly
a. Strongly agree e. disagree
b. Agree f. strongly disagree
c. unsure
16. Have you ever displaced from your residential areas to cede your land for ongoing investment
activities in your area? a. yes b. no
17. If your answer to Q16 is ‗no‘, have you ever worried that you will be some day in the future? a.
yes b. no
18. If your answer is yes, what is your plan as to solve the problems that might come because of
displacement?
a. --------------------------------------------------------------------
b. --------------------------------------------------------------------
c. --------------------------------------------------------------------
B. Agriculture - Industry linkages
1. Do you have access to supply raw materials from your produce (crops, livestock, etc) for operating
industries in your area? a. yes b. no
2. If your answer to Q1 is ‗yes‘, would you please, specify top three items in order of their
importance for you,
a. -------------------------------------------------
b. -------------------------------------------------
c. -------------------------------------------------
3. Do you have an opportunity/possibility to purchase consumable products produced from operating
industries in your area? a. yes n. no
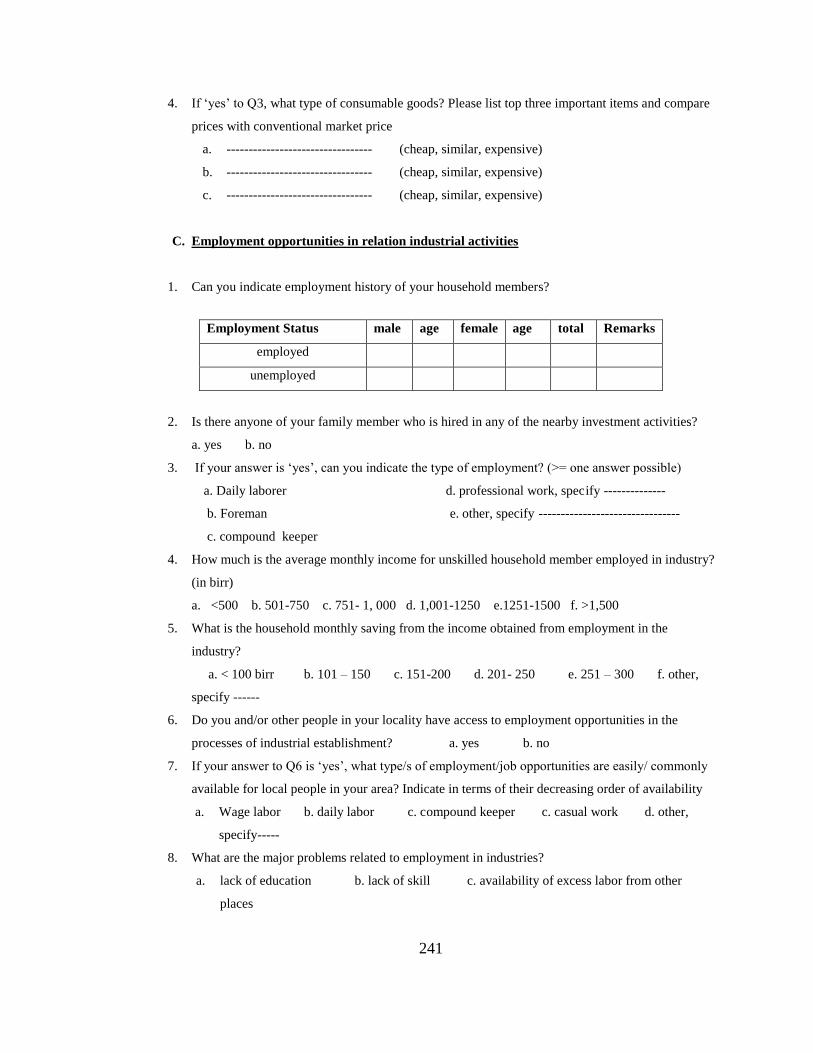
241
4. If ‗yes‘ to Q3, what type of consumable goods? Please list top three important items and compare
prices with conventional market price
a. --------------------------------- (cheap, similar, expensive)
b. --------------------------------- (cheap, similar, expensive)
c. --------------------------------- (cheap, similar, expensive)
C. Employment opportunities in relation industrial activities
1. Can you indicate employment history of your household members?
Employment Status male age female age total Remarks
employed
unemployed
2. Is there anyone of your family member who is hired in any of the nearby investment activities?
a. yes b. no
3. If your answer is ‗yes‘, can you indicate the type of employment? (>= one answer possible)
a. Daily laborer d. professional work, specify --------------
b. Foreman e. other, specify --------------------------------
c. compound keeper
4. How much is the average monthly income for unskilled household member employed in industry?
(in birr)
a. <500 b. 501-750 c. 751- 1, 000 d. 1,001-1250 e.1251-1500 f. >1,500
5. What is the household monthly saving from the income obtained from employment in the
industry?
a. < 100 birr b. 101 – 150 c. 151-200 d. 201- 250 e. 251 – 300 f. other,
specify ------
6. Do you and/or other people in your locality have access to employment opportunities in the
processes of industrial establishment? a. yes b. no
7. If your answer to Q6 is ‗yes‘, what type/s of employment/job opportunities are easily/ commonly
available for local people in your area? Indicate in terms of their decreasing order of availability
a. Wage labor b. daily labor c. compound keeper c. casual work d. other,
specify-----
8. What are the major problems related to employment in industries?
a. lack of education b. lack of skill c. availability of excess labor from other
places
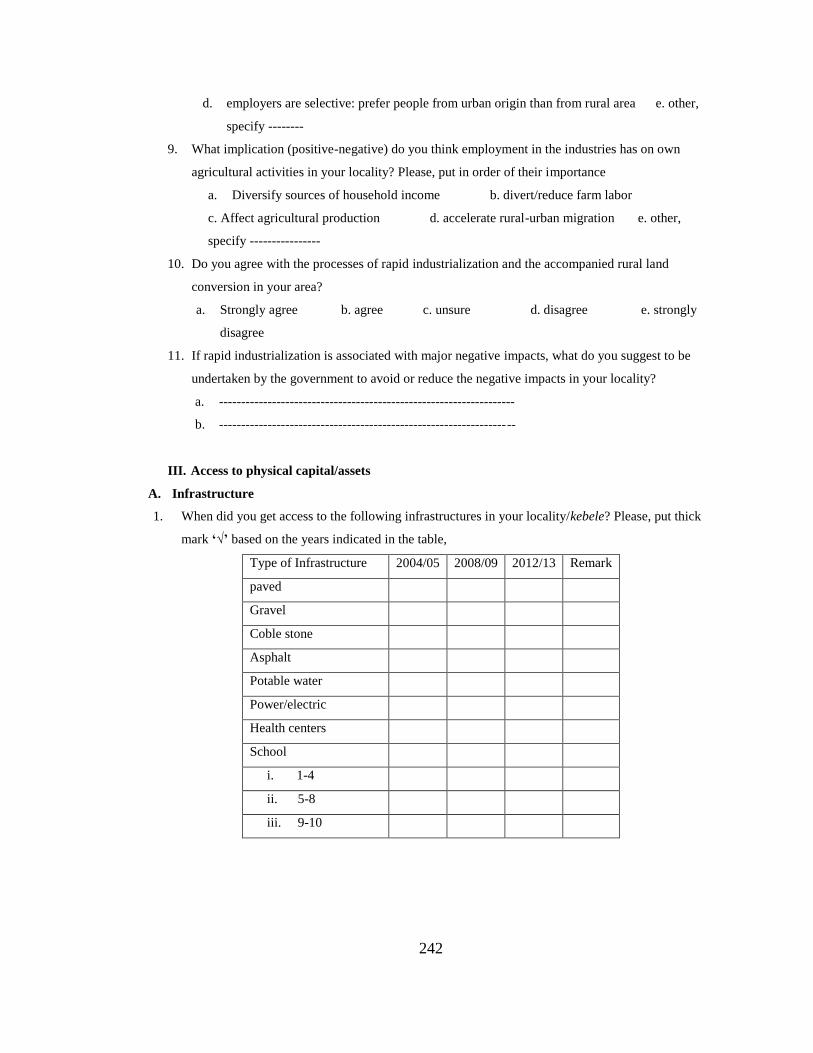
242
d. employers are selective: prefer people from urban origin than from rural area e. other,
specify --------
9. What implication (positive-negative) do you think employment in the industries has on own
agricultural activities in your locality? Please, put in order of their importance
a. Diversify sources of household income b. divert/reduce farm labor
c. Affect agricultural production d. accelerate rural-urban migration e. other,
specify ----------------
10. Do you agree with the processes of rapid industrialization and the accompanied rural land
conversion in your area?
a. Strongly agree b. agree c. unsure d. disagree e. strongly
disagree
11. If rapid industrialization is associated with major negative impacts, what do you suggest to be
undertaken by the government to avoid or reduce the negative impacts in your locality?
a. -------------------------------------------------------------------
b. -------------------------------------------------------------------
III. Access to physical capital/assets
A. Infrastructure
1. When did you get access to the following infrastructures in your locality/kebele? Please, put thick
mark ‘√’ based on the years indicated in the table,
Type of Infrastructure 2004/05 2008/09 2012/13 Remark
paved
Gravel
Coble stone
Asphalt
Potable water
Power/electric
Health centers
School
i. 1-4
ii. 5-8
iii. 9-10
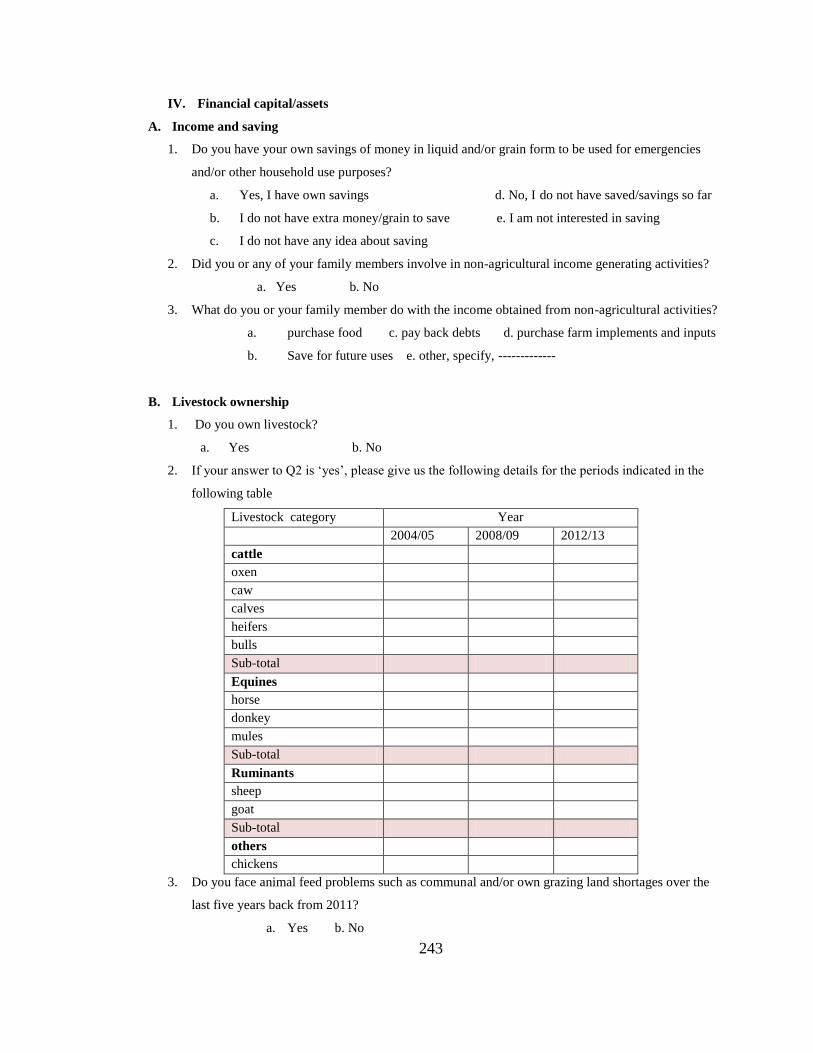
243
IV. Financial capital/assets
A. Income and saving
1. Do you have your own savings of money in liquid and/or grain form to be used for emergencies
and/or other household use purposes?
a. Yes, I have own savings d. No, I do not have saved/savings so far
b. I do not have extra money/grain to save e. I am not interested in saving
c. I do not have any idea about saving
2. Did you or any of your family members involve in non-agricultural income generating activities?
a. Yes b. No
3. What do you or your family member do with the income obtained from non-agricultural activities?
a. purchase food c. pay back debts d. purchase farm implements and inputs
b. Save for future uses e. other, specify, -------------
B. Livestock ownership
1. Do you own livestock?
a. Yes b. No
2. If your answer to Q2 is ‗yes‘, please give us the following details for the periods indicated in the
following table
Livestock category Year
2004/05 2008/09 2012/13
cattle
oxen
caw
calves
heifers
bulls
Sub-total
Equines
horse
donkey
mules
Sub-total
Ruminants
sheep
goat
Sub-total
others
chickens
3. Do you face animal feed problems such as communal and/or own grazing land shortages over the
last five years back from 2011?
a. Yes b. No
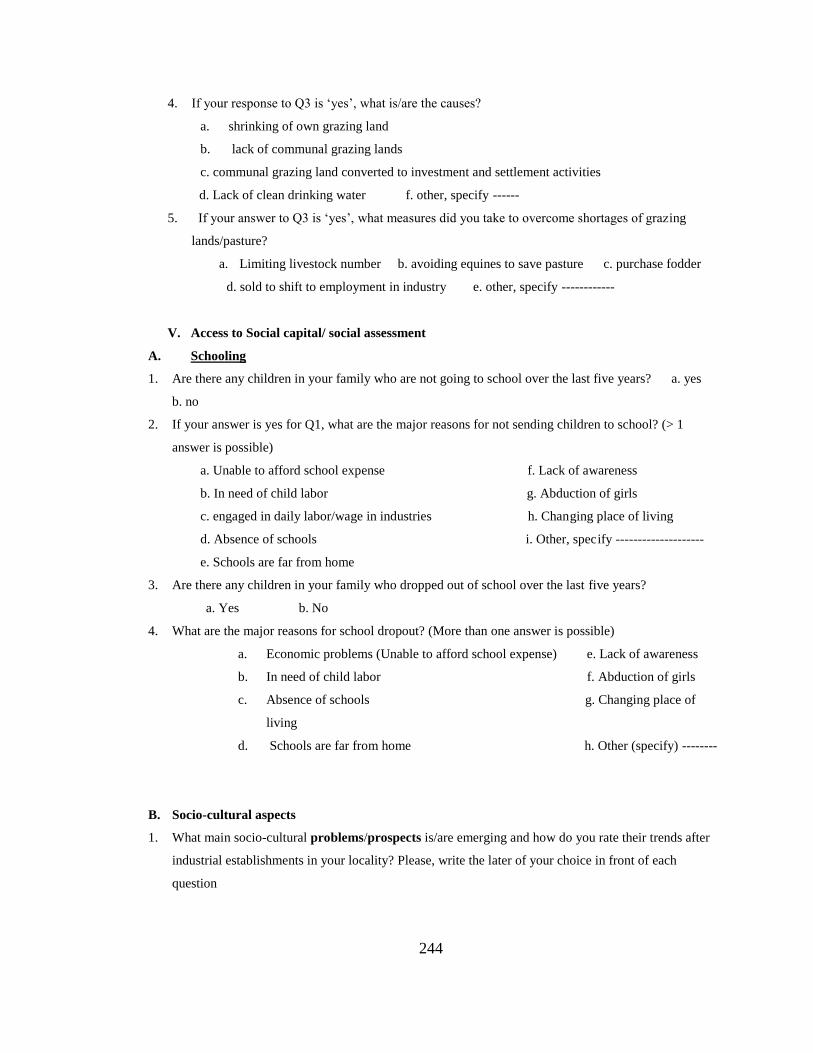
244
4. If your response to Q3 is ‗yes‘, what is/are the causes?
a. shrinking of own grazing land
b. lack of communal grazing lands
c. communal grazing land converted to investment and settlement activities
d. Lack of clean drinking water f. other, specify ------
5. If your answer to Q3 is ‗yes‘, what measures did you take to overcome shortages of grazing
lands/pasture?
a. Limiting livestock number b. avoiding equines to save pasture c. purchase fodder
d. sold to shift to employment in industry e. other, specify ------------
V. Access to Social capital/ social assessment
A. Schooling
1. Are there any children in your family who are not going to school over the last five years? a. yes
b. no
2. If your answer is yes for Q1, what are the major reasons for not sending children to school? (> 1
answer is possible)
a. Unable to afford school expense f. Lack of awareness
b. In need of child labor g. Abduction of girls
c. engaged in daily labor/wage in industries h. Changing place of living
d. Absence of schools i. Other, specify --------------------
e. Schools are far from home
3. Are there any children in your family who dropped out of school over the last five years?
a. Yes b. No
4. What are the major reasons for school dropout? (More than one answer is possible)
a. Economic problems (Unable to afford school expense) e. Lack of awareness
b. In need of child labor f. Abduction of girls
c. Absence of schools g. Changing place of
living
d. Schools are far from home h. Other (specify) --------
B. Socio-cultural aspects
1. What main socio-cultural problems/prospects is/are emerging and how do you rate their trends after
industrial establishments in your locality? Please, write the later of your choice in front of each
question
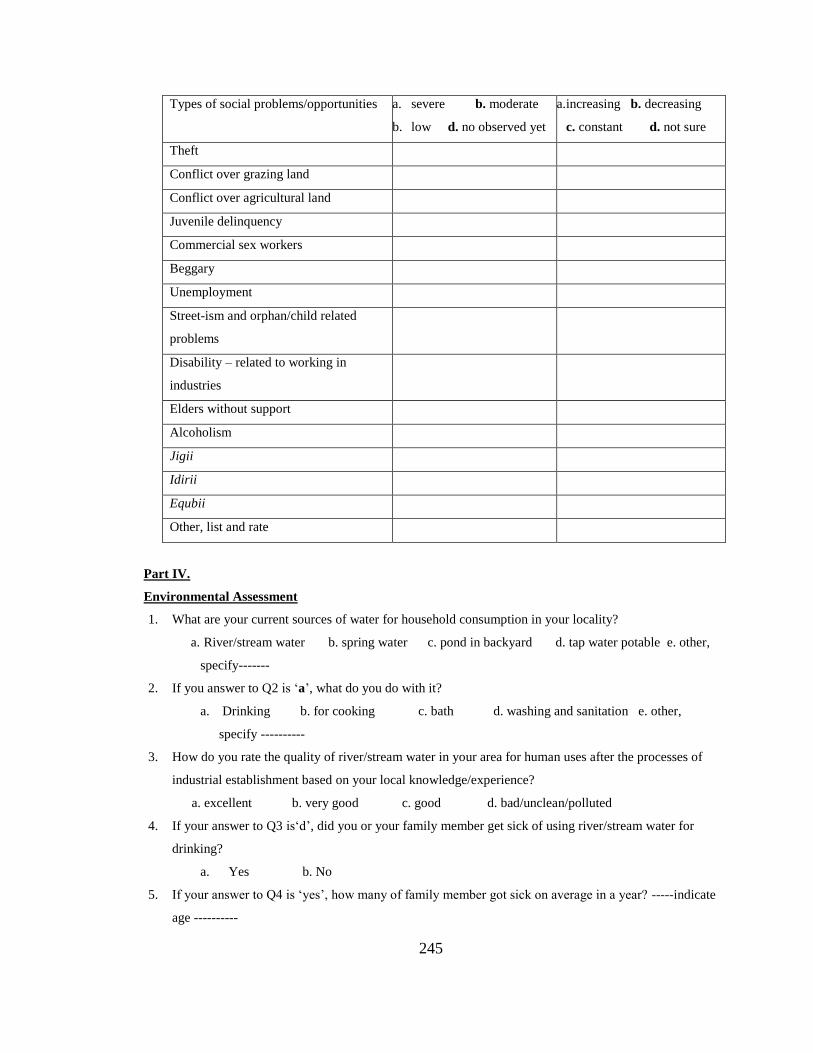
245
Types of social problems/opportunities a. severe b. moderate
b. low d. no observed yet
a. increasing b. decreasing
c. constant d. not sure
Theft
Conflict over grazing land
Conflict over agricultural land
Juvenile delinquency
Commercial sex workers
Beggary
Unemployment
Street-ism and orphan/child related
problems
Disability – related to working in
industries
Elders without support
Alcoholism
Jigii
Idirii
Equbii
Other, list and rate
Part IV.
Environmental Assessment
1. What are your current sources of water for household consumption in your locality?
a. River/stream water b. spring water c. pond in backyard d. tap water potable e. other,
specify-------
2. If you answer to Q2 is ‗a‘, what do you do with it?
a. Drinking b. for cooking c. bath d. washing and sanitation e. other,
specify ----------
3. How do you rate the quality of river/stream water in your area for human uses after the processes of
industrial establishment based on your local knowledge/experience?
a. excellent b. very good c. good d. bad/unclean/polluted
4. If your answer to Q3 is‗d‘, did you or your family member get sick of using river/stream water for
drinking?
a. Yes b. No
5. If your answer to Q4 is ‗yes‘, how many of family member got sick on average in a year? -----indicate
age ----------
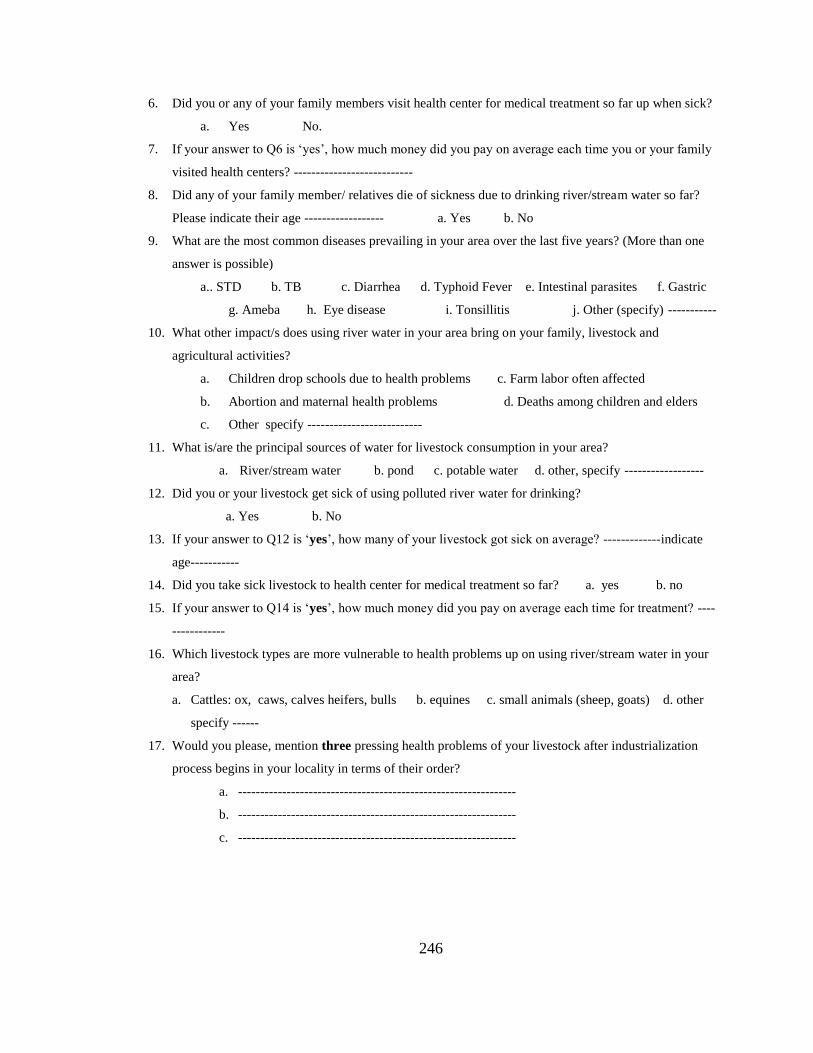
246
6. Did you or any of your family members visit health center for medical treatment so far up when sick?
a. Yes No.
7. If your answer to Q6 is ‗yes‘, how much money did you pay on average each time you or your family
visited health centers? ---------------------------
8. Did any of your family member/ relatives die of sickness due to drinking river/stream water so far?
Please indicate their age ------------------ a. Yes b. No
9. What are the most common diseases prevailing in your area over the last five years? (More than one
answer is possible)
a.. STD b. TB c. Diarrhea d. Typhoid Fever e. Intestinal parasites f. Gastric
g. Ameba h. Eye disease i. Tonsillitis j. Other (specify) -----------
10. What other impact/s does using river water in your area bring on your family, livestock and
agricultural activities?
a. Children drop schools due to health problems c. Farm labor often affected
b. Abortion and maternal health problems d. Deaths among children and elders
c. Other specify --------------------------
11. What is/are the principal sources of water for livestock consumption in your area?
a. River/stream water b. pond c. potable water d. other, specify ------------------
12. Did you or your livestock get sick of using polluted river water for drinking?
a. Yes b. No
13. If your answer to Q12 is ‗yes‘, how many of your livestock got sick on average? -------------indicate
age-----------
14. Did you take sick livestock to health center for medical treatment so far? a. yes b. no
15. If your answer to Q14 is ‗yes‘, how much money did you pay on average each time for treatment? ----
------------
16. Which livestock types are more vulnerable to health problems up on using river/stream water in your
area?
a. Cattles: ox, caws, calves heifers, bulls b. equines c. small animals (sheep, goats) d. other
specify ------
17. Would you please, mention three pressing health problems of your livestock after industrialization
process begins in your locality in terms of their order?
a. ---------------------------------------------------------------
b. ---------------------------------------------------------------
c. ---------------------------------------------------------------
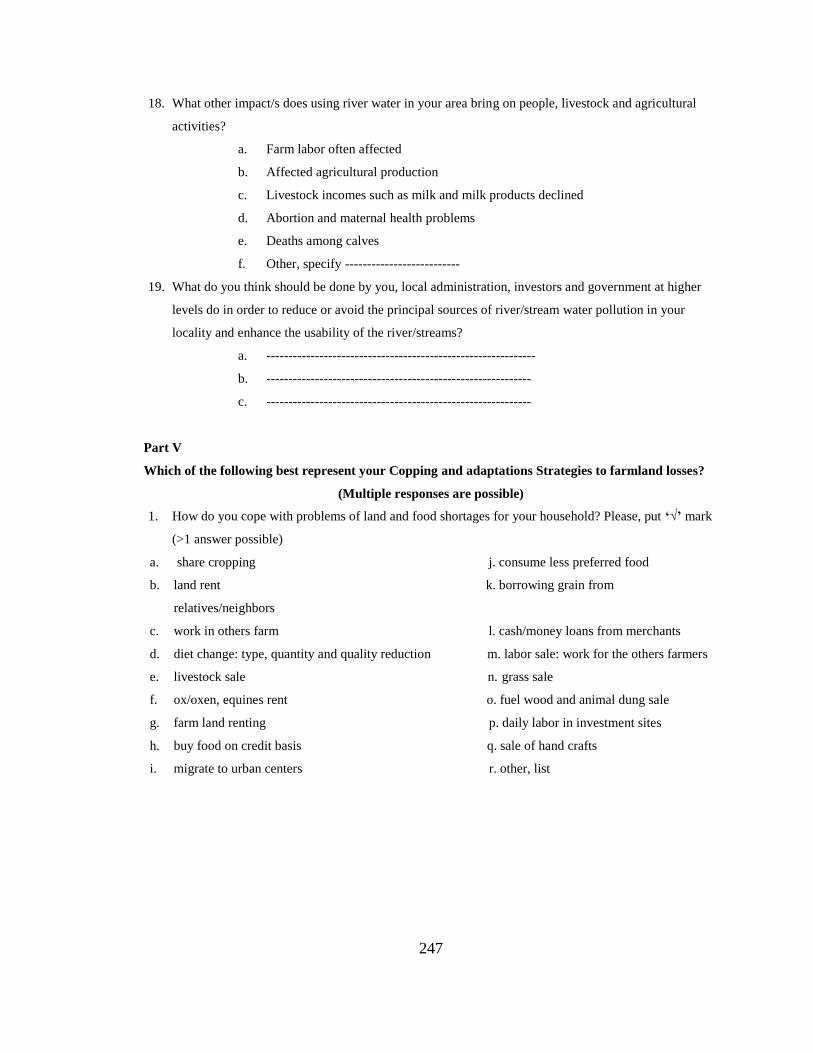
247
18. What other impact/s does using river water in your area bring on people, livestock and agricultural
activities?
a. Farm labor often affected
b. Affected agricultural production
c. Livestock incomes such as milk and milk products declined
d. Abortion and maternal health problems
e. Deaths among calves
f. Other, specify --------------------------
19. What do you think should be done by you, local administration, investors and government at higher
levels do in order to reduce or avoid the principal sources of river/stream water pollution in your
locality and enhance the usability of the river/streams?
a. -------------------------------------------------------------
b. ------------------------------------------------------------
c. ------------------------------------------------------------
Part V
Which of the following best represent your Copping and adaptations Strategies to farmland losses?
(Multiple responses are possible)
1. How do you cope with problems of land and food shortages for your household? Please, put ‘√’ mark
(>1 answer possible)
a. share cropping j. consume less preferred food
b. land rent k. borrowing grain from
relatives/neighbors
c. work in others farm l. cash/money loans from merchants
d. diet change: type, quantity and quality reduction m. labor sale: work for the others farmers
e. livestock sale n. grass sale
f. ox/oxen, equines rent o. fuel wood and animal dung sale
g. farm land renting p. daily labor in investment sites
h. buy food on credit basis q. sale of hand crafts
i. migrate to urban centers r. other, list
248
Appendix C
Checklists for informants involved in the Focus Group Discussion (FGD)
General Direction
The objective of the FGD is entirely meant for the academic requirements and all the information
collected will be kept confidential on behalf of the researcher. To this effect, I kindly request your
honest and true answers to each question to the best of your knowledge.
I thank you for your time and cooperation in advance.
PART I
1. What do you feel and understand the processes of rapid industrialization and agricultural land use
change in your locality?
2. Did you receive a notification letter for the local government about the conversion of your farmland?
3. How do you understand and reflect on the procedures involved in the land conversion in their
localities?
4. Were you paid compensation money and how do you rate the amount of compensation money?
5. How the effects of agricultural land/grazing land conversion was very minimal on the livestock
population in most of the study kebeles?
6. Were the processes of land conversion and/or development processes involved local communities
participation before any decision-making by local/regional governments?
7. According to your perception, the rapid industrialization of your locality is an opportunity or a
challenge for present and future generations.
8. Do you have any other worry/worries related with the expansion of investment activities in general
and manufacturing industries in particular in your area in the short and long run?
9. What are the major problems regarding crop production in the area?
10. Health problems of industrial effluents on the residents?
11. What are the main problems regarding livestock production?
Benefited from the expected trickle-down effects on the following?
12. Clean water supply?
13. Off-farm and/or non-farm employment opportunities?
14. Electricity and improved access roads?
15. How do you assess the availability current and future employment opportunities for you and local
people in your area?
249
Appendix D
A. Expert Interview: Focal persons in the city administration
Investment office; land administration office, environmental protection office and
agricultural office.
1. Do you or your office hand over notification letter in advance for a landholder as it is
stipulated in the proclamation no. 455/2005?
2. Regarding the terms of compensation, I had an interview with focal persons (i.e. finance
department) in urban administration of the study town. According to the views of these
interviewees, the decision to break the compensation money into installments was made
intentionally as a strategy to allow the beneficiaries use the money appropriately.
(Interview no. 5; 22/3/2014).
3. Hove your ever involved local people/farmers in the processes of valuation and
estimation of compensation money?
4. What elements are considered in the valuation process and how do you determine
compensation amount?
5. Based on your knowledge and experience, why do you think were the reasons or causes,
the government is not able to disburse compensation money for the affected households
in one installment?
6. Had your office or related organized awareness creating trainings or orientation on the
management and sustainable use of compensation money for the beneficiaries?
7. Based on your knowledge and experience, do you think, your office is strictly adhering to and
implementing the rules and procedures outlined for land expropriation?
8. According to your knowledge, what do thing are the causes for livestock sickness in the
study areas and why some livestock are more vulnerable to health problems than others?
9. How often you carry out field inspection activities?
10. What technical tools you employed to identify or ensure that industries are complying
with the environmental standards?
11. According to your own understanding and judgment, are you and your office is receiving
appropriate support: material, finical and moral support to ensure the environmental
sustainability by allowing the proper implementations of legal procedures in
place?‖(Interview no. 4, 5 and 6, 25/3/2014)
12. What do you think are the major causes of these health problems or causes of livestock illness in
this area?
250
B. Interview of the selected households affected by the land conversion and
community leaders
1. Did any portion of your farmland was confiscated by the government for industrialization
purpose?
2. Where you involved in the processes of land expropriation: consultation, property estimation?
3. How did you decide to cede your farmland?
4. Would you share knowledge and experience on why the total cultivate land size and crop
production is shrinking and the livelihood strategies pursued by the local people is not helping
to overcome food deficits at home?
251
Education and Sources of Internal Funding
International Funding Scholarships
Research Stay
252
Publications
Diriba, D, Hossein, A., Feyera, S., Ketema, A., Fatemeh, T., and Till, S. (2016): Urban
sprawl and its impacts on land use change in Central Ethiopia. The case of Dukem
town, in central Ethiopia; Journal of Urban Forestry & Urban Greening. Vol. 16,
pages 132–141, Elsevier
Diriba, D., Till, S., Hossein, A., Ketema, A. and Feyera, S. (2015): The Impact of
Industrialization on Land Use and Livelihoods in Ethiopia: Agricultural Land
Conversion around Gelan and Dukem Town, Oromia Region. In: Stellmacher,
Till (ed). Socio-economic Change in Rural Ethiopia. Understanding Local
Dynamics in Environmental Planning and Natural Resource Management. Peter
Lang. Frankfurt.
Diriba, D., Feyera, S., Till, S., Hossein, A., Steven, V. P. and Ketema, A. (2016).
Environmental and Health Impacts of Effluents from Textile Industries in
Ethiopia: The Case of Gelan and Dukem, Oromia Regional State (Under Review)
Diriba, D., Feyera, S., Till, S., Hossein, A., (2016). Livelihood Strategies Pursued by the
Households affected by Agricultural Land Expropriation: The Cases of Gelan and
Dukem town (Draft Manuscript for submission for a Journal)