Embed Size (px)
Citation preview

THE IMPACTS OF THE MEGA-AGREEMENTS ON THE BRICS:
in search for a new global governance for trade at the WTO
Vera Thorstensen
Lucas Ferraz1
I. INTRODUCTION
While some of the BRICS countries were still beginning its participation on the
multilateral trading system as members of the WTO, major players such as the United
States and the European Union were changing their attention from the WTO – where
negotiations of the Doha Round were at an impasse, despite the success of the Bali
Ministerial, to the negotiations of preferential trade agreements. In the field of
international trade, Brazil, India and South Africa were founding members of the
GATT. China acceded to the World Trade Organization – WTO in 2001, after 15 years
of negotiations. Russia has only acceded to the organization in 2012, after 19 years of
negotiations, becoming the last big economy to enter the WTO.
The difficulties in negotiating new rules for the multilateral system to deal with the
challenges of 21st century trade helped to diminish the centrality of the WTO as the
forum of rules negotiation and encouraged the main “rule makes” in the international
scenario to focus their efforts on preferential negotiations, where they could expand the
frontiers of international trade regulation, advance market access liberalization and
deepen economic integration.
In January, 2014, the US had 14 preferential trade agreements (PTAs) in force and the
EU had 34. The total number of PTAs increased from around 50 in 1991 to 3772. This
significant proliferation of preferential trade agreements changed the international trade
landscape, creating an increasing number trade rules and fragmenting international trade
regulation.
These agreements often present rules that go beyond the WTO framework (WTO-plus
rules) as in services or intellectual property or that deal with subjects outside the scope
of the organization, such as environment, labor clauses, competition and investments
(WTO-extra rules). Each major player presents its own model of rules regarding the
main issues of international trade, proposing such framework to its trade partners and,
1 Vera Thostensen and Lucas Ferraz are professor at the São Paulo Economic School of FGV. They are
coordinators of CGTI - Center on Global Trade and Investment. Carolina Muller, Rodolfo Cabral are
research assistants. 2 http://www.wto.org/english/tratop_e/region_e/region_e.htm
thus, expanding the application of rules that answer to their interests, in a clear exercise
of domination by the rules.
The BRICS countries are still placed outside this movement of deep integration trade
agreements. Even though some countries have started negotiating a significant number
of PTAs, they still lack an ambitious model of trade rules able to respond to their needs,
concentrating mainly in marker access.
The situation raises more concern with the launch of the two called mega-agreements:
the Trans-Pacific Partnership – TPP and the Transatlantic Trade and Investment
Partnership – TTIP. The TPP is an initiative of the US to increase their presence in the
Pacific region. The agreement encompasses 12 countries (Australia, Brunei, Canada,
Chile, Japan, Malaysia, Mexico, New Zealand, Peru, Singapore the US and Vietnam),
and 25% of international trade3. The TTIP aims to integrate the two major players in
international trade – the US and the EU, encompassing around one third of all
international trade flows4.
Both agreements aim to promote the elimination of tariff barriers and a substantial
reduction of non-tariff barriers amongst its members. Furthermore, they intend to
become a model for 21st century international trade rules. The TTIP shall end
longstanding divergences between the US and the EU on several aspects of international
trade regulation, establishing a new benchmark for all trade relations with one of these
partners, and certainly setting a new platform to the WTO.
In this scenario, what should be the role of BRICS? With the governance on
international trade shifting from the WTO to the mega-agreements, how can the BRICS
participate in international trade regulation and not become “rule-takers”? What are the
impacts of the mega-agreements to the BRICS economies and what should be done to
assure their insertion in global trade flows? What is the role of the BRICS to set a new
agenda for the WTO and rescuing its centrality as forum of trade negotiation?
The origin of the BRICS is relatively new. In 2001, Goldman Sachs created the
expression to call attention to these major emerging economies: Brazil, Russia, India
and China. The prospects of economic growth of these countries encouraged their
governments to transform it in a group of political coordination to discuss the main
themes of global governance: UN, IMF and World Bank. In 2011, South Africa was
included in the group.
With the economic difficulties faced by the World economy now, the big question is
what will be the role of the BRICS. In terms of trade, what is the role of these countries
in the WTO?
The main objective of this article is to give some attention to this question. Through
global equilibrium model simulations, this article will analyze the main impacts of the
3 https://www.dfat.gov.au/fta/tpp/
4 http://ec.europa.eu/trade/policy/countries-and-regions/countries/united-states/

mega-agreements to the BRICS economies and, in the following, present the main
actions the BRICS should promote to assure their place in international trade scenario.
II. THE IMPACT OF THE MEGA-AGREEMENTS ON BRICS:
REDUCTION OF TARIFFS AND NON-TARIFF BARRIERS
TTIP and TPP – the two mega-agreements shall increase trade flows and promote
economic growth amongst its partners, but they may also present negative effects on the
economies which are not participating in such agreements, which may suffer from the
impacts of trade diversion and from their isolation from the economic integration
promoted by the two agreements.
This section shall analyze the impacts of the mega-agreements on the BRICS sectorial
GDP as well as their exports and imports balances.
1. Modeling Issues
The GTAP computable general equilibrium model was used in the present simulations
in order to evaluate the first round effects of the costs and opportunities for the BRICS
of the creation of TTIP and TPP. For a description of the standard GTAP model, see
Hertel (1997).
The GTAP model is a global comparative static applied general equilibrium model. The
model identifies 57 sectors in 153 regions of the world. Its system of equations is based
on microeconomic foundations providing a detailed specification of household and
perfect competitive firm behavior within individual regions and trade linkages between
regions. In addition to trade flows, the GTAP model also recognizes global
transportation costs.
The GTAP model qualifies as a Johansen-type model, where solutions are obtained by
solving the system of linearized equations of the model. This model estimates the
impacts of external shocks (gains and losses of a PTA) through a comparative static
modeling (before and after the shock). A typical result shows the percentage change in
the set of endogenous variables (GDP, exports and imports, exchange rate and land
value) after a policy shock is carried out, compared to their values in the initial
equilibrium, in a given environment. The schematic presentation of Johansen solutions
for such models is standard in the literature (see Dixon et al (1992) and Dixon and
Parmenter (1996)).
For the modeling of the reduction of non-tariff barriers, this project used the same
methodology presented in the Ecorys Project, developed by Berden and Francois for the
European Commission, in 2009. Non-tariff barriers are considered as all non-priced and
non-quantitative restrictions to international trade in goods, services and investments.
These measures include customs procedures, regulatory measures, and standards,
amongst others.

2. Data Base
The GTAP 8 database combines detailed bilateral trade, transport and protection data
characterizing economic linkages among 129 regions, together with individual country
input-output data bases which account for inter-sectorial linkages within regions. The
dataset is harmonized and completed with additional sources to provide the most
accurate description of the world economy. The last version of GTAP is from 2007, but
the data in this simulation were updated.
The main applied protection data used in the GTAP 8 data base originates from ITC’s
MacMap database, which contains exhaustive information at the tariff line level. The
ITC database includes the United Nations Conference on Trade and Development’s
(UNCTAD’s) Trade Analysis and information system (TRAINS) data base, to which
ITC staff added their own data. The model transforms all specific tariffs in ad valorem
tariffs.
In order to capture the first round effects, the simulations were carried out using a
standard GTAP hypothesis, which considers perfect factor mobility for labor and capital
and imperfect factor mobility for land and natural resources. National aggregate supply
of factors of production is exogenous and production technology for firms is given.
The way the economy variables are affected by horizontal reductions in bilateral import
tariffs of the TTIP and TPP partners will depend on the resulting behavior of domestic
relative prices. Domestic relative prices of the TTIP and TPP partners will be altered in
such a way that import competition from the PTA partner will be favored, as the
economy becomes more preferentially open to trade. Overall efficiency in resource
allocation tends to be improved and, by the same token, possible gains from trade may
take national welfare a step up.
Notwithstanding the aggregate benefits from improved resource allocation, regions
might be adversely affected through re-orientation of trade flows – trade diversion – as
relative accessibility changes in the system. Thus bilateral aggregate gains from trade
are not necessarily accompanied by generalized regional gains in welfare. This issue of
trade diversion versus trade creation has been an important one in the international trade
literature, especially in the case of welfare evaluations of preferential trade agreements.
3. Results of the Simulations
The results in these simulations present the impacts for exports and imports, as well as
the gains and losses for the sectorial GDP, in order to evidence the sensitiveness of each
sector of the BRICS economies in relation to the TTIP and TPP.
The choice for impacts on sectorial GDP can be explained as an attempt to explore the
global effect of each PTA in a more complete evaluation since GDP includes the
impacts on production, exports and imports.

In this section, the main results from the simulations are presented.
Simulation 1
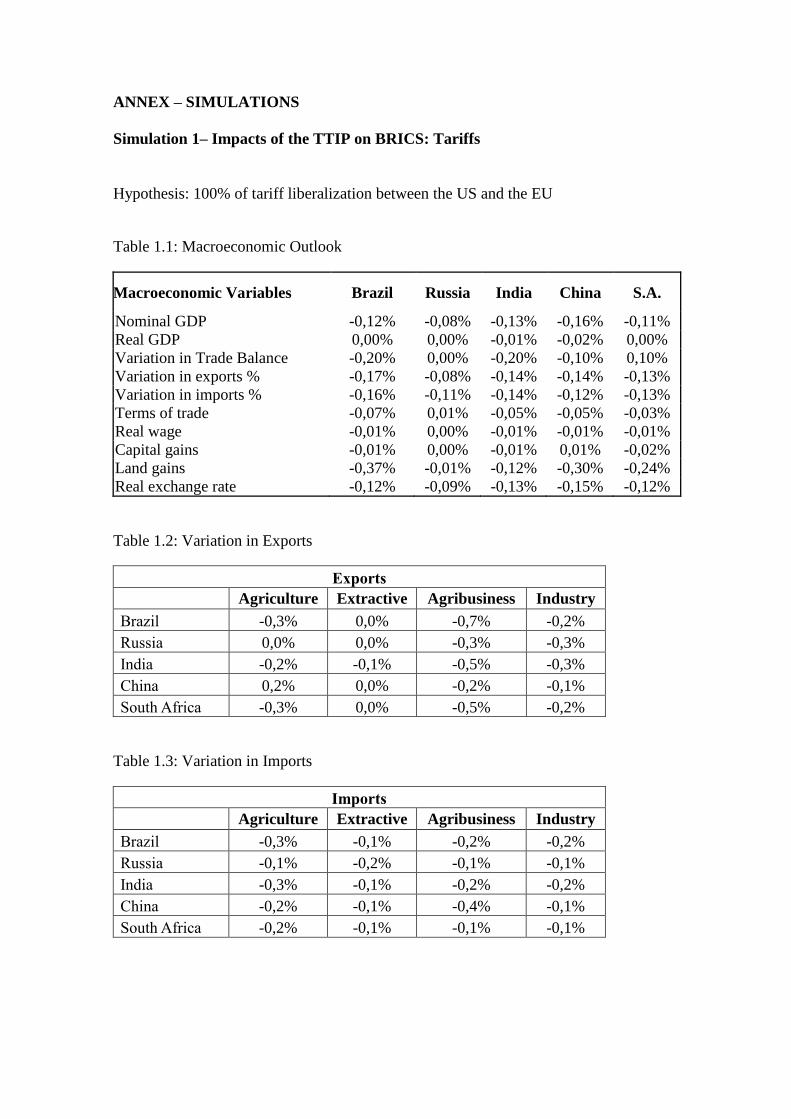
Simulation 1 presents the impacts of the TTIP on BRICS considering a scenario of
100% reduction of tariffs. The agreement results in slightly negative impacts for the
global exports of all BRICS countries, affecting their trade balance and resulting in a
small reduction of the GDP of these countries.
The most affected countries are Brazil, with a decline of 0.17% in its exports and 0.16%
in its imports, India with a decrease of 0.14% in both imports and exports, and China,
that presents a drop of 0,14% in its exports and of 0,12% in its imports.
Source: CGTI estimates
Because tariffs of the US and the EU are already low, the major market liberalization of
the TTIP will be promoted through the reduction of non-tariff barriers. The parties aim
an ambitious NTB reduction which will reduce costs incurred by exporters and will
allow an increase of trade flows.
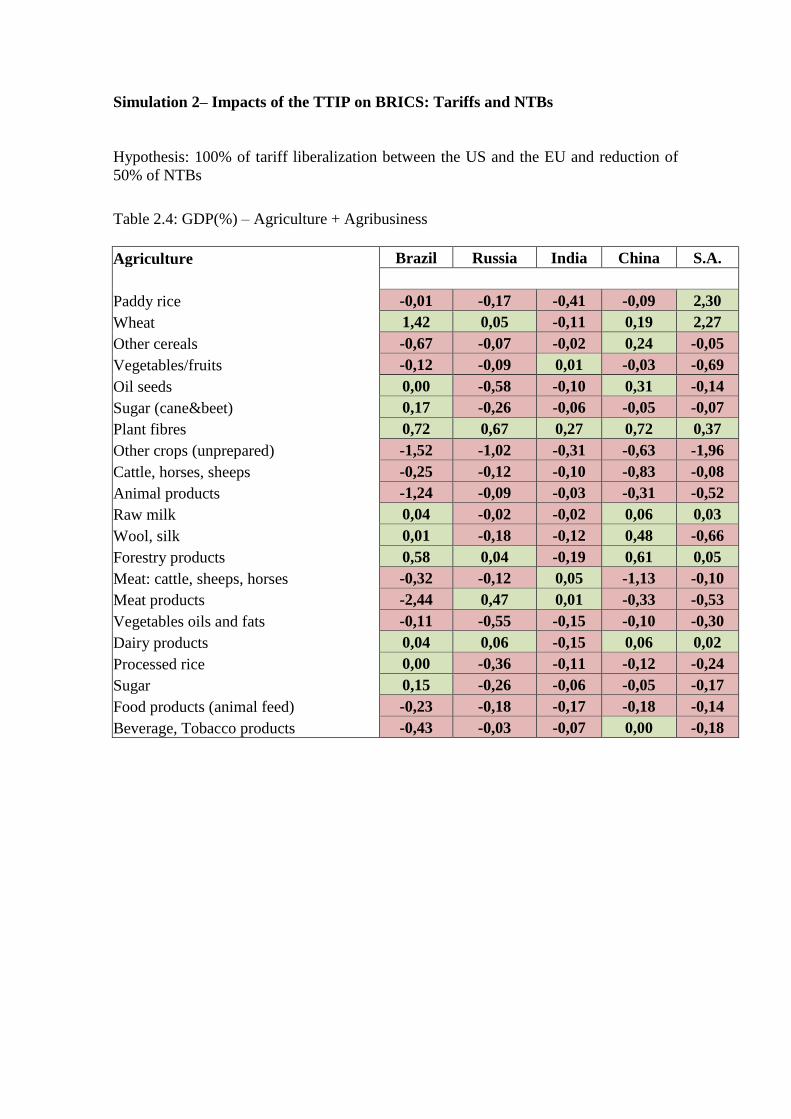
Simulation 2
Simulation 2 presents the impacts of TTIP on BRICS, considering the elimination of
tariffs combined to the elimination of 50% of NTBs between the US and the EU. Under
this scenario, the negative impacts of BRICS global trade flows and GDP are more
expressive.
When the reduction of NTBs is considered, the impacts of the TTIP become greater,
negatively affecting the BRICS economies. Brazilian exports and imports are affected
more severely by the reduction of tariff and non-tariff barriers in the scope of TTIP:
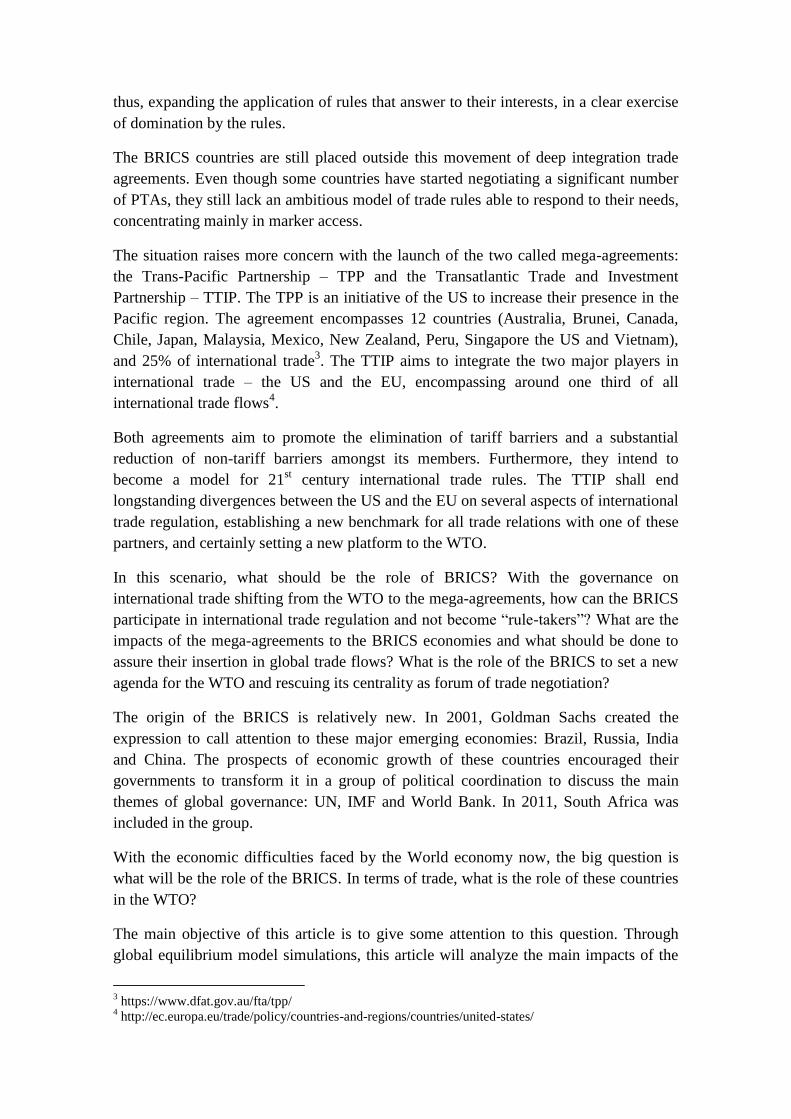
both exports and imports are reduced in 1.61%. China, South Africa, and India exports
and imports are also negatively affected in more than 1%, while Russia endures losses
by 0.8%.
BRICS will also face reductions between 0,6% to 1,2% of their total GDP already in the
first round effects of the agreement.
Source: CGTI estimates
The negative impacts can increase in the long term. The TTIP shall promote a deep
economic integration within its members. The benefits of this deep integration include
an increase in business opportunities (trade in goods and services and investments)
amongst the partners as well as the exchange of know-how and technology through the
internationalized production chain, enhancing the countries’ competitiveness and
negatively affecting trade partners that do not participate in this process of regional
integration.
The most affected sector for Brazil, India and South Africa, considering exports, will be
agriculture, while China and Russia will face more losses in the agribusiness sector. For
all four sectors (agriculture, extractive, agribusiness and industry) losses in global
exports of the five BRICS countries are verified.
Simulation 3
Simulation 3 presents the impacts of the TPP in the BRICS. Again, the simulation
included, at first, only the elimination of tariff barriers. Small losses are verified for all
BRICS countries, except for Russia, which benefits from a very small increase in its
exports.
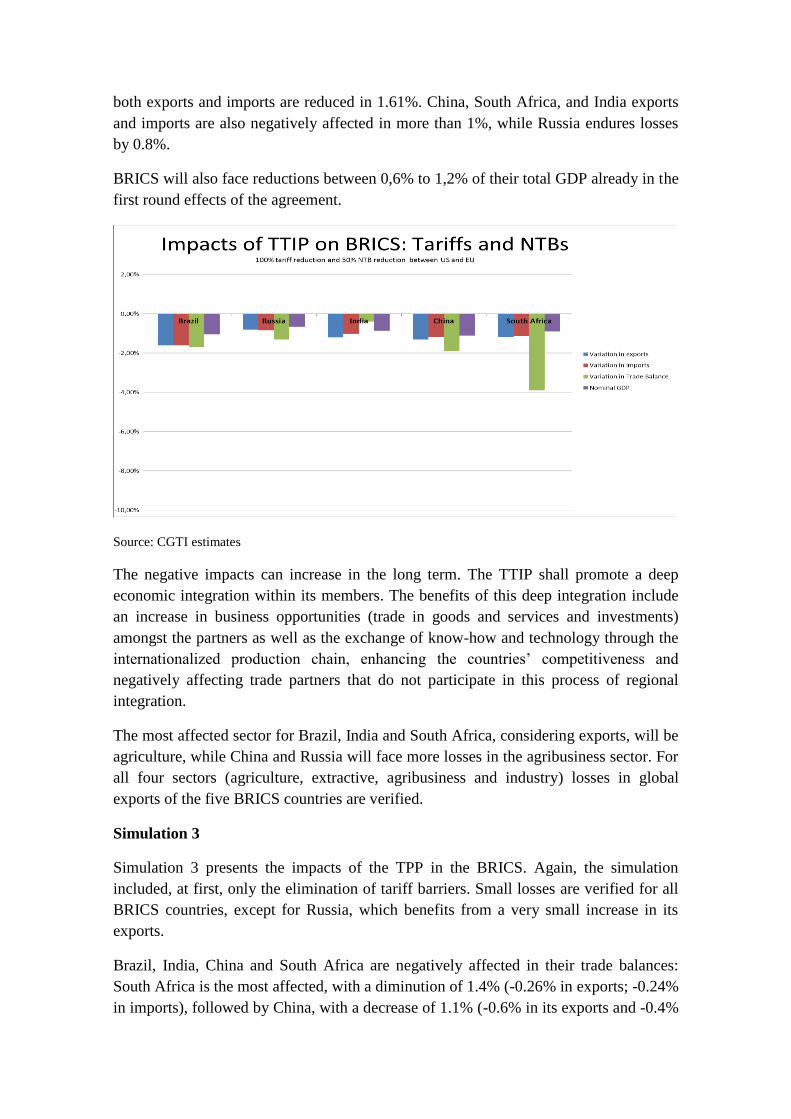
Brazil, India, China and South Africa are negatively affected in their trade balances:
South Africa is the most affected, with a diminution of 1.4% (-0.26% in exports; -0.24%
in imports), followed by China, with a decrease of 1.1% (-0.6% in its exports and -0.4%
in its imports); Brazil, that suffers a reduction of 0.4% (-0.37% in exports; -0.35% in
imports); and Russia, with a drop of 0.2% (0.01% in exports; -0.02% in imports).
India is the only country that presents a slightly increase of 0,4% in its trade balance,
but its exports and imports are still negatively affected in -0.26% and -0.16%
respectively.
Furthermore, all countries face a decrease in their nominal GDP.
Source: CGTI estimates
As in the TTIP, despite the impacts of the elimination of tariffs, the major market
liberalization in the TPP will be achieved through the negotiation of NTBs.
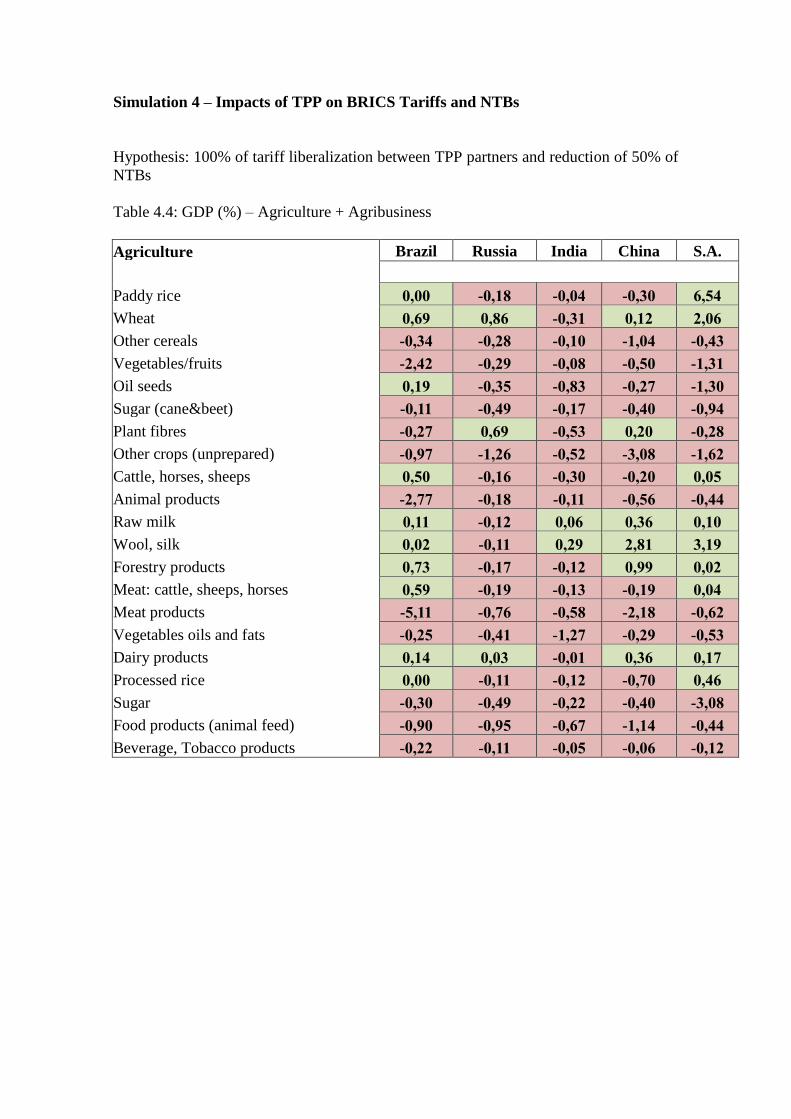
Simulation 4
Simulation 4 considers the impacts of the TPP on BRICS under the scenario of
elimination of tariff barriers combined with a 50% reduction of NTBs.
The reduction of NTBs significantly increases the negative impacts of the mega-
agreement to the BRICS. Losses from 1,7% to 3,1% are verified for global exports of
all countries.
Four of the five countries that form the BRICS group would have its trade balance
negatively affected. South Africa would endure the greatest reductions (-8.9%),
followed by China (-5.4%), Brazil (-2.5%) and Russia (-0.6%). Contrarily, India would
observe an increase of 1.8% in its trade balance, although both its exports and imports
would suffer a decrease of -2.1% and -1.4% respectively.
All countries will suffer losses of more than 1% of their nominal GDP.

Because the simulations consider only the first round effects of the mega-agreements,
the negative impacts can become even greater when considered the gains of
competitiveness brought by the agreement to its members in the long-term.
Source: CGTI estimates
The major losses in BRICS exports will be concentrated in the agribusiness, with drops
from 5% to 15% of global exports for the agribusiness sector, but all four sectors
(agriculture, extractive, agribusiness and industry) of the BRICs will have their exports
negatively affected, with the exception of Russia’s agriculture sector.
In summary, the mega-agreements will negatively affect the BRICS economies, which
will not be included in these preferential access offered by the partners of the two mega-
agreements. The higher the market liberalization promoted within the two agreements,
with an ambitious reduction of NTBs, higher will be the negative impacts suffered by
the BRICS.
The simulations show the potential harms of the proliferation of preferential trade
agreements, and specially, of the mega-agreements, on BRICS, which are being left
isolated from economic integration. With the creation of free trade areas, exporters from
the parties of these agreements will benefit from preferential access, diverting trade and
negatively affecting exports of BRICS products.
The impacts on specific sectors in the agriculture, extractive and industry sectors are
presented in the annex.
III. THE NEW RULES OF THE MEGA-AGREEMENTS
Besides the reduction of tariffs and non-tariff barriers, there is another factor of the
mega-agreements that may impact BRICS international trade: the 21st century rules that

are being negotiated within these agreements and that exceed the regulatory framework
of the WTO.
The mega agreements being negotiated mainly by the US and the EU are giving rise to
intense discussions over the content of the new rules applied for international trade.
The negotiations of the TTIP and the TPP present an agenda that aims to achieve
pioneering goals, including enlargement of market access in services and government
procurement, harmonization and mutual recognition of technical, sanitary and
phytosanitary measures, global value chains, regulatory harmonization and other aspects
that deal with the challenges of trade at the 21st century.
The agreements propose numerous WTO plus and extra rules such as enhanced
intellectual property protection, regulation of e-commerce, competition rules,
liberalization and protection of investments, regulation of trade related aspects of state
owned enterprises, provisions on small and medium sized enterprises, rules of
international supply chains, amongst other themes5.
Several rules negotiated within those agreements, including technical regulations and
intellectual property, might reach all the other players in the international trade scenario.
Since these rules suggest a modification in the national legislation of each partner to be
applied to all goods or services trade within the territory of the respective country,
BRICS products are likely to face technical and sanitary standards negotiated within the
TTIP or enhanced intellectual property protection in patents registered in any of the TPP
partners, which may negatively affect their exports.
The BRICS will have to adapt to a number of the requirements established by these two
agreements without having participated in the drafting of such rules, and thus, without
being able to impose its own interests and perspectives in the regulation of such themes.
Regarding market access the TTIP and the TPP aim at a substantial reduction of all
tariffs and non-tariff barriers, as well as important commitments in access on services.
Concerning rules of origin, the most relevant proposal in the TPP negotiations is the
“yarn forward” for textiles, already implemented in other agreements. This stringent
requirement confers origin only for textile products fully produced in one or more
member countries of the preferential agreement. In addition, the TPP will provide rules
allowing bilateral cumulation6. In other words, this means that the countries
participating in the agreement will be allowed to cumulate origin.
5 FERGUSSON, I.; COOPER, W.; JURENAS, R.; WILLIAMS, B., The Trans-Pacific Partnership
Negotiations and Issues for Congress, Congressional Research Service Report for Congress, junho de
2013, p. 47-48 and Interim Report to Leaders from the Co-Chairs EU-US High Level Working Group on
Jobs and Growth, June 2012
6 Cumulation is the term used to describe a system that allows originating products of country A to be
further processed or added to products originating in country B, just as if they had originated in country
B. The resulting product would have the origin of country
In regard to trade defense, the TPP maintains the antidumping rights as they are
regulated within the WTO. The subsidies theme, conversely, has proposals by Australia
and New Zealand that intend to limit their use in the agricultural sector. Safeguards are
also subject to new regulatory measures, particularly when related to monetary and
exchange rate policies, a proposal that is being pressed by some sectors within the US.
In the issue of technical, sanitary and phytosanitary barriers to trade, it is possible to
identify two approaches that may be reproduced both on the TPP and the TTIP. The
first one refers to the US model: in its PTAs they usually present mechanisms of mutual
recognition of these measures by the parties of the agreement. This mechanism
considers that the technical and sanitary requirements present on the legislation of each
country have equivalent level playing fields and can be recognized by the other country.
The second one is related to the European model: the theme is usually regulated through
harmonization (export of European standards) of each partner’s domestic legislations.
The creation of a consultation mechanism was also suggested, as well as a quick and
effective consultation mechanism for non-durable products, since the regular
mechanism can sometimes be long-lasting which may cause damages to the exports of
these type of products.
The negotiations on trade in services encompass new themes such as e-commerce and
regulatory coherence, to be achieved through an intergovernmental regulatory reform.
One of the objectives of the TTIP is to enhance the protection level related to
intellectual property, including, but not limited to, geographic indication,
pharmaceutical products, trademarks and patents, copyright, trade secrets, and e-
commerce.
The regulation of investments aims both liberalization and protection of international
investments and shall present and investor-state arbitration clause.
The new agreements also innovates in the environmental regulation, bringing clauses
that deal with illegal trade in endangered species of fauna and flora, climate change and
environmental goods.
Competition and labor clauses are also addressed in the negotiations of both TPP and
TTIP. Discussions related to the first subject envisage transparency, technical
assistance, and consumer protection; while the ones with reference to the second theme
make reference to multilateral commitments within International Labor Organization
(ILO).
Other themes are included in the negotiations of those agreements, such as: state owned
enterprises (SOEs) and the regulation of its investments and competition; value chains
and its implications to international trade; and small and medium-sized enterprises,
especially regarding the promotion of access to foreign markets.
The mega-agreements will bring s series of behind-the-boarders measures that will
impact not only the parties of the agreements but all other players that wish to export to
these partners. These exporters will be obliged to adapt with these requirements even
though there was no participation of their countries in the negotiation of these measures.
In this scenario, if the BRICS countries do not pursue a more active participation in the
drafting of 21st century trade rules, they will become a rule takers, instead of a rule
makers, bearing all the costs related to its late arrival in this new generation of
international trade rules.
IV. A ROLE FOR THE BRICS
With the mega-agreements and the deadlock of multilateral negotiations, the position of
BRICS in international trade is threatened. The countries that form the BRICS are
outside the negotiations of the mega-agreements and, consequently, of the market
liberalization that will be achieved and of the negotiation of new rules for 21st century
trade.
The US and the EU for decades have leaded the negotiations under the multilateral
trading system. With the enlargement of the WTO and the accession of several
developing countries, the negotiations became more complex. The active participation
of Brazil and India during the Doha Round, especially in agriculture, leading the
developing countries and opposing the propositions of the US and EU is a good
example of how the “old quad” (US, EU, Canada and Japan) lost its importance and
gave place to the “new quad” (US, EU, Brazil and India with China as a recently
acceded member). This created a new geometry of negotiating power, given more
influence to developing countries, and introducing difficulties to the US and the EU to
impose their position in multilateral negotiations as happened in all GATT negotiations.
The attention of the US and EU was, thus, drawn to the preferential sphere, where they
could negotiate individually with other trade partners, achieving to establish new market
access and drafting new trade rules. This movement helped the proliferation of
preferential trade agreements that is seen today.
The mega-agreements represented one step further. They aim more ambitious market
access and deeper and more innovative regulatory frameworks. By comprehending
major portions of world trade, these initiatives shall also be the base for the 21st century
international trade, diminishing the importance of multilateral negotiations.
With the deadlock of multilateral negotiations and outside of the mega-agreements, the
BRICS are isolated from international trade governance. Currently, there is only one
forum where these countries can negotiate and make their own interests regarding
international trade regulations prevail – it is the WTO.
The BRICS must reactivate the WTO as the major negotiation forum for international
trade regulation. The Ministerial Conference of Bali was an important achievement that
may help this goal. The conference approved the first multilateral agreement since the
creation of the WTO. Even though what was agreed in Bali represents just a small part
of the Doha package, its success gives a boost to multilateral negotiations.
The WTO remains as the only forum where the BRICS may exercise their pressure and
influence international trade governance. It is the only international trade forum where
all five countries participate, allowing all five countries to coordinate their positions,
strengthening their power of bargain. Under the WTO, the BRICS will be more able to
make their interests on the drafting of new trade rules prevail.
At the Bali Ministerial Conference, members have decided to prepare, within the
following 12 months, the work program on the remaining Doha Development Agenda
issues7. This is momentum for the BRICS to reactivate WTO negotiations and
undertake an active participation in global trade governance, defining the themes that
should integrate the post-Bali agenda and effectively influencing the drafting of a new
regulatory framework for international trade.
Proposals for the BRICS at the WTO can include:
- Enhancement of the transparent mechanism regarding PTAs. The WTO still
lacks an efficient mechanism that allows for a surveillance of preferential
agreements. The fragmentation of international trade regulation has severe
effects on the multilateral system. The WTO needs to better study each clause of
the several PTAs currently in force, analyze the compatibilities and
incompatibilities amongst them and with WTO rules, and discuss mechanisms to
assure coherence of international trade rules, avoiding the negative impacts of
fragmentation.
- Improvement of the mechanisms of notification and special trade concerns in the
Technical Barriers to Trade Committee and Sanitary and Phytosanitary
Committee. These mechanisms are important to the transparency of these non-
tariff barriers, which frequently constitute significant obstacles to international
trade. Special attention should be given to the issue of private standards, that
require new transparency mechanisms in order to avoid negative impacts on
trade.
- Improvement of market access and reduction of subsidies in agriculture.
Agriculture still presents higher tariffs and more flexible rules to subsidies,
which harms agricultural exports. The granting of subsidies, because it affects
all exporters, independently of their origin, is traditionally dealt on the
multilateral level. Commitments for the reduction of subsidies are not usual in
PTAs, since they would not constitute a preferential advantage, because all
exports competing with the subsided product would benefit from the reduction.
7 WTO, Ministerial Conference – Ninth Session, Bali Ministerial Declaration, Adopted on December
2013 (WT/MIN(13)/DEC), para. 1.11

The agricultural market is of great interest for the BRICS and the WTO
constitutes the ideal forum to discuss the reduction of barriers to these exports.
- Inclusion of new themes on the agenda of negotiations. Through 2014, WTO
members shall decide if future negotiations will remain restricted to the Doha
Agenda or new themes should be included. This is the proper momentum for the
BRICS to discuss which their priorities in international trade regulation are and
which themes shall object of future negotiations. To return to the old agenda of
the Doha Round will reintroduce competition, investment and public
procurement in the discussion and will divide the attention between the mega
and WTO to regulate these areas.
V. CONCLUSION
The mega-agreements will promote trade flows and economic growth amongst its
partners and will establish the pillars for the 21st century international trade regulation.
But they will also cause significant losses for the economies that are not part of these
agreements, which will suffer from losses in their exports and imports and will be
isolated from the creation of rules for new important trade issues. These countries will
be affected by the economic integration promoted within the TTIP and TPP.
In the meanwhile, the WTO, which would allow all countries to benefit from increasing
larger market access and from the development of consensus based international trade
rules is severely weakened, mainly because of the position of the US and the EU to
reduce the role of the WTO. The deadlock of the Doha Round negotiations, combined
with the proliferation of deep-integration preferential trade agreements, led by the US
and the EU, have diminish the importance of the organization as the main forum for
international trade governance.
Under this scenario, the future for the BRICS economies is worrying.
Simulations have shown losses of up to 1,6% in BRICS’s global exports and of up to
1,1% in the nominal GDP with the entry into force of the TTIP, and of up to 3% global
exports and of up to 1,8% in the nominal GDP with the entry into force of the TPP,
considering only the first round effects of the agreements. The combination of the
negative effects of the two agreements entering into force simultaneously, as well as the
consideration of impacts in the long term can worsen the results.
Besides, the two mega-agreements will also create the basis for new international trade
rules, which shall answer to the challenges of modern international trade, such as global
value chains, competition issues, regulatory coherence, participation of small and
medium enterprises, investments and state trading enterprises. The discussions on these
new rules will be held only amongst the partners of the two agreements, even though
they will be gradually extended to the whole international trade. They shall be
constituted mostly for behind the boarder measures and, thus, shall be applied to all
exporters that trade with any of the TPP and TTIP members.

The BRICS will lose their prominent role in international trade governance, see their
trade flows reduced and gradually be isolated from global trade. This situation must be
reverted quickly. The BRICS must find their space in this new context. They must
promote a forum where they can actively participate in trade governance.
The WTO shows itself as the best forum to assure the position held by the BRICS
countries in the international arena. With the accession of Russia, in 2012, the WTO
became the only trade forum where the five countries can act conjointly, making their
interests prevail.
The reactivation of the WTO should be considered a priority for the BRICS foreign
trade policy. The momentum is favorable, since the post-Bali agenda is being discussed,
allowing the BRICS to influence the decision on the new themes of international trade
regulation.
The mega-agreements are deeply changing the landscape of international trade. It is
imperative that the BRICS adapt to this new scenario and react in order to assure their
place in international trade governance again.
BIBLIOGRAPHY
DIXON, P. B., Parmenter, B. R., Powell, A. A., & Wilcoxen, P. J. (1992). Notes and
problems in applied general equilibrium economics. In C. J. Bliss & M. D.
Intriligator (Eds.), Advanced textbooks in economics (Vol. 32). Amsterdam:
North-Holland.
DIXON, P. B.,& Parmenter, B. R. (1996). Computable general equilibrium modelling
for policy analysis and forecasting. In H. M. Amman, D. A. Kendrick, & J. Rust
(Eds.), Handbook of computational economics (Vol. 1, pp. 3–85). Amsterdam:
Elsevier.
ECORYS, Non-Tariff Measures in the EU-US Trande and Investment – An Economic
Analysis”, Report Prepared by Berden; Francois; Tamminem; Thelle and
Wymenga for the European Commission, 2009, OJ 2007/S180-219493.
EU Commission Staff Working Document, Impact Assessment Report on the Future of
EU-US trade relations, Strasbourg, March 2013 (SWD(2013) 68 final).
FERGUSSON, I.; COOPER, W.; JURENAS, R.; WILLIAMS, B., The Trans-Pacific
Partnership Negotiations and Issues for Congress, Congressional Research
Service Report for Congress, junho de 2013.
FRANCOIS Joseph (coord.), Reducing Transatlantic Barriers to Trade and Investment
– An economic Assesment, Centre for Economic Policy Research, London,
March 2013
FRANKEL, S. “The intellectual property chapter in the TPP”. In: LIM, C.L.; ELMS,
D.K.; LOW, P. (orgs.). The Trans – Pacific Partnership: A Quest for a Twenty-
First-Century Trade Agreement. New York: Cambridge University Press: 2012.
HARBINSON, S.; LIM, A.H. “Trade in Services”. In: LIM, C.L.; ELMS, D.K.; LOW,
P. (orgs.). The Trans – Pacific Partnership: A Quest for a Twenty-First-Century
Trade Agreement. New York: Cambridge University Press: 2012.
HERTEL T.W. (1997). Global Trade Analysis: Modeling and Applications. Cambridge
University Press.
PIERMARTINI, Roberta; BUDETTA, Michelle, “A Mapping of Regional Rules on
technical barriers to trade”, in ESTEVADEORDAL, A., et. al., Regional Rules
in the Global Trading System. Cambridge: Cambridge University Press, 2009.
ANNEX – SIMULATIONS
Simulation 1– Impacts of the TTIP on BRICS: Tariffs
Hypothesis: 100% of tariff liberalization between the US and the EU
Table 1.1: Macroeconomic Outlook
Macroeconomic Variables Brazil Russia India China S.A.
Nominal GDP -0,12% -0,08% -0,13% -0,16% -0,11%
Real GDP 0,00% 0,00% -0,01% -0,02% 0,00%
Variation in Trade Balance -0,20% 0,00% -0,20% -0,10% 0,10%
Variation in exports % -0,17% -0,08% -0,14% -0,14% -0,13%
Variation in imports % -0,16% -0,11% -0,14% -0,12% -0,13%
Terms of trade -0,07% 0,01% -0,05% -0,05% -0,03%
Real wage -0,01% 0,00% -0,01% -0,01% -0,01%
Capital gains -0,01% 0,00% -0,01% 0,01% -0,02%
Land gains -0,37% -0,01% -0,12% -0,30% -0,24%
Real exchange rate -0,12% -0,09% -0,13% -0,15% -0,12%
Table 1.2: Variation in Exports
Exports
Agriculture Extractive Agribusiness Industry
Brazil -0,3% 0,0% -0,7% -0,2%
Russia 0,0% 0,0% -0,3% -0,3%
India -0,2% -0,1% -0,5% -0,3%
China 0,2% 0,0% -0,2% -0,1%
South Africa -0,3% 0,0% -0,5% -0,2%
Table 1.3: Variation in Imports
Imports
Agriculture Extractive Agribusiness Industry
Brazil -0,3% -0,1% -0,2% -0,2%
Russia -0,1% -0,2% -0,1% -0,1%
India -0,3% -0,1% -0,2% -0,2%
China -0,2% -0,1% -0,4% -0,1%
South Africa -0,2% -0,1% -0,1% -0,1%
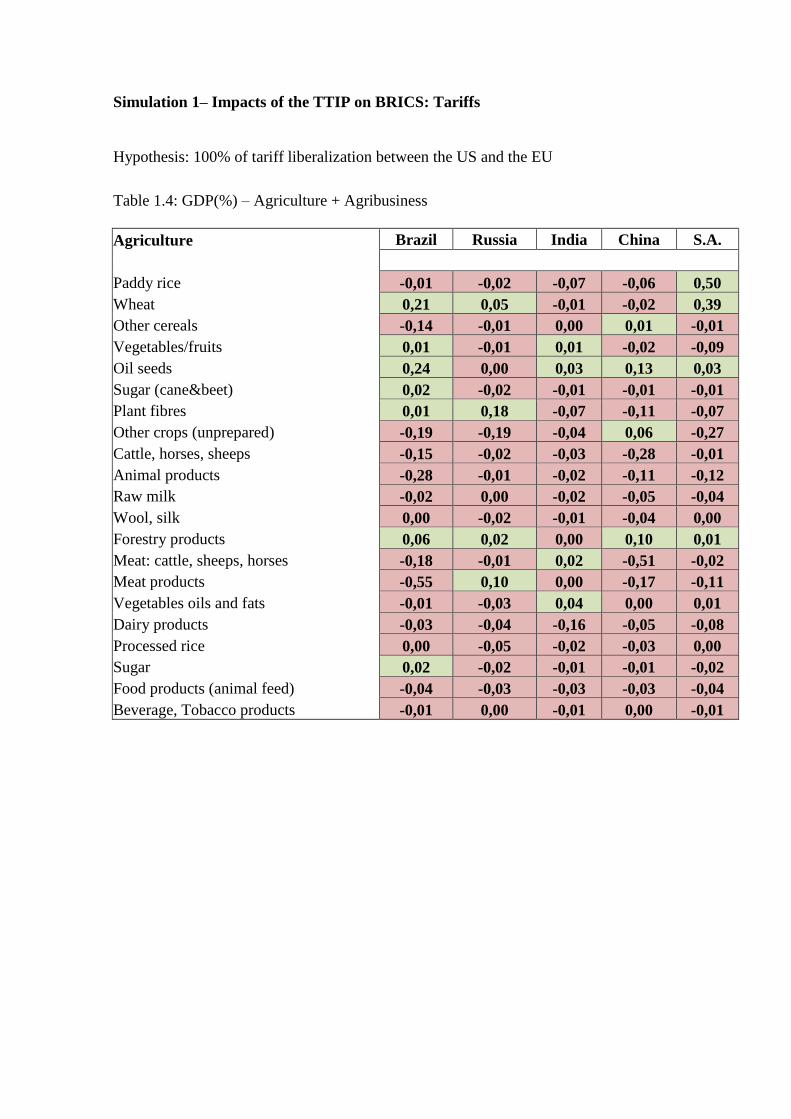
Simulation 1– Impacts of the TTIP on BRICS: Tariffs
Hypothesis: 100% of tariff liberalization between the US and the EU
Table 1.4: GDP(%) – Agriculture + Agribusiness
Agriculture Brazil Russia India China S.A.
Paddy rice -0,01 -0,02 -0,07 -0,06 0,50
Wheat 0,21 0,05 -0,01 -0,02 0,39
Other cereals -0,14 -0,01 0,00 0,01 -0,01
Vegetables/fruits 0,01 -0,01 0,01 -0,02 -0,09
Oil seeds 0,24 0,00 0,03 0,13 0,03
Sugar (cane&beet) 0,02 -0,02 -0,01 -0,01 -0,01
Plant fibres 0,01 0,18 -0,07 -0,11 -0,07
Other crops (unprepared) -0,19 -0,19 -0,04 0,06 -0,27
Cattle, horses, sheeps -0,15 -0,02 -0,03 -0,28 -0,01
Animal products -0,28 -0,01 -0,02 -0,11 -0,12
Raw milk -0,02 0,00 -0,02 -0,05 -0,04
Wool, silk 0,00 -0,02 -0,01 -0,04 0,00
Forestry products 0,06 0,02 0,00 0,10 0,01
Meat: cattle, sheeps, horses -0,18 -0,01 0,02 -0,51 -0,02
Meat products -0,55 0,10 0,00 -0,17 -0,11
Vegetables oils and fats -0,01 -0,03 0,04 0,00 0,01
Dairy products -0,03 -0,04 -0,16 -0,05 -0,08
Processed rice 0,00 -0,05 -0,02 -0,03 0,00
Sugar 0,02 -0,02 -0,01 -0,01 -0,02
Food products (animal feed) -0,04 -0,03 -0,03 -0,03 -0,04
Beverage, Tobacco products -0,01 0,00 -0,01 0,00 -0,01
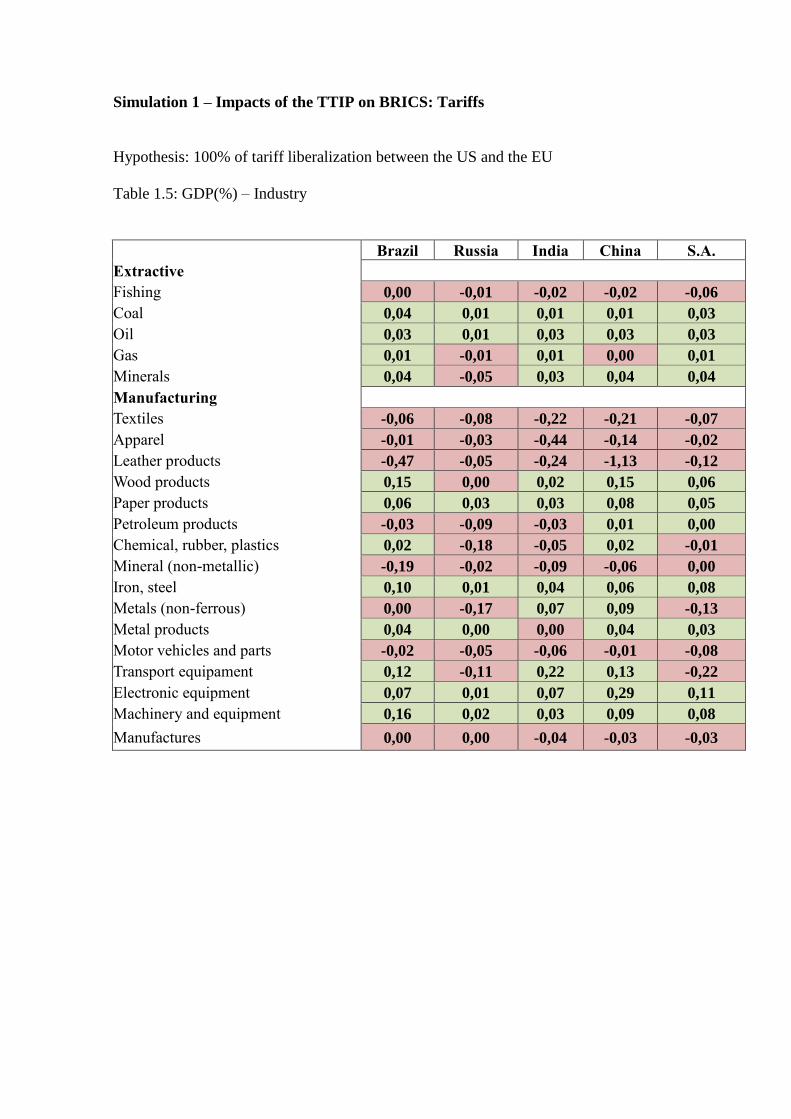
Simulation 1 – Impacts of the TTIP on BRICS: Tariffs
Hypothesis: 100% of tariff liberalization between the US and the EU
Table 1.5: GDP(%) – Industry
Brazil Russia India China S.A.
Extractive
Fishing 0,00 -0,01 -0,02 -0,02 -0,06
Coal 0,04 0,01 0,01 0,01 0,03
Oil 0,03 0,01 0,03 0,03 0,03
Gas 0,01 -0,01 0,01 0,00 0,01
Minerals 0,04 -0,05 0,03 0,04 0,04
Manufacturing
Textiles -0,06 -0,08 -0,22 -0,21 -0,07
Apparel -0,01 -0,03 -0,44 -0,14 -0,02
Leather products -0,47 -0,05 -0,24 -1,13 -0,12
Wood products 0,15 0,00 0,02 0,15 0,06
Paper products 0,06 0,03 0,03 0,08 0,05
Petroleum products -0,03 -0,09 -0,03 0,01 0,00
Chemical, rubber, plastics 0,02 -0,18 -0,05 0,02 -0,01
Mineral (non-metallic) -0,19 -0,02 -0,09 -0,06 0,00
Iron, steel 0,10 0,01 0,04 0,06 0,08
Metals (non-ferrous) 0,00 -0,17 0,07 0,09 -0,13
Metal products 0,04 0,00 0,00 0,04 0,03
Motor vehicles and parts -0,02 -0,05 -0,06 -0,01 -0,08
Transport equipament 0,12 -0,11 0,22 0,13 -0,22
Electronic equipment 0,07 0,01 0,07 0,29 0,11
Machinery and equipment 0,16 0,02 0,03 0,09 0,08
Manufactures 0,00 0,00 -0,04 -0,03 -0,03
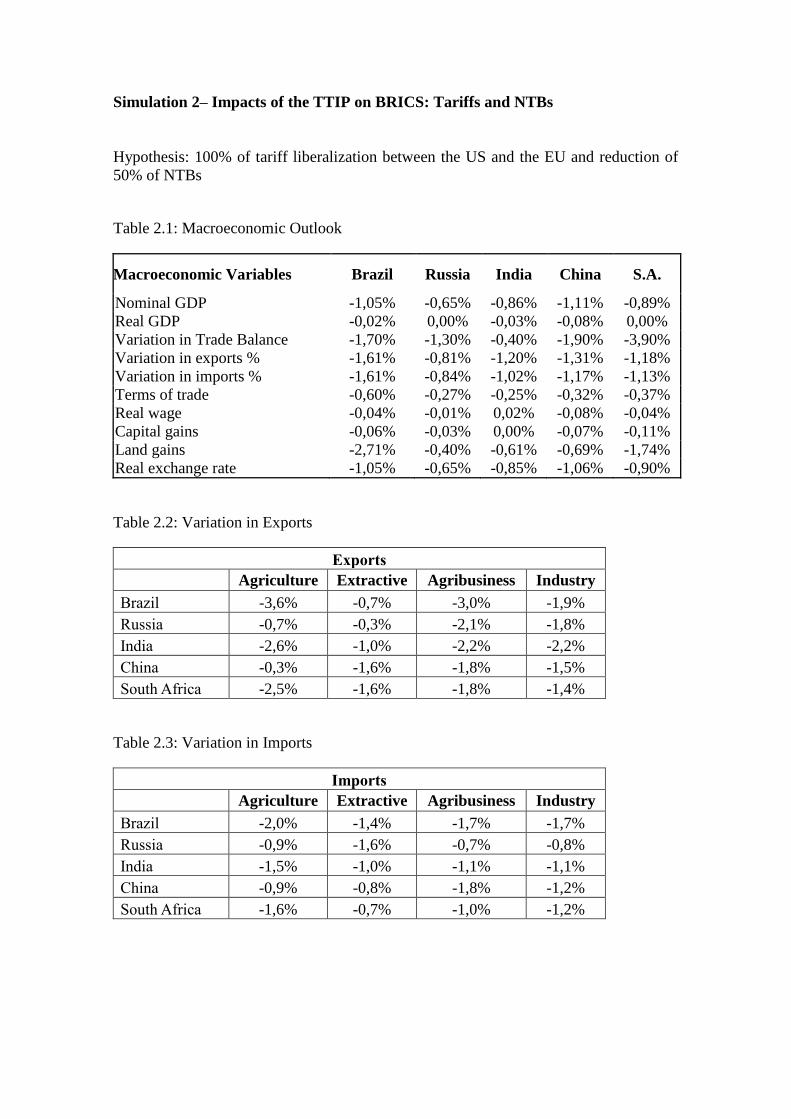
Simulation 2– Impacts of the TTIP on BRICS: Tariffs and NTBs
Hypothesis: 100% of tariff liberalization between the US and the EU and reduction of
50% of NTBs
Table 2.1: Macroeconomic Outlook
Macroeconomic Variables Brazil Russia India China S.A.
Nominal GDP -1,05% -0,65% -0,86% -1,11% -0,89%
Real GDP -0,02% 0,00% -0,03% -0,08% 0,00%
Variation in Trade Balance -1,70% -1,30% -0,40% -1,90% -3,90%
Variation in exports % -1,61% -0,81% -1,20% -1,31% -1,18%
Variation in imports % -1,61% -0,84% -1,02% -1,17% -1,13%
Terms of trade -0,60% -0,27% -0,25% -0,32% -0,37%
Real wage -0,04% -0,01% 0,02% -0,08% -0,04%
Capital gains -0,06% -0,03% 0,00% -0,07% -0,11%
Land gains -2,71% -0,40% -0,61% -0,69% -1,74%
Real exchange rate -1,05% -0,65% -0,85% -1,06% -0,90%
Table 2.2: Variation in Exports
Exports
Agriculture Extractive Agribusiness Industry
Brazil -3,6% -0,7% -3,0% -1,9%
Russia -0,7% -0,3% -2,1% -1,8%
India -2,6% -1,0% -2,2% -2,2%
China -0,3% -1,6% -1,8% -1,5%
South Africa -2,5% -1,6% -1,8% -1,4%
Table 2.3: Variation in Imports
Imports
Agriculture Extractive Agribusiness Industry
Brazil -2,0% -1,4% -1,7% -1,7%
Russia -0,9% -1,6% -0,7% -0,8%
India -1,5% -1,0% -1,1% -1,1%
China -0,9% -0,8% -1,8% -1,2%
South Africa -1,6% -0,7% -1,0% -1,2%
Simulation 2– Impacts of the TTIP on BRICS: Tariffs and NTBs
Hypothesis: 100% of tariff liberalization between the US and the EU and reduction of
50% of NTBs
Table 2.4: GDP(%) – Agriculture + Agribusiness
Agriculture Brazil Russia India China S.A.
Paddy rice -0,01 -0,17 -0,41 -0,09 2,30
Wheat 1,42 0,05 -0,11 0,19 2,27
Other cereals -0,67 -0,07 -0,02 0,24 -0,05
Vegetables/fruits -0,12 -0,09 0,01 -0,03 -0,69
Oil seeds 0,00 -0,58 -0,10 0,31 -0,14
Sugar (cane&beet) 0,17 -0,26 -0,06 -0,05 -0,07
Plant fibres 0,72 0,67 0,27 0,72 0,37
Other crops (unprepared) -1,52 -1,02 -0,31 -0,63 -1,96
Cattle, horses, sheeps -0,25 -0,12 -0,10 -0,83 -0,08
Animal products -1,24 -0,09 -0,03 -0,31 -0,52
Raw milk 0,04 -0,02 -0,02 0,06 0,03
Wool, silk 0,01 -0,18 -0,12 0,48 -0,66
Forestry products 0,58 0,04 -0,19 0,61 0,05
Meat: cattle, sheeps, horses -0,32 -0,12 0,05 -1,13 -0,10
Meat products -2,44 0,47 0,01 -0,33 -0,53
Vegetables oils and fats -0,11 -0,55 -0,15 -0,10 -0,30
Dairy products 0,04 0,06 -0,15 0,06 0,02
Processed rice 0,00 -0,36 -0,11 -0,12 -0,24
Sugar 0,15 -0,26 -0,06 -0,05 -0,17
Food products (animal feed) -0,23 -0,18 -0,17 -0,18 -0,14
Beverage, Tobacco products -0,43 -0,03 -0,07 0,00 -0,18
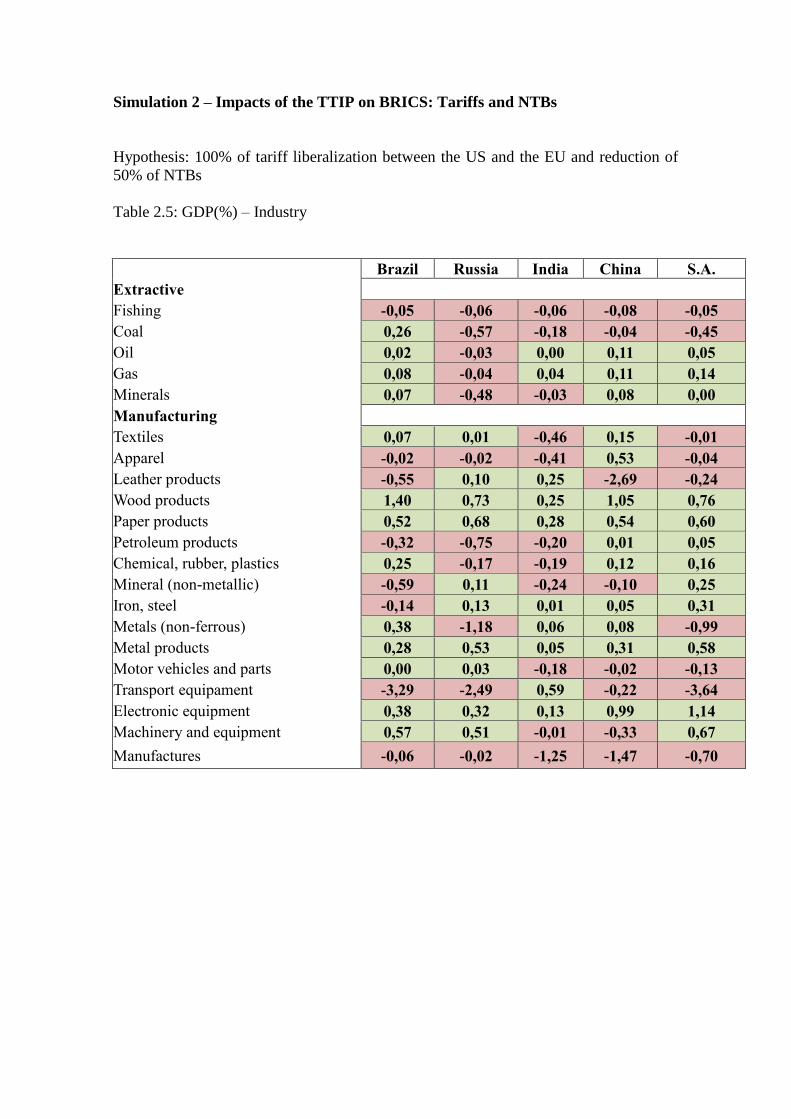
Simulation 2 – Impacts of the TTIP on BRICS: Tariffs and NTBs
Hypothesis: 100% of tariff liberalization between the US and the EU and reduction of
50% of NTBs
Table 2.5: GDP(%) – Industry
Brazil Russia India China S.A.
Extractive
Fishing -0,05 -0,06 -0,06 -0,08 -0,05
Coal 0,26 -0,57 -0,18 -0,04 -0,45
Oil 0,02 -0,03 0,00 0,11 0,05
Gas 0,08 -0,04 0,04 0,11 0,14
Minerals 0,07 -0,48 -0,03 0,08 0,00
Manufacturing
Textiles 0,07 0,01 -0,46 0,15 -0,01
Apparel -0,02 -0,02 -0,41 0,53 -0,04
Leather products -0,55 0,10 0,25 -2,69 -0,24
Wood products 1,40 0,73 0,25 1,05 0,76
Paper products 0,52 0,68 0,28 0,54 0,60
Petroleum products -0,32 -0,75 -0,20 0,01 0,05
Chemical, rubber, plastics 0,25 -0,17 -0,19 0,12 0,16
Mineral (non-metallic) -0,59 0,11 -0,24 -0,10 0,25
Iron, steel -0,14 0,13 0,01 0,05 0,31
Metals (non-ferrous) 0,38 -1,18 0,06 0,08 -0,99
Metal products 0,28 0,53 0,05 0,31 0,58
Motor vehicles and parts 0,00 0,03 -0,18 -0,02 -0,13
Transport equipament -3,29 -2,49 0,59 -0,22 -3,64
Electronic equipment 0,38 0,32 0,13 0,99 1,14
Machinery and equipment 0,57 0,51 -0,01 -0,33 0,67
Manufactures -0,06 -0,02 -1,25 -1,47 -0,70

Simulation 3 – Impacts of TPP on BRICS Tariffs
Hypothesis: 100% of tariff liberalization between TPP partners
Table 3.1: Macroeconomic Outlook
Macroeconomic Variables Brazil Russia India China S.A.
Nominal GDP -0,26% -0,01% -0,21% -0,38% -0,20%
Real GDP -0,01% 0,01% -0,01% -0,07% -0,01%
Variation in Trade Balance -0,40% -0,20% 0,40% -1,10% -1,40%
Variation in exports % -0,37% 0,01% -0,26% -0,60% -0,26%
Variation in imports % -0,35% -0,02% -0,16% -0,40% -0,24%
Terms of trade -0,17% 0,11% -0,15% -0,28% -0,11%
Real wage 0,04% 0,00% -0,04% -0,05% -0,06%
Capital gains -0,03% 0,01% -0,04% 0,03% -0,04%
Land gains -0,25% 0,04% -0,29% -1,41% -0,15%
Real exchange rate -0,26% -0,02% -0,22% -0,34% -0,21%
Table 3.2: Variation in Exports
Exports
Agriculture Extractive Agribusiness Industry
Brazil 0,7% 0,3% -2,3% -0,5%
Russia 0,9% 0,3% -1,8% -0,3%
India -0,2% 0,2% -0,8% -0,7%
China -0,3% 0,7% -6,5% -0,5%
South Africa 0,3% 0,1% -2,7% -0,4%
Table 3.3: Variation in Imports
Imports
Agriculture Extractive Agribusiness Industry
Brazil -0,6% 0,0% -0,5% -0,4%
Russia -0,2% -0,2% 0,1% 0,0%
India -1,0% 0,0% -0,3% -0,2%
China -1,0% 0,0% -1,3% -0,5%
South Africa -0,5% 0,1% -0,2% -0,3%

Simulation 3 – Impacts of TPP on BRICS Tariffs
Hypothesis: 100% of tariff liberalization between TPP partners
Table 3.4: GDP (%) – Agriculture + Agribusiness
Agriculture Brazil Russia India China S.A.
Paddy rice 0,04 0,14 0,15 -0,25 6,38
Wheat 0,26 0,35 -0,11 -0,09 0,84
Other cereals -0,13 -0,05 0,00 -0,51 -0,13
Vegetables/fruits 0,22 -0,07 0,02 -0,19 -0,09
Oil seeds 0,57 -0,02 0,01 0,50 0,23
Sugar (cane&beet) -0,02 -0,15 -0,05 -0,14 -0,78
Plant fibres 0,56 0,14 -0,01 -0,42 0,27
Other crops (unprepared) 0,17 -0,75 -0,22 -0,68 0,06
Cattle, horses, sheeps 0,24 0,02 -0,04 -0,35 0,14
Animal products -1,74 0,00 -0,08 -0,47 -0,28
Raw milk 0,05 0,02 -0,02 0,22 0,00
Wool, silk 0,02 0,04 0,43 1,80 3,10
Forestry products 0,09 0,04 0,12 0,34 0,00
Meat: cattle, sheeps, horses 0,26 0,01 -0,07 -0,55 0,12
Meat products -3,52 -0,75 -0,50 -1,88 -0,45
Vegetables oils and fats 0,16 -0,03 -0,05 0,14 0,33
Dairy products 0,07 0,01 -0,08 0,22 0,03
Processed rice 0,02 0,51 0,08 -0,41 1,40
Sugar -0,05 -0,15 -0,05 -0,14 -2,58
Food products (animal feed) -0,23 -0,32 -0,19 -0,40 -0,13
Beverage, Tobacco products -0,01 0,00 -0,04 -0,05 -0,03
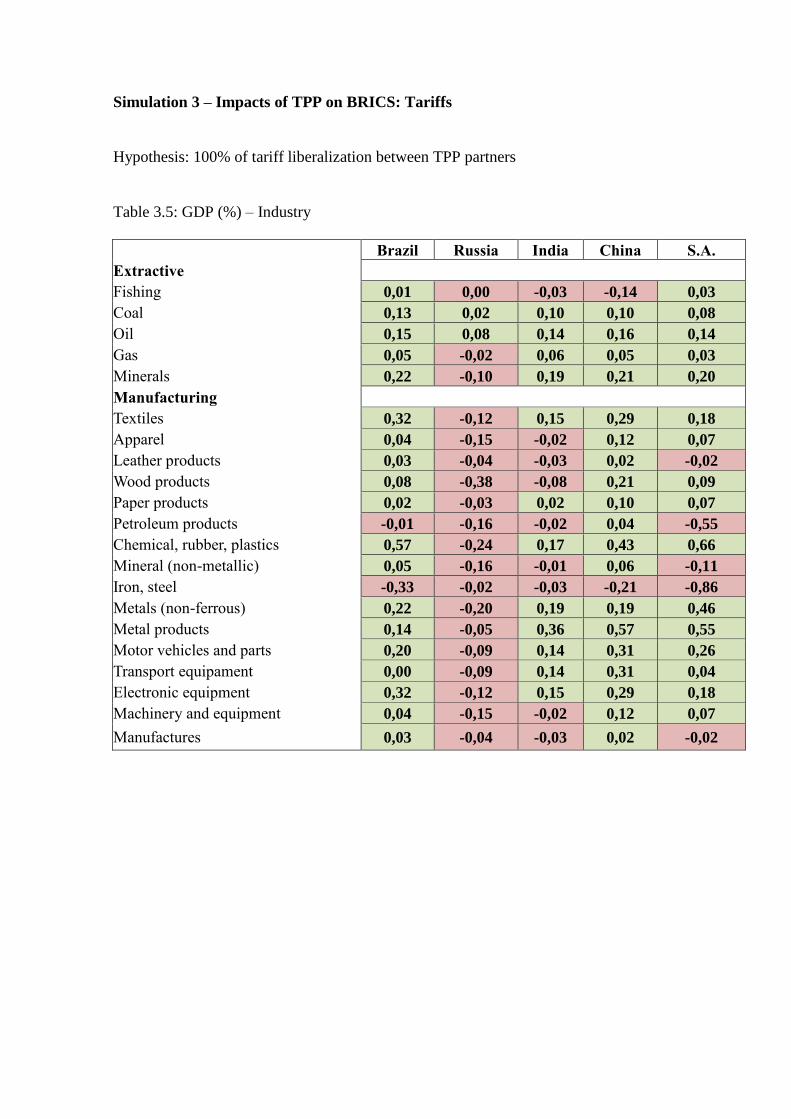
Simulation 3 – Impacts of TPP on BRICS: Tariffs
Hypothesis: 100% of tariff liberalization between TPP partners
Table 3.5: GDP (%) – Industry
Brazil Russia India China S.A.
Extractive
Fishing 0,01 0,00 -0,03 -0,14 0,03
Coal 0,13 0,02 0,10 0,10 0,08
Oil 0,15 0,08 0,14 0,16 0,14
Gas 0,05 -0,02 0,06 0,05 0,03
Minerals 0,22 -0,10 0,19 0,21 0,20
Manufacturing
Textiles 0,32 -0,12 0,15 0,29 0,18
Apparel 0,04 -0,15 -0,02 0,12 0,07
Leather products 0,03 -0,04 -0,03 0,02 -0,02
Wood products 0,08 -0,38 -0,08 0,21 0,09
Paper products 0,02 -0,03 0,02 0,10 0,07
Petroleum products -0,01 -0,16 -0,02 0,04 -0,55
Chemical, rubber, plastics 0,57 -0,24 0,17 0,43 0,66
Mineral (non-metallic) 0,05 -0,16 -0,01 0,06 -0,11
Iron, steel -0,33 -0,02 -0,03 -0,21 -0,86
Metals (non-ferrous) 0,22 -0,20 0,19 0,19 0,46
Metal products 0,14 -0,05 0,36 0,57 0,55
Motor vehicles and parts 0,20 -0,09 0,14 0,31 0,26
Transport equipament 0,00 -0,09 0,14 0,31 0,04
Electronic equipment 0,32 -0,12 0,15 0,29 0,18
Machinery and equipment 0,04 -0,15 -0,02 0,12 0,07
Manufactures 0,03 -0,04 -0,03 0,02 -0,02

Simulation 4 – Impacts of TPP on BRICS Tariffs and NTBs
Hypothesis: 100% of tariff liberalization between TPP partners and reduction of 50% of
NTBs
Table 4.1: Macroeconomic Outlook
Macroeconomic Variables Brazil Russia India China S.A.
Nominal GDP -1,65% -1,40% -1,21% -1,81% -1,39%
Real GDP -0,02% -0,13% -0,03% -0,16% -0,01%
Variation in Trade Balance -2,50% -0,60% 1,80% -5,40% -8,90%
Variation in exports % -2,41% -1,71% -2,10% -3,04% -1,83%
Variation in imports % -2,40% -1,33% -1,40% -2,43% -1,70%
Terms of trade -0,75% -0,38% -0,21% -0,78% -0,33%
Real wage -0,05% 0,09% 0,13% -0,13% -0,06%
Capital gains -0,07% 0,06% 0,12% 0,00% -0,11%
Land gains -2,92% -0,52% -1,37% -2,64% -3,14%
Real exchange rate -1,65% -1,23% -1,20% -1,73% -1,40%
Table 4.2: Variation in Exports
Exports
Agriculture Extractive Agribusiness Industry
Brazil -3,3% -1,0% -5,7% -2,9%
Russia 1,0% -1,7% -5,8% -1,2%
India -5,6% -1,1% -6,6% -3,3%
China -7,1% -0,5% -15,2% -3,2%
South Africa -3,7% -0,9% -6,0% -2,3%
Table 4.3: Variation in Imports
Imports
Agriculture Extractive Agribusiness Industry
Brazil -2,9% -1,8% -2,2% -2,6%
Russia -1,7% -0,8% -1,5% -1,4%
India -2,9% -1,1% -1,6% -1,4%
China -2,7% -1,2% -3,2% -2,7%
South Africa -2,3% -1,4% -1,5% -1,8%
Simulation 4 – Impacts of TPP on BRICS Tariffs and NTBs
Hypothesis: 100% of tariff liberalization between TPP partners and reduction of 50% of
NTBs
Table 4.4: GDP (%) – Agriculture + Agribusiness
Agriculture Brazil Russia India China S.A.
Paddy rice 0,00 -0,18 -0,04 -0,30 6,54
Wheat 0,69 0,86 -0,31 0,12 2,06
Other cereals -0,34 -0,28 -0,10 -1,04 -0,43
Vegetables/fruits -2,42 -0,29 -0,08 -0,50 -1,31
Oil seeds 0,19 -0,35 -0,83 -0,27 -1,30
Sugar (cane&beet) -0,11 -0,49 -0,17 -0,40 -0,94
Plant fibres -0,27 0,69 -0,53 0,20 -0,28
Other crops (unprepared) -0,97 -1,26 -0,52 -3,08 -1,62
Cattle, horses, sheeps 0,50 -0,16 -0,30 -0,20 0,05
Animal products -2,77 -0,18 -0,11 -0,56 -0,44
Raw milk 0,11 -0,12 0,06 0,36 0,10
Wool, silk 0,02 -0,11 0,29 2,81 3,19
Forestry products 0,73 -0,17 -0,12 0,99 0,02
Meat: cattle, sheeps, horses 0,59 -0,19 -0,13 -0,19 0,04
Meat products -5,11 -0,76 -0,58 -2,18 -0,62
Vegetables oils and fats -0,25 -0,41 -1,27 -0,29 -0,53
Dairy products 0,14 0,03 -0,01 0,36 0,17
Processed rice 0,00 -0,11 -0,12 -0,70 0,46
Sugar -0,30 -0,49 -0,22 -0,40 -3,08
Food products (animal feed) -0,90 -0,95 -0,67 -1,14 -0,44
Beverage, Tobacco products -0,22 -0,11 -0,05 -0,06 -0,12

Simulation 4 – Impacts of TPP on BRICS: Tariffs and NTBs
Hypothesis: 100% of tariff liberalization between TPP partners and reduction of 50% of
NTBs
Table 4.5: GDP (%) – Industry
Brazil Russia India China S.A.
Extractive
Fishing -0,17 -0,03 -0,06 -0,36 -0,05
Coal 0,44 0,21 0,13 0,19 0,25
Oil -0,05 -0,08 -0,14 0,03 -0,03
Gas -0,26 -0,86 -1,07 -0,88 -1,22
Minerals 0,36 0,10 0,11 0,31 0,19
Manufacturing
Textiles -0,07 -0,13 -1,34 -0,43 -0,28
Apparel -0,09 -0,42 -3,00 -0,66 -0,18
Leather products -0,82 -0,80 -1,81 -1,12 -0,82
Wood products 1,77 0,53 0,19 1,49 0,80
Paper products 0,67 0,62 0,34 0,99 0,49
Petroleum products -0,16 -0,08 -0,24 -0,01 0,09
Chemical, rubber, plastics 0,40 0,91 -0,12 0,56 0,14
Mineral (non-metallic) -0,06 0,30 0,03 0,23 0,27
Iron, steel -0,32 0,56 -0,19 -0,01 -0,46
Metals (non-ferrous) 0,63 -0,24 0,08 0,37 -0,75
Metal products 0,24 0,36 -0,04 0,17 0,24
Motor vehicles and parts -0,89 0,85 -0,36 -0,54 -1,19
Transport equipament -3,08 1,09 0,97 -0,13 1,63
Electronic equipment 1,01 1,39 0,67 -0,07 1,93
Machinery and equipment 0,27 0,58 -0,09 -0,54 0,54
Manufactures 0,03 0,05 -0,23 0,42 0,13


![[AW]policy BRICS - ITD · กลุ่มประเทศ brics จะก่อให้เกิดประโยชน์ทางเศรษฐกิจกับไทย”](https://img.pdfslide.net/doc/110x75/5eb6589d95ac763ff45c6af5/awpolicy-brics-aaaaaaaaaaa-brics-aaaaaafaaaaaaaaaaaaaaoeaaaaaaaaaaaaaaaaaa.jpg)