Embed Size (px)
Citation preview
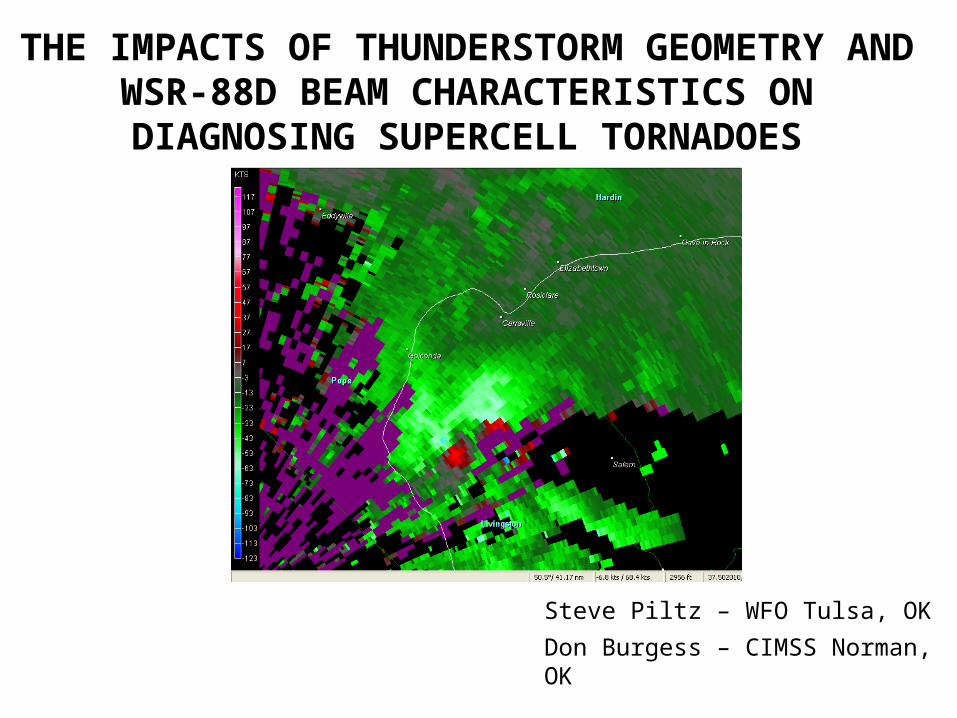
THE IMPACTS OF THUNDERSTORM GEOMETRY AND WSR-88D BEAM CHARACTERISTICS ON
DIAGNOSING SUPERCELL TORNADOES
Steve Piltz – WFO Tulsa, OK
Don Burgess – CIMSS Norman, OK
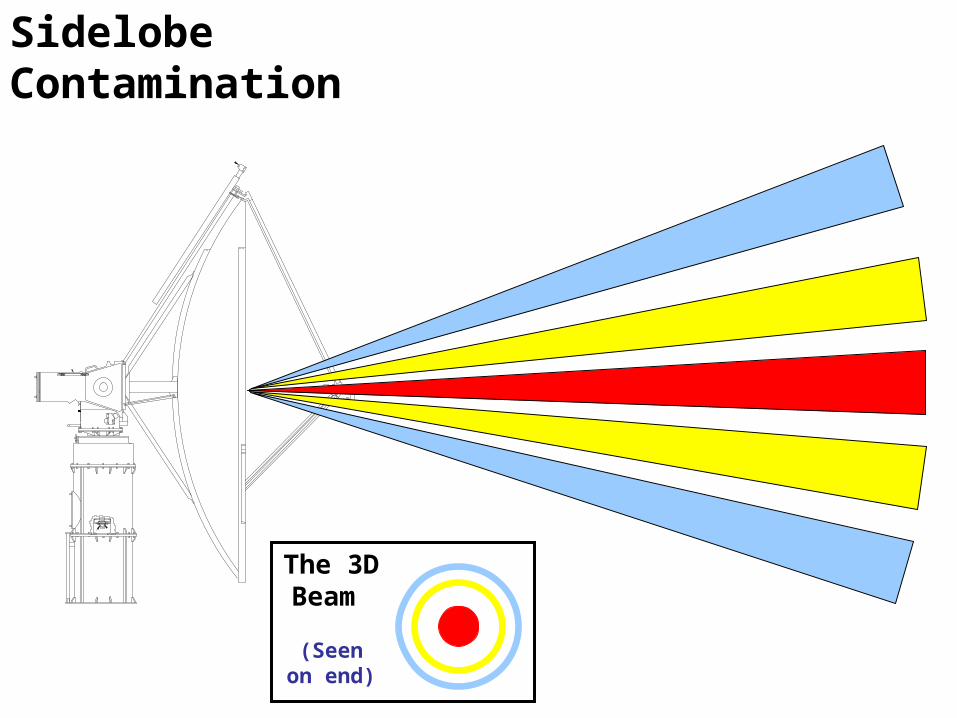
The 3D Beam
(Seen on end)
Sidelobe Contamination

Federal Meteorological Handbook 11- Part BDoppler Radar Theory and Meteorology
3.6 Data Contamination by Antenna Sidelobe Signal. An occasional source of datacontamination is simultaneous reception of signals at comparable power levels through both the antenna pattern main lobe and its sidelobes. This occurs when the meteorological reflectivity gradient exceeds the two-way sidelobe/main lobe isolation.

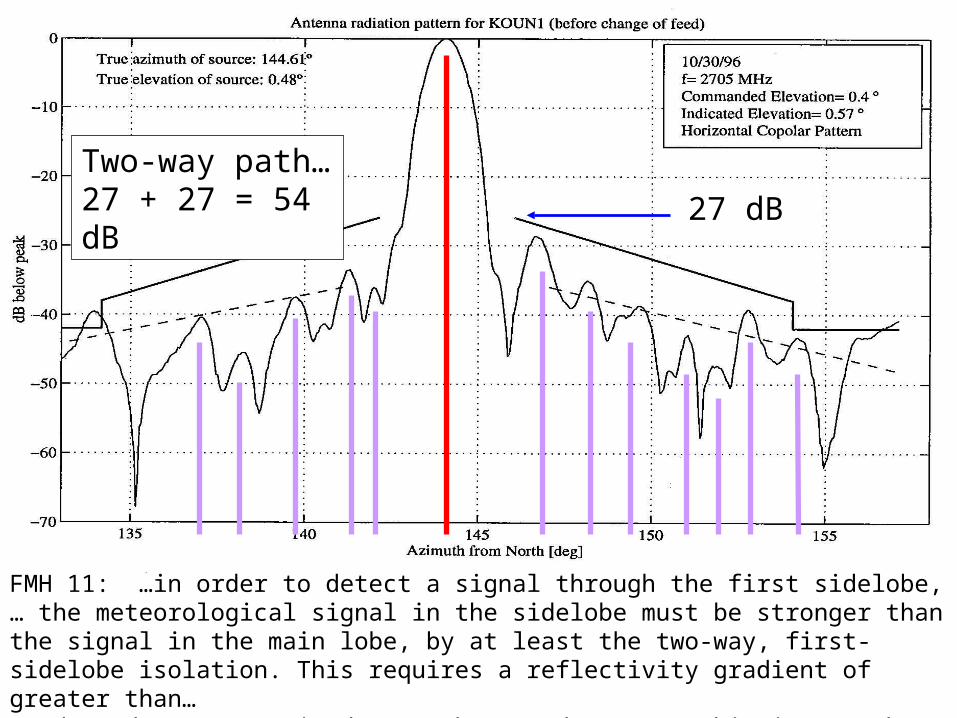
27 dB
Two-way path… 27 + 27 = 54 dB
Measurements of WSR-88D radiation patters are rare. Therefore we are discussing approximations at best.
For example, if the side-lobe is sensing a 64 dBZ return, the main-beam would have to be sampling something around or less than 10 dBZ for side-lobe contamination to occur.
27 dB
Two-way path… 27 + 27 = 54 dB
FMH 11: …in order to detect a signal through the first sidelobe, … the meteorological signal in the sidelobe must be stronger than the signal in the main lobe, by at least the two-way, first-sidelobe isolation. This requires a reflectivity gradient of greater than…40 dB / degree sustained over about 2 degrees. This is a rather large value and seldom-encountered in practice.

NWS Training on Sidelobe Contamination
The most significant sidelobe contamination tends to occur with intense convection at close range. If the reflectivity gradients are large enough, a situation may occur where the main lobe is sampling clear air while the sidelobes are sampling the storm. In this
case, a low reflectivity would be displayed along the azimuth corresponding to the main lobe.On a reflectivity product, sidelobe contamination generally appears as a
"smearing" of low reflectivities from one azimuth to the next in a clockwise direction (The WSR-88D antenna always rotates clockwise).

Which Sidelobe?
Federal Meteorological Handbook 11- Part B
Doppler Radar Theory and Meteorology

Horizontal reflectivity gradients from weather targets sufficient to result in sidelobe contamination are rather rare. In the vertical they are less rare…if not common in supercells.
Vertical Reflectivity Gradients in Supercells

KPAH – September 22, 2006

White arrow (right):0.4 degree: -1.0 dBZ and +66 kts
Yellow arrow (right):3.3 degree: 55 dBZ and +48 kts
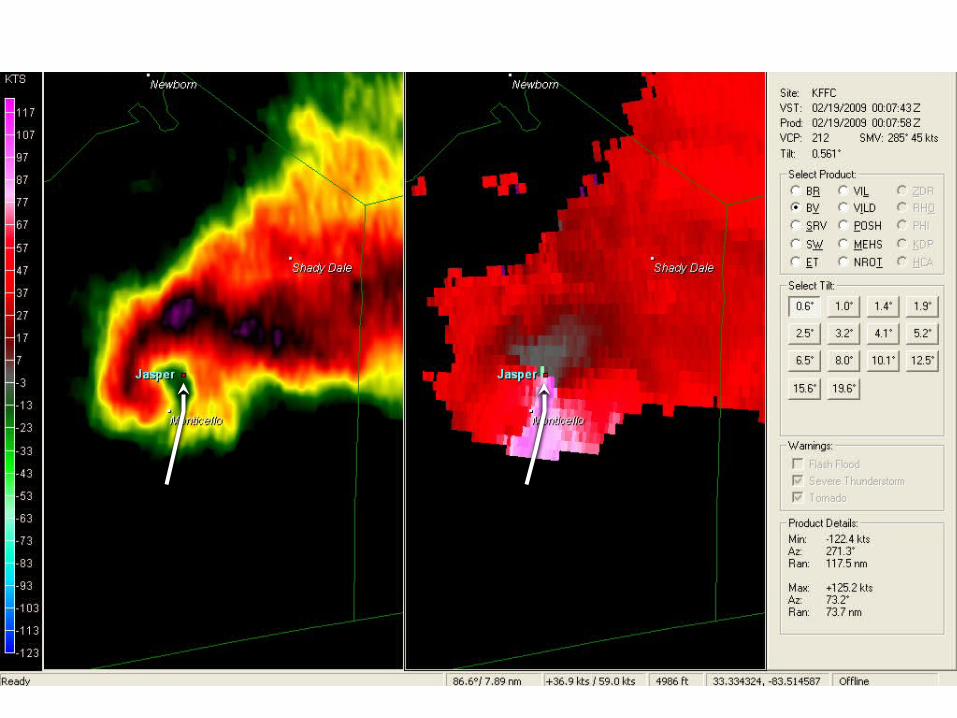
R X-Section
Base Vel X-Section
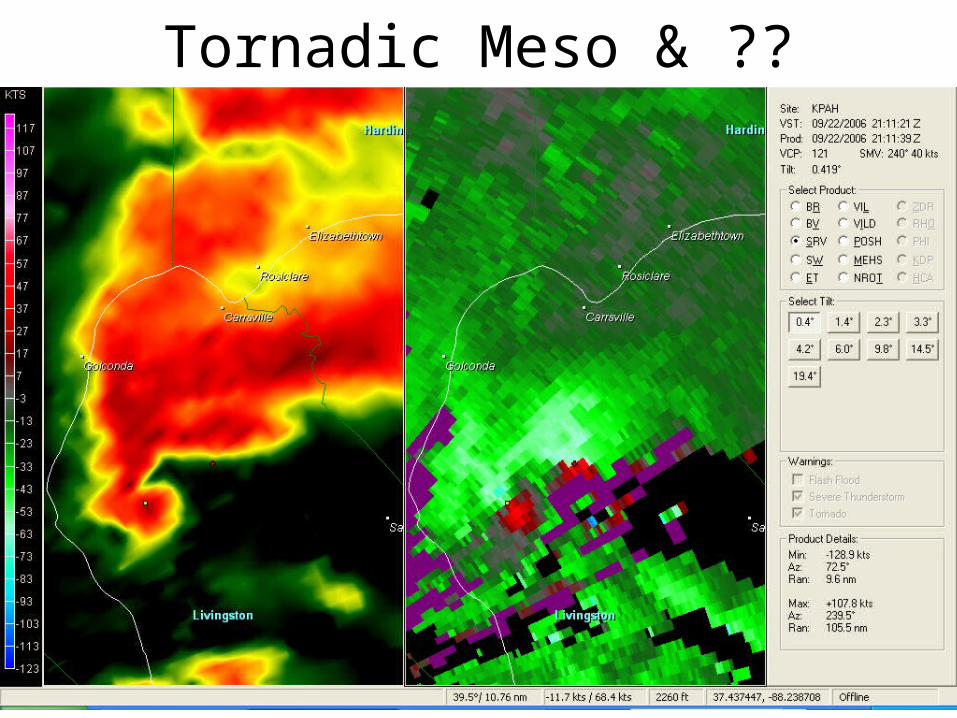
Tornadic Meso & ??
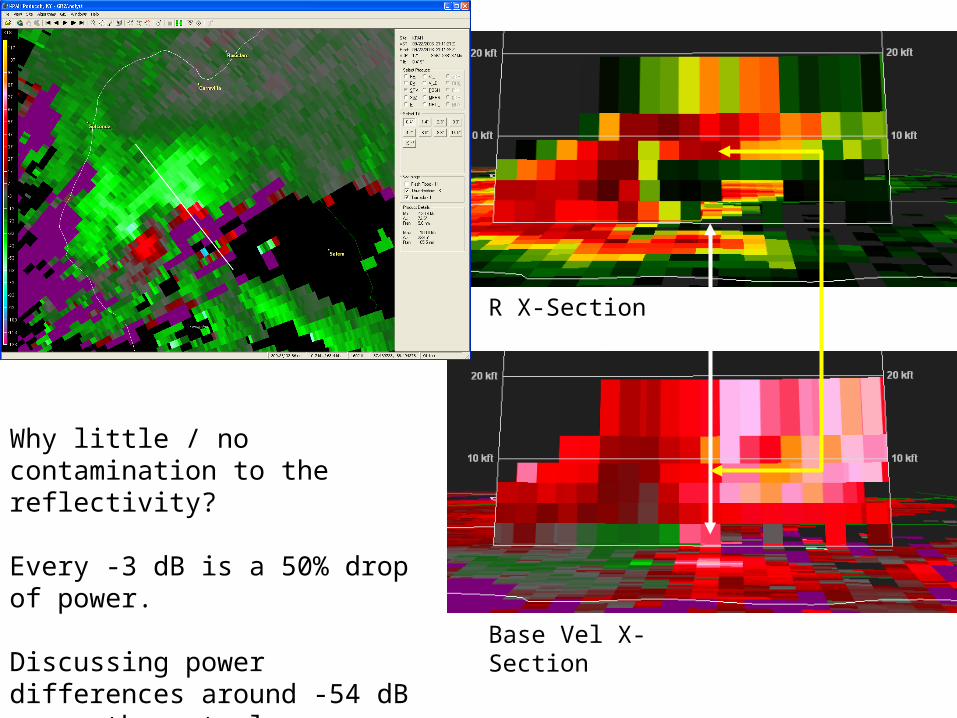
Why little / no contamination to the reflectivity?
Every -3 dB is a 50% drop of power.
Discussing power differences around -54 dB means the actual power returned is very small.
R X-Section
Base Vel X-Section

But velocity data are collected. They inappropriately become a part of what the main beam samples, and the main beam’s data are contaminated.
R X-Section
Base Vel X-Section
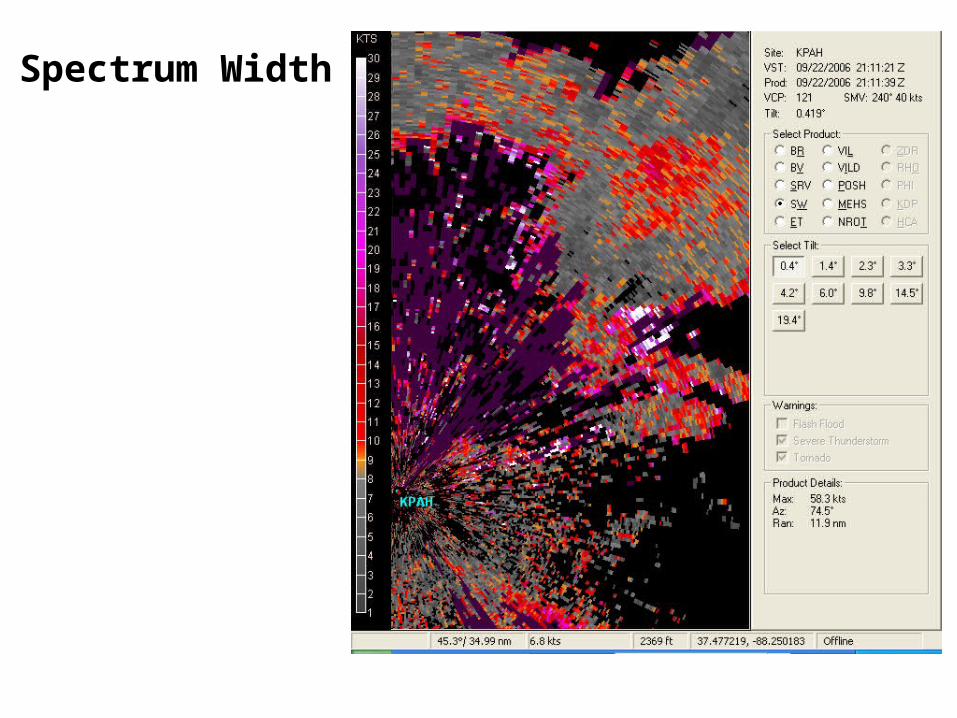
Spectrum Width

Note the precision with which the Spectrum Width data “fit” into the low Reflectivity.

Time Continuity
21:06 UTC
21:11 UTC

Height Continuity

Yellow arrow (right):1.4 degrees: -1.0 dBZ3.3 degrees: 53.0 dBZ
Base Vel X-Section
R X-Section
The 3D Beam
(Seen on end)

Reflectivity 1.4 degrees21:11 UTC
Spectrum Width 1.4 degrees21:11 UTC
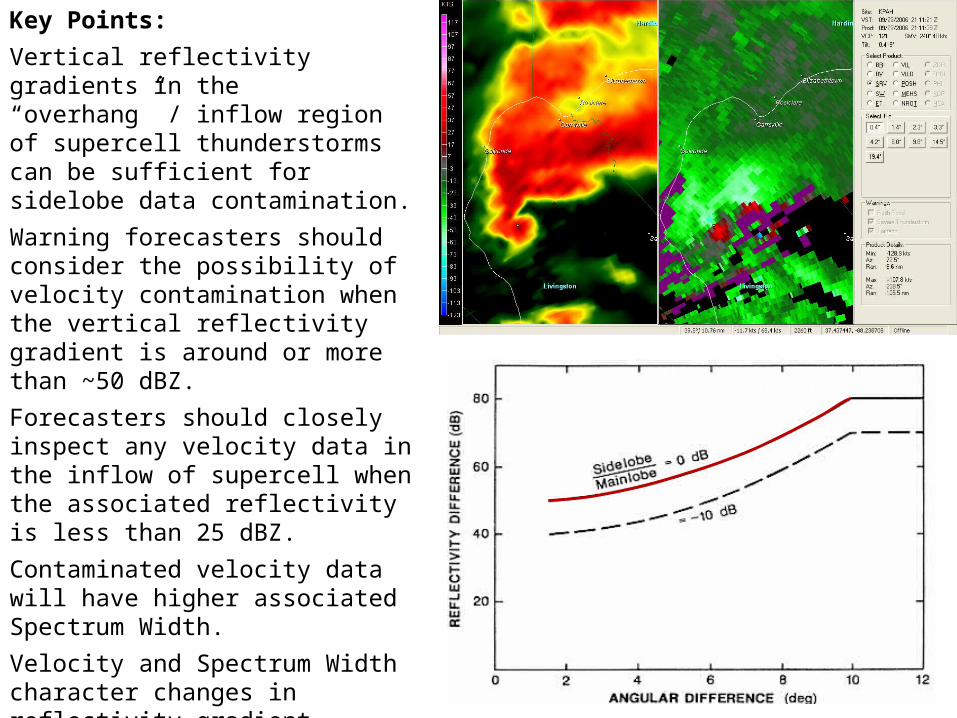
Key Points:
Vertical reflectivity gradients in the “overhang” / inflow region of supercell thunderstorms can be sufficient for sidelobe data contamination.
Warning forecasters should consider the possibility of velocity contamination when the vertical reflectivity gradient is around or more than ~50 dBZ.
Forecasters should closely inspect any velocity data in the inflow of supercell when the associated reflectivity is less than 25 dBZ.
Contaminated velocity data will have higher associated Spectrum Width.
Velocity and Spectrum Width character changes in reflectivity gradient.
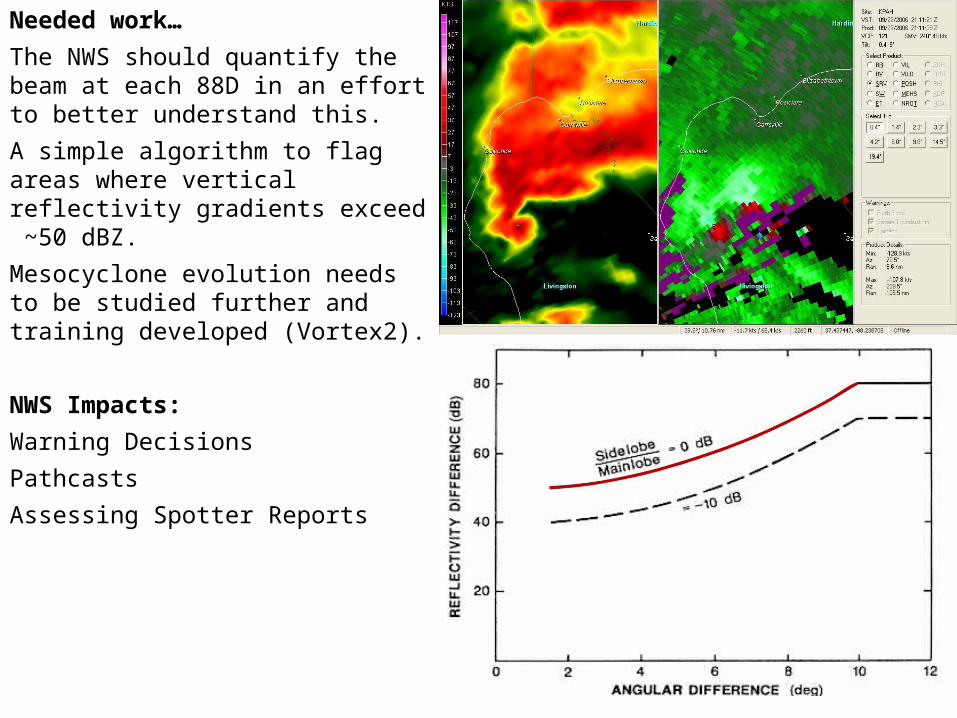
Needed work…
The NWS should quantify the beam at each 88D in an effort to better understand this.
A simple algorithm to flag areas where vertical reflectivity gradients exceed ~50 dBZ.
Mesocyclone evolution needs to be studied further and training developed (Vortex2).
NWS Impacts:
Warning Decisions
Pathcasts
Assessing Spotter Reports

Future Work…


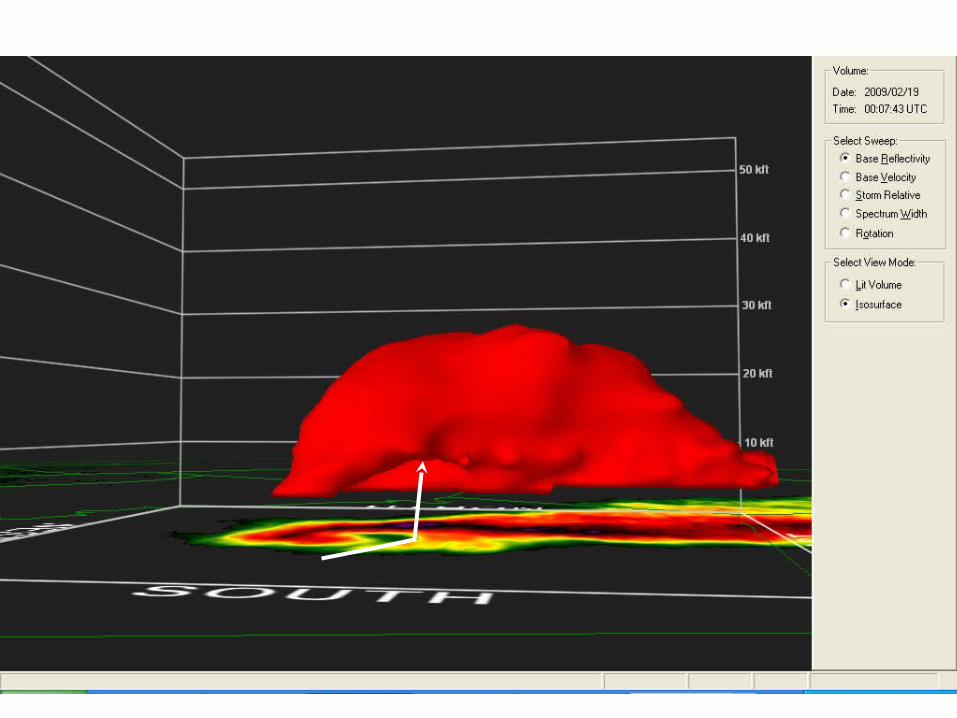
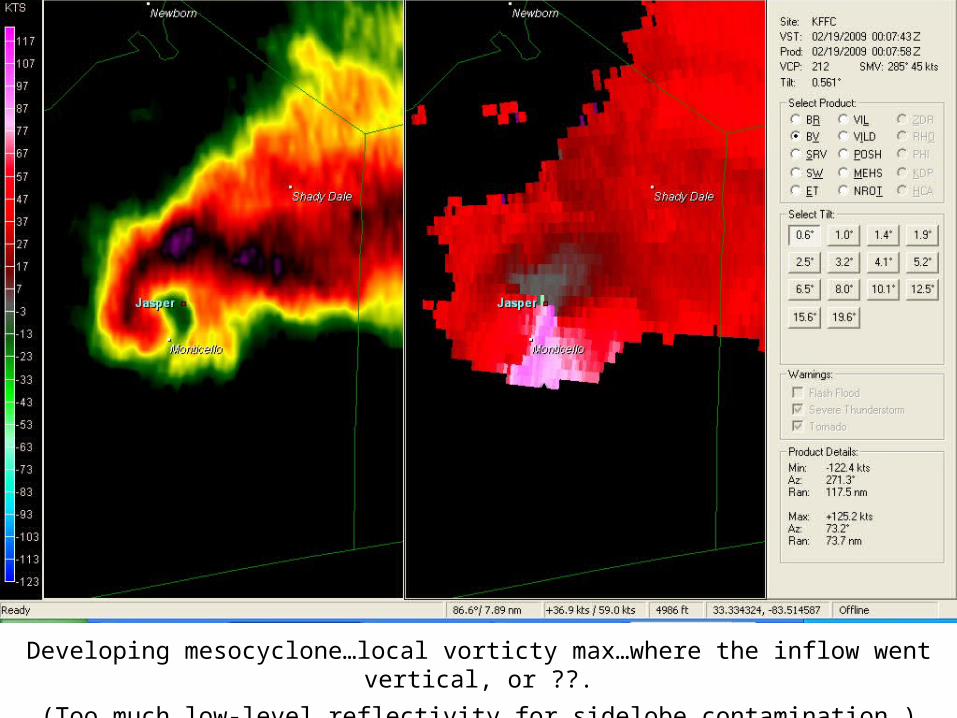
Developing mesocyclone…local vorticty max…where the inflow went vertical, or ??.
(Too much low-level reflectivity for sidelobe contamination.)

Thank You
Steve Piltz – WFO Tulsa, OK
Don Burgess – CIMSS Norman, OK