Embed Size (px)
Citation preview

i
The implementation of transfer pricing for a strategic
business advantage
Jyoti Rupnarain
445768
A research project submitted to the Gordon Institute of Business Science, University of
Pretoria in partial fulfilment of the requirements for the degree of
Master of Business Administration
16 November 2015

ii
ABSTRACT
The aim of this study was to investigate the impact of transfer pricing strategy and performance
in terms of how this provides for a strategic business advantage. A further aim was to assess
the extent that transfer pricing is primarily tax-driven or business strategy-driven. The reason
for choosing this research problem was based on the gap that exists in the theory and literature
on the link between transfer pricing being utilised strategically for a multinational.
This study was best served as a single quantitative exploratory case study to gain an
understanding of how the implementation of transfer pricing can provide for a strategic
business advantage. The non-probability sampling technique of judgment (purposive)
sampling was used for this study in which primary data was collected. Relevant statistical
analyses was performed in order to answer the research questions and involved descriptive
statistics as well as correlation analysis.
Based on the findings it was confirmed that transfer pricing is considered to be part of the
business strategy in the Process Automation division at ABB. However, it was not confirmed
that ABB has a unique global environment for transfer pricing nor a unique country level
environment for transfer pricing. There was agreement that it is beneficial for transfer prices
to be set by a centralised control system.
Keywords
Transfer pricing, Competitive advantage, Business strategy

iii
DECLARATION
I declare that this research project is my own work. It is submitted in partial fulfilment of the
requirements for the degree of Master of Business Administration at the Gordon Institute of
Business Science, University of Pretoria. It has not been submitted before for any degree or
examination in any other University. I further declare that I have obtained the necessary
authorisaiton and consent to carry out this research.
____________________ _____________________
Jyoti Rupnarain Date

iv
TABLE OF CONTENTS
1. INTRODUCTION TO THE RESEARCH PROBLEM ................................................... 1
1.1 Introduction ............................................................................................................. 1
1.2 Problem Identification and Research Motivation ..................................................... 2
1.3 Aim of the Research ............................................................................................... 3
1.4 Relevance of the Research ..................................................................................... 4
2. LITERATURE REVIEW .............................................................................................. 5
2.1 The Concept of Transfer Pricing ............................................................................. 5
2.2 Transfer Pricing as a competitive business strategy ................................................ 6
2.3 The Impact of Transfer Pricing on business strategy ............................................. 10
2.4 The Reasons for Implementing Transfer Pricing ................................................... 11
2.5 The Evaluation of Transfer Pricing as a tool .......................................................... 13
2.6 The Control System of Transfer Pricing ................................................................ 14
2.7 Conclusion to the Literature Review ...................................................................... 16
3. RESEARCH HYPOTHESES .................................................................................... 17
3.1 Research Hypothesis 1 ......................................................................................... 17
3.2 Research Hypothesis 2 ......................................................................................... 17
3.3 Research Hypothesis 3 ......................................................................................... 18
3.4 Research Hypothesis 4 ......................................................................................... 18
3.5 Research Hypothesis 5 ......................................................................................... 18
4. RESEARCH METHODOLOGY ................................................................................ 19
4.1 Research Design .................................................................................................. 19
4.2 Population of Relevance ....................................................................................... 19
4.3 Unit of Analysis ..................................................................................................... 20
4.4 Sampling Method and Size ................................................................................... 20
4.5 Research Instrument and Data Collection Process ............................................... 21
4.6 Data Analysis Approach ........................................................................................ 24
4.7 Reliability and Validity ........................................................................................... 25

v
4.8 Confidentiality and Anonymity ............................................................................... 26
4.9 Research Limitations ............................................................................................ 26
5. RESULTS ................................................................................................................. 27
5.1 Response Rates ................................................................................................... 27
5.2 Demographics ....................................................................................................... 27
5.3 Transfer Pricing as a competitive business strategy .............................................. 31
5.4 The Impact of Transfer Pricing on business strategy ............................................. 35
5.5 The Reasons for Implementing Transfer Pricing ................................................... 39
5.6 The Evaluation of Transfer Pricing as a tool .......................................................... 43
5.7 The Control System of Transfer Pricing ................................................................ 48
5.8 Correlations between Research Themes .............................................................. 53
5.9 Data Reliability and Validity .................................................................................. 55
6. DISCUSSION OF RESULTS .................................................................................... 56
6.1 Response Rates and Omissions ........................................................................... 56
6.2 Demographics ....................................................................................................... 56
6.3 Transfer pricing as a competitive business strategy .............................................. 57
6.4 Conclusion of the results for Research Hypothesis 1 ............................................ 59
6.5 The Impact of Transfer Pricing on business strategy ............................................. 59
6.6 Conclusion of the results for Research Hypothesis 2 ............................................ 60
6.7 The Reasons for Implementing Transfer Pricing ................................................... 61
6.8 Conclusion to the results for Research Hypothesis 3 ............................................ 62
6.9 The Evaluation of Transfer Pricing as a tool .......................................................... 63
6.10 Conclusion to the results for Research Hypothesis 4 ............................................ 64
6.11 The Control System of Transfer Pricing ................................................................ 64
6.12 Conclusions to the results for Research Hypothesis 5 .......................................... 66
6.13 Data Reliability and Validity ................................................................................... 66
7. CONCLUSION ......................................................................................................... 67
7.1 Background of Research....................................................................................... 67
7.2 Research Findings ................................................................................................ 67

vi
7.3 Recommendations for Further Research .............................................................. 70
8. REFERENCES ......................................................................................................... 71
9. APPENDIX 1: QUESTIONNAIRE ............................................................................ 75
10. APPENDIX 2: ETHICS APPROVAL ...................................................................... 79
11. APPENDIX 3: TURNITIN RECEIPT ...................................................................... 80

vii
TABLE OF TABLES
Table 1: Frequency table of Process Automation respondents to questionnaire.................. 28
Table 2: Length in role of respondents ................................................................................ 29
Table 3: Chi-square test results of transfer pricing being a part of business strategy .......... 32
Table 4:Chi-square test results of stage of business strategy transfer pricing falls into ....... 33
Table 5: Chi-square test results of transfer pricing being a business procedure .................. 35
Table 6: Chi-square test results of ABB having a unique global environment for transfer pricing
........................................................................................................................................... 36
Table 7: Chi-square test results of transfer pricing being used to reaffirm that ABB is a global
multinational ........................................................................................................................ 38
Table 8: Chi-square test results of the objectives of why transfer pricing was implemented
have been achieved ............................................................................................................ 39
Table 9: Chi-square test results of transfer pricing being implemented as an accounting
technique ............................................................................................................................ 40
Table 10: Chi-square test results of the utilisation of transfer pricing makes business results
easier to be reported ........................................................................................................... 41
Table 11: Chi-square test results of the benefits of transfer pricing being quantified ........... 42
Table 12: Chi-square test results of the value created by transfer pricing for the organisation
........................................................................................................................................... 43
Table 13: Chi-square test results of transfer pricing seen as more of a management tool ... 44
Table 14: Chi-square test results of the management incentives for utilising transfer pricing
........................................................................................................................................... 45
Table 15: Chi-square test results of the utilisation of transfer pricing making business easier
to be conducted .................................................................................................................. 46
Table 16: Chi-square test results of the costing system being viewed as a strategic variable
........................................................................................................................................... 48
Table 17: Chi-square test results of the evaluation of transfer prices being done effectively 49
Table 18: Chi-square test results of the performance of transfer pricing .............................. 50
Table 19: Chi-square test results of the exploitation of transfer prices amongst related entities
of ABB ................................................................................................................................ 51
Table 20: Chi-square test results of transfer prices being set by a centralised control system
........................................................................................................................................... 52
Table 21: Chi-square test results of transfer prices cannot be determined on a decentralised
level .................................................................................................................................... 53
Table 22: Descriptive statistics of scores between research themes ................................... 54
Table 23: Correlations between research themes ............................................................... 55
viii
TABLE OF FIGURES
Figure 1: Representation of Process Automation country respondents to questionnaire ..... 27
Figure 2: Job roles of respondents ...................................................................................... 29
Figure 3: Number of years of working experience of respondents ....................................... 30
Figure 4: Age group of respondents .................................................................................... 30
Figure 5: Transfer pricing is considered to be part of the business strategy ........................ 31
Figure 6: Transfer pricing is considered as part of the business strategy ............................ 32
Figure 7: Strategy stage of transfer pricing .......................................................................... 33
Figure 8: Transfer pricing falls into the implementation stage of strategy ............................ 34
Figure 9: Transfer pricing is a procedure of the way business is conducted ........................ 35
Figure 10: ABB has a unique global environment for transfer pricing .................................. 36
Figure 11: ABB has a unique environment for transfer pricing on a country level ................ 37
Figure 12: Transfer pricing is used to reaffirm that ABB is a global multinational firm .......... 38
Figure 13: The objective of implementing transfer pricing has been acheived ..................... 39
Figure 14: Reasons for implementing transfer pricing ......................................................... 40
Figure 15: Utilisation of transfer pricing makes business results easier to be reported ........ 41
Figure 16: Benefits of transfer pricing can be quantified ...................................................... 42
Figure 17: Value created by transfer pricing for the organisation ......................................... 43
Figure 18: View of transfer pricing as a strategic management tool ..................................... 44
Figure 19: Incentive of utilising tansfer pricing ..................................................................... 45
Figure 20: Utilisation of transfer pricing makes business easier to be conducted ................ 46
Figure 21: The utilisation of transfer pricing makes business easier to be conducted .......... 47
Figure 22: Costing system viewed as a strategic variable ................................................... 48
Figure 23: Effectiveness of evaluating transfer pricing ........................................................ 49
Figure 24: Management of the performance of transfer pricing ........................................... 50
Figure 25: Exploitation of transfer pricing among related entities of ABB ............................ 51
Figure 26: Transfer pricing set by a centralised control system ........................................... 52
Figure 27: Centralisation level of transfer prices .................................................................. 53
1
1. INTRODUCTION TO THE RESEARCH PROBLEM
1.1 Introduction
According to (Adler, 1996; Wong, Nassiripour, Mir, & Healy, 2011), due to the rapid
globalisation of the world economy there has been an accompanying growth of multinational
corporations with a subsequent increase in the transfer of goods and services between related
entities. The World Trade Organisation (WTO) estimates that about 50% of the world’s
international trade lies among multinational corporations. A staggering 25% of total productive
assets belong to the 300 largest multinationals (The Economist, 1993). Therefore,
multinationals play an important role in the global trade environment (Clausing, 2000).
Whilst there is this aggregation towards globalisation, this same trend has placed a lot more
attention on a multinational (Cravens, 1997). In order for these multinationals to be in a
position to actively compete, the understanding of how domestic and multinational competitors
operate in this dynamic world becomes a necessity (Cravens, 1997).
Though multinationals are faced with the multifaceted challenges of how they can compete in
this global economy, they also have the influence to exercise a substantial amount of power
and utilising their operations in a number of countries (Cravens, 1997). (Schjelderup &
Weichenrieder, 1999) highlights that whilst there may be an increasing concern around the
profit-sharing activities, the reality is that tax authorities find it extremely difficult to monitor the
behaviour of transfer pricing amongst the related entities of a multinational.
Though multinationals are faced with the multifaceted challenges of how they can compete in
this global economy, they also have the influence of exercising a substantial amount of power
and utilising their operations in a number of countries (Cravens, 1997). Whilst multinationals
may have numerous advantages in their respective local markets, the balance is that they also
have the most critical complication in accomplishing the strategic intention of the organisation
and is required to select the adequate strategies to ensure profitability (Cravens, 1997).
Transfer pricing has the ability to accomplish these myriad of strategic objectives.

2
1.2 Problem Identification and Research Motivation
(Eccles, 1985) highlighted the importance of transfer pricing, as nearly 80% of Fortune 1000
have to choose a transfer pricing strategy. (Cravens, 1997) confirmed this by stating that
transfer pricing is receiving an increasing amount of attention. (Holtzmann & Nagel, 2014)
argued that it is not only globalisation that has attracted the focus of implementing a transfer
pricing strategy, but it has also been fostered by several developing economies having opened
up to the world and the impact that transfer pricing has on the organisation’s taxable income.
For the majority of multinationals, globalisation and the rapid growth of international trade has
made the way these inter-companies conduct their pricing an everyday necessity (Raby,
2013). (Raby, 2013) highlighted that with the development of national treasury shortfalls and
the frequent use of terms ‘transfer pricing’, ‘tax havens’ and ‘tax shelters’ multinationals have
been exposed to the centre of the storm of controversy. However, as globalisation grows and
covers almost every corner of the world, these same multinationals are looking for efficient
ways to ‘protect’ their tax bases (Holtzmann & Nagel, 2014). (Holtzmann & Nagel, 2014)
indicated that the issue lies with strict documentation and audit practices and that
multinationals seek ‘advice’ on ways to fend off this high scrutiny and regulation levels.
Transfer pricing applies to holdings, company groups and large entities and departments
operating at international level. There is nothing new about the concept of transfer pricing as
it has been in existence over decades. (Parmar, 2012) advocates that the extent of the transfer
pricing practice which has acquired critical mass is given due consideration by tax authorities.
(Uyar, 2014) also highlighted that transfer price has become an important issue, as decisions
on policies to guide pricing decisions is becoming increasingly complicated. In light of this,
there has been an increasing number of executives that have realised that the role of transfer
pricing as an essential strategy for multinationals. (Cravens, 1997) solidified this view by
showing that there is clear evidence that the organisations using transfer pricing as a strategic
intent has a direct contribution to overall corporate performance.
In a recent survey by tax and financial directors of almost two out of three multinational
companies, transfer pricing was listed as the most current and future international tax concern
(SAICA, 2011). Thus, it is quite concerning when approximately 70% of these multinationals
still maintained that transfer pricing is not incorporated into their organisations strategic
decision-making objectives (SAICA, 2011). The unfortunate risk is if these multinationals could
effectively manage their transfer pricing, they might gain a coordinating lever over their global
operations and a competitive business advantage. The argument is that transfer pricing cannot
3
be viewed as a tax compliance issue when it can and should become an crucial strategic tool
to measure performance and ultimately increase profitability (SAICA, 2011).
Multinationals are faced daily with the challenges of operating in a complex environment, and
the objective of this study is to investigate the implementation of transfer pricing providing for
a strategic business advantage. Multinationals also experience the challenge of preparing
documentation to demonstrate their compliance to transfer pricing rules as the expectations
of each jurisdiction is constantly growing (Raby, 2013). (Holtzmann & Nagel, 2014) highlighted
that, due to the tax reforms, transfer pricing adjustments lie among the top concerns for United
Stated businesses. As this is a market that multinationals operate in, the risk of non-
conformance is high.
The impact of the devotion of government’s focus to transfer pricing policies has created a
very unsteady business environment for multinationals, many of which are already struggling
with increased global competition, escalating costs of operation and the imminent threats of
global recession (Raby, 2013). In addition to this, the changes in accounting rules and the
challenge for accountants to have a single number to report as an indicator of earning makes
for what many may term ‘a perfect storm’ (Raby, 2013). However, (Holtzmann & Nagel, 2014)
viewed this from a different perspective, with this complexity considered an opportunity to
obtain the organisations strategic objective by optimising profits, maintaining tax rates and
increasing cash flows.
According to (Raimondos-Moller & Scharft, 2002) transfer pricing has been brought into the
spotlight because of the concerns that multinationals are shifting profits across countries with
lower-tax implications. (Cravens & Shearon, 1996) highlighted that most of the research on
transfer pricing primarily focuses on the transfer pricing method and does not necessarily
cover the whole process involved in transfer pricing.
1.3 Aim of the Study
Multinational corporations are operating in a complex and unsteady environment, and the aim
of this study is to investigate the impact of transfer pricing strategy on business strategy and
performance in terms of how this provides for a strategic business advantage.
The study also aims to assess the extent that transfer pricing is primarily tax-driven or business
strategy-driven. The reason for choosing this research problem was based on the gap that
exists in the theory and literature on the strategic use of transfer pricing to obtain business

4
advantage. Although the fields of transfer pricing and business strategy may have sufficient
literature in their respective fields and has extensive research been conducted, the link
between the two is sparse and under researched. (Hyde, 2005) has identified that the distinct
roles of transfer pricing being tax-driven and/or strategy driven filtering into management
incentives have been managed in isolation. This research aims to minimise that gap.
1.4 Relevance of the Study
The expected benefits from this research is to lend to the body of knowledge for academics,
business managers and multinationals as a whole.
The study is relevant for the following reasons:
1. (Chan & Chow, 1997) have shown empirical research on international transfer
pricing focussing mainly on organisations operating the United States (Chan &
Chow, 1997). However, Research on transfer pricing in developing countries
like South Africa is found to be scarce and this study aims to provide larger
insight.
2. There will be a benefit to managers of businesses to gain a clearer
understanding of what decisions needs to be made strategically to drive overall
performance with the utilisation of transfer pricing. In support of this aim,
transfer pricing can accomplish a variety of these strategic objectives (Cravens,
1997).

5
2. LITERATURE REVIEW
2.1 The Concept of Transfer Pricing
(Cravens, 1997) defines the “Transfer Price as the internal value placed on a raw material,
good, or service as it moves from one related organisational entity to another within a
consolidated corporate group” (Cravens, 1997: pg. 128). These transfer prices could apply to
any related entity of the organisation. In the normal operations of these multinationals the
transfer of goods, raw materials, intangibles or services between related entities of the
multinational parent occurs. Since these entities operate separately, a transfer price is
assigned to the transfer (Cravens, 1997).
Then (Borkowski, 1990) states that transfer pricing is a pricing strategy on products, semi-
finished products or components transferred between the related entities in order to review
compliance with the purpose and supreme performance based on maximum profit and
minimum tax.
The (Holtzmann & Nagel, 2014) study described the term transfer pricing as the pricing
arrangement for transactions between the related entities. The span of activities this ranges
from includes tangible and intangible goods and services, intellectual property and loans and
financing transactions.
(Sikka & Willmott, 2010) portray transfer pricing as a technique for optimal allocation of costs
and revenues amongst division, subsidiaries and joint ventures within a group of related
entities.
(McGowan, Beauregard, & Collier, 2011) have condensed their definition to state it is the value
that has been placed on products that are sold within the related entities of the organisation.
The parent company has manufactured some product and sell to a foreign subsidiary that then
sells on the same product to a customer.
Whilst (Hirshleifer, 1956) simply states that the transfer price should be set as the marginal
cost this proves to be quite challenging in practice and leads to transfer pricing becoming more
of an information revelation quandary. For this reason, transfer pricing should not be viewed
in isolation but more in the larger context of the organisations strategic intent.

6
Findings on the literature available on this subject reach consensus on the definition of transfer
pricing being the price allocated between the related entities of an organisation.
A transfer price is guided by the arm’s-length principle guides that a transfer price be set at a
price between their entities that they would price to an independent organisation (Barry, 2005;
OECD, 1979; Satapathy, 2001). According to (Holtzmann & Nagel, 2014) the arm’s-length
principle should be the source to determine if the transfer pricing transaction was correctly
recorded. (Barry, 2005) however cautions that this is not so easy to determine for intangible
items and therefore makes the compliance to law difficult. (Clausing, 2000) highlighted that in
practice organisations intrafirm trade prices differ from the arm’s length pricing in order to
minimise the tax burden. (Holtzmann & Nagel, 2014) criticises the (“Organization for Economic
Co-Operation and Development,” 2013) transfer pricing rules in it not being consistent
government agencies and organisations. According to (Patel, 1981) an easy gauge that a
good is over or under priced is if it is higher or lower than the arm’s length price.
2.2 Transfer Pricing as a competitive business strategy
(Eccles, 1985) concisely consolidates all of the objectives of transfer pricing from previous
research as being:
Managing the tax burden
Complying with tax regulations
Managing tariffs
Promoting equitable performance evaluations
Motivation of managers
Promoting goal congruence
Maintaining a competitive market position
Mitigating cash transfer restrictions
Minimising the inflation risk
Managing foreign currency exchanges
Addressing social or political concerns
Reflecting the actual costs and income consistently
(Andrews, 1987) considers corporate strategy as the organisational process consisting of the
formulation of the strategy and then the implementation of it. When one has to consider
transfer pricing, it then falls into the implementation phase of corporate strategy. (Andrews,

7
1987) argued that this is reinforced by analysing the relationship between strategy and transfer
pricing. (Eccles, 1985) supported this view by classifying strategy and transfer pricing as a
reiteration of each other. Later (Eccles, 1985) confirmed that a transfer pricing policy is
directed by an organisation’s strategy and that it’s effective management requires
administration. This was further emphasised by (Andrews, 1987) that viewed strategy as being
a collection of goals with a similar purpose. There has been significant improvement in the
view that organisations now readily accept transfer pricing as a component of strategy (Eccles,
1985). (Patel, 1981) highlighted that transfer pricing can be utilised in business strategy as a
means to hedge payments based on speculator lags and lags in order to minimise an
organisations payments due to a weak currency, like South Africa currently finds itself in. Thus
the literature shows the relationship with corporate strategy and transfer pricing being a
component thereof.
The (Cravens, 1997) and (Uyar, 2014) studies have concurred on four pricing methods used
for transfer pricing. They are cost-based, market-based, negotiated pricing and dual transfer
pricing.
1. The cost-based pricing method is reliant on obtaining the costs of manufacturing or
acquiring the item that is required to be transferred and referred to as the transfer
price.
2. The market-based pricing method uses the external market price as the frame of
reference for the same or similar item to be transferred.
3. The negotiated pricing method is when the related business entities engage and
jointly agree to the transfer price.
4. The dual transfer pricing method where the price of the item that is transferred differs
for internal business units that are involved in the transfer.
The (Chalos & Haka, 1990) empirical evidence showed that most organisations largely rely
on negotiations to determine the transfer price for that product or transaction. This conformed
to the (Tang, 1979) negotiated transfer pricing mechanism.
(Baldenius & Reichelstein, 2006) cautioned against using the market price as the transfer
pricing transaction ends up being double marginalised which then makes it impossible to
achieved the most efficient outcome. (Adler, 1996) is critical of market pricing and views it as

8
being foolish as it does not take into account competitive advantages. However, the advantage
of a market price is that it is able to meet the necessary statutory requirements (Baldenius &
Reichelstein, 2006).
The (OECD, 1979) stipulated the following three pricing methods that may be used to set
arm’s length prices:
1. Comparable uncontrolled price method which is the price charged for the same
goods or service to another unrelated organisation.
2. Re-sale price method which is the price at which the goods or services may be
re-sold to an affiliate to an unrelated party – in the case of ABB this would be a
channel or distribution partner, and
3. Cost-plus method which is the cost of the goods or service plus a markup.
The comparable uncontrolled prices is the best evidence to conform that the arm’s-length
pricing principle (McGowan et al., 2011). (Gox & Schondube, 2004) suggested that the optimal
transfer price is the cost-plus method. The advantage of this is that a higher product price than
the Nash equilibrium can be set which results in decreasing the power of the rivalry of
competitors. (Gresik & Osmundsen, 2008) showed that the cost-plus method is the most
effective in limiting the profits out of a high-tax country and bringing in the largest revenues for
a low-tax country. Of the methods, (McGowan et al., 2011) have shown that re-sale price
method is the most difficult method to apply in practice.
In addition to the OECD pricing methods (Nielsen, Raimondos-Moller, & Schjelderup, 2003)
adds a split profit method which is the sharing of the profit between the supplier and the
purchaser.
(Stevenson & Cabell, 2002) justified the activity-based costing approach for a multinational to
use amongst the related entities in different countries.
It is evident that there are many forms, practices and variations to the transfer price. None of
the methods are perfect and the challenge that lies for a multinational is in administering and
maintaining them internationally (Nielsen et al., 2003). (Holtzmann & Nagel, 2014) confirmed
this view in that there is not one single method that can be used all the time and nor is it that
simple, however the underlying arm’s-length principle could be used as a basis for this whilst

9
(Baldenius & Reichelstein, 2006) argued that whatever the transfer price is it will always be a
contentious issue amongst the related entities. (Alles & Datar, 1998) are of the view that
transfer prices are based on the manufacturing costs that are communicated to marketing and
it is for this reason that transfer prices will always have a strategic objective associated with
it. The cost drivers need to be understood in order to be able to deliver on the desired
competitive advantage (Alles & Datar, 1998). The general conclusion (Borkowski, 1990;
Eccles, 1985; Emmanuel & Mehafdi, 1994; Spicer, 1988) is that there is no one correct
method. (Borkowski, 1990) argues that no one ‘correct’ transfer price can be prescribed for all
multinationals. Thus, it is important that each multinational chooses a method which fits the
needs of the organisation in terms of strategy implementation.
As a caution (Adler, 1996) advises not focusing on the pricing method providing short-term
cost benefits but rather viewing it from a competitive advantage perspective. This studythough
is not concerned with the method of transfer pricing, and is focused on how the implementation
of transfer pricing allows for a strategic business advantage. However, because the related
entities of the multinational do not exist in isolation from each other, transfer pricing becomes
an essential component in order for the multinational to pursue a competitive business
advantage (Cravens, 1997). (Nielsen et al., 2003) highlights the strategic role that transfer
pricing plays in being able to capture market share from competitors and in turn increase the
organisations profits. Even though sometimes transfer pricing may be unnoticeable, (Gox &
Schondube, 2004) demonstrated that they still have a strategic impact to the organisation.
The more direct the transfer pricing strategy is, the more profitable it becomes for the
organisation (Hamilton & Mqasqas, 1997).
Whilst transfer pricing may be viewed from a tax-driven perspective, the utilisation of transfer
pricing for a multinational could provide for a means of achieving corporate objectives and
creating strategic value (Cravens, 1997). (Cravens, 1997) has successfully shown that
multinationals may not be solely focussed on the taxation issues as a primary objective to
utilise transfer pricing, and may be utilising this technique as a means to achieve a competitive
business advantage in addition to other business objectives. Whilst transfer pricing may be
employed in many different situations, (Cravens, 1997) cites the most imperative objective of
implementing transfer pricing for a multinational should be to maintain a competitive market
position in order to compete in the global economy. (Eccles, 1985) provides a framework for
the implementation of the transfer pricing strategy that assists managers in scrutinising their
own entities transfer pricing.

10
(Eccles, 1985; Spicer, 1988) are in agreement that transfer pricing is not part of a business
procedure but rather a component of the business strategy. This perspective places the
significance of transfer pricing on the strategy and performance of the multinational (Eccles,
1985; Spicer, 1988). (Cravens, 1997) highlights that transfer pricing is viewed as being critical
to the overall success of the multinational globally, and thus does feed into the strategy.
The transfer price is critically important as it is the means by which the multinational does a
considerable amount of business. In addition, if organisations employ transfer pricing to
accomplish multiple objectives, then the effectiveness of transfer pricing becomes even more
important to overall corporate success (Cravens, 1997).
2.3 The Impact of Transfer Pricing on business strategy
(Cravens, 1997) is of the view that a multinational exerts its reason for existence in the ability
to provide its good and/or services globally and as all of the entities are related they need to
remain separate. Thus a transfer price needs to be provided for the goods and/or services
(Cravens, 1997).
For a multinational it is not an easy task to make decisions about the different global markets
and then attempt to filter this into transfer prices (Cravens, 1997). (Clausing, 2000) cautions
that multinationals may decide to produce goods in low-tax countries and export these goods
to high-tax countries in order to boost sales. (Nielsen et al., 2003) has shown that transfer
pricing has a strategic value in addition to it being used as an instrument to gauge profitability
of the organisation.
(Chan & Chow, 1997) have found that research in the area of transfer pricing for developing
countries are scarce and are largely based on recommendations provided by the OECD
(OECD, 1979). (Grubert & Mutti, 1991) also cautions that developing countries become prime
targets for a developed country like the United States to import and export more to a
developing country where the tax rates may be lower.
In order to maximise profit, (Arpan, 1972; Fowler, 1978; Kant, 1988) argue that a higher/lower
price than arm’s length may be assigned. However, the level of arbitrariness in setting the
transfer price is dependent on whether the products are traded in the open market or not.
(Usmen, 2010) then assumes that multinationals have considerable leeway to adjust the level
of transfer prices charged to their affiliates.

11
(Schjelderup & Weichenrieder, 1999) argues that if a country changes from a price-related
transfer pricing system to a profit-related measure it can have the effect of reducing the
number of imports without actually changing any of the transfer prices as this trade effect
utilises the transfer pricing as an instrument as a strategic trade policy and protection against
tax laws.
A global transfer pricing policy for a multinational involves a detailed analysis of the
economics, development of the proposed policy in line with the multinationals global tax
planning objectives, a detailed implementation and monitoring plan, and the adoption of a
defensive strategy (Raby, 2013). in the development of the policy, stakeholders like finance,
operations and taxation are involved and provides for a useful opportunity to communicate
and assess business strategy and priorities (Raby, 2013). The implementation also requires
cross-functional cooperation for the multinational.
Transfer pricing may however also be utilised solely with the intention of portraying the
multinational image (Cravens, 1997) because if the multinational operated without these
transfer prices then the purpose for the existence would be questioned.
2.4 The Reasons for Implementing Transfer Pricing
(Eccles, 1985) highlights the importance of transfer pricing as nearly 80% of Fortune 1000
have to choose a transfer pricing strategy.
Transfer pricing is an area that is largely viewed as being tax-driven (Cravens, 1997). Contrary
to this, (Cravens, 1997) has successfully shown that multinationals may not be solely focussed
on the taxation issues as a primary objective to utilise transfer pricing, and may be utilising
this technique as a means to achieve a competitive business advantage in addition to other
business objectives. (Clausing, 2000) argues that tax incentives largely influence trade
between related entities of an organisation. (Rugman & Eden, 1985) boldly states that in
making use of trade taxes and different rates of taxing the related entities, these unregulated
transfer pricing becomes inefficient. (Nielsen et al., 2003) are of the view that it can be a win-
win situation for a multinational to achieve both: manipulate the transfer pricing for tax
purposes as well as achieving strategic intent.

12
Whilst transfer pricing may be commonly thought of as a way to manage tax considerations,
(Eccles, 1985) emphasises that transfer pricing forms part of the overall strategy and should
not be considered in separation and classified as an accounting technique. (Anthony,
Dearden, & Govindarajan, 1992) supports this in their view that transfer pricing should not be
primarily an accounting tool. Therefore, when decisions are being made, they should be driven
from a strategy perspective and not solely as a response to accounting or tax regulations
(Eccles, 1985).
Cognisance needs to be made that whenever a multinational chooses to enter into a new
market, there will be newer complexities added to the multinationals transfer pricing strategy
(Cravens, 1997). (Holtzmann & Nagel, 2014) confirms this view by stating that with this growth
to become a multinational there are differing tax requirements and the requirements could be
complicated and expensive.
(Cravens, 1997) is of the view that one of the main reasons why multinationals consider
transfer pricing in high importance as it plays an important role in persuading competitors of
their profitability as an organisation. However (Raimondos-Moller & Scharft, 2002) has shown
that when an organisation is non-integrated and vertically linked each related entity behaves
as a monopolist and sets prices above the marginal costs resulting in a higher final price and
ultimately negatively affecting the organisation’s profitability.
(Alles & Datar, 1998) are of the view that transfer prices are based on the manufacturing costs
that are communicated to marketing and it is for this reason that transfer prices will always
have a strategic objective associated with it.
Transfer pricing is an effective tool for multinational corporations to achieve many different
objectives, such as profit maximization, cash flow management, marketing strategy
implementation, product coordination, and employee motivation. Amongst these, achieving
maximum corporate-wide profit and divisional evaluation are often cited as the most important
goals of transfer pricing (Uyar, 2014; Wong et al., 2011). (Hiemann & Reichelstein, 2012)
supports this in their objective of transfer pricing being to enable a decentralised organisation
to achieve its full profit potential.
(Usmen, 2010) also argues that a transfer pricing mechanism is used to circumvent market
imperfections brought about by government authorities such as tariffs, duties, exchange
controls and blocked funds and provides a framework where transfer prices are used to exploit
tax arbitrage as well as financial arbitrage opportunities that are present in segmented

13
international capital markets. Transfer pricing is thus a strategic tool that can destroy or create
value for an organisation, as it shifts revenues within the network of alliances of the parent
(Usmen, 2010).
(Hyde, 2005) highlighted that it is the parent that has the first-mover advantage as they set
the transfer price and the related entity then has to react to it. This is a strategy that a
multinational can utilise in order to gain a competitive market position against their
competitors.
(Cravens & Shearon, 1996) had cautioned that whilst the transfer pricing policy may have the
ability to measure that total tax burden and return on assets, the outcomes of the transfer
pricing policies of multinationals still has sufficient room for exploration.
2.5 The Evaluation of Transfer Pricing as a tool
(Cravens, 1997) is of the view that a transfer price is critical as it is by this price that the
multinational conducts a substantial part of its business.
For the domestic portion of the multinational, there are many internal issues in the evaluation
and performance of transfer pricing (Cravens, 1997). (McGowan et al., 2011) highlighted that
the evaluation of manager’s performance becomes very difficult for a multinational when
transfer pricing is involved as for the foreign subsidiary they may have very little control on
what the transfer price will be charged by the producer or parent entity.
(Anthony et al., 1992) highlights that transfer pricing should be viewed as a behavioural tool
that has the ability to motivate managers to make the right business decisions. (Gox &
Schondube, 2004) has an interesting viewpoint with criticising managers rather than the
transfer price itself. It is the risk-averseness of the manager that can dictate a higher product
price and not the transfer pricing method chosen. According to (Vroom, 2006) it is the
organisation that needs to be able to motivate managers to become less when negotiating or
agreeing to prices as a way to increase the organisations profits and will have a knock-on
effect of competitors also raising their prices.
According to (Hyde, 2005) besides transfer pricing being able to minimise the tax burden for
a multinational, its use serves as an incentive for divisional managers that are remunerated
based on the performance of their business unit.

14
(Anthony et al., 1992) further emphasises that when transfer pricing is used as a control
mechanism then this feeds into the organisation achieving its strategic objective.
(Eccles, 1983) carried out extensive studies of the practical use of the transfer pricing methods
in industry where he linked the transfer pricing method used by a firm to the firm’s strategy.
He also argued that in reality the personal relationship between the division managers may
lead to uncooperative behaviour and hence to non-optimal outcomes.
2.6 The Control System of Transfer Pricing
When a multinational pursues the route of employing transfer pricing in order to achieve
numerous objectives, the effectiveness of transfer pricing contributes to this overall success
(Cravens, 1997). (Cravens, 1997) is of the opinion that the best measure of effectiveness for
strategy is to view it in terms of where management objectives were achieved. However,
(Cravens, 1997) is cognisant the a measure like effectiveness is not that easy to be able to
quantify and some sort of general indication is the magnitude to which the anticipated objective
has been accomplished.
However, (Eccles, 1985) cautions that the effective management of transfer requires attention
to the administration of the way internal transfers are conducted. (Chalos & Haka, 1990) also
stated the risk in frequently making use of negotiated prices does not follow the organisations
strategic objectives. However, (McGowan et al., 2011) has shown that a multinational does
have the ability to manage its business effectively and efficiently with the utilisation of transfer
pricing.
(Baldenius & Reichelstein, 2006) cautioned against using the market price as the transfer
pricing transaction ends up being double marginalised which then makes it impossible to
achieved the most efficient outcome. Therefore transfer pricing needs to be effectively
managed in order to discourage the ‘paper’ multiple profit centres of the organisation
(Emmanuel & Mehafdi, 1994).
For a multinational it is a staggering task to apply a transfer price from a centralised level and
expect to be applied uniformly in global markets and this finds itself being further complicated
by the changing perspective of boundaries (Cravens, 1997). However (Nielsen et al., 2003)
argues that a multinational can gain by setting the transfer price from a centralised control

15
system and by Cournot competition allows the local entity to determine the local prices and
quantities. (Vroom, 2006) however argues that decentralisation has the effect of softening up
competitors to the point where the organisations profits end up being higher than the Cournot
profit but the use of transfer pricing and decentralisation creates conflict and inefficiencies in
the organisation. (Onsi, 1970) cautioned that decentralisation in a multinational coupled with
dealing with multiple profit centres becomes a massive problem. (Baldenius, Melumad, &
Reichelstein, 2004) argued that transfer pricing can be utilised as an instrument to achieve
decentralisation and coordination for a multinational.
(Cravens, 1997) is aware that a control system may also fail due to informal alliances that may
have been forged between countries.
The unfortunate risk is if these multinationals could effectively manage their transfer pricing,
they gain a coordinating lever over their global operations and a competitive business
advantage. Further complications arise when considering income tax and tariff objectives and
thus emphasis that transfer prices cannot be set in separation and needs to form part of the
overall business strategy (Cravens, 1997).
(Eccles, 1985) cites the two primary ways to evaluate the effectiveness of transfer pricing as
being:
1. To consider whether the organisation has made a transfer pricing
decision that has a positive effect on corporate performance
2. That the managers feel fairly rewarded for their activities involved in
transfer pricing.
Executives of an organisation will not hastily employ a transfer pricing mechanism that is not
susceptible to achieving overall corporate performance.
(Holmstrom & Tirole, 1991) recommends that it is the degree of centralisation that determines
the balance between the trading relationship and transfer pricing policy. (Baldenius &
Reichelstein, 2006) advised that if there is an efficient decentralisation in the organisation then
transfer pricing based on market prices becomes easier to manage.
A multinational is capable of exploiting, in part or in whole, any internal transfers that occur
amongst the related entities (Cravens, 1997). (Lambert, 1979) showed that there is a

16
heightened level of conflict between related entities when transfer prices are being set solely
for that related entities profits and should not be exploited.
2.7 Conclusion to the Literature Review
The area of transfer pricing and the strategy employed thereof can be a complex challenge
for any multinational. One of the areas that the multinational can look to is what the
organisations strategic intent is and how the transfer pricing policy feeds into this.
The literature review attempted to narrow the study into the following research themes:
1. Transfer pricing as a competitive business strategy
2. The impact of transfer pricing on business strategy
3. The reasons for implementing transfer pricing
4. The evaluation of transfer pricing as a tool
5. The control system of transfer pricing
One of the challenges encountered for this section is that the topic is attempting to combine
different fields with a resulting gap in the literature tying the two up and resulted in limited
articles that could be sourced. There is a resulting limited amount of literature in this area thus
small number of articles cited.

17
3. RESEARCH HYPOTHESES
According to (Zikmund, Babin, Carr, & Griffin, 2012) the start of the research process is with
research objectives. These research objectives are classified as the goals to be achieved by
conducting research. (Zikmund et al., 2012) stated that the researcher should formally state
the research objectives after identifying and clarifying the research problem as this defines the
type of research that is required and what intelligence may result that will allow for informed
choices to be made.
The research objectives committed the researcher to produce the needed research and drove
the rest of the research process and was deemed vital that the objectives are appropriate and
will produce relevant information (Zikmund et al., 2012).
The research objectives wished to expand the researchers understanding the role that
strategic transfer pricing plays in order to provide a strategic business advantage. A research
hypothesis is the prediction that a relationship exists (Field, 2013). This was called the
alternative hypothesis and denoted as H1. The opposite alternative (null) hypothesis was
denoted by H0 and stated that a relationship is absent.
The specific research objectives or hypotheses that were investigated in this research were
as follows.
3.1 Research Hypothesis 1
This research hypothesis objective was to understand if transfer pricing was initialised as a
competitive business strategy in the organisation.
H0:There is no relationship that transfer pricing was initialised as a competitive business
strategy.
H1: Transfer pricing was initialised as a competitive business strategy.
3.2 Research Hypothesis 2
This research hypothesis aimed to investigate how the impact of transfer pricing was
determined to be a part of business strategy.

18
H0:There is no relationship that transfer pricing was determined as part of business strategy.
H1: The impact of transfer pricing was determined as part of business strategy.
3.3 Research Hypothesis 3
This research hypothesis objective was to differentiate whether the reason for implementing
transfer pricing was primarily tax-driven or business strategy-driven.
H0:There was no relationship that the primary reason for implementing transfer pricing is
business strategy-driven.
H1: The primary reason for implementing transfer pricing was business strategy-driven.
3.4 Research Hypothesis 4
This research hypothesis aimed to investigate whether transfer pricing was a management
control tool or a component of corporate strategy.
H0:There was no relationship that transfer pricing is a component of corporate strategy.
H1: Transfer pricing was a component of corporate strategy.
3.5 Research Hypothesis 5
This research hypothesis objective was to identify whether transfer prices set by a centralised
control system were more desired than by a decentralised system.
H0:There was no relationship that transfer pricing set by a centralised control system were
more desirable.
H1: Transfer pricing set by a centralised control system were more desirable.

19
4. RESEARCH METHODOLOGY
This chapter outlines and explains the research methodology that was adopted for the
research. It includes the research philosophy, the approach, design and method of data
analysis that was used. This chapter illustrates how the approach was most appropriately
aligned to the objectives of the research.
4.1 Research Design
(Zikmund et al., 2012) described the research design as a master plan that specifies the
methods and procedures for collecting and analysing the needed information. Thus a research
design provides the framework or plan of action for the intended research (Zikmund et al.,
2012). The research questions, data and analysis will ensure that the research questions were
adequately addressed.
(Saunders & Lewis, 2012) recommended that exploratory research be performed with the aim
of discovering new understandings and viewing existing topics in a new manner all with an
aim of seeking new insights. (Zikmund et al., 2012) confirmed this by stating that exploratory
research is conducted to clarify ambiguous situations and is used as a guide and refine
subsequent research efforts. The aim of the study was thus served best by a quantitative
exploratory study. The ways of conducting exploratory research as defined by (Saunders &
Lewis, 2012) were searching the academic literature, interviewing ‘experts’ in the subject, and
conducting interviews.
4.2 Population of Relevance
The population, or universe, as defined by (Saunders & Lewis, 2012) is the complete set of
group members. (Zikmund et al., 2012) emphasised that specifying the target population is a
crucial aspect of the sampling plan.
For the purposes of this study, the population was defined as the Process Automation division,
which is one of the five divisions of ABB.

20
4.3 Unit of Analysis
(Zikmund et al., 2012) identified the unit of analysis as what or who should provide the data
and at what level of aggregation. The appropriate unit of analysis for this research was
specified as the Chief Financial Officers (CFO’s), Local Divisional Managers, Divisional
Controllers and Local Business Unit Managers in the Process Automation division. This unit
of analysis allowed for an analysis of the Process Automation division of ABB and provided a
global perspective of the research findings.
4.4 Sampling Method and Size
The non-probability sampling technique of judgment (purposive) sampling was used for this
research based on the researcher’s judgement to actively choose who will be best to be able
to answer the research question and meet the research aim. (Saunders & Lewis, 2012)
supports this view when judgement is used as to whom is best suited to answer the research
objectives. For the purposes of this study the researcher selected the sample based on
personal judgement about some appropriate characteristics of the sample in the unit of
analysis.
This was a cross-sectional study because the data was collected at a single point in time
(Zikmund et al., 2012). The typical method of analysing a cross-sectional survey was to divide
the sample into appropriate subgroups. (Saunders & Lewis, 2012) supports that a cross-
sectional study usually employed the survey strategy to produce quantitative data. The critical
case sampling variety (Saunders & Lewis, 2012) was utilised where the sample was crucial
to addressing the research aim. The underlying premise was that the topic of interest was
most likely to occur in the sample selected and that the sample selected was essential to the
operation of the process.
According to (Zikmund et al., 2012) the next sampling issue concerns sample size. Whilst
every individual involved in the transfer pricing process of ABB was wished to be examined,
doing so may have proven to be unnecessary and unrealistic. (Zikmund et al., 2012) is of the
view that larger samples are more precise than smaller ones. However, proper nonprobability
sampling of a minimum sample size of 30 with fair representation from the unit of analysis can
allow this proportion of the total population to give a reliable measure of the whole and be
meaningful. Even though nonprobability sampling involves samples being selected on the
basis of personal judgement or convenience, the researcher ensured that a sample selection

21
error did not occur. In line with (Saunders & Lewis, 2012) the researcher clearly explained the
criteria of the unit of analysis, the reasons for the selection and the underlying premise on
which these were based.
4.5 Research Instrument and Data Collection Process
When conducting business research, (Zikmund et al., 2012) are of the view that a survey is
the most common method of generating primary data. A survey is a research strategy which
involves the structured collection of data from a sizeable population (Saunders & Lewis, 2012).
(Zikmund et al., 2012) defines a survey as a research technique in which a sample is
interviewed in some form or behaviour of respondents is observed and described in some
way. As the data collection in a survey may take the form of questionnaires, structured
observation and structured interviews it can also be viewed as unobtrusive.
Primary data was collected via an online administered survey and is shown in APPENDIX 1:
QUESTIONNAIRE. The survey involved the structured collection of data from a
sizeable population. It is a method widely used in business and management research and
allowed for the collection of data about the same thing from a large number of people in a
cost-effective manner.
According to (Zikmund et al., 2012) some of the advantages of a survey are:
They provide for a quick, inexpensive, efficient and accurate means of assessing
information about a population.
An online survey will allow the research to reach the global audience desired for in the
unit of analysis.
Surveys are quite flexible and, when properly conducted, can be extremely valuable.
An online survey can further be customised based on answers processed.
However, surveys may present the following errors in survey research (Zikmund et al., 2012):
Random sampling error which is a statistical fluctuation that occurs because of chance
variation in the elements selected for a sample. These statistical problems are

22
unavoidable without very large sample (>400). This study aims to overcome random
sampling error with purposive sampling.
A systematic error resulting from some imperfect aspect of research design or from a
mistake in the execution of the research.
A sample bias existing when the results of a sample shows a persistent tendency to
deviate in one direction from the true value of the population parameter.
Non-response error which is the statistical difference between a survey that includes
only those who responded and a perfect survey that would also include those who
failed to respond.
Nonrespondents of people who are not contacted or who refuse to cooperate.
Refusals occurring when people are unwilling to participate.
A self-administered questionnaire was prepared and posted online to the unit of analysis. The
online survey allowed for a geographically dispersed sample to be reached so that interviews
were not required (Zikmund et al., 2012).
In the design of the questionnaire, the researcher aimed for it to be relevant to the research
objectives and was specific about data needs and have a clear rationale for each question.
Irrelevant questions were avoided as they could potentially make the survey unnecessarily
long and may have lost the focus of the respondent. (Zikmund et al., 2012) advised that
questionnaires should be simple, understandable, unbiased and unambiguous. The
researcher designed a questionnaire that facilitated recall and motivated respondents to
cooperate. There was also a cognisance of wording of questions and the sequence as this
could have influenced the accuracy of results. Fixed alternative questions were utilised as they
required less interviewer skill, took less time and was easier for the respondent to answer
(Zikmund et al., 2012). The answers to closed questions could be classified into standardised
groupings prior to the data collection which provided for comparability of answers, which
facilitated coding, tabulating and interpreting of data.
Questions used simple, conversational language, were specific to the research objectives and
avoided leading or loaded questions. Some demographic or questions at the beginning of the

23
questionnaire appeared at the beginning of the survey to ‘warm-up’ respondents and built their
confidence. Respondents’ were told what the questionnaire was about and why the questions
were required to be answered (Saunders & Lewis, 2012). The funnel technique (Zikmund et
al., 2012) was utilised which allowed the researcher to understand the respondent’s frame of
mind before more specific questions about the level and intensity of his/her opinions were
asked. The layout of the questionnaire was easy to use, flowed logically and had a clean look
that motivated the respondent to cooperate from start to finish. Radio buttons were utilised for
activating responses.
(Zikmund et al., 2012) defined an attitude as an enduring disposition to consistently respond
in a given manner to various aspects of the world, composed of affective, cognitive and
behavioural components. An attitude can be measured by making inferences on the way an
individual responds to multiple scale indicators. These phenomena cannot be seen and are
thus referred to as hypothetical constructs. From the techniques of measuring attitudes, this
research will utilise the rating technique which is a measurement task that requires
respondents to estimate the magnitude of a characteristic or quality that a brand, store, or
object possesses (Zikmund et al., 2012). (Saunders & Lewis, 2012) advised that rating is to
be utilised when the respondents’ opinion or belief is being sought, as was the case in this
research. The rating task involved the respondent marking a response on one or more attitude
or cognitive scales which resulted in a quantitative score.
According to (Zikmund et al., 2012) a Likert scale is a measure of attitudes designed to allow
respondents to rate how strongly they agree or disagree with carefully constructed statements,
ranging from very positive to very negative attitudes towards some object. The number of
alternatives was an odd number of five alternatives – strongly disagree, disagree, neutral,
agree and strongly agree. Scores or weights were assigned to each response. For purposes
of this research questionnaire scores of 1, 2, 3, 4 and 5 was assigned to each level of
agreement respectively. Thus a score of 5 will be assigned to the most favourable attitude
being strongly agree. The numerical scores were not be revealed and printed on the
questionnaire or shown on the computer screen. The questionnaire was be distributed using
an email via official ABB e-mail addresses with a hyperlink to the questionnaire. To this end,
a complete and up-to-date list of the sample’s email addresses was compiled.
(Saunders & Lewis, 2012) explained that case studies enable a detailed understanding of the
context within which the data are collected. A case study spanning different countries was
used to investigate how the implementation of strategic transfer pricing provided for a
competitive business advantage.

24
The research was original research with the sample population generating primary data since
there was no secondary data available to the researcher. As an ABB employee the researcher
had access to the sample population and data for the purposes of this research and was
authorised to obtain data for purposes of this research with an ABB Non-Disclosure
Agreement also signed.
(Zikmund et al., 2012) described a pilot study as a small-scale research project that collected
data from respondents similar to those that were used in the full study. This served as a guide
for the larger study or examine specific aspects of the research to see if the selected
procedures actually worked as intended. Pilot studies were critical in refining survey questions
and reduced the risk that the full study would be fatally flawed (Zikmund et al., 2012) as they
were useful in fine-tuning research objectives that were conducted as part of this research.
(Saunders & Lewis, 2012) highlighted the use of pilot testing and confirmed that the actual
respondents understood the meaning of the questions and were able to follow the instructions
on the questionnaire. A pilot testing was carried out of the interview and technique to check
that the questions were likely to be understood, were not leading and provided the researcher
with the data that was required.
4.6 Data Analysis Approach
(Zikmund et al., 2012) described data analysis as the application of reasoning to understand
data was gathered. The analysis involved determining consistent patterns and summarising
the relevant details from the research with the appropriate analytical technique determined by
the information requirements, the characteristics of the research design and the nature of the
data gathered (Zikmund et al., 2012).
Prior to the data being analysed, the data relevant to this study was extracted and consolidated
into a consistent and comparable data set for each sample. This study comprised of both
ranked categorical and discrete numerical data in support of the research hypotheses and
research aim.
Relevant statistical analyses was performed in order to answer the research questions and
included descriptive statistics as well as correlation analysis. A frequency distribution was run
as it was used in order to assess the distribution of inputs (Field, 2013). A Pearson chi-square
test was then run to test the likelihood that the distribution was due to chance (Field, 2013). A

25
chi-square test was also comparable with (Chan & Chow, 1997) research. (Zikmund et al.,
2012) terms it a ‘goodness of fit’ test, as it measures how well the observed distribution of data
fits with the distribution that is expected if the variables are independent. This test statistic
does not give any information about the strength of the relationship but only illustrates if there
is a relationship or not. For purposes of this study a p-value of below 0.05 was used as a
reference to indicate that there is a dependent relationship between the variables, whereas a
p-value above 0.05 represents the absence of a relationship. These statistical analyses
produced results that were interpreted to provide insight to the research hypotheses. Tables
and graphs were utilised in order to simplify and clarify the data. The researcher was cognisant
of a data processing error not occurring.
4.7 Reliability and Validity
Reliability was used as an indicator of a measure’s internal consistency according to (Zikmund
et al., 2012). The internal consistency of a measure would be reliable when different attempts
at measuring something converge on the same result. (Field, 2013) confirms that a
questionnaire should consistently reflect the construct that is being measured. The internal
consistency in this study was tested by the following method (Zikmund et al., 2012):
The co-efficient alpha or Cronbach’s alpha, α, which is the most commonly applied
estimate of a multiple-item scale’s reliability which represented the average of all
possible split-half reliabilities for a construct.
(Saunders & Lewis, 2012) cautioned that in order for the research to be reliable, it should
employ data collection methods and analysis procedures which produces consistent findings.
A test-retest was administered on some of the respondents administering the same scale or
measured again at two separate times in order to test for stability. This test-retest reliability
ensured the repeatability of a measure.
According to (Zikmund et al., 2012) validity is the accuracy of a measure or the extent to which
a score truthfully represented a concept. (Saunders & Lewis, 2012) simplified validity by
stating that validity is concerned whether the findings are really about what they appear to be
about. The researcher attempted to ensure face and content validity were maintained.

26
4.8 Confidentiality and Anonymity
Confidentiality was clearly stated at the beginning of the questionnaire and the respondents’
were guaranteed of their confidentiality. Only aggregated data was reported so that patterns
that emerge from the results could be established (Saunders & Lewis, 2012).
The organisation that the research was being conducted on was ABB and has been quantified
as a case study. However, the anonymity of the respondents’ answers was maintained with
reference only to the unit of analysis classifications. There was an ethical responsibility to
protect individual respondents’ right to anonymity which was maintained (Saunders & Lewis,
2012). The research objectives were written in a way that conclusions which may be harmful
to respondents’ were not possible. Making quantitative data anonymous proved to be less
problematic.
4.9 Research Limitations
The limitations of the proposed research methodology were:
A response bias that occurred when respondents to the survey either consciously
or unconsciously tending to answer questions with a certain slant that
misrepresents the truth (Zikmund et al., 2012). This presented itself as deliberate
falsification of answers or an unconscious misrepresentation and biases in the form
of acquiescence bias, extremity bias, interviewer bias and social desirability bias.
As this is a global study, the researcher was aware that different cultures may have
different norms and attitudes towards a survey.
(Saunders & Lewis, 2012) cautioned that case studies, especially those chosen
from a single company, have the limitation of being dissimilar to other organisations
and restrict the option of generalising findings.

27
5. RESULTS
The research results, statistical analyses and interpretation are summarised and presented in
the chapter. In addition, the questionnaire response rates, demographic analysis and the
corresponding results are reviewed.
5.1 Response Rates
The questionnaire was sent out to 112 recipients of the sample population, of which 34
responded to resulting in a response rate of 30%. Some responses to answers were left
incomplete, which were then disregarded.
5.2 Demographics
The following figure is the split of ABB countries of respondents that had completed the
questionnaire.
Figure 1: Representation of Process Automation country respondents to questionnaire

28
Table 1: Frequency table of Process Automation respondents to questionnaire
Country
Frequency Percent Valid Percent
Cumulative
Percent
Valid Australia 1 2.9 3.0 3.0
China 2 5.9 6.1 9.1
Dubai 1 2.9 3.0 12.1
Egypt 3 8.8 9.1 21.2
India 4 11.8 12.1 33.3
Indonesia 1 2.9 3.0 36.4
Italy 2 5.9 6.1 42.4
Singapore 7 20.6 21.2 63.6
South Africa 8 23.5 24.2 87.9
Sweden 2 5.9 6.1 93.9
Switzerland 1 2.9 3.0 97.0
United Kingdom 1 2.9 3.0 100.0
Total 33 97.1 100.0
Missing 0 1 2.9
Total 34 100.0
South Africa had the highest percentage of respondents. Singapore is the regional head office
of the Process Automation division and also had the second highest percentage. There is no
representation from the Americas region which comprises a substantial amount of Process
Automation division revenue.
The job roles of the respondents are depicted in Figure 2.

29
Figure 2: Job roles of respondents
The highest percentage of respondents were in the role of the Local Business Manager
(52.94%) which could be an indication of the interest on the impact of transfer pricing on the
profit and loss statements in the business and the greater number of these positions in the
organisation.
The frequency table of the length in the role that respondents have been in is shown in Table
2. The highest frequencies occurred in respondents having tenures of 1 – 3 and 4 – 6 years.
Table 2: Length in role of respondents
Length in Role
Frequency Percent Valid Percent
Cumulative
Percent
Valid <1 year 4 11.8 11.8 11.8
>10 years 3 8.8 8.8 20.6
1 - 3 years 13 38.2 38.2 58.8
4 - 6 years 10 29.4 29.4 88.2
7 - 10 years 4 11.8 11.8 100.0
Total 34 100.0 100.0

30
The total number of working experience of the respondents is shown in Figure 3 which depicts
the number of years is typically takes to reach the positions in ABB of the sample population.
Figure 3: Number of years of working experience of respondents
The age group of respondents is depicted in Figure 4 with the higher percentiles in 41 – 50
and 51 – 65 years which is indicative of the age group of the respondents. This correlates well
with the number of working years it has typically taken to reach these positions at ABB.
Figure 4: Age group of respondents

31
5.3 Transfer Pricing as a competitive business strategy
This research hypothesis objective aimed to understand if transfer pricing was initialised as a
competitive business strategy in the organisation. The questions ranged from the opinion of
whether transfer pricing was considered to be a part of ABB’s business strategy, whether it
was a business procedure and whether the implementation of transfer pricing was conducted
as part of business strategy.
Descriptive statistics were run to show the frequency of responses received. Figure 5
highlights that majority of the respondents (a combination of 40.63% and 28.13%) agreed that
transfer pricing is considered to be a part of the business strategy.
Figure 5: Transfer pricing is considered to be part of the business strategy
A Pearson chi-square analysis was run for this variable which aimed to establish whether
levels or perceptions along one variable depend on levels on the variable. A p-value below
0.05 indicates that there is a dependent relationship between the two variables, whereas a p-
value above 0.05 represents the absence of a relationship between the two variables.

32
Table 3: Chi-square test results of transfer pricing being a part of business strategy
Value df
Asymptotic Significance
(2-sided)
Pearson Chi-Square 65.850a 44 .018
Likelihood Ratio 41.678 44 .572
N of Valid Cases 31
a. 60 cells (100.0%) have expected count less than 5. The minimum expected count is .03.
Figure 6: Transfer pricing is considered as part of the business strategy
The result was statistically significant, 𝑥2 (44) = 65.85, p = 0.018, indicating that transfer pricing considered to be part of the business strategy is dependent on the country of the participants. In other words, there are differences in perceptions based on the country the participants are from. In particular, the South African participants tended to report greater levels of agreement with the item as shown in
Figure 6 above, indicating that these respondents are more likely to agree with the question.

33
This was then further tested to ascertain that if transfer pricing is part of the business strategy,
then does it fall into the implementation stage of the strategy. As shown in Figure 7, 50% of
the respondents agreed that it fell into the implementation stage of business strategy.
Figure 7: Strategy stage of transfer pricing
Table 4: Chi-square test results of stage of business strategy transfer pricing falls into
Value df Asymptotic Significance (2-sided)
Pearson Chi-Square 52.591a 33 .017
Likelihood Ratio 30.909 33 .572
N of Valid Cases 31
a. 48 cells (100.0%) have expected count less than 5. The minimum expected count is .03.

34
Figure 8: Transfer pricing falls into the implementation stage of strategy
The result was statistically insignificant, 𝑥2 (33) = 52.591, p = 0.017, indicating that transfer
pricing falling into the implementation stage of the business strategy is not dependent on the
country of the participants, as shown in Figure 8.
When respondents were questioned whether their view of whether transfer pricing is a
procedure of the way business is conducted, 71.88% of respondents agreed as shown in
Figure 9. None of the respondents strongly disagreed that transfer pricing is not a procedure
in the way business is conducted.

35
Figure 9: Transfer pricing is a procedure of the way business is conducted
The chi-square test yielded the following results:
Table 5: Chi-square test results of transfer pricing being a business procedure
Value df Asymptotic Significance (2-sided)
Pearson Chi-Square 32.629a 33 .485
Likelihood Ratio 25.360 33 .827
N of Valid Cases 31
a. 47 cells (97.9%) have expected count less than 5. The minimum expected count is
.03.
The result was statistically significant, 𝑥2 (33) = 32.629, p = 0.485, indicating that whether
transfer pricing is a procedure of the way business is conducted is dependent on the country
of the participants.
5.4 The Impact of Transfer Pricing on business strategy
This research theme aimed to investigate the impact that transfer pricing had on the business
strategy. The questions ranged from the uniqueness of the global environment to the
organisation, whether ABB uses transfer pricing as an indication that they are a global
multinational firm and whether the objectives of implementing transfer pricing have been
achieved.

36
There was no strong agreement that ABB has a unique global environment for transfer pricing
as shown in Figure 10, the largest percentage of 36.67% was neutral.
Figure 10: ABB has a unique global environment for transfer pricing
The chi-square test yielded the following results:
Table 6: Chi-square test results of ABB having a unique global environment for transfer pricing
Value df Asymptotic Significance (2-sided)
Pearson Chi-Square 44.165a 44 .465
Likelihood Ratio 43.706 44 .484
N of Valid Cases 29
a. 60 cells (100.0%) have expected count less than 5. The minimum expected count
is .03.
The result was statistically significant, 𝑥2 (44) = 44.165, p = 0.465, indicating that whether ABB
has a unique global environment for transfer pricing is dependent on the country of the
participants.
This was further delved into whether ABB has a unique environment for transfer pricing. A
higher percentage was neutral, 43.33%, and smaller percentages agreed and strongly agreed
as shown in Figure 11.

37
Figure 11: ABB has a unique environment for transfer pricing on a country level
The chi-square test yielded the following results:
Table 7: Chi-square test results of ABB (country level) has a unique environment for transfer pricing
Value df Asymptotic Significance (2-sided)
Pearson Chi-Square 40.765a 33 .166
Likelihood Ratio 41.171 33 .155
N of Valid Cases 29
a. 48 cells (100.0%) have expected count less than 5. The minimum expected
count is .10.
The result was statistically significant, 𝑥2 (33) = 40.765, p = 0.166, indicating that whether an
ABB entity having a unique environment for transfer pricing is dependent on the country of the
participants.
The question was posed in order to ascertain whether transfer pricing was utilised in order to
reaffirm that ABB is a global multinational firm. Whilst no respondents strongly disagreed, a
large proportion were neutral (36.67%) or disagreed (13.33%) as shown in Figure 12.

38
Figure 12: Transfer pricing is used to reaffirm that ABB is a global multinational firm
The chi-square test yielded the following results:
Table 7: Chi-square test results of transfer pricing being used to reaffirm that ABB is a global multinational
Value df Asymptotic Significance (2-sided)
Pearson Chi-Square 33.323a 33 .452
Likelihood Ratio 32.442 33 .495
N of Valid Cases 29
a. 48 cells (100.0%) have expected count less than 5. The minimum expected
count is .07.
The result was statistically significant, 𝑥2 (33) = 33.323, p = 0.452, indicating that ABB utilising
transfer pricing as a way to reaffirm its position as a global multinational is dependent on the
country of the participants.
Respondents were largely neutral as to whether the objectives of why transfer pricing was
implemented has been achieved, as shown in Figure 13.

39
Figure 13: The objective of implementing transfer pricing has been acheived
The chi-square test yielded the following results:
Table 8: Chi-square test results of the objectives of why transfer pricing was implemented have been achieved
Value df Asymptotic Significance (2-sided)
Pearson Chi-Square 25.903a 44 .986
Likelihood Ratio 26.153 44 .985
N of Valid Cases 29
a. 60 cells (100.0%) have expected count less than 5. The minimum expected
count is .03.
The result was statistically significant, 𝑥2 (44) = 25.903, p = 0.986, indicating that whether
transfer pricing is a procedure of the way business is conducted is dependent on the country
of the participants.
5.5 The Reasons for Implementing Transfer Pricing
This research theme aimed to investigate the reasons why transfer pricing was implemented
in the organisation. The questions ranged from whether transfer pricing was implemented as
an accounting technique or a strategic business tool, whether the utilisation of transfer pricing
made business results easier to be reported on and whether the financial benefit of transfer
pricing could be quantified.

40
When respondents were questioned on whether transfer pricing was implemented as an
accounting technique, the responses received were scattered between disagree, neutral and
agree as shown in Figure 14.
Figure 14: Reasons for implementing transfer pricing
The chi-square test yielded the following results:
Table 9: Chi-square test results of transfer pricing being implemented as an accounting technique
Value df Asymptotic Significance (2-sided)
Pearson Chi-Square 30.625a 44 .937
Likelihood Ratio 36.062 44 .797
N of Valid Cases 30
a. 60 cells (100.0%) have expected count less than 5. The minimum expected
count is .03.
The result was statistically significant, 𝑥2 (44) = 30.625, p = 0.937, indicating that implementing
transfer pricing as an accounting technique is dependent on the country of the participants.
The following question was posed to ascertain whether respondents were of the opinion that
the utilisation of transfer pricing made business results easier to be reported on. Figure 15
shows that the largest component (38.71%) was in agreement.

41
Figure 15: Utilisation of transfer pricing makes business results easier to be reported
The chi-square test yielded the following results:
Table 10: Chi-square test results of the utilisation of transfer pricing makes business results easier to be reported
Value df Asymptotic Significance (2-sided)
Pearson Chi-Square 31.250a 44 .926
Likelihood Ratio 29.609 44 .953
N of Valid Cases 30
a. 60 cells (100.0%) have expected count less than 5. The minimum expected
count is .03.
The result was statistically significant, 𝑥2 (44) = 31.250, p = 0.926, indicating that the utilisation
of transfer pricing to make business easier to be reported on is dependent on the country of
the participants.
Respondents were questioned whether their view was if the strategic benefit of the
implementation of transfer pricing could be quantified. Majority of the respondents were in
agreement (48.39%).

42
Figure 16: Benefits of transfer pricing can be quantified
The chi-square test yielded the following results:
Table 11: Chi-square test results of the benefits of transfer pricing being quantified
Value df Asymptotic Significance (2-sided)
Pearson Chi-Square 40.506a 44 .622
Likelihood Ratio 35.002 44 .832
N of Valid Cases 30
a. 60 cells (100.0%) have expected count less than 5. The minimum expected
count is .03.
The result was statistically significant, 𝑥2 (44) = 40.506, p = 0.622, indicating that whether the
benefits of transfer pricing being quantified is dependent on the country of the participants.
The view on whether respondents were of the opinion that transfer pricing created value for
the organisation as a strategic tool was in agreement (54.84%), as shown in Figure 17.

43
Figure 17: Value created by transfer pricing for the organisation
The chi-square test yielded the following results:
Table 12: Chi-square test results of the value created by transfer pricing for the organisation
Value df Asymptotic Significance (2-sided)
Pearson Chi-Square 39.212a 44 .677
Likelihood Ratio 31.640 44 .918
N of Valid Cases 30
a. 60 cells (100.0%) have expected count less than 5. The minimum expected
count is .03.
The result was statistically significant, 𝑥2 (44) = 39.212, p = 0.677, indicating that the value
that is created by transfer pricing is dependent on the country of the participants.
5.6 The Evaluation of Transfer Pricing as a tool
This research theme delved more into the evaluation of transfer pricing as a strategic
management tool. The questions ranged from the view of transfer pricing as a management
tool, the management incentives for the utilisation of transfer pricing, whether the utilisation of
transfer pricing made business easier to report on and whether the costing system was viewed
as a strategic variable.

44
When respondents were questioned on their view of whether transfer pricing was seen as
more of a management tool instead of a component of strategy, there were no respondents
that strongly disagreed, there was still a majority that were neutral and disagreed (60.0% in
total) as shown in Figure 18.
Figure 18: View of transfer pricing as a strategic management tool
The chi-square test yielded the following results:
Table 13: Chi-square test results of transfer pricing seen as more of a management tool
Value df Asymptotic Significance (2-sided)
Pearson Chi-Square 25.306a 33 .829
Likelihood Ratio 27.777 33 .725
N of Valid Cases 29
a. 48 cells (100.0%) have expected count less than 5. The minimum expected
count is .03.
The result was statistically significant, 𝑥2 (33) = 25.306, p = 0.829, indicating that the view that
transfer pricing being viewed as a management tool as opposed to a component of strategy
is dependent on the country of the participants.

45
The other reasons for utilising transfer pricing other than a component of business strategy
was questioned. Results ranged amongst all the alternatives, as shown in Figure 19.
Figure 19: Incentive of utilising tansfer pricing
The chi-square test yielded the following results:
Table 14: Chi-square test results of the management incentives for utilising transfer pricing
Value df Asymptotic Significance (2-sided)
Pearson Chi-Square 48.802a 44 .286
Likelihood Ratio 35.113 44 .828
N of Valid Cases 28
a. 60 cells (100.0%) have expected count less than 5. The minimum expected
count is .04.
The result was statistically significant, 𝑥2 (44) = 48.802, p = 0.286, indicating that the
management incentives as opposed to the business strategy of utilising transfer pricing is
dependent on the country of the participants.
Figure 20 shows that most respondents were in agreement that transfer pricing makes
business easier to be conducted (44.83%).

46
Figure 20: Utilisation of transfer pricing makes business easier to be conducted
The chi-square test yielded the following results:
Table 15: Chi-square test results of the utilisation of transfer pricing making business easier to be conducted
Value df Asymptotic Significance (2-sided)
Pearson Chi-Square 49.858a 33 .030
Likelihood Ratio 39.010 33 .218
N of Valid Cases 28
a. 48 cells (100.0%) have expected count less than 5. The minimum expected count
is .07.
The result was statistically insignificant, 𝑥2 (33) = 49.858, p = 0.030, indicating that the
utilisation of transfer pricing to make business easier to be conducted is not dependent on the
job role of the participants, as shown in Figure 21.
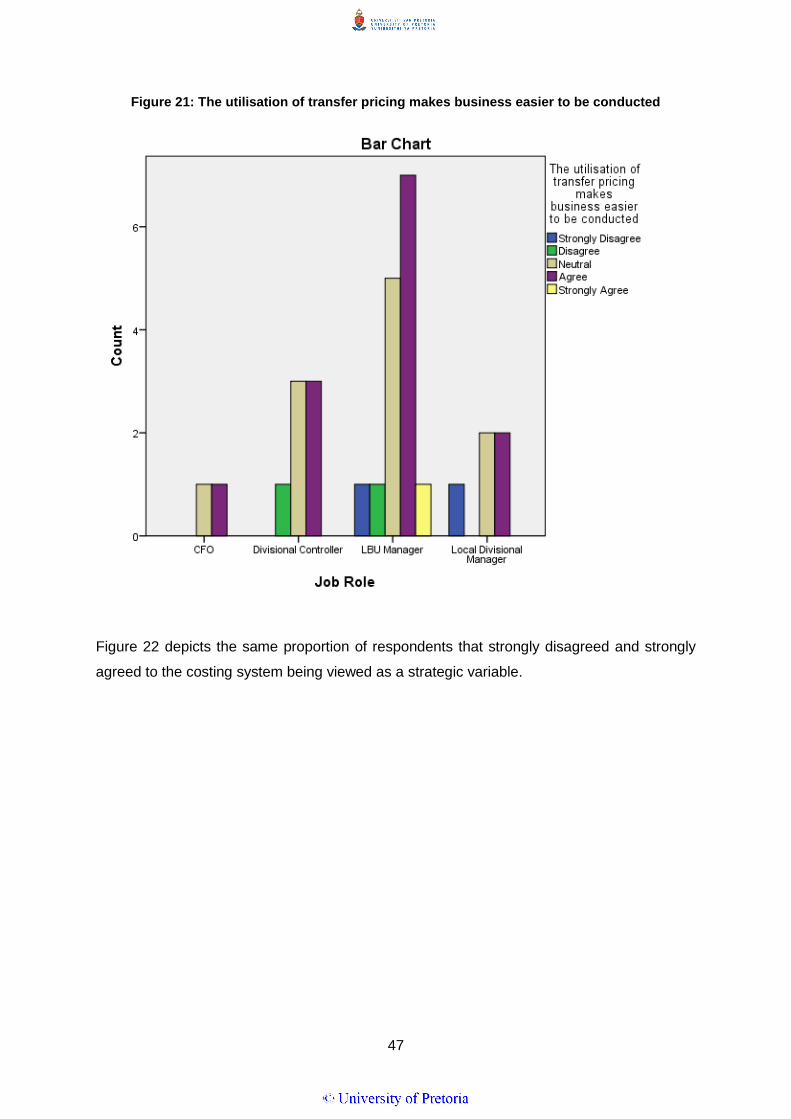
47
Figure 21: The utilisation of transfer pricing makes business easier to be conducted
Figure 22 depicts the same proportion of respondents that strongly disagreed and strongly
agreed to the costing system being viewed as a strategic variable.

48
Figure 22: Costing system viewed as a strategic variable
The chi-square test yielded the following results:
Table 16: Chi-square test results of the costing system being viewed as a strategic variable
Value df Asymptotic Significance (2-sided)
Pearson Chi-Square 48.921a 33 .037
Likelihood Ratio 29.441 33 .645
N of Valid Cases 28
a. 48 cells (100.0%) have expected count less than 5. The minimum expected
count is .04.
The result was statistically insignificant, 𝑥2 (33) = 48.921, p = 0.037, indicating that whether
the costing system is viewed as a strategic variable is not dependent on the country of the
participants, as shown in .
5.7 The Control System of Transfer Pricing
This research theme aimed to investigate the control system of transfer pricing in the
organisation. The questions ranged from the evaluation of the effectiveness of transfer pricing
and the performance, whether transfer prices are exploited among related entities and whether
set by a centralised control system.

49
As shown in Figure 23, majority of respondents agreed that transfer prices are set effectively
(48.28%).
Figure 23: Effectiveness of evaluating transfer pricing
The chi-square test yielded the following results:
Table 17: Chi-square test results of the evaluation of transfer prices being done effectively
Value df Asymptotic Significance (2-sided)
Pearson Chi-Square 17.836a 12 .121
Likelihood Ratio 17.160 12 .144
N of Valid Cases 29
a. 19 cells (95.0%) have expected count less than 5. The minimum expected
count is .10.
The result was statistically significant, 𝑥2 (12) = 17.836, p = 0.121, indicating that whether
transfer prices are effectively evaluated is dependent on the country of the participants.
Whilst no respondents had strongly agreed that the performance of transfer prices are
managed effectively, the combination that had disagreed and strongly disagreed (34.48%) do
not believe so as shown in Figure 24.

50
Figure 24: Management of the performance of transfer pricing
The chi-square test yielded the following results:
Table 18: Chi-square test results of the performance of transfer pricing
Value df Asymptotic Significance (2-sided)
Pearson Chi-Square 9.423a 12 .666
Likelihood Ratio 11.620 12 .477
N of Valid Cases 29
a. 19 cells (95.0%) have expected count less than 5. The minimum expected count
is .10.
The result was statistically significant, 𝑥2 (12) = 9.423, p = 0.666, indicating that whether the
performance of transfer pricing is managed effectively is dependent on the country of the
participants.
Most of the respondents were neutral or in agreement that transfer pricing is being exploited
among the related entities of ABB as shown in Figure 25.

51
Figure 25: Exploitation of transfer pricing among related entities of ABB
The chi-square test yielded the following results:
Table 19: Chi-square test results of the exploitation of transfer prices amongst related entities of ABB
Value df Asymptotic Significance (2-sided)
Pearson Chi-Square 15.247a 12 .228
Likelihood Ratio 14.064 12 .297
N of Valid Cases 29
a. 18 cells (90.0%) have expected count less than 5. The minimum expected
count is .03.
The result was statistically significant, 𝑥2 (12) = 15.247, p = 0.228, indicating that whether
transfer prices are exploited amongst related entities of ABB is dependent on the country of
the participants.
A combination of respondents strongly disagreed and disagreed (37.93%) that transfer prices
are set by a centralised control system as shown in Figure 26.

52
Figure 26: Transfer pricing set by a centralised control system
The chi-square test yielded the following results:
Table 20: Chi-square test results of transfer prices being set by a centralised control system
Value df Asymptotic Significance (2-sided)
Pearson Chi-Square 15.246a 12 .228
Likelihood Ratio 17.244 12 .141
N of Valid Cases 29
a. 18 cells (90.0%) have expected count less than 5. The minimum expected
count is .07.
The result was statistically significant, 𝑥2 (12) = 15.246, p = 0.228, indicating that whether
transfer pricing is set by a centralised control system is dependent on the country of the
participants.
The majority of respondents are in agreement (55.17%) that transfer prices cannot be
determined on a decentralised level.

53
Figure 27: Centralisation level of transfer prices
The chi-square test yielded the following results:
Table 21: Chi-square test results of transfer prices cannot be determined on a decentralised level
Value df Asymptotic Significance (2-sided)
Pearson Chi-Square 16.816a 16 .398
Likelihood Ratio 14.525 16 .560
N of Valid Cases 29
a. 24 cells (96.0%) have expected count less than 5. The minimum expected
count is .03.
The result was statistically significant, 𝑥2 (16) = 16.816, p = 0.398, indicating that whether the
ability for transfer pricing to not be set on a decentralised level is dependent on the country of
the participants.
5.8 Correlations between Research Themes
The research themes were added together, separately for each theme. This was done by
adding the three items of research theme 1 to obtain a total score. Each theme was then
correlated with each other to determine whether the themes related to one another or not.
The descriptive statistics are presented in Table 22.

54
Table 22: Descriptive statistics of scores between research themes
Mean Std. Deviation N
Level_of_Initiation 11.5000 2.07908 32
Impact_of_Transfer 13.0000 2.93610 30
Reasons_for_Implementin
g 12.9677 3.25048 31
Evaluation_of_Transfer 12.6207 2.47002 29
Control_System 15.4483 3.39733 29
N Skewness Kurtosis
Statistic Statistic Std. Error Statistic Std. Error
Level_of_Initiation 32 -.241 .414 .217 .809
Impact_of_Transfer 30 .359 .427 1.456 .833
Reasons_for_Implement
ing 31 -.206 .421 -.199 .821
Evaluation_of_Transfer 29 -.155 .434 -.018 .845
Control_System 29 -.615 .434 .584 .845
Valid N (listwise) 28
The correlations between the research themes are presented in Table 23.

55
Table 23: Correlations between research themes
Level_of_Initiation
Impact_of_Transfer
Reasons_for_Implementing
Evaluation_of_Transfer
Control_System
Level_of_Initiation Pearson Correlation
1 0.252 0.301 0.007 0.098
Sig. (2-tailed) 0.179 0.1 0.973 0.614
N 32 30 31 29 29
Impact_of_Transfer
Pearson Correlation
0.252 1 .651** .410* 0.315
Sig. (2-tailed) 0.179 0 0.03 0.102
N 30 30 30 28 28
Reasons_for_Implementing
Pearson Correlation
0.301 .651** 1 .495** .410*
Sig. (2-tailed) 0.1 0 0.006 0.027
N 31 30 31 29 29
Evaluation_of_Transfer
Pearson Correlation
0.007 .410* .495** 1 0.272
Sig. (2-tailed) 0.973 0.03 0.006 0.153
N 29 28 29 29 29
Control_System Pearson Correlation
0.098 0.315 .410* 0.272 1
Sig. (2-tailed) 0.614 0.102 0.027 0.153
N 29 28 29 29 29
**. Correlation is significant at the 0.01 level (2-tailed).
*. Correlation is significant at the 0.05 level (2-tailed).
The correlation between Theme One and Theme Two was not statistically significant, r = .252,
p = 0.179, indicating there is not a significant relationship between the two variables. On the
other hand, Theme Two correlated positively and significantly with Theme Three, r = .651, p
< .001. This indicates that higher scores along Theme Two are associated with higher scores
on Theme Three.
5.9 Data Reliability and Validity
Cronbach’s α was computed for the non-demographic items in the questionnaire of which
there were 20 in total. The finding indicated excellent internal consistency and reliability for
the questionnaire with α = 0.838. Thus the section possessed strong reliability and the
appropriate use of each of the items included in the questionnaire.

56
6. DISCUSSION OF RESULTS
This chapter discusses the results shown in Chapter 5 in terms of the research hypotheses
and the literature review. The sample and its impact or implications on the results are
discussed first. Insights are provided into the research hypotheses, with the relevant evidence
that the research problem has been addressed.
6.1 Response Rates and Omissions
The questionnaire was sent out to 112 recipients of the sample population. The questionnaire
was run for a period of one month with regular reminders sent out for completion. There were
34 responses received, some of which were partially completed. Motivation to complete the
questionnaire was low, with many respondents questioning the purpose of the questionnaire
and the value to the organisation yet the researcher had obtained prior permission which was
attached the questionnaire with a signed company non-disclosure.
Nonetheless, the overall response rates were 30%, which proves to be comparable and much
higher than the (Cravens, 1997) study. Therefore the results and interpretation thereof can be
generalised to the entire population.
6.2 Demographics
Care was taken in the questionnaire design so as to not include too many questions that may
cause respondent fatigue. There were five demographic questions posed as ‘warming up’ the
respondents and to ease them into the questionnaire. The aim was also to create a distinction
between countries and levels in the organisation which would later facilitate the chi-square
tests. Each research theme had a maximum of four questions each with a total of twenty
questions to be answered.
The researcher is based in South Africa and the number of respondents were the highest for
this country (24.2%) as shown in Figure 1. This could be attributed to the sample size being
familiar with the researcher and thus more receptive to responding. The sample bias
experienced is not alarming due to South Africa likely engaging in transfer pricing as there is
no local production and has to make use of the organisations feeder factory manufacturing
operations (Cravens, 1997). The second highest country response rate was Singapore at
21.2%. Singapore is the regional hub for the Process Automation division of which the

57
researcher reports into and has representation. This second highest response rate could be
due to the research providing regular updates on South Africa feeding into the region hub and
thus reciprocated a good questionnaire response. The third highest response rate was from
India, 12.1%, and this could once again be due to the researcher having strategic business
relationships with this country in the form of outsourced services.
The European regional hub was represented with responses received from Italy, Sweden,
Switzerland and the United Kingdom. Noticeably, there is no representation from the Americas
regional hub due to the researcher having limited interaction with this hub. Cognisance needs
to be drawn to this region comprising a substantial amount of Process Automation revenue.
Figure 2 shows the job roles of the respondents. This is in line with the structure of the
organisation, as there are much lesser Chief Financial Officers (CFO’s) than Local Business
Unit (LBU) Manager. Thus the ratio of respondents’ job roles lies in line with the organisational
structure. The topic being researched fell in line with the sample population and was reaffirmed
by their ability to answer the questions posed. Besides transfer pricing generally being
classified as an accounting or financial technique, there was an encouragingly strong interest
shown in the topic from Local Divisional managers (17.6%) as transfer pricing is an area that
has a direct impact on the profit and loss of the Process Automation division.
The length in the role that respondents were in was questioned in order to test the depth of
responses received. Table 2 shows that only 11.8% of the respondents had been in their
respective roles for less than one year. This needs to be tied in with Figure 3 which shows the
total number of working years the respondents possesses. A staggering 64.71% of the
respondents have more than twenty years of working experience. This can be viewed as an
indication of the number of working years required to reach this level of seniority of the role of
the sample population. Figure 4 shows the age group of the respondents with the higher
percentiles in 41 – 50 and 51 – 65 years of 44.12% and 38.24% respectively. This correlates
well with the number of working years it has typically taken to reach roles of this seniority
levels.
6.3 Transfer pricing as a competitive business strategy
This research hypothesis objective aimed to understand if transfer pricing was initialised as a
competitive business strategy in the organisation.

58
The first question in this research theme was to ascertain if transfer pricing was considered
as part of business strategy. This question was posed in the view to gauge whether the
respondents were aligned to the concept of transfer pricing being a component of the business
strategy. Figure 5 confirmed this with the majority of the respondents (a combination of 40.63%
and 28.13%) agreed that transfer pricing is considered to be a part of the business strategy.
This was then further delved into with a chi-square test to establish whether this levels or
perceptions along this question is dependent on the country level. The chi-square test results
shown in Table 3 was statically significant which indicates that it is dependent on the country
of the participants. Thus the alternate hypothesis has to be accepted. (Alles & Datar, 1998)
confirms this with the view that there is a strategic objective to the utilisation of transfer pricing.
South African respondents tended to report greater levels of agreement with the item as shown
in Figure 6 indicating that these respondents are more likely to agree with the question.
Based on the agreement that transfer pricing is considered to be a part of the business
strategy, the stage of strategy that it fell into was queried. Respondents largely agreed (50%)
that transfer pricing falls into the implementation stage of the business strategy as shown in
Figure 7. The chi-square test results shown in Table 4 reflects a p-value of 0.017 which is less
than 0.05 which makes the result statistically insignificant. This indicates that transfer pricing
falling into the implementation stage of the business strategy is not dependent on the country
of the participants as shown in Figure 8. This can be viewed in a positive light by the
organisation as it is an indication that the strategic objective of transfer has been achieved
and is irrelevant of the country of the multinational. There is clear alignment with the
respondents that transfer pricing is part of the essential strategy of the organisation (Cravens,
1997). It is also an indication of the ability of the multinational to cascade the business strategy
downwards to ensure implementation of the strategy being achieved.
Most of the respondents were in agreement (71.88%) that transfer pricing is a procedure of
the way business is conducted in the organisation as shown in Figure 9. None of the
respondents had strongly disagreed. (Eccles, 1985; Spicer, 1988) are in agreement that
transfer pricing is not part of a business procedure but rather a component of the business
strategy. The findings in this research positively show that transfer pricing in a multinational
like ABB is widely accepted business practice. The chi-square test results shown in Table 5
was statistically significant which indicates that whether transfer pricing is a procedure of the
way business is conducted is dependent on the country of the participants.

59
6.4 Conclusion of the results for Research Hypothesis 1
The findings of this research hypothesis show that transfer pricing has a component of being
initialised by the organisation as a competitive business strategy. This ties into (Eccles, 1985)
that highlighted the importance of transfer pricing as nearly 80% of Fortune 1000 have to
choose a transfer pricing strategy and concurs with (Cravens, 1997) that highlighted that the
tax considerations is only one of the objectives why an international transfer pricing strategy
is employed by an multinational.
Thus the alternative hypothesis of transfer pricing being initialised as a competitive business
strategy is accepted.
6.5 The Impact of Transfer Pricing on business strategy
This research hypothesis aimed to investigate how the impact of transfer pricing was
determined to be a part of the business strategy.
The first question in this research theme was to ascertain whether respondents were of the
view that ABB has a unique global environment for transfer pricing. Based on Figure 10, there
seems to be no strong agreement that ABB does have a unique global environment for transfer
pricing. From the frequency distribution the largest percentage of responses was 36.67%
being neutral. This was then further analysed using a chi-square test with the aim of
establishing whether this perception was dependent on a country level. The chi-square test
results shown in Table 6 was statically significant which indicates that it is dependent on the
country of the participants. This can be attributed to some countries not having local production
facilities and reliant on the organisations feeder factory manufacturing operations (Cravens,
1997).
This was then expanded to test the view based on whether on a country level there exists a
unique environment for transfer pricing. Once again the neutral frequency distribution came
up the highest, but this time at 43.33% being higher than the 36.67% for the previous question.
The chi-square test results shown in Table 7 was statistically significant which indicates that
the uniqueness of the country level environment is dependent on the country that business is
conducted in.
60
The next question posed was to ascertain whether transfer pricing was utilised in order to
reaffirm that ABB is a global multinational firm. There were no respondents that strongly
disagreed. However the largest proportions were neural (36.67%) and with 40.00% agreeing.
The chi-square test results shown in Table 7 yielded a p-value of 0.452 which makes it
statistically significant and is an indication that whether transfer pricing is utilised to reaffirm
that ABB is a global multinational is dependent on the country being evaluated. Transfer
pricing may however also be utilised solely with the intention of portraying the multinational
image (Cravens, 1997).
The final question in this research theme probed whether the objective of implementing
transfer pricing was achieved. Based on the frequency distribution shown in Figure 13 majority
of the respondents were neutral (53.33%). The chi-square test result yielded a p-value of
0.986, indicating that whether transfer pricing is a procedure of the way business is conducted
is dependent on the country of the participants.
(Schjelderup & Weichenrieder, 1999) findings have confirmed that if arm’s length pricing is
used as an approach to regulate profit as opposed to regulate transfer pricing then the overall
effect will be a reduction in international trade.
6.6 Conclusion of the results for Research Hypothesis 2
The responses received to this research theme do not largely concur with (Cravens, 1997) in
that transfer pricing is viewed as being critical to the overall success of the multinational
globally, and thus does feed into the strategy. (Alles & Datar, 1998) have also shown that an
organisation may choose to cross-subsidise its products as an attempt to increase their overall
profitability, this is certainly the case with the Process Automation division at ABB.
Interestingly (Chan & Chow, 1997) found that research in the area of transfer pricing for
developing countries are scarce. Most of the respondents from developing countries have
found similarities in terms of complying to transfer pricing being mandated by the more
developed countries with a larger power base and this was shown in the chi-square test
results.
The opposite alternative (null) hypothesis (H0) that there is no relationship that transfer pricing
was determined as part of business strategy is accepted.

61
6.7 The Reasons for Implementing Transfer Pricing
At this point of the research it has been confirmed that transfer pricing does have a strategic
component associated to it at ABB. However the impact of transfer pricing on business
strategy cannot be.
This research hypothesis objective was to differentiate whether the reason for international
transfer pricing was primarily tax-driven or business strategy-driven.
The first question in this research theme was to understand if transfer pricing was implemented
for tax purposes, foreign exchange and cash controls, i.e. an accounting technique. The
responses received are shown in Figure 14 are were found to be scattered between disagree,
neutral and agree. The chi-square test results shown in Table 9 yielded a p-value of 0.937
which was statistically significant. This indicates that implementing transfer pricing as an
accounting technique is dependent on the country of the participants. In terms of the context
of this research it is positive as it shows that the primary reason of implementing transfer
pricing may not be tax-driven. The findings from this research are in agreement with (Eccles,
1985) that emphasised that transfer pricing forms part of the overall strategy and should not
be considered in separation and classified as an accounting technique. It was interesting that
the singular focus of complying with tax laws was not the focus of transfer pricing (Eccles,
1985) and is viewed as an active management strategy. (Chan & Chow, 1997) have provided
empirical evidence that manipulation of the tax rate is not the driving factor to implement
transfer pricing. (Clausing, 2000) however argues that tax incentives largely influence trade
between related entities of an organisation and found a correlation between organisations’
trade balances and country’s tax rates. (Nielsen et al., 2003) findings argue that manipulating
the transfer pricing for tax purposes can also achieve the organisation’s strategic intent.
The next question was posed to ascertain whether respondents were of the opinion that the
utilisation of transfer pricing made business results easier to be reported on. Figure 15 shows
that the largest component (38.71%) was in agreement. The chi-square test results yielded a
p-value of 0.926 for a statistically significant result indicating that the utilisation of transfer
pricing to make business results easier to report on is dependent on the country that the
business operates in.

62
Respondents were questioned whether their view was if the strategic benefit of the
implementation of transfer pricing could be quantified. Majority of the respondents were in
agreement (48.39%) as shown in Figure 16. This result can be viewed positively for the
organisation in that respondents are able to enumerate the benefit of transfer pricing. The chi-
square test results showed a p-value of 0.622 making it statistically significant indicating that
whether the benefits of transfer pricing being quantified is dependent on the country of the
participants. (Cravens, 1997) attributes this to some countries not having local production
facilities and reliant on the organisations feeder factory manufacturing operations thus
affecting the view of the benefits of transfer pricing. In trying to assess whether the benefits of
transfer can be quantified, the findings of this research is in agreement with (Cravens, 1997)
view that multinationals make use of transfer pricing as it plays and important role in
persuading competitors of their profitability as an organisation, this has certainly shown so
from respondents where the profit and loss of the business unit is a serious concern to ensure
profitability and sustainability.
The final question in this research theme questioned whether the view on whether
respondents were of the opinion that transfer pricing created value for the organisation as a
strategic tool. Figure 17 shows that majority of the respondents were in agreement (54.84%).
A statistically significant chi-square test result was achieved with a p-value of 0.77 indicating
that the value created by transfer pricing is dependent on the country of the participants.
6.8 Conclusion to the results for Research Hypothesis 3
In responding to the research hypothesis for this research theme, there is no tangible finding
that can conclude that the reason for implementing transfer pricing is primarily tax-driven or
strategy-driven. In the absence of this evidence, the opposite alternative (null) hypothesis
being that there is no relationship that the primary reason for implementing transfer pricing is
business strategy-driven will have to be accepted.
However, in concluding this (Nielsen et al., 2003) has successfully shown that transfer pricing
can be utilised to achieve a combination of tax benefits and achieving the organisation’s
strategic objective. The strategic nature arises in setting transfer prices on a centralised level
but allowing the local entities to set the prices and quantities for the local market thus allowing
them to be strategic by winning market share from local competitors (Nielsen et al., 2003).

63
6.9 The Evaluation of Transfer Pricing as a tool
This research hypothesis objective aimed to investigate whether transfer pricing was a
management control tool or a component of corporate strategy.
The first question in this research theme aimed to evaluate whether transfer prices were
perceived as more of a management tool instead of a component of strategy. For this question
there were no respondents that strongly disagreed but there was still a majority that were
neutral and disagreed (60.0% in total) as shown in Figure 18. The chi-square test results
shown in Table 13 yielded a p-value of 0.829 with a statistically significant result. This indicates
that whether transfer pricing is viewed as a management tool is dependent on the country of
the participants.
The utilisation of transfer pricing may have more than one objective. When querying whether
there are more management incentives involved as a motivation to utilise transfer pricing
rather than as a component of strategy, the results ranged amongst all the alternatives as
shown in Figure 19. The chi-square tests result were statistically significant with a p-value of
0.286 indicating that the management incentives as opposed to the business strategy of
utilising transfer pricing is dependent on the country of the participants. Whilst the findings in
this research may not be definitive, (Anthony et al., 1992) highlights that transfer pricing should
be viewed as a behavioural tool that has the ability to motivate managers to make the right
business decisions. These results tie in with the (Cravens, 1997) study where it was
successfully shown that businesspeople are in agreement that transfer pricing does have an
influence on business measures.
The next question queried whether respondents were of the view that the utilisation of transfer
pricing makes business easier to be conducted. The highest percentage of respondents,
44.83%, were in agreement that the utilisation of transfer pricing does make business easier
to be conducted. Chi-square tests were run with the association of this variable on the job
roles of the participants. The result was statistically insignificant with a p-value of 0.030,
indicating that the utilisation of transfer pricing to make business easier to be conducted is not
dependent on the job role of the participants, as shown in Figure 21.
The final question in this research theme was to evaluate the view of the costing system as a
strategic variable for the organisation. Figure 22 depicts the same proportion of respondents

64
that strongly disagreed and strongly agreed to the costing system being viewed as a strategic
variable. The chis-square test result was statistically insignificant with a p-value of 0.037,
indicating that whether the costing system is viewed as a strategic variable is not dependent
on the country of the participants.
According to (Hyde, 2005) besides transfer pricing being able to minimise the tax burden for
a multinational, its use serves as an incentive for divisional managers that are remunerated
based on the performance of their business unit.
According to (Vroom, 2006) it is the design of the organisation and the management incentives
used to manage performance that guide the decision making that feeds into strategy and
therefore the transfer pricing strategy needs to be aligned to managers ability to negotiate and
agree pricing.
6.10 Conclusion to the results for Research Hypothesis 4
Based on the results of the chis-square test results the findings of this research theme do not
show conclusively that transfer pricing is being utilised as a strategic tool in the organisation.
Thus the opposite alternative (null) hypothesis of no relationship that transfer pricing is a
component of corporate strategy is accepted.
One of the contributing factors to this outcome may be found from (Borkowski, 1990) that once
a transfer pricing method has been chosen then there is a certain amount of unwillingness to
change and could affect the strategic objective of implementing transfer pricing in the
organisation.
6.11 The Control System of Transfer Pricing
This research hypothesis objective was to identify whether transfer prices set by a centralised
control system were more desired than by a decentralised system.
For the first question in this research theme, respondents were questioned on their view
whether the evaluation of transfer prices were done effectively. There were no respondents
that strongly agreed as shown in Figure 23. Majority of respondents agreed that transfer prices
are set effectively (48.28%). The chi-square test yielded a statistically significant test result
with a p-value of 0.121 indicating that whether transfer prices are effectively evaluated is

65
dependent on the country of the participants. For each of the individual countries, there are
many internal issues in the evaluation and performance of transfer pricing (Cravens, 1997)
which may have affected the question responses.
Respondents were then questioned on the whether the performance of transfer prices is done
effectively. A combination of respondents that had disagreed and strongly disagreed (34.48%)
do not believe so as shown in Figure 24. The chi-square test result was statistically significant
with a p-value of 0.666 indicating that whether the performance of transfer pricing is managed
effectively is dependent on the country of the participants. The findings of the research are not
in line with the (Cravens, 1997) study where the best measure of effectiveness for any strategy
is to view it in terms of where management objectives were achieved. In this research transfer
pricing was seen as a business strategy as concluded from Research Theme 1 but the
effectiveness of the intention was not necessarily met. (Eccles, 1985; Holmstrom & Tirole,
1991) findings are also congruent with this study where respondents where a criticism is that
resources are spent on competing with competitors pricing and does not necessarily add to
the overall efficiency of the organisation.
Most of the respondents were neutral or in agreement that transfer pricing is being exploited
among the related entities of ABB as shown in Figure 25. The chi-square test result was
statistically significant with a p-value of 0.228 indicating that whether transfer prices are
exploited amongst related entities of ABB is dependent on the country of the participants. The
realisation is that a multinational will always have the ability to exploit, in part or in whole, any
internal transfer by a related entity of the organisation (Cravens, 1997).
In line with (Holmstrom & Tirole, 1991) the findings of this study shows that it is the degree of
centralisation that determines the balance between the trading relationship and transfer
pricing policy were for some countries this was prominent than others. However, the findings
in this study do not correspond to the organisational forms that (Holmstrom & Tirole, 1991)
tested.
The next question assessed whether transfer prices were set by a centralised control system.
A combination of respondents strongly disagreed and disagreed (37.93%) that transfer prices
are set by a centralised control system as shown in Figure 26. The majority of respondents
are in agreement (55.17%) that transfer prices cannot be determined on a decentralised level.
Following on the (Chalos & Haka, 1990) study shows that transfer pricing in a decentralised
organisation is maintaining profit maximisation whilst still trying to balance out the related
entities autonomy. This has been apparent in this study as well.

66
The (Eccles, 1985) study cautioned that when an organisations transfer pricing policy is not in
line with the market demands, this may lead to conflict in the organisation and ineffectiveness.
(Chan & Chow, 1997) came to the realisation that the assessment of a multinationals transfer
pricing is particularly difficult in developing countries. They have provided empirical evidence
that manipulation of the tax rate is not the driving factor to implement transfer pricing.
6.12 Conclusions to the results for Research Hypothesis 5
This research hypothesis objective was to identify whether transfer prices set by a centralised
control system were more desired than by a decentralised system. The majority of
respondents were in agreement that transfer prices cannot be determined on a decentralised
level. Thus the alternative hypothesis of transfer pricing being set by a centralised control
system were more desirable is accepted. The general conclusion though is that there is no
one correct method, but is dependent on what fits the needs to implement the strategy best.
6.13 Data Reliability and Validity
(Field, 2013) suggests that a measure of reliability should consistently reflect in the construct
that is being measured. Given that things are equal, a respondent answering a questionnaire
should be able to respond similarly to the same question at a different point in time, this is
referred to as a test-retest reliability (Field, 2013). The Cronbach’s α computed was 0.838.
According to (Field, 2013; Zikmund et al., 2012) a value of 0.7 to 0.8 is an acceptable value
and thus the section possessed strong reliability and the appropriate use of each of the items
included in the questionnaire.

67
7. CONCLUSION
The purpose of this chapter is to consolidate the outcomes of the research in line with the
objectives and to provide recommendations for further research.
7.1 Background of Research
(Schjelderup & Weichenrieder, 1999) created the awareness that governments have the ability
to control transfer pricing but the challenge lies in monitoring of the transfer pricing amongst
the related entities. The focus of authorities is also questionable as sometimes it lies more in
the transfer price itself as opposed to attempting to implement a neutral trade pattern.
(Schjelderup & Weichenrieder, 1999) findings have confirmed that if arm’s length pricing is
used as an approach to regulate profit as opposed to regulate transfer pricing then the overall
effect will be a reduction in international trade.
The literature review provided the impetus for the research questionnaire along the following
themes:
Transfer pricing employed as a competitive business strategy
The impact of transfer pricing on business strategy
The reasons for implementing transfer pricing
The evaluation of transfer pricing as a tool
The control system of transfer pricing
7.2 Research Findings
The research findings, with its limitations, can be utilised by the organisation to understand
how transfer pricing can be utilised to provide a strategic business advantage. It addresses
the gap in literature between the two fields of research and aims to bridge that divide.
(Lall, 1979) has suggested that a transfer pricing problem may differ in scope and
concentration based on the industry that is being evaluated, thus the reader needs to be
cognisant that the research was done on the Process Automation division of ABB.

68
This research largely concurs with (Cravens, 1997) in that transfer pricing is viewed as being
critical to the overall success of the multinational globally, and thus does feed into the strategy.
The (Eccles, 1985) framework for the implementation of the transfer pricing strategy can be
used by managers in order to scrutinise their own entities transfer pricing. A multinational
needs to be cognisant that whenever the choice to enter into a new market arises, there will
be newer complexities added to the multinationals transfer pricing strategy (Cravens, 1997).
The findings from this study ties into (Eccles, 1985) that highlighted the importance of transfer
pricing as nearly 80% of Fortune 1000 have to choose a transfer pricing strategy. (Holtzmann
& Nagel, 2014) agrees that a multinationals transfer pricing strategy should be one that can
be defended and ties into the organisation’s strategic intent.
Based on the findings, it has confirmed that transfer pricing is considered to be part of the
business strategy in the Process Automation division at ABB. A positive outcome of the study
has shown that the strategic objective of transfer pricing has been achieved irrespective of the
country of the related entity of the multinational that business is conducted in. transfer pricing
in a multinational like ABB is a widely accepted business practice. The alternative research
hypothesis is accepted.
The findings for research hypothesis 2 are that the opposite alternative (null) hypothesis is
accepted. This is due to the findings showing no strong agreement as an organisation ABB
and the Process Automation division showing a unique global environment for transfer pricing
nor a unique country level environment for transfer pricing. (Schjelderup & Weichenrieder,
1999) findings have confirmed that if arm’s length pricing is used as an approach to regulate
profit as opposed to regulate transfer pricing then the overall effect will be a reduction in
international trade.
For research hypothesis 3, the alternative (null) hypothesis had to be accepted as there was
no tangible finding that allowed for a conclusion that the reason for implementing transfer
pricing could be either primary tax-driven or strategy-driven. Whilst the temptation may always
be there to view transfer pricing from a tax perspective, this study has shown that a
multinational can utilise transfer pricing to achieve multiple objectives that can provide for a
strategic business advantage. This study has also confirmed that multinational have multiple
strategic objectives from implementing a transfer pricing strategy. It is important to understand
what is driving the strategy as this will be supported by the decisions made with regards to
transfer pricing.

69
(Cravens, 1997) emphasises the power in transfer pricing being able to drive the correct
corporate performance. However, in concluding this (Nielsen et al., 2003) has successfully
shown that transfer pricing can be utilised to achieve a combination of tax benefits and
achieving the organisation’s strategic objective.
The findings of this research for hypothesis 4 did not conclusively show that transfer pricing
was being used as a strategic tool in the Process Automation division at ABB. for this reason
the opposite alternative (null) hypothesis is accepted. (Anthony et al., 1992) has shown that
transfer pricing can be used as a motivational behavioural tool to drive managers to make
strategic business decisions. The (Cravens, 1997) study supported this view with the influence
that businesspeople can have to influence business measures. (Eccles, 1985) cautions that
when an organisations transfer pricing policy is not in line with the market demands, this may
lead to conflict in the organisation and ineffectiveness.
This study for research hypothesis 5 showed that transfer prices cannot be set on a
decentralised level and had to have a level of centralisation. Thus the alternative hypothesis
of transfer pricing being set by a centralised control system is accepted. Following on the
(Chalos & Haka, 1990) study shows that transfer pricing in a decentralised organisation is
maintaining profit maximisation whilst still trying to balance out the related entities autonomy.
This has been apparent in this study as well.
(Holtzmann & Nagel, 2014) criticises the (“Organization for Economic Co-Operation and
Development,” 2013) transfer pricing rules in it not being consistent government agencies and
organisations. Whilst there is the realisation is that a multinational will always have the ability
to exploit, in part or in whole, any internal transfer by a related entity of the organisation
(Cravens, 1997), the general conclusion in setting a transfer price is that there is no one correct
method, which ties into the literature findings as well. The transfer price that needs to be set
and implemented should align to what fits the business strategy best. (Alles & Datar, 1998)
recommends that if an organisation wishes to have an absolute advantage in the markets that
it is present in, then the costs of the products needs to be increased via transfer pricing.
(Eccles, 1985) has cautioned that driving individual related entities profits may lead to conflict
and may have far-reaching long-term implications for the multinational. The suggestion that
(Eccles, 1985) provides is to consider the transfer pricing strategy as a bargaining approach
over time which is consistent with game theory approaches that ensure optimum outcomes.

70
7.3 Recommendations for Further Research
This research provides a footprint to extend the research to an organisation-wide study, eg.
the other four remaining divisions at ABB. This study attempted to provide a global perspective
by obtaining responses from a representative sample set. However, it could be extended to a
wider number of individuals per country within the ABB group. Alternatively, the research can
be extended to an industry study to understand whether there is consistencies and/or
similarities within the power and automation industry.
The game theory approach should be considered to be investigated to review ‘player’
strategies in the form of the related entities and to have a view of longer-term organisational
strategy rather than a point in time.
(Cravens & Shearon, 1996) had cautioned that whilst the transfer pricing policy may have the
ability to measure that total tax burden and return on assets, the outcomes of the transfer
pricing policies of multinationals still has sufficient room for exploration.

71
8. REFERENCES
Adler, R. W. (1996). Transfer Pricing for World-Class Manufacturing. Long Range Planning,
29(1), 69–75. http://doi.org/0024-6301(95)00067-4
Alles, M., & Datar, S. (1998). Strategic Transfer Pricing. Management Science, 44(4), 451–
461. Retrieved from http://www.jstor.org/stable/2634608
Andrews, K. R. (1987). The Concept of Corporate Strategy. Irwin, Homewood, IL.
Anthony, R. N., Dearden, J., & Govindarajan, V. (1992). Management Control Systems.
Homewood: IL: Irwin.
Arpan, J. S. (1972). International Intercorporate Pricing. New York: Praeger.
Baldenius, T., Melumad, N. D., & Reichelstein, S. (2004). Integrating Managerial and Tax
Objectives in Transfer Pricing. The Accounting Review, 79(3), 591–695.
Baldenius, T., & Reichelstein, S. (2006). External and Internal Pricing in Multidivisional Firms.
Journal of Accounting Research, 44(1). http://doi.org/10.1111/j.1475-679X.2006.00191.x
Barry, F. (2005). FDI , transfer pricing and the measurement of R & D intensity. Research
Policy, 34(5), 673–681. http://doi.org/10.1016/j.respol.2005.02.002
Borkowski, S. C. (1990). Environmental and organizational factors affecting transfer pricing: a
survey. Journal of Management Accounting Research, (2 Fall), 78–99.
Chalos, P., & Haka, S. (1990). Transfer Pricing Under Bilateral Bargaining. Accounting
Review, 65(3), 624–641.
Chan, K. H., & Chow, L. (1997). An empirical study of tax audits in China on international
transfer pricing. Journal of Accounting and Economics, 23(1), 83–112.
Clausing, K. A. (2000). The Impact of transfer pricing on intrafirm T]trade. International
Taxation and Multinational Activity, (January), 173–200.
Cravens, K. S. (1997). Examining the role of transfer pricing as a strategy for multinational
firms. International Business Review, 6(2), 127–145.
Cravens, K. S., & Shearon, W. T. (1996). An Outcome-Based Assessment of International
Transfer Pricing Policy. The International Journal of Accounting, 31(4), 419–443.
Eccles, R. G. (1983). Control with Fairness in Transfer Pricing. Harvard Business Review,
61(6), 149–161.
Eccles, R. G. (1985). The Transfer Pricing Problem: A Theory for Practice. Lexington, MA.:
Lexington Books.
Emmanuel, C. R., & Mehafdi, M. (1994). Transfer Pricing. London: Academic Press.
Field, A. (2013). Discovering Statistics using IBM SPSS statistics (4th ed.). Thousand Oaks:

72
Sage.
Fowler, D. . (1978). Transfer prices and profit maximization in multinational enterprise
operations. Journal of International Business Studies, 9(3), 9–26.
Gox, R. F., & Schondube, J. R. (2004). Strategic Transfer Pricing with Risk-Averse Agents.
Schmalenbach Business Review, 56(April), 98–118.
Gresik, T. A., & Osmundsen, P. (2008). Transfer Pricing In Vertically Integrated Industries.
International Tax and Public Finance, 15(3), 231–255.
Grubert, H., & Mutti, J. (1991). Taxes, tariffs and transfer pricing in multinational corporate
decision making. The Review of Economics and Statistics, 73(2), 285–293.
Hamilton, J. L., & Mqasqas, I. M. (1997). Direct vertical integration strategies. Southern
Economic Journal, 64(1), 220–234.
Hiemann, M., & Reichelstein, S. (2012). Transfer pricing in multinational corporations : An
integrated management-and tax perspective. MPI Studies in Tax Law and Public Finance
1, 3–18. http://doi.org/10.1007/978-3-642-25980-7
Hirshleifer, J. (1956). On the Economics of Transfer Pricing. The Journal of Business, 29(3),
172–184.
Holmstrom, B., & Tirole, J. (1991). Transfer Pricing and Organizational Form. Journal of Law,
Economics, & Organization, 7(2), 201–228.
Holtzmann, Y., & Nagel, P. (2014). An introduction to transfer pricing. Journal of Management
Development, 33(1), 57–61. http://doi.org/10.1108/JMD-11-2013-0139
Hyde, C. E. (2005). Keeping two sets of books: The Relationship between tax and incentive
transfer prices. Journal of Economics & Management Strategy, 14(1), 165–186.
Kant, C. (1988). Endogenous transfer pricing and the effects of uncertain regulation. Journal
of International Economics, 24(1), 147–157.
Lall, S. (1979). Transfer pricing and developing countries: some problems of investigation.
World Development 7(1).
Lambert, D. (1979). Transfer pricing and interdivisional conflict. California Management
Review (pre-1986), 21(000004), 70.
McGowan, C. B., Beauregard, D., & Collier, H. W. (2011). Transfer Pricing And The
Multinational Corporation. The Journal of Applied Business Research (JABR), 3(2), 64–
71.
Nielsen, S. B., Raimondos-Moller, P., & Schjelderup, G. (2003). Formula apportionment and
transfer pricing under oligopolistic competition. Journal of Public Economic Theory, 5(2),
419–437.
OECD. Transfer Pricing Guidelines for Multinational Enterprises and Tax Administrations
(1979). Paris: OECD Publication Services.
Onsi, M. (1970). A transfer pricing system based on opportunity cost. The Accounting Review,
45(3), 535–543.

73
Organization for Economic Co-Operation and Development. (2013). Retrieved from
www.oecd.org
Parmar, S. (2012). Transfer pricing: Emerging Issues for MNC. Rajkot.
Patel, M. (1981). A Note on Transfer Pricing by Transnational Corporations. Indian Economic
Review, 16(1/2), 139–152.
Raby, N. (2013). International Transfer Pricing 2013/14. (E. Sweigart & D. Hart, Eds.) (2013/14
ed.). PriceWaterhouse Coopers.
Raimondos-Moller, P., & Scharft, K. (2002). Transfer pricing rules and competing
governments. Oxford Economic Papers, 54(2), 230–246.
http://doi.org/10.1093/oep/54.2.230
Rugman, A. M., & Eden, L. (Eds. . (1985). Multinationals and Transfer Pricing. Beckenham,
Kent: Croom Helm.
SAICA. (2011). The value of strategic transfer pricing. Retrieved April 29, 2015, from
https://www.saica.co.za/integritax/2001/867_The_value_of_strategic_transfer_pricing.ht
m
Satapathy, C. (2001). Transfer Pricing: Impact on trade and profit taxation. Economic and
Political Weekly, 36(20), 1689–1692.
Saunders, M., & Lewis, P. (2012). Doing Research in Business and Management: An
Essential Guide to Planning Your Project (6th ed.). London: Pearson Education.
Schjelderup, G., & Weichenrieder, A. J. (1999). Trade, Multinationals, and Transfer Pricing
Regulations. Canadian Journal of Economics, 32(3), 817–834.
http://doi.org/10.2307/136452
Sikka, P., & Willmott, H. (2010). The dark side of transfer pricing: Its role in tax avoidance and
wealth retentiveness. Critical Perspectives on Accounting, 21(4), 342–356.
http://doi.org/10.1016/j.cpa.2010.02.004
Spicer, B. H. (1988). Towards an organizational theory of the transfer pricing process.
Accounting Organizations and Society, 13(3), 303–324.
Stevenson, T. H., & Cabell, D. W. E. (2002). Integrating Transfer Pricing and Activity-Based
Costing. Journal of International Marketing, 10(4), 77–88.
Tang, R. Y. W. (1979). Transfer Pricing Practices in the United States and Japan. New York:
Praeger.
The Economist. (1993, May). Taxing Questions: What is the best way to tax multinational
companies?, 73.
Usmen, N. (2010). How should MNCs use transfer prices to enhance value? Journal of
International Business and Economics, 10(1).
Uyar, M. (2014). A Study on Accounting of Transfer Pricing and Its Effect on Taxation.
Accounting and Finance Research, 3(1), 79. http://doi.org/10.5430/afr.v3n1p79
Vroom, G. (2006). Organizational Design and the Intensity of Rivalry. Management Science,

74
52(11), 1689–1702. http://doi.org/10.1287/mnsc.1060.0586
Wong, H., Nassiripour, S., Mir, R., & Healy, W. (2011). Transfer Price Setting in Multinational
Corporations. International Journal of Business and Social Science, 2(9), 10–15.
Zikmund, W., Babin, B., Carr, J., & Griffin, M. (2012). Business research methods. Cengage
Learning.

75
9. APPENDIX 1: QUESTIONNAIRE
ONLINE SURVEY
A self-administered questionnaire was distributed using an email via official ABB e-mail
addresses with a hyperlink (www.surveymonkey.com) to the unit of analysis.
INTRODUCTION
I am conducting research on the implementation of strategic transfer pricing for competitive
advantage. To that end, my request is for you to complete a survey with a set number of
questions. This will enable the understanding of the impact of transfer pricing as a part of
business strategy at ABB. The questionnaire should take no longer than ten (10) minutes of
your time to complete. Your participation is voluntary and you can withdraw at any time without
penalty. Of course, all data collected for this research purpose will be kept confidential and
anonymous. To this end, I have also signed an ABB Non-Disclosure Agreement. By
completing the survey, you indicate that you voluntarily participate in this research. If you have
any concerns, please contact me or my research supervisor.
Researcher: Research Supervisor:
Jyoti Rupnarain Matthew E Birtch
[email protected] [email protected]
084 900 7007 082 939 2672
_________________________________________________________________________

76
DEMOGRAPHIC QUESTIONS
Name (Voluntary):
Country:
What is your
age?
18 - 32 33 - 40 41 -50 51 - 65 >65
What is your
current job
role at ABB?
CFO
Local Div Manager
Div Controller
LBU Manager
Other
(please
specify)
How long
have you
been in this
role?
<1 year
1 - 3 years
4 - 6 years
7 - 10 years
>10 years
How many
years of total
working
experience
do you
have?
<5 years
5 - 10 years
10 - 15 years
15 - 20 years
>20 years
Research Theme 1: Level of initialisation of transfer pricing in the organisation
Strongly
disagree
Disagree Neutral Agree Strongly
agree
Transfer pricing is considered to be
part of the business strategy
Transfer pricing is a procedure of the
way business is conducted
If it is considered as part of the
business strategy, it falls into the
implementation stage of the strategy

77
Research Theme 2: Impact of transfer pricing on business strategy
Strongly
disagree
Disagree Neutral Agree Strongly
agree
ABB has a unique global environment
for transfer pricing
ABB (country level) has a unique
environment for transfer pricing
Transfer pricing is used to reaffirm
that ABB is a global multinational firm
The objectives of why transfer pricing
was implemented have been
achieved
Research Theme 3: Reasons for implementing transfer pricing
Strongly
disagree
Disagree Neutral Agree Strongly
agree
Transfer pricing was implemented for
tax purposes, foreign exchange and
cash controls (i.e. an accounting
technique)
The utilisation of transfer pricing
makes business results easier to be
reported
The financial and/or strategic benefit
of implementing transfer pricing is
quantified
Transfer pricing creates value for the
organisation as a strategic tool

78
Research Theme 4: The evaluation of transfer pricing as a tool
Strongly
disagree
Disagree Neutral Agree Strongly
agree
Transfer pricing seen as more a
management tool instead as a
component of strategy
There are more management
incentives to utilising transfer pricing
than a component of business
strategy
The utilisation of transfer pricing
makes business easier to be
conducted
The costing system is viewed as a
strategic variable
Research Theme 5: The control system of transfer pricing
Strongly
disagree
Disagree Neutral Agree Strongly
agree
The evaluation of transfer prices is
done effectively
The performance of transfer prices
are managed effectively
Transfer pricing is being exploited
among the related entities of ABB
Transfer prices are set by a
centralised control system
Transfer prices cannot be determined
on a decentralised level
Thank you for your time taken and valuable input in the participation in the questionnaire.

79
10. APPENDIX 2: ETHICS APPROVAL

80
11. APPENDIX 3: TURNITIN RECEIPT