Embed Size (px)
Citation preview
CRM D0000457.A1 / FinalJune 2000
The Implications of UniversalEnrollment for the DOD HealthCare System
Robert A. Levy • Richard D. Miller
Center for Naval Analyses4401 Ford Avenue • Alexandr ia, Virginia 22302-1498

Copyright CNA Corporation/Scanned October 2002
Approved for distribution: June 2000
L^UCAAJb ty fflcv*
LaurieJ. May, DirectorMedical TeamResource Analysis Division
This document represents the best opinion of CNA at the time of issue.It does not necessarily represent the opinion of the Department of the Navy.
APPROVED FOR PUBLIC RELEASE; DISTRIBUTION UNLIMITEDFor copies of this document, call the CNA Document Control and Distribution Section (703) 824-2130
Copyright © 2000 The CNA Corporation

ContentsSummary. . . . . . . . . . . . . . . . . . . . . . . . . . . . . . 1
Introduction . . . . . . . . . . . . . . . . . . . . . . . . . 1Approach . . . . . . . . . . . . . . . . . . . . . . . . . . . 2Findings. . . . . . . . . . . . . . . . . . . . . . . . . . . . 3
The benefits and costs of enrollment . . . . . . . . . . . . . . 7Background on the DHP . . . . . . . . . . . . . . . . . . 7Benefits . . . . . . . . . . . . . . . . . . . . . . . . . . . . 8
Reducing uncertainty. . . . . . . . . . . . . . . . . . 9Improving the health of DOD beneficiaries. . . . . . 12
Costs . . . . . . . . . . . . . . . . . . . . . . . . . . . . . 13
Specifying enrollment options . . . . . . . . . . . . . . . . . . 1 5Considerations . . . . . . . . . . . . . . . . . . . . . . . . 15Option 1—Changes to Prime and Extra only. . . . . . . . 17Option 2—Prime and TRICARE Standard/Extra with fees 18OptionS—Offering FEHB to beneficiaries. . . . . . . . . 19
Method. . . . . . . . . . . . . . . . . . . . . . . . . . . . . . . 2 1Data. . . . . . . . . . . . . . . . . . . . . . . . . . . . . . 2 1General approach . . . . . . . . . . . . . . . . . . . . . . 22
Grouping beneficiaries by health planp a r t i c i p a t i o n . . . . . . . . . . . . . . . . . . . . . . 2 3
Responses on planned enrollment anddisenrollment . . . . . . . . . . . . . . . . . . . . . 2 5
Creating categories representing the sourceof care . . . . . . . . . . . . . . . . . . . . . . . . . 26
Designing the rules for projecting e n r o l l m e n t . . . . . . . 27Rules for projecting enrollment in option 1 . . . . . 27Rules for projecting enrollment in option 2 . . . . . 30Rules for projecting enrollment in option 3 . . . . . 33

Results . . . . . . . . . . . . . . . . . . . . . . . . . . . . . . . 3 7Baseline. . . . . . . . . . . . . . . . . . . . . . . . . . . . 3 7
Active duty family members . . . . . . . . . . . . . . 37Retirees under 65 . . . . . . . . . . . . . . . . . . . . 42Retirees 65 and older . . . . . . . . . . . . . . . . . . 43
Quantifying the changes after enrollment . . . . . . . . . 44Expected enrollment under option 1 . . . . . . . . . 44Expected enrollment under option 2 . . . . . . . . . 46Expected enrollment under option 3 . . . . . . . . . 49
Effects on cost . . . . . . . . . . . . . . . . . . . . . . . . 51Factors influencing cost calculations. . . . . . . . . . 51Determining the cost by option . . . . . . . . . . . . 55
Impact o n readiness . . . . . . . . . . . . . . . . . . . . . . . . 6 1Impact on direct care system reliance . . . . . . . . . 61Converting numbers of patients to numbers ofphysicians . . . . . . . . . . . . . . . . . . . . . . . 6 2
Concluding r e m a r k s . . . . . . . . . . . . . . . . . . . . . . . . 6 5
R e f e r e n c e s . . . . . . . . . . . . . . . . . . . . . . . . . . . . . 6 9
List o f tables . . . . . . . . . . . . . . . . . . . . . . . . . . . . 7 1
Distribution list . . . . . . . . . . . . . . . . . . . . . . . . . . 7 3

Summary
IntroductionThe TRICARE program is designed to provide for the health careneeds of those on active duty, their family members, and retirees andtheir family members. TRICARE is a complicated health care systemwith several different parts. One key component is Prime, the man-aged care portion of the Defense Health Plan (DHP). One mustenroll in Prime to receive care under it; however, other options forreceiving care do not require enrollment.
This study responds to tasking from the Under Secretary of Defense(USD) for Personnel and Readiness concerning the feasibility of anenrollment system for the DHP. Under Prime, enrollment is arequirement for receiving care. In a limited sense, enrollment is notonly possible but currently under way. We believe, however, that themore important question and one posed under the tasking is whetheruniversal enrollment is feasible. As we'll show, Prime pertains to a rel-atively important and growing part of the beneficiary population thatrelies on military treatment facilities (MTFs)—military clinics andhospitals—for health care. The other users of the MTFs rely on space-available care. These people don't have to enroll to use military healthcare providers or facilities; they use the MTFs for care when there issufficient capacity.
In this study, we project what would happen if beneficiaries had toenroll in specific options offered under the Defense Health Plan inorder to receive care or reimbursement from DOD. Perhaps the mostimportant implication is that space-available care would no longer beoffered. MTFs would not be available to anyone who had not enrolledin Prime.
We recognize that changing the system in this way would have majorramifications to the system as well as to DOD beneficiaries. MostDOD

Approach
beneficiaries have options that are not open to others in the civilianhealth care system. They can stay within the system by joining Primeor they can rely on a mixture of civilian and military care, through theuse of TRICARE Standard/Extra and space-available care. Not onlywould many who rely on the MTF for all or part of their care find theiroptions more limited, but the system might find that too manypatients would opt out and rely on nonmilitary facilities and provid-ers. At some point, the number of enrollees left in Prime could beinsufficient to support the military's medical readiness goals.
Of course, the lack of enrollment and the reliance on space-availablecare come with a price. Those who rely on space-available care mayfind that they cannot get the appointment they want or see the pro-vider they prefer. It means that the goals of the Military Health System(MHS) of providing preventive care and implementing other initia-tives to improve the health and productivity of DOD beneficiarieswould be limited. It's difficult, if not impossible, to provide these ser-vices when patients don't enroll and can move in and out of thesystem as they please. The uncertainty of which beneficiaries areusing what part of the system greatly complicates the managing andplanning of future improvements and budgets. Enrollment wouldalleviate many of these problems.
Clearly, a change to a universal enrollment system would not be sim-ple; it represents a major change to the current DHP with manyimportant effects. To explore this issue, we construct a set of enroll-ment options and determine whether the benefits to the system out-weigh the costs that we could quantify—if not the political costs, atleast the economic and readiness costs.
As a first step, we defined a set of options that give the beneficiariescertain choices to remain in the system or to leave it. Next, we con-structed a series of models, based for the most part on the beneficia-ries' own responses to survey questions, that allowed us to projectenrollment for each option. We made sure that these models wereflexible and could be rerun easily if other assumptions or optionswere being considered. Finally, for each option studied, we took the

Findings
models' projections of enrollment in Prime or their DOD-providedalternative and determined the implications for cost and readiness.
We explored three alternatives for increasing enrollment. We chosethese options because they are similar to options for the DHP thathave been proposed by senior DOD dpolicymakers or members ofCongress, although they would tend to reduce enrollment fees, notincrease them, as we have assumed. Table 1 presents a summary ofwho would be affected and how much each option would cost.Option 1 is the most limited and affects only retirees under 65. Itwould still allow the active duty family members (ADFMs) and Medi-care-eligible beneficiaries to use space-available care. Only underoptions 2 and 3 would there be universal enrollment.
Table 1. Options considered in CNA analysis
Plan characteristics Option 1 Option 2 Option 3Beneficiary groups affectedPrime enrollment to use MTFPrime enrollment fees
Changes to Standard/ExtraEnrollment fees3
Benefit design
Retirees under 65Mandatory
$150/individual,$3007 family
$0 for Standard,$150/$300 for Extra
Some changes todeductibles and copays
All but active dutyMandatory
$400/individual,$800/family
$650/individual,$1,350/familySame as today
All but active dutyMandatory
$400/individual,$800/family
Substituted by FEHBPDepends on plan
Depends on plan
a. Under options 2 and 3, active duty family members do not pay an enrollment fee for Prime and are subsidized forany alternative.
Under option 1, Prime enrollment fees would be reduced, but itwould cost something to join the network under TRICARE Extra.TRICARE Standard would still have no enrollment and no fee.Option 2 imposes universal enrollment—that is, there is no space-available care. It also imposes higher fees, at least for retirees; ADFMswould not face any enrollment fees, but they must enroll to receivecare. Beneficiaries would have to enroll in Standard or Extra (we'veassumed they would operate under one plan, analogous to a

managed fee-for-service plan) and would have to pay an enrollmentfee. Option 3 retains the enrollment fee structure for Prime and theeligibility for benefits by the over-65 population. However, it replacesTRICARE Standard/Extra with the Federal Employee Health Bene-fits Program (FEHBP). DOD will pay the premiums (at least up to aset amount) for the ADFM beneficiaries, but retirees will have to paytheir share.
Why the increased fees? The main reason is to have beneficiariescommit to a single plan and to reduce the uncertainty of the currentsystem, making it more manageable and predictable. From the bene-ficiaries' point of view, however, what is perhaps most important isthat they would retain their rights to rely on the system when theyturn 65. One of the reasons for this analysis is to determine whetherour proposed options would make it possible (i.e., affordable) to pro-vide a full benefit to the DOD Medicare-eligible population. But itwould not be hard to analyze what would happen if enrollment feeswere lower then we have assumed here.
Using our models for each option and each affected beneficiary cat-egory, we projected the enrollment in the system and enrollment atMTFs, and then estimated the effects on cost and military health carereadiness. Table 2 summarizes what we found. We project that thereare 1.827 million full-time-equivalent adult users of the MTFs todayand that that would fall somewhat under each option.1 Option 1shows a decline, but that option only assumed changes for retireesunder 65. The greatest decline would occur should FEHBP beoffered to all DOD non-active-duty beneficiaries. The DHP loses pop-ulation, although DOD would find many beneficiaries relying onFEHBP.
Costs would change as well, although there are many assumptionsthat we've made that had an impact on the results. For example, weassumed from the beginning that DOD would attempt to keep thefamily members of active duty from paying more than they do now, at
1. In table 2, the use of care pertains to adults only. For computing costs,however, we have added the children back and assume that their use ofcare follows the adults in the same proportions.

least from the point of enrollment fees to DOD or premiums toFEHBP. DOD's taking on this cost added fairly significantly to totalcost for both options 2 and 3. Another factor concerns the cost of pro-viding care to the DOD Medicare-eligible population. The valuesshown in table 2 assume that Medicare pays for much of the care ifthis population takes one of the DOD options. Option 2 actuallyappears to reduce costs by about $900 million, but that would onlyoccur when Medicare is the first payor and Standard/Extra becomesa second payor. In the main text, we show that costs would be as muchas $2.5 billion higher if DOD has to cover all of the Medicare-eligiblecosts should Medicare not contribute.
Table 2. Summary of findings for all options
Option Option OptionCurrent 1 2 3
Use of care (in millions)MTFa
Total DHPFEHBP
1.8272.651
1.5852.660
1.3923.139
1.3201.6581.653
Cost of care to DOD (in $B)MTF 7.118 6.387 5.463 5.209Otherb 2.841 3.601 4.784 8.427
Subtotal 9.959 9.988 10.247 13.636DOD enrollment fees-beneficiaries .143 .156 1.302 .467Net cost to DOD 9.816 9.832 8.944 11.816FEHBP premium cost-beneficiaries 1.243a. The current case includes space-available care,b. Includes premiums paid by DOD for FEHBP.
We've now seen that there are significant effects both on the use andcost of the DHP. The last effect is the impact on readiness because ofthe reduced population using the MTFs for care. We examined
2. Indeed, many of the savings when people leave the system might notmaterialize as well. We've assumed that costs would change as the pop-ulation changes; however, if much of the cost of care was fixed, thisprobably would not happen.

whether the population left after the changes would keep militaryphysicians sufficiently busy to keep their skills up to date.
We found that the loss of population would not create a significantproblem for most specialties, but there would be problems for gen-eral surgery, orthopedic surgery, and emergency medicine. Even forthese three, the problem is worsened, but the reduced populationlevels didn't really cause the problem, with orthopedic surgeonsbeing the lone exception. Todays' population levels would still implythat workload would be insufficient.
6

The benefits and costs of enrollmentIn this section, we describe the benefits that would likely result fromimplementing universal enrollment. Some of the benefits wouldaccrue to the beneficiaries directly, others would improve the man-agement of the system, which in turn, should lead to efficiencies andbetter care for beneficiaries.
We also recognize, however, that introducing universal enrollmentwould not be costless. Beneficiaries may well have to pay a highershare of their health care bill, and DOD would probably have toimplement new administrative procedures. Our analysis will notquantify all such costs and benefits, but in this section we lay out someof the arguments on both sides. Rather than focus on the benefits andcosts of specific enrollment options, we provide a general discussionthat should apply to virtually any option.
Background on the DHPThe current system has three major parts. Prime serves beneficiariesin much the same way as any health care maintenance organization(HMO) would. A beneficiary signs up with the local military treat-ment facility (MTF) or a network of civilian providers. The networksthat have been set up under the managed care support (MCS) con-tracts are designed to deliver primary care services, with referralsback to the MTFs or other civilian providers for specialty services asthe need arises. If the MTFs cannot provide the required services,because of limitations on their staff/facilities or a lack of capacity, theMCS contractor is responsible for ensuring that the service is pro-vided in the civilian sector.
Under the current system, all beneficiaries under 65—whether activeduty family members (ADFMs) or retirees and their familymembers—have other options in addition to Prime. They are eligiblefor TRICARE Standard or Extra, which resemble other fee-for-service

Benefits
(FFS) and preferred provider organization (PPO) plans, with deduct-ibles, copayments, and out-of-pocket (OOP) maximums.3 An impor-tant feature of both plans is that there is currently no enrollment andno corresponding fee to participate.
The difference between the two plans is that Standard allows the ben-eficiary to use any provider or facility. In other words, there is noexplicit or formal network of providers who provide care to DOD ben-eficiaries. Both ADFMs and retirees must meet an outpatient deduct-ible, and ADFMs must generally pay 20 percent of allowable chargeswhile retirees pay 25 percent of allowable charges. Providers whoaccept Standard patients must accept the allowable charges. TRI-CARE Extra relies on a network of providers who have contractedwith DOD to provide services at a discounted cost. The copaymentsare slightly lower when beneficiaries use this option.
The third option open to DOD beneficiaries, including the 65+ pop-ulation, is receiving care on a "space-available" basis at military hospi-tals and clinics. This means that the beneficiaries do not have toenroll to receive care; as long as capacity in the system exists—whether for primary or specialized care—they can be seen andtreated with DOD paying virtually all costs. Space-available care is par-ticularly important to DOD beneficiaries older than 65 because oftheir ineligibility for TRICARE Standard/Extra or Prime.
Because belonging to Prime is similar to belonging to an HMO, itmost closely resembles plans that are offered by private sectoremployers to their employees. Prime beneficiaries enroll, whichmeans that DOD should know which and how many beneficariesmake up its covered population. It can then plan for what it takes interms of resources to provide required services. Of course, the tran-sient nature of active duty personnel and their family members
3. See [1] for additional details on the specific benefits and costs under allDOD plans.

complicates things, but the basic idea is still similar to what employersprovide to their employees.
TRICARE Standard/Extra resembles many managed FFS plans, par-ticularly when the network option is included. As we said earlier, whatreally distinguishes these plans from those offered by other govern-ment agencies or private sector firms is the lack of explicit enrollmentand any associated enrollment fees. Perhaps the most important pointto note is that care paid for by TRICARE Standard/Extra, although aliability of DOD, is delivered outside the direct care system.
Space-available care is probably the form of care that is most differentfrom what is provided by other health care plans. Of course, there areafter-hours or neighborhood clinics that often take care of those with-out insurance for little or no cost. But the patients of these kinds ofclinics are not generally those whose care is provided through anemployer. The clinics certainly provide an important service, but theyoffer mainly emergency or episodic care.
Given the way the system functions today, how would it—including themanagement of the health care plan itself as well as its beneficiaries—benefit from enrollment? We argue that the benefits that would resultfrom enrollment can be summarized by the following broad categories:
• Reduced uncertainly concerning exactly who is to receive carefrom the MHS
• The ability to focus on providing the appropriate care for eachbeneficiary.
We will describe each of these in more detail below.
Reducing uncertaintyBecause anyone other than Prime beneficiaries can submit claimsthrough Standard/Extra4 or receive care on a space-available basis,the system cannot know with any certainty how many beneficiaries
4. As we said earlier, with few exceptions, TRICARE Standard/Extra is notavailable to the DOD Medicare-eligible (i.e., over 65) population.

will rely on it for care. From a management point of view, the systemmust estimate who relies on it if it is to provide the appropriate levelof resources. It's certainly true that civilian health care plans cannottell what the future holds for their beneficiaries' needs and the plans'subsequent costs. For example, health care costs were moderate inthe early part of the decade, but they began to accelerate over the lastfew years. Nonetheless, the civilian plans at least know to whom theymust potentially provide care, removing an important source ofuncertainty in their future liability.
Is DOD affected by what happens to health care costs in the civiliansector? The answer is yes, but DOD probably has some additional con-trol on the resources required for providing health care. Forexample:
• With so many beneficiaries, the "risk pool" for health care useis larger and, therefore, more predictable than under mostplans.
• Military compensation can be controlled more tightly, at leastin the short run, before problems in recruiting and retentionof providers become issues.
• As a large provider of health care services, DOD can buy items,such as prescription drugs, in large quantities at lower pricesthan in the civilian sector.
Many non-Prime beneficiaries rely on the system for only a portion oftheir care. Which portion they require—outpatient services, inpa-tient services, prescription drugs, mental health, and so on—can havea major effect on the types and associated costs of the requiredresources.
In fact, because beneficiaries do use the system in different ways,OASD/HA must estimate the number of full-time equivalent (FTE)users that rely on the system. The system first must track how manybeneficiaries are eligible for care. The number of eligibles includes allactive duty personnel, their family members, retirees and their familymembers, those in the National Guard or reserves, the Coast Guard,and a few government civilians who serve overseas and have no other
10

source of health care other than military hospitals and/or clinics.There are more than 8 million DOD eligibles.
Not all rely on the DHP. Some are referred to as ghosts. This termrefers to those who rely on civilian sources for their care and don'tsubmit charges that must be paid by DOD. Though they could use thesystem and, therefore, create liabilities for DOD, they don't today,which means they are not an immediate concern, only a potentialone. They may be covered by an employer's plan or they may feel itisn't worth the effort to file a claim. But, that could change if the DHPmade it appealing for them to rejoin the system. An example thatwe'll examine later would arise should DOD offer to pay for all or partof their private insurance needs (as under FEHBP). This wouldundoubtedly draw many people who rely on their own insurance backinto the system, creating a new and expanded liability for DOD.
How many people rely on the DHP either as Prime enrollees, Stan-dard/Extra, or space-available users? DOD doesn't really know. It'sreasonable to assume that anyone on active duty or enrolled in Primeshould be counted as a user (or a covered life, a common term in thehealth care business). What's more difficult is determining how manyFTE users there are in TRICARE Standard or Extra or space-available.Unfortunately, that must be calculated by putting "pieces" of caretogether because the numbers are based on workload counts, notpeople. Some number of people who go for outpatient visits, or inpa-tient stays, or pharmacy prescriptions makes up an FTE user.
Even if this number is accurate, under the best of circumstances, it'sonly an educated guess, so the next question is, how many FTEs arethere using the direct care system versus Standard or Extra? Militaryhealth care managers don't know this either, although we'll attemptto estimate it in this study.
To summarize, it is very hard to manage a system in which its manag-ers do not know who uses it for different kinds of care. Estimates aremade and are probably done as well as possible, but even then theymay be inaccurate. As an insurer, DOD takes on the health care risksof its beneficiaries. The added risk of not knowing who will use thesystem can be eliminated by enrollment.
11

Improving the health of DOD beneficiariesThe discussion thus far has focused on the difficulties with managingthe system. From the point of view of the care provided to beneficia-ries, there are other issues as well. We'll use the MHS's own term todescribe an important benefit of enrollment—namely, implementingprocedures that will lead to population health improvement (PHI).
The basic ideas underlying PHI are associated with many initiativesbeing discussed and implemented in the civilian health care sector(see [2], for example). PHI begins with the notion that medical carehas, in the past, been associated with the focus on disease. In otherwords, the focus has been on dealing with patients only when theypresent themselves for treatment. Health care becomes highly epi-sodic with many unplanned visits. There is a lack of continuity in thecare of beneficiaries, which ultimately leads to little if any increase intheir "health status."
The new focus under PHI is on the health of the beneficiary. "Appro-priate" access is encouraged. It may start with an assessment of needsbefore any disease or problems present themselves. There are initia-tives to prevent primary disease or injuries. Appropriate access maytake the form of proactively providing blood pressure checks or warn-ing beneficiaries to wear seat belts when driving. In other words, somesimple methods may lead to healthier and happier beneficiaries.
Other initiatives may be more complicated. In addition to preventivecare, the focus turns to utilization (or demand) management and dis-ease (or evidence-based) management. Utilization management isalready standard practice in the MHS. But, the change here is turningaway from a strict reliance on utilization review, which has taken on anegative connotation by focusing on reducing bed days, denyingcare, and constraining provider practive, to one that focuses on qual-ity management. According to the mission statement of the MHSOptimization Plan (on page 10 of the MHS interim report), initiativesshould deliver "best value" health care that balances customer ser-vice, high technical quality, and lower costs.
Disease management focuses on managing chronic conditions. Thesystem should coordinate and deliver services focusing on making the
12

Costs
patient comfortable and delivering appropriate care. It targets high-cost, high-volume, and complex diseases/conditions so that positiveoutcomes can be achieved for the patient as well as the system byusing cost-effective methods.
A more complete description of the three elements can be found innumerous papers and briefings being offered under the HA/TMA/Services MHS Optimization Plan. The hope is to ensure continuity ofcare of the patient who, in turn, will respond with higher levels of sat-isfaction and loyalty to the system.
It's clear that episodic care and PHI are essentially not compatible.Enrollment becomes a requirement for this kind of system to work.The DHP must know who relies on it for care and the patient mustknow who will provide that care on an ongoing basis. Beneficiarieswho sometimes use TRICARE Standard/Extra or even space-availablecare cannot fully benefit, if they can benefit at all, from this new focuson population health.
in
Although the benefits are important, we can't ignore the potentialcosts to implementing enrollment, some of which we've alluded toalready. We summarize the main costs as follows:
• Reduction in options open to beneficiaries, particularlyremoving space-available care
• Higher beneficiary costs should enrollment fees be initiated
• Potential reduction in readiness due to loss of workload asspace-available users leave the MHS.
Let's begin with the reduction in options. The use of part-time or full-time space-available care would no longer be permitted under a uni-versal enrollment scheme. For some current beneficiaries, this wouldnot only limit their options but eliminate their access to the systemcompletely—namely the 65+ beneficiaries.
The fee structure now is fairly modest. We've already provided a briefdescription of the current set of enrollment fees and other aspects of
13

the underlying health care plan under Prime or Standard/Extra.Only retirees currently pay enrollment fees, which are relatively mod-est: $230 or $460 (for a family) for Prime. We'll describe our pro-posed fee structure shortly. We still will impose no fees on the familymembers of active duty personnel. Realistically, we felt that it wouldbe too much of a change from the current system and perhaps toomuch of a hardship on them to do so. Nonetheless, even here, wehaven't made the plan offerings completely open-ended. Thereshould be some limits if the system is to be affordable for DOD.
The last cost we'll discuss concerns the potential effect on readiness.Raising fees and limiting access may well decrease the population ofbeneficiaries who had been using the MTFs. Providing space-availablecare, with all of the negative effects on managing both the system andbeneficiary health care, does provide many patients and, therefore,workload, for physicians and other providers. We need to examine,first, whether there is any reduction in population and, second, theextent to which the reduction would mean that there would be insuf-ficient workload for military physicians.5
5. We don't want to ignore the effects on other providers or on graduatemedical education. We just felt that we needed to start with the fullytrained physicians. More work would be needed to expand the scope ofexamining the readiness effects to everyone in the system.
14

Specifying enrollment optionsIn this section, we describe the options that we've considered in ouranalysis. The next section describes the method or set of "rules" weused in determining how many beneficiaries would enroll in eachoption, and the final section presents our estimates of the numbers ofenrollees and the implications of the changes in enrollment for theDHP with regard to cost and readiness.
ConsiderationsWe considered a number of factors when determining the options forenrollment. We began with the benefit design of the current system.At present, only retirees under 65 pay any enrollment fee to partici-pate in Prime. Other than at a few limited demonstration sites, theover-65 retirees can't join Prime at all nor can they use TRICAREStandard/Extra. We should also point out that, with few exceptions,our focus on costs within a plan is limited to the premium or enroll-ment fee; we didn't redesign the deductibles or copays. We recognizethat these may be contentious—many beneficiaries don't like payingfees at network providers—but other than one proposed plan thatwe'll describe, we felt that later work could focus on changing deduct-ibles and copays.
Although imposing mandatory enrollment is a major change, wewanted to suggest changes that we felt were not entirely outside thescope of what one observes in other standard employer-providedplans. Furthermore, we wanted to design plans that could potentiallyinclude the 65+ population. In [1], we showed that the DOD healthcare benefit is a rich one, but there are some problems. The value ofthe retiree health care benefit is somewhat less than that offered tofederal civilians under FEHBP or by private sector firms to their work-ers. The main reason for the difference is the reduction in benefitswhen retirees reach their 65th birthday. Therefore, we felt from the
15

beginning that imposing fees on retirees under 65, while clearly a lossin the benefit, could be "made up" in whole or at least in part if thebeneficiaries knew they wouldn't entirely lose the benefit when theyreach 65.
Of course, the over-65 population is an expensive group to cover,especially when Medicare doesn't pay part of the bill. Most plans,including most FEHB and private sector plans, can keep costs downfor this group only if Medicare becomes the first payor. Otherwise,their costs can be as much as 3.5 times that of the average beneficiary.
We based the proposed "plans" on what we had heard senior DODleaders had proposed as possible alternatives, including our sponsor,the USD. For example, one proposed plan focused exclusively onretirees under 65, but wanted to make Prime more appealing by low-ering its enrollment fee from $230 per beneficiary to $150 (or from$460 to $300 per family). The USD specifically asked that we examineFEHBP in our comparison of benefits, and we wanted to continue theanalysis by allowing it to be an option in this analysis.
Another consideration was that we wanted to ensure that beneficia-ries would "stick" with the plan. If the enrollment fees are too low,anyone can sign up, but enrollees could never or only episodically usethe services. In that sense, it would be like space-available care andwould do little to improve the problems the system faces withoutenrollment. By "imposing" fees that are roughly in line with low-costplans elsewhere, we believe that the beneficiary would still be receiv-ing a reasonable health care plan at reasonable cost. Some may leavethe system, but at least they had the option to join. And that would,in some cases, include the 65+ population, whose members can usethe MHS only if they reside near an MTF.
Finally, we wanted to design plans that would benefit not only thosenear an MTF. The plans we'll suggest, because they are similar to whatexists today or are commonly requested by beneficiary groups, wouldhelp those in and out of catchment, although beneficiaries may wellrespond differently depending on where they live. We believe ourplans come close to the notion of providing a universal benefit thatmay not suit some beneficiaries, but would at least provide them withoptions. The question is whether the costs outweigh the benefits.
16

Option 1—Changes to Prime and Extra onlyThe first plan was designed to affect the under-65 retiree only and isthe most limited in the kinds of changes to be imposed. Because ofthat as well as the fact that it was under active consideration for awhile, it seemed like a good place to start. As we'll see, our otheroptions would affect all non-active-duty beneficiaries.
Under option 1, the under-65 retirees would have the choice ofenrolling in Prime, enrolling in a redesigned Extra, or choosing noenrollment, but having the option of using a redesigned Standard.Table 3 presents the changes in the system. This plan does not imposeuniversal enrollment, even for young retirees, because they couldremain in TRICARE Standard at no cost. Those in Standard wouldstill face a $150 individual deductible or $300 family deductible, with30 percent copays and less choice of providers, but the notion wasthat if beneficiaries wanted to participate in a "free" plan, they wouldhave one. Of course, it would only be free if they used no health care,because of the relatively high deductibles and copays.
Table 3. Plan design for option 1
Enrollment fee
Deductible
Copays
Prime$150/individualor $300/famiiy
None
None at MTF,same as today if
use network
Extra$150/individual or
$300/familyNone
20% of negotiatedfees in network, 25%
out of network
Standard$0
$150/individualor $300/family
30% copays, mustuse network if
possible
Those retirees who participate in Prime would pay $150 per person($300 per family), which is lower than the fees today ($230 and $460,respectively). Extra would be redesigned. Beneficiaries would have topay an enrollment fee as shown in the table, comparable to Prime,and the deductible would be waived. Extra enrollees would be able toto use network providers and pay 20 percent of negotiated fees or usenon-network providers and pay 25 percent of allowable charges. Theidea is to make Prime the most appealing option but leave in placethe no-cost and no-enrollment option—Standard. But those in Extra
17

must now enroll. Thus, as we said, this plan represents a limitedenrollment plan, but it will be useful as a starting point in our analysis.
Option 2—Prime and TRICARE Standard/Extra with feesThe next plan also starts with the current system, but now imposesmandatory enrollment. There are no major redesigns of plans asthere are in option 1. The only thing we've changed from the presentsystem is the introduction of enrollment fees for retirees. The optionaffects all three beneficiary categories (other than active duty who areall enrolled in Prime). Although we impose enrollment even onactive duty family members, we should point out that in this plan, aswell as the last option, we will not impose any enrollment fees orpremiums.
Table 4 presents the changes in the enrollment fees and options avail-able. There are more significant changes for the retiree population.Because the under- and over-65 retirees face different options now,
/?
let's first focus on the effects for the under-65 retirees. The planimposes a higher fee on Prime—$400 per person—than they facetoday. The increase is fairly small, about $15 per month, and is wellbelow most civilian-sector HMO plan costs (as in FEHBP). Currently,retirees under 65 are eligible to submit claims through TRICAREStandard/Extra, which we've said closely resembles a managed FESplan in the civilian sector. They can continue to use these plans, butnow they must enroll and pay a fee of $650 per person to join. Wecan't really distinguish between those who would prefer a networkand those who wouldn't, so we implicitly assume they join the Stan-dard/Extra "plan."
As we said, we determine how many of the under-65 group would join,how much it would cost DOD (or save compared to the current sys-tem). We realize that, from a political point of view, these costs maymake the program infeasible. But, by then examining what happenswhen the over-65 population joins the program, we felt that the gains
6. For the second and third options, we perform the analysis for each ben-eficiary group separately.
18

in value of the plan here might outweigh the loss due to mandatoryenrollment and higher fees.
Table 4. Eligibility and enrollment fee changes under option 2
Prime Standard/Extra
Eligibility3
Enrollment feesADFMRetirees (all)
IndividualFamily
CurrentADFM and
retirees < 65
$0
$230$460
Option 2All
$0
$400$800
CurrentADFM and
retirees < 65
$0
$0$0
Option 2All
$0
$650$1,300
a. Currently, the over-65 retiree with very few exceptions can't join Prime or use Stan-dard/Extra.
Option 3—Offering FEHB to beneficiariesThe last option is to offer participation in FEHBP to non-active-dutybeneficiaries. Because of many similarities between the kinds of plansoffered under FEHBP and TRICARE Standard/Extra, there would belittle advantage to assuming that both plans are available. FEHBPoffers many different plans with different sets of benefits and fees.
If options 2 and 3 are so similar, wouldn't we project similar numbersof enrollment? The simple answer is that the numbers will be similar;because of our method and assumptions, however, there are somesubtle differences. We rely on beneficiaries' stated satisfaction withtheir current plan to determine who would join or leave their currentplan. Based on responses to survey questions by beneficiaries whonow rely on TRICARE Standard/Extra, we use this information whendetermining who would sign up.
Another important issue concerns the cost to the beneficiary of anFEHB plan. We assume there will be differences in plan design for theADFM and retirees. Table 5 summarizes the changes associated withoption 3. We will not limit the number of plans that active duty family
19

members can choose; as today, that will depend mainly on location.We will, however, limit their costs. We will assume in this analysis thatDOD will subsidize the ADFMs by paying up to a set amount that willbuy them a "good" plan that will provide coverage for all dependentfamily members. All other beneficiaries, including the 65+ popula-tion, can join but must pay their share of the premium, just like anyfederal civilian employee.
Table 5. Eligibility and enrollment fee changes under option 3
Prime Standard/Extra FEHB
EligibilityPremiumsADFM
Retirees (all)Individual
Available to all
None
$$400
Unavailable Available to all
Potentially none, butup to set amount
Same as currentfederal civilians
Family $800 Same as currentfederal civilians
We turn next to our discussion of the data and method we used todetermine who would take each plan assumed in the differentoptions.
7. We don't claim our methods are so exact that we can determine differ-ences in enrollments for any plan. FEHBP offers a multitude of choices.Our concept is to have DOD pay for an ADFM's "typical" local HMOplan or provide the cost for a Blue Cross/Blue Shield standard optionplan, not one of the "gold-plated" plans that could cost several thousanddollars more. The standard option provides good care at a fairly reason-able cost: for 2000, a federal civilian contributes less than $800 for anindividual plan and a little more than $1,700 for a family plan.
20

Method
Data
We've just described the enrollment options that we assumed for pur-poses of this analysis. In this section, we provide additional details on:
• Data sources
• How we used the information from survey responses to deter-mine DOD beneficiaries'
— Insurance holdings or participation in specific health careplans (including Prime and Standard/Extra)
— Stated desire to disenroll or enroll in Prime in the future
— Source of health care services, i.e., military or civilian
• Specific rules for projecting enrollment, for each group.
The main source of information was the OASD/HA survey of DODbeneficiaries. The survey is sent out annually to a sample of beneficia-ries and asks them to respond to a series of questions concerning
• Their use of health care services over the past year
• Whether they received care in military or civilian facilities
• Their holdings of insurance, both private and Medicare
• Their satisfaction and overall ratings of the health care theyreceive
• Their personal characteristics, including age, sex, race, andeducation.
CNA has used earlier versions of the survey many times before. Aspart of the tasking for USD, our earlier paper [1] relied on the 1997survey of DOD beneficiaries, as well as a similar survey of federal
21

civilian employees, to compare satisfaction levels between DOD andfederal civilian beneficiaries.
For this analysis, we've relied on the 1998 survey. In general, all of thesurveys ask fairly detailed questions on the types of health care insur-ance held by the beneficiaries. Unlike the 1997 survey that asked ben-eficiaries who paid for their insurance (e.g., their employer orthemselves), the 1998 survey did not, but it did include several other-questions that helped in our determination of who would enroll ineach plan.
The survey contains a lot of useful information about the beneficiarypopulation, but contains little if anything on how people respond tochanges in enrollment fees. Therefore, we used a second source ofinformation—the findings from a civilian study that analyzed the sen-sitivity of consumers to changes in health care premiums [3]. Thestudy examined the effects when the University of California (UC)moved to a policy of limiting its contribution to the cost of the leastexpensive plan that they offer their employees, which meant thatOOP premiums increased for roughly one-third of them. Theauthors' results (derived from estimating the sensitivity of the UCbeneficiaries to this price increase) showed a strong response. Indi-viduals facing premium increases of less than $10 per month, whichin today's dollars would be close to the change in the Prime premi-ums we're assuming (about $15/month), were roughly 5 times aslikely to switch plans as those whose premiums remained constant.We incorporated this kind of information into our enrollment model.
General approachWe realize that there is no perfect way to predict who would remainin Prime or Standard or leave the system entirely, given the largechanges in the system that we've assumed. Nonetheless, our approachis one that we used recently to predict the participation rates of DODbeneficiaries to proposed changes in their health care benefit. Forexample, in [4], we used the survey to help determine the number ofMedicare-eligible beneficiaries who would take advantage of anexpanded national mail order pharmacy program. Even closer inconcept to the current study was the analysis of how many of thesebeneficiaries would participate if DOD offered FEHBP.
22

We take a similar approach here. DOD beneficiaries often have addi-tional health care alternatives besides the DHP. Family members andretirees who work may have coverage provided by their employer. The65+ population has access to Medicare. It's important to take note ofthese alternatives because they will directly influence how they react tochanges in the benefit offered. For example, according to the survey,most 65+ beneficiaries have some sort of health care insurance thatthey pay for themselves, which in the majority of cases means a Medi-gap plan. These plans are usually at least as expensive as a typical FEHBplan and don't cover as many services (e.g., pharmacy is only coveredby a few and very expensive Medigap plans). Therefore, we wouldargue that, over the long run, as the "new" policy of offering FEHBP isput in place and both insurance firms and beneficiaries see the plan ispermanent, the beneficiaries would realize they would be much betteroff signing up for FEHBP than paying for a Medigap plan.
Grouping beneficiaries by health plan participationWe begin by sorting the beneficiaries into mutually exclusive groups.For the ADFMs and retirees, we group them as follows:
• Prime members
• Primary insurance holders (as opposed to those with supple-mental insurance, such as CHAMPUS supplemental)
• FEHBP policyholders
• Standard users—based on responses that imply that the benefi-ciary relied on Standard/Extra but did not usually use a pro-vider in the network
We believe many of the current problems with the FEHBP demonstra-tion, in terms of low participation rate, results from the transitorynature of the demonstration itself. Three years is probably insufficientfor the beneficiaries and the insurance firms to feel confident that anyunexpected costs or other problems could be dealt with. Here, weassume that there are no transitional issues and that any given optionhas been available long enough to have reached a "steady state."
23

• Extra users—based on responses that imply that the beneficiaryrelied on Standard/Extra, but did usually use a networkprovider
• Others—those who don't meet any of the foregoing criteria.
Because these are mutually exclusive categories, beneficiaries that weput in the Standard group did not have some other form of primaryinsurance. In other words, they did not have a plan through theiremployer nor did they purchase one on their own. Those who are inthe primary insurance group may have submitted a claim throughTRICARE Standard, but at most TRICARE would be a second payor.The other category represents those who, for some reason, either paidfor health care on their own and/or relied on space-available care.Where are the other space-available users? In fact, they are in all ofthe categories, with the exception of Prime members. Later in thepaper, we calculate just how much space-available care there is in thesystem today, in terms of full-time equivalent users.
Because the 65 and older beneficiaries often rely on Medicare supple-mental plans (i.e., Medigap plans), we created two distinct categoriesrepresenting for the 65+ insurance holders—those with a primaryinsurance plan only and those with at least a Medigap supplementalplan (i.e., they might have only a Medigap plan or a Medigap andsome other plan). The survey asks first about supplemental insuranceholdings (and explicitly asks about Medigap holdings) and follows
9. Another group in this and several of the other categories are those whohad no health care costs during the year. Enrollees in a plan, includingPrime, are still considered users even if they did not consume healthcare services (it's a small group anyway, at most 1 or 2 percent). But,because submission of a claim is the only way we can identify Standard/Extra users, there are, by definition, no non-users of health care servicesin these groups.
24

with a question about other insurance or managed care plans thatwould cover them.
Thus, the categories for the Medicare-eligible population include:
• Prime members
• Supplemental plan holders, including those with multipleinsurance holdings
• Primary insurance holders only
• FEHBP policyholders
• Medicare-HMO participants
• Others.
Neither Standard nor Extra is an option for the Medicare-eligiblebeneficiaries (which means that, other than the few Prime enrollees,all users are space-available users). Also, note that we adjusted theresponses to the question asking if they were enrolled in Prime. TRI-CARE Senior Prime is a new program with relatively few participants.Yet, the number of Medicare-eligibles who say they are enrolled inPrime is much higher than the number enrolled in Senior Prime.Therefore, we adjusted the Prime group by using another questionthat asked whether, over the past year, they had received most of theircare from Prime or Senior Prime. The combination of the two ques-tions put the numbers derived from the survey much closer to theadministrative numbers.
Responses on planned enrollment and disenrollmentFor each of these groups, representing their enrollment in Prime orparticipation in some other health plan, the next step was to use the
10. Based on the 1997 survey, more than 90 percent of DOD 65+ beneficia-ries said they had Medicare, parts A and B, but the 1998 survey suggeststhat the number had fallen to the mid-80-percent range. We believe thenumber is closer to the 1997 value, but the lower 1998 number may bethe result of the way the question on insurance was asked. Wheneverpossible, we've "adjusted" the responses by taking into account relatedquestions.
25

survey to determine whether those in Prime planned to reenroll andwhether those not currently in Prime planned to enroll later. Weshould point out that the responses we'll describe were useful forADFMs and retirees under 65, but not for the 65+ group because oftheir low current enrollment and the general unavailability of Prime(with the exception, as we said earlier, of a few specific sites).
Prime enrollees were split into three groups: (1) those who werelikely or very likely to reenroll, (2) those who were neither likely norunlikely or did not know (which we called the don't knows), and (3)those who were unlikely or very unlikely to reenroll. Similarly, thosewho were not currently enrolled were split into (1) those very unlikelyor unlikely to enroll, (2) those who were neither likely nor unlikelyand the not-sures (again, the don't-know group), and (3) those whowere likely or very likely to enroll.
Creating categories representing the source of careThe last major categorization had to do with where DOD beneficia-ries received their care and whether they were satisfied with it. Again,this is similar to what we had done in [4], but we've now added thebeneficiaries' satisfaction into the analysis.
Here, we used the survey to determine, first, whether the beneficiaryused any health care services. In general, we could determine wherethey received care because the survey asks them whether they havebeen to a military provider or facility over the past year as well aswhether they have been to a civilian provider or facility. Beneficiarieswho responded negatively to each of these questions were character-ized as not having used any health care services over the year. Thenumbers were small—-just a few percent.
We then broke out those who usually went to military facilities fortheir care from those who usually went to civilian facilities. Not sur-prisingly, those in catchment are far more likely to use the MTFs thanthose who reside out of catchment. We broke them down further intothose who agreed or strongly agreed with the statement that theywere satisfied with the care they received from those who disagreedor strongly disagreed. For the ADFMs and retirees under 65, our lastcategory was simply civilian users. Therefore, we created four groups
26

for all under-65 beneficiaries—no health care, satisfied military users,dissatisfied military users, and civilian users.
Because the Medicare-eligible beneficiaries in general are not eligiblefor Prime, we couldn't rely on questions concerning whether theyplanned to enroll in or disenroll from Prime. As an alternative, we feltthat it was useful to incorporate what they thought of their currentsource of care, which was usually in the civilian sector. So, weexpanded the categories of civilian users into those who were satisfiedfrom those who were not. This gave us five categories representingthe sources of care—the first three being the same as the under-65beneficiaries, and the two additional ones for civilian users.
Designing the rules for projecting enrollmentIn this section, we present the model that we used to derive enroll-ment for the three options. The models are really a set of rules thatwe used to project enrollment. In all cases, we begin with the benefi-ciary categories—ADFM, retirees under 65, and those over 65—andthen categorize them, as shown earlier, by their plan type or insur-ance holdings. As noted, we do this separately for those in and out ofcatchment because of the differences one would expect in type ofplan relied on for care.
Next, we create a "matrix" for each group. As an example, for thosealready in Prime, the rows of the matrix represent, respectively, thebeneficiaries who plan to reenroll, the beneficiaries who don't knowwhat they will do, and the beneficiaries who plan not to reenroll. Thecolumns represent their sources of care. There are analogous matri-ces for each of the non-Prime groups. Although there are too manycases to describe them all in detail here, we will present some exam-ples to illustrate our method.
Rules for projecting enrollment in option 1We'll begin with option 1, which would affect only retirees under 65.Remember that the plan included a lower enrollment fee for Primemembers and no fee for those who do not wish to enroll but stay inStandard, though they would face a large deductible and higher
2V

copays. The plan also allows enrolling in Extra, but beneficiarieswould have to pay $150 for an individual plan or $300 for a familyplan.
Current Prime enrollees
Table 6 presents the matrix that we derived from the survey for Primeenrollees only. We created similar matrices for each non-Prime groupas well. Here, the first cell in the upper left-hand corner shows thepercentage of Prime enrollees who plan to reenroll, but had no visitsto health care providers or facilities over the past year. The percent-age is small, about 1.44 percent of all Prime enrollees. The largestpercentage is given by those Prime members who were satisfied withthe MTF and plan to reenroll—almost 53 percent of Prime enrolleesfell into this category.
Table 6. Matrix for current Prime retirees under 65 (percentages)
No health Military user Military user Civiliancare satisfied dissatisfied user Total
Plan to reenrollDon't knowPlan to disenrollTotal
1.440.230.081.74
52.566.012.60
61.17
6.432.681.63
10.74
20.133.962.26
26.35
80.5612.67
6.57100.0
The last row and last column show the totals for that specific columnand row, respectively. For example, almost 81 percent of all Primebeneficiaries plan to reenroll, almost 13 percent don't know, and alittle more than 6 percent plan to disenroll. Of the users of militaryfacilities, 61 percent were satisfied with the care they received and 11percent were not.
Does the matrix alone tell us what they plan to do? No, because theirresponses were based on the current system, not how the systemwould change under option 1. Yet, we use the information in thematrix to project what would happen under the new option.
This is where we define the rules that place beneficiaries in their newcategories. We'll continue to use table 6 to illustrate how we did this.For the Prime members, we assumed that all of those in the first two
28

rows would reenroll. These two rows represent those who plan to reen-roll or those who stated they didn't know if they would. Option 1lowers the price they would have to pay, from $230 to $150. With space-available care no longer an option, we've assumed that their onlyother choice to stay within the system is to pay as much for Extra ordisenroll and plan on using Standard when health care expenses arise.
Would all of them really stay? How about those who weren't happywith the care they received at MTFs? One option for this group is tostay with Prime but to enroll with network providers. Of course, ourassumptions here may be too strong; some might leave, but there's noway we can be absolutely sure. Our goal is (l)to get the numbersapproximately right and (2) to design a set of rules whose underlyingassumptions can be changed so that new values can be easily obtainedas a way of checking whether our projections or estimates are "in theballpark."
Let's complete the look at current Prime enrollees by focusing onthose in the last row—those who plan to disenroll from Prime. Heretheir current source of care matters. We assumed that those with norecent health care costs, representing low users of health care,wouldn't want to pay an enrollment fee. They would disenroll fromPrime and rely on Standard. That way, they don't pay anything if theyare really healthy. Next, we assume that those who were satisfied withthe care they received at MTFs would reenroll after all. Again, theprice has been reduced and they can't use space-available care any-more. Finally, for those dissatisfied with the care they received or whohad used civilian sources, we check to see if they had other insurance,including FEHBP (as a small proportion of Prime users do). Weassume that that those who did have insurance would leave the systemand those without insurance would reenroll in Prime.11
11. Isn't it possible they would join Extra or Standard? Again, some might,but in general we assumed that Prime would be their first choice. Aswe'll see, this won't affect our estimate of the costs (because we can'treally disentangle the cost of Prime from what it costs DOD to pay claimsthrough Standard or Extra) and we felt that it was reasonable to assumethat they would stay with Prime.
29

Non-Prime users
Thus far, we've covered only the first group, or current Prime enroll-ees. That leaves similar sets of rules for determining what the othergroups would do. We assumed that the beneficiaries in all non-Primegroups who planned to enroll in Prime would do so. That leaves thosewho didn't state whether they would enroll or stated that they werelikely not to enroll.
We assumed that those with primary insurance, FEHB, or Standardbehaved in a similar manner. Those who do not plan enjoining Primewould stay with their own insurance. Those who don't know whetherthey would join Prime were a bit more complicated. We assumed thatabout 25 percent, roughly the percentage who according to [3] wouldleave their plan for a $10 per month reduction elsewhere, would takePrime, but the remaining 75 percent would continue to use their owninsurance or remain with the Standard option.
It was a little more complicated for the Extra users. Those who werenot going to join or didn't know whether they would, but who weresatisfied with the MTF, were assumed to join Prime. If, however, theywere dissatisfied with the MTF or used civilian facilities, we assumedthat about one-third would join Prime, one-quarter would move tothe no-fee Standard option, and the rest would enroll in Extra, paythe fee, and have no deductible and lower copays.
The final group were those we characterized as the other category. Weassumed that the remaining beneficiaries, in the won't-enroll ordon't-know categories, would join either Prime or Standard (specifi-cally one-third would join Prime, the rest would not enroll and relyon Standard).
Rules for projecting enrollment in option 2Option 2 was assumed to affect all three beneficary groups, not justthe under-65 retirees. In options 2 and 3, we derived enrollment sep-arately for the three groups. One complication that could affect thebeneficiaries' response is whether retirees under 65 would stay withthe system to ensure they could remain when they reach 65. That may
30

be a rational response, but we had no way of incorporating that kindof behavior in our model.12
We won't provide all of the details for each beneficiary group,although we will provide a broad overview of how we determinedwhat each group would do.13 The rules were designed to capturewhat each group, in and out of catchment, would do if faced with theloss of space-available care, a slightly higher charge for Prime, and acharge for enrolling in Standard/Extra. For the latter, we really didn'tredesign the benefit, in terms of changing deductibles and copaysfrom today, but we assumed that beneficiaries could still take advan-tage of the network under Extra if they so desired.
Active duty family members
For the ADFMs, we assumed no enrollment fee, so most, as now, willstay with the system. The only real change is that they need to statewhat they plan to do and can't fall back on space-available care. As inoption 1, we relied on the combination of responses concerningwhether they planned to enroll or disenroll and their current sourceof care (and satisfaction with the use of military facilities). But, wealso incorporated some additional information that we didn't use inthe previous option for the retirees. As an example, let's focus onnon-Prime family members who fell in the primary insurance orFEHB groups. We now also included information on those beneficia-ries who had a CHAMPUS supplemental policy. We assumed thatthose who did have such a policy and were not planning to join Primeand were dissatisfied with the MTF would join Standard/Extra. Thosewithout such a policy would enroll in Prime.
12. Note that we have implicitly assumed that retirees would have to adhereto other rules dictating when they would be eligible for any benefit. Inother words, they can't leave the system and years later try to rejoin it.Under FEHB, for example, federal civilian employees who retire canopt for FEHB then, but if they don't sign up, they lose eligibility.
13. Given the two options and three beneficiary groups, both in and out ofcatchment, providing the complete description of all models or rules(even in an appendix) would result in excessive detail. We will be happyto provide any interested readers with the complete sets of models orrules that we used.
31

Another variable that we used to project enrollment for currentADFM Standard/Extra users was how they rated it. The notion hereis that if they gave it a high enough rating (at least a 6 on a 10-pointscale, with 10 the highest), they would be willing to enroll in it. But,those who rated it poorly would not and would join Prime.
In this way, we developed our set of rules for all of the categories wedescribed earlier. Based on our assumptions, only those with otherinsurance, including FEHB, might leave the system. The otherswould either choose Prime or Standard/Extra. The model, or set ofrules, we assume simply suggests the circumstances under which theydecide to do so.
Retirees
Analogously, we developed projections for retirees, but both thoseunder and over 65 would have to pay for Prime or Standard/Extra.Even with the enrollment fees, the plans still represent "good" dealsfrom the purely monetary point of view, especially for the over-65group. Almost any insurance they have, other than Medicare, wouldsurely cost them more than even the $650 per person for Standard/Extra (exceptions being employer-provided plans in which theirshare is less than the cost of Prime or Standard/Extra or MedicareHMO plans).
The rules were designed to take note of the differences between thetwo retiree groups as well as their differences from ADFMs. Membersof the 65+ group are large consumers of health care, although theydo have Medicare to help defray some of the costs. In fact, we'veassumed that those currently in Medicare HMOs, which usually paymost if not all health care costs, would all stay with them.
One important question is the role of Medicare in defraying some ofthe costs of other programs, as under Medicare subvention. HavingMedicare be a first payor would have a huge effect on the costs of the
14. We did not want to assume that any DOD beneficiaries would ever buyinsurance or take advantage of employer-provided insurance if there'sno evidence that they do so now. For ADFMs, even if they decide not toenroll in Prime, they can always rely on Standard/Extra.
32

program. We've assumed it wouldn't affect what the beneficiariesthemselves plan on doing (as we've designed the rules), but clearly itaffects the costs of the program and therefore feasibility to DOD.We'll discuss this and the costs in a later section.
The rules we designed for both groups were somewhat similar tothose for ADFMs. We should note one difference, however. Mostfamily members live in catchment and, therefore, have relatively easyaccess to Prime. We recognize that, for those active duty and theirfamily members who live out of catchment, access to the MTFs maywell be limited. But, the numbers are fairly small and, for purposes ofthis analysis, we assumed that it wouldn't really be an issue. In otherwords, we used the same rules both in and out catchment.
Compared with ADFMs, a greater percentage of retirees live out ofcatchment. Even with civilian networks, they would probably havemore trouble joining Prime. We didn't know exactly how to quantifyhow many fewer out-of-catchment retirees would join Prime, so wemade a simple assumption. With the exception of the group that saidit would enroll (and presumably had some knowledge that it wouldbe possible), we assumed all others would be only half as likely to joinPrime as those residing in catchment.
Rules for projecting enrollment in option 3
Design of the FEHB option
The last option represents a major change for the DHP. Instead ofoffering an enrollment-based Standard/Extra option, beneficiarieswould be offered FEHBP. In other words, the only alternatives opento beneficiaries would be Prime or participation in FEHBP. Wouldthere be any differences from the way the program works for currentfederal civilians or retirees? The simple answer is no. We assume thatthe choice of plans and cost-sharing arrangements would be the sameas today. Depending on the location, there could be several alterna-tive health care plans from which to choose, with the governmentpaying no more than 75 percent of the total premium. DOD benefi-ciaries have characteristics similar to those of the current FEHB ben-eficiaries, and, despite the recent experience of the FEHBPdemonstration, we wouldn't expect their costs to be that different.
33

Yet, before we turn to our discussion of the rules, we need to say some-thing about ADFMs. As with option 2, we realized that any optionwould be politically feasible only if family member costs were held toa minimum. Therefore, we're assuming that DOD would pay theentire bill. Does that mean that any and all options would be open tothem? Frankly, without any constraints, the system would undoubt-edly cost too much. It may be too costly even with constraints.
Nonetheless, to keep the costs within some sort of bounds, we'veimplicitly assumed that DOD would pay up to a "blended" premiumfor some combination of HMO and a Blue Cross/Blue Shield stan-dard option. The beneficiary may want to purchase a "better" plan,but he or she would have to pay the difference. How much would itcost? Given the cost of an individual-only policy in 2000 and usingKaiser-Permanente of mid-Atlantic to represent a typical HMO, thebeneficiary would pay about $611 per year and DOD would pay about$1,729. A popular alternative is the standard option Blue Cross/BlueShield plan that would cost the beneficiary $781 and DOD $2,050,respectively. Thus, we'll assume the costs to DOD would run some-where between about $2,400 and $2,800 and the implicit "value" tothe beneficiary (for comparison purposes) would be about $700 foran individual plan or slightly above the Standard/Extra cost weassumed under option 2.
Summary of the rules
Let's turn back to the rules we've set up here for the program. ForADFMs, only a few would not take the offer of either Prime or FEHB,and that depends on whether they have other insurance. For the oth-ers, we assumed that those who use the MTFs and were satisfied wouldtend to stay with Prime. Those with little health care utilization, orwho weren't satisfied with the MTFs, or who already used civiliansources for care would sign up for the FEHB program.
For the under-65 retirees, the rules were fairly similar to what weassumed under Standard/Extra, although most FEHBP plans, espe-cially the FFS plans that are usually chosen by FEHB retirees, wouldcost a little more. The only other factor that would lead to significantdifferences would be their current experience with their plan, includ-ing Standard or Extra. With few exceptions, DOD beneficiaries have
34
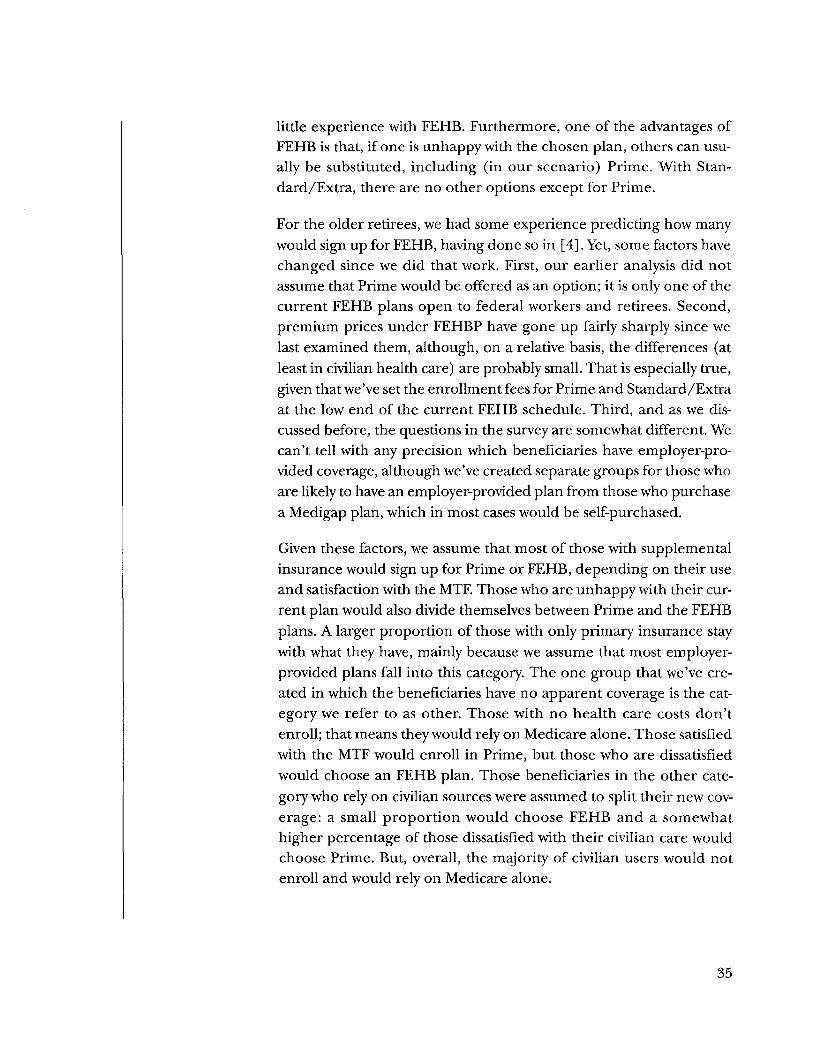
little experience with FEHB. Furthermore, one of the advantages ofFEHB is that, if one is unhappy with the chosen plan, others can usu-ally be substituted, including (in our scenario) Prime. With Stan-dard/Extra, there are no other options except for Prime.
For the older retirees, we had some experience predicting how manywould sign up for FEHB, having done so in [4]. Yet, some factors havechanged since we did that work. First, our earlier analysis did notassume that Prime would be offered as an option; it is only one of thecurrent FEHB plans open to federal workers and retirees. Second,premium prices under FEHBP have gone up fairly sharply since welast examined them, although, on a relative basis, the differences (atleast in civilian health care) are probably small. That is especially true,given that we've set the enrollment fees for Prime and Standard/Extraat the low end of the current FEHB schedule. Third, and as we dis-cussed before, the questions in the survey are somewhat different. Wecan't tell with any precision which beneficiaries have employer-pro-vided coverage, although we've created separate groups for those whoare likely to have an employer-provided plan from those who purchasea Medigap plan, which in most cases would be self-purchased.
Given these factors, we assume that most of those with supplementalinsurance would sign up for Prime or FEHB, depending on their useand satisfaction with the MTF. Those who are unhappy with their cur-rent plan would also divide themselves between Prime and the FEHBplans. A larger proportion of those with only primary insurance staywith what they have, mainly because we assume that most employer-provided plans fall into this category. The one group that we've cre-ated in which the beneficiaries have no apparent coverage is the cat-egory we refer to as other. Those with no health care costs don'tenroll; that means they would rely on Medicare alone. Those satisfiedwith the MTF would enroll in Prime, but those who are dissatisfiedwould choose an FEHB plan. Those beneficiaries in the other cate-gory who rely on civilian sources were assumed to split their new cov-erage: a small proportion would choose FEHB and a somewhathigher percentage of those dissatisfied with their civilian care wouldchoose Prime. But, overall, the majority of civilian users would notenroll and would rely on Medicare alone.
35

THIS PAGE INTENTIONALLY LEFT BLANK

ResultsWe've just discussed the procedures and rules that we used to projectenrollment. In this section, we will show how our assumed changeswould affect the system, in terms of
• The beneficiary population projected to use it after thechanges have taken place
• The effects on DHP costs
• Potential effects on readiness, based on changes in expectedbeneficiary populations.
BaselineBefore we can discuss any implications of the changes, we must startby presenting what the system looks like today. Even here, however,there are numerous factors that must be considered and quantified.One in particular is how many people rely on the system today?Before we can answer that, we need to look at the coverage held byDOD beneficiaries,
Active duty family membersIn making our projections, we began by categorizing beneficiariesinto groups based on their health care plan or insurance holdings.Because the surveys we used covered adults only, we determined thenumbers in each group using the percentages we derived from thesurvey and the number of eligible adults from administrative num-bers provided by OASD/HA. In most cases, the surveys were filled inby beneficiaries in early 1999, but the counts of eligibles and userswere based on information in August 1999. Later, in the sections oncost and readiness, we will extrapolate to cover all beneficiaries, bothadults and children.
37

Table 7 presents the number of eligible beneficiaries in each of ourgroups for ADFMs. The total number of adult family members isabout 780,000. The survey implies that about 68 percent of all in-catchment ADFMs and about 48 percent of the out-of-catchmentpopulation were enrolled in Prime. About 90,000 ADFMs, or about 12percent, relied on Standard or Extra. Only about 65,000 have otherinsurance, including FEHB (a fairly small number, particularly out ofcatchment). After Prime, most ADFMs are in the category we'vereferred to as the other group. There are a total of about 154,000 inthis group, or about 20 percent of the ADFMs. Most of this groupprobably relies on space-available care when they require health care.
Table 7. Adult ADFMs, by plan type (in thousands)
Prime enrolleesPrimary insurance holdersFEHB holdersStandard usersExtra usersOther
Total
In catchment366.4
32.52.7
24.210.3
103.3539.4
Out ofcatchment
116.929.6
0.729.716.450.8
244.1
Total483.3
62.13.4
53.926.7
154.1783.5
All of the non-Prime groups contain beneficiaries who at times go toMTFs for space-available care. Because we want to compare thesystem before and after we impose mandatory enrollment, we needan estimate of how many rely on the MTFs today (which wouldinclude those Prime users who use the MTFs). Based on OASD esti-mates of DHP users, we know the total number who use some combi-nation of care at MTFs or through Standard/Extra; what we don'tknow is how many fall in each category.
15. Although we believe that there would be cost implications from changesin Prime versus the managed care support contracts, we don't believethat at this time we can disentangle these costs. We will instead use thecosts of the entire DHP per person to determine the implications.Nonetheless, for readiness implications, we must determine how manywill use each part of the system.
38

Table 8 presents the percentage of each group that fell into oursource-of-care categories. Here, we've combined two of the categoriesthat we used in our models to project enrollment, namely, the satis-fied and dissatisfied MTF users. We now merge them into the singleMTF category. What's important here is not user satisfaction—onlythat they received the care at the MTF.
Table 8. ADFM sources of care (percentages)
In catchment Out of catchment
Prime enrolleesPrimary insurance
holdersFEHB holdersStandard usersExtra usersOther
Nohealthcare2.32.2
5.00.00.02.8
MTF84.019.6
12.114.214.076.7
Civilian13.778.3
82.985.886.020.5
Nohealthcare1.95.6
0.00.00.06.3
MTF46.7
8.3
46.014.25.1
38.1
Civilian51.486.1
54.085.894.955.6
To estimate the number of civilian Prime and Standard/Extra users,we propose multiplying the percentages of the users who rely on civil-ian sources for care by the number of beneficiaries who fall into eachcategory. This procedure is fairly clear for Standard and Extra users.Any care they receive from civilian providers or facilities is a potentialliability for DOD and does not involve active duty providers. There-fore, we will approximate the number of Standard/Extra users whodon't use the MTFs by multiplying their respective civilian source ofcare percentage by the number of beneficiaries who are users.
We do need, however, to consider Prime beneficiaries who use thecivilian network. The network is particularly important for beneficia-ries who live out of catchment. But, do they receive some of theircare—most likely specialty care—at the MTFs? Clearly, many do, buthow much? As a first approximation, we will assume that the percent-age of Prime enrollees who usually go to civilian (military) facilitiesfor care can be used to proxy the percentage of enrollees using civil-ian (military) facilities.
39

To be more specific, the derivation takes the appropriate row in table 8that lists the source of care for those who were enrolled in Prime andcombines that value with the corresponding values shown in table 7.For example, using the appropriate values from each table implies thatabout 50,000 in-catchment ADFMs (the product of 366,000 and .137)and about 60,000 out-of-catchment ADFMs (the product of .514 and117,000) relied on civilian care under Prime. In similar fashion, we cal-culated that there would be almost 29,000 users of Standard/Extra incatchment and about 41,000 users out of catchment.
Again, why are these numbers important? The reason is simply to pro-vide a starting point for where the system is today. Furthermore, giventhe number of total users and estimates of (1) those in Prime who usu-ally go to MTFs, (2) those in Prime who usually see a network provider,and (3) those who usually rely on TRICARE Standard/Extra, we canthen estimate the number of space-available users as the residual.
The calculation begins with the total user value of 751,611 ADFMusers (both in-and out-of-catchment) and then subtracts the 110,000civilian Prime users and the 70,000 Standard/Extra users to derive anestimate of about 571,000 space-available users. This estimate may beimprecise, but our estimate of today's cost won't really depend on it.For that, we'll simply take the count of total users (and derived byother means from OASD) for that beneficiary group and multiply thevalue by its appropriate cost per user.
The next question is, can we be sure that assuming those who rely ona specific source of care (which really means the survey respondentanswered that they usually used that source for care) is a good proxyfor a full-time equivalent user? Given the system today and the lack oftruly accurate health care utilization data that show how much Primeenrollees use military versus civilian facilities, there is no preciseanswer to this question. For purposes of this analysis, we decided thatthe questions from the survey asking about the beneficiaries' usualsource of care were adequate. We can, however, suggest that anothermethod might be to use questions from the survey that ask the bene-ficiaries about their use of health care services. For example, we cre-ated each beneficiary's utilization weights based on his or her numberof outpatient visits, the number of inpatient days (where each day
40

counts as 10 visits, just to emphasize the relative importance of a hos-pital stay), and the visits to an emergency room (where each visitcounts as two outpatient visits). We constructed these simple weightsto represent a beneficiary's use of MTFs, their use of civilian care paidby TRICARE, and their use of other civilian care (private or govern-ment funded). The three weights sum to 1 and provide a relative useof care within and outside the DHP.
There were some differences for the resulting estimates of space-avail-able and Standard/Extra ADFMs when we compared these numbersto our measure based on the beneficiary's usual source of care. How-ever, the final calculation of space-available care was very similar. We
1 r*did find that there were larger differences for the under-65 retiree.In particular, the utilization measure indicated that some of the civil-ian care received by both ADFMs and retirees whom we characterizeas using Standard or Extra also receive a not insignificant amount ofcare (i.e., anywhere from a few to several percent) from non-TRI-CARE civilian sources (with the larger values for retirees). Thus, wewill tend to overestimate the number of Standard/Extra users in thebaseline.
It's not clear which is the better measure for purposes of determiningthe various categories of users. With refinement, the utilization mea-sures might actually turn out to be superior. We suggest, however, thatfurther study would be needed to ensure that they would be. Our pur-pose was not to keep refining all of the values, but to provide someestimates of what's happening today and what might happen tomor-row under enrollment. For now, we continue to present our estimatesof Prime civilian, TRICARE Standard/Extra, and space-available carebased on our original measure and leave alternative measures, suchas those based on self-reported utilization, to the future. We turn nextto our discussion of the under-65 retiree.
16. There is really no analogous problem of estimating space-available care-for the Medicare-eligible retiree (at least if one accepts the HealthAffairs estimates) because they can enroll in very limited numbers inPrime or use space-available care.
41
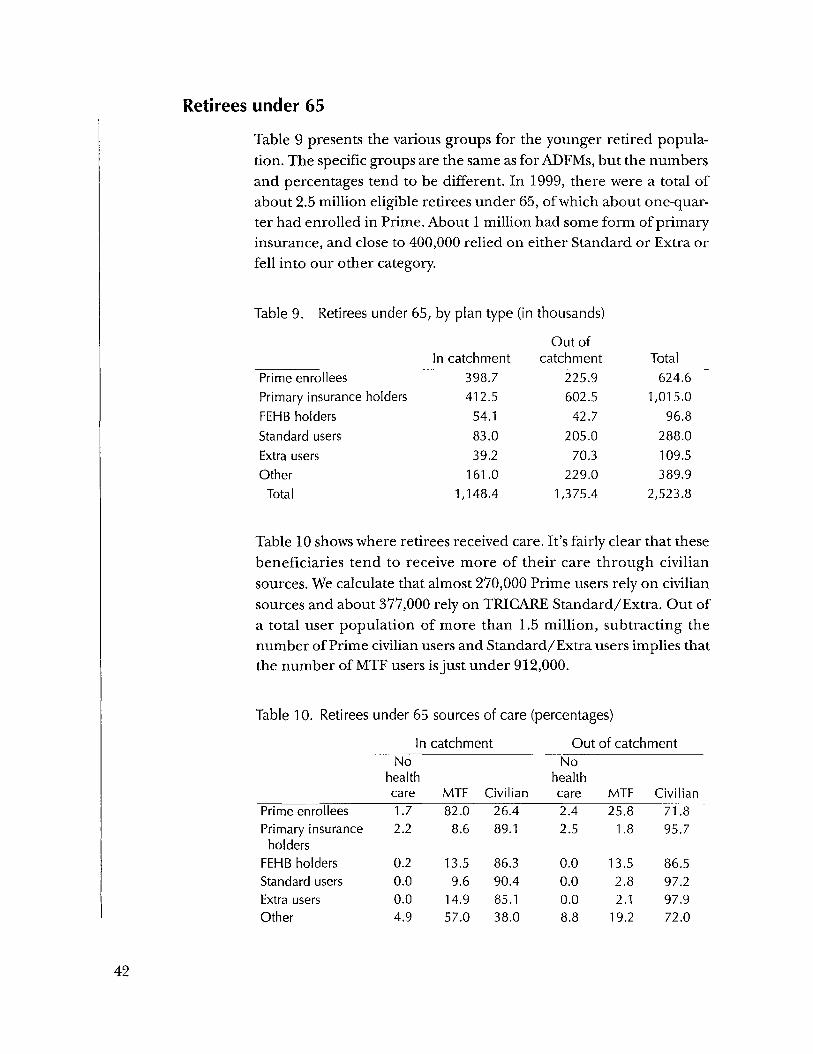
Retirees under 65Table 9 presents the various groups for the younger retired popula-tion. The specific groups are the same as for ADFMs, but the numbersand percentages tend to be different. In 1999, there were a total ofabout 2.5 million eligible retirees under 65, of which about one-quar-ter had enrolled in Prime. About 1 million had some form of primaryinsurance, and close to 400,000 relied on either Standard or Extra orfell into our other category.
Table 9. Retirees under 65, by plan type (in thousands)
Prime enrolleesPrimary insurance holdersFEHB holdersStandard usersExtra usersOther
Total
In catchment398.7412.5
54.183.039.2
161.01,148.4
Out ofcatchment
225.9602.542.7
205.070.3
229.01,375.4
Total624.6
1,015.096.8
288.0109.5389.9
2,523.8
Table 10 shows where retirees received care. It's fairly clear that thesebeneficiaries tend to receive more of their care through civiliansources. We calculate that almost 270,000 Prime users rely on civiliansources and about 377,000 rely on TRICARE Standard/Extra. Out ofa total user population of more than 1.5 million, subtracting thenumber of Prime civilian users and Standard/Extra users implies thatthe number of MTF users is just under 912,000.
Table 10. Retirees under 65 sources of care (percentages)
In catchment Out of catchment
Prime enrolleesPrimary insuranceholders
FEHB holdersStandard usersExtra usersOther
Nohealthcare1.72.2
0.20.00.04.9
MTF82.08.6
13.59.6
14.957.0
Civilian26.489.1
86.390.485.138.0
Nohealthcare2.42.5
0.00.00.08.8
MTF25.8
1.8
13.52.82.1
19.2
Civilian71.895.7
86.597.297.972.0
42

Retirees 65 and older
Medicare-eligibles make up the last beneficiary category. As we indi-cated earlier, with very few exceptions, they are not eligible for Stan-dard or Extra, but we did create two separate insurance groups, aswell as coverage by Medicare-risk HMOs.
Table 11 presents the numbers of these beneficiaries who fall withineach of the groups. Very few of the Medicare-eligible beneficiarieswere enrolled in Prime because of the limitations of the Senior Prime
1 >7
program. Almost two-thirds of the beneficiaries had a supplemental(i.e., Medigap) plan and another 6 percent had another form of pri-mary insurance, very likely through an employer. More than 13 per-cent were in Medicare HMOs, and about 10 percent fell in the othercategory which, for the Medicare-eligibles, really means they reliedon Medicare and/or space-available care at MTFs.
Table 11. Retirees 65 and older, by plan type (in thousands)
Prime enrolleesSupplemental insurance
In catchment25.0
320.1
Out ofcatchment
13.3564.7
Total38.3
884.8holders
Primary insurance only 34.9 49.4 84.3FEHB 42.7 34.8 77.5Medicare HMO 75.0 114.5 189.5Other 53.4 88.0 141.4
Total 551.1 864.7 1,415.8
Because they weren't eligible for Standard/Extra, it becomes straight-forward to count the number of FTE MTF users for this group. Allusers rely on the MTF and their number totals about 343,650. That
17. Even these numbers, particularly out of catchment, seem high. As weindicated earlier, many of the 65+ beneficiaries answer on the surveythat they have enrolled, but administrative records show far fewer. Onepossible explanation is that local MTFs empanel these beneficiaries toprovide them with a source of care; from the point of view of the bene-ficiaries, they are enrolled.
43

means that about one-quarter of the Medicare-eligible populationcurrently relies on the direct care system on a space-available basis.
Quantifying the changes after enrollmentWe'll begin by focusing on the number of beneficiaries who eitherenroll or leave the system under each of the proposed options. Oncewe estimate how the numbers using the system change, we can thendiscuss the effects on cost and readiness.
Expected enrollment under option 1
Table 12 shows our first set of projections, which captures how thesystem would change under option 1. Although we ran the model sep-arately for those retirees under 65 both in and out of catchment,we've aggregated these two sets of values to show the results for allsuch retirees. The table shows that the number of Prime beneficiarieswould increase substantially, by more than 380,000. Prime enrolleeswould rise from about one-quarter of all young retirees to almost 40percent. The total number using Standard would increase substan-tially as well, although this probably overstates its appeal. The numberof Standard users has almost doubled, but much of that probablycomes from individuals who formerly were in the other group. Thisprobably means that when they required care, they used the MTF ona space-available basis. Under option 1, that is no longer possible, sothey either join Prime or they don't enroll, but plan on using Stan-dard. We project that only a relative few would choose Extra, giventhat Standard seems like a lower cost substitute.
Table 12. Option 1 enrollment, by plan type (in thousands)
Croup Current After DifferencePrime enrolleesPrimary insurance holdersFEHB holdersStandard usersExtra usersOther
624.61,015.0
96.8288.0109.5389.9
1,005.3864.7
94.2525.0
34.60.0
380.7-150.3
-1.4237.0-74.9
-389.9
44

Table 13 presents the same results, only now we show how we wouldexpect their use of the system and MTF would change under option1. Both Prime enrollment and Standard show an increase. Prime hasincreased, but it's important to determine whether DOD has more orfewer total beneficiaries relying on the system and whether more orfewer rely on the MTFs for their care. The first question bears impor-tant implications for DOD costs and the second question for militaryhealth care readiness.
Table 13. System and MTF use under option 1 (in thousands)
Croup Retirees under 65
PrimeMTFa
Civilian networkSpace-availableStandardExtraTotal MTF useTotal system use
Current
357.3267.3554.4376.5
911.71,555.5
After
669.5335.7
0525.034.6
669.51,564.9
a. The numbers we report for the MTF include those who reported no health careuse.
The table shows the breakout after the changes have occurred, but weneed to explain how we derived the values. We began by calculatingthe Prime enrollees who use the MTF and those who use the civiliannetwork. We assumed that all in-catchment Prime use would go to theMTF. Might that be too strong an assumption? Perhaps, but it isimportant for the system to recapture as many enrollees as possible,especially when total MTF use is predicted to decline. As for the out-of-catchment values, we realize the difficulty in recapturing workloadfrom individuals who just live too far from military facilities. There-fore, we used the percentage of civilian use today to project use afteroption 2 has been implemented. Even here, it's important to recap-ture as much as possible.
Having calculated the two components of Prime, we then calculatespace-available care as the "residual" value by taking the total number
45

of users less Prime less the civilian portion of Standard/Extra. Totalsystem use includes all Prime enrollees—at MTFs or civilian net-works—space-available care, and Standard/Extra.
Expected enrollment under option 2
Option 1, which we just described, represents a relatively smallchange in the system—only the young retiree was affected, only somemust enroll, and the enrollment fee changes were fairly modest. Per-haps the biggest change was associated in eliminating space-availablecare for this group.
Option 2 assumes many more changes. Here we'll present the resultsin two parts. First, we'll show how each beneficiary category wasaffected by the assumed changes, and then we'll present the totals forthe entire population. Our primary comparison will be to showchanges in the number of beneficiaries who use the system—eitherthrough the direct care system or under the managed care supportcontract—and changes in the number who rely on the MTF.
Projected changes under option 2
Table 14 presents the before and after changes for the three benefi-ciary groups. ADFM enrollment in Prime increases by about 100,000and enrollment of those relying on the combined Standard/Extraincreases by about 70,000. The other group experiences the largestdrop and, in fact, falls to 0. Why? Option 2 assumes universal enroll-ment, but DOD would waive the beneficiaries' enrollment fees forPrime or Standard/Extra. We felt it was reasonable that in time every-one in this group would sign up for something.
Next, we turn to the under-65 retirees. Prime enrollment increases byalmost 400,000, but Standard/Extra decreases by about 23,000. Ofcourse, this is the new more costly Standard/Extra and it's not unrea-sonable that some who used it before would not enroll. The rules weset up allow those who weren't happy with it to drop it, most likely forPrime if they didn't have other insurance. Other beneficiaries as wellcould join Standard/Extra, based on assumptions underlying theirdecision process. In general, Standard/Extra is still a fairly good plan,given that it resembles a managed FFS at a good price. It seems clear
46
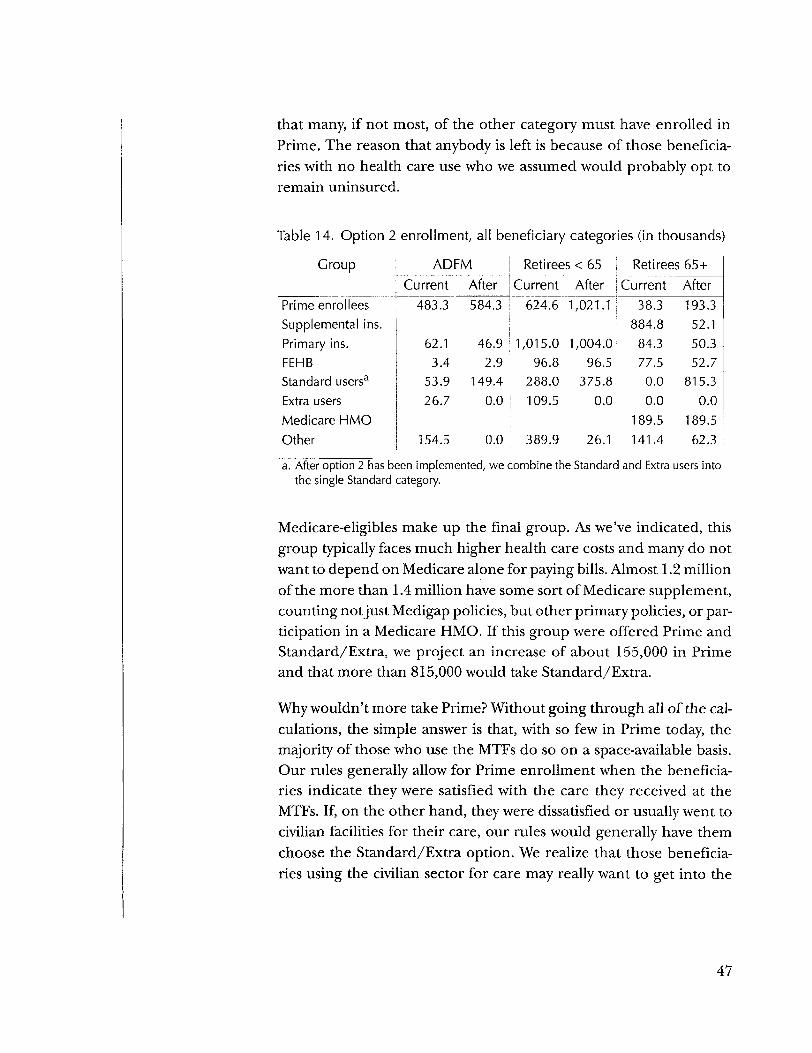
that many, if not most, of the other category must have enrolled inPrime. The reason that anybody is left is because of those beneficia-ries with no health care use who we assumed would probably opt toremain uninsured.
Table 14. Option 2 enrollment, all beneficiary categories (in thousands)
Croup
Prime enrolleesSupplemental ins.Primary ins.FEHBStandard users3
Extra usersMedicare HMO
ADFM RetireesCurrent
483.3
62.13.4
53.926.7
Other 154.5
After Current584.3 I 624.6 1
46.92.9
149.4
1,015.0 196.8
288.00.0 i 109.5
I
I
0.0 389.9
<65After,021.1
,004.096.5
375.80.0
26.1
RetireesCurrent
38.3884.8
84.377.50.00.0
189.5141.4
65+After193.3
52.150.352.7
815.30.0
189.562.3
a. After option 2 has been implemented, we combine the Standard and Extra users intothe single Standard category.
Medicare-eligibles make up the final group. As we've indicated, thisgroup typically faces much higher health care costs and many do notwant to depend on Medicare alone for paying bills. Almost 1.2 millionof the more than 1.4 million have some sort of Medicare supplement,counting notjust Medigap policies, but other primary policies, or par-ticipation in a Medicare HMO. If this group were offered Prime andStandard/Extra, we project an increase of about 155,000 in Primeand that more than 815,000 would take Standard/Extra.
Why wouldn't more take Prime? Without going through all of the cal-culations, the simple answer is that, with so few in Prime today, themajority of those who use the MTFs do so on a space-available basis.Our rules generally allow for Prime enrollment when the beneficia-ries indicate they were satisfied with the care they received at theMTFs. If, on the other hand, they were dissatisfied or usually went tocivilian facilities for their care, our rules would generally have themchoose the Standard/Extra option. We realize that those beneficia-ries using the civilian sector for care may really want to get into the
47

MTFs, but we had. no way of determining that this was the case. If theywere used to civilian care, we assumed they would stay with it.
The effects on system and MTF use under option 2
Table 15 presents how the use of the system and MTFs change afteroption 2 has been implemented. After aggregating across the threebeneficiary categories, the results show that the projected number ofbeneficiaries relying on the DHP will go up, from 2.651 million (adult)users to 3.139 million users, but the increase is entirely the result of theincrease in the Medicare-eligible population of about of 665,000. TheADFM and young retiree population actually falls slightly.
Table 15. System and MTF use under option 2 (in thousands)
Croup
PrimeMTFa
Civilian networkSpace-availableStandard/ExtraTotal MTF useTotal system use
ADFMCurrent
372.9110.4198.470.0
571.3751.7
AfterRetirees
Current
506.0 357.378.3 267.30.0 554.4
149.4506.0733.7
376.5911.7
1,555.5 1
<65After
RetireesCurrent
692.6 38.4328.5 0.0
0.0 305.3375.8 0.0692.6 343.7
,396.9 343.7 1
65+After
193.30.00.0
815.3193.3
,008.6a. The numbers we report for the MTF include those who reported no health care use.
There's a larger decrease in the number of beneficiaries using theMTF, however. According to our calculations, all three beneficiarygroups experience a decline, with the younger retirees experiencingthe most, almost 220,000 fewer FTE users. In total, the decline isalmost 435,000 users, or about 24 percent when compared to the cur-rent user population in the system. Also, we've assumed that all of theMedicare-eligibles who enroll in Prime go to the MTFs. Because most(if not all) came from those who used to go space-available, weassumed they would continue to enroll in Prime there (plus, theMTFs need to keep as many as possible enrolled at the MTFs).
Despite what may appear to be a large decline, there are a few factorsthat would tend to lessen the effect. First, we've already discussed thedifficulties of determining who uses the system today. The method for
48

determining FTE users among those who go to MTFs on a space-avail-able basis may overstate the use of resources required for care. Retir-ees who only use the MTF for their prescription drug purchaseswould not provide the workload for surgeons who need to keep theirskills up to date. Second, we haven't yet added a large group of userswho would be unaffected by any of these potential options, namely,the active duty. There are more than 1.3 million active duty person-nel; assuming they are all MTF users, the actual decline in MTF usefalls by only 14 percent.
Expected enrollment under option 3The third option is similar to the second, but now FEHB replacesStandard/Extra. The role of the managed care support conractorwould certainly be reduced, although we would expect the DHPwould still require contractor help, at least for providing primary carefor Prime enrollees. Nonetheless, this option would entail the great-est change compared to today.
Table 16 presents the before and after results for plan use for this case.The results are fairly similar to the previous case mainly because, aswe've said, Standard/Extra is similar to many of the plans underFEHB. We project that relatively more would take FEHB even thoughit may cost a little more for some of the plans. But, although we intro-duced a price effect into our rules to account for these kinds ofchanges, probably the stronger effect was from beneficiaries satisfac-tion, or lack thereof, with Standard/Extra. One key advantage ofFEHB is the wide variety of plans that we assumed were open to bene-ficiaries. If claims processing or other factors unique to the plan arefound wanting, the beneficiary can often switch to another plan.
Our rules guiding choices indicate that more of the Medicare-eligiblebeneficiary population would take FEHB, when compared to Stan-dard/Extra, and slightly fewer would enroll in Prime. Few have anyexperiences with either FEHB or Standard/Extra. Could we reallymodel their preferences for one over the other? We wouldn't claimthat we could and perhaps slightly more would enroll in Prime thanwe projected. But, we didn't try to "tinker" too much to get reason-able results. We created the model to be flexible so that alternativeassumptions could be tried to gauge how sensitive the results would
49

be to any underlying assumptions. What we believe is most importantis that our results imply that the DHP would attract about 68 percentadditional Medicare-eligibles into the system, either through enroll-ment in Prime or FEHB. This result is very close to our prediction ofa 67-percent rate for FEHB alone in [4].
Table 16. Option 3 enrollment, all beneficiary categories (in thousands)
Group
Prime enrolleesSupplemental ins.Primary ins.FEHBStandard users
ADFMCurrent
483.3
62.13.4
53.9Extra users 26.7Medicare HMOOther 154.5
After548,281
46.9188.0
0.00.0
0.0
RetireesCurrent
624.6
1,015.0 196.8
288.0109.5
389.9
<65After907.2
,004.3586.1
0.0
RetireesCurrent
38.3884.8
84.377.50.0
0.0 i 0.0189.5
26.1 | 141.4
65+After202.2
32.550.3
878.70.00.0
189.562.3
Table 17 presents the effects on the system and MTF use after fullimplementation of option 3. Similar to the results for option 2, theMedicare-eligibles more than outweigh the slight decline in totalsystem users. There is also a slightly greater decline in MTF use, withthe percentage falling by about 16 percent, after including the activeduty population.
Table 17. Option 3 system and MTF use (in thousands)
Group
PrimeMTFa
Civilian networkSpace-availableFEHBb
Total MTF useTotal system use
ADFMCurrent After
372.9 480.7110.4 68.0198.4 0.0
0.0 188.0571.3 480.7751.7 736.7
Retirees < 65Current After
357.3 637.1267.3 270.1554.4 0.0
0.0 586.1911.7 637.1
1,555.5 1,493.3
Retirees 65+Current After
38.4 202.20.0 0.0
305.3 0.00.0 878.7
343.7 202.2342.7 1,080.9
a. The numbers we report for the MTF include those who reported no health care use.b. The FEHB numbers before the change are set to 0 because DOD was not paying for it.
50

Effects on cost
Factors influencing cost calculationsHaving projected the changes in the beneficiaries' use of the systemunder each option, we now turn to the implications for cost andreadiness. We'll begin with the costs, not only those that DOD mustpay, but the enrollment fees paid by the beneficiaries to participate inthe plan.
We had to consider a number of factors before we could perform therequired cost calculations. A short list follows; we'll expand on eachbelow:
• Adding back children into the user counts
• Determining how many individual and family plans would beselected
• Determining the appropriate costs, both within the system—MTF and TRICARE Standard/Extra—and outside—includingMedicare and FEHB premiums.
Adding back the dependent children is important because they, too,are eligible for care and add to the population and costs associatedwith the system. Remember that our projections pertain only toadults because we based the projections on the DOD Survey of adults.The decision to join the various plans or options will be made by theadults, but we still need to calculate all people who might receivehealth care services. We've taken the simplest route, which means wetake the ratio of the entire population, adults and children, to theadult population, for either eligibles or users, depending on whichwas appropriate (the ratios are very close—about 2.5 for ADFM andabout 1.2 for retirees under 65).
It was a little more complicated to determine how many individualand family plans would be chosen. This can be important because notall users would require an individual plan. That would greatly over-state the costs of the plan, especially for the active duty family mem-bers. In our previous work [4], we had used the DOD populationsystem, now the Managed Care Forecasting and Analysis System
51

(MCFAS), to approximate the number of individual plans, based onthe numbers of retirees, dependents of retirees, and survivors. Onefact that simplified the calculation for this group was the lack of anydependent children.
Active duty family members and the younger retirees, however, oftenhave at least one dependent child. For these two groups, we usedinformation from the Defense Manpower Data Center (DMDC), Sep-tember 1997, that showed the marital and family status for active dutypersonnel, by paygrade, both officer and enlisted. To determinewhich ADFMs would likely take an individual or family plan, we usedthe percentage of active duty who fell in the married/no-children cat-egory across all paygrades. That percentage was about 14 percent,which when applied to the ADFM population would give us theapproximate percentage of dependent spouses without any children.Because their spouses are active duty and covered automaticallyunder Prime, these family members would be candidates for individ-ual plans. We assumed that all of the other adults would then take afamily plan because of their dependent children.
For retirees under 65, we had to make an alternative assumption. Onepossibility was to rely on MCFAS, use a similar procedure to what wehad done for the Medicare-eligible population, but then remove alldependent children. To simplify matters, we used the DMDC informa-tion, but relied on the percentage of either single or joint service cou-ples without children for a few of the more senior active duty groups,such as those enlisted E-5 and above and officers O-4 and above.
Table 18 shows the percentages we used for the three beneficiary cat-egories. The percentages of individual plans are close for the ADFMsand young retirees, around 14 or 15 percent, and about 45 percentfor the older retirees.
Table 18. Percentage of adults by plan type
Individual FamilyADFMRetirees under 65Medicare-eligibles
141545
868555
52

What's probably most uncertain is the cost of providing care. Thereare several reasons for this. First, we've already alluded to DOD's notknowing exactly how many people use the system. Second, it's difficultto ensure that we have captured the total costs for delivering directpatient care, and even more difficult to determine the fixed and mar-ginal costs. We would especially like to know the marginal costs todetermine how costs change with "small" changes in population.
In our recent study on the DOD health care benefit, we used informa-tion from OASD/HA to estimate that the total cost to DOD of patientcare in the United States was about $11.77 billion. Given the 5.3 mil-lion estimated users, we derived a cost per user within the DHP ofabout $2,377. That represents the costs of delivering care at the MTFsas well as through TRICARE Standard or Extra. This number remainsa reasonable estimate for all beneficiaries, but we project changes inthe beneficiary mix and we need to estimate the difference in cost bybeneficiary category as well.
In lieu of better data, we use an updated version of the same HealthAffairs information. Table 19 shows these estimates, by beneficiary cat-egory. For each category, we show the estimated cost per user and thenthe total cost of care for that group, based on the estimated number ofusers in that group. Active duty beneficiaries each cost the systemslightly less than $1,400, family members slightly less than $2,000, andthe Medicare-eligibles the most, almost $4,500. With almost 1.9 millionusers, the retirees under 65 cost the DHP the most—almost $5 billion.
Table 19. Costs of health care by beneficiary category, estimates for2000
Beneficiary categoryActive dutyActive duty family memberRetiree under 65Medicare-eligible
Cost/user ($)1,3921,9872,5024,456
Total cost($ billions)
1.8483.7244.7041.531
We use these numbers to represent the cost of care in the MTF or forreimbursement through TRICARE Standard/Extra for the ADFMs
53

and retirees under 65. But, can we use the value shown in the tablefor the Medicare-eligible population? Let's examine their costs in abit more detail. The value in the table is based on the current use ofservices. That's a small amount of Senior Prime and lots of space-avail-able care, including pharmacy-only users who are aggregated up toone FTE.
The questions are, how reasonable are these costs and what should weuse when option 2 offers TRICARE Standard/Extra and option 3offers FEHB to the Medicare-eligible population? Can we projectcosts derived from mainly the MTF to what it will cost under Stan-dard/Extra or FEHB?
It may be instructive to examine the costs of care for the civilian Medi-care-eligible population. From the 1995 Medicare Current Benefi-ciary Survey (MCBS), we projected that the average cost in 1999 forthe non-institutionalized Medicare-eligibles would be about $6,900per person. Medicare pays about $4,000, leaving about $2,900 inuncovered costs ($870 for prescription drugs alone). That's whyMedicare-eligibles buy supplemental plans—to help pay for theuncovered costs.
These numbers may be high because the DOD population, on aver-age, is probably somewhat younger and healthier than the civilianMedicare-eligible population. Actuaries at the Office of PersonnelManagement (OPM) who administer the FEHB program for federalcivilian employees and retirees told us that, in 1998, the average costfor an individual in an HMO plan was very close to today's projectedcost for an ADFM, or about $1,987. For retirees, not all of whom areyet eligible for Medicare, those who have assigned their Medicarerights to their HMO (which simply means that Medicare becomes thefirst payor, not the HMO), the average cost was about $2,366. This isfairly close to the overall average and close to the DOD retiree average.On the other hand, the average for non-Medicare retirees (i.e., thosefor whom FEHB pays all costs) was close to $3,500. This number wouldhave been higher had it included only those over 65, not all retirees.
We recognize that there are a lot of different numbers and withoutthe entire claims file from OPM it's difficult to determine with anyprecision how the costs would differ between retirees under and over
54

65. We use the OPM values to illustrate the difficulty of determiningwhat the DOD Medicare-eligible would cost under our proposedplans. Is the $4,500 from the MTF about right or should we assumethat Medicare will pay first and DOD would act as a second payor?OPM told us that when beneficiaries assign their Medicare rights totheir health care plan, which happens more often for FFS plans thanfor HMOs, the cost of the Medicare-eligible population is close to theaverage for the entire population. Their costs run about 3.5 times ashigh as the average beneficiary, but Medicare pays almost three-quar-ters of the cost. If that's the case, we would argue that the Medicare-eligibles may be expensive, but not necessarily for DOD. If, however,DOD must pay the entire bill, they could be very expensive, particu-larly if their cost is closer to $6,900 than $4,500.
Nonetheless, we will continue to assume that the cost of a Medicare-eligible, whether within the direct care system or under the expandedStandard/Extra plan would cost $4,456 per user. Furthermore, wewill also assume that if Medicare is the first payor, they will pay about58 percent of the cost (the same percentage as in the civilian sector)and DOD would pay essentially the rest (the beneficiaries would stillface the normal deductibles and copays, but these would amount tono more than a few hundred dollars in out-of-pocket costs at most).We will also, however, calculate the costs assuming that DOD mayhave to pay the entire bill if Medicare does not pay its share.
As for FEHB, we will also assume that DOD beneficiaries face the samepremium costs as current federal civilians and retirees. We see noreason why they should be more expensive. They are somewhatyounger than the typical federal retiree over 65 and quite likely at leastas healthy. Most have Medicare, parts A and B, which should helpdefray the costs, because Medicare can become the first payor. But,these are assumptions that may require further analysis at a later date.
Determining the cost by option
Option 1
To determine the costs of option 1, we start with the various catego-ries showing how many received care. Because we don't attempt todisentangle the costs of providing care through Prime, Standard/
55

Extra, or space-available, changes in cost after implementing option1 were entirely the result of the change in the number of beneficiariesusing the system.
Table 20 shows our projected costs currently and with option 1. Asbefore, we estimate the costs of providing care for the young retireesat about $4.7 billion, slightly less after adding the current enrollmentfees.18
Table 20. Costs under option!, retirees under 65 ($ billions)
Current AfterCost of care
MTF + space-availableNetworkStandard/Extra
SubtotalPremiums paid by beneficiariesNet cost to DOD
2.757.808
1.1394.704
.1444.561
2.0251.0151.6924.733
.1564.577
After the implementation of the new plan, the cost of care at the MTFsfalls by more than $700 million, although there is a small increase atthe civilian networks. Option 1 no longer allows retirees to receivespace-available care so total MTF workload goes down. Other costs dochange, however. Because of the enrollment fee, there are very fewExtra users. More beneficiaries rely on Standard: there is no premiumassumed and any cost savings from Extra are relatively small.
In this and the other cases that follow, we want to reiterate that we'vemade the important assumption that the estimated cost per user canbe used to predict how costs change with changes in population. Tothe extent that fixed costs prevent any significant downsizing, thecosts after any option has been assumed may well be higher. But, this
18. We realized when we were computing our estimates of the currentenrollment fees that they may have already been taken into account aspart of the cost per user. But, we wanted to be consistent. If new enroll-ment fees would reduce DOD's cost, we felt that we should reduce thecurrent cost as well.
56

again reaffirms the need for better cost data. Until a more exhaustiveanalysis of the DOD health care system's cost structure is available, webelieve our estimates remain valid.
Option 2
Option 2 affects all three beneficiary categories, and we'll begin withthe ADFMs and retirees under 65. Table 21 shows our projections ofthese costs. There have been some reductions in the cost of Prime,particularly in the portion going to the network. Remember that weassumed that, with no space-available care allowed, should MTF work-load fall in catchment, Prime enrollees would receive all of their careat the MTFs. Standard/Extra costs rise, but overall the total cost ofproviding care falls.
Table 21. Costs under option 2, ADFMs and retirees under 65 ($ billions)
ADFM Retirees under 65
Cost of careMTF + space-availableNetworkStandard/Extra
SubtotalPremiums paid by beneficiariesNet cost to DOD
Current
2.830.547.347
3.724
3.724
After
2.507.388.740
3.635
3.635
Current
2.757.808
1.1394.704
.1444.561
After
2.095.993
1.1364.225
.6953.529
There is a more striking decrease in costs for retirees under 65. Morethan a half million of this group relied on space-available care. Evenwith the increase in Prime, we projected that the overall MTF workloadwill fall and so will cost. In addition, the new fee structure leads to asubstantial increase in the fees paid to DOD, which rise to almost $700million. Thus, MTF workload falls, fees increase, and DHP costs fall.
We present the results for the Medicare-eligibles separately because,as we hope our earlier discussion made clear, there is even moreuncertainty associated with the costs of providing care to this group.Table 22 presents our projected costs, under different assumptionsconcerning the role of Medicare. First, we assume that DOD pays theentire bill for this group and that the bill per user is the $4,456 shown
57

in table 19. Under this scenario, costs rise from about $1.5 billion toalmost $4 billion—a result of the high costs of providing care to somany beneficiaries under Standard/Extra. But, the second scenarioassumes that Medicare becomes the first payor and relieves DOD ofabout 58 percent of the bill. That leaves DOD paying probably lessthan the 42 percent remaining (i.e., less than 42 percent because ofsmall deductibles and copays that must be paid by beneficiaries). Theimportant point is that the cost of care would fall to about $1.8 billionfrom almost $4 billion. We believe this to be the most likely case, butDOD must determine what role Medicare will play.
Table 22. Costs under option 2, Medicare-eligibles ($ billions)
After After____________________Current Case1a Case 2b
Cost of careMTF + space-available 1.531 .861 .861NetworkStandard/Extra 3.633 1.526
Subtotal 1.531 4.494 2.387Premiums paid by beneficiaries 607 .607Net cost to DOD 1.531 3.887 1.780
a. DOD pays the entire bill; no Medicare contribution.b. Medicare is the first payor; its contributions average about 58 percent of the total bill.
Table 23 summarizes the costs for all beneficiaries under the secondoption. We show the total over all three groups, with the various casesbased on alternative assumptions concerning whether Medicare willpay part of the bill. We've also added a third case, the worst-case sce-nario. If the cost of providing care is higher than the $4,456 valuewe've been using, say closer to the $6,900 it costs for the average civil-ian Medicare-eligible, DOD could face as much as an additional $2.5billion in costs. It is important to determine whether Medicare willcontribute to the care of DOD beneficiaries.
58

Table 23. Net DOD costs ($ billions)
__ Net cost of careCurrent 9.816After
Case 1 11.051Case 2 8.944"Worst" case3 13.50
a. Assumes that the true cost of delivering care to thisgroup is close to civilian average.
Option 3
The last case substitutes FEHB for TRICARE Standard/Extra. Notonly did we have to estimate the cost of providing Prime to DODenrollees, but we had to estimate the cost of premiums to DOD andits beneficiaries. In this case, as we've already mentioned, when dis-cussing FEHB, we do not assume that premiums will be higher thanfor current federal civilian workers and retirees. Again, this is impor-tant for the projected costs of the DOD Medicare-eligible population.The costs will be similar only if roughly the same proportion of retir-ees who sign up for FEHB assign their Medicare rights to their insur-ance plan as do current FEHB Medicare-eligibles.
Table 24 shows our projections of costs for option 3. The most expen-sive group under FEHB is the ADFMs. Their cost would go up by about$1.6 billion. As with option 2, we've assumed that they face no premi-ums as long as they accept the subsidized payment of a blended HMOand Blue Cross/Blue Shield (BC/BS) standard option plan. To deter-mine the cost of such a plan, we assumed that about 30 percent wouldchoose the HMO and 70 percent would choose BC/BS. This mirrorsthe current split between HMOs and FFS plans among current FEHBenrollees. Retirees must pay their share of the premiums, which wealso calculate as a blend, but for retirees, we assumed that only 16 per-cent would choose the HMO and the rest would choose the FFS plan(again, mirroring current OPM retirees).
59

Table 24. Costs under option 3, all beneficiary categories ($ billions)
ADFM Retirees under 65 Medicare-eligibles
Cost of careMTF + space-availableNetworkStandard/Extra
SubtotalPremiums paid by DODPrime premiums paid to DODFEHB premiums paid by beneficiariesNet cost to DOD
Current
2.830.547.347
3.724
3.724
After
2.381.337
2.7182.644
5.362
Current
2.757.808
1.1394.704
.144
4.561
After
1.927.817
2.7441.391
.386
.5353.748
Current
1.531
1.531
1.531
After
.901
.9011.886.081.709
2.706
Costs actually fall for the under-65 retirees. We projected that manymore would enroll in Prime than in the current scenario, but otherswho had used Standard/Extra or space-available left the systementirely. Also similar to option 2, fees paid for the increase, but mostof the cost reduction was from lower enrollment.
The final group is the Medicare-eligible beneficiaries. Fewer also relyon the MTFs when compared to today, but under option 3 (as inoption 2) they are enrolled. Their FEHB costs are also high; DODpays almost $1.9 billion in premiums, for a net increase in their coststo DOD of almost $1.2 billion.
Table 25 summarizes the costs for option 3 by presenting the costsaggregated over all beneficiaries. The cost of offering FEHB, togetherwith the other characteristics of the option 3 plan design, would leadto an increase in cost of about $2 billion. As we saw in the last table,the cost of providing all retirees with the plan is not really the reasonfor the added costs. About 80 percent is because of the ADFMsubsidy.
Table 25. Option 3 net DOD costs ($ billions)
Net cost of careCurrent 9.816After 11.816
60

Impact on readinessOur results indicate that the introduction of enrollment as describedin options 2 and 3 would lead to a decrease in the number of individ-uals who would rely on the military's direct care system. This raisesconcerns about whether this decrease would have an adverse effecton military readiness. The three services would like enough workloadwithin the direct care system to keep those physicians who are neededfor wartime care sufficiently busy to enhance their skills.
In this section, we describe the impact of enrollment on the numberof beneficiaries relying on the direct care system. Given the projectedpopulation, we then generate the numbers of physicians, by specialty,that would be necessary to provide patient care within the direct caresystem, currently and under options 2 and 3. Finally, we comparethese numbers with the numbers of physicians the three services musthave in order to maintain military readiness.
Impact on direct care system relianceIn table 26, we present the numbers of beneficiaries who currentlyrely on the direct care system and who we project would rely on thedirect care system under options 2 and 3. We include beneficiariesliving overseas, active duty personnel, active duty family members,and retirees and their dependents and survivors. We include the over-seas beneficiaries because we were not able to determine how manyof the physicians required for readiness purposes are based overseas.We estimate that about 4.7 million beneficiaries currently rely on thedirect care system. If option 2 were adopted, we project that thisnumber would fall by about 12 percent to roughly 4.1 million. Ifoption 3 were adopted, our predictions indicate that it would fall by15 percent to roughly 4 million. Therefore, the loss of workload frommilitary facilities would be fairly significant.
61

Table 26. Impact of enrollment on direct care system reliance (inmillions)
Number of beneficiaries using direct care systemBeneficiary groupOverseasActive dutyActive duty familyRetirees under 65Retirees 65 and olderTotalChange from current
Current.489
1.3281.4381.102
.3444.700N/A
Option 2.489
1.3281.274
.837
.1934.121-12%
Option 3.489
1.3281.210
.770202
3.999- 1 5%
Converting numbers of patients to numbers of physicians
One way of measuring this loss in workload is to convert the numberof patients to the number of different types of physicians this patientbase can support. Most managed care organizations have developedmethods to determine how many physicians are necessary to treat agiven number of patients. One such managed care organization thatresembles the direct care system, in the sense that it is a large groupmodel HMO, is the Kaiser Foundation Health Plan.
We should make it clear that we do not assume that the militaryhealth care system must staff just as Kaiser would. But, the use of Kai-ser's staffing ratios serve as a way of allowing us to compare therequired physicians that a well-respected health care organizationfeels it needs to provide care for a given population. We have usedthese staffing ratios in earlier studies that looked at the optimal allo-cation of the Navy's inventory of physicians across its facilities (see [5]as an example). Here, we use staffing ratios that Kaiser has developedto determine the number of physicians the direct care patient basecan currently support as well as the number it could support underoptions 2 and 3.
The staffing ratios, which are measured as number of physiciansneeded per 100,000 patients, are presented in table 27. We've aggre-gated some of the categories. For example, we combined generalinternal medicine physicians and family practice physicians to comeup with the primary care category. We've also aggregated many of the
62

internal medicine (IM) subspecialties, such as cardiologists and gas-troenterologists, for the IM specialists category.
Table 27. Kaiser Foundation Health Plan staffing ratios
Staffing ratioType of physician (per 100,000 patients)Primary care 40.25Pediatrics 18.68Internal medicine specialists 13.37General surgeons 5.45Orthopedic surgeons 5.82Other surgical specialties 25.82Anesthesiologists 6.36Radiologists and pathologists 8.09Dermatologists 2.94Neurologists 1.87Psychiatrists 5.58Emergency medicine 6.73
The question we were most interested in was whether the populationthat we project to enroll in Prime at the MTFs would support thenumber of physicians required for readiness. Once we have the pop-ulation for all cases and the staffing ratios from Kaiser, it's relativelysimple to project what the care requirements would be. The hardestpart is determining each services' readiness numbers.
Therefore, we requested from each service a list of their fully trainedrequirement that is now calculated as part of the DOD Sizing Model.We recognize that we have chosen to focus only on a small part ofwhat's required for medical readiness. There are physicians who arerequired for training (under what is termed sustainment). We don'tinclude them here. There are other medical specialties, includingnurses, dentists, and many others required for readiness, but wecouldn't examine them all. Our primary goal in this section was tosuggest a method to account for the potential effects on military med-ical readiness requirements, given such large changes in the system aswe've imposed in this analysis.
63

Table 28 presents the projected patient care physician requirementsas well as, in the last column, our calculation for the tri-service readi-ness requirement. This was derived simply by totaling the three ser-vices' individual requirements. The table confirms that the smallerMTF population would reduce the number required for providingpatient care. Primary care physician requirements would fall fromalmost 1,900 to a bit more than 1,600, depending on which optionwas implemented.
Table 28. Projected requirements based on population and readiness
Type of physician Currrent Option 2 Option 3 ReadinessPrimary carePediatricsInternal medicine specialistsGeneral surgeonsOrthopedic surgeonsOther surgical specialtiesAnesthesiologistsRadiologists and pathologistsDermatologistsNeurologistsPsychiatristsEmergency medicine
1,892878628256274
1,21429938013988
262316
1,659770551225240
1,06426233312177
230277
1,610747535233233
1,03225432411875
223269
1,355216119442277457238238
2418
172337
The important question is whether these requirements that are basedon providing peacetime care to a given population, would supportthe number of physicians required for readiness. The answer is no, atleast not for all specialties examined in this analysis. The number ofsuch specialties is small, however. Furthermore, even based on ourcalculation of the current population, there would not be sufficientnumbers of general surgeons and emergency medicine physicians tokeep their skills sufficiently high to be ready for an important contin-gency. The only specialty in which the decrease in population wouldpotentially create a new problem is orthopedic surgery. In all of theother cases but these three, our numbers indicate that options 2 or 3would not create a significant readiness problem.
64

Concluding remarksIn this analysis, we have explored the effects on the DHP if DOD ben-eficiaries had to enroll in specific options that were offered as part oftheir health care benefit. Probably the most significant implication ofuniversal enrollment is that space-available care would not be avail-able to anyone who has not enrolled in Prime.
We examined three specific options. Details were provided in thetext, but we can briefly summarize them as follows:
• Option 1—affects only retirees under 65, who would have theirenrollment fees for Prime reduced, would have to pay anenrollment fee for TRICARE Extra, but could still rely on theno-enrollment, no-fee TRICARE Standard option,
• Option 2—affects all non-active-duty beneficiaries, who wouldfind that they must enroll and pay a fee for Prime, or enroll andpay a somewhat higher fee for TRICARE Standard/Extra ifthey want to stay in the system,
• Option 3—affects all non-active-duty beneficiaries, who wouldfind that they must enroll and pay a fee for Prime, or sign upfor FEHB, the same plan offered to federal civilian employeesand retirees.
Although we realize that these three options may cost beneficiariesmore and certainly do constrain the choices for care that they havecurrently, we believe there are many benefits, including:
• Reduced uncertainty surrounding who receives care, whichwould lead to management efficiencies and the appropriateuse of resources
• Increased emphasis of the DHP focusing on increasing thehealth of its beneficiaries.
65

Our focus has been on developing models that would allow us toproject who and how many would enroll in each plan. The modelswere designed to be fairly easy to run and flexible because there aremany potential alternatives to those examined here. The models alsoallow us to determine how sensitive the results are to changes inunderlying assumptions used in making the projections.
Once we projected enrollments for all three options, we turned toestimating the associated costs that DOD and the beneficiaries wouldhave to pay. We broke out the three beneficiary categories separatelyso that we could determine when the costs were especially large. Animportant question was whether it was affordable to include the DODMedicare-eligible population in our proposed options. Indeed, thatwas one reason for increasing fees for younger retirees—if the coststo DOD were not too high, that might mean that retirees could retainthe benefit when they turn 65.
To summarize what we found:
• All options would lead to increases in Prime enrollments, butthe overall use of the MTF would fall.
• MTF use would drop because the current system has so manyspace-available users, who would be forced to choose amongseveral alternatives, including leaving the system.
— The smallest decrease occurs under option 1, which isn'tsurprising because it involves the smallest set of changesand affects only the young retirees.
— The largest decrease occurs under option 3 (and is onlyslightly larger than option 2). After adding back the activeduty, who would not be affected by the plan, the reductionin overall MTF use would be about 16 percent.
• The number of beneficiaries who would take advantage ofwhat's offered, whether under Prime or an alternative (such asFEHB), is either close to or a bit higher than today. This ismostly the result of large numbers of DOD Medicare-eligiblesjoining the system.
66
• The current cost of providing care to ADFMs and retirees of allages today is just under $10 billion.
— Option 1 would increase this figure slightly.
— Option 2 might actually decrease costs, but this assumesthat Medicare pays a good part of the care for the Medicare-eligible population.
— Option 3 would increase costs by about $2 billion. Most ofthis increase, however, results from our assumption thatDOD would pay much, if not all, of the ADFM premium.
From the outset, we knew that one of the major concerns of policy-makers is how any change to the system could potentially affect thereadiness of military providers. Therefore, we examined how changesin MTF enrollments and use would affect the readiness of militaryphysicians. We found:
• Most specialties, even with the reduced population and result-ing loss in workload, would have sufficient population to keeptheir skill levels where they are today.
• Three specialties would have problems—general and orthope-dic surgery and emergency medicine. But, according to our cal-culations, these three might not have enough of a populationbase even today.
• More work should be done in this area, including focusing onhow the changing mix of the population might cause addi-tional problems and how physicians required for training aswell as other providers would be affected.
To conclude, we believe that more needs to be done to understandwhat might happen when the system changes in a major way. Currentdemonstration projects and surveys provide useful information, butthey tell only part of the story. We believe that we've developed auseful set of models and data from which one could explore theeffects of changes in the benefit offered to DOD beneficiaries. None-theless, this is a complicated area and much of the required data arelacking not only to project the future but to determine what thesystem looks like today.
6V

THIS PAGE INTENTIONALLY LEFT BLANK
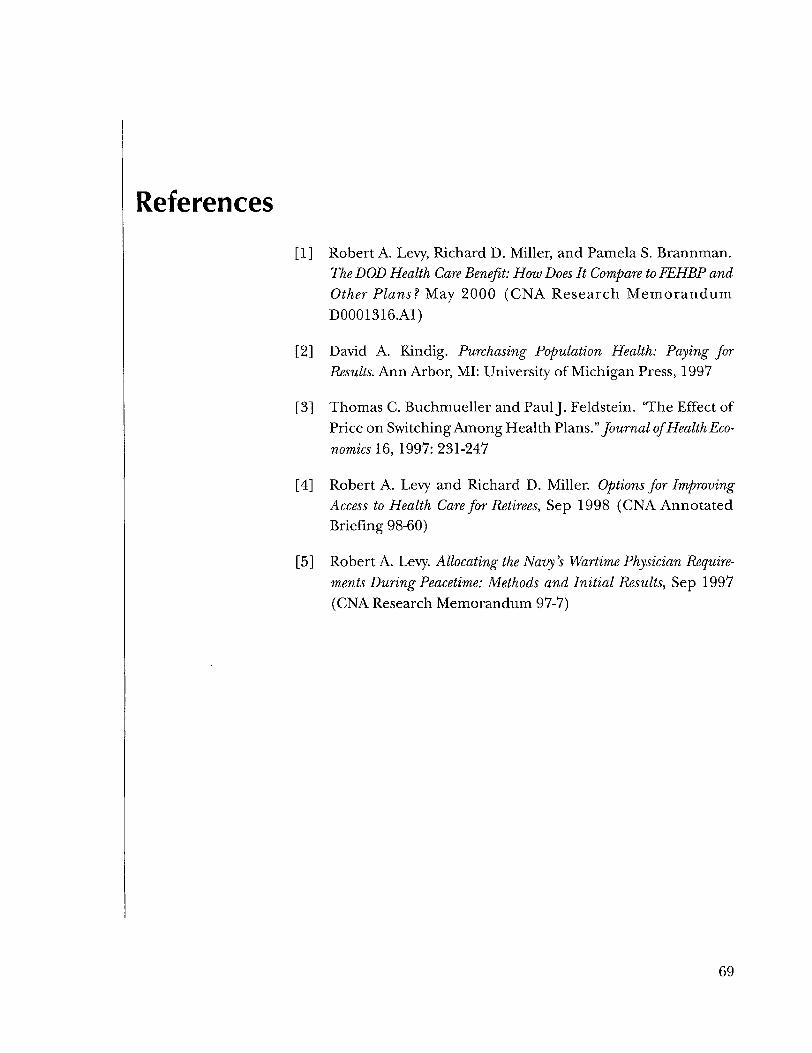
References[1] Robert A. Levy, Richard D. Miller, and Pamela S. Brannman.
The DOD Health Care Benefit: How Does It Compare to FEHBP andOther Plans'? May 2000 (CNA Research MemorandumD0001316.A1)
[2] David A. Kindig. Purchasing Population Health: Paying forResults. Ann Arbor, MI: University of Michigan Press, 1997
[3] Thomas C. Buchmueller and Paul J. Feldstein. 'The Effect ofPrice on Switching Among Health Plans." Journal of Health Eco-nomics 16,1997: 231-247
[4] Robert A. Levy and Richard D. Miller. Options for ImprovingAccess to Health Care for Retirees, Sep 1998 (CNA AnnotatedBriefing 98-60)
[5] Robert A. Levy. Allocating the Navy's Wartime Physician Require-ments During Peacetime: Methods and Initial Results, Sep 1997(CNA Research Memorandum 97-7)
69

THIS PAGE INTENTIONALLY LEFT BLANK

List of tablesTable 1. Options considered in CNA analysis . . . . . . . . . 3
Table 2. Summary of findings for all options . . . . . . . . . 5
Table 3. Plan design for option 1 . . . . . . . . . . . . . . . 17
Table 4. Eligibility and enrollment fee changes underoption 2 . . . . . . . . . . . . . . . . . . . . . . . . 19
Table 5. Eligibility and enrollment fee changes underoption 3 . . . . . . . . . . . . . . . . . . . . . . . . 20
Table 6. Matrix for current Prime retirees under 65(percentages) . . . . . . . . . . . . . . . . . . . . . 2 8
Table 7. Adult ADFMs, by plan type (in thousands) . . . . . 38
Table 8. AD FM sources of care (percentages). . . . . . . . . 39
Table 9. Retirees under 65, by plan type (in thousands) . . . 42
Table 10. Retirees under 65 sources of care (percentages) . . 42
Table 11. Retirees 65 and older, by plan type (in thousands) . 43
Table 12. Option 1 enrollment, by plan type (in thousands) . 44
Table 13. System and MTF use under option 1(in t h o u s a n d s ) . . . . . . . . . . . . . . . . . . . . . 45
Table 14. Option 2 enrollment, all beneficiary categories( in t h o u s a n d s ) . . . . . . . . . . . . . . . . . . . . . 47
Table 15. System and MTF use under option 2(in t h o u s a n d s ) . . . . . . . . . . . . . . . . . . . . . 48
71

Table 16. Option 3 enrollment, all beneficiary categories(in t h o u s a n d s ) . . . . . . . . . . . . . . . . . . . . . 50
Table 17. Option 3 system and MTF use (in t h o u s a n d s ) . . . . 50
Table 18. Percentage of adults by plan type. . . . . . . . . . . 52
Table 19. Costs of health care by beneficiary category,estimates for 2000 . . . . . . . . . . . . . . . . . . . 53
Table 20. Costs under optionl, retirees under 65 ($ billions) . 56
Table 21. Costs under option 2, ADFMs and retirees under65 ($ billions) . . . . . . . . . . . . . . . . . . . . . 57
Table 22. Costs under option 2, Medicare-eligibles($ billions). . . . . . . . . . . . . . . . . . . . . . . 58
Table 23. Net DOD costs ($ billions) . . . . . . . . . . . . . . 59
Table 24. Costs under option 3, all beneficiary categories($ b i l l i o n s ) . . . . . . . . . . . . . . . . . . . . . . . 60
Table 25. Option 3 net DOD costs ($ billions) . . . . . . . . . 60
Table 26. Impact of enrollment on direct care systemreliance (in millions) . . . . . . . . . . . . . . . . . 62
Table 27. Kaiser Foundation Health Plan staffing ratios . . . . 63
Table 28. Projected requirements based on population andreadiness. . . . . . . . . . . . . . . . . . . . . . . . 6 4
72

Distribution listResearch Memorandum D000457.A1 /Final
OtherBIB USD/PR
Attn: Bernard RostkerAttn: Jeanne Fites
ASD Force Management PolicyAttn: A. Maldon
DASD Military Personnel PolicyAttn: VADM Patricia Tracey
SNDLVCNO Attn: ADM Donald PillingA5 CHBUMED
MED-01 Attn: John CuddyA5 Navy Surgeon General
Attn: VADM Richard NelsonAttn: RADM Donald ArthurAttn: CAPT Christine Hunter
MED-03Attn: CAPT N. LescavageAttn: CAPT C. DavisAttn: CDR E. Valentin
A1H ASSTSECNAV MRA Washington DCAttn: Carolyn BecraftAttn: Karen HeathAttn: LCDR G.Jaeger
OPNAVNl Attn: VADM N. RyanN931 Attn: CAPT Stephen RiceN80 Attn: CDR Toni WhitmeyerOtherAIR USAF Surgeon General
Attn: LTG CarletonAttn: COL Thomas Peters
BIB ASD/HAAttn: Dr. Sue BaileyAttn: RADM CowanAttn: Gwendolyn BrownAttn: Mary GerwinAttn: Dr. John MazzuchiAttn: Dr. Robert OpsutAttn: COL Paul FrederickAttn: Ed Chan
BIB OSD PA&EAttn: Carla TigheAttn: Barry Mitchell
B2A DA Washington DC/DASG APOAttn: LTG Ronald BlanckAttn: COL James McGaha
TRI TRICARE Management ActivityAttn: Dr. James SearsAttn: RADM Thomas CarratoAttn: Steve LillyAttn: Jean StorckAttn: Dr. Richard Guerin
ASSTSECARMYMRAAttn: COL Craig Urbauer
ASSTSECAFMRAAttn: Carol Thompson
73