Embed Size (px)
Citation preview
Ann. Zool. Fennici 44: 8–19 ISSN 0003-455XHelsinki 15 March 2007 © Finnish Zoological and Botanical Publishing Board 2007
The importance of breeding groups for territory occupancy in a declining population of a farmland passerine bird
Ville Vepsäläinen1, Timo Pakkala1, Markus Piha1 & Juha Tiainen2
1) Finnish Museum of Natural History, P.O. Box 26, FI-00014 University of Helsinki, Finland (e-mail: [email protected], [email protected], [email protected])
2) Finnish Game and Fisheries Research Institute, P.O. Box 6, FI-00721 Helsinki, Finland (e-mail: [email protected])
Received 18 Aug. 2006, revised version received 21 Nov. 2006, accepted 28 Oct. 2006
Vepsäläinen, V., Pakkala, T., Piha, M. & Tiainen, J. 2007: The importance of breeding groups for territory occupancy in a declining population of a farmland passerine bird. — Ann. Zool. Fennici 44: 8–19.
We studied the relationships between the occupancy of territory sites and environ-mental and behaviour-related factors in a declining farmland bird, the ortolan bunting Emberiza hortulana, in southern Finland in 1984–2003. We investigated the depend-ence of different factors on population density. The surrounding breeding group posi-tively affected the occupation frequency of territory sites before and after the popula-tion crash. Bush- or tree-covered ditches and springtime non-vegetated fields also had positive effect on territory site occupancy. We suggest that large breeding groups, and obvious conspecific attraction, give indications of favourable breeding locations. Habitat deterioration may have pronounced consequences for local populations, in which the breeding group tends to be the unit of population dynamics. The results sug-gest that for conservation of the ortolan bunting, the maintenance and improvement of structurally and biologically diverse habitats is vital, since tendency to breed in groups apparently makes the species more sensitive to habitat changes than many other farm-land species.
Introduction
The habitat selection and habitat preferences of species are classic problems in bird ecology (see e.g. Wiens 1989, Newton 1998). Pynnönen (1954), and later also Brown (1969), proposed that the best, or most favourable, habitats will be occupied from year to year, while the occu-pation of lower-quality habitats will show more variation. Thus, the marginal habitats will be occupied only in years when the best habitats are filled and the territories ‘spill over’ into marginal habitats (cf. Vepsäläinen 1968).
There are two straightforward paradigmatic models that aim to describe how bird indi-viduals respond to variation in habitat quality, namely the ideal free distribution (IFD) and ideal despotic distribution (IDD) models (Fretwell & Lucas 1969).
These models of habitat selection are most applicable to, on the one hand, non-territorial species (IFD model), and, on the other hand, to territorial species with territory defence and a social hierarchy (IDD model). However, in the case of territorial species that have aggregated but no strictly defended territories and that show
ANN. Zool. FeNNIcI Vol. 44 • Importance of breeding groups for territory occupancy 9
social or non-aggressive aspects in interactions between individuals, the distribution and occu-pation patterns are more complex (e.g. Newton 1998). The ortolan bunting, Emberiza hortu-lana, is an example of a species whose habitat selection and territory occupation is probably affected both by sociality between conspecifics and by quality-related factors in the habitat (e.g. Cramp & Perrins 1994, Vepsäläinen et al. 2005). In this species, territory defence is restricted to the close vicinity of the nest (Durango 1948, Cramp & Perrins 1994). The territories of the ortolan bunting are typically located in loose concentrations with shared feeding areas, i.e. in breeding groups. In these, males sing in close proximity to each other (‘singing-groups’) and aggression between birds seldom occurs, even near nest sites (Durango 1948, Cramp & Per-rins 1994, Vepsäläinen et al. 2005). However, in studies in Germany, Conrads (1969) observed that territories may be more actively defended at certain times within the breeding season, and that paired males dominated unpaired males. The aggregated distribution of the territories of the ortolan bunting may — at least partly — be the result of the type of conspecific attraction that has been observed in colonial and also in non-colonial territorial bird species (e.g. Ala-talo et al. 1982, Tiainen et al. 1984, Mikkonen 1985, Stamps 1988, a review by Reed & Dobson [1993], Muller et al. [1997], Etterson [2003]). Thus, the singing of males could act as a cue to other males indicating a good habitat; this in turn could lead to an aggregation of territories (Alatalo et al. 1982, Reed & Dobson 1993), and also to avoidance or more efficient detection of predators by groups (Reed & Dobson 1993). Nevertheless, the aggregation of territories does not necessarily indicate the existence of conspe-cific attraction, since an aggregated territorial pattern may be formed by a clustering of suitable habitat patches in a fragmented environment, or similarly by a clustering of other resources (e.g. Stamps 1988, Reed & Dobson 1993). In relating these factors to conservation issues, Reed (1999) suggested that the disappearance of group struc-ture in declining populations might decrease survival probabilities by virtue of the effect on breeding or on feeding efficiency (the ‘Allee effect’).
The social aspects in the ortolan bunting’s behaviour are thought to affect the persistence and viability of local breeding groups, especially in declining populations. After the disappearance of a local breeding group, re-establishment of the group may be difficult, since it probably takes more than one or a couple of males to attract and establish a permanent singing and breeding group in a particular location (Vepsäläinen et al. 2005). The tendency to breed in groups and the social behaviour of the ortolan bunting have been known for a long time (e.g. Durango 1948, Conrads 1969, Cramp & Perrins 1994), but, to the best of our knowledge, there have been no detailed studies on the relationship between this behaviour and (i) the persistence of territory groups, (ii) the occupancy of territory sites, or (iii) environmental factors.
The ortolan bunting is one of the bird species that has undergone a particularly severe decline in the agricultural areas of Europe (cf. BirdLife International 2004, Vepsäläinen et al. 2005); thus it is important to understand the role of breeding groups in the maintenance of local populations, and the relationship between social aspects and habitat characteristics. In Finland the decline has been associated with a decrease in small-scale habitat heterogeneity, and especially in the loss of bush- or tree-covered ditches and roadsides. These features provide song posts for the ortolan bunting males and probably also provide food, shelter and nest sites (Vepsäläinen et al. 2005). In addition, springtime non-vegetated agricul-tural land (mainly spring cereal and root crop fields) has been shown to be important for the occurrence of the species in agricultural areas (Vepsäläinen et al. 2005). This suggests that changes in the overall area of this kind of habitat may have contributed to the decline — along with other factors, for example losses of individ-uals during migration or in wintering areas (e.g. Cramp & Perrins 1994, Tucker & Heath 1994, Goławski & Dombrowski 2002, Vepsäläinen et al. 2005).
We studied the relationships between the occupancy of the ortolan bunting’s territory sites and various environmental and breeding group-related factors in agricultural landscapes. The study was conducted in Lammi, southern Fin-land, where a decline in density of more than
10 Vepsäläinen et al. • ANN. Zool. FeNNIcI Vol. 44
70% has taken place over the total study period, 1984–2003 (Vepsäläinen et al. 2005). Our aim was to study whether breeding group structure and habitat characteristics could explain the vari-ation in the occupation of territory sites in such a declining population, and whether the importance of these factors depended on population density. We considered the breeding group aspect to be extremely important, since it seems that large breeding groups are better buffered against fac-tors affecting density changes (Vepsäläinen et al. 2005). This could have a corresponding effect on the maintenance of local populations on a larger geographical scale. Our aim was also to study whether the distributions of occupation frequen-cies of territory sites varied between periods of different population densities. We wanted to find out whether there were relatively more sites with low occupation frequency in high population densities than in low population densities. How-ever, it is important to note that the occupation frequencies of territory sites are not straightfor-wardly comparable, since both the number of potential territory sites and the breeding density
decrease with the population decline in our study area. For this reason, we also estimated the expected values for mean territory occupation at various densities.
In order to explain the changes in the occu-pancy and persistence of the territory sites, we used data on changes in breeding groups (based on annual territory-mapping census data), and on habitat and landscape characteristics. We related these to the patterns of territory site occupancy that occurred in four five-year periods, within the overall 20-year study period (1984–2003). The spatial scale of the study ranged from terri-tory scale (100 m radius) to the scale of separate patches of farmland (from about 1 to 3 km²).
Material and methods
Study area
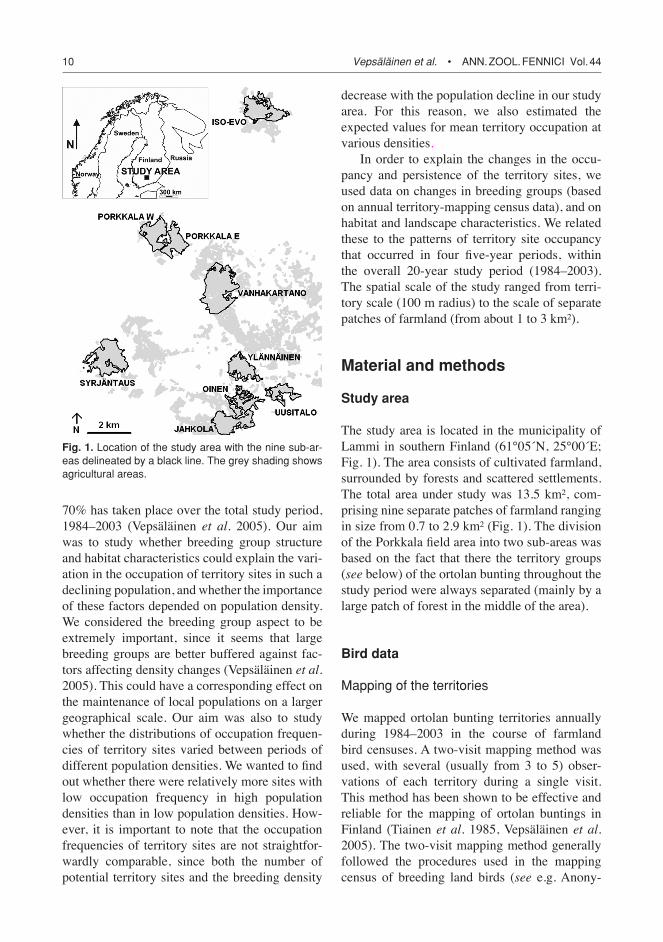
The study area is located in the municipality of Lammi in southern Finland (61°05´N, 25°00´E; Fig. 1). The area consists of cultivated farmland, surrounded by forests and scattered settlements. The total area under study was 13.5 km², com-prising nine separate patches of farmland ranging in size from 0.7 to 2.9 km² (Fig. 1). The division of the Porkkala field area into two sub-areas was based on the fact that there the territory groups (see below) of the ortolan bunting throughout the study period were always separated (mainly by a large patch of forest in the middle of the area).
Bird data
Mapping of the territories
We mapped ortolan bunting territories annually during 1984–2003 in the course of farmland bird censuses. A two-visit mapping method was used, with several (usually from 3 to 5) obser-vations of each territory during a single visit. This method has been shown to be effective and reliable for the mapping of ortolan buntings in Finland (Tiainen et al. 1985, Vepsäläinen et al. 2005). The two-visit mapping method generally followed the procedures used in the mapping census of breeding land birds (see e.g. Anony-
Fig. 1. location of the study area with the nine sub-ar-eas delineated by a black line. The grey shading shows agricultural areas.
ANN. Zool. FeNNIcI Vol. 44 • Importance of breeding groups for territory occupancy 11
mous 1969, Koskimies & Väisänen 1991). The visits were made in May and the first half of June. We paid special attention to simultaneous observations of singing males, to individuals giving alarm calls, to territory locations, and to accurate estimations of the territory numbers in territory concentrations. The annual numbers of territories and the locations of territory centres were then interpreted following the standards developed for studies of agricultural birds in Finland (see Tiainen & Pakkala 2000, Piha et al. 2003). The interpretations were based on the locations of the various kinds of observa-tions mentioned above — mainly simultaneous observations of singing males — recorded from both census visits. Having located the territory centres on a map, we digitized the data to a GIS database.
Definition of the territory sites and their occupation
We here use the term territory site to refer to an area combining the annual locations of each ter-ritory. Territory sites are often ‘traditional’, in the sense that annual ortolan bunting territories tend to be located in more or less same places, year after year. The precise locations of the sites were determined as follows:
1. Annual territory centres were located, mostly via simultaneous observations of singing males.
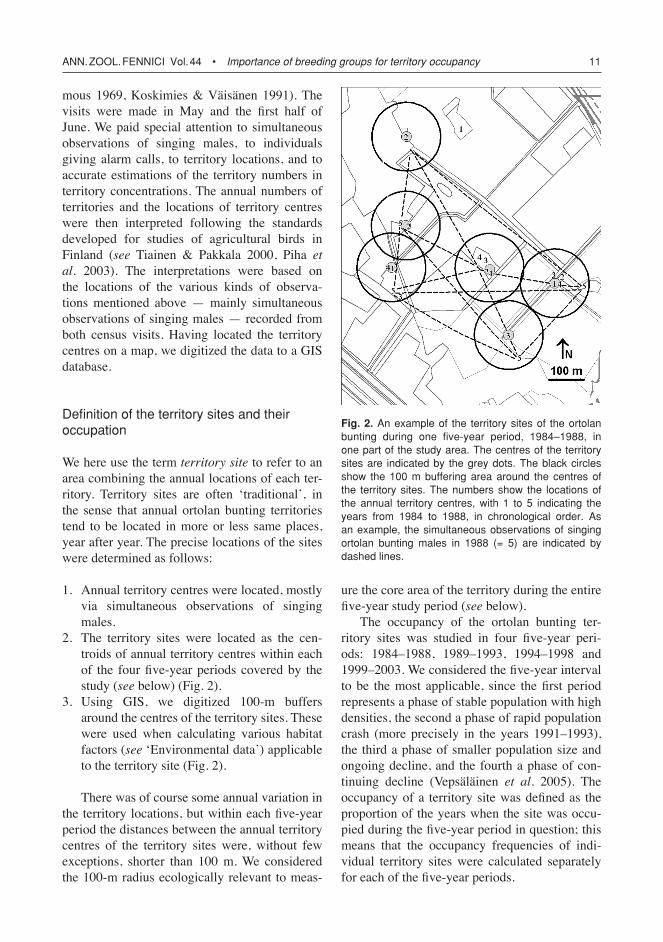
2. The territory sites were located as the cen-troids of annual territory centres within each of the four five-year periods covered by the study (see below) (Fig. 2).
3. Using GIS, we digitized 100-m buffers around the centres of the territory sites. These were used when calculating various habitat factors (see ‘Environmental data’) applicable to the territory site (Fig. 2).
There was of course some annual variation in the territory locations, but within each five-year period the distances between the annual territory centres of the territory sites were, without few exceptions, shorter than 100 m. We considered the 100-m radius ecologically relevant to meas-
ure the core area of the territory during the entire five-year study period (see below).
The occupancy of the ortolan bunting ter-ritory sites was studied in four five-year peri-ods: 1984–1988, 1989–1993, 1994–1998 and 1999–2003. We considered the five-year interval to be the most applicable, since the first period represents a phase of stable population with high densities, the second a phase of rapid population crash (more precisely in the years 1991–1993), the third a phase of smaller population size and ongoing decline, and the fourth a phase of con-tinuing decline (Vepsäläinen et al. 2005). The occupancy of a territory site was defined as the proportion of the years when the site was occu-pied during the five-year period in question; this means that the occupancy frequencies of indi-vidual territory sites were calculated separately for each of the five-year periods.
Fig. 2. An example of the territory sites of the ortolan bunting during one five-year period, 1984–1988, in one part of the study area. The centres of the territory sites are indicated by the grey dots. The black circles show the 100 m buffering area around the centres of the territory sites. The numbers show the locations of the annual territory centres, with 1 to 5 indicating the years from 1984 to 1988, in chronological order. As an example, the simultaneous observations of singing ortolan bunting males in 1988 (= 5) are indicated by dashed lines.
12 Vepsäläinen et al. • ANN. Zool. FeNNIcI Vol. 44
Environmental data
Habitat data
Habitat data were collected in the field, by iden-tifying land use types and by mapping land use boundaries. Additional information, based on topographic maps (National Land Survey of Fin-land), was also used. Habitat data were digitized from the field maps into a GIS database. The selection and classification of the habitat data included in this study was based on the results of a previous study conducted in the same study area (Vepsäläinen et al. 2005). In that study, the ortolan bunting population density changes and envi-ronment associations were studied from territory scale to landscape scale. The data were classified within the following three land-use classes: (1) fields with spring tillage, not covered by vegeta-tion in the spring (usually fields of spring cereal, potato, sugar beet, or turnip rape; rarely also sun-flower, pea, vegetable garden plants, corn, onion, carrot, beetroot, or cabbage), (2) fields covered by vegetation in the spring (including ley, hay, pasture, set-aside, meadow, autumn cereal, stub-ble, ruderal vegetation, currant, and strawberry), and (3) roads. The division of cultivated fields into covered vs. non-covered by vegetation in the spring represents the situation in the first half of May, when ortolan buntings arrive at their breed-ing areas. In a previous study (Vepsäläinen et al. 2005), the amount of springtime non-covered field was found to be important for the occur-rence of the ortolan bunting. In addition, data on bush and forest patches (i.e. islets) were collected during field censuses, and these data were used as supplementary information when locating the small-scale habitat elements (see next section) on the map. We did not include either forests sur-rounding the patches of farmland or settlements in the habitat classification, since in the previous study (Vepsäläinen et al. 2005) they had been found to have an insignificant effect on the occur-rence and density of the ortolan buntings at all spatial scales.
Data on small-scale habitat elements
The selection and classification of data on small-
scale habitat elements was based on the results of the study mentioned above (Vepsäläinen et al. 2005), in which these kind of habitat elements were found to have a significant positive effect on the occurrence of the ortolan bunting at vari-ous spatial scales. The data on small-scale habitat elements (point objects and linear elements) were collected from field maps and aerial photographs taken in 1979, 1991–1992, and 2000. The data were supplemented with land-use data where the aerial photographs did not completely fit with the years of field study. In addition, all other small-scale data from the aerial photographs were com-pared and crosschecked with the field data. Point objects included large rocks and rock piles, bush and forest patches (i.e. bush and forest islets), single large trees and bushes, and barns. Linear elements were classified either as ‘open’ (short vegetation), including open field ditches and road bank ditches, or ‘closed’ (high vegetation i.e. bushes or trees), including bush- or tree-covered ditches and road banks, and wood avenues. The data on small-scale habitat elements were also digitized into a GIS database.
open farmland areas (oFAs)
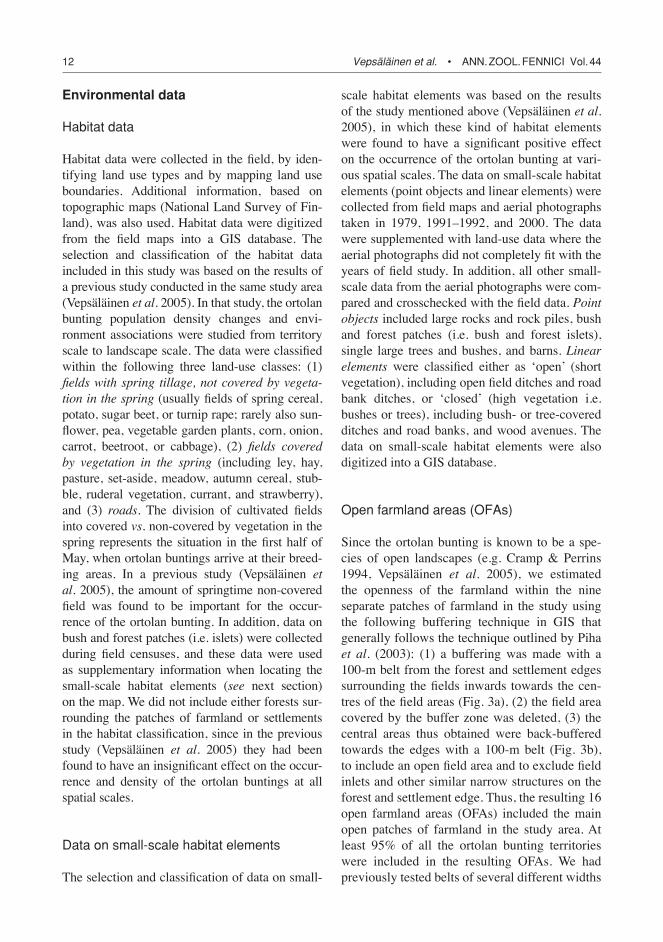
Since the ortolan bunting is known to be a spe-cies of open landscapes (e.g. Cramp & Perrins 1994, Vepsäläinen et al. 2005), we estimated the openness of the farmland within the nine separate patches of farmland in the study using the following buffering technique in GIS that generally follows the technique outlined by Piha et al. (2003): (1) a buffering was made with a 100-m belt from the forest and settlement edges surrounding the fields inwards towards the cen-tres of the field areas (Fig. 3a), (2) the field area covered by the buffer zone was deleted, (3) the central areas thus obtained were back-buffered towards the edges with a 100-m belt (Fig. 3b), to include an open field area and to exclude field inlets and other similar narrow structures on the forest and settlement edge. Thus, the resulting 16 open farmland areas (OFAs) included the main open patches of farmland in the study area. At least 95% of all the ortolan bunting territories were included in the resulting OFAs. We had previously tested belts of several different widths
ANN. Zool. FeNNIcI Vol. 44 • Importance of breeding groups for territory occupancy 13
(50–150 m), and found that the 100-m radius provided the best fit with the spatial scales of the landscape of the study area. As the sub-areas were of different size and shape, the areas and proportions of the OFAs also varied (Table 1).
Analyses of territory site occupancy
Since both the number of territory sites and the ortolan bunting density decreased during the overall study period, we calculated the expected mean values for the proportions of occupancies of territory sites during each five-year period. Our aim in this was to see whether it is really possible to directly compare the distributions of the occu-pancy proportions of the territory sites between the four periods. The expected mean value for territory occupancy was calculated for each of the periods as follows: EPi = (∑Pj)/5; where Pj = NEHj/NTSi (i = 1, .., 4; j = 1, ..., 5); and where NEHj is the number of occupied territories in year j, and NTSi is the number of territory sites in period i.
The relationships between the occupancy of territory sites and environmental and breeding group-related factors were studied using logis-tic regression analysis (with multinomial error distribution). We used a cumulative logit model with forward selection of the LOGISTIC proce-dure of SAS statistical software version 8 (SAS Institute Inc. 1999). The dependent variable was the occupancy of a territory site. The depend-ent variable thus had five response levels: 0.2,
0.4, 0.6, 0.8 or 1, depending on whether a site was occupied for 1, 2, 3, 4 or 5 years within a given five-year period (1984–1988, 1989–1993, 1994–1998, 1999–2003). The following factors were used as independent variables (territory site factors (1–6) were calculated inside the 100-m buffer around the centre of the territory site): (1) area of cultivated land, (2) proportion of field not covered by springtime vegetation, (3) length of closed linear elements, (4) length of open linear elements, (5) number of point objects, (6) length of roads, (7) total area of OFA in the patch of farmland (Fig. 1) in which the site in question is located, and (8) ‘breeding group effect’ (BGE) in the patch of farmland (Fig. 1) in which the site in question is located, calculated as follows: BGE = ( OCC – EMPTY)/ TOTAL; where OCC is the average ortolan bunting density in surrounding territory sites when the site is occupied, EMPTY is the average ortolan bunting density in surround-ing territory sites when the site is not occupied, and TOTAL is the total average ortolan bunting density in the surrounding territory sites. The analyses were carried out independently for each of the four five-year periods. The mean values for each environmental factor in the five-year period in question were used. The 100-m radius was selected to match variation in the locations
Table 1. Sub-areas with corresponding total areas of farmland and oFA, and the proportion of oFA in rela-tion to the total area (cf. Fig. 1a).
Sub-area Total Area of oFA(number farmland oFA proportionof oFAs) area (km²) (km²) (%) of total farmland area
Syrjäntausta (1) 1.97 1.57 79.7Jahkola (2) 1.39 1.04 74.8oinen (4) 1.50 0.42 28.0Uusitalo (2) 0.72 0.35 48.6Ylännäinen (2) 1.15 0.67 58.3Vanhakartano (2) 2.93 2.18 74.4Porkkala W (1) 1.27 0.91 71.7Porkkala e (1) 1.02 0.81 79.4Iso-evo (1) 1.57 1.01 64.3
Fig. 3. An example of the estimation of openness by buffering in one of the sub-areas, Syrjäntausta. (a) The dark-grey area indicates a buffer zone created by buffering 100 m inwards from the forest and settlement edge. (b) The light-grey area indicates the buffer zone created by back-buffering 100 m outwards from the central area (white) that remained after deleting the field area covered by the first buffer area. The outer-most border of the light grey area is taken as the border of the resulting oFA. The dashed line shows the forest and settlement edge, i.e. the starting point of the buffer-ing procedure.
14 Vepsäläinen et al. • ANN. Zool. FeNNIcI Vol. 44
of annual territory centres during a five-year period. Along with traditional R2 (= coefficient of determination of the model), we also esti-mated maximum rescaled R2, which according to Nagelkerke (1991) is often more suitable for logistic regression models.
Results
Occupancy of the territory sites
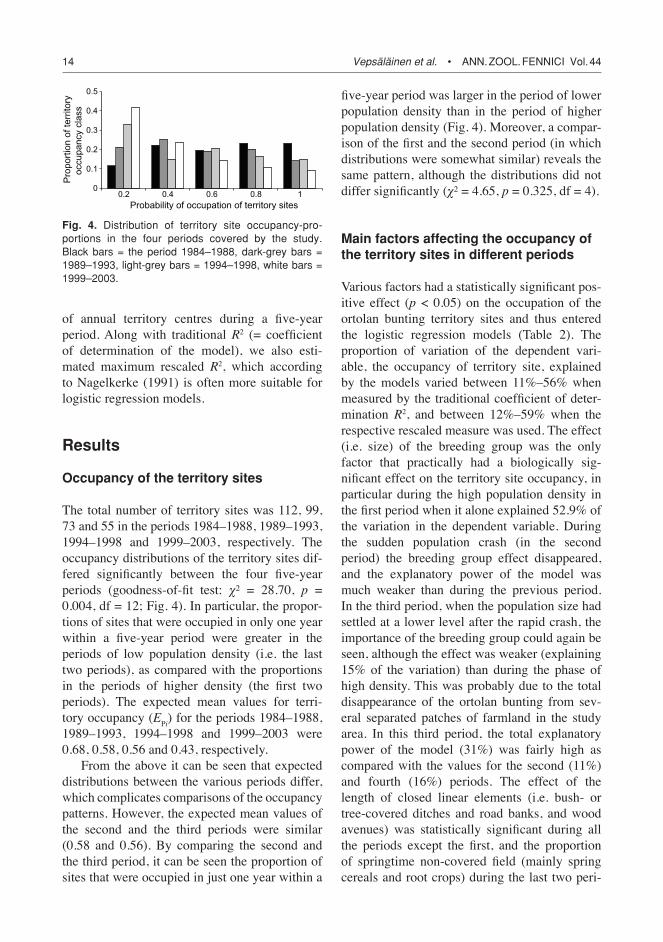
The total number of territory sites was 112, 99, 73 and 55 in the periods 1984–1988, 1989–1993, 1994–1998 and 1999–2003, respectively. The occupancy distributions of the territory sites dif-fered significantly between the four five-year periods (goodness-of-fit test: χ² = 28.70, p = 0.004, df = 12; Fig. 4). In particular, the propor-tions of sites that were occupied in only one year within a five-year period were greater in the periods of low population density (i.e. the last two periods), as compared with the proportions in the periods of higher density (the first two periods). The expected mean values for terri-tory occupancy (EPi) for the periods 1984–1988, 1989–1993, 1994–1998 and 1999–2003 were 0.68, 0.58, 0.56 and 0.43, respectively.
From the above it can be seen that expected distributions between the various periods differ, which complicates comparisons of the occupancy patterns. However, the expected mean values of the second and the third periods were similar (0.58 and 0.56). By comparing the second and the third period, it can be seen the proportion of sites that were occupied in just one year within a
five-year period was larger in the period of lower population density than in the period of higher population density (Fig. 4). Moreover, a compar-ison of the first and the second period (in which distributions were somewhat similar) reveals the same pattern, although the distributions did not differ significantly (χ² = 4.65, p = 0.325, df = 4).
Main factors affecting the occupancy of the territory sites in different periods
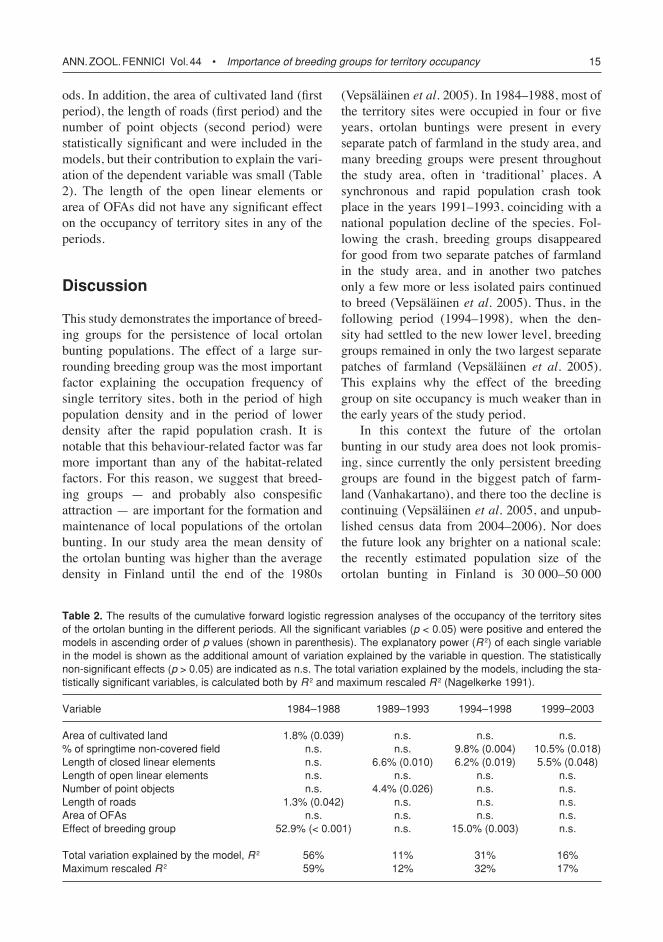
Various factors had a statistically significant pos-itive effect (p < 0.05) on the occupation of the ortolan bunting territory sites and thus entered the logistic regression models (Table 2). The proportion of variation of the dependent vari-able, the occupancy of territory site, explained by the models varied between 11%–56% when measured by the traditional coefficient of deter-mination R2, and between 12%–59% when the respective rescaled measure was used. The effect (i.e. size) of the breeding group was the only factor that practically had a biologically sig-nificant effect on the territory site occupancy, in particular during the high population density in the first period when it alone explained 52.9% of the variation in the dependent variable. During the sudden population crash (in the second period) the breeding group effect disappeared, and the explanatory power of the model was much weaker than during the previous period. In the third period, when the population size had settled at a lower level after the rapid crash, the importance of the breeding group could again be seen, although the effect was weaker (explaining 15% of the variation) than during the phase of high density. This was probably due to the total disappearance of the ortolan bunting from sev-eral separated patches of farmland in the study area. In this third period, the total explanatory power of the model (31%) was fairly high as compared with the values for the second (11%) and fourth (16%) periods. The effect of the length of closed linear elements (i.e. bush- or tree-covered ditches and road banks, and wood avenues) was statistically significant during all the periods except the first, and the proportion of springtime non-covered field (mainly spring cereals and root crops) during the last two peri-
0
0.1
0.2
0.3
0.4
0.5
0.2 0.4 0.6 0.8 1Probability of occupation of territory sites
Pro
port
ion
of te
rrito
ryoc
cupa
ncy
clas
s
Fig. 4. Distribution of territory site occupancy-pro-portions in the four periods covered by the study. Black bars = the period 1984–1988, dark-grey bars = 1989–1993, light-grey bars = 1994–1998, white bars = 1999–2003.
ANN. Zool. FeNNIcI Vol. 44 • Importance of breeding groups for territory occupancy 15
ods. In addition, the area of cultivated land (first period), the length of roads (first period) and the number of point objects (second period) were statistically significant and were included in the models, but their contribution to explain the vari-ation of the dependent variable was small (Table 2). The length of the open linear elements or area of OFAs did not have any significant effect on the occupancy of territory sites in any of the periods.
Discussion
This study demonstrates the importance of breed-ing groups for the persistence of local ortolan bunting populations. The effect of a large sur-rounding breeding group was the most important factor explaining the occupation frequency of single territory sites, both in the period of high population density and in the period of lower density after the rapid population crash. It is notable that this behaviour-related factor was far more important than any of the habitat-related factors. For this reason, we suggest that breed-ing groups — and probably also conspesific attraction — are important for the formation and maintenance of local populations of the ortolan bunting. In our study area the mean density of the ortolan bunting was higher than the average density in Finland until the end of the 1980s
(Vepsäläinen et al. 2005). In 1984–1988, most of the territory sites were occupied in four or five years, ortolan buntings were present in every separate patch of farmland in the study area, and many breeding groups were present throughout the study area, often in ‘traditional’ places. A synchronous and rapid population crash took place in the years 1991–1993, coinciding with a national population decline of the species. Fol-lowing the crash, breeding groups disappeared for good from two separate patches of farmland in the study area, and in another two patches only a few more or less isolated pairs continued to breed (Vepsäläinen et al. 2005). Thus, in the following period (1994–1998), when the den-sity had settled to the new lower level, breeding groups remained in only the two largest separate patches of farmland (Vepsäläinen et al. 2005). This explains why the effect of the breeding group on site occupancy is much weaker than in the early years of the study period.
In this context the future of the ortolan bunting in our study area does not look promis-ing, since currently the only persistent breeding groups are found in the biggest patch of farm-land (Vanhakartano), and there too the decline is continuing (Vepsäläinen et al. 2005, and unpub-lished census data from 2004–2006). Nor does the future look any brighter on a national scale: the recently estimated population size of the ortolan bunting in Finland is 30 000–50 000
Table 2. The results of the cumulative forward logistic regression analyses of the occupancy of the territory sites of the ortolan bunting in the different periods. All the significant variables (p < 0.05) were positive and entered the models in ascending order of p values (shown in parenthesis). The explanatory power (R 2) of each single variable in the model is shown as the additional amount of variation explained by the variable in question. The statistically non-significant effects (p > 0.05) are indicated as n.s. The total variation explained by the models, including the sta-tistically significant variables, is calculated both by R 2 and maximum rescaled R 2 (Nagelkerke 1991).
Variable 1984–1988 1989–1993 1994–1998 1999–2003
Area of cultivated land 1.8% (0.039) n.s. n.s. n.s.% of springtime non-covered field n.s. n.s. 9.8% (0.004) 10.5% (0.018)length of closed linear elements n.s. 6.6% (0.010) 6.2% (0.019) 5.5% (0.048)length of open linear elements n.s. n.s. n.s. n.s.Number of point objects n.s. 4.4% (0.026) n.s. n.s.length of roads 1.3% (0.042) n.s. n.s. n.s.Area of oFAs n.s. n.s. n.s. n.s.effect of breeding group 52.9% (< 0.001) n.s. 15.0% (0.003) n.s. Total variation explained by the model, R 2 56% 11% 31% 16%Maximum rescaled R 2 59% 12% 32% 17%
16 Vepsäläinen et al. • ANN. Zool. FeNNIcI Vol. 44
pairs. Thus the decline since the 1980s is approx-imately 75%, and it is still continuing (Väisänen 2001, BirdLife International 2004).
The proportion of territories that were occu-pied in just one year within a five-year period was greater after the population crash (i.e. 1994–1998) than in the years just prior to and includ-ing the population crash (i.e. 1989–1993). The occupancy of the territory sites in our study shows a clear overall pattern: during the period of high population density there were throughout the study area strong breeding groups occupying traditional territory sites. After the rapid crash, breeding group structures were generally frac-tured.
The positive effect of ditches and road banks covered by bushes or trees, and wood avenues (in the models for all periods except the first) is interesting, since this variable had been found to have a positive significant effect on the occur-rence and density of the ortolan bunting in a previous multi-scale study in the same area (Vepsäläinen et al. 2005). Thus, although in the present study the practical significance of this variable is weak, its appearance in the models seems to underline the importance of these habi-tat features for the ortolan bunting. These kinds of linear habitat elements create biological and structural diversity in an otherwise relatively open environment — mainly by offering song-posts for males, and probably also feeding and breeding places (Vepsäläinen et al. 2005). Thus, it is not surprising that the existence of these habitat features, together with the effect of the breeding group (including the social behaviour related to the group) had a positive effect on the frequency of occupation of territory sites. Unfortunately for the ortolan bunting, there has been a 30% decrease in the length of these kinds of habitat elements in our study area during the study period (Vepsäläinen et al. 2005). The dis-appearance of these small-scale habitat features may have severe consequences for local breed-ing groups, if habitat deterioration takes place in the core areas of breeding groups. When too few birds return the following spring, and when these arrive at places where the habitat has changed crucially (for example due to sub-surface drain-age or the cutting of trees and bushes), the struc-ture of the group may be lost. This may result
in rapid local extinctions in separate patches of farmland, as in our study area (Vepsäläinen et al. 2005). The most dramatic example of this can be found in one of the separate patches of farmland (Ylännäinen, size 1 km2) where the population density dropped from 11 pairs/km2 to 1 pair/km2 between the years 1989 and 1992. Almost two kilometres of tree- and bush-growing ditches were first cut, and later totally removed in con-nection with sub-surface drainage. The outcome of these operations was that the traditional song-posts of the ortolan bunting disappeared, and no new breeding group has become re-established in the area since then (Vepsäläinen et al. 2005, and unpubl. data). Single singing males have been observed there in some years since the dis-appearance of the local population, but usually no females or other males have been observed, and often the single male leaves the patch of farmland during the breeding season.
The existence of singing groups of ortolan buntings was reported in previous studies (cf. Cramp & Perrins 1994, Vepsäläinen et al. 2005). It is evident that the song of the males attracts other males, and probably also females; thus it seems to be the key element of conspesific attraction, and is probably necessary for the for-mation of breeding groups. Although we could not directly test the presence or absence of con-spesific attraction in our study setup, we suggest that ortolan buntings returning from migration do not simply use habitat features as cues when ‘deciding’ where to settle down; they also may use the presence of conspecifics as indications of a favourable breeding habitat.
Philopatry is one factor that may affect the occupation of territory sites and the establish-ment and maintenance of breeding groups among the ortolan bunting. For example, if adult philo-patry is strong, then there may be a time-lag in the disappearance of breeding groups following a crash, since many of the surviving adults will continue to return to their previous breeding territories, in spite of changes in the environ-ment. In Norway, where the entire known orto-lan bunting population contains only about 150 singing males, long-distance breeding dispersal (i.e. movements involving a change of singing territory, both within and between years) was observed in males that were born in the previous
ANN. Zool. FeNNIcI Vol. 44 • Importance of breeding groups for territory occupancy 17
year or in the year before that; by contrast older males showed high territory fidelity (Dale et al. 2005). We did not have ringing data that would allow us to study the philopatry in our study pop-ulation. Both conspesific attraction and philopa-try probably have some effect on the observed dependencies between habitat factors and the occupancy of territory sites, but their roles are difficult to quantify in any precise way.
The presence of springtime non-covered fields (i.e. cereal and root crops fields that are mainly bare black ground at the beginning of May in Finland) has been shown to have a positive effect on the occurrence of the ortolan bunting (Vepsäläinen et al. 2005). The attraction of ortolan buntings to fields without tall spring-time vegetation — often dry and dark-coloured ground — has also been reported in other Euro-pean studies: nests are usually located in or on the edges of cereal and root crop fields (Haukioja et al. 1985, Norrdahl 1990, Cramp & Perrins 1994, Tucker & Heath 1994, Nævra 2002). In this con-text it is notable that the proportion of springtime non-vegetated fields had a positive effect on ter-ritory site occupancy after the population crash, even though this variable alone explained only about 10% of the variation in occupation. For Finnish ortolans arriving from migration at the beginning of May, large areas of non-vegetated dark bare soil may also be a cue indicating a suitable habitat. On the other hand, in patches of farmland where large areas are under taller veg-etation already in early spring (i.e. set-asides, ley, winter cereal areas and meadows) the landscape may seem too ‘closed’, and thus not attractive. The reason why ortolans would favour spring-time bare fields is a matter for speculation. The ortolan bunting may have intrinsic adaptations for dry, rather open habitats, being originally a species of southern and eastern dry areas (from the European point of view) (Cramp & Perrins 1994). Dark, bare areas of farmland can also become exposed earlier and more often to the sun than fields with (moist) springtime vegetation, especially after a harsh winter. Thus they could have more favourable microclimatic conditions and probably more food for the arriving ortolans. However, there are no studies on this aspect.
In Finnish farmland most fields have for dec-ades been under spring cereal and root crop cul-
tivation, and thus lacking in springtime vegeta-tion. For this reason, changes in the proportions of fields with and without springtime vegetation cover are not in themselves sufficient to explain the decline of the ortolan bunting in Finland — not even in the early 1990s, when approximately 30% of cultivated field area was left uncultivated for four years due to the National Set-aside Scheme (Vepsäläinen et al. 2005). Nevertheless, we would suggest that a decrease in this habitat, combined with a loss of tree- and bush-growing small-scale habitat elements, and in associa-tion with a breakdown in the social structure of breeding groups, has led to local extinctions of the ortolan buntings in certain areas of Finland. It is true that ortolans also face many threats during migration and in their wintering areas, e.g. from hunting in France, but the role of these factors in the population decline is unknown (Vepsäläinen et al. 2005).
This study is the first to describe in detail the importance of breeding groups for the ortolan bunting. Our results offer new information for the conservation of this species, which is one of the farmland birds in Europe that has under-gone the most severe decline (Tucker & Heath 1994, BirdLife International 2004, Vepsäläinen et al. 2005). The maintenance of structurally and biologically diverse agricultural environment should be encouraged, for example by national agri-environment schemes in the member states of the European Union. More precisely, the maintenance of habitat elements that include song-posts together with breeding and feeding sites is important. In practice this means that tree- and bush-growing ditches, field margins, roadsides, field islets and large isolated trees and bushes should be preserved wherever pos-sible. Owing to the importance of sociality and breeding groups, and of the usually aggregated territory distribution, the conservation measures should be directed at areas where large breeding groups still exist.
We suggest that the breeding group structure of the ortolan bunting may cause the species to be more vulnerable and sensitive to habitat changes than many other farmland bird species. Thus, the disappearances of ortolan buntings from farmlands may indicate decreases in habi-tat quality and quantity, and therefore serve as
18 Vepsäläinen et al. • ANN. Zool. FeNNIcI Vol. 44
an early warning signal regarding the status of many other farmland bird species — especially species using bush and tree habitats similar to those used by the ortolan bunting. More gener-ally, the ortolan bunting could serve as a good indicator species when monitoring the conse-quences of modern intensive agriculture, which (as shown by e.g. Tucker & Heath 1994, Fuller et al. 1995, Siriwardena et al. 1998, Chamberlain et al. 2000, Tryjanowski 2000, Tiainen & Pakkala 2001, Kujawa 2002, Piha et al. 2003, Rintala et al. 2003, BirdLife International 2004) has been responsible for the declines of many bird species in Europe since the mid-20th century.
Acknowledgements
We would like to thank Kari Vepsäläinen and the three anonymous referees for their comments on this manuscript. We are grateful for the Lammi Biological Station of the University of Helsinki for excellent working facilities during the fieldwork, and thanks are also due to Donald Adamson for revising the English. This study has been financed by grants from the Jenny and Antti Wihuri Foundation (to VV), the Finnish Cultural Foundation (to MP & VV), and the Ministry of Agriculture and Forestry in frames of the Finnish Biodiversity Research Programme (Academy of Finland), Research into Biodiversity Impacts of the National Agri-environmental Support Scheme (MYTVAS), and Research Programme of Biodiversity (MOSSE).
References
Alatalo, R. V., Lundberg, A. & Björklund, M. 1982: Can the song of male birds attract other males? An experiment with the Pied Flycatcher Ficedula hypoleuca. — Bird Behav. 4: 42–45.
Anonymous 1969: Recommendations for an international standard for a mapping method in bird census work. — Bird Study 16: 249–254.
BirdLife International 2004: Birds in Europe: population estimates, trends and conservation status. — BirdLife International (BirdLife Conservation Series No. 12), Cambridge, UK.
Brown, J. L. 1969: Territorial behavior and population regu-lation in birds. A review and re-evaluation. — Wilson Bull. 81: 293–329.
Chamberlain, D. E., Fuller, R. J., Bunce, R. G. H., Ducks-worth, J. C. & Shrubb, M. 2000: Changes in the abun-dance of farmland birds in relation to the timing of agricultural intensification in England and Wales. — J. Appl. Ecol. 37: 771–788.
Conrads, K. 1969: Beobachtungen am Ortolan (Emberiza
hortulana L.) in der Brutzeit. — J. Ornithol. 110: 379–420. [In German with English summary].
Cramp, S. & Perrins, C. M. (eds.) 1994: The Birds of the Western Palaearctic, vol. IX. — Oxford University Press, Oxford.
Dale, S., Lunde, A. & Steifetten, Ø. 2005: Longer breeding dispersal than natal dispersal in the ortolan bunting. — Behav. Ecol. 16: 20–24.
Durango, S. 1948: Notes sur la reproduction de Bruant orto-lan en Suède. — Alauda 16: 1–20.
Etterson, M. A. 2003: Conspecific attraction in logger-head shrikes: implications for habitat conservation and reintroduction. — Biol. Conserv. 144: 199–205.
Fretwell, S. D. & Lucas, H. L. Jr. 1969: On territorial behav-ior and other factors influencing habitat distribution in birds. — Acta Biotheor. 19: 16–36.
Fuller, J. R., Gregory, R. D., Gibbons, D. W., Marchant, J. H., Wilson, J. D. & Carter, N. 1995: Population declines and range contractions among lowland farmland birds in Britain. — Conserv. Biol. 9: 1425–1441.
Goławski, A. & Dombrowski, A. 2002: Habitat use of Yel-lowhammers Emberiza citrinella, Ortolan Buntings E. hortulana and Corn Buntings Miliaria calandra in farmland of east-central Poland. — Ornis Fennica 79: 164–72.
Haukioja, M., Kalinainen, P. & Nuotio, K. 1985: Maa-talouden vaikutus peltolinnustoon, esitutkimusraportti. — Ympäristöministeriön ympäristön- ja luonnonsuoje-luosaston julkaisu A: 34.
Koskimies, P. & Väisänen, R. A. (eds.) 1991: Monitoring bird populations. — Finnish Museum of Natural His-tory, Helsinki.
Kujawa, K. 2002: Population density and species composi-tion changes for breeding bird species in farmland woodlots in western Poland between 1964 and 1994. — Agr. Ecosyst. Environ. 91: 261–271.
Mikkonen, A. V. 1985: Establishment of breeding territory by the chaffinch Fringilla coelebs, and the brambling F. montifringilla, in northern Finland. — Ann. Zool. Fen-nici 22: 137–156.
Muller, K. L., Stamps, J. A., Krishnan, V. V. & Willits, N. H. 1997: The effects of conspecific attraction and habitat quality on habitat selection in territorial birds (Troglo-dytes aedon). — Am. Nat. 150: 650–661.
Nagelkerke, N. J. D. 1991: A note on a general definition of the coefficients of determination. — Biometrika 78: 691–692.
Nævra, A. 2002: The fateful hour of the Ortolan Bunting (Emberiza hortulana). — Vår Fuglefauna 25: 62–81. [In Norwegian with English summary].
Newton, I. 1998: Population limitation in birds. — Academic Press, London.
Norrdahl, K. 1990: Birds of plain fields in western Finland. — Suomenselän Linnut 25: 44–50. [In Finnish with Eng-lish summary].
Piha, M., Pakkala, T. & Tiainen, J. 2003: Habitat preferences of the Skylark Alauda arvensis in southern Finland. — Ornis Fennica 80: 97–110.
Pynnönen. A. 1954: Beiträge zur Kenntnis der Lebensweise des Haselhuhns, Tetrastes bonasia (L.). — Papers on
ANN. Zool. FeNNIcI Vol. 44 • Importance of breeding groups for territory occupancy 19
Game Research 12:1–90.Reed, J. M. 1999: The role of behavior in recent avian
extinctions and endangerments. — Conserv. Biol. 13: 232–241.
Reed, J. M. & Dobson, A. P. 1993: Behavioural constraints and conservation biology: conspecific attraction and recruitment. — Trends Ecol. Evol. 8: 253–256.
Rintala, J., Tiainen, J. & Pakkala, T. 2003: Population trends of Finnish starling Sturnus vulgaris, 1952–1998, as inferred from annual ringing totals. — Ann. Zool. Fen-nici 40: 365–385.
SAS Institute Inc. 1999: SAS OnlineDoc®, ver. 8. — SAS Institute Inc., Cary, NC.
Siriwardena, G. M., Baillie, S. R., Buckland, S. T., Fewster, R. M., Marchant, J. H. & Wilson, J. D. 1998: Trends in the abundance of farmland birds: a quantitative com-parision of smoothed common bird census indices. — J. Appl. Ecol. 35: 24–43.
Stamps, J. A. 1988: Conspecific attraction and aggregation in territorial species. — Am. Nat. 131: 329–347.
Svensson, S., Svensson, M. & Tjernberg, M. 1999: Svensk fågelatlas. — Vår Fågelvärld, supplement 31, Stock-holm.
Tiainen, J. 2001: The Finnish agricultural environments. — In: Pitkänen, M. & Tiainen, J. (eds.), Biodiversity of agricultural landscapes in Finland: 9–12. BirdLife Finland Conservation Series No. 3, Yliopistopaino, Hel-sinki, Finland.
Tiainen, J. 2004: Maatalousympäristön historia. — In: Tiai-nen, J., Kuussaari, M., Laurila, I. P. & Toivonen T. (eds.), Elämää pellossa. Suomen maatalousympäristön monimuotoisuus: 26–40. Edita Publishing, Helsinki, Fin-land.
Tiainen, J. & Pakkala, T. 2000: Population changes and monitoring of farmland birds in Finland. — In: Solonen, T. & Lammi, E. (eds.), Linnut-vuosikirja 1999: 98–105.
BirdLife Suomi, Luonnontieteellinen keskusmuseo ja Suomen ympäristökeskus, Helsinki, Finland.
Tiainen, J. & Pakkala, T. 2001: Birds. — In: Pitkänen, M. & Tiainen, J. (eds.), Biodiversity of agricultural landscapes in Finland: 33–50. BirdLife Finland Conservation Series No. 3, Yliopistopaino, Helsinki, Finland.
Tiainen, J., Saurola, P. & Solonen, T. 1984: Nest distribution of the Pied Flycatcher Ficedula hypoleuca in an area saturated with nest boxes. — Ann. Zool. Fennici 21: 199–204.
Tiainen, J., Pakkala, T., Piiroinen, J., Vickholm, M. & Viro-lainen, E. 1985: Changes in the avifauna of farmland at Lammi, Southern Finland during the past 50 years. — Lintumies 20: 30–42. [in Finnish with English sum-mary].
Tryjanowski, P. 2000: Changes in breeding populations of some farmland birds in W Poland in relation to changes in crop structure, weather conditions and number of predators. — Folia Zool. 49: 305–315.
Tucker, G. M. & Heath, M. F. 1994: Birds in Europe: their conservation status. — BirdLife International (BirdLife Conservation Series No. 3), Cambridge, U. K.
Vepsäläinen, K. 1968: The effect of the cold spring 1966 upon the Lapwing (Vanellus vanellus) in Finland. — Ornis Fennica 45: 33–47.
Vepsäläinen, V., Pakkala, T., Piha, M. & Tiainen, J. 2005: Population crash of the ortolan bunting Emberiza hor-tulana in agricultural landscapes of southern Finland. — Ann. Zool. Fennici 42: 91–107.
Väisänen, R. A. 2001: Steep recent decline in Finnish breed-ing populations of the Wryneck, Wheatear, Chiffchaff and Ortolan Bunting. — Linnut 36: 14–15. [In Finnish with English summary].
Wiens, J. A. 1989: The ecology of bird communities, vol. 1: Foundations and patterns. — Cambridge studies in ecol-ogy, Cambridge University Press.
This article is also available in pdf format at http://www.annzool.net/