Embed Size (px)
Citation preview

General rights Copyright and moral rights for the publications made accessible in the public portal are retained by the authors and/or other copyright owners and it is a condition of accessing publications that users recognise and abide by the legal requirements associated with these rights.
• Users may download and print one copy of any publication from the public portal for the purpose of private study or research. • You may not further distribute the material or use it for any profit-making activity or commercial gain • You may freely distribute the URL identifying the publication in the public portal
If you believe that this document breaches copyright please contact us providing details, and we will remove access to the work immediately and investigate your claim.
Downloaded from orbit.dtu.dk on: Jun 14, 2018
The importance of mass spectrometric dereplication in fungal secondary metaboliteanalysis
Nielsen, Kristian Fog; Larsen, Thomas Ostenfeld
Published in:Frontiers in Microbiology
Link to article, DOI:10.3389/fmicb.2015.00071
Publication date:2015
Document VersionPublisher's PDF, also known as Version of record
Link back to DTU Orbit
Citation (APA):Nielsen, K. F., & Larsen, T. O. (2015). The importance of mass spectrometric dereplication in fungal secondarymetabolite analysis. Frontiers in Microbiology, 6, [71]. DOI: 10.3389/fmicb.2015.00071
REVIEW ARTICLEpublished: 17 February 2015
doi: 10.3389/fmicb.2015.00071
The importance of mass spectrometric dereplication infungal secondary metabolite analysisKristian F. Nielsen and Thomas O. Larsen*
Department of Systems Biology, Technical University of Denmark, Kongens Lyngby, Denmark
Edited by:
Nancy Keller, University ofWisconsin–Madison, USA
Reviewed by:
Tim S. Bugni, University ofWisconsin–Madison, USANicholas Oberlies, University of NorthCarolina at Greensboro, USA
*Correspondence:
Thomas O. Larsen, Department ofSystems Biology, Technical Universityof Denmark, Soeltofts Plads B221,Kongens Lyngby DK-2800, Denmarke-mail: [email protected]
Having entered the Genomic Era, it is now evident that the biosynthetic potential offilamentous fungi is much larger than was thought even a decade ago. Fungi harbor manycryptic gene clusters encoding for the biosynthesis of polyketides, non-ribosomal peptides,and terpenoids – which can all undergo extensive modifications by tailoring enzymes –thus potentially providing a large array of products from a single pathway. Elucidating thefull chemical profile of a fungal species is a challenging exercise, even with elementalcomposition provided by high-resolution mass spectrometry (HRMS) used in combinationwith chemical databases (e.g., AntiBase) to dereplicate known compounds.This has led to acontinuous effort to improve chromatographic separation in conjunction with improvementin HRMS detection. Major improvements have also occurred with 2D chromatography, ion-mobility, MS/MS and MS3, stable isotope labeling feeding experiments, classic UV/Vis,and especially automated data-mining and metabolomics software approaches as thesheer amount of data generated is now the major challenge. This review will focus onthe development and implementation of dereplication strategies and will highlight theimportance of each stage of the process from sample preparation to chromatographicseparation and finally toward both manual and more targeted methods for automateddereplication of fungal natural products using state-of-the art MS instrumentation.
Keywords: liquid chromatography, metabolomics, mass spectrometry, diode array detection, dereplication
INTRODUCTIONFilamentous fungi are prolific producers of secondary metabolites(SM) of importance to humankind. Useful fungal metabolitesinclude drugs, food colorants, feed additives, industrial chem-icals, and biofuels (Bills, 1995; Bode et al., 2002; Firn and Jones,2003; Butler, 2004). Fungi are also known for their negative conse-quences as contaminants of food and feed due to the production ofmycotoxins which can be cytotoxic, immunotoxic, estrogenic, orcarcinogenic (Miller, 2008; Shephard, 2008). Fungi can also causeinvasive human infections, especially in immuno-compromisedindividuals (Larsen et al., 2007).
Having entered the Genomic Era it is now clear that the biosyn-thetic and metabolic diversity potential of filamentous fungi, isstill vast, due to the presence of many cryptic SM encodinggene clusters. This is particularly true for non-model organisms.The abundance of cryptic gene clusters has resulted in the useof many strategies to stimulate gene expression aimed towardthe discovery of novel bioactive compounds and characteriza-tion of their biosynthetic pathways (Bode et al., 2002; Bergmannet al., 2007; Bok et al., 2009; Schroeckh et al., 2009; Sarkara et al.,2012; Sørensen et al., 2012; Droce et al., 2013; Sorensen and Son-dergaard, 2014). Uncovering the full chemical potential of anymicro-organism is a challenging exercise. Firstly, expression ofmetabolites related to a given gene cluster is highly regulated andmay only be expressed under special condition, and furthermoreeach cluster may be responsible for more than 10 end productsand a similar number of stable intermediates also present indetectable concentrations (Degenkolb et al., 2006; Chiang et al.,
2010; Nielsen et al., 2011b; Ali et al., 2014; Holm et al., 2014;Petersen et al., 2015). In addition, crosstalk between biosyntheticpathways can result in compounds that are products of morethan one gene cluster (Nielsen et al., 2011b; Tsunematsu et al.,2013). Overall this results in an extremely complex pool of diversesmall organic molecules to identify by chemical analysis, especiallywhen considering a single species of Aspergillus and Fusariumcontains 50–80 gene clusters (Sanchez et al., 2012; Lysoe et al.,2014).
It is common for natural products to have identical elementalcomposition (up to 130 for some terpenes) making unambigu-ous identification very challenging. As such, without access toauthentic standards, elemental composition alone – obtained byhigh resolution mass spectrometry (HRMS) –is not enough tounambiguously identify compounds (Nielsen et al., 2011a; El-Elimat et al., 2013). Consequently, fast identification of previouslydescribed compounds without reference standards – known asdereplication – is a very challenging task. As reference standardsof most secondary metabolite standards are not available, fastdereplication is vital for progress in both drug discovery and path-way elucidation projects (Cordell and Shin, 1999; Dinan, 2005;Zhang, 2005; Bitzer et al., 2007; Feng and Siegel, 2007; Stadler et al.,2009; Zengler et al., 2009; Nielsen et al., 2011a). Dereplication ismost often done by Ultra high performance liquid chromatog-raphy (UHPLC) coupled to diode array detection (DAD) andHRMS, in combination with database searching. Proper derepli-cation strategies ensures that time consuming and costly effortswith isolation and subsequent NMR based structure elucidation
www.frontiersin.org February 2015 | Volume 6 | Article 71 | 1

Nielsen and Larsen Dereplication by LC-MS
can be focused solely on novel compounds (Cordell and Shin,1999) or that re-isolation of known compounds can be donein an efficient way based on functional groups and thus fewersteps (Månsson et al., 2010). This paper will highlight importantissues and recent approaches toward fast and reliable derepli-cation of fungal NPs primarily based on UHPLC-DAD-HRMStechniques.
THE IMPORTANCE OF SAMPLE PREPARATIONThe chemical diversity which is found both between and withinthe many classes of secondary metabolites (e.g., polyketides(PKs), non-ribosomal peptides (NRPs) and terpenoids), makesit impossible to quantitatively extract all secondary metabolitesfrom a given fungus using a single procedure. Consequently,sample preparation is an important aspect of secondary metabo-lite profiling and will, no matter the choice of method, leadto bias toward certain types of compounds. To avoid extract-ing too many polar media components, primary metabolitesand sugars an organic extraction is needed using one or morewater-immiscible solvents such as ethyl acetate (EtOAc; Nielsenet al., 2011a; Stadler et al., 2014), dichloromethane (DCM; Abdel-Mawgoud et al., 2008), or 1-butanol (Yokota et al., 2012). Thelatter is efficient for the extraction of lipopeptides but has ahigh boiling point (118◦C), thus requiring both N2 and heat-ing for evaporation. The pH is vital for an organic extraction,as ionizable molecules will be extracted into the organic phaseto a much higher degree in their neutral form than when ina charged state. As almost 50% of all described fungal NPs(Månsson et al., 2010) contains an acidic moiety, a low pHextraction is necessary in most cases but can be supplementedwith a neutral extraction (e.g., for stability reasons). Solventssuch as ethers (highly flammable and able to form explosiveperoxides) as well the carcinogenic and environmental damag-ing chloroform (CHCl3) and carbon tetrachloride (CCl4) arebeing phased out. Methanol and ethanol are also efficaciousbut, due to their high polarity, also results in the extrac-tion of large quantities of salts and polar interfering substanceswhich can quickly clog analytical HPLC columns. On the otherhand, methanol/ethanol extracts can also contain highly non-polar waxes, sterols and triglycerides, however, these can usu-ally be flushed out of the column at 80◦C with a mixture ofacetonitrile-isopropanol for 1 h. We have experienced that injec-tion of 1 μl of crude methanol extracts from marine mediaclogged an LC-MS electrospray source after analyzing only fourextracts.
For extraction with EtOAc an essential process is the centrifu-gation of the 2-phase system as hard as possible then leavingbehind the common interfacial agglomeration containing cells.Drying EtOAc extracts with anhydrous Na2SO4 can also resultin cleaner extracts as EtOAc can contain up to 8% water. Amajor pitfall in sample preparation is the possibility of unwantedchemical reactions taking place. For example, alcohols can formesters with carboxylic acids and lactones (e.g., in homoserinelactones, rubratoxins, statins) under acidic conditions and canalso catalyze various intramolecular changes (Rundberget et al.,2004). Acid catalyzed reactions can be especially problematicwhen evaporating organic extracts, since the lower volatility
of acids such as formic and acetic acids will result in upcon-centration when using volatile solvents like EtOAc and DCM,especially in the presence of residual water. Examples we haveobserved include; up to 50% loss of patulin during evapora-tion from EtOAc (Boonzaaijer et al., 2005); loss of trichothecenesprior to derivatization for GC-MS analysis (Langseth and Rund-berget, 1998); up to 80% loss of fumonisins due to binding tothe silanol groups of non-derivatized glass with up to 80% lost(Nielsen et al., 2015). We have used a fast extraction procedureto minimize the risk of studying artifact peaks, this procedureinvolves extraction into acetonitrile-water (1:1; in a ultrason-ication bath or a beadbeater for circa 10 min), followed bycentrifugation and subsequent transfer of the centrifugate directlyto an auto-sampler compatible vial for analysis (Mogensen et al.,2011).
In some cases samples need to be purified on small solid phaseextraction (SPE) columns to remove chromatography impairinglipids and phospholipids (Degenkolb et al., 2006; Pucci et al., 2009)or abundant but common secondary metabolites (e.g., as is Stachy-botrys; Hinkley and Jarvis, 2000; Andersen et al., 2002). But SPEcan also be used to simplify very complex extracts into severalfractions. For example, ion exchange SPE can be used to separatean extract into acidic, neutral and basic analytes (Månsson et al.,2010), which may resolve new peaks and simplify the mass spectra.For an orthogonal separation to the common reversed phase ana-lytical separation, we prefer diol or amino-propyl normal phaseSPE (Bladt et al., 2013; Petersen et al., 2015) as we have found themto better separate compound classes compared to, e.g., pure silica.
ANALYTICAL SEPARATIONWhen grown on rich growth media fungi often produce in excess of100 SMs (Stadler et al., 2007, 2014; Bertrand et al., 2013; Kildgaardet al., 2014; Klitgaard et al., 2014; Wolfender et al., 2015). With suchcomplex mixtures it is practically impossible to acquire enoughseparation power to provide complete resolution of all individ-ual metabolites and media components and allow for subsequentspectroscopic analysis. On balance, by far the best choice forseparation is reverse phase (RP) chromatography, since it’s polar-ity is well suited to most SMs, especially with the emergence ofmore polar phases such as pentafluoro phenyl, biphenyl, phenyl(Kildgaard et al., 2014; Wolfender et al., 2015) and also columnswith various embedded groups (Euerby and Petersson, 2005).Many vendors have introduced improved the solid core particles oftheir stationary phase, ensuring no diffusion through the particlecenter (e.g., Poroshell, Kinetex, Ascentis, and Cortecs). Fur-thermore, hybrid chemistry particles (e.g., Waters BEH) providesharper peaks as well as reduced tailing due to secondary interac-tions at a wide pH range. Performing LC at low pH is statisticallypreferably as 50% of all secondary metabolites contain an acidicmoiety, while ca. 10% have a basic moiety (Månsson et al., 2010).Since sharper peaks are obtained from the non-charged state ofSMs, low pH is preferable in RP chromatography. Undoubtedlythe most prevalent buffers/acidifiers used are formic and aceticacid (Varga et al., 2013). Although triflouroacetic acid (TFA) iscommonly utilized to lower the pH,this has the consequence of sig-nificantly suppressing negative ionization MS detection. We havechosen formic acid as, in addition to its lower pKa, it suppresses
Frontiers in Microbiology | Microbial Physiology and Metabolism February 2015 | Volume 6 | Article 71 | 2
Nielsen and Larsen Dereplication by LC-MS
microbial growth in solvent reservoirs to a greater extent thanacetic acid. We have found that, in general, formic acid appearsto give sharper peaks at lower concentrations than acetic acid,and thus lower suppression of the UV signal. Although the useformic acid to adjust the pH is generally satisfactory, for somecompounds it results in poor ionization, for example type B tri-chothecenes (Sulyok et al., 2006). Formic acid may also not beoptimal if the majority of analysis is performed in negative mode –in which case acetic acid performs better – or if the analysis is per-formed under non-acidic conditions (Sulyok et al., 2006; Zhanget al., 2012).
Comprehensive 2D LC (Dugo et al., 2009; Chen et al., 2012)have recently been introduced by several of the UHPLC manufac-tures and introduced some interesting possibilities for orthogonalseparation through the use of a long high-polarity HPLC column(20–30 min run) in the first dimension and a short highly retentivesmall particle C18 in the second dimension (20–30 s runs).
Whereas RP chromatography is usually a suitable choicefor the separation of the wide range of middle-polarity sec-ondary metabolites mainly produced by fungi, smaller verypolar compounds are usually poorly retained. As a result ofthe lack of retention this chemical window has been exploitedto a much lesser degree due to difficulties with analysis.To better investigate compounds in this high polar and/orionic window (compounds with LogD < -3) techniques suchas HILIC (Sørensen et al., 2007; Creek et al., 2011), high-pH ion-chromatography (IC; van Dam et al., 2002; Kvitvanget al., 2014) or ion-pair chromatography (Lebrun et al., 1989;Werner, 1993; Magdenoska et al., 2013) are needed to suffi-ciently retain the analytes. Common to all these techniquesis that the window of separation is much narrower than forthe extremely versatile RP, thus requiring more optimization.A major benefit of these techniques can be found in thatmany NP chemists only examine organic extractable compoundsthereby overlooking many interesting high polar compounds(Cannall, 1998; Dufresne, 1998; Shimizu, 1998; Månsson et al.,2010). Other alternative choices for retention of polar com-pounds include anion or cation mixed mode columns (Apfelthaleret al., 2008). Examples such as the Dionex Trinety or thePrimeSep columns can retain anionic and/or cationic analytesstrongly while also performing conventional RP chromatography(Lammerhofer et al., 2008).
Though LC is the dominant technique for the separation ofcompounds from complex mixtures there are several alternatives.For volatile compounds such as terpenes or compounds (e.g.,acids) that can be derivatized to heat stable analytes GC-MS can bean efficient choice. GC-MS can be beneficial both due to the supe-rior separation (10-100 higher peak capacity) but also due to thereproducible EI+ ionization that can be employed. Furthermore,technological improvements such as comprehensive GC × GC arebecoming more affordable and dedicated TOFMS detectors for GCare being developed delivering accurate mass (<5 ppm accuracy)as well as GC-APCI interfaces for molecular mass identification.
Most recently, significant technological advances have occurredin the previously neglected field of supercritical fluid chromatog-raphy (SFC). Improvements have been made to SFC with bettercolumns and much enhanced reproducibility by both Waters
and Agilent. Together with novel column systems, many forenantiomeric separation, we foresee that this technique willbecome very valuable for analysis of SMs from the mid-polarregion to the extremely non-polar (e.g., waxes and sterol esters).The technology can now be used with UV detection and isespecially well suited for APCI.
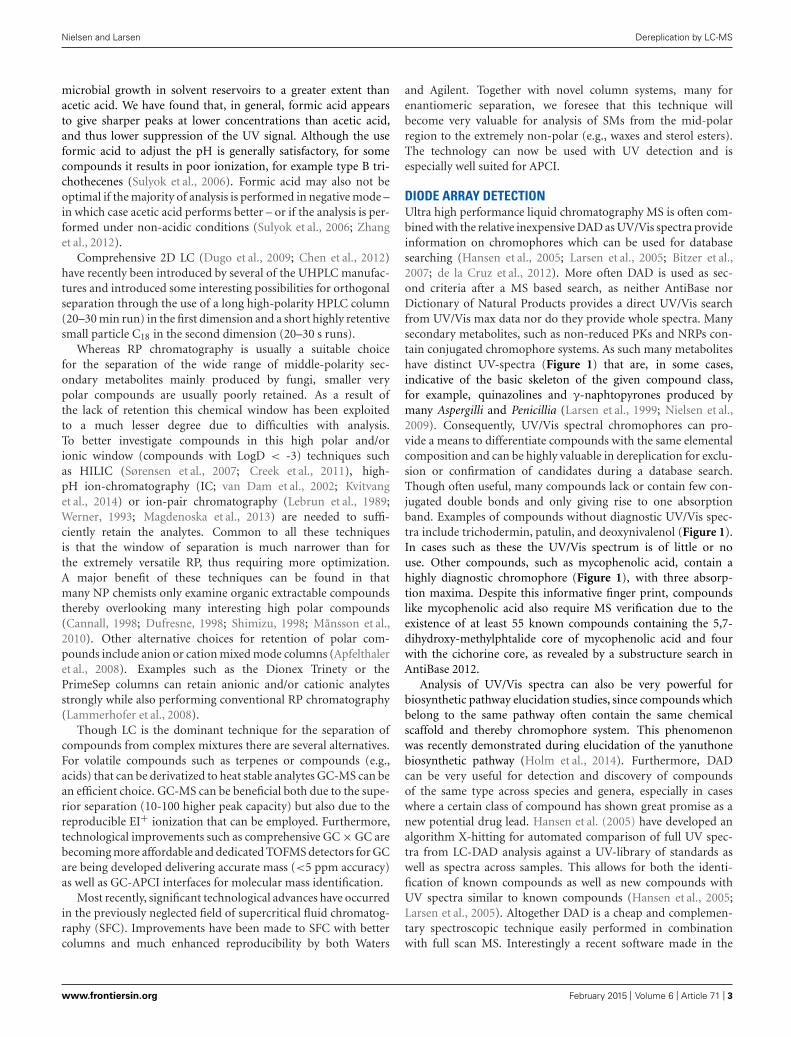
DIODE ARRAY DETECTIONUltra high performance liquid chromatography MS is often com-bined with the relative inexpensive DAD as UV/Vis spectra provideinformation on chromophores which can be used for databasesearching (Hansen et al., 2005; Larsen et al., 2005; Bitzer et al.,2007; de la Cruz et al., 2012). More often DAD is used as sec-ond criteria after a MS based search, as neither AntiBase norDictionary of Natural Products provides a direct UV/Vis searchfrom UV/Vis max data nor do they provide whole spectra. Manysecondary metabolites, such as non-reduced PKs and NRPs con-tain conjugated chromophore systems. As such many metaboliteshave distinct UV-spectra (Figure 1) that are, in some cases,indicative of the basic skeleton of the given compound class,for example, quinazolines and γ-naphtopyrones produced bymany Aspergilli and Penicillia (Larsen et al., 1999; Nielsen et al.,2009). Consequently, UV/Vis spectral chromophores can pro-vide a means to differentiate compounds with the same elementalcomposition and can be highly valuable in dereplication for exclu-sion or confirmation of candidates during a database search.Though often useful, many compounds lack or contain few con-jugated double bonds and only giving rise to one absorptionband. Examples of compounds without diagnostic UV/Vis spec-tra include trichodermin, patulin, and deoxynivalenol (Figure 1).In cases such as these the UV/Vis spectrum is of little or nouse. Other compounds, such as mycophenolic acid, contain ahighly diagnostic chromophore (Figure 1), with three absorp-tion maxima. Despite this informative finger print, compoundslike mycophenolic acid also require MS verification due to theexistence of at least 55 known compounds containing the 5,7-dihydroxy-methylphtalide core of mycophenolic acid and fourwith the cichorine core, as revealed by a substructure search inAntiBase 2012.
Analysis of UV/Vis spectra can also be very powerful forbiosynthetic pathway elucidation studies, since compounds whichbelong to the same pathway often contain the same chemicalscaffold and thereby chromophore system. This phenomenonwas recently demonstrated during elucidation of the yanuthonebiosynthetic pathway (Holm et al., 2014). Furthermore, DADcan be very useful for detection and discovery of compoundsof the same type across species and genera, especially in caseswhere a certain class of compound has shown great promise as anew potential drug lead. Hansen et al. (2005) have developed analgorithm X-hitting for automated comparison of full UV spec-tra from LC-DAD analysis against a UV-library of standards aswell as spectra across samples. This allows for both the identi-fication of known compounds as well as new compounds withUV spectra similar to known compounds (Hansen et al., 2005;Larsen et al., 2005). Altogether DAD is a cheap and complemen-tary spectroscopic technique easily performed in combinationwith full scan MS. Interestingly a recent software made in the
www.frontiersin.org February 2015 | Volume 6 | Article 71 | 3

Nielsen and Larsen Dereplication by LC-MS
FIGURE 1 | UV/Vis spectra (pH 3) and structures of some common fungal natural products illustration the diversity in absorption range depending on
the number of conjugated double bonds present in the molecules.
same R environment1 as the popular XC-MS package (vide infra)for LC-MS, is now also available for LC-DAD (Wehrens et al.,2014).
Other (non-MS) detectors which are often used in combinationwith LC are evaporative light scattering detectors (ELSD; Bitzeret al., 2007; Yang et al., 2014) and the Corona cad detectors. Thesedetectors give more quantitative information about the amount ofcompounds eluting from the LC unit, in contrast to MS detectorswhich are highly biased.
MASS SPECTROMETRYToday all MS instrumentations coupled to LC rely on atmosphericpressure ionization (API) techniques such as electrospray ioniza-tion (ESI), atmospheric pressure chemical ionization (APCI), oratmospheric pressure photo ionization (APPI). These are all softionization techniques, as such only limited fragmentation fungalSMs takes place at standard ionization conditions compared towhat is seen when using hard ionization such as electron impact(EI) which is used for gas chromatography. Although limited frag-mentation is usually observed, the default ion-source settings frommany of the LC-MS manufactures, especially for ESI, cause quiteextensive fragmentation to occur for very low molecular mass SMs(<300 Da) on most LC-MS systems (Nielsen et al., 2011a; Klit-gaard et al., 2014; Rasmussen et al., 2014). Thus can the task ofidentifying the molecular mass in an API generated spectra becomequite troublesome as a mix of fragment ions adducts and dimericand double charged ions may be generated (Figure 2; Nielsen et al.,2011a; Kildgaard et al., 2014; Klitgaard et al., 2014). Consequently,the task of identifying the molecular mass in API generated spec-tra comes down to interpretation of the adduct patterns thatcan be seen for the different types of secondary metabolites(Figure 2).
Correct assessment of the molecular mass (M) is often nottrivial as in-source fragmentation and adduct formation can lead
1http://www.r-project.org/
to incorrect assignment of ions such as [M+Na]+, [M+NH4]+or [M-H2O+H]+ as [M+H]+ (Nielsen et al., 2011a) or due tothe low abundance of the [M+H]+ ion due to poor ioniza-tion under the selected conditions. A combination of both ESI+and ESI− ionization will assign the mass unambiguously, whilejust one polarity will only assign the mass unambiguously, whenseveral adducts in a given mass spectrum all points toward thesame molecular mass (Nielsen and Smedsgaard, 2003; Nielsenet al., 2011a). When the mass, or even better elemental compo-sition, has been determined, this information can be searchedagainst the literature to determine whether the compound islikely known or novel. AntiBase is currently the most suitabledatabase for dereplication of fungal secondary metabolites asit only contains microbial metabolites. The 2014 version con-tains 43000 recorded compounds, including ∼18000 fungal and21000 bacterial compounds. Dictionary of Natural Products addi-tionally contains a large number of plant metabolites (some ofwhich are produced by endophytic fungi and not the plant them-selves), thus is this database a valuable addition to AntiBase. Thedatabases Scifinder/CAS and RSC/Chemspider are highly biasedtoward synthetic compounds, and of less value. Furthermore hitsin these databases cannot be sorted by organism type (Lang et al.,2008; Nielsen et al., 2011a). For Marine derived fungi MarineLit(Blunt et al., 2008) may be of interest and now available viaRSC/Chemspider2.
In recent years data handling software has become the mostcrucial component of successful dereplication. Modern UHPLC-MS instruments can provide 50–200 data files per day with MSand tandem MS data, this can take many hours if not days per datafile to manually handle, thus mandating more automated derepli-cation approaches. As with manual dereplication, the indisputablefirst step in automated dereplication is determination of the ele-mental composition of the individual compounds in the sample.For this accurate mass is vital. Depending on the mass range and
2http://pubs.rsc.org/marinlit/
Frontiers in Microbiology | Microbial Physiology and Metabolism February 2015 | Volume 6 | Article 71 | 4

Nielsen and Larsen Dereplication by LC-MS
FIGURE 2 | Position of ions relative to the monoisotopic mass, of
ESI+ (A), ESI− (B) and EI+ (C) along with adduct ions, and 3
example ESI spectra. In shamixanthone (D) the [M+H]+ ion is absentbut the molecular mass can easily be assigned using the �40 (39.9925)
between the [M+Na]+ and the [M+H-H2O]+. In (E,F) the big differenceof formate adduct intensity on the austinols (same run, elutes 0.4 minin-between) is illustrated. For instrument settings see Kildgaard et al.(2014).
the instrumental accuracy the elemental composition can oftenbe determined unambiguously up to 300 Da at an accuracy of5 ppm, while 1–2 ppm is required for compounds with masses upto 5–600 Da (Kind and Fiehn, 2007; Nielsen et al., 2011a). Whenaccurate isotope ratio assessment is also reliable, it is possible toeliminate close lying elemental composition candidates with dif-ferent numbers of carbon atoms (Bitzer et al., 2007; Lehner et al.,2011; Nielsen et al., 2011a; Bueschl et al., 2012; Sleno, 2012; Xianet al., 2012; Nagao et al., 2014).
Today the market is dominated by time of flight (TOF), Orbi-trap, and Fourier transform ion cyclotron (FT-ICR) based massspectrometers. TOF instruments deliver both superior isotopicratios as well as an unmatched scan speed providing ample timefor concurrent MS/MS experiments or the possibility of ultra-fastseparation runs. A serious drawback of TOF based instruments isoverloading of the detector leading to poor mass accuracy, whichwas very pronounced on the earlier TDC type detectors. Evenfor the newest 4 GHz ADC detectors overloading is still a prob-lem and TOF related software needs to limit analysis to scans fromthe non-overloaded parts of the chromatographic peak (Kildgaardet al., 2014). Overall this results in poorer mass resolution thanthe two other common types of HRMS instruments. The FT-ICRtechnology provides an unsurpassed mass accuracy and resolu-tion, for example an FT-ICR can easily resolve the A+2 ion ofsulfur containing ions into the 12Cx
13C232S and 12Cx+2
34S iso-topomers. Unfortunately FT-ICR instruments suffer from highrunning costs for magnets, high acquisition price, as well as slowscan capability. The practical limitations of FT-ICR instrumentshave made Orbitrap type instruments much more popular as theydo not require the expensive cooling of the superconducting mag-nets. In contrast to TOF based instruments Orbitraps do notsuffer from the detector overload and needs less frequent mass
calibration, though they deliver significantly slower scan speeds.The linear ion-trap (LIT)-orbitrap types can provide MSn forfragmentation trees due to a dual detector providing both highand low resolution spectra, while Quadrupole (Q)-Exactive pro-vides MS/MS as a QTOF and better quantitative performance thanthe Lit-Orbitrap, as well as the possibility of positive/negativeswitching.
Some of the earlier Orbitrap types used an ion-trap for frag-mentation and helium as collision gas, which does not providethe same fragment ions as heavier gasses. Furthermore, ion-trapping usually has a limited m/z trapping window, a limitationthat have been overcome by adding an additional collision cellon newer models (Perry et al., 2008). With respect to MS/MSspectra obtained from QqQ and QTOF instruments, we findthe Q-Orbitrap to be superior. A class of lower cost instru-ments, which can perform MSn, are ion-trap (IT) spectrometers,albeit with low mass accuracy. This is very useful for peptideidentification, and for other polymeric molecules made up ofknown units. In regard to dereplication, the common occurrenceof chromatographic peaks indicating an unknown compoundrenders IT instruments inferior to accurate mass instruments.Triple quadrupole instrumentations have very poor full-scansensitivity and are cost wise a poor choice for dereplication appli-cations, but highly valuable for environmental analyses wheresensitivity is the most important parameter (Sulyok et al., 2006;Sørensen et al., 2009).
For a number of years ion-mobility has been used in a rangeof configurations, for example, in the Waters Synapt instrumentused for differentiating drift times of the fragment ions afterMS/MS, however this has limited applications in SM analysis.Recently (May et al., 2014), a much higher resolution ion-mobilityinterface (positioned between the API source and a QTOF) has
www.frontiersin.org February 2015 | Volume 6 | Article 71 | 5

Nielsen and Larsen Dereplication by LC-MS
been disclosed and appears extremely promising to resolve co-eluting compounds which often have very different masses andcross sectional areas. Deconvolution of chromatographically co-eluting compounds can occur as the pseudo molecular ions andsimple fragment ions (e.g., [M+H-H2O]+) have almost the samecross-section and thus same drift times. In contrast the co-elutingcompounds are likely to have different cross sectional area anddifferent drift times so can then be deconvoluted in the drifttime dimension. This will provide a cleaner MS spectrum andmore reliable interpretation of the molecular mass. Theoreti-cally, a three dimensional deconvolution using both retention timeand drift time can be used, but has to our knowledge not beendeveloped.
AUTOMATED TARGETED ANALYSISAn alternate dereplication strategy is to search LC-MS data filesfor the masses (preferable accurate masses or elemental composi-tions) of a list of possible known compounds. This strategy, namedaggressive dereplication, has been shown to work well for lists upto 3000 compounds (Kildgaard et al., 2014; Klitgaard et al., 2014),using the software from several manufactures. A major challengeis fragile compounds that easily fragment in the ion-source andthus appear as another elemental composition, leading to erro-neous compound identification. The technology can be improvedtremendously by introducing pseudo MS/MS in a second scantrace, so the instrument alternates between high and low fragmen-tation during a run (MS-All, MS-E, All-Ions; Ojanpera et al., 2006;Broecker et al., 2011; Guthals et al., 2012; El-Elimat et al., 2013)to obtain compound specific fragment ions known from our ownstandards, literature data, or from in-silico fragmentation (Hill andMortishire-Smith, 2005; Kangas et al., 2012; Hufsky et al., 2014).The MS-All, MS-E, All-Ions strategy also has the advantage thatthe [M+Na]+ is often enhanced in the fragmentation trace andan accurate confirmation of [M+Na]+ to [M+H]+ or [M+H-H2O]+ cuts down on the number of false positives resultingfrom misidentification of in-source fragment ions (e.g., [M+H-H2O]+ being identified as [M+H]+ of another compound). Herewe have observed that using an algorithm locking the pair likeBruker Target 1.3, Agilent Quant (vide infra), or ACD/SpectrusProcessor provides 2–10 fold less false positives than Agilent Qual(Kildgaard et al., 2014) or Bruker Target 1.2 (Klitgaard et al., 2014)where one cannot require pairs of [M+Na]+ and [M+H]+ or[M+H-H2O]+.
CONSTRUCTION OF COMPOUND DATABASEAn important part of targeted analysis is construction of the com-pound database to be used for searching. Kildgaard et al. (2014)and Klitgaard et al. (2014) used ACD Chemfolder (AdvancedChemistry Development, Toronto, ON, Canada) for construc-tion of a database including: (i) a number of in-house referencestandards; (ii) a selection of common fungal compounds fromAntiBase; (iii) common impurity compounds known from blanksamples or as common media components, and finally iv) a num-ber of tentatively identified compounds. Compound-databasehandlers like Chemfolder or Chemfinder have the advantage ofthe ability to perform substructure searches, which is why theseare preferred for a master database. For each compound, major
adducts (known or predicted) were registered in the database[41]. If known and/or predicted fragment ions from an alternat-ing broad band fragmentation (MS-E, All-Ions) are included thespecificity is greatly increased.
The next step is to create a taxonomically relevant search list(if chemotaxonomic data from properly identified fungal iden-tifications are available). If a species specific search list is notavailable data from the whole genus may be used dependingon the number of compounds described. However, a balancemust be found between the number of false positives fromcompounds with the same elemental composition and with com-pounds failing to be identified and requiring subsequent manualdeconvolution.
Minor in-house programming (e.g., Excel) is required to trans-fer from a Chemfolder/Chemfinder database to a ready searchlist for the MS vendor software (Bruker Target analysis (Klitgaardet al., 2014), Agilent Masshunter-find by formula (Kildgaard et al.,2014), or Waters ChromaLynx etc. Different settings for retentiontime, mass accuracy of peaks, area cut-off, among others can beused to process data-files depending on the nature of the samples.
In some concurrent large screening studies of black aspergilli,we have used a multi-sample screening tool, Agilent MassHunterQuant (similar packages available from Waters and Thermo),developed for LC-QqQ targeted quantification of pesticides, forexample. Despite being outside the original design the soft-ware can also handle high-resolution data. Thus a target listcan be imported via an XML file and one can convert aChemfolder/Chemfinder database (e.g., [M+H]+, [13C1M+H]+[M+Na]+, [13C1M+Na]+, with RT window and fragmentions) to an XML file and import into MassHunter Quant(Figures 3B–D).
The advantage of the multi-sample screening approach is thatwhole batches of anywhere from 10 to 100s of samples includingblanks, fungal strains grown on multiple media can be screenedsimultaneously. This not only gives fast processing, but a highchance of identifying a compound not previously detected whileconcurrently identifying the most prodigious producer of thebatch. In many cases several peaks of interest are identified butwith a proper selection of qualifier ion and comparisons betweenspecies and media and blanks usually only 2–3 peaks in thewhole batch require further manual inspection. Here the sam-ple with the most intense peak can be selected automaticallyas it is most likely to provide the best MS/HRMS and possibleUV/Vis data. This is illustrated in Figure 3 where a part of thebatch of samples is shown, here screening for campyrone C, using[M+H]+ (240.1230 ± 20 ppm, Figure 3C). Figure 3D shows thequalifier chromatograms, including [M+Na]+, showing that thecompound has the right elemental composition. The compoundwas then manually verified (Figures 3E–H) through conclusiveMS/HRMS spectra and a correct elution order of the A or Bisomers.
Altogether, the target analysis approach makes it possible toeasily identify chromatographic peaks which are both likely torepresent already known compounds and, even more importantly,also peaks that do not correspond to known compounds. Thus thetarget approach can quickly support prioritization in relation towhich compounds might need to be produced in larger scale for
Frontiers in Microbiology | Microbial Physiology and Metabolism February 2015 | Volume 6 | Article 71 | 6

Nielsen and Larsen Dereplication by LC-MS
FIGURE 3 | Aggressive (A–C) batch processing of 150 samples (12
shown), here sorted by peak area (Response column) of mass of [M+H]+of campyrone C (240.1230 ± 20 ppm) shown in (C). While (D) shows theoverlaid extracted ion chromatograms of the same as well as 13C1
12C12[M+H]+ isotopomer and the [M+Na]+ ion. (F–I) Manual verification of datafile with highest peak intensity of campyrone C. (E) Shows the highly
complex Base Peak chromatogram, while, the extracted ion chromatogramsof [M+H]+ of campyrone C and A/B respectively. (G) Shows the MS/MSspectrum at 10 eV of the tentatively identified campyrone C with (H) Showingthe structure of campyrone C along with (I) theoretical masses of 3 likelyfragmentation of the molecule. For instrument settings see Kildgaard et al.(2014).
semi-preparative isolation and possibly full structural characteri-zation based on isolation and NMR spectroscopy. In our view thisapproach is very well suited to fungi that has already been studiedsignificantly and when, for example, a new species related to a wellcharacterized species is to be investigated.
PEAK-FINDINGA more classical approach to investigation of a full scan UHPLC-HRMS file is to use a peak finding algorithm based on molecular
features. This approach uses deconvolution of the time profilesand adds peaks together and possibly resolves the adduct pattern(Kuhl et al., 2012; Kildgaard et al., 2014). Most vendor softwareas well as the open source software XC-MS (Smith et al., 2006)with the Camera package (Kuhl et al., 2012) offers this featurealthough not all can search Chemfolder/Chemfinder StructureData Format (SDF). However they can all search ChemSpider andsimilar public databases. This approach is probably best suitedto extracts from species where the taxonomy is not well known
www.frontiersin.org February 2015 | Volume 6 | Article 71 | 7

Nielsen and Larsen Dereplication by LC-MS
and can be used in a true unbiased metabolomics workflow (Coxet al., 2014; Macintyre et al., 2014; Wolfender et al., 2015), andcan be especially useful when combined with bioactivity or geneknock-outs.
A major obstacle for this method is that all samples to becompared need to be processed at the same time, as changes inmedia batches, impurities in solvents, filters, plastic and glassware(often strongly ionizing impurities) strongly influences data anal-ysis. In addition to this there are problems associated with thelikelihood of changes in secondary metabolism which are oftenseen for many organisms, even though great efforts are made tostandardize cultivation conditions. Finally analytical separation,cleanliness of ion-sources, changes in LC-MS solvents and manyother things also may cause changes in data. One can standardizedata between batches but this demands an enormous amount ofquality assurance work as it needs to include at least all the vari-able things mentioned above and is likely to still result in largeuncertainties.
Thus, if using a metabolomics approach to find small peaksin extracts, a very strong experimental design, with 4–6 repli-cates per condition is needed, and ideally all samples need tobe processed and analyzed in a single batch. If this strict con-trol is not implemented the peak picking algorithm and unbiaseddata analysis will likely find the sample preparation day as themost significant parameter, especially when lowering the inten-sity threshold. In such cases 5,000–30,000 chemical features (Coxet al., 2014; Macintyre et al., 2014; Wolfender et al., 2015) maybe detected and statistically some will always be correlated to agiven hypothesis. Despite these shortcomings, for extracts withvery high media background and very low signal intensity fromthe secondary metabolites this approach is the most effective. Inour view this approach is highly time-consuming and if searchingfor a bioactive compound, an assay guided approach may be farless time consuming.
The metabolomics workflow is often not easily implementablewith the workflow in a natural product laboratory as different
species and strains often need substantial optimization in termsof growth and analysis (Figure 4). However, for gene-to-productlinking type of projects, it can be the only way to search for lowintensity peaks in defined studies, as one cannot add samples fromlater studies.
API MS/MS LIBRARIESAs mentioned above, UHPLC-HRMS is often not enough for apositive identification and a library based identification – as ispossible for EI+ fragmentation – would be highly desirable. Ifmatching LC-MS generated MS spectra to a library they must bereproducible to give reliable matches. This is not possible with fullscan MS due to the differences in in-source fragmentation settingsand adduct formation and spectra of the same compound canbe very different even on the same instrument. However MS/MSspectra of the pseudomolecular ions, in general, produces thesame fragment ions, although the fragmentation energy to pro-vide the same spectrum may be very different and also will varybetween the harder argon toward the softer nitrogen (Baumannet al., 2000; Fredenhagen et al., 2005; Lee et al., 2005; Pavlic et al.,2006; Oberacher et al., 2012; El-Elimat et al., 2013; Kildgaard et al.,2014).
Thus an additional scan type, MS/MS, can be used simul-taneously with full-scan, when using a QTOF, IT-Orbi-Trap,Q-Orbi-Trap, as these can perform auto-MS/MS, or data depen-dent MS/MS. While TOF and Orbi-trap (Excactive) instrumentscannot isolate an ion for MS/MS, they can perform broad bandexcitation (All-Ions or MS-E) fragmentation at some point in theion-optics. A corollary is that fragmentation in an ion-trap oftenprovides very different fragments than a collision cell as fragmentions that are outside the excitation window in the ion-trap are nolonger accelerated and thus fragmented. To remedy this shortcom-ing some Orbi-Trap type spectrometers come with an additionalhexa- or octapole collision cell.
Compared to forensic science and toxicology (Broecker et al.,2011) only few in-house MS/MS libraries with fungal metabolite
FIGURE 4 | Suggested workflow in fungal natural products research depending on the problem, number of strains, species and of peaks are minor or
major, as well as if it is as well-studied or new organism, the different data-parts may differ significantly.
Frontiers in Microbiology | Microbial Physiology and Metabolism February 2015 | Volume 6 | Article 71 | 8
Nielsen and Larsen Dereplication by LC-MS
spectroscopic data are available thus far (Kildgaard et al., 2014).The major reasons are firstly; the lack of requirement to pub-lish MS/HRMS spectra and secondly; the lack of standard-ization of fragmentation energies between instrument man-ufactures. Although only containing relatively few micro-bial natural products, the two libraries that can be helpful,to identify lipids, medium polar primary metabolites, vita-mins, and other coumpunds are Massbank (Horai et al., 2010)and Metlin (Smith et al., 2005; ∼10,000 compounds withspectra).
In addition it is unreliable to use in silico predictors for pre-diction of fragmentation of NPs, since they often represent highlycondensed and complex ring structures, only leaving room forverification of some fragments from a structure in a spectrum(Hill and Mortishire-Smith, 2005; Hufsky et al., 2014). Despite ofthese challenges we anticipate that the use of MS/HRMS spectrallibraries will become much more pronounced in the near future,especially since the different vendors can see a huge advantagein being able to supply their customers with dedicated spectrallibraries.
PRECURSOR SELECTIONThe use of MS/MS on one of the pseudomolecular ionsdoes indeed already provide very reproducible MS/MS spectrawithin one brand of instrument (Fredenhagen et al., 2005) asrecently demonstrated in our laboratory (Fredenhagen et al., 2005;Kildgaard et al., 2014). Thus, good reproducibility can be achievedif the collision energy is calibrated and the nature of metal ion
adducts are known, since [M+Na]+ and [M+K]+ fragment farless and with different mechanisms than [M+H]+, [M+NH4]+(Oberacher et al., 2009, 2011; Wurtinger and Oberacher, 2012;Kildgaard et al., 2014). For robustness, many of the known adductions should be included as it increases the identification con-fidence especially between related compounds (Kildgaard et al.,2014).
FRAGMENTATIONImportantly, different energies for MS/MS are needed as the stabil-ity of compounds varies significantly (Kildgaard et al., 2014). Thiscan be acquired in two ways: (i) as several distinct energies (Smithet al., 2005), or ii) by ramping the collision energy, thus acquiringan average spectrum. For fungal metabolites we have found thespectral quality (Kildgaard et al., 2014) to be much higher whenusing distinct energies, especially when using accurate mass of thefragment ions. In such cases only 3–7 fragment ions are needed,as long as they are distributed equally over the mass range (nei-ther in the very low range, with common fragments shared withmany other compounds, nor close to the molecular ion wherethe losses may not differentiate from related compounds). Agi-lent Technologies and Metlin have chosen to acquire spectra at thethree different fragmentation energies 10, 20, and 40 eV (Kildgaardet al., 2014), which we also found efficient for microbial metabo-lites, except for large peptides where 60 eV had to be included,and we suggest a possibility to change the window for thesewhen going to larger masses where much more energy is generallyneeded.
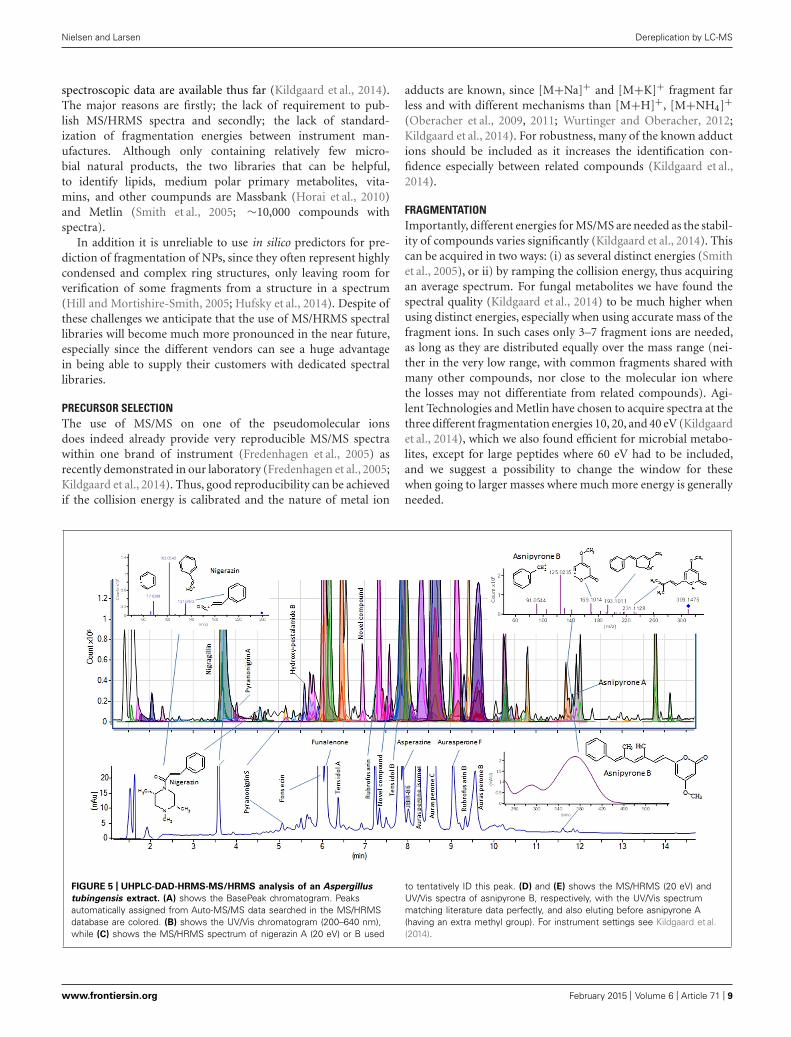
FIGURE 5 | UHPLC-DAD-HRMS-MS/HRMS analysis of an Aspergillus
tubingensis extract. (A) shows the BasePeak chromatogram. Peaksautomatically assigned from Auto-MS/MS data searched in the MS/HRMSdatabase are colored. (B) shows the UV/Vis chromatogram (200–640 nm),while (C) shows the MS/HRMS spectrum of nigerazin A (20 eV) or B used
to tentatively ID this peak. (D) and (E) shows the MS/HRMS (20 eV) andUV/Vis spectra of asnipyrone B, respectively, with the UV/Vis spectrummatching literature data perfectly, and also eluting before asnipyrone A(having an extra methyl group). For instrument settings see Kildgaard et al.(2014).
www.frontiersin.org February 2015 | Volume 6 | Article 71 | 9

Nielsen and Larsen Dereplication by LC-MS
ALGORITHMS AND LIBRARY SCORINGDifferent algorithms have been used to search experimentalMS/MS spectra contained in small in-house MS/MS libraries fortentative identification of fungal SMs. For example the NIST(National Institute of Standards and Technology) algorithm,developed for full scan EI+ spectra and the Mass Frontier soft-ware for MSn spectra were compared by Fredenhagen et al. (2005)to search low resolution MS/MS data, with the latter found to besuperior. Similarly El-Elimat et al. (2013) used ACD-IntelliXtract,which allows inclusion of accurate masses of the fragments,but does not use the parent ion data as search entry [64]. Weuse the Agilent search algorithm that is an integral part of theAgilent MassHunter software for fast and automated search inour in-house MS/HRMS library of more than 1300 compoundsfor unambiguous identification of especially fungal metabolitesbelonging species in the genera Aspergillus, Penicillium, andFusarium (Figure 5).
The software allows background subtraction and merging ofspectra over chromatographic peaks into a single spectrum prior to
automatic searching against the library. Importantly, searching ofMS/HRMS spectra against a given in-house library in MassHunterallows for both forward and reverse scoring using the parent massfor matching of peaks in the unknown spectrum against the libraryspectra or vice versa. Often both forward and reverse scoring areneeded for correct identification as shown in our work for theidentification of patulin (Kildgaard et al., 2014). Part of our library(277 microbial compounds) can be downloaded as PCDL for-mat from the homepage of the Technical University of Denmark(Nielsen and Frisvad, 2014).
Manual interpretation of MS/HRMS spectra might even beused to predict the structure of unknown compounds based oncareful inspection of the obtained fragmentation patterns. Thisapproach is especially applicable for NRPs due to their sequentialcomposition of amino acids (Figure 6).
For ion-traps users (especially IT-Orbi trap) the so calledMS-trees offers an additional dimension to identification of asubstructure of an analyte molecule by MS/MS/MS (MS3; Rid-der et al., 2012; Rojas-Cherto et al., 2012), as fragment ions from
FIGURE 6 |Tentative identification of emericellamides in an extract of
Aspergillus nidulans grown for 7 days on yeast extract sucrose agar:
(A) Base Peak chromatogram; (B) novel emericellamides where
MS/HRMS and retention time suggest the structure shown in (K) with
(I) RT 9.17 (R1 = CH3, R2 = H) and (J) RT 9.33 (R1 = H, R2 = CH3).
Water loss from the fatty acid chain is more favored when R1 = H as a
conjugation with the carbon can occur. (C) shows other novelemericellamides G (R1 = H, R2 = H) presumably with the fatty chain2 × CH2 longer. (H), emericellamide B; (G), emericellamide H(emericellamide E, with R1 = CH3, R2 = CH3); (F), emericellamide F; (E),emericellamide A; and (D), emericellamide C. For instrument settings seeKildgaard et al. (2014).
Frontiers in Microbiology | Microbial Physiology and Metabolism February 2015 | Volume 6 | Article 71 | 10

Nielsen and Larsen Dereplication by LC-MS
the first MS/MS event subsequently can be further fragmentedand matched in a MS/MS library for assigning parts of a givenmolecular structure.
MS NETWORKINGIn recent years the Dorrestein and Bandeira labs (Guthals et al.,2012; Watrous et al., 2012) have been key drivers toward devel-opment of new networking MS/MS approaches. Here MS/MSspectra of compounds in a given sample are compared pairwiseand structurally related compounds are clustered based on thepresence of similar fragments and neutral loses. In this way severalcompounds belonging to the same pathways have very convinc-ingly been linked together including compounds which belongto both known and novel biosynthetic pathways (Watrous et al.,2012; Yang et al., 2013). A major current drawback is the lack ofback-integration of raw data for evaluation of the correspond-ing full scan data and retention time, making detailed analysisextremely time consuming. Also source code is not available in anopen-source format as, e.g., XC-MS and it is thus impossible totroubleshoot data in cases where the analysis fails.
ISOTOPE LABELING FOR STRUCTURE AND BIOSYNTHESISINVESTIGATIONThe availability of LC-MS instruments and increased availabilityof stable isotope (13C, 2H, 15N, 34S) labeled substrates has mademore reliable determination of the elemental composition of agiven compound more robust through determination of the num-ber of carbon (Bueschl et al., 2012), nitrogen (Bode et al., 2012)or sulfur atoms in the molecule (Brock et al., 2014). However,the technology is also promising for incorporation of precursorsinvolved in PK and NRP biosynthetic studies (McIntyre et al., 1982,1989; Townsend and Christensen, 1983; Steyn et al., 1984; Simp-son, 1998; Baran et al., 2010; Bode et al., 2012; Fuchs et al., 2012;Proschak et al., 2013; Brock et al., 2014; Huang et al., 2014), asrecently exploited for proving that yanuthone production in A.niger is produced via 6-methylsalisylic acid and not shikimic acid(Holm et al., 2014; Petersen et al., 2015).
SURFACE TECHNIQUESDuring the last 7 years surface desorption techniques have beenintroduced for secondary metabolite screening. These techniquescan both ionize and detect surface excreted compounds and com-pounds in agar, for example, the identification of compoundspresent between colonies of different organisms for studying inter-actions. Current methods can be separated into two differentsub families: desorption electrospray ionization mass spectrom-etry (DESI), direct analysis in real time (DART) and variants ofthem, and they are all soft ionization techniques (Watrous et al.,2012; Hsu et al., 2013; Bouslimani et al., 2014). DESI (Esquenaziet al., 2009) is based on charged droplets of organic solvent and agas jet hitting the surface and then sampling ions close by (Gur-dak et al., 2014), whereas DART uses a gas ionized by a plasma.Both have a poor spatial resolution (mm range) and can only beapplied for major structures as DESI imprint of exudate droplets(Figueroa et al., 2014). Another major field of surface desorp-tion techniques are the matrix assisted laser desorption techniques(MALDI). MALDI has a much higher spatial resolution (down to
several 100 μm), but still not low enough to provide cellular res-olution of fungi (Watrous and Dorrestein, 2011; Watrous et al.,2012; Bouslimani et al., 2014).
CONCLUSION AND PERSPECTIVESThe recent advancements in separation sciences, high resolutionmass spectrometry, as well as data mining tools have dramati-cally improved our possibilities for dereplication of fungal naturalproducts in complex mixtures. At the same time these advancescall for more automated methods for analysis since the amountsof data that can be generated on a single instrument in a shorttime is truly immense. Among other techniques, dereplicationbased on auto-MS/MS has proven to be very robust and effec-tive on a given instrument. However, the use of MS/MS settingsbetween manufactures and scoring algorithms are calling for stan-dardized methods for both generation and comparison of MS/MSpatterns.
The ultimate solution for future dereplication would be theconstruction of an open natural product database, where all rel-evant chemical and taxonomic information have been mergedtogether. In particular this should include chromatographic andspectroscopic data (HR MS/MS, UV/Vis, NMR) as well as validtaxonomic information about the source organism, in many casesmaybe even including linking biosynthetic origin of a given naturalproduct to the related gene cluster.
ACKNOWLEDGMENTSWe are grateful to Agilent Technologies for the Thought LeaderDonation of the UHPLC-QTOFMS system, and linguistic cor-rections by Christopher Phippen. Funding is acknowledged fromthe Novo Nordic Foundation and from PharmaSea (EEC, GrantAgreement No 312184).
REFERENCESAbdel-Mawgoud, A. M., Aboulwafa, M. M., and Hassouna, N. A. H. (2008). Char-
acterization of surfactin produced by Bacillus subtilis isolate BS5. Appl. Biochem.Biotechnol. 150, 289–303. doi: 10.1007/s12010-008-8153-z
Ali, H., Ries, M. I., Lankhorst, P. P., van der Hoeven, R. A. M., Schouten, O. L., Noga,M., et al. (2014). A Non-canonical NRPS ss Involved in the synthesis of fungis-porin and related hydrophobic cyclic tetrapeptides in Penicillium chrysogenum.PLoS ONE 9:e98212. doi: 10.1371/journal.pone.0098212.g001
Andersen, B., Nielsen, K. F., and Jarvis, B. B. (2002). Characterization of Stachybotrysfrom water-damaged buildings based on morphology, growth and metaboliteproduction. Mycologia 94, 392–403. doi: 10.2307/3761773
Apfelthaler, E., Bicker, W., Lammerhofer, M., Sulyok, M., Krska, R., Lind-ner, W., et al. (2008). Retention pattern profiling of fungal metaboliteson mixed-mode reversed-phase/weak anion exchange stationary phases incomparison to reversed-phase and weak anion exchange separation mate-rials by liquid chromatography-electrospray ionisation-tandem mass spec-trometry. J. Chromatogr. A 1191, 171–181. doi: 10.1016/j.chroma.2007.12.067
Baran, R., Bowen, B. P., Bouskill, N. J., Brodie, E. L., Yannone, S. M., and Northen,T. R. (2010). Metabolite identification in Synechococcus sp. PCC 7002 using untar-geted stable isotope assisted metabolite profiling. Anal. Chem. 82, 9034–9042. doi:10.1021/ac1020112
Baumann, C., Cintora, M. A., Eichler, M., Lifante, E., Cooke, M., Przyborowska,A., et al. (2000). A library of atmospheric pressure ionization daughter ionmass spectra based on wideband excitation in an ion trap mass spectrome-ter. Rapid Commun. Mass Spectrom. 14, 349–356. doi: 10.1002/(SICI)1097-0231(20000315)14:5<349::AID-RCM873>3.0.CO;2-P
Bergmann, S., Schumann, J., Scherlach, K., Lange, C., Brakhage, A. A.,and Hertweck, C. (2007). Genomics-driven discovery of PKS-NRPS hybrid
www.frontiersin.org February 2015 | Volume 6 | Article 71 | 11

Nielsen and Larsen Dereplication by LC-MS
metabolites from Aspergillus nidulans. Nat. Chem. Biol. 3, 213–217. doi: 10.1038/nchembio869
Bertrand, S., Schumpp, O., Bohni, N., Bujard, A., Azzollini, A., Monod, M., et al.(2013). Detection of metabolite induction in fungal co-cultures on solid mediaby high-throughput differential ultra-high pressure liquid chromatography-time-of-flight mass spectrometry fingerprinting. J. Chromatogr. A 1292, 219–228. doi:10.1016/j.chroma.2013.01.098
Bills, G. F. (1995). Analysis of microfungal diversity from a user’s perspective. Can.J. Bot. 73, s33–s41. doi: 10.1139/b95-222
Bitzer, J., Kopcke, B., Stadler, M., Heilwig, V., Ju, Y. M., Seip, S.,et al. (2007). Accelerated dereplication of natural products, supported byreference libraries. Chimia (Aarau) 61, 332–338. doi: 10.2533/chimia.2007.332
Bladt, T. T., Duerr, C., Knudsen, P. B., Kildgaard, S., Frisvad, J. C., Gotfredsen,C. H., et al. (2013). Bio-Activity and dereplication-based discovery of ophiobolinsand other fungal secondary metabolites targeting leukemia cells. Molecules 18,14629–14650. doi: 10.3390/molecules181214629
Blunt, J. W., Copp, B. R., Hu, W. P., Munro, M. H. G., Northcote, P. T., andPrinsep, M. R. (2008). Marine natural products. Nat. Prod. Rep. 25, 35–94. doi:10.1039/b701534h
Bode, H. B., Bethe, B., Höfs, R., and Zeeck, A. (2002). Big effects from small changes:possible ways to explore Nature’s chemical diversity. ChemBioChem 3, 619–627.doi: 10.1002/1439-7633(20020703)
Bode, H. B., Reimer, D., Fuchs, S. W., Kirchner, F., Dauth, C., Kegler, C., et al. (2012).Determination of the absolute configuration of peptide natural products by usingstable isotope labeling and mass spectrometry. Chem. A Eur. J. 18, 2342–2348.doi: 10.1002/chem.201103479
Bok, J. W., Chiang, Y. M., Szewczyk, E., Reyes-Domingez, Y., Davidson, A. D.,Sanchez, J. F., et al. (2009). Chromatin-level regulation of biosynthetic geneclusters. Nat. Chem. Biol. 5, 462–464. doi: 10.1038/nchembio.177
Boonzaaijer, G., Bobeldijk, I., and van Osenbruggen, W. A. (2005). Analysis ofpatulin in dutch food, an evaluation of a SPE based method. Food Control 16,587–591. doi: 10.1016/j.foodcont.2004.06.020
Bouslimani, A., Sanchez, L. M., Garg, N., and Dorrestein, P. C. (2014). Mass spec-trometry of natural products: current, emerging, and future technologies. Nat.Prod. Rep. 31, 718–729. doi: 10.1039/c4np00044g
Brock, N. L., Nikolay, A., and Dickschat, J. S. (2014). Biosynthesis of the antibi-otic tropodithietic acid by the marine bacterium Phaeobacter inhibens. Chem.Commun. 50, 5487–5489. doi: 10.1039/c4cc01924e
Broecker, S., Herre, S., Wust, B., Zweigenbaum, J., and Pragst, F. (2011). Develop-ment and practical application of a library of CID accurate mass spectra of morethan 2,500 toxic compounds for systematic toxicological analysis by LC-QTOF-MS with data-dependent acquisition. Anal. Bioanal. Chem. 400, 101–117. doi:10.1007/s00216-010-4450-9
Bueschl, C., Kluger, B., Berthiller, F., Lirk, G., Winkler, S., Krska, R., et al. (2012).METEXTRACT: a new software tool for the automated comprehensive extractionof metabolite-derived LC/MS signals in metabolomics research. Bioinformatics 28,1–5. doi: 10.1093/bioinformatics/bts012
Butler, M. S. (2004). The role of natural product chemistry in drug discovery. J. Nat.Prod. 67, 2141–2153. doi: 10.1021/np040106y
Cannall, R. J. P. (1998). “Methods in biotechnolog,” in Natural Products Isolation,Vol. 4, ed. R. J. P. Cannall (New Jersey: Humana Press), 1–51. doi: 10.1007/978-1-59259-256-2_1
Chen, X., Cao, Y., Lv, D., Zhu, Z., Zhang, J., and Chai, Y. (2012). Compre-hensive two-dimensional HepG2/cell membrane chromatography/monolithiccolumn/time-of-flight mass spectrometry system for screening anti-tumorcomponents from herbal medicines. J. Chromatogr. A 1242, 67–74. doi:10.1016/j.chroma.2012.04.034
Chiang, Y. M., Szewczyk, E., Davidson, A. D., Entwistle, R., Keller, N. P.,Wang, C. C. C., et al. (2010). Characterization of the Aspergillus nidulansmonodictyphenone gene cluster. Appl. Environ. Microbiol. 76, 2067–2074. doi:10.1128/AEM.02187
Cordell, G. A., and Shin, Y. G. (1999). Finding the needle in the haystack. Thedereplication of natural products extracts. Pure Appl. Chem. 71, 1089–1094. doi:10.1351/pac199971061089
Cox, D. G., Oh, J., Keasling, A., Colson, K. L., and Hamann, M. T. (2014). The utilityof metabolomics in natural product and biomarker characterization. Biochim.Biophys. Acta 1840, 3460–3474. doi: 10.1016/j.bbagen.2014.08.007
Creek, D. J., Jankevics, A., Breitling, R., Watson, D. G., Barrett, M. P., and Burgess,K. E. V. (2011). Toward global metabolomics analysis with hydrophilic interactionliquid chromatography-mass spectrometry: improved metabolite identifica-tion by retention time prediction. Anal. Chem. 83, 8703–8710. doi: 10.1021/ac2021823
Degenkolb, T., Grafenhan, T., Nirenberg, H. I., Gams, W., and Bruckner, H. (2006).Trichoderma brevicompactum complex: rich source of novel and recurrent plant-protective polypeptide antibiotics (peptaibiotics). J. Agric. Food Chem. 54, 7047–7061. doi: 10.1021/jf060788q
de la Cruz, M., Martin, J., Gonzalez-Menendez, V., Perez-Victoria, I., Moreno,C., Tormo, J. R., et al. (2012). Chemical and physical modulation of antibioticactivity in Emericella Species. Chem. Biodivers 9, 1095–1113. doi: 10.1002/cbdv.201100362
Dinan, L. (2005). “Methods in biotechnology,” in Dereplication and Partial Identifi-cation of Compounds Natural Products Isolation, 2nd Edn, Vol. 20, eds S. D. Sarker,Z. Latif, and A. I. Gray (Louisville, KY: Humana Press), 297–321.
Droce, A., Sorensen, J. L., Giese, H., and Sondergaard, T. E. (2013).Glass bead cultivation of fungi: combining the best of liquid and agarmedia. J. Microbiol. Methods. 94, 343–346. doi: 10.1016/j.mimet.2013.07.005
Dufresne, C. (1998). “Methods in biotechnolog,” in Isolation by Ion-Exchange Meth-ods, Natural Products Isolation, Vol. 4, ed. R. J. P. Cannall (New Jersey: HumanaPress), 141–164.
Dugo, P., Cacciola, F., Donato, P., Airado-Rodriguez, D., Herrero, M., and Mon-dello, L. (2009). Comprehensive two-dimensional liquid chromatography toquantify polyphenols in red wines. J. Chromatogr. A 1216, 7483–7487. doi:10.1016/j.chroma.2009.04.001
El-Elimat, T., Figueroa, M., Ehrmann, B. M., Cech, N. B., Pearce, C. J., and Ober-liesm, N. H. (2013). High-resolution MS, MS/MS, and UV database of fungalsecondary metabolites as a dereplication protocol for bioactive natural products.J. Nat. Prod. 76, 1709–1716. doi: 10.1021/np4004307
Esquenazi, E., Dorrestein, P. C., and Gerwick, W. H. (2009). Probing marine naturalproduct defenses with DESI-imaging mass spectrometry. Proc. Natl. Acad. Sci.U.S.A. 106, 7269–7270. doi: 10.1073/pnas.0902840106
Euerby, M. R., and Petersson, P. (2005). Chromatographic classification and compar-ison of commercially available reversed-phase liquid chromatographic columnscontaining polar embedded groups/amino endcappings using principal com-ponent analysis. J. Chromatogr. A 1088, 1–15. doi: 10.1016/j.chroma.2004.10.027
Feng, X., and Siegel, M. M. (2007). FTICR-MS applications for the structuredetermination of natural products. Anal. Bioanal. Chem. 389, 1341–1363. doi:10.1007/s00216-007-1468-8
Figueroa, M., Jarmusch, A. K., Raja, H. A., El-Elimat, T., Kavanaugh, J. S., Horswill,A. R., et al. (2014). Polyhydroxyanthraquinones as quorum sensing inhibitorsfrom the guttates of Penicillium restrictum and their analysis by desorptionelectrospray ionization mass spectrometry. J. Nat. Prod. 77, 1351–1358. doi:10.1021/np5000704
Firn, R. D., and Jones, C. G. (2003). Natural products - a simple model to explainchemical diversity. Nat. Prod. Rep. 20, 382–391. doi: 10.1039/b208815k
Fredenhagen, A., Derrien, C., and Gassmann, E. (2005). An MS/MS library onan ion-trap instrument for efficient dereplication of natural products. Differentfragmentation patterns for [M + H]+ and [M +Na]+ ions. J. Nat. Prod. 68,385–391. doi: 10.1021/np049657e
Fuchs, S. W., Sachs, C. C., Kegler, C., Nollmann, F. I., Karas, M., and Bode, H. B.(2012). Neutral loss fragmentation pattern based screening for arginine-rich nat-ural products in Xenorhabdus and Photorhabdus. Anal. Chem. 84, 6948–6955. doi:10.1021/ac300372p
Gurdak, E., Green, F. M., Rakowska, P. D., Seah, M. P., Salter, T. L. R., and Gilmore,I. S. (2014). VAMAS interlaboratory study for desorption electrospray ionisa-tionmass spectrometry (DESI MS) intensity repeatability and constancy. Anal. Chem.86, 9603–9611. doi: 10.1021/ac502075t
Guthals, A., Watrous, J. D., Dorrestein, P. C., and Bandeira, N. (2012). The spectralnetworks paradigm in high throughput mass spectrometry. Mol. Biosyst. 8, 2535–2544. doi: 10.1039/c2mb25085c
Hansen, M. E., Smedsgaard, J., and Larsen, T. O. (2005). X-Hitting: an algo-rithm for novelty detection and dereplication by UV spectra of complexmixtures of natural products. Anal. Chem. 77, 6805–6817. doi: 10.1021/ac040191e
Frontiers in Microbiology | Microbial Physiology and Metabolism February 2015 | Volume 6 | Article 71 | 12

Nielsen and Larsen Dereplication by LC-MS
Hill, A. W., and Mortishire-Smith, R. J. (2005). Automated assignment of high-resolution collisionally activated dissociation mass spectra using a systematicbond disconnection approach. Rapid Commun. Mass Spectrom. 19, 3111–3118.doi: 10.1002/rcm.2177
Hinkley, S. F., and Jarvis, B. B. (2000). “Methods molecular biology, in Chro-matographic Method for Stachybotrys Toxins, 157. Mycotoxin Protocols, edsA. Pohland and M. W. Trucksess (Totowa: Humana Press), 173–194. doi:10.1385/1-59259-064-0:173
Holm, D. K., Petersen, L. M., Klitgaard, A., Knudsen, P. B., Jarczynska,Z., Nielsen, K. F., et al. (2014). Molecular and chemical characterizationof the biosynthesis of the 6-MSA-derived meroterpenoid yanuthone D inAspergillus niger. Chem. Biol. 21, 519–529. doi: 10.1016/j.chembiol.2014.01.013
Horai, H., Arita, M., Kanaya, S., Nihei, Y., Ikeda, T., Suwa, K., et al. (2010). Mass-Bank: a public repository for sharing mass spectral data for life sciences. J. MassSpectrom. 45, 703–714. doi: 10.1002/jms.1777
Hsu, C. C., ElNaggar, M. S., Peng, Y., Fang, J., Sanchez, L. M., Mascuch,S. J., et al. (2013). Real-time metabolomics on living microorganisms usingambient electrospray ionization flow-probe. Anal. Chem. 85, 7014–7018. doi:10.1021/ac401613x
Huang, Y. Q., Wang, Q. Y., Liu, J. Q., Hao, Y. H., Yuan, B. F., and Feng, Y. Q.(2014). Isotope labelling - paired homologous double neutral loss scan-massspectrometry for profiling of metabolites with a carboxyl group. Analyst 139,3446–3454. doi: 10.1039/c4an00312h
Hufsky, F., Scheubert, K., and Bocker, S. (2014). Computational mass spectrometryfor small-molecule fragmentation. Track-Trends Anal. Chem. 53, 41–48. doi:10.1016/j.trac.2013.09.008
Kangas, L. J., Metz, T. O., Isaac, G., Schrom, B. T., Ginovska-Pangovska, B., Wang,L. N., et al. (2012). In silico identification software (ISIS): a machine learningapproach to tandem mass spectral identification of lipids. Bioinformatics 28,1705–1713. doi: 10.1093/bioinformatics/bts194
Kildgaard, S., Mansson, M., Dosen, I., Klitgaard, A., Frisvad, J. C., Larsen, T. O., et al.(2014). Accurate dereplication of bioactive secondary metabolites from marine-derived fungi by UHPLC-DAD-QTOFMS and a MS/HRMS library. Mar. Drugs12, 3681–3705. doi: 10.3390/md12063681
Kind, T., and Fiehn, O. (2007). Seven golden rules for heuristic filtering of molecularformulas obtained by accurate mass spectrometry. BMC Bioinform. 8:105. doi:10.1186/1471-2105-8-105
Klitgaard, A., Iversen, A., Andersen, M. R., Larsen, T. O., Frisvad, J. C., and Nielsen,K. F. (2014). Aggressive dereplication using UHPLC-DAD-QTOF - screeningextracts for up to 3000 fungal secondary metabolites. Anal. Bioanal. Chem. 406,1933–1943. doi: 10.1007/s00216-013-7582-x
Kuhl, C., Tautenhahn, R., Boettcher, C., Larson, T. R., and Neumann, S. (2012).CAMERA: an integrated strategy for compound spectra extraction and anno-tation of liquid chromatography/mass spectrometry data sets. Anal. Chem. 84,283–289. doi: 10.1021/ac202450g
Kvitvang, H. F. N., Kristiansen, K. A., and Bruheim, P. (2014). Assessment ofcapillary anion exchange ion chromatography tandem mass spectrometry forthe quantitative profiling of the phosphometabolome and organic acids in bio-logical extracts. J. Chromatogr. A 1370, 70–79. doi: 10.1016/j.chroma.2014.10.029
Lammerhofer, M., Richter, M., Wu, J. Y., Nogueira, R., Bicker, W., andLindner, W. (2008). Mixed-mode ion-exchangers and their comparative chro-matographic characterization in reversed-phase and hydrophilic interactionchromatography elution modes. J. Sep. Sci. 31, 2572–2588. doi: 10.1002/jssc.200800178
Lang, G., Mayhudin, N. A., Mitova, M. I., Sun, L., van der Sar, S., Blunt, J. W.,et al. (2008). Evolving trends in the dereplication of natural product extracts:new methodology for rapid, small-scale investigation of natural product extracts.J. Nat. Prod. 71, 1595–1599. doi: 10.1021/np8002222
Langseth, W., and Rundberget, T. (1998). Instrumental methods for deter-mination of nonmacrocyclic trichothecenes in cereals, foodstuffs and cul-tures. J. Chromatogr. A 815, 103–121. doi: 10.1016/S0021-9673(98)00388-4
Larsen, T. O., Franzyk, H., and Jensen, S. R. (1999). UV-guiden isolation of ver-rucines A and B, novel quinazolines from Penicillium verrucosum structuralyrelated to anacine from Penicillium aurantiogriseum. J. Nat. Prod. 62, 1578–1580.doi: 10.1021/np990251p
Larsen, T. O., Petersen, B. O., Duus, J. O., Sørensen, D., Frisvad, J. C., and Hansen,M. E. (2005). Discovery of new natural products by application of X-hitting, anovel algorithm for automated comparison of full UV spectra, combined withstructural determination by NMR spectroscopy. J. Nat. Prod. 68, 871–874. doi:10.1021/np040248s
Larsen, T. O., Smedsgaard, J., Nielsen, K. F., Hansen, M. E., Samson, R. A., andFrisvad, J. C. (2007). Production of mycotoxins by Aspergillus lentulus and othermedically important and closely related species in section Fumigati. Med. Mycol.45, 225–232. doi: 10.1080/13693780601185939
Lebrun, M. H., Gaudemer, F., Boutar, M., Nicolas, L., and Goudemer, A.(1989). Ion-pair, anion-exchange and ligand-excahange high-performance liquidchromatography of tenuazonic acid and 3-acetyl 5-substituted pyrrolidiene-2,4-diones. J. Chromatogr. 464, 307–322. doi: 10.1016/S0021-9673(00)94249-3
Lee, S. J., Kim, D. H., Liu, K. H., Oh, T. K., and Lee, C. H. (2005). Identificationof flavonoids using liquid chromatography with electrospray ionization and iontrap tandem mass spectrometry with an MS/MS library. Rapid Commun. MassSpectrom. 19, 3539–3548. doi: 10.1002/rcm.2230
Lehner, S. M., Neumann, N. K. N., Sulyok, M., Lemmens, M., Krska, R., andSchuhmacher, R. (2011). Evaluation of LC-high-resolution FT-Orbitrap MSfor the quantification of selected mycotoxins and the simultaneous screen-ing of fungal metabolites in food. Food Addit. Contam. 28, 1457–1468. doi:10.1080/19440049.2011.599340
Lysoe, E., Harris, L., Subramaniam, R., Divon, H. H., Riiser, E. S., Llorens,C., et al. (2014). The genome of the generalist plant pathogen Fusar-ium avenaceum is enriched with genes involved in redox, signaling, andsecondary metabolism. PLoS ONE 9:e112703. doi: 10.1371/journal.pone.0112703
Macintyre, L., Zhang, T., Viegelmann, C., Martinez, I. J., Cheng, C., Dowdells,C., et al. (2014). Metabolomic tools for secondary metabolite discovery frommarine microbial symbionts. Mar. Drugs 12, 3416–3448. doi: 10.3390/md12063416
Magdenoska, O., Martinussen, J., Thykaer, J., and Nielsen, K. F. (2013). Dispersivesolid phase extraction combined with ion-pair ultra high-performance liquidchromatography tandem mass spectrometry for quantification of nucleotidesin Lactococcus lactis. Anal. Biochem. 440, 166–177. doi: 10.1016/j.ab.2013.05.023
Månsson, M., Phipps, R. K., Gram, L., Munro, M. H., Larsen, T. O., and Nielsen,K. F. (2010). Explorative solid-phase extraction (E-SPE) for accelerated microbialnatural product discovery, dereplication, and purification. J. Nat. Prod. 73, 1126–1132. doi: 10.1021/np100151y
May, J. C., Goodwin, C. R., Lareau, N. M., Leaptrot, K. L., Morris, C. B., Kuru-lugama, R. T., et al. (2014). Conformational ordering of biomolecules in the gasphase: nitrogen collision cross sections measured on a prototype high resolu-tion drift tube ion mobility-mass spectrometer. Anal. Chem. 86, 2107–2116. doi:10.1021/ac4038448
McIntyre, C. R., Scott, F. E., Simpson, T. J., Trimble, L. A., and Vederas, J. C.(1989). Application of stable isotope to labeling methodology the biosynthesisof the mycotoxin, terretonin, by Aspergillus terreus - incorporation of C-13-labeled acetates and methionine, H-2-labeled and C-13-labeled, O-18-labeledethyl 3,5-dimethylorsellinate and O-18 gas. Tetrahedron 45, 2307–2321. doi:10.1016/S0040-4020(01)83433-5
McIntyre, C. R., Simpson, T. J., Stenzel, D. J., Bartlett, A. J., O’Brien, E. O., et al.(1982). Biosynthsis of the meroterpenoid metabolites. austin and terretonin:incoporation of 3,5-dimethylorsellinate. J. Chem. Soc. Chem. Commun. 781–782.doi: 10.1039/c39820000781
Miller, J. D. (2008). Mycotoxins in small grains and maize: old problems,new challenges. Food Addit. Contam. 25, 219–230. doi: 10.1080/02652030701744520
Mogensen, J. M., Sørensen, S. M., Sulyok, M., van der Westhuizen, L., Shep-ard, G. S., Frisvad, J. C., et al. (2011). Single kernel analysis of fumon-isins and other fungal metabolites in maize from South African subsistencefarmers. Food Addit. Contam. 28, 1724–1734. doi: 10.1080/19440049.2011.611823
Nagao, T., Yukihira, D., Fujimura, Y., Saito, K., Takahashi, K., Miura, D., et al. (2014).Power of isotopic fine structure for unambiguous determination of metaboliteelemental compositions: in silico evaluation and metabolomic application. Anal.Chim. Acta 813, 70–76. doi: 10.1016/j.aca.2014.01.032
www.frontiersin.org February 2015 | Volume 6 | Article 71 | 13

Nielsen and Larsen Dereplication by LC-MS
Nielsen, K. F., and Frisvad, J. C. (2014). DTU Mycotoxin-Fungal Secondary Metabo-lite MS/HRMS Library. Available at: http://www.bio.dtu.dk/english/Research/Platforms/Metabolom/MSMSLib
Nielsen, K. F., Månsson, M., Rank, C., Frisvad, J. C., and Larsen, T. O. (2011a).Dereplication of microbial natural products by LC-DAD-TOFMS. J. Nat. Prod.74, 2338–2348. doi: 10.1021/np200254t
Nielsen, M. L., Nielsen, J. B., Rank, C., Klejnstrup, M. L., Holm, D. K., Bro-gaard, K. H., et al. (2011b). A genome-wide polyketide synthase deletion libraryuncovers novel genetic links to polyketides and meroterpenoids in Aspergillusnidulans. FEMS Microbiol. Lett. 321, 157–166. doi: 10.1111/j.1574-6968.2011.02327.x
Nielsen, K. F., Mogensen, J. M., Johansen, M., Larsen, T. O., and Frisvad, J. C.(2009). Review of secondary metabolites and mycotoxins from the Aspergillusniger group. Anal. Bioanal. Chem. 395, 1225–1242. doi: 10.1007/s00216-009-3081-5
Nielsen, K. F., Ngemela, A. F., Jensen, L. B., de Medeiros, L. S., and Rasmussen, P. H.(2015). UHPLC-MS/MS determination of ochratoxin A and fumonisins in coffeein using QuEChERS extraction combined with mixed-mode SPE purification.J. Agric. Food Chem. 63, 1029–1034. doi: 10.1021/jf504254q
Nielsen, K. F., and Smedsgaard, J. (2003). Fungal metabolite screening: database of474 mycotoxins and fungal metabolites for de-replication by standardised liquidchromatography-UV-mass spectrometry methodology. J. Chromatogr. A 1002,111–136. doi: 10.1016/S0021-9673(03)00490-4
Oberacher, H., Pavlic, M., Libiseller, K., Schubert, B., Sulyok, M., Schuh-macher, R., et al. (2009). On the inter-instrument and inter-laboratorytransferability of a tandem mass spectral reference library: 1. Results of anAustrian multicenter study. J. Mass Spectrom. 44, 485–493. doi: 10.1002/jms.1545
Oberacher, H., Pitterl, F., Siapi, E., Steele, B. R., Letzel, T., Grosse, S., et al. (2012).On the inter-instrument and the inter-laboratory transferability of a tandem massspectral reference library. 3. Focus on ion trap and upfront CID. J. Mass Spectrom.47, 263–270. doi: 10.1002/jms.2961
Oberacher, H., Weinmann, W., and Dresen, S. (2011). Quality evaluation oftandem mass spectral libraries. Anal. Bioanal. Chem. 400, 2641–2648. doi:10.1007/s00216-010-4598-3
Ojanpera, S., Pelander, A., Pelzing, M., Krebs, I., Vuori, E., and Ojanpera, I. (2006).Isotopic pattern and accurate mass determination in urine drug screening byliquid chromatography/time-of-flight mass spectrometry. Rapid Commun. MassSpectrom. 20, 1161–1167. doi: 10.1002/rcm.2429
Pavlic, M., Libiseller, K., and Oberacher, H. (2006). Combined use of Esi-Qqtof-Msand Esi-Qqtof-Ms/Ms with mass-spectral library search for qualitative anal-ysis of drugs. Anal. Bioanal. Chem. 386, 69–82. doi: 10.1007/s00216-006-0634-8
Perry, R. H., Cooks, R., and Noll, R. J. (2008). Orbitrap mass spectrometry: instru-mentation, ion motion, and applications. Mass Spectrom. Rev. 27, 661–699. doi:10.1002/mas.20186
Petersen, L. M., Holm, D. K., Knudsen, P. B., Nielsen, K. F., Godtfredsen,C. H., Mortensen, U. H., et al. (2015). Characterization of four novel anti-fungal yanuthones from Aspergillus niger. J. Antibiot. On Line doi: 10.1038/ja.2014.130 [Epub ahead of print].
Proschak, A., Lubuta, P., Grun, P., Lohr, F., Wilharm, G., De Berardinis, V., et al.(2013). Structure and biosynthesis of fimsbactins A-F, siderophores from Acine-tobacter baumannii and Acinetobacter baylyi. ChemBioChem 14, 633–638. doi:10.1002/cbic.201200764
Pucci, V., Di Palma, S., Alfieri, A., Bonelli, F., and Monteagudo, E. (2009). A novelstrategy for reducing phospholipids-based matrix effect in LC-ESI-MS bioanal-ysis by means of HybridSPE. J. Pharmaceut. Biomed. Anal. 50, 867–871. doi:10.1016/j.jpba.2009.05.037
Rasmussen, B. B., Nielsen, K. F., Machado, H., Gram, L., and Sonnenschein, E.(2014). Global and phylogenetic distribution of quorum sensing signals, acylhomoserine lactones, in the family of Vibrionaceae. Mar. Drugs 12, 5527–5546.doi: 10.3390/md12115527
Ridder, L., van der Hooft, J. J. J., Verhoeven, S., De Vos, R. C. H., van Schaik,R., and Vervoort, J. (2012). Substructure-based annotation of high-resolutionmultistage MSn spectral trees. Rapid Commun. Mass Spectrom. 26, 2461–2471.doi: 10.1002/rcm.6364
Rojas-Cherto, M., Peironcely, J. E., Kasper, P. T., van der Hooft, J. J. J., De Vos,R. C. H., Vreeken, R., et al. (2012). Metabolite identification using automated
comparison of high-resolution multistage mass spectral trees. Anal. Chem. 84,5524–5534. doi: 10.1021/ac2034216
Rundberget, T., Skaar, I., O’Brien, O., and Flåøyen, A. (2004). Penitrem andthomitrem formation by Penicillium crustosum. Mycopathologia 157, 349–357.doi: 10.1023/B:MYCO.0000024180.99262.b1
Sanchez, J. F., Somoza, A. D., Keller, N. P., and Wang, C. C. C. (2012). Advancesin Aspergillus secondary metabolite research in the post-genomic era. Nat. Prod.Rep. 29, 351–371. doi: 10.1039/c2np00084a
Sarkara, A., Funka, A. N., Scherlach, K., Horn, F., Schroeckh, V., Chankhamjon,P., et al. (2012). Differential expression of silent polyketide biosynthesis geneclusters in chemostat cultures of Aspergillus nidulans. J. Biotechnol. 160, 64–71.doi: 10.1016/j.jbiotec.2012.01.015
Schroeckh, V., Scherlach, K., Nützmann, H.-W., Shelest, E., Schmidt-Heck, W., Schuemann, J., et al. (2009). Intimate bacterial–fungal inter-action triggers biosynthesis of archetypal polyketides in Aspergillus nidu-lans. Proc. Natl. Acad. Sci. U.S.A 106, 14558–14563. doi: 10.1073pnas.0901870106
Shephard, G. S. (2008). Impact of mycotoxins on human health in develop-ing countries. Food Addit. Contam. 25, 146–151. doi: 10.1080/02652030701567442
Shimizu, Y. (1998). “Methods in biotechnolog,” in Natural Products Isolation, Purifi-cation of Water-Soluble Products, Vol. 4, ed. R. J. P. Cannall (New Jersey: HumanaPress), 329–341.
Simpson, T. J. (1998). Application of Isotopic Methods to Secondary MetabolicPathways Topics in Current Chemistry, Vol. 195. (Heidelberg: Springer),1–48.
Sleno, L. (2012). The use of mass defect in modern mass spectrometry. J. MassSpectrom. 47, 226–236. doi: 10.1002/jms.2953
Smith, C. A., O’Maille, G., Want, E. J., Qin, C., Trauger, S. A., Brandon, T. R., et al.(2005). METLIN: a metabolite mass spectral database. Ther. Drug Monit. 27,747–751. doi: 10.1097/01.ftd.0000179845.53213.39
Smith, C. A., Want, E. J., O’Maille, G., Abagyan, R., and Siuzdak, G. (2006).XCMS: Processing mass spectrometry data for metabolite profiling using Nonlin-ear peak alignment, matching, and identification. Anal. Chem. 78, 779–787. doi:10.1021/ac051437y
Sørensen, J. L., Hansen, F. T., Sondergaard, T. E., Staerk, D., Lee,T. V., Wimmer, R., et al. (2012). Production of novel fusarielins byectopic activation of the polyketide synthase 9 cluster in Fusarium gramin-earum. Environ. Microbiol. 14, 1159–11570. doi: 10.1111/j.1462-2920.2011.02696.x
Sørensen, J. L., Nielsen, K. F., and Thrane, U. (2007). Analysis of moniliformin inmaize plants using hydrophilic interaction chromatography. J. Agric. Food Chem.55, 9764–9768. doi: 10.1021/jf0715875
Sørensen, J. L., Phipps, R. K., Nielsen, K. F., Schroers, H. J., Frank, J., andThrane, U. (2009). Analysis of Fusarium avenaceum metabolites produced dur-ing wet apple core rot. J. Agric. Food Chem. 57, 1632–1639. doi: 10.1021/jf802926u
Sorensen, J. L., and Sondergaard, T. E. (2014). The effects of different yeast extractson secondary metabolite production in Fusarium. Int. J. Food Microbiol. 170,55–60. doi: 10.1016/j.ijfoodmicro.2013.10.024
Stadler, M., Fournier, J., Quang, D. N., and Akulov, A.Y. (2007). Metabolomic studieson the chemical ecology of the Xylariaceae (Ascomycota). Nat. Prod. Commun. 2,287–304.
Stadler, M., Laessoe, T., Fournier, J., Decock, C., Schmieschek, B., Tichy, H. V., et al.(2014). A polyphasic taxonomy of Daldinia (Xylariaceae). Stud. Mycol. 77, 1–143.doi: 10.3114/sim0016
Stadler, M., Ticky, H. V., Katsiou, E., and Hellwig, V. (2009). Chemotaxonomyof Pochonia and other conidial fungi with Verticillium-like anamorphs. Mycol.Progress 2, 95–122. doi: 10.1007/s11557-006-0048-1
Steyn, P. S., Vleggaar, R., and Simpson, T. J. (1984). Stable isotope labelling stud-ies on the biosynthesis of asticolorin-C by Aspergillus multicolor - evidencefor a symmetrical intermediate. J. Chem. Soc. Chem. Commun. 765–767. doi:10.1039/c39840000765
Sulyok, M., Berthiller, F., Krska, R., and Schuhmacher, R. (2006). Devel-opment and validation of a liquid chromatography/tandem mass spectro-metric method for the determination of 39 mycotoxins in wheat andmaize. Rapid Commun. Mass Spectrom. 20, 2649–2659. doi: 10.1002/rcm.2640
Frontiers in Microbiology | Microbial Physiology and Metabolism February 2015 | Volume 6 | Article 71 | 14

Nielsen and Larsen Dereplication by LC-MS
Townsend, C. A., and Christensen, S. B. (1983). Stable isotope studies ofanthraquinone intermediates in the aflatoxin pathway. Tetrahedron 39, 3575–3582. doi: 10.1016/S0040-4020(01)88668-3
Tsunematsu, Y., Ishikawa, N., Wakana, D., Goda, Y., Noguchi, H., Moriya,H., et al. (2013). Distinct mechanisms for spiro-carbon formation revealbiosynthetic pathway crosstalk. Nat. Chem. Biol. 9, 818–827. doi: 10.1038/nchembio.1366
van Dam, J. C., Eman, M. R., Frank, J., Lange, H. C., van Dedem, G. W. K., andHeijnen, S. J. (2002). Analysis of glycolytic intermediates in Saccharomyces cere-visiae using anion exchange chromatography and electrospray ionization withtandem mass spectrometric detection. Anal. Chim. Acta 460, 209–218. doi:10.1016/S0003-2670(02)00240-4
Varga, E., Glauner, T., Berthiller, F., Krska, R., Schuhmacher, R., and Sulyok, M.(2013). Development and validation of a (semi-)quantitative UHPLC-MS/MSmethod for the determination of 191 mycotoxins and other fungal metabolitesin almonds, hazelnuts, peanuts, and pistachios. Anal. Bioanal. Chem. 405, 5087–5104. doi: 10.1007/s00216-013-6831-3
Watrous, J. D., and Dorrestein, P. C. (2011). Imaging mass spectrome-try in microbiology. Nat. Rev. Microbiol. 9, 683–694. doi: 10.1038/nrmicro2634
Watrous, J., Roach, P., Alexandrov, T., Heath, B. S., Yang, J. Y., Kersten,R. D., et al. (2012). Mass spectral molecular networking of living microbialcolonies. Proc. Natl. Acad. Sci. U.S.A. 109, E1743–E1752. doi: 10.1073/pnas.1203689109
Wehrens, R., Carvalho, E., and Fraser, P. (2014). Metabolite profiling in LC-DADusing multivariate curve resolution: the alsace package for R. Metabolomics 11,143–154. doi: 10.1007/s11306-014-0683-5
Werner, A. (1993). Reversed-phase and ion-pair separations of nucleotides,nucleosides, and nucleobases - analysis of biological samples in health anddisease. J. Chromatogr. Biomed. Appl. 618, 3–14. doi: 10.1016/0378-4347(93)80024-X
Wolfender, J. L., Marti, G., Thomas, A. l., and Bertrand, S. (2015). Currentapproaches and challenges for the metabolite profiling of complex naturalextracts. J. Chromatogr. A On Line doi: 10.1016/j.chroma.2014.10.091 [Epubahead of print].
Wurtinger, P., and Oberacher, H. (2012). Evaluation of the performance of a tandemmass spectral library with mass spectral data extracted from literature. Drug Test.Anal. 4, 235–241. doi: 10.1002/dta.341
Xian, F., Hendrickson, C. L., and Marshall, A. G. (2012). High resolution massspectrometry. Anal. Chem. 84, 708–719. doi: 10.1021/ac203191t
Yang, J., Liang, Q., Wang, M., Jeffries, C., Smithson, D., Tu, Y., et al. (2014).UPLC-MS-ELSD-PDA as a powerful dereplication tool to facilitate compoundidentification from small-molecule natural product libraries. J. Nat. Prod. 77,902–909. doi: 10.1021/np4009706
Yang, J. Y., Sanchez, L. M., Rath, C. M., Liu, X., Boudreau, P. D., Bruns, N., et al.(2013). Molecular networking as a dereplication strategy. J. Nat. Prod. 76, 1686–1699. doi: 10.1021/np400413s
Yokota, K., Yatsuda, M., Miwa, E., and Higuchi, K. (2012). Comparativestudy on sample preparation methods for the HPLC quantification of iturinfrom culture supernatant of an antagonistic Bacillus strain. J. ISSAAS 18,70–75.
Zengler, K., Paradkar, A., and Keller, M. (2009). “Natural products: drug discoveryand therapeutic medicine, in New Methods to Access Microbial Diversity for SmallMolecule Discovery, eds L. Zhang and A. L. Demain (Totowa, NJ: Humana PressInc.), 275–293.
Zhang, L. (2005). “Natural products: drug discovery and therapeutic medicine,in Integrated Approaches for Discovering Novel Drugs from Microbial NaturalProducts, eds L. Zhang and A. L. Demain (Totowa, NJ: Humana Press Inc.), 33–55.
Zhang, X. M., Clausen, M. R., Zhao, X. L., Zheng, H., and Bertram, H. C. (2012).Enhancing the power of liquid chromatography-mass spectrometry-based urinemetabolomics in negative ion mode by optimization of the additive. Anal. Chem.84, 7785–7792. doi: 10.1021/ac3013835
Conflict of Interest Statement: The authors declare that the research was conductedin the absence of any commercial or financial relationships that could be construedas a potential conflict of interest.
Received: 27 November 2014; accepted: 20 January 2015; published online: 17February 2015.Citation: Nielsen KF and Larsen TO (2015) The importance of mass spectrometricdereplication in fungal secondary metabolite analysis. Front. Microbiol. 6:71. doi:10.3389/fmicb.2015.00071This article was submitted to Microbial Physiology and Metabolism, a section of thejournal Frontiers in Microbiology.Copyright © 2015 Nielsen and Larsen. This is an open-access article distributed underthe terms of the Creative Commons Attribution License (CC BY). The use, distributionor reproduction in other forums is permitted, provided the original author(s) or licensorare credited and that the original publication in this journal is cited, in accordance withaccepted academic practice. No use, distribution or reproduction is permitted whichdoes not comply with these terms.
www.frontiersin.org February 2015 | Volume 6 | Article 71 | 15