Embed Size (px)
Citation preview
research papers
10 https://doi.org/10.1107/S2059798317017491 Acta Cryst. (2018). D74, 10–20
Received 19 October 2017
Accepted 5 December 2017
Edited by A. Berghuis, McGill University,
Canada
Keywords: MamC; magnetosome;
biomineralization; protein–mineral interaction.
PDB references: unstructured MamC magnetite-
binding protein located between two helices,
5mm3; a MamC-MIC insertion in an MBP
scaffold at position Lys170, 6eqz
Supporting information: this article has
supporting information at journals.iucr.org/d
The importance of the helical structure of aMamC-derived magnetite-interacting peptide for itsfunction in magnetite formation
Hila Nudelman,a Teresa Perez Gonzalez,b Sofiya Kolushiva,c Marc Widdrat,d
Victoria Reichel,d Ana Peigneux,b Geula Davidov,a Ronit Bitton,c,e Damien Faivre,d
Concepcion Jimenez-Lopezb and Raz Zarivacha,c*
aDepartment of Life Sciences and the National Institute for Biotechnology in the Negev, Ben-Gurion University of the
Negev, Beer Sheva, Israel, bDepartamento de Microbiologia, Campus de Fuentenueva, Universidad de Granada,
18071 Granada, Spain, cIlse Katz Institute for Nanoscale Science and Technology, Ben-Gurion University of the Negev,
Beer Sheva, Israel, dDepartment of Biomaterials, Max Planck Institute of Colloids and Interfaces, Potsdam, Germany, andeDepartment of Chemical Engineering, Ben-Gurion University of the Negev, Beer Sheva, Israel. *Correspondence e-mail:
Biomineralization is the process of mineral formation by organisms and involves
the uptake of ions from the environment in order to produce minerals, with the
process generally being mediated by proteins. Most proteins that are involved in
mineral interactions are predicted to contain disordered regions containing
large numbers of negatively charged amino acids. Magnetotactic bacteria, which
are used as a model system for iron biomineralization, are Gram-negative
bacteria that can navigate through geomagnetic fields using a specific organelle,
the magnetosome. Each organelle comprises a membrane-enveloped magnetic
nanoparticle, magnetite, the formation of which is controlled by a specific set of
proteins. One of the most abundant of these proteins is MamC, a small
magnetosome-associated integral membrane protein that contains two trans-
membrane �-helices connected by an �21-amino-acid peptide. In vitro studies
of this MamC peptide showed that it forms a helical structure that can interact
with the magnetite surface and affect the size and shape of the growing crystal.
Our results show that a disordered structure of the MamC magnetite-interacting
component (MamC-MIC) abolishes its interaction with magnetite particles.
Moreover, the size and shape of magnetite crystals grown in in vitro magnetite-
precipitation experiments in the presence of this disordered peptide were
different from the traits of crystals grown in the presence of other peptides or in
the presence of the helical MIC. It is suggested that the helical structure of the
MamC-MIC is important for its function during magnetite formation.
1. Introduction
Biomineralization is the most common process of mineral
deposition by living organisms and can be found in all king-
doms of life. This process allows an organism to take up ions
from the environment and incorporate them into functional
structures that are useful for mechanical support (skeletons)
and protection (shells) and that allow magnetotaxis
(magnetosomes) (Mann, 2001; Lowenstam & Weiner, 1989;
Dove, 2010).
The formation of biominerals is highly regulated by
macromolecules, mostly proteins, which are involved in the
nucleation, growth, morphology and assembly of the inorganic
matrix (Lowenstam & Weiner, 1989). Many of the proteins
involved in biomineralization processes partially or fully lack
three-dimensional structure and instead are usually consid-
ered to be intrinsically disordered proteins (IDPs) or to
ISSN 2059-7983
# 2018 International Union of Crystallography
contain intrinsically disordered regions (IDRs) (Wald et al.,
2013). IDPs are rich in polar and charged residues and contain
few hydrophobic amino acids, which are generally responsible
for stable structural folds. In addition to contributing to bio-
mineralization, unstructured proteins are also found in regu-
latory and signalling pathways, such as in transmembrane
receptors, intracellular scaffolds, chaperones and transcription
factors (Wojtas et al., 2012).
Proteins that participate in the biomineralization process
generally inhibit or regulate mineral formation by controlling
the direction and extension of crystal growth (Addadi &
Weiner, 1992). For instance, osteopontin, one of the well
studied biomineralizing proteins with an unfolded structure,
regulates calcium crystallization in both bone and teeth
(Fisher et al., 2001). Its flexible structure enables osteopontin
to bind to other proteins or to mineral phases (Fisher et al.,
2001).
To better understand the relationship between the structure
of a protein and its mineral-interacting properties, we used a
peptide derived from MamC, a protein associated with the
magnetosome membrane in magnetotactic bacteria (MTB).
MTB are able to navigate the Earth’s magnetic field via the
formation of magnetic minerals from iron ions within a
specialized organelle, the magnetosome. The magnetosome is
composed of magnetic (magnetite or greigite) nanoparticles
surrounded by a lipid bilayer membrane. Each bacterial cell
contains one or several magnetosome chain(s) that align(s)
along the cell axis so as to allow a sufficient magnetic dipole
for geomagnetic field alignment. Diversity in the size and
shape of these magnetic nanoparticles is regulated by
magnetosome-associated proteins (MAPs). Mms6 is the most
abundant and most studied MAP and, using mms6-knockout
mutants, has been shown to be involved in magnetite forma-
tion in the magnetosome (Raschdorf et al., 2017). The deletion
or mutation of mms6 caused defects in the size and shape of
magnetite particles (Amemiya et al., 2007; Tanaka et al., 2011;
Yamagishi et al., 2016). In vitro studies also showed that Mms6
affects magnetite particle size and shape during iron precipi-
tation and that the 22 C-terminal residues are essential for
function (Kashyap et al., 2014; Rawlings et al., 2016; Yamagishi
et al., 2016).
Although Mms6 is important for magnetite formation,
MamC (Mms13) is the second most abundant MAP in the
magnetosome membrane (MM) and is highly conserved in
magnetotactic Alphaproteobacteria (Grunberg et al., 2004;
Jogler & Schuler, 2009; Raschdorf et al., 2017). MamC from
Magnetospirillum magneticum AMB-1 is a small integral
membrane protein (12.4 kDa) with two transmembrane
helices connected by a small peptide of 21 residues in length
(MamC magnetite-interacting component; MamC-MIC) that
is directed into the magnetosome lumen. In in vitro experi-
ments, MamC, expressed as a recombinant protein, was shown
to affect the size of magnetite crystals, with larger crystals
growing in the presence of the protein compared with those
grown in the absence of MamC (Valverde-Tercedor et al.,
2015; Nudelman et al., 2016).
To better understand the interaction of MamC-MIC with
magnetite, we previously created a chimera of maltose-binding
protein (MBP) with MamC-MIC (MBP-MamC-MIC). These
studies established that the MIC adopts an �-helical structure
that can interact with magnetite and affect its size and shape
during in vitro iron precipitation (Nudelman et al., 2016). In
the electron-density map of the MamC-MIC structure, we
could detect only 17 amino acids of the 21 residues comprising
the peptide, yet we showed that the peptide adopts a helical
conformation. The MIC �-helix contains two electrostatic
charged areas on its surface that are conserved in all MamC-
MIC homologues (Nudelman et al., 2016). It was further
shown that the MamC-MIC C-terminus presents a negatively
charged electrostatic surface, which is suspected to bind to the
magnetite surface and control its size and shape. This inter-
action is most likely to take place via two negatively charged
research papers
Acta Cryst. (2018). D74, 10–20 Nudelman et al. � MamC-derived magnetite-interacting peptide 11
Table 1Macromolecule-production information.
Source organism M. magneticum AMB-1Cloning vector pET-28a†Expression vector pET-28aExpression host E. coli RosettaComplete amino-acid sequence
of the MC R354 constructMGSSHHHHHHSSGLVPRGSHMKIEEGKLVI
WINGDKGYNGLAEVGKKFEKDTGIKVTV
EHPDKLEEKFPQVAATGDGPDIIFWAHD
RFGGYAQSGLLAEITPDKAFQDKLYPFT
WDAVRYNGKLIAYPIAVEALSLIYNKDL
LPNPPKTWEEIPALDKELKAKGKSALMF
NLQEPYFTWPLIAADGGYAFKYENGKYD
IKDVGVDNAGAKAGLTFLVDLIKNKHMN
ADTDYSIAEAAFNKGETAMTINGPWAWS
NIDTSKVNYGVTVLPTFKGQPSKPFVGV
LSAGINAASPNKELAKEFLENYLLTDEG
LEAVNKDKPLGAVALKSYEEELAKDPRI
AATMENAQKGEIMlPNIPQMSAFWYAVR
TAVINAASGRLKEKRITNTEAAIDTGKE
TVGQTVDEALKDAQTNSSS
Complete amino-acid sequenceof the MC K170 construct
MGSSHHHHHHSSGLVPRGSHMKIEEGKLVI
WINGDKGYNGLAEVGKKFEKDTGIKVTV
EHPDKLEEKFPQVAATGDGPDIIFWAHD
RFGGYAQSGLLAEITPDKAFQDKLYPFT
WDAVRYNGKLIAYPIAVEALSLIYNKDL
LPNPPKTWEEIPALDKELKAKGKSALMF
NLQEPYFTWPLIAADGGYAFLKEKRITN
TEAAIDTGKETVGVGVDNAGAKAGLTFL
VDLIKNKHMNADTDYSIAEAAFNKGETA
MTINGPWAWSNIDTSKVNYGVTVLPTFK
GQPSKPFVGVLSAGINAASPNKELAKEF
LENYLLTDEGLEAVNKDKPLGAVALKSY
EEELAKDPRIAATMENAQKGEIMPNIPQ
MSAFWYAVRTAVINAASGRQTVDEALKD
AQTNSSS
Complete amino-acid sequenceof the MC K313 construct
MGSSHHHHHHSSGLVPRGSHMKIEEGKLVI
WINGDKGYNGLAEVGKKFEKDTGIKVTV
EHPDKLEEKFPQVAATGDGPDIIFWAHD
RFGGYAQSGLLAEITPDKAFQDKLYPFT
WDAVRYNGKLIAYPIAVEALSLIYNKDL
LPNPPKTWEEIPALDKELKAKGKSALMF
NLQEPYFTWPLIAADGGYAFKYENGKYD
IKDVGVDNAGAKAGLTFLVDLIKNKHMN
ADTDYSIAEAAFNKGETAMTINGPWAWS
NIDTSKVNYGVTVLPTFKGQPSKPFVGV
LSAGINAASPNKELAKEFLENYLLTDEG
LEAVNKDKPLGAVALKSYEEELAKLKEK
RITNTEAAIDTGKETVGDPRIAATMENA
QKGEIMPNIPQMSAFWYAVRTAVINAAS
GRQTVDEALKDAQTNSSS
† All plasmids were purchased from Biomatik Corporation, Ontario, Canada.
residues, Glu66 and Asp70, located near the C-terminus of the
MIC and which contribute to the negatively charged surface.
To further mimic the position of the MIC between the two
MamC integral membrane �-helices, in the present work the
MamC-MIC was inserted between two helices in Escherichia
coli maltose-binding protein (MBP), based on the MBP
structure. This yielded several versions of the MBP-MamC-
MIC chimera, with three different MamC-MIC constructs
being inserted at three different positions in the MBP
sequence. In the first MamC-MIC was introduced between the
last two helices of the MBP scaffold (between Arg354 and
Gln355; named MC R354), while in the other two MamC-MIC
was positioned in the middle of the MBP structure, and these
were named according to their positions as MC K170 and MC
K313. We used isothermal titration calorimetry (ITC), in vitro
iron precipitation, small-angle X-ray scattering (SAXS) and
X-ray crystallography measurements to further characterize
and define the link between structured/unstructured folds and
MamC-MIC function.
2. Materials and methods
2.1. Protein cloning
To generate MC R354, a 21-amino-acid peptide derived
from the M. magneticum strain AMB-1 mamC gene (MamC-
MIC; Leu57–Gly77) was cloned into plasmid pET-28a
encoding E. coli MBP between the last two helices of the MBP
C-terminal region (Arg354–Gln355). To generate MC K170
and MC K313, the 21-amino-acid MamC-MIC (Leu57–Gly77)
was inserted between MBP residues Lys170 and Asp180 or
Lys313 and Lys314, respectively. All constructs were cloned
into the pET-28a vector. All constructs were purchased from
Biomatik, Cambridge, Ontario, Canada (Table 1). MBP-
MamC-MIC and MBP-Mms6-MIC have been described by
Nudelman et al. (2016).
2.2. Protein expression
Competent E. coli Rosetta cells were transformed with one
of the plasmids described above and grown in 12 l LB medium
with 50 mg ml�1 kanamycin and 30 mg ml�1 chloramphenicol
at 37�C. Protein production was induced with autoinduction
medium (Formedium, Hunstanton, England); after 8 h at 37�C
the protein was expressed overnight at 27�C. The cells were
collected by centrifugation for 8 min (7400g at 4�C) and frozen
at �80�C until use.
2.3. Protein purification
The cells were thawed and resuspended in binding buffer A
(20 mM Tris–HCl pH 8, 200 mM NaCl, 1 mM EDTA).
Protease-inhibitor cocktail (100 mM phenylmethylsulfonyl
fluoride, 1.2 mg ml�1 leupeptin and 1 mM pepstatin A) and
DNase (10 mg ml�1) were added after cell resuspension. The
cells were lysed by two rounds of disruption using a French
press apparatus at 172 MPa (Thermo, Waltham, Massachu-
setts, USA). The crude lysate was then centrifuged (31 000g at
4�C) for 40 min. The supernatant was loaded onto a pre-
equilibrated amylose resin column followed by washing with
five column volumes of binding buffer A. The protein was
eluted with elution buffer B (20 mM Tris–HCl pH 8, 200 mM
NaCl, 10 mM maltose, 5 mM imidazole). The eluted fractions
were loaded onto a homemade gravity Ni–NTA column [4 ml
bed volume, 2.5 cm diameter; Econo-Column Chromato-
graphy Column (Bio-Rad) containing Ni–NTA His-Bind
Resin, Lot M0063428 (Novagen)] pre-equilibrated with buffer
B. The protein was washed with buffers C, D and E (buffer C,
20 mM Tris–HCl pH 8, 1 M NaCl, 20 mM imidazole; buffer D,
20 mM Tris–HCl pH 8, 500 mM NaCl, 30 mM imidazole;
buffer E, 20 mM Tris–HCl pH 8, 200 mM NaCl, 40 mM
imidazole). The protein was eluted with buffer F (20 mM Tris–
HCl pH 8, 200 mM NaCl, 500 mM imidazole) and concen-
trated. The concentrated protein sample was loaded onto a
size-exclusion column (Superdex 75 26/60, GE Healthcare
Life Sciences) and eluted at a size that correlated to a
monomer (44 kDa). All fractions were collected, concen-
trated, flash-cooled in liquid nitrogen and stored at�80�C. All
purification steps were analyzed by 12.5% SDS–PAGE.
2.4. Crystal screening for MC K354 and MC K170
A 96-well sitting-drop plate was set up using the Index kit
(Hampton Research, Aliso Viejo, California, USA) for MC
R354 and MC K170. Each well in the plate contained two
protein drops corresponding to MC R354 with or without a
polyhistidine tag at concentrations of 14 and 11.4 mg ml�1,
respectively. For MC K170, each well contained different
protein concentrations: 7.5 and 15 mg ml�1. The plates were
stored at 20�C in an automated imaging system (Rock Imager,
Formulatrix, Bedford, Massachusetts, USA). Positive hits were
observed for MC R354 in a single condition, namely 1.4 M
trisodium citrate, for the untagged construct and 0.1 M
HEPES pH 7.5 for the polyhistidine-tagged construct. For MC
K170, positive hits were observed in one condition, namely
research papers
12 Nudelman et al. � MamC-derived magnetite-interacting peptide Acta Cryst. (2018). D74, 10–20
Table 2Crystallization.
MC R354 MC K170
Plate type Cryschem S small 24-well plate MRC 96-well plateTemperature (K) 293.15 293.15Protein concentration (mg ml�1) 11.5 20Buffer composition of protein solution 20 mM Tris pH 8, 200 mM NaCl 20 mM Tris pH 8, 200 mM NaClComposition of reservoir solution 1.4 M trisodium citrate, 0.1 M HEPES 1.86 M triammonium citrateVolume and ratio of drop 1 ml, 1:1 0.6 ml, 1:1Volume of reservoir 0.5 ml 80 ml
1.8 M triammonium citrate. Optimization plates were set up
around these crystallization conditions (Table 2).
2.5. Structure determination
A data set for MC R354 was collected using a single crystal
on beamline BM14 at the European Synchrotron Radiation
Facility (ESRF), Grenoble, France. The MC R354 data set was
collected using a wavelength of 0.939 A. 1000 images were
collected with an oscillation range of 0.2�, an exposure time of
0.01 s per image and a crystal-to-detector distance of
303.4 mm. The data were processed and scaled using the
HKL-2000 program suite (Otwinowski & Minor, 1997). Phases
were obtained via molecular replacement with Phaser using
the coordinates of MBP-MamC-MIC (PDB entry 5e7u; H.
Nudelman & R. Zarivach, unpublished work) followed by
manual building cycles using Coot (Emsley & Cowtan, 2004;
McCoy et al., 2007). Structures were refined in REFMAC5
(Murshudov et al., 2011), while the final model was refined and
built using the PDB_REDO server (Joosten et al., 2009).
For MC K170, a data set was collected using a single crystal
on beamline ID29 at ESRF. The MC K170 data set was
collected with a wavelength of 0.976 A. 1300 images were
collected with an oscillation of 0.1�, an exposure time of
0.037 s per image and a crystal-to-detector distance of
391.26 nm. The data were processed and scaled using XDS
(Kabsch, 2010). Phases were obtained via molecular replace-
ment with Phaser using the coordinates of MBP-MamC-MIC
(PDB entry 5e7u) followed by manual building cycles using
Coot (Emsley & Cowtan, 2004; McCoy et al., 2007). The
structure was refined in PHENIX (Zwart et al., 2008). Struc-
tural figures were prepared using PyMOL (DeLano, 2002).
Data-collection and structure-refinement statistics are given in
Tables 3 and 4.
2.6. Synthesis of magnetic nanoparticles for protein-interaction experiments
Magnetite was synthesized by a modified co-precipitation
method controlled by a titration system (Metrohm, 776
Dosimat and 719 S Titrino). Iron(II)/iron(III) chloride solu-
tion (1 M; 1:2 Fe2+:Fe3+) was added at a rate of 1 ml min�1 to a
total volume of 10 ml. The pH and temperature were kept
constant (the pH was held at 11� 0.4 with 1 M NaOH and the
temperature was held at 25 � 0.1�C) during an 8 h synthetic
process. All solutions were degassed before use and the system
was kept in a nitrogen atmosphere during synthesis. Magnetite
size was determined by assessing synchrotron X-ray diffrac-
tion on the �-Spot beamline (BESSY II, Berlin) by Scherrer
analysis of the (311) peak of magnetite (Baumgartner et al.,
2013; Widdrat et al., 2014).
2.7. ITC
Interactions between MamC constructs and magnetite were
investigated at a constant temperature by titrating the protein
samples (in 20 mM Tris–HCl pH 8, 200 mM NaCl) into a
solution containing magnetite in the sample cell of the
calorimeter, since magnetite can clog the injection needle. The
heat change was expressed as the electrical power (J s�1;
Jelesarov & Bosshard, 1999). As a control, each protein was
also injected into a buffer without magnetite particles. All
research papers
Acta Cryst. (2018). D74, 10–20 Nudelman et al. � MamC-derived magnetite-interacting peptide 13
Table 3Data collection and processing.
Values in parentheses are for the outer shell.
MC R354(PDB entry 5mm3)
MC K170(PDB entry 6eqz)
Diffraction source ID14-4, ESRF ID29, ESRFWavelength (A) 0.939 0.976Temperature (K) 100 100Detector ADSC Q315 Pilatus 6MFCrystal-to-detector distance (mm) 303.4 391.26Rotation range per image (�) 0.2 0.1Total rotation range (�) 69 130Exposure time per image (s) 0.1 0.037Space group P41212 P222a, b, c (A) 115, 115, 117 110.6, 113.8, 115.5�, �, � (�) 90, 90, 90 90, 90, 90Mosaicity (�) 0.599 0.170Resolution range (A) 82.18–2.10 46.70–2.29Total No. of reflections 116817 318921No. of unique reflections 38573 65839Completeness (%) 82.6 (87.5) 99.6 (95.0)Multiplicity 3.0 (2.9) 4.8 (4.7)hI/�(I)i 23.3 (4.56) 5.5 (0.8)Rr.i.m.† 0.118 (0.43) 0.284 (2.40)CC1/2 0.955 (0.947) 0.977 (0.310)Overall B factor from
Wilson plot (A2)27.00 36.46
† Rr.i.m. is the Rmerge value multiplied by the factor [N/(N � 1)]1/2, where N is the datamultiplicity.
Table 4Structure solution and refinement.
Values in parentheses are for the outer shell.
MC R354(PDB entry 5mm3)
MC K170(PDB entry 6eqz)
Resolution range (A) 47.57–2.10 26.70–2.30Completeness (%) 82.50 99.19� Cutoff None 1.33No. of reflections
Working set 36623 65508Test set 1920 3320
Final Rcryst 0.1844 0.2046Final Rfree 0.2278 0.2738Cruickshank DPI 0.205 0.410No. of non-H atoms
Protein Chain A, 2891;chain B, 2740
Chain A, 2937; chain B, 2907;chain D, 2948; chain G, 2907
Ligand 46 92Water 293 288Total 5970 12079
R.m.s. deviationsBonds (A) 0.0105 0.009Angles (�) 1.4179 1.193
Average B factors (A2)Overall 32.30 42.72Protein Chain A, 29.93;
chain B, 35.12Chain A, 42.18; chain B, 38.88;
chain D, 45.12; chain G, 45.75Ligand 27.061 Chain E, 32.70; chain C, 30.82;
chain F, 37.31; chain H, 32.57Water 30.26 34.90
Ramachandran plotMost favoured (%) 97.20 97.67Allowed (%) 2.66 2.13Outliers (%) 0.14 0.20
measurements were compared with a reference cell containing
distilled deionized water. Owing to magnetite-particle
agglomeration, the thermodynamic parameters could not be
determined. Only interactions between proteins and magne-
tite particles were obtained. Therefore, each sample was
measured three times to confirm the protein–magnetite
interaction results.
2.8. SAXS
SAXS experiments were performed on the BM29 BioSAXS
beamline at the ESRF. An energy level of 12.5 keV, corre-
sponding to a wavelength of 0.998 A, was selected. The scat-
tering intensity was recorded using a Pilatus 1M detector in
the 0.004 < q < 0. 5 A�1 interval. Ten frames with 2 s exposure
time were recorded for each sample. Measurements were
performed in flow mode, with samples being pumped through
the capillary at a constant flow rate. The dedicated beamline
software BsxCuBe and EDNA were used for data collection
and preliminary processing. Further analyses and final plot
preparations were performed using ATSAS and IGOR v.6.3
(Franke et al., 2017). A theoretical Rg was calculated from the
PDB file using CRYSOL.
2.9. Free-drift biomineralization experiments
Free-drift biomineralization experiments were performed
following the procedures described in Valverde-Tercedor et al.
(2015) and Nudelman et al. (2016). All reagents were
purchased from Sigma–Aldrich. Briefly, deoxygenated solu-
tions of 0.15 M NaHCO3/Na2CO3, 1 M FeCl3, 0.5 M Fe(ClO4)2
and 5 M NaOH were prepared with deoxygenated Milli-Q
water. Aliquots of the peptides used in the present study were
bubbled with purified nitrogen for 10 min to remove residual
O2 and placed inside a Coy chamber along with the water.
Synthesis and material handling were carried out inside the
anaerobic chamber (O2 level of �40 p.p.b.) to avoid potential
oxidation.
Inorganic magnetite was precipitated from solutions in free-
drift experiments held at 25�C and 101.3 kPa total pressure
inside the Coy chamber filled with 4% H2 in N2, following the
protocol described by Perez-Gonzalez et al. (2011). Different
volumes of the solutions listed above were mixed to prepare
the precipitation solution to a final composition of 3.5 mM
NaHCO3/Na2CO3, 5.56 mM FeCl3, 2.78 mM Fe(ClO4)2 pH 9,
which was achieved by the addition of NaOH solution.
Analysis of the effect of MC K354 on magnetite precipita-
tion was carried out in the presence of the chimera at
10 mg ml�1. The reaction was allowed to proceed inside the
anaerobic chamber for 30 d, after which time the precipitated
materials were harvested. The precipitated solids were
concentrated in tubes with a magnet, while the supernatants,
which were transparent and contained no visible solids, were
discarded. The precipitates were washed with deoxygenated
water. This washing procedure was repeated three times, after
which the precipitate was collected, immediately freeze-dried
(Flexi-Dry �P) and stored inside the anaerobic chamber until
analysis. Data from this study were compared with those
reported by Nudelman et al. (2016), with the MBP-MamC-
MIC in the present study corresponding to MBP-long as
described in the previous report.
2.10. Transmission electron microscopy (TEM)
The morphologies and sizes of the crystals collected above
were studied by TEM using a Philips Model CM20 electron
microscope equipped with an energy-dispersive X-ray spec-
trometer (EDAX). The synthesized magnetic powders were
dehydrated with ethanol and embedded in Embed 812 resin.
Ultrathin (50–70 nm) sections were prepared using a Reichert
Ultracut S microtome (Leica Microsystems, Wetzlar,
Germany). The sections were placed onto copper grids and
carbon-coated using an Emitech Model K975X thermal
evaporator (Fall River, Massachusetts, USA). Imaging and
size-distribution analyses were performed on more than 600
nanoparticles in each experiment. Crystal sizes were measured
manually using ImageJ v.1.47, while size-distribution curves
were determined from these measurements using OriginPro
v.9. Statistical calculations were performed using Statistica v.12
and Microsoft Excel.
3. Results and discussion
3.1. Structural analysis
MC R354 gave positive hits during our crystallographic
trials, crystallizing as diamond-shaped crystals with two
molecules in the asymmetric unit. The MC R354 crystal
diffracted to 2.1 A resolution and its structure was determined
via molecular replacement using the MBP-MamC-MIC
structure (PDB entry 5e7u) followed by manual building. The
structure of MC R354 revealed that only one chain in the
asymmetric unit, chain A, contained sufficient electron density
to allow structure determination of MamC-MIC. Only 17
amino acids of MamC-MIC were found in an unstructured
conformation, while the last four residues and the following
�-helix in the MBP C-terminal region (Gln376–Ser391) were
not observed (Figs. 1a and 1b). In contrast to MC R354 chain
A, we were able to resolve chain B up to Ala352; this chain
therefore lacks both the MamC loop and the MBP C-terminal
region, probably owing to the high flexibility of MamC-MIC.
Structural overlap of the two MBP monomers in the
asymmetric unit revealed substantial structural identity,
supported by a root-mean-square deviation (r.m.s.d.) of
0.46 A, indicating high similarity between these two MBP
chains. In contrast, the overlap between helical MamC-MIC
(PDB entry 5e7u) and the unstructured MamC-MIC moiety
from MC R354 chain A (PDB entry 5mm3) yielded a higher
r.m.s.d. of 6.28 A, reflecting large structural differences
between the two (Figs. 1c and 1d; Nudelman et al., 2016). The
inability of MamC-MIC to form a helical structure in MC
R354 could result from instability of the last 16 amino acids at
the MBP C-terminus (Gln376–Ser391). Interruption of this
C-terminal helical structure is probably owing to the insertion
of MamC-MIC.
In previous studies, MamC-MIC presented a helical struc-
ture when attached to the C-terminus of MBP. In the helical
research papers
14 Nudelman et al. � MamC-derived magnetite-interacting peptide Acta Cryst. (2018). D74, 10–20
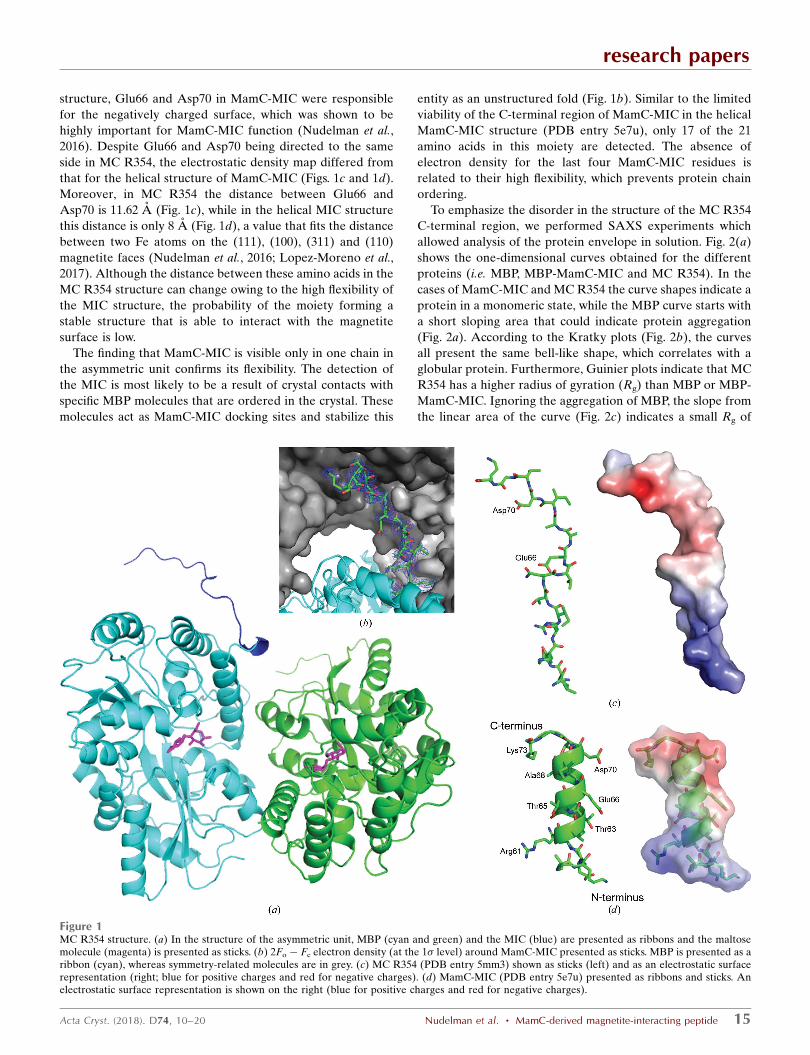
structure, Glu66 and Asp70 in MamC-MIC were responsible
for the negatively charged surface, which was shown to be
highly important for MamC-MIC function (Nudelman et al.,
2016). Despite Glu66 and Asp70 being directed to the same
side in MC R354, the electrostatic density map differed from
that for the helical structure of MamC-MIC (Figs. 1c and 1d).
Moreover, in MC R354 the distance between Glu66 and
Asp70 is 11.62 A (Fig. 1c), while in the helical MIC structure
this distance is only 8 A (Fig. 1d), a value that fits the distance
between two Fe atoms on the (111), (100), (311) and (110)
magnetite faces (Nudelman et al., 2016; Lopez-Moreno et al.,
2017). Although the distance between these amino acids in the
MC R354 structure can change owing to the high flexibility of
the MIC structure, the probability of the moiety forming a
stable structure that is able to interact with the magnetite
surface is low.
The finding that MamC-MIC is visible only in one chain in
the asymmetric unit confirms its flexibility. The detection of
the MIC is most likely to be a result of crystal contacts with
specific MBP molecules that are ordered in the crystal. These
molecules act as MamC-MIC docking sites and stabilize this
entity as an unstructured fold (Fig. 1b). Similar to the limited
viability of the C-terminal region of MamC-MIC in the helical
MamC-MIC structure (PDB entry 5e7u), only 17 of the 21
amino acids in this moiety are detected. The absence of
electron density for the last four MamC-MIC residues is
related to their high flexibility, which prevents protein chain
ordering.
To emphasize the disorder in the structure of the MC R354
C-terminal region, we performed SAXS experiments which
allowed analysis of the protein envelope in solution. Fig. 2(a)
shows the one-dimensional curves obtained for the different
proteins (i.e. MBP, MBP-MamC-MIC and MC R354). In the
cases of MamC-MIC and MC R354 the curve shapes indicate a
protein in a monomeric state, while the MBP curve starts with
a short sloping area that could indicate protein aggregation
(Fig. 2a). According to the Kratky plots (Fig. 2b), the curves
all present the same bell-like shape, which correlates with a
globular protein. Furthermore, Guinier plots indicate that MC
R354 has a higher radius of gyration (Rg) than MBP or MBP-
MamC-MIC. Ignoring the aggregation of MBP, the slope from
the linear area of the curve (Fig. 2c) indicates a small Rg of
research papers
Acta Cryst. (2018). D74, 10–20 Nudelman et al. � MamC-derived magnetite-interacting peptide 15
Figure 1MC R354 structure. (a) In the structure of the asymmetric unit, MBP (cyan and green) and the MIC (blue) are presented as ribbons and the maltosemolecule (magenta) is presented as sticks. (b) 2Fo � Fc electron density (at the 1� level) around MamC-MIC presented as sticks. MBP is presented as aribbon (cyan), whereas symmetry-related molecules are in grey. (c) MC R354 (PDB entry 5mm3) shown as sticks (left) and as an electrostatic surfacerepresentation (right; blue for positive charges and red for negative charges). (d) MamC-MIC (PDB entry 5e7u) presented as ribbons and sticks. Anelectrostatic surface representation is shown on the right (blue for positive charges and red for negative charges).
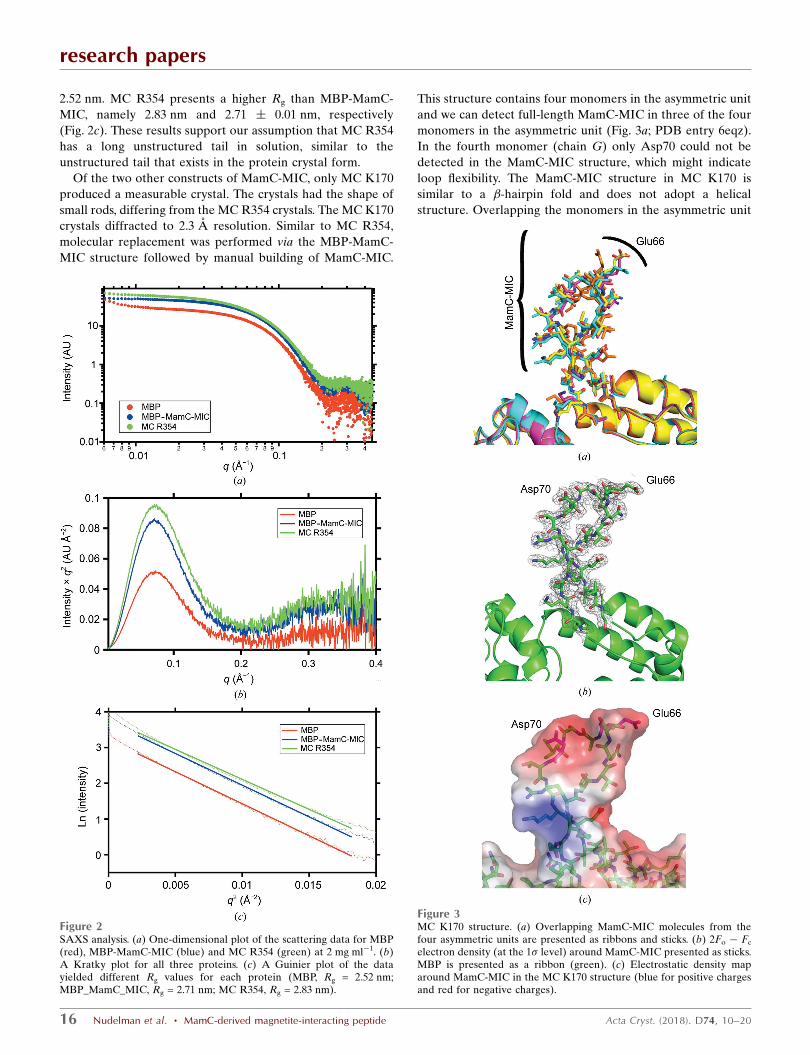
2.52 nm. MC R354 presents a higher Rg than MBP-MamC-
MIC, namely 2.83 nm and 2.71 � 0.01 nm, respectively
(Fig. 2c). These results support our assumption that MC R354
has a long unstructured tail in solution, similar to the
unstructured tail that exists in the protein crystal form.
Of the two other constructs of MamC-MIC, only MC K170
produced a measurable crystal. The crystals had the shape of
small rods, differing from the MC R354 crystals. The MC K170
crystals diffracted to 2.3 A resolution. Similar to MC R354,
molecular replacement was performed via the MBP-MamC-
MIC structure followed by manual building of MamC-MIC.
This structure contains four monomers in the asymmetric unit
and we can detect full-length MamC-MIC in three of the four
monomers in the asymmetric unit (Fig. 3a; PDB entry 6eqz).
In the fourth monomer (chain G) only Asp70 could not be
detected in the MamC-MIC structure, which might indicate
loop flexibility. The MamC-MIC structure in MC K170 is
similar to a �-hairpin fold and does not adopt a helical
structure. Overlapping the monomers in the asymmetric unit
research papers
16 Nudelman et al. � MamC-derived magnetite-interacting peptide Acta Cryst. (2018). D74, 10–20
Figure 3MC K170 structure. (a) Overlapping MamC-MIC molecules from thefour asymmetric units are presented as ribbons and sticks. (b) 2Fo � Fc
electron density (at the 1� level) around MamC-MIC presented as sticks.MBP is presented as a ribbon (green). (c) Electrostatic density maparound MamC-MIC in the MC K170 structure (blue for positive chargesand red for negative charges).
Figure 2SAXS analysis. (a) One-dimensional plot of the scattering data for MBP(red), MBP-MamC-MIC (blue) and MC R354 (green) at 2 mg ml�1. (b)A Kratky plot for all three proteins. (c) A Guinier plot of the datayielded different Rg values for each protein (MBP, Rg = 2.52 nm;MBP_MamC_MIC, Rg = 2.71 nm; MC R354, Rg = 2.83 nm).
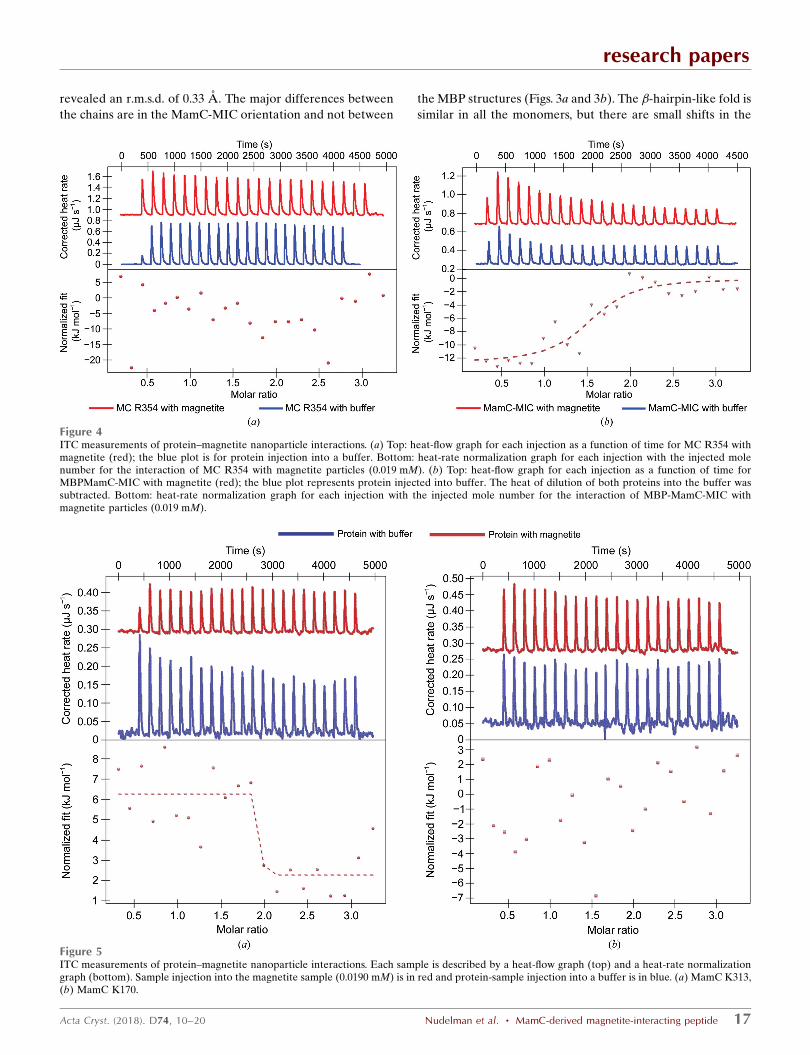
revealed an r.m.s.d. of 0.33 A. The major differences between
the chains are in the MamC-MIC orientation and not between
the MBP structures (Figs. 3a and 3b). The �-hairpin-like fold is
similar in all the monomers, but there are small shifts in the
research papers
Acta Cryst. (2018). D74, 10–20 Nudelman et al. � MamC-derived magnetite-interacting peptide 17
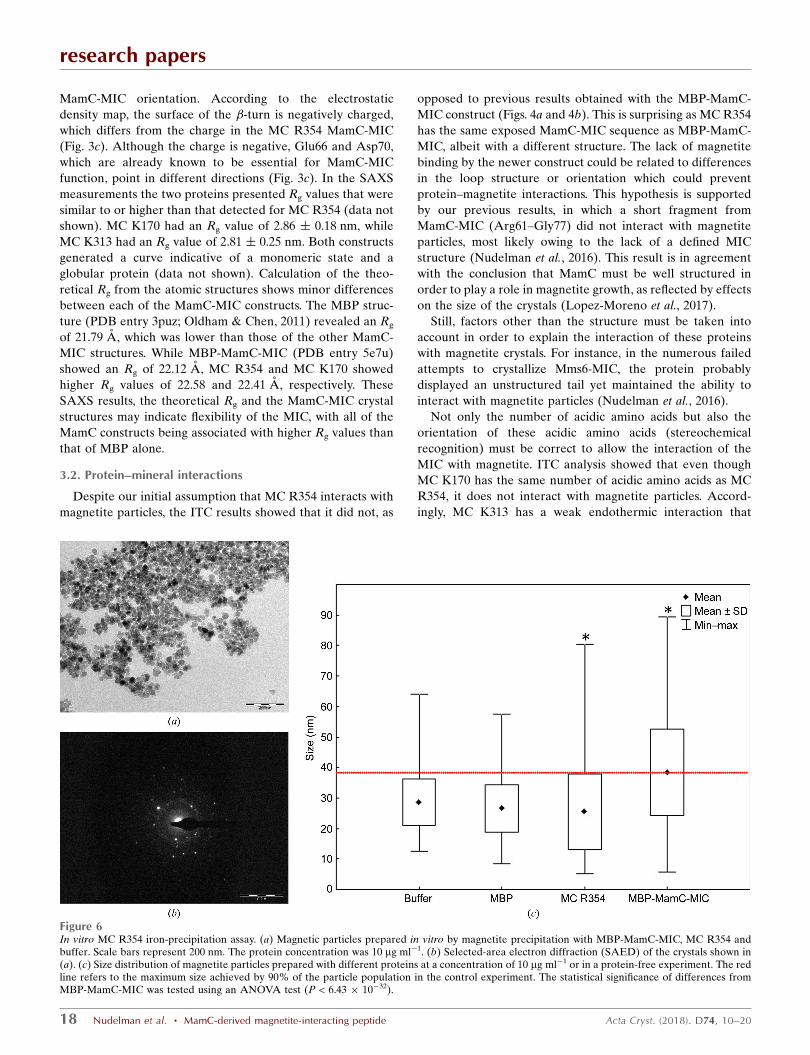
Figure 5ITC measurements of protein–magnetite nanoparticle interactions. Each sample is described by a heat-flow graph (top) and a heat-rate normalizationgraph (bottom). Sample injection into the magnetite sample (0.0190 mM) is in red and protein-sample injection into a buffer is in blue. (a) MamC K313,(b) MamC K170.
Figure 4ITC measurements of protein–magnetite nanoparticle interactions. (a) Top: heat-flow graph for each injection as a function of time for MC R354 withmagnetite (red); the blue plot is for protein injection into a buffer. Bottom: heat-rate normalization graph for each injection with the injected molenumber for the interaction of MC R354 with magnetite particles (0.019 mM). (b) Top: heat-flow graph for each injection as a function of time forMBPMamC-MIC with magnetite (red); the blue plot represents protein injected into buffer. The heat of dilution of both proteins into the buffer wassubtracted. Bottom: heat-rate normalization graph for each injection with the injected mole number for the interaction of MBP-MamC-MIC withmagnetite particles (0.019 mM).
MamC-MIC orientation. According to the electrostatic
density map, the surface of the �-turn is negatively charged,
which differs from the charge in the MC R354 MamC-MIC
(Fig. 3c). Although the charge is negative, Glu66 and Asp70,
which are already known to be essential for MamC-MIC
function, point in different directions (Fig. 3c). In the SAXS
measurements the two proteins presented Rg values that were
similar to or higher than that detected for MC R354 (data not
shown). MC K170 had an Rg value of 2.86 � 0.18 nm, while
MC K313 had an Rg value of 2.81 � 0.25 nm. Both constructs
generated a curve indicative of a monomeric state and a
globular protein (data not shown). Calculation of the theo-
retical Rg from the atomic structures shows minor differences
between each of the MamC-MIC constructs. The MBP struc-
ture (PDB entry 3puz; Oldham & Chen, 2011) revealed an Rg
of 21.79 A, which was lower than those of the other MamC-
MIC structures. While MBP-MamC-MIC (PDB entry 5e7u)
showed an Rg of 22.12 A, MC R354 and MC K170 showed
higher Rg values of 22.58 and 22.41 A, respectively. These
SAXS results, the theoretical Rg and the MamC-MIC crystal
structures may indicate flexibility of the MIC, with all of the
MamC constructs being associated with higher Rg values than
that of MBP alone.
3.2. Protein–mineral interactions
Despite our initial assumption that MC R354 interacts with
magnetite particles, the ITC results showed that it did not, as
opposed to previous results obtained with the MBP-MamC-
MIC construct (Figs. 4a and 4b). This is surprising as MC R354
has the same exposed MamC-MIC sequence as MBP-MamC-
MIC, albeit with a different structure. The lack of magnetite
binding by the newer construct could be related to differences
in the loop structure or orientation which could prevent
protein–magnetite interactions. This hypothesis is supported
by our previous results, in which a short fragment from
MamC-MIC (Arg61–Gly77) did not interact with magnetite
particles, most likely owing to the lack of a defined MIC
structure (Nudelman et al., 2016). This result is in agreement
with the conclusion that MamC must be well structured in
order to play a role in magnetite growth, as reflected by effects
on the size of the crystals (Lopez-Moreno et al., 2017).
Still, factors other than the structure must be taken into
account in order to explain the interaction of these proteins
with magnetite crystals. For instance, in the numerous failed
attempts to crystallize Mms6-MIC, the protein probably
displayed an unstructured tail yet maintained the ability to
interact with magnetite particles (Nudelman et al., 2016).
Not only the number of acidic amino acids but also the
orientation of these acidic amino acids (stereochemical
recognition) must be correct to allow the interaction of the
MIC with magnetite. ITC analysis showed that even though
MC K170 has the same number of acidic amino acids as MC
R354, it does not interact with magnetite particles. Accord-
ingly, MC K313 has a weak endothermic interaction that
research papers
18 Nudelman et al. � MamC-derived magnetite-interacting peptide Acta Cryst. (2018). D74, 10–20
Figure 6In vitro MC R354 iron-precipitation assay. (a) Magnetic particles prepared in vitro by magnetite precipitation with MBP-MamC-MIC, MC R354 andbuffer. Scale bars represent 200 nm. The protein concentration was 10 mg ml�1. (b) Selected-area electron diffraction (SAED) of the crystals shown in(a). (c) Size distribution of magnetite particles prepared with different proteins at a concentration of 10 mg ml�1 or in a protein-free experiment. The redline refers to the maximum size achieved by 90% of the particle population in the control experiment. The statistical significance of differences fromMBP-MamC-MIC was tested using an ANOVA test (P < 6.43 � 10�32).
differs from the exothermic interaction shown by MamC-MIC,
as presented in our previous study (Fig. 5; Nudelman et al.,
2016). The lack of stereochemical recognition in these
constructs, compared with that of MamC-MIC, may explain
the differences observed. According to structural predictions,
the Mms6 peptide is only attached at its N-terminus, while the
C-terminal end is highly flexible without any defined structure
(Nudelman & Zarivach, 2014). It is important to say that the
ITC results point to weak interactions that differ from the
interaction of helical MamC and MBP with a C-terminally
placed Mms6, which was used as a positive control.
3.3. In vitro iron co-precipitation
One important role that MamC plays in magnetosome
formation is to affect magnetite size and shape during the
biomineralization process. Therefore, in the present study we
performed in vitro iron-precipitation assays to determine
whether MC R354 also had an effect on magnetite size and
shape. The average magnetite particle size obtained in the
presence of MC R354 was 25.43 � 0.57 nm, while that for
MBP-MamC-MIC was 38.35 � 0.93 nm (Fig. 6; Nudelman et
al., 2016). An ANOVA test showed a small P value of 6.43 �
10�32, with an F value of 152.96. A low P-value and an F value
greater than 1 mean that the two populations are significantly
different. Moreover, the crystals formed in the presence of
MC R354 displayed less defined faces than those observed in
crystals formed in the presence of MBP-MamC-MIC (Fig. 6).
The differences between these two populations cannot be
explained by the presence of MBP, since the ANOVA test
showed no significant differences (P-value = 0.07) between the
size of the particles obtained in the presence of MC R354 and
those obtained in the presence of MBP (average size of
26.61 nm).
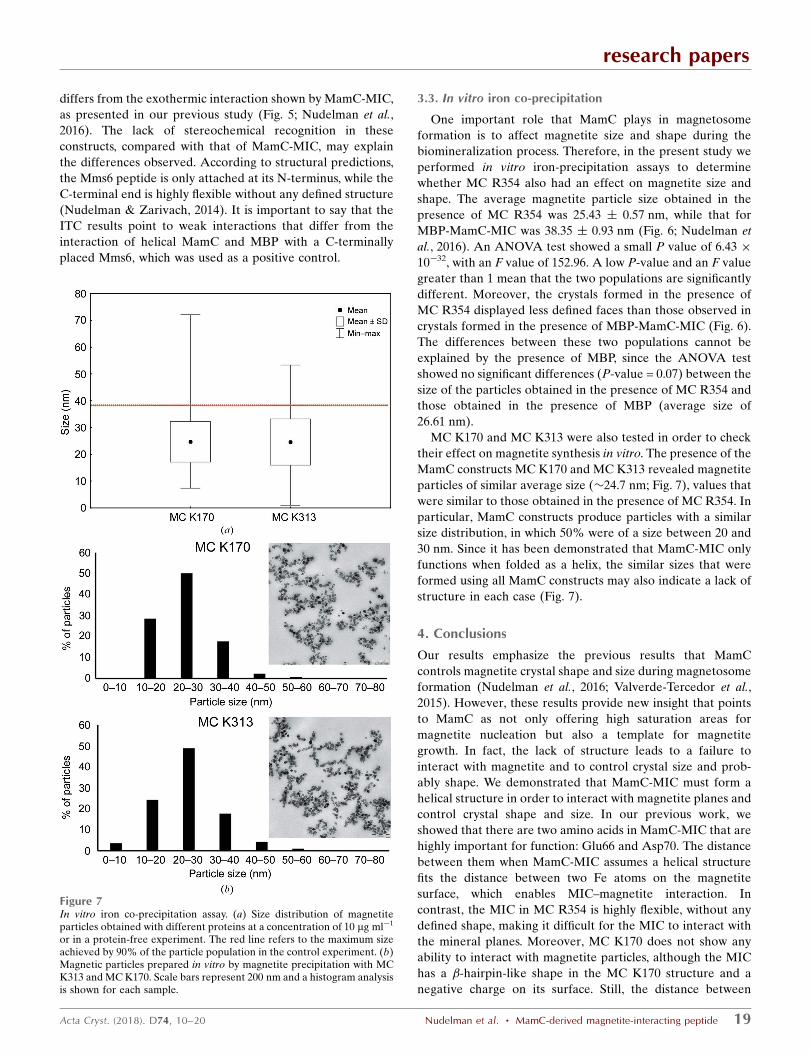
MC K170 and MC K313 were also tested in order to check
their effect on magnetite synthesis in vitro. The presence of the
MamC constructs MC K170 and MC K313 revealed magnetite
particles of similar average size (�24.7 nm; Fig. 7), values that
were similar to those obtained in the presence of MC R354. In
particular, MamC constructs produce particles with a similar
size distribution, in which 50% were of a size between 20 and
30 nm. Since it has been demonstrated that MamC-MIC only
functions when folded as a helix, the similar sizes that were
formed using all MamC constructs may also indicate a lack of
structure in each case (Fig. 7).
4. Conclusions
Our results emphasize the previous results that MamC
controls magnetite crystal shape and size during magnetosome
formation (Nudelman et al., 2016; Valverde-Tercedor et al.,
2015). However, these results provide new insight that points
to MamC as not only offering high saturation areas for
magnetite nucleation but also a template for magnetite
growth. In fact, the lack of structure leads to a failure to
interact with magnetite and to control crystal size and prob-
ably shape. We demonstrated that MamC-MIC must form a
helical structure in order to interact with magnetite planes and
control crystal shape and size. In our previous work, we
showed that there are two amino acids in MamC-MIC that are
highly important for function: Glu66 and Asp70. The distance
between them when MamC-MIC assumes a helical structure
fits the distance between two Fe atoms on the magnetite
surface, which enables MIC–magnetite interaction. In
contrast, the MIC in MC R354 is highly flexible, without any
defined shape, making it difficult for the MIC to interact with
the mineral planes. Moreover, MC K170 does not show any
ability to interact with magnetite particles, although the MIC
has a �-hairpin-like shape in the MC K170 structure and a
negative charge on its surface. Still, the distance between
research papers
Acta Cryst. (2018). D74, 10–20 Nudelman et al. � MamC-derived magnetite-interacting peptide 19
Figure 7In vitro iron co-precipitation assay. (a) Size distribution of magnetiteparticles obtained with different proteins at a concentration of 10 mg ml�1
or in a protein-free experiment. The red line refers to the maximum sizeachieved by 90% of the particle population in the control experiment. (b)Magnetic particles prepared in vitro by magnetite precipitation with MCK313 and MC K170. Scale bars represent 200 nm and a histogram analysisis shown for each sample.
Glu66 and Asp70 is too long in order for it to interact directly
with the particle surface. Our assumption is that MamC-MIC
adopts a �-helical structure owing to its location between two
transmembrane helices. This helix can act as an anchor to the
magnetosome membrane and as a protein-oligomerization
module within the membrane. Our findings further indicate
that although the MIC contains the necessary sequence for
magnetite binding in an exposed form, its structure plays a
crucial role in successful binding. Furthermore, the results
support the MamC–mineral interaction model for describing
helix–magnetite interactions.
Acknowledgements
We thank Dr Anat Shahar from the Macromolecular Crys-
tallography Research Center (MCRC) for her help with the
X-ray crystallography analyses. The crystallography experi-
ments were performed on beamlines ID14-4 and ID29 at the
European Synchrotron Radiation Facility (ESRF), Grenoble,
France. We are grateful to the Local Contact at the ESRF for
providing assistance in using beamlines ID14-4 and ID29.
Funding information
This work is supported by the Israel Science Foundation, the
Israel Ministry of Science, Technology and Space, the
European Molecular Biology Organization, the Max Planck
Society and CMST COST Action CM0902. CJL thanks
projects CGL2013-46612 and CGL2016-76723 from the
Ministerio de Economıa y Competitividad, Spain and Fondo
Europeo de Desarrollo Regional (FEDER). DF acknowledges
financial support from the Max Planck Society.
References
Addadi, L. & Weiner, S. (1992). Angew. Chem. Int. Ed. Engl. 31, 153–169.
Amemiya, Y., Arakaki, A., Staniland, S. S., Tanaka, T. & Matsunaga,T. (2007). Biomaterials, 28, 5381–5389.
Baumgartner, J., Bertinetti, L., Widdrat, M., Hirt, A. M. & Faivre, D.(2013). PLoS One, 8, e57070.
DeLano, W. (2002). CCP4 Newsl. Protein Crystallogr. 40,contribution 11. http://www.ccp4.ac.uk/newsletters/newsletter40/11_pymol.pdf.
Dove, P. M. (2010). Elements, 6, 37–42.Emsley, P. & Cowtan, K. (2004). Acta Cryst. D60, 2126–2132.Fisher, L. W., Torchia, D. A., Fohr, B., Young, M. F. & Fedarko, N. S.
(2001). Biochem. Biophys. Res. Commun. 280, 460–465.Franke, D., Petoukhov, M. V., Konarev, P. V., Panjkovich, A.,
Tuukkanen, A., Mertens, H. D. T., Kikhney, A. G., Hajizadeh, N. R.,Franklin, J. M., Jeffries, C. M. & Svergun, D. I. (2017). J. Appl.Cryst. 50, 1212–1225.
Grunberg, K., Muller, E. C., Otto, A., Reszka, R., Linder, D., Kube,
M., Reinhardt, R. & Schuler, D. (2004). Appl. Environ. Microbiol.70, 1040–1050.
Jelesarov, I. & Bosshard, H. R. (1999). J. Mol. Recognit. 12, 3–18.Jogler, C. & Schuler, D. (2009). Annu. Rev. Microbiol. 63, 501–521.Joosten, R. P. et al. (2009). J. Appl. Cryst. 42, 376–384.Kabsch, W. (2010). Acta Cryst. D66, 125–132.Kashyap, S., Woehl, T. J., Liu, X., Mallapragada, S. K. & Prozorov, T.
(2014). ACS Nano, 8, 9097–9106.Lopez-Moreno, R., Fernandez-Vivas, A., Valverde-Tercedor, C.,
Azuaga Fortes, A. I., Casares Atienza, S., Rodriguez-Navarro,A. B., Zarivach, R. & Jimenez-Lopez, C. (2017). Cryst. Growth Des.17, 1620–1629.
Lowenstam, H. A. & Weiner, S. (1989). On Biomineralization. OxfordUniversity Press.
Mann, S. (2001). Biomineralization: Principles and Concepts inBioinorganic Materials Chemistry. Oxford University Press.
McCoy, A. J., Grosse-Kunstleve, R. W., Adams, P. D., Winn, M. D.,Storoni, L. C. & Read, R. J. (2007). J. Appl. Cryst. 40, 658–674.
Murshudov, G. N., Skubak, P., Lebedev, A. A., Pannu, N. S., Steiner,R. A., Nicholls, R. A., Winn, M. D., Long, F. & Vagin, A. A. (2011).Acta Cryst. D67, 355–367.
Nudelman, H., Valverde-Tercedor, C., Kolusheva, S., Perez, T.,Widdrat, M., Grimberg, N., Levi, H., Nelkenbaum, O., Davidov, G.,Faivre, D., Jimenez-Lopez, C. & Zarivach, R. (2016). J. Struct. Biol.194, 244–252.
Nudelman, H. & Zarivach, R. (2014). Front. Microbiol. 5, 9.Oldham, M. L. & Chen, J. (2011). Science, 332, 1202–1205.Otwinowski, Z. & Minor, W. (1997). Methods Enzymol. 276, 307–326.Perez Gonzalez, T., Rodriguez-Navarro, A. B. & Jiminez-Lopez, C.
(2011). J. Supercond. Nov. Magn. 24, 549–557.Raschdorf, O., Bonn, F., Zeytuni, N., Zarivach, R., Becher, D. &
Schuler, D. (2017). J. Proteomics, https://doi.org/10.1016/j.jprot.2017.10.007.
Rawlings, A. E., Bramble, J. P., Hounslow, A. M., Williamson, M. P.,Monnington, A. E., Cooke, D. J. & Staniland, S. S. (2016).Chemistry, 22, 7885–7894.
Tanaka, M., Mazuyama, E., Arakaki, A. & Matsunaga, T. (2011). J.Biol. Chem. 286, 6386–6392.
Valverde-Tercedor, C., Montalban-Lopez, M., Perez-Gonzalez, T.,Sanchez-Quesada, M. S., Prozorov, T., Pineda-Molina, E.,Fernandez-Vivas, M. A., Rodriguez-Navarro, A. B., Trubitsyn, D.,Bazylinski, D. A. & Jimenez-Lopez, C. (2015). Appl. Microbiol.Biotechnol. 99, 5109–5121.
Wald, T., Osickova, A., Sulc, M., Benada, O., Semeradtova, A.,Rezabkova, L., Veverka, V., Bednarova, L., Maly, J., Macek, P.,Sebo, P., Slaby, I., Vondrasek, J. & Osicka, R. (2013). J. Biol. Chem.288, 22333–22345.
Widdrat, M., Kumari, M., Tompa, E., Posfai, M., Hirt, A. M. & Faivre,D. (2014). ChemPlusChem, 79, 1225–1233.
Wojtas, M., Dobryszycki, P. & Ozyhar, A. (2012). Advanced Topics inBiomineralization, edited by J. Seto, pp. 1–32. Rijeka: Intech.https://doi.org/10.5772/31121.
Yamagishi, A., Narumiya, K., Tanaka, M., Matsunaga, T. & Arakaki,A. (2016). Sci. Rep. 6, 35670.
Zwart, P. H., Afonine, P. V., Grosse-Kunstleve, R. W., Hung, L.-W.,Ioerger, T. R., McCoy, A. J., McKee, E., Moriarty, N. W., Read, R. J.,Sacchettini, J. C., Sauter, N. K., Storoni, L. C., Terwilliger, T. C. &Adams, P. D. (2008). Methods Mol. Biol. 426, 419–435.
research papers
20 Nudelman et al. � MamC-derived magnetite-interacting peptide Acta Cryst. (2018). D74, 10–20