Embed Size (px)
Citation preview

“The important thing is not to stop questioning.
Curiosity has its own reason for existing.”
Albert Einstein
University of Alberta
Development of Empirical Models to Predict Deposition of Aerosols in the
Extrathoracic Airways of Children
by
Laleh Golshahi
A thesis submitted to the Faculty of Graduate Studies and Research
in partial fulfillment of the requirements for the degree of
Doctor of Philosophy
Department of Mechanical Engineering
©Laleh Golshahi
Spring 2012
Edmonton, Alberta
Permission is hereby granted to the University of Alberta Libraries to reproduce single copies of this thesis
and to lend or sell such copies for private, scholarly or scientific research purposes only. Where the thesis is
converted to, or otherwise made available in digital form, the University of Alberta will advise potential users
of the thesis of these terms.
The author reserves all other publication and other rights in association with the copyright in the thesis and,
except as herein before provided, neither the thesis nor any substantial portion thereof may be printed or
otherwise reproduced in any material form whatsoever without the author's prior written permission.

DEDICATION
It is my great pleasure to dedicate this thesis to my better half, Reza, for his
friendship, humor, endless support and encouragement.

ABSTRACT
The experimental studies described in this thesis were performed with the goal of
measuring deposition of aerosols, inhaled either nasally or orally, in the
extrathoracic airways of children in different age groups. We pursued in vitro
methods and characterized the deposition of aerosols in the extrathoracic airway
models of children to address the current concerns in the area of pediatric
dosimetry. Using rapid prototyping, nasal airways of ten adults and fourteen
children 4-14 years old as well as oral airways of nine children 6-14 years old
were replicated from CT scans and MRI images during the course of this research.
In addition to these 33 plastic replicas, ten previously-built nasal airway replicas
of infants were also used to develop three empirical models to predict the
deposition of ultrafine aerosols in nasal airways of infants and the deposition of
micrometer-sized particles in the nasal and oropharyngeal airways of children.
One of the goals of this study was also to develop a simplified idealized child
throat model that could simulate the average oropharyngeal deposition among the
children 6-14 years old. The resulting idealized child model presented here will
hopefully simplify and accelerate the development of new inhalable drugs for the
pediatric population suffering from respiratory diseases.

ACKNOWLEDGEMENTS
I have been waiting for a chance to express my sincere gratitude to my Ph.D.
advisor, Professor Warren Finlay, who has been a great mentor to me and has
literally held my hands when I have been taking my baby steps during the course
of this study. I fell a lot, but picked myself up because I have had the chance to
rely on his unconditional support. It may sound unreal, but I would have done my
Ph.D. with him again if I were given a second chance to do so. He has had a
strong influence on my academic life and writing this thesis to graduate has been
a very hard decision to make since I have never felt that I have learned enough
from his very broad and deep knowledge of aerosol science. Thank you for having
me as your graduate student, Dr. Finlay. I am always grateful and honored for
having the chance to do a Ph.D. with a brilliant researcher like you.
In addition to Dr. Finlay, the rest of my committee members Professors Sunalene
Devadason, Carlos Lange, Michelle Noga, Jason Olfert and Reinhard Vehring
have provided me with their invaluable feedback on this research. Their time and
expertise are very much appreciated.
I would like to thank Professor Michelle Noga once more for providing the CT
images of the nasal airways, coordinating the imaging of oral airways and
providing guidance on ethics approval procedure. I cannot envision having this
thesis completed without her help and support. The incredible staff of the PET/CT
center at the Stollery Children’s hospital, especially Mr. Scott Warren and Greg
Wandzilak have been immensely helpful and have gone beyond their job
descriptions to make a major part of the CT recordings possible. Professor
Richard Thompson is also acknowledged for providing the MRI images of the
nasal airways of adults, recruited by John Storey-Bishoff. Thanks also to
Professor Carlos Flores-Mir and the staff at the Dentistry Department of the
University of Alberta, especially Ms. Susan Helwig, for providing CBCT images
at the preliminary stages of the oral airway studies.

The expertise of the staff of the Institute for Reconstructive sciences in Medicine
(iRSM) in image processing and rapid prototyping has been vital to make this
research possible. Special thanks to Mr. Andrew Grosvenor and Ben King for
printing the airway replicas and answering my questions regarding image
processing and rapid prototyping. Dr. Diana Shaw at iRSM has been more than a
collaborator and her support has made the fabrication of models an enjoyable
experience.
The talents of the professionals in the Department of Mechanical Engineering's
machine shop and electronic engineering facility are highly acknowledged. They
have generously helped me with my endless questions and requests. My special
thanks go to Mr. Bernie Faulkner, Rick Conrad, Andrew Campbell, Dave Waege,
Rick Bubenko, Daniel Mooney and Roger Marchand.
The staff at the main office of the Mechanical Engineering Department have been
wonderful to me and I would like to especially thank Ms. Doris Riedner for
patiently helping me with the imaging reimbursement fees for more than two
years and Ms. Teresa Gray for being helpful with my frequent complicated
expense claims. Also, I would like to thank Ms. Gail Dowler, the Department’s
Secretary of Graduate Studies, for her extensive help and support since the very
beginning of my Ph.D.
Thanks to all the current and former members of ARLA lab during the long years
of my Ph.D. studies. Especially, John Storey-Bishoff for answering my questions
even long after his graduation, Roberto Martinez for answering my coding
questions during my early attempts and Andriy Roshchenko for the interesting
discussions that we have had during my experiments. Thank you to Stacey Yuen
and Gillian Redman for their friendship and boundless energy. Thank you also to
all the recently-joined ARLA members for their friendship, interesting questions,
comments and their patience with the delays in their studies caused by my never-
ending experiments. I also would love to very sincerely thank Ms. Helena

Orszanska. Helena, you made this study feasible in your own way. You made my
days in the lab colorful with your spirit and vast knowledge of books and music.
You made me believe there are lots left to be learned and I will never forget your
subtle way of kindness. I have only got the chance to meet Dr. Kevin Stapleton at
the final stages of my research, but his honest and friendly pieces of advice during
our very short encounter have helped me to dust myself off at a pivotal point close
to the end of this study. I am truly grateful for such honesty and guidance, Kevin.
Thanks to my family for always allowing me to grow and follow my passion with
a peaceful mind. They have a special place in my heart for forming the core of my
life's philosophy and teaching me to strive to be an honest person and a fair player
no matter what life brings on my way. My mother is a heroin and the way she sets
her life standards always inspires me. My father has been the reason that I have
been driven into health-related research and I hope once more in a near future, I
can be held effortlessly in his arms and be told that I have been a good daughter.
My genuine, bottom-hearted appreciation is reserved for my best friend and kind
husband, Dr. Reza Mohammadi. He has patiently waited for me to get to the end
of this journey. I believe it was not an easy road for him either, but he kept having
faith in me and reminded me that this will end too. We did this together and I
cannot see myself being able to do this alone or with anyone else. He stepped into
my chaotic graduate student life in Calgary and since then he has been there for
me despite my long hours either in the labs or lost in thoughts, my continuous
doubts in myself and my sulfur-smelled clothes and hair on our very first date!
His love and support have always been beyond my understanding and I feel
incredibly lucky for getting to know his pure and beautiful soul. His family have
also been incredibly supportive and their cheerful voices on the phone have made
me smile and forget my day-to-day research problems.
Many friends inside and outside of the University of Alberta have made my life
happier during my time at the U of A. Thanks to Oxana Malysheva, Haide Razavy

and her family for their friendship, my lovely friends at PIE readers book club,
my incredible Corinne Lillo at Lillo’s music school and Marjan Akhbari who has
recently been discovered!
Finally, financial support from the Alberta Innovates (AIF), the Natural Sciences
and Engineering Research Council of Canada (NSERC) and the University of
Alberta are gratefully acknowledged. This thesis is materialized as a result of such
generous financial support.
Laleh Golshahi
January 22nd
, 2012
Edmonton, AB, Canada
Table of Contents
CHAPTER 1 : INTRODUCTION .................................................................................................... 1
1.1 Background ............................................................................................................................ 1
1.2 Objectives ............................................................................................................................... 3
1.3 Overall Structure of the Thesis ............................................................................................... 4
1.4 Bibliography ........................................................................................................................... 5
CHAPTER 2 : DEPOSITION OF INHALED ULTRAFINE AEROSOLS IN REPLICAS OF
NASAL AIRWAYS OF INFANTS ............................................................................................... 10
2.1 Introduction .......................................................................................................................... 10
2.2 Experimental Procedure ....................................................................................................... 14
2.3. Results and Discussion ........................................................................................................ 22
2.3.1. Method Validation ........................................................................................................ 22
2.3.2. Comparison of Infant Data with Existing Adult Correlations ...................................... 25
2.3.3. Predictive Correlations for Infants ............................................................................... 31
2.3.4. Use of Infant Correlation for Adults ............................................................................. 39
2.4. Conclusions ......................................................................................................................... 41
2.5 Bibliography ......................................................................................................................... 42
CHAPTER 3 : IN VITRO DEPOSITION MEASUREMENT OF INHALED MICROMETER-
SIZED PARTICLES IN EXTRATHORACIC AIRWAYS OF CHILDREN AND
ADOLESCENTS DURING NOSE BREATHING ........................................................................ 50
3.1 Introduction .......................................................................................................................... 50
3.2 Experimental Methods.......................................................................................................... 53
3.3. Results and Discussion ........................................................................................................ 62
3.3.1. Method Validation ........................................................................................................ 63
3.3.2. Nasal Deposition in Child Replicas .............................................................................. 65
3.3.3. Comparison of Deposition in Normal vs. Congested Nose .......................................... 76
3.3.4. Comparison of Deposition across Different Age Groups ............................................. 79
3.4 Conclusions .......................................................................................................................... 81
3.5 Bibliography ......................................................................................................................... 82
CHAPTER 4 : DEPOSITION OF INHALED MICROMETER-SIZED PARTICLES IN
OROPHARYNGEAL AIRWAY REPLICAS OF CHILDREN AT CONSTANT FLOW RATES
........................................................................................................................................................ 89
4.1 Introduction .......................................................................................................................... 89
4.2 Experimental Methods.......................................................................................................... 92
4.2.1 Imaging of the Airways ................................................................................................. 92
4.2.2. Fabrication of Replicas ................................................................................................. 94
4.2.3. Deposition Measurement Experiments ......................................................................... 97
4.3. Results and Discussion ........................................................................................................ 99
4.4 Conclusions ........................................................................................................................ 106
4.5 Bibliography ....................................................................................................................... 107
CHAPTER 5 : AN IDEALIZED CHILD THROAT THAT MIMICS AVERAGE PEDIATRIC
OROPHARYNGEAL DEPOSITION .......................................................................................... 113
5.1 Introduction ........................................................................................................................ 113
5.2 Methods .............................................................................................................................. 115
5.3 Results and Discussion ....................................................................................................... 117
5.4 Conclusions ........................................................................................................................ 120
5.5 Bibliography ....................................................................................................................... 121
CHAPTER 6 : COMPARISON OF THE LUNG DOSE IN ADULTS AND CHILDREN USING
THE DEVELOPED CORRELATIONS FOR EXTRATHORACIC DEPOSITION ................... 125
6.1 Introduction ........................................................................................................................ 125
6.2 Methods .............................................................................................................................. 126
6.3 Results and Discussion ....................................................................................................... 127
6.4 Conclusions ........................................................................................................................ 132
6.5 Bibliography ....................................................................................................................... 133
CHAPTER 7 : CONCLUSIONS .................................................................................................. 134
7. 1 Summary and Conclusions ................................................................................................ 134
7.2 Future Work ....................................................................................................................... 135
7.3 Bibliography ....................................................................................................................... 136
Appendix A: Experimental Deposition Data ..................................................................................... i
A.1 List of Deposition Data Presented in Chapter 2 ..................................................................... i
A.2 List of Deposition Data Presented in Chapter 3 ................................................................... vi
A.3 List of Deposition Data Presented in Chapter 4 ................................................................. xiii
A.4 List of Deposition Data Presented in Chapter 5 ............................................................... xviii
List of Tables
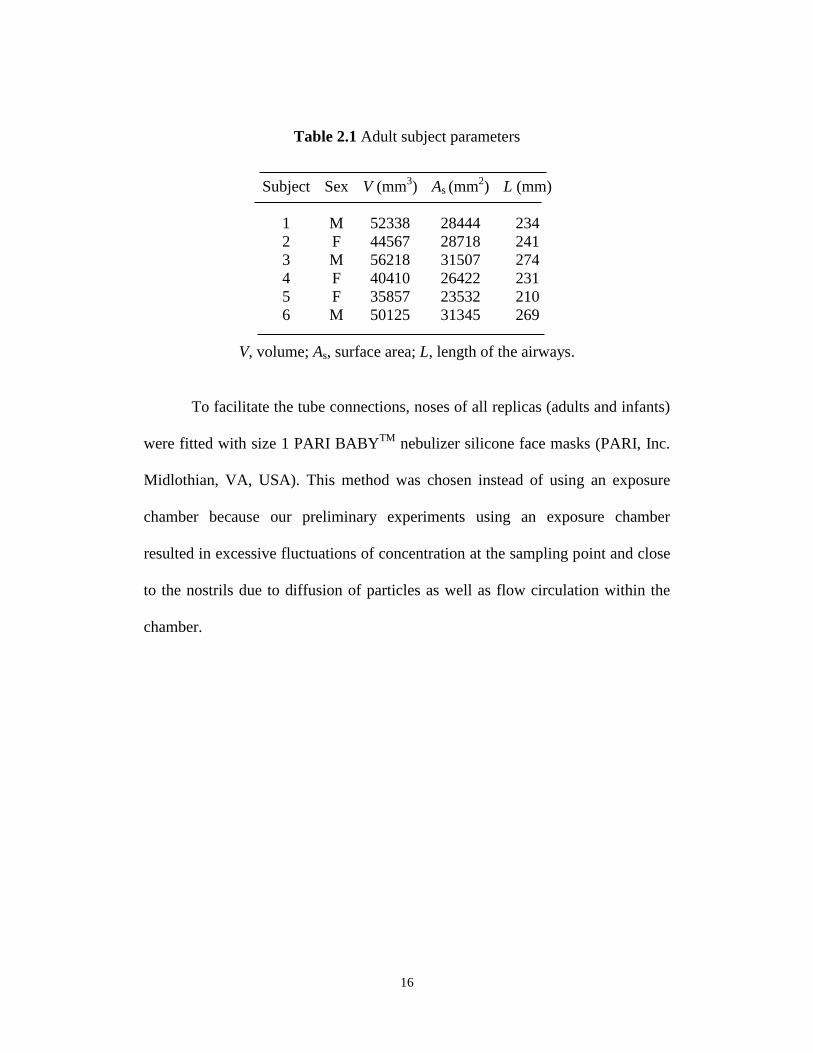
Table 2.1 Adult subject parameters ...................................................................... 16
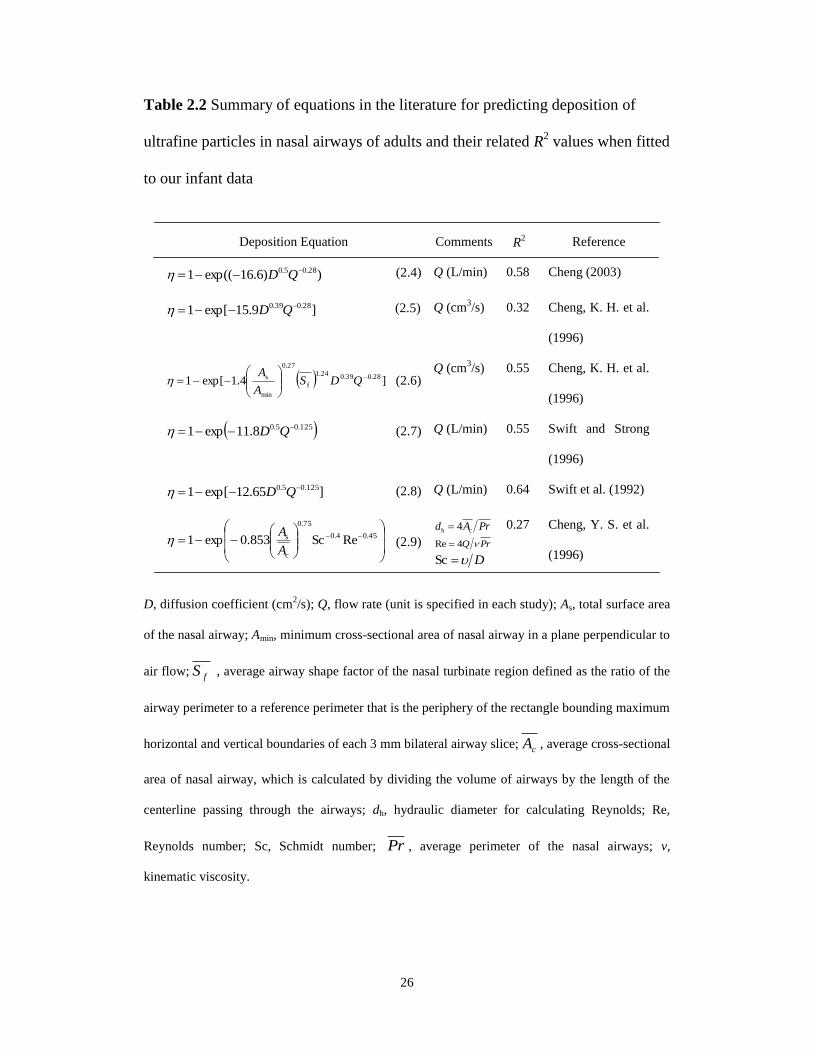
Table 2.2 Summary of equations in the literature for predicting deposition of
ultrafine particles in nasal airways of adults and their related R2 values when fitted
to our infant data ................................................................................................... 26
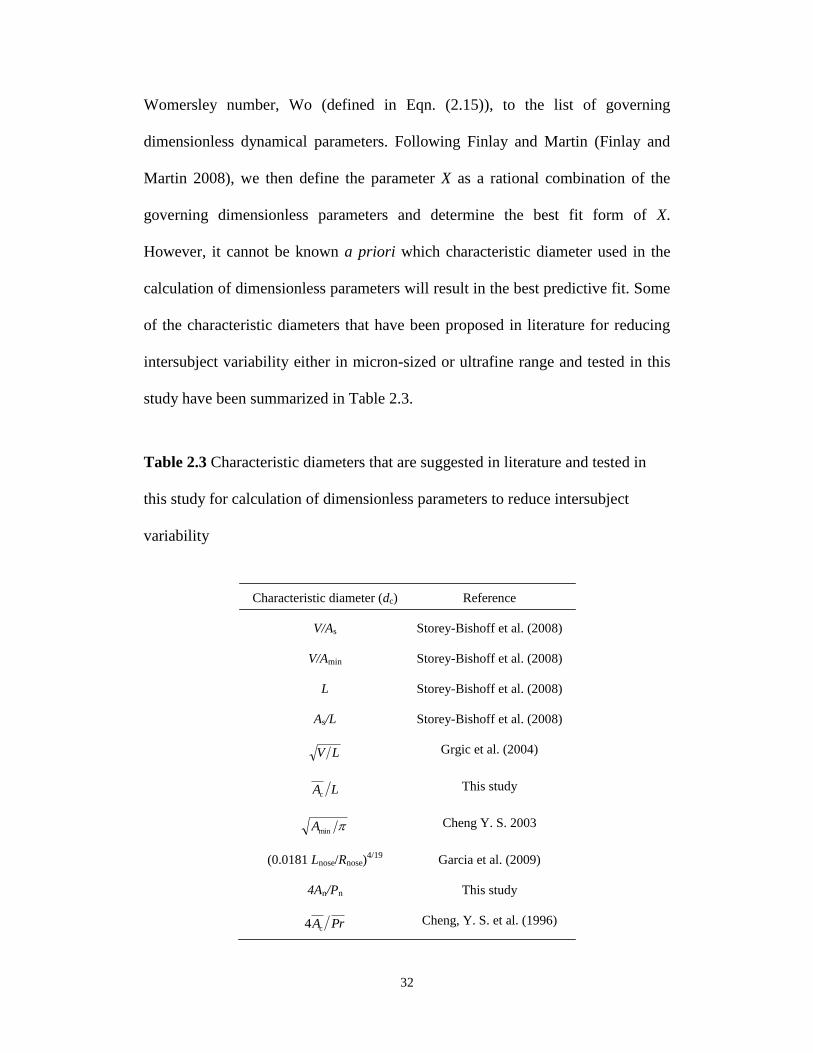
Table 2.3 Characteristic diameters that are suggested in literature and tested in
this study for calculation of dimensionless parameters to reduce intersubject
variability .............................................................................................................. 32
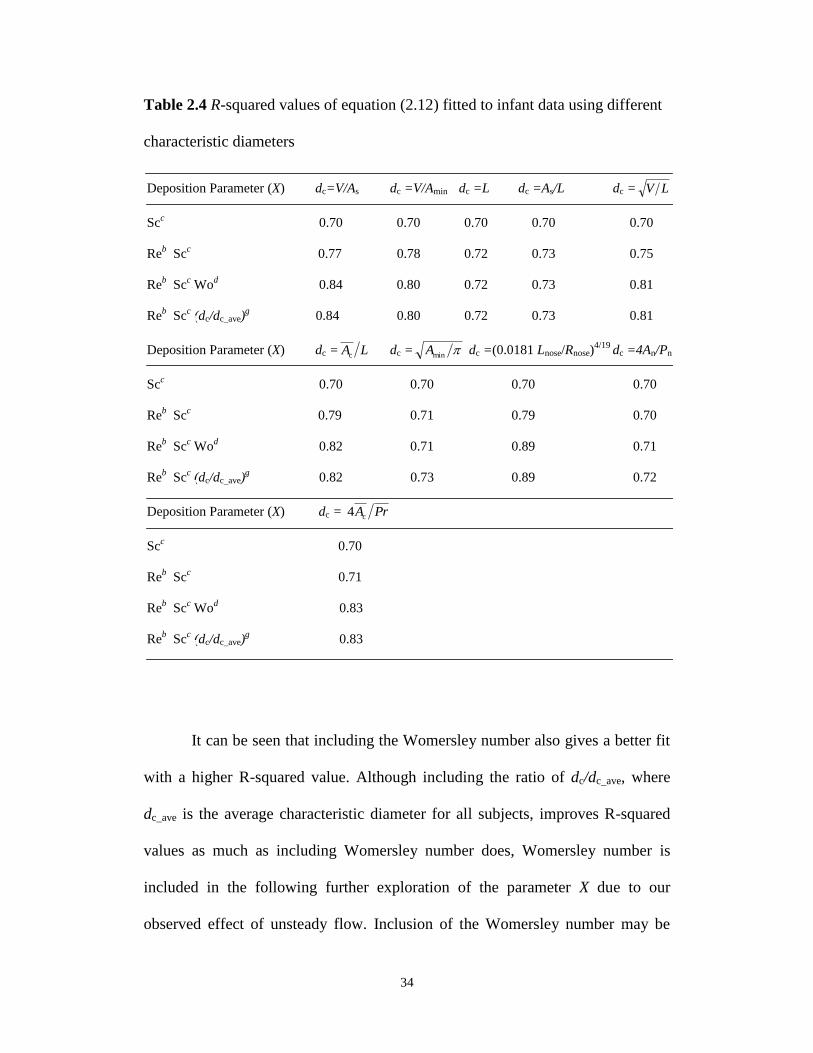
Table 2.4 R-squared values of equation (2.12) fitted to infant data using different
characteristic diameters ......................................................................................... 34
Table 2.5 Values of constants in equations (2.12) and (2.13) for four diameters
with the highest R2 values for infant data ............................................................. 35
Table 2.6 Nasal resistance dependent characteristic diameter of infants .............. 38
Table 2.7 Nasal resistance dependent characteristic diameter of adults ............... 40
Table 3.1 Geometrical parameters including volume (V), surface area (As) and
path length (L) of the five nasal replicas of adults used for comparison with in
vivo data given in the literature ............................................................................. 54
Table 3.2 Child subject parameters. V is the volume of airway, As is the surface
area of the airway lumen, Lnose is the length of nasal cavity to the end of septum,
Lt is the length of the remaining part of the nasal airway (oropharynx) to the level
of upper trachea, Amin is the minimum cross section of the airway measured for
each cross section at 3 mm intervals perpendicular to the possible streamline of
air going through the nasal airway, Pnostril is the perimeter of nostrils, Nl is the
length of nostril (larger dimension of an ellipse) and Nw is the width (smaller
dimension) of nostrils. .......................................................................................... 56
Table 3.3 Characteristic diameters and their corresponding references in the
literature in case they have previously been used. Anostril is the cross sectional area
of the nostrils, which is defined as the length of the nostril times its width, herein.
meanE is the average ellipticity of the two nostrils for each subject, whereby
ellipticity is defined as the ratio of each nostril’s height to its width. Rnose is the
resistance of the nose, which is defined in Eq. 3.12. ............................................ 70
Table 3.4 R-squared values for different combinations of characteristic diameters
used in defining combination of the nondimensional numbers in the deposition
parameter, X (given in Eq. 3.9). The exponent values a, b (from Eq. 3.9), c, d, e
(given below) are different in each case and chosen to minimize R2 via least
squares................................................................................................................... 71
Table 4.1 Relevant information of the subjects including their sex, age (in years),
height (in cm) and weight (in kg) ......................................................................... 94
Table 4.2 Geometrical parameters of the replicas post-build: volume (mm3),
surface area (mm2) and length (mm) .................................................................... 96
Table 6.1 List of the developed extrathoracic deposition equations and their
related parameters and references. Parameters V, L and As are the volume,
centerline length and surface area of the airways, respectively. ......................... 127
List of Figures
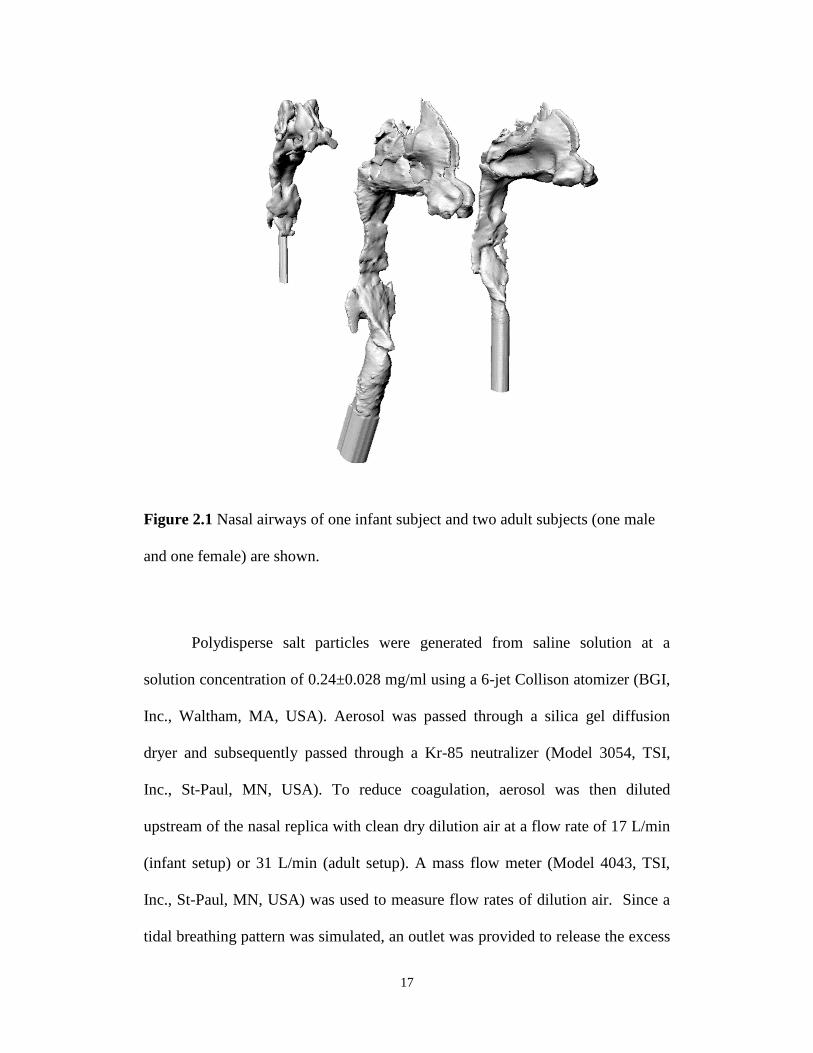
Figure 2.1 Nasal airways of one infant subject and two adult subjects (one male
and one female) are shown. .................................................................................. 17
Figure 2.2 Schematic diagram of the experimental setup. ................................... 18
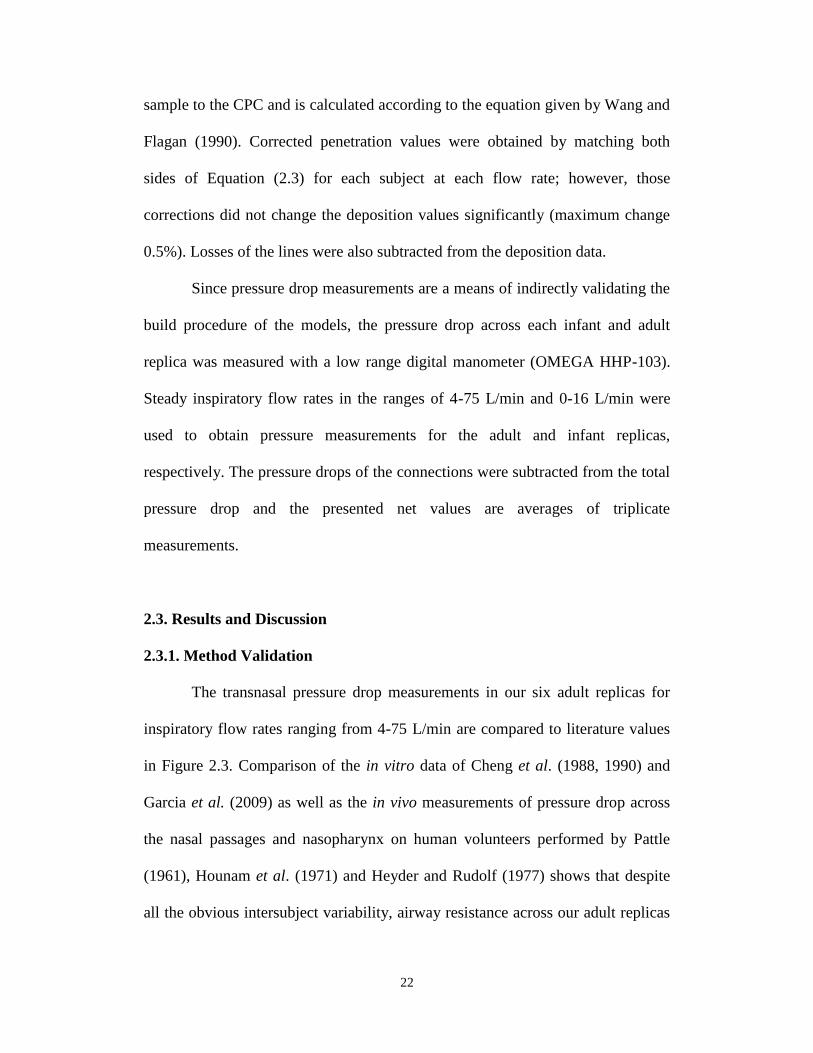
Figure 2.3 Pressure drop data points across six adult human nasal replicas as a
function of inspiratory air flow rate compared with available in vivo and in vitro
measurements in the literature. ............................................................................. 23
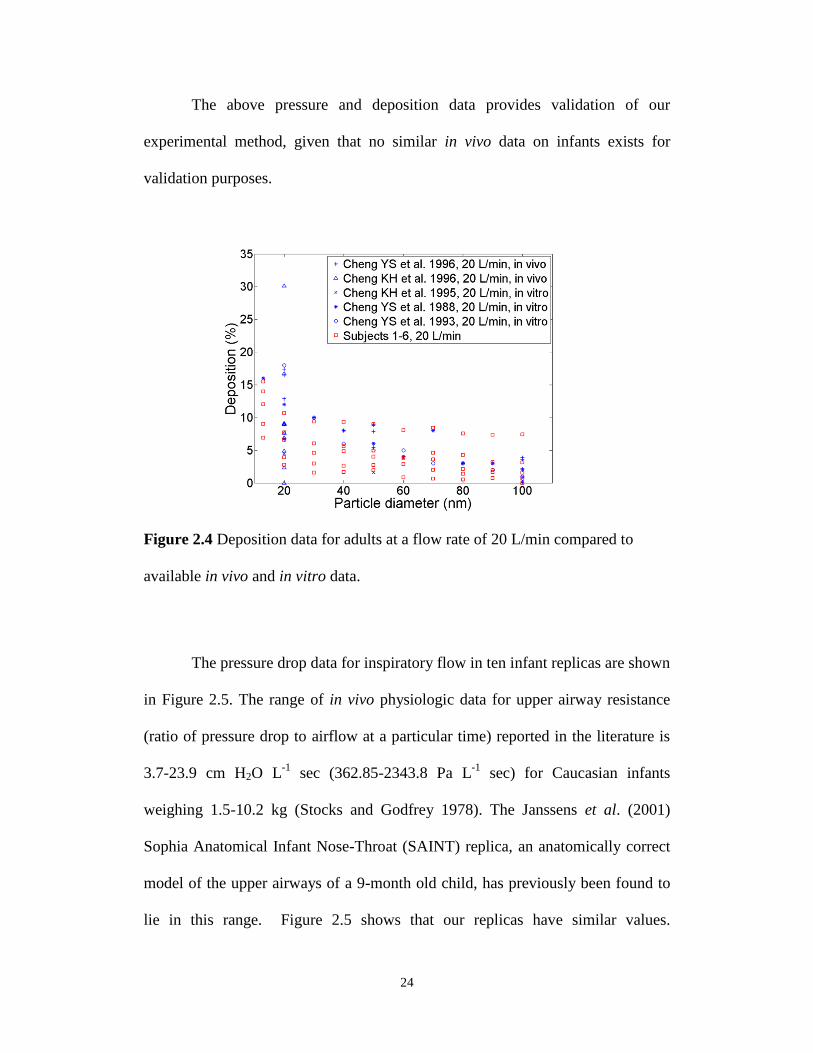
Figure 2.4 Deposition data for adults at a flow rate of 20 L/min compared to
available in vivo and in vitro data. ........................................................................ 24
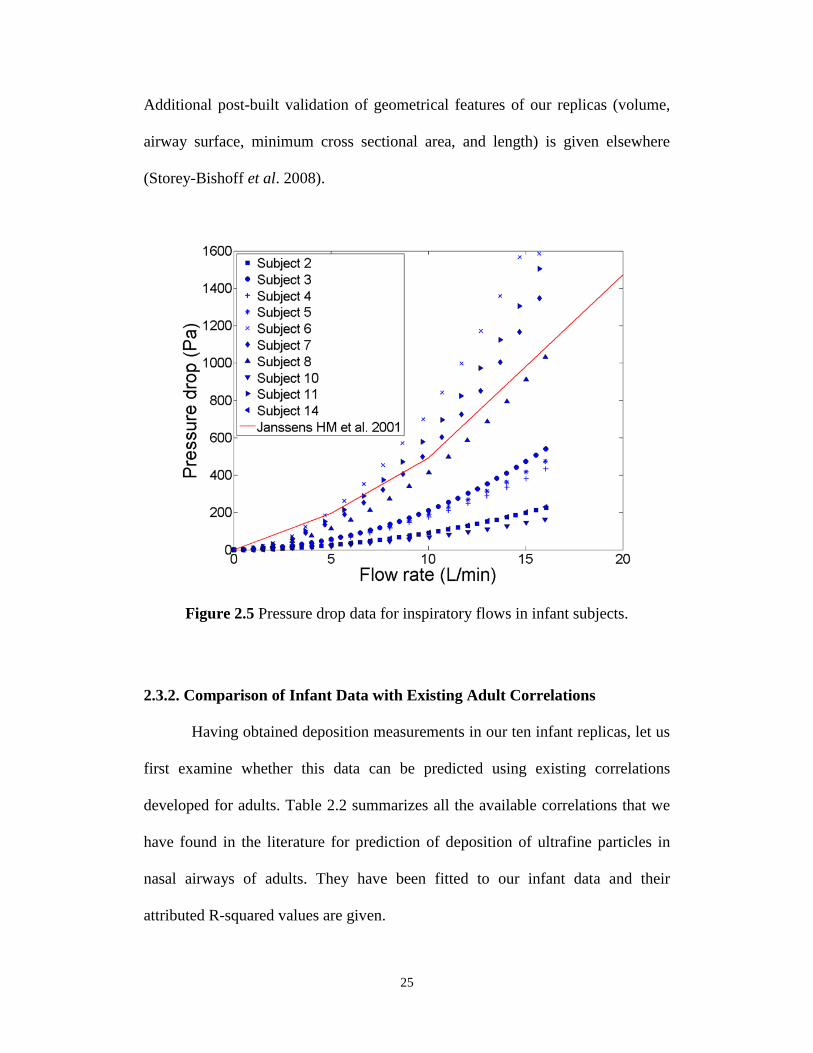
Figure 2.5 Pressure drop data for inspiratory flows in infant subjects. ................ 25
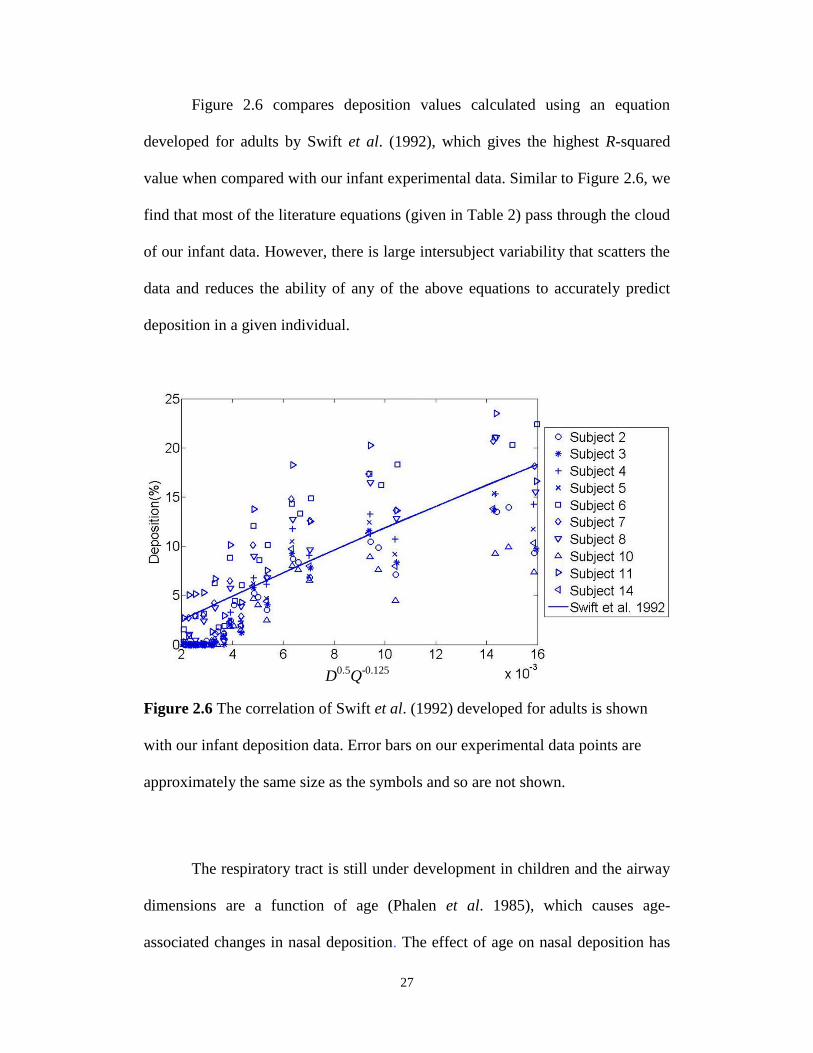
Figure 2.6 The correlation of Swift et al. (1992) developed for adults is shown
with our infant deposition data. Error bars on our experimental data points are
approximately the same size as the symbols and so are not shown. ..................... 27
Figure 2.7 The correlation of Cheng et al. (1995) developed for older children
(1.5-, 2.5- and 4-year-olds) is shown with infant deposition data in this study. ... 28
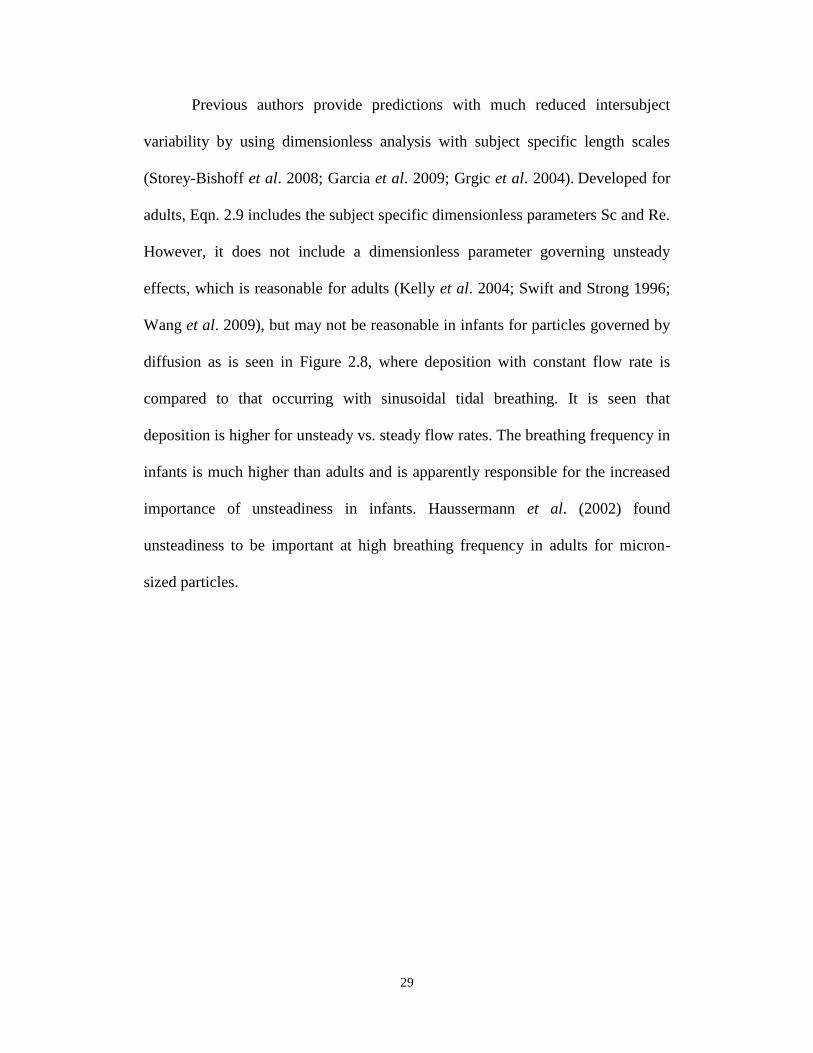
Figure 2.8 Comparison of deposition in infant replicas vs. particle diameter (dp)
using tidal breathing (solid markers) and constant flow rate (empty markers). ... 30
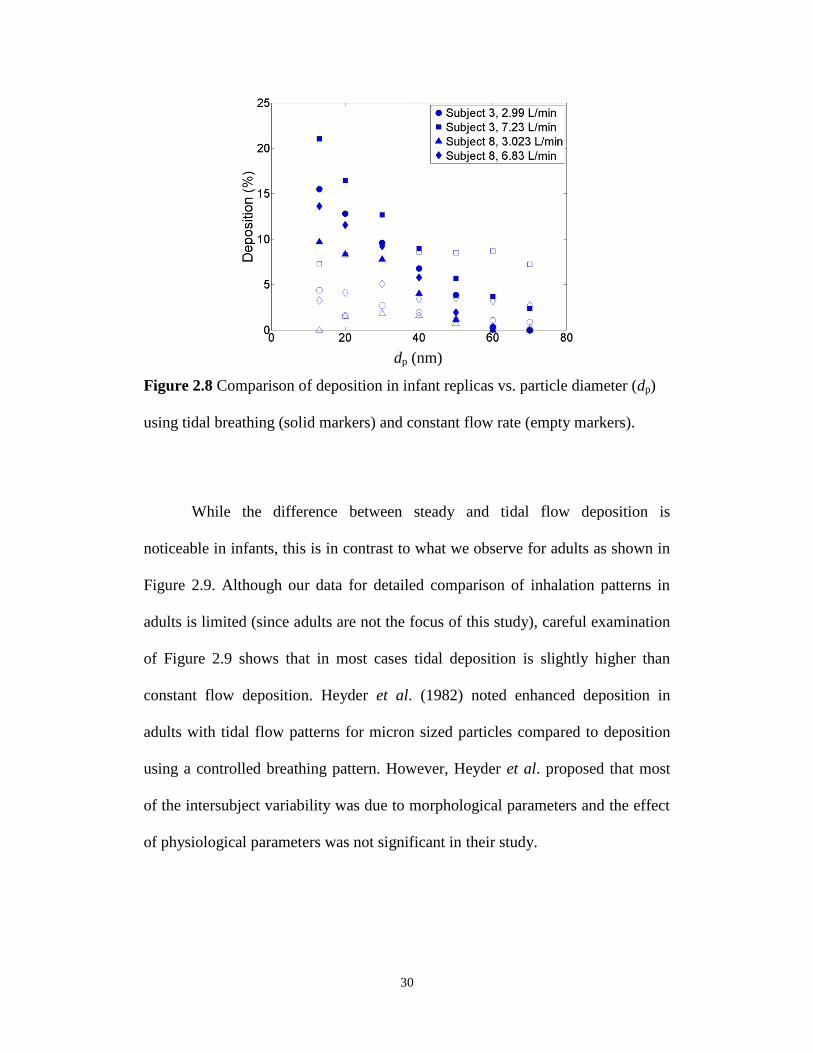
Figure 2.9 Comparison of deposition in adult replicas vs. particle diameter (dp)
using tidal breathing (solid markers) and constant flow rate (empty markers). ... 31
Figure 2.10 Deposition in infant replicas vs. non-dimensional deposition
parameter using characteristic diameter defined as dc = (0.0181 Lnose/Rnose) 4/19
. . 36
Figure 2.11 Deposition in infant replicas vs. non-dimensional deposition
parameter using characteristic diameter dc = LAc . ............................................. 39
Figure 3.1 Fourteen nasal airways of children 4-14 years old. The subjects are
arranged based on their numerical label from left to right on each row (subject 1 is
the top left airway). ............................................................................................... 55
Figure 3.2 Schematic diagram of the experimental setup for measuring deposition
of particles in nasal airways of adults and children. ............................................. 58
Figure 3.3 Deposition in our five adult replicas (subjects 2, 5, 6, 8, and 9)
compared to in vivo data in the literature. ............................................................. 64
Figure 3.4 Comparison of deposition data from in vivo studies (Becquemin et al.
(1991), 20 subjects 5.5-15 years old, and Bennett et al. (2008), 12 subjects 6-10
years old) with our deposition values in 13 replicas of children 4-14 years old vs.
the impaction parameter (da2Q). ............................................................................ 66
Figure 3.5 Deposition in children’s replicas vs. the deposition parameter including
intranasal pressure drop (da2p). ........................................................................... 67
Figure 3.6 Deposition of micrometer-sized particles in children replicas vs. non-
dimensional deposition parameter X from Eq. 3.9 including a characteristic
diameter defined as (a) dc=As/L (b) dc= LV. .................................................... 75
Figure 3.7 Comparison of deposition in one six year old subject with a congested
nose with our thirteen healthy subjects. ................................................................ 78
Figure 3.8 Deposition versus impaction parameter da2Q across different ages
(infants, children, adults). ..................................................................................... 80
Figure 4.1 The dimensions of the mouthpiece (LC star nebulizer’s mouthpiece),
through which the children inhaled at the time of CT imaging. ........................... 93
Figure 4.2 Nine oral airway replicas of children 6-14 years old. The replicas are
arranged in an ascending order based on their numerical label from left to right on
each row. ............................................................................................................... 95
Figure 4.3 Schematic diagram of the experimental setup we used for measuring
deposition of particles in oropharyngeal airway replicas of children and the
‘Alberta Idealized Throat’. .................................................................................... 98
Figure 4.4 Deposition in children’s replicas vs. the impaction parameter (da2Q) for
flow rates of 30-150 L/min and particles in the aerodynamic size range of 0.5- 5.3
m. ...................................................................................................................... 100
Figure 4.5 Comparison of the deposition in our children replicas with the
estimated values using a correlation developed for adults by Grgic et al. (2004)
(Eq. 4.1) when the x-axis contains the children’s geometrical dimensions. ....... 102
Figure 4.6 Deposition of micrometer-sized particles in oropharyngeal replicas of
children vs. non-dimensional deposition parameter (X) as a combination of
Stokes and Reynolds numbers that include a characteristic diameter defined as dc=
LV . ................................................................................................................. 103
Figure 4.7 The deposition of micrometer-sized particles in oropharyngeal replicas
of children vs. non-dimensional deposition parameter, X, as a combination of
Stokes and Reynolds numbers. These numbers include a characteristic diameter
defined as dc= V/As. ............................................................................................. 105
Figure 5.1 Schematic of the Idealized Child Throat. The lengths of the sections a,
b and c (62.7, 40.6 and 38.7 mm, respectively) are the summations of polylines
shown in each section. ........................................................................................ 116
Figure 5.2 The deposition of orally inhaled micrometer-sized particles in the
Idealized Child Throat versus the impaction parameter compared to that of nine
children replicas in our previous study (Golshahi et al. 2011b). ........................ 118
Figure 5.3 Deposition in the Idealized Child Throat and children’s anatomically
accurate replicas (Golshahi et al. 2011b) versus the deposition parameter
X=Stk1.5
Re0.69
where Stk and Re are Stokes and Reynolds numbers that use a
subject specific length scale V/As. ....................................................................... 120
Figure 6.1 Lung doses for different age groups, normalized to the body mass and
the adult inhaled dose, versus particle’s aerodynamic diameter. ........................ 129
Figure 6.2 Lung doses for different age subjects, normalized to the adult inhaled
dose and the subjects’ body surface area, versus aerodynamic diameter of
particles. .............................................................................................................. 130
Figure 6.3 Lung doses for different age group subjects, normalized to the adult
inhaled dose and the body surface area of different age groups, versus the inertial
impaction parameter da2Q. .................................................................................. 132
1
CHAPTER 1 : INTRODUCTION
1.1 Background
Deposition in the extrathoracic region of the respiratory system plays an
important role in determining the dose delivered to the lungs since this region
filters the inhaled aerosols on their way to the lungs. Extrathoracic airways are
generally defined as oral/buccal cavity, nasal passages, pharynx, larynx and the
proximal region of the trachea (Stahlhofen et al. 1980, 1983). Thus, there have
been extensive studies with the focus on characterizing deposition in both nasal
and oral airways of adults in order to understand the deposition mechanisms in the
extrathoracic airways and, thus, determining the dose delivered to the lungs.
Deposition in oral airways is lower than nasal airways; therefore,
oropharyngeal airways are considered as the preferred route of inhalation drug
delivery, which is a favorite method of drug delivery due to its noninvasive
nature. This path of inhalation has been extensively studied for drug delivery by
our group (DeHaan and Finlay, 2001, 2004; Grgic et al. 2004 a, b, 2006) and
others (Cheng et al. 1999, 2001; Swift, 1992; Zhou et al. 2011). Moreover,
attempts have been made to simplify such complicated geometries in the form of
idealized models to facilitate development of new drug formulations. The United
States Pharmacopia (USP) throat is an example of such developments. This throat
has been used with the hope of simulating the average oropharyngeal deposition
among adults. The failure of this model (USP throat) in the deposition
estimations, however, has been hypothesized to be due to its significant difference
from the actual anatomical geometries because of its excessive simplifications
2
(Srichana et al. 2000; Zhang et al. 2007; Zhou et al. 2011). Thus, the ‘Alberta
Idealized Throat’ has been developed in our group based on the actual airway
geometry of adults and has successfully been commercialized to simulate the
average oropharyngeal deposition among adults (Grgic et al. 2004 a, b; Stapleton
et al., 2000; Zhang et al. 2007; Zhou et al. 2011).
Despite the progress that has been made in the prediction of extrathoracic
deposition among adults, little data exists on oral airway deposition in children. In
vivo studies are not easily feasible due to the ethical concerns regarding exposure
of human subjects, especially children, to radiation. Thus, there are only limited
numbers of in vivo studies with a focus on measuring total deposition of aerosols
in the children’s respiratory tract (Becquemin et al. 1991; Bennett and Zeman,
1998, 2004; Schiller-Scotland et al. 1992) and a few more on oropharyngeal and
lung deposition of aerosols emitted from specific inhalers (Agertoft et al. 2003;
Devadason et al. 1997, 2003; Geller et al. 1998; Roller et al. 2007; Schueepp et
al. 2009).
In vitro studies, on the other hand, have proven to be successful in
improving our understanding of respiratory deposition among adults over the
years. However, long imaging time, a major issue considering the short attention
span common among children, and tedious resin cast production have hindered
the necessary progress in the area of pediatric respiratory deposition. Recent
advances in high resolution imaging and 3D printing have facilitated studies in the
field of in vitro pulmonary deposition. Thus, only recently attempts have been
made to address the shortcomings of in vivo measurements by taking an in vitro
3
approach (Janssens et al. 2001; Minocchieri et al. 2008; Corcoran et al. 2003;
Laube et al. 2010). Most of these studies however, have been focused on a limited
number of nose-breathing subjects (mostly just one subject) or just with specific
inhalers (Wachtel et al. 2010). A comprehensive study has been done in our group
with the focus on minimizing the intersubject variability apparent in deposition of
micrometer-sized particles in the nasal airways of infants 3-18 months (Storey-
Bishoff et al. 2008). This thesis was planned to complete such measurements by
expanding the age range of the pediatric subjects, inhalation route (i.e. nasal and
oral) and the particle sizes.
1.2 Objectives
The main goal of this study is to characterize the deposition of aerosols of
various sizes in the extrathoracic airways of children of different ages during
various breathing patterns through the nose or mouth. In order to achieve this
goal, the development of nasal and oral airway replicas of children was one of the
prerequisites. Further measurements of aerosol deposition in the developed
replicas and correlating the deposition data to the related non-dimensional
numbers, which include the geometrical dimensions of the extrathoracic airways
of each subject, were targeted to reduce intersubject variability and to enhance
individualized prediction of extrathoracic deposition. Eventually, the development
of a simple geometry that could simulate the average deposition of aerosols in the
children’s oral airways (as the preferred route of drug delivery), was deemed to be
4
within the scope of this research. Such a simple geometry may have a major
impact on simplifying bench-top testing of new inhalation drug formulations.
1.3 Overall Structure of the Thesis
This thesis is presented in mixed-format, which includes published and as-
yet under review research. The current chapter, Chapter 1, is a brief introductory
chapter to the entire thesis and is written to describe the motivation behind this
research and to explain the connections among the next chapters. Development of
a method to measure the deposition of ultrafine aerosols (13-100 nm) in nasal
airway replicas of ten infants is described in Chapter 2. This study is useful in
exposure studies since ultrafine particles are ubiquitous in the environment and
infants, as explicitly nose-breathers, are a high risk population. To extend our
understanding of nasal deposition, the fabrication of fourteen nasal airway
replicas of children 4-14 years old and the measurements of deposition of
micrometer-sized particles in these replicas were undertaken, the procedure and
results of which is presented in Chapter 3. This chapter will be useful for
exposure studies and for potential inhalation drug delivery methods involving face
masks. Since the preferred route of drug delivery to the lungs is the oral airways,
the development of nine oral airway replicas and deposition measurements of
micrometer-sized particles in these replicas are explained in Chapter 4. The
results of Chapter 4 were used to develop an Idealized Child Throat model based
on the previously made ‘Alberta Idealized Throat’ for the simulation of average
extrathoracic deposition in adults. Chapter 5 introduces such an idealized child
5
throat model. Chapter 6 examines the usage of the developed correlations in
Chapters 3 and 4. In this Chapter, the delivered dose to the lungs of children is
also compared with those of adults and infants based on the previously-developed
correlations (Grgic et al. 2004a; Storey-Bishoff et al. 2008) for the two latter age
groups. Finally, summary of the whole thesis is given in Chapter 7 as the
conclusions and suggested future works.
1.4 Bibliography
Agertoft, L., Laulund, L. W., Harrison, L. I., Pedersen, S. (2003). Influence of
particle size on lung deposition and pharmacokinetics of beclomethasone
dipropionate in children. Pediatric Pulmonology, 35, 192-199.
Becquemin, M. H., Yu, C. P., Roy, M., and Bouchikhi, A. (1991). Total
deposition of inhaled particles related to age: comparison with age dependent
model calculations. Radiation Protection Dosimetry, 38, 23-28.
Bennett, W. D., and Zeman, K. L. (1998). Deposition of fine particles in children
spontaneously breathing at rest. Inhalation Toxicology, 10, 831-842.
Bennett, W. D., and Zeman, K. L. (2004). Effect of body size on breathing pattern
and fine-particle deposition in children. Journal of Applied Physiology, 97, 821-
826.
Cheng, Y. S., Zhou, Y., and Chen, T. B. (1999). Particle deposition in a cast of
human oral airways. Aerosol Science and Technology, 31, 286-300.
6
Cheng, Y. S., Yazzie, D., and Zhou, Y. (2001). Respiratory deposition patterns of
salbutamol pMDI with CFC and HFA-134a formulations in a human airway
replica. Journal of Aerosol Medicine, 14(2), 255-266.
Corcoran, T.E., Shortall, B.P., Kim, I.K., Meza, M.P., Chigier, N. (2003). Aerosol
drug delivery using heliox and nebulizer reservoirs: Results from an MRI-based
pediatric model. Journal of Aerosol Medicine, 16, 365-271.
DeHaan, W. H., and Finlay, W. H. (2001). In vitro monodisperse aerosol
deposition in a mouth and throat with six different inhalation devices. Journal of
Aerosol Medicine, 14(3), 361-367.
DeHaan, W. H., and Finlay, W. H. (2004). Predicting extrathoracic deposition
from dry powder inhalers. Journal of Aerosol Science, 35(3), 309-331.
Devadason, S. G., Everard, M. L., MacEarlan, C., Roller, C., Summers, Q. A.,
Swift, P., Borgstrom, L., and Le Souef, P. N. (1997). Lung deposition from the
Turbuhaler in children with cystic fibrosis. The European Respiratory Journal,
10, 2023-2028.
Devadason, S. G., Huang, T., Walker, S., Troedson, R., and Le Souef, P. N.
(2003). Distribution of technetium-99m-labelled QVARTM
delivered using an
AutohalerTM
device in children. The European Respiratory Journal, 21, 1007-
1011.
Geller, D. E., Eigen, H., Fiel, S. B., Clark, A., Lamarre, A. P., Johnson, C. A.,
Konstan, M. W. (1998). Effect of smaller droplet size of dornase alfa on lung
function in mild cystic fibrosis. Pediatric Pulmonology, 25, 83-87.
7
Grgic, B., Finlay W. H., Burnell, P. K. P., Heenan, A. F. (2004a). In vitro
intersubject and intrasubject deposition measurements in realistic mouth-throat
geometries. Journal of Aerosol Science, 35, 1025-1040.
Grgic, B., Finlay W. H., Heenan, A. F. (2004b). Regional aerosol deposition and
flow measurements in an idealized mouth and throat. Journal of Aerosol Science,
35, 21-32.
Grgic, B., Martin, A. R., and Finlay W. H. (2006). The effect of unsteady flow
rate increase on in vitro mouth-throat deposition of inhaled boluses. Journal of
Aerosol Science, 37, 1222-1233.
Janssens, H.M., De Jongste, J.C., Fokkens, W.J., Robben, S.G.F., Wouters, K.,
Tiddens, H.A.W.M. (2001). The Sophia anatomical infant nose-throat (saint)
model: A valuable tool to study aerosol deposition in infants. Journal of Aerosol
Medicine, 14, 433-441.
Laube, B.L., Sharpless, G., Shermer, C., Nasir, O., Sullivan, V., Powell, K.
(2010). Deposition of albuterol aerosol generated by pneumatic nebulizer in the
Sophia Anatomical Infant Nose-Throat (SAINT) model. Pharmaceutical
Research, 27, 1722-1729.
Minocchieri, S., Burren, J.M., Bachmann, M.A., Stern, G., Wildhaber, J., Buob,
S., Schindel, R., Kraemer, R., Frey, U.P., Nelle, M. (2008). Development of the
premature infant nose throat-model (PrINT-Model)-an upper airway replica of a
premature neonate for the study of aerosol delivery. Pediatric Research, 64,141-
146.
8
Roller, C. M., Zhang, G., Troedson, R. G., Leach, C. L., Le Souef, P. N., and
Devadason, S. G. (2007). Spacer inhalation technique and deposition of extrafine
aerosol in asthmatic children. The European Respiratory Journal, 29, 299-306.
Schiller-Scotland, C. H. F., Hlawa, R., Gebhart, J., Wonne, R., and Heyder, J.
(1992) Total deposition of aerosol particles in the respiratory tract of children
during spontaneous and controlled mouth breathing. Journal of Aerosol Science,
23(Suppl. 1), S457-S460.
Schueepp, K. G., Devadason, S. G., Roller, C., Minocchieri, S., Moeller, A.,
Hamacher, J., and Wildhaber, J. H. (2009) Aerosol delivery of nebulised
budesonide in young children with asthma. Respiratory Medicine, 103, 1738-
1745.
Srichana, T., Martin, G., and Marriott, C. (2000). A human oral-throat cast
integrated with a twin-stage impinger for evaluation of dry powder inhalers.
Journal of Pharmacy and Pharmacology, 52, 771-778.
Stahlhofen, W., Gebhart, J., and Heyder, J. (1980). Experimental determination of
the regional deposition of aerosol particles in the human respiratory tract.
American Industrial Hygiene Association Journal, 41(6), 385-398a.
Stahlhofen, W., Gebhart, J., Heyder, J., Scheuch, G. (1983). New regional
deposition data of the human respiratory tract. Journal of Aerosol Science, 14(3),
186-188.
Stapleton, K. W., Guentsch, E., Hoskinson, M. K., and Finlay, W. H. (2000). On
the suitability of k-turbulence modeling for aerosol deposition in the mouth and
throat: a comparison with experiment. Journal of Aerosol Science, 31,739-749.
9
Storey-Bishoff, J., Noga, M. and Finlay, W. H. (2008). Deposition of micrometer-
sized aerosol particles in infant nasal airway replicas. Journal of Aerosol Science,
39, 1055-1065.
Swift, D. L. (1992). Apparatus and method for measuring regional distribution of
therapeutic aerosols and comparing delivery systems. Journal of Aerosol Science,
23(Suppl. 1), S495-S498.
Wachtel, H., Bickmann, D., Breitkreutz, J., Langguth, P. (2010). Can Pediatric
Throat Models and Air Flow Profiles Improve Our Dose Finding Strategy. In
Respiratory Drug Delivery 2010, pp. 195-204, ed. Dalby, R.N., Byron, P. R.,
Peart, J., Suman, J. D., Farr, S. J., Young, P.M., Davis Healthcare, Rivergrove,
Illinois.
Zhang, Y., Gilbertson, K., and Finlay, W. H. (2007). In vivo-in vitro comparison
of deposition in three mouth-throat models with Qvar and Turbuhaler inhalers.
Journal of Aerosol Medicine, 20: 227-35.
Zhou, Y., Sun, J., and Cheng Y. S. (2011). Comparison of deposition in the USP
and physical mouth-throat models with solid and liquid particles. Journal of
Aerosol Medicine and Pulmonary Drug Delivery, 24, 1-8.
10
CHAPTER 2 : DEPOSITION OF INHALED ULTRAFINE
AEROSOLS IN REPLICAS OF NASAL AIRWAYS OF
INFANTS1
A very similar version of this chapter has been published as:
Golshahi, L., Finlay, W. H., Olfert, J. S., Thompson, R. B., and Noga, M. L.
(2010). Deposition of Inhaled Ultrafine Aerosols in Replicas of Nasal Airways of
Infants. Aerosol Science and Technology, 44,741-752.
2.1 Introduction
Ultrafine particles (UFP, with a diameter of less than 100 nm) are
ubiquitous in ambient and indoor air from several natural and anthropogenic
sources. Epidemiological studies have raised concerns over adverse health effects
associated with exposure to ultrafine particles (Kreyling et al. 2006). The
cardiovascular and pulmonary systems have been diagnosed as the main targets of
this unwanted exposure. However, recent studies have shown stronger affiliations
between inhaled particles and respiratory failure compared to cardiovascular
outcomes (Halonen et al. 2009). Exposure to radon and its progeny, which
attaches to dusts and airborne particles, is associated with an increased risk of
lung cancer (NRC 1988). Viral lower respiratory tract infections in infants and
young children are also a major public health issue (Van Woensel et al. 2003). On
the other hand, effects of UFPs on organs other than the lungs, especially, the
brain and central nervous system (CNS) have received special attention recently.
1 Reproduced with permission from Taylor & Francis, Copyright 2010.
11
Researchers have found that the CNS can be a target of ultrafine aerosols and the
most probable mechanism behind this process is from deposits on the olfactory
mucosa in the nasopharyngeal region of the respiratory tract and subsequent
translocation via the olfactory nerve (Oberdorster et al. 2004).
Nanomedicine, including the use of nanoparticles, has potential for the
therapeutic treatment of diseases via manipulation of particle characteristics such
as size, surface chemistry, surface charge, and surface area (Gill et al. 2007).
Conceptually, drug delivery directly to the site of infection reduces the systemic
side effects of therapeutic agents, which in turn makes pulmonary targeted drug
delivery of ultrafines a plausible research area. Moreover, deposition of inhaled
pharmaceutical aerosols in the olfactory region may be an efficient method for
treatment of central nervous system disorders. However, the dosimetry, which
involves regional deposition patterns in the respiratory tract and the biokinetic
fate of inhaled ultrafine particles, is not yet fully understood (Kreyling et al.
2006).
Human extrathoracic airways filter inhaled pharmaceutical particles and
hinder their penetration to targeted regions in the lung. Therefore, knowledge of
the filtration efficiency of the upper airways (naso/oropharyngeal regions) and the
influence of intersubject differences on this mechanism is essential for evaluating
delivered dose to the lungs, as well as assessing the risks of exposure to toxic
ultrafine particles in different environments. In an attempt to understand how
physical properties of particles and respiratory parameters influence the
deposition of aerosols in extrathoracic airways of adults, many experimental
12
measurements (in vivo and in vitro), numerical analyses and computational fluid
dynamics (CFD) studies have been performed. For example, in vivo adult studies
have been performed by Cheng, Y. S. et al., Cheng, K. H. et al., and Swift and
Strong (1996). These in vivo studies have demonstrated that considerable
intersubject variability is present in the diffusion deposition regime (Cheng 2003).
Although in vivo studies on human subjects are desirable, the invasive and
hazardous nature of the employed aerosols limits the extent of such studies.
Experimental measurements of deposition of ultrafine particles in physical casts
of extrathoracic airways (in vitro) have been used as a substitute for in vivo
studies (Cheng et al. 1988, 1990, 1993; Swift et al. 1992; Yamada et al. 1988;
Gradon and Yu 1989; Guilmette et al. 1994; Kelly et al. 2004). Computational
fluid dynamic (CFD) simulations have been useful for improving our
understanding of deposition mechanisms correlated to flow patterns in nasal
airways (Yu et al. 1998; Zamankhan et al. 2006; Shi et al. 2006; Wang et al.
2009; Xi and Longest 2008).
In spite of all the above noted progress on aerosol deposition in adults, our
knowledge of aerosol behavior in children and specifically in infants is limited.
Practical difficulties with using in vivo imaging in infants and children could be
one of the reasons for this limitation. The youngest subject for which in vitro
deposition of ultrafine particles in extrathoracic airways has been measured is
reported in the study of Cheng et al. (1995). They measured the deposition of
ultrafine particles and radon progeny within three nasal airways replicas of 1.5-,
2.5- and 4-year-old children using monodispersed NaCl and Ag aerosols ranging
13
from 0.0046 m to 0.2 m in diameter at inspiratory and expiratory flow rates of
3 L/min, 7 L/min and 16 L/min. In that study, the deposition efficiency was found
to decrease with increasing age for a given particle size between 0.001 to 0.2 m.
To our knowledge, however, no studies have measured the deposition of ultrafine
particles in the extrathoracic airways of children younger than 1.5 years (i.e.,
infants).
For micron-sized particles, comparison of the deposition data of Swift
(1991), Minocchieri et al. (2008) and the SAINT replica (Schuepp et al. 2005)
raised the following question: assuming there are large intersubject variations in
extrathoracic airways of infants, as there are in adults, how much of the variability
in deposition is due to differences in airway morphology or breathing pattern at a
given age and how much is due to age alone? (Finlay 2008) While Storey-Bishoff
et al. (2008) address this question for micron-sized particles, ultrafine aerosol
deposition in infants has not been explored in this regard.
It has been suggested that infants breathe exclusively through their nose
from birth to between 6 weeks and 6 months of age (Polgar and Kong 1965).
Moreover, face masks are normally used for pharmaceutical aerosol
administration to infants because infants are unable to use the mouthpieces
associated with standard inhalers and nebulizers; therefore, predicting deposition
of aerosols in nasal airways of infants is important in exposure assessments and
determining lung drug dose.
Comparisons of ultrafine particle deposition in models and live subjects
confirm in vitro measurement as an acceptable method for the simulation of
14
particle behavior in human nasal airways (Martonen and Zhang 1992).
Experiments using nasal replicas are popular because they can be used for
systematic studies in laboratories without the ethical limitations of human studies.
Given that nasal airway cross sections do not change noticeably during the
breathing cycle (Arens et al. 2005), collecting images of infant extrathoracic
airways is an alternative option to avoid the complexities of subject recruitment
and in vivo studies. Moreover, although deposition of ultrafine aerosols in replicas
with nasal hair is higher than without nasal hair for adults (Cheng et al. 1993),
this is not an issue for infants because they do not yet have any nasal hair. Also,
surface roughness characteristics of replicas have not been found to be important
in deposition of ultrafine particles less than 150 nm in diameter (Kelly et al.
2004). For the above reasons, in vitro measurements of deposition in infants nasal
airways are expected to be an acceptable alternative to in vivo studies.
In the present study we characterize ultrafine particles deposition in nasal
airways of infants, supplementing a recent communication whose focus was on
the deposition of micrometer-sized particles in replicas of nasal airways of infants
(Storey-Bishoff et al. 2008).
2.2 Experimental Procedure
For the infant part of our study, computed tomography (CT) scans of
upper airways of ten infants (3-18 months) were obtained from the medical
imaging archive at Stollery Children’s Hospital, Edmonton, Canada with the
approval of the Alberta Health Research Ethics Board. The replicas included the
15
face, nostrils and nasal airways to the level of the upper trachea. Details of model
construction and subject parameters can be found in a recent communication
(Storey-Bishoff et al. 2008).
For validation purposes, magnetic resonance imaging (MRI) scans of six
adults during nasal breathing were obtained in coronal slices using a Turbo Spin
Echo sequence using a Siemens MRI scanner (Sonata, Siemens Healthcare,
Erlangen, Germany) with a standard head coil for signal reception under the
approval of the University of Alberta Health Research Ethics Board. In-plane
spatial resolution in the coronal plane was 0.33 mm with a slice thickness of 1.5
mm. Coronal slice orientations ensured the lower resolution slice-dimension was
oriented predominantly along the length of the nasal passages, while the high
resolution in-plane dimensions were oriented perpendicular to the nasal wall.
Manual dynamic region growing using Mimics (Materialise, Leuven, Belgium)
was used for segmenting airways in the MRI data. Replicas included all facial
features and smoothed nasal airways proximal to trachea were subtracted from the
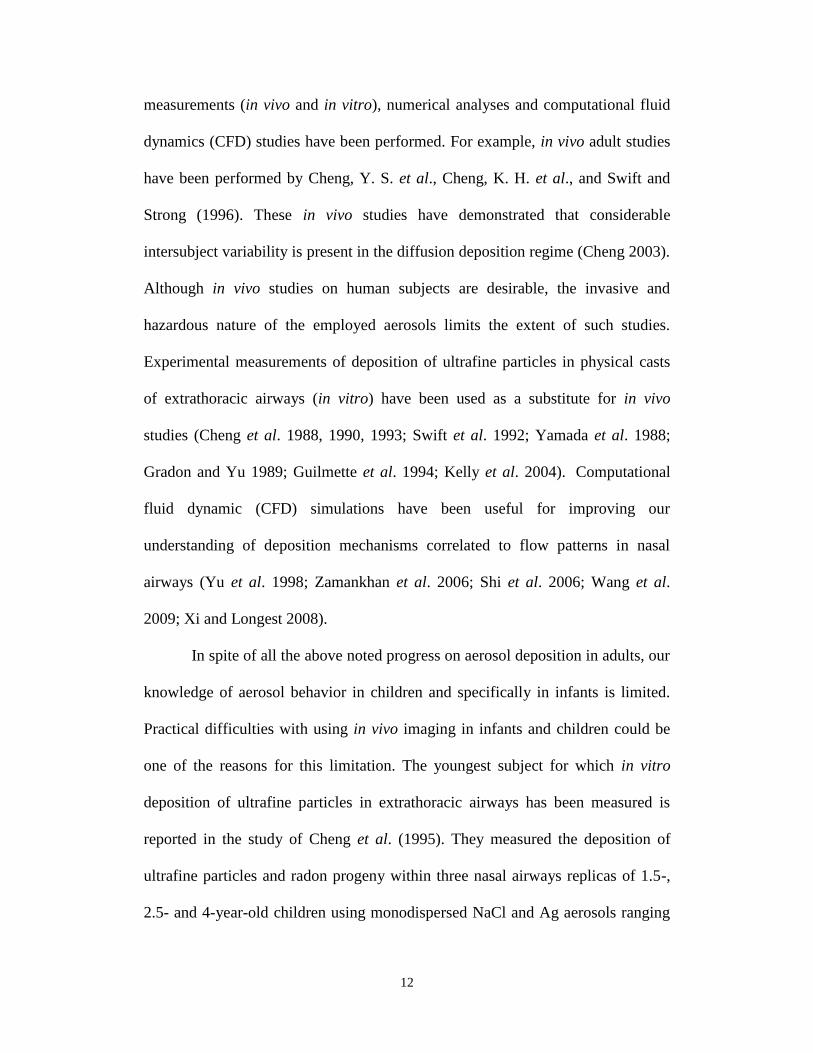
face. Figure 2.1 shows smoothed nasal airways of one male (subject 3), one
female (subject 5), and one of the infants (subject 2). The replicas were built in an
Invision SR 3-D printer (3D Systems, Rock Hill, SC, USA) in three parts using an
acrylic-build material and wax support, which was melted and removed later from
the replicas by heating them to 60 C. Some geometrical parameters of the adult
subjects are given in Table 2.1.
16
Table 2.1 Adult subject parameters
Subject Sex V (mm3) As (mm
2) L (mm)
1 M 52338 28444 234
2 F 44567 28718 241
3 M 56218 31507 274
4 F 40410 26422 231
5 F 35857 23532 210
6 M 50125 31345 269
V, volume; As, surface area; L, length of the airways.
To facilitate the tube connections, noses of all replicas (adults and infants)
were fitted with size 1 PARI BABYTM
nebulizer silicone face masks (PARI, Inc.
Midlothian, VA, USA). This method was chosen instead of using an exposure
chamber because our preliminary experiments using an exposure chamber
resulted in excessive fluctuations of concentration at the sampling point and close
to the nostrils due to diffusion of particles as well as flow circulation within the
chamber.
17
Figure 2.1 Nasal airways of one infant subject and two adult subjects (one male
and one female) are shown.
Polydisperse salt particles were generated from saline solution at a
solution concentration of 0.24±0.028 mg/ml using a 6-jet Collison atomizer (BGI,
Inc., Waltham, MA, USA). Aerosol was passed through a silica gel diffusion
dryer and subsequently passed through a Kr-85 neutralizer (Model 3054, TSI,
Inc., St-Paul, MN, USA). To reduce coagulation, aerosol was then diluted
upstream of the nasal replica with clean dry dilution air at a flow rate of 17 L/min
(infant setup) or 31 L/min (adult setup). A mass flow meter (Model 4043, TSI,
Inc., St-Paul, MN, USA) was used to measure flow rates of dilution air. Since a
tidal breathing pattern was simulated, an outlet was provided to release the excess
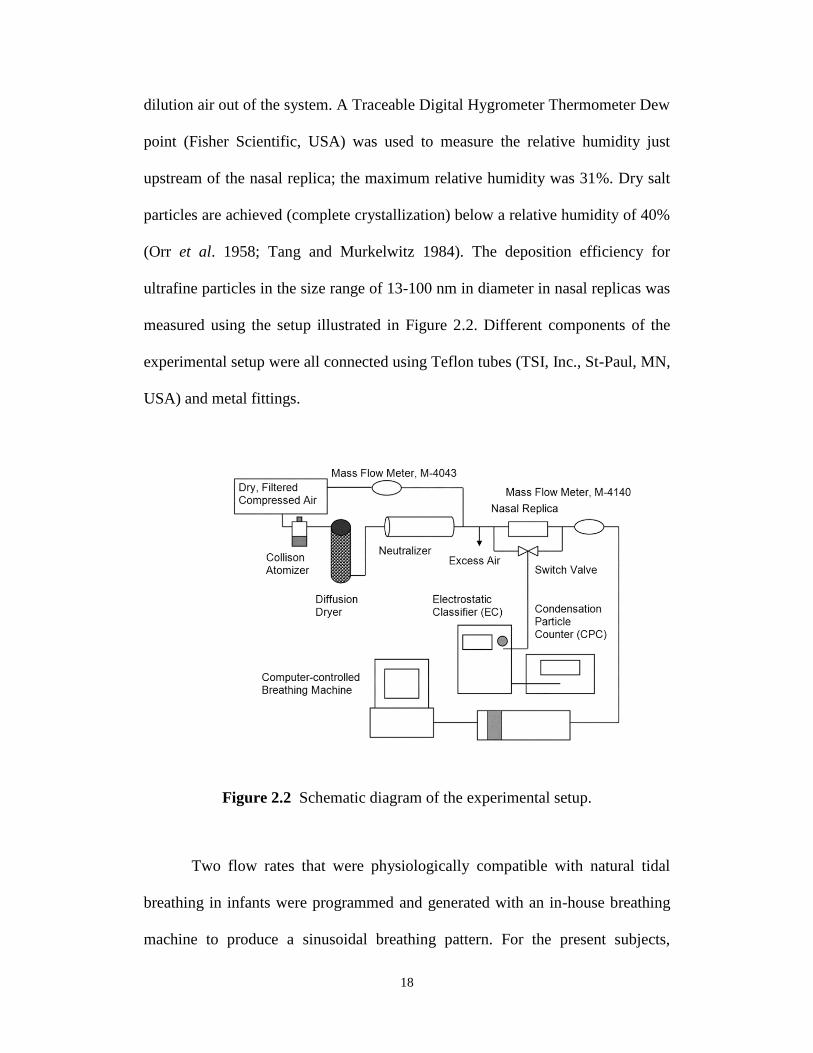
18
dilution air out of the system. A Traceable Digital Hygrometer Thermometer Dew
point (Fisher Scientific, USA) was used to measure the relative humidity just
upstream of the nasal replica; the maximum relative humidity was 31%. Dry salt
particles are achieved (complete crystallization) below a relative humidity of 40%
(Orr et al. 1958; Tang and Murkelwitz 1984). The deposition efficiency for
ultrafine particles in the size range of 13-100 nm in diameter in nasal replicas was
measured using the setup illustrated in Figure 2.2. Different components of the
experimental setup were all connected using Teflon tubes (TSI, Inc., St-Paul, MN,
USA) and metal fittings.
Figure 2.2 Schematic diagram of the experimental setup.
Two flow rates that were physiologically compatible with natural tidal
breathing in infants were programmed and generated with an in-house breathing
machine to produce a sinusoidal breathing pattern. For the present subjects,
19
resting tidal volumes of 30-88 mL and breathing rate of 44-34 bpm, respectively,
have been considered physiologically realistic (Storey-Bishoff et al. 2008). A
mass flow meter (Model 4140, TSI, Inc., St-Paul, MN, USA) was used for
recording tidal breathing patterns. Periodic patterns were used since previous
researchers have shown differences in total deposition of particles during tidal and
steady flow through airway replicas at an equal average velocity (Haussermann et
al. 2002; Shi et al. 2006). Only the inhalation half of the breathing pattern was
used. Actual values of breaths/min and tidal volume for each test were measured
by analyzing recorded flow patterns vs. time, given that the tidal volume is the
area under the curve. The following measured breathing patterns were used:
42.09±0.16 breaths/min (bpm) with average flow rate 3.07±0.03 L/min, and
33.98±0.09 bpm with average flow rate 7.06±0.06 L/min, corresponding to
minimum and maximum flow rates. Dividing average flow rate by twice the
breaths per minute gives the tidal volume for a sinusoidal wave. To determine the
effect of flow rate on deposition for three subjects (2, 6 and 10), a third flow
pattern with a middling flow rate (5.34±0.25 L/min, 39.78±0.12 bpm) was also
tested. Similarly, a small number of tests were done with two infant subjects
(subjects 3 and 8) at two constant flow rates similar to two tested tidal flow
patterns (3 and 7 L/min).
For six adult replicas, three constant flow rates of 4, 10 and 20 L/min were
used to allow comparison with literature data. An additional set of experiments
was performed with three adult subject replicas (subjects 1, 3 and 6) using two
physiological tidal flow patterns with the average of approximately 9.7±0.03
20
L/min (9.6±0.05 bpm and tidal volume Vt=0.506±0.002 L) and 19.6±0.4 L/min
(16.86±0.34 bpm and Vt=0.58±0.02 L) to obtain preliminary data on the
difference in deposition between constant vs. tidal flow.
A scanning mobility particle sizer (Model 3936, TSI, Inc., Shoreview,
MN, USA), consisting of an electrostatic classifier (EC, Model 3080, TSI, Inc.,
Shoreview, MN, USA) with a nano differential mobility analyzer (DMA, 3085,
TSI, Inc., Shoreview, MN, USA) and a condensation particle counter (CPC,
Model 3776, TSI, Inc., Shoreview, MN, USA), was used to count the particles.
Deposition efficiency (η) was determined based on the number concentration
before (Cin) and after (Cout) each nasal airway replica, as follows:
100in
outin
C
CC (2.1)
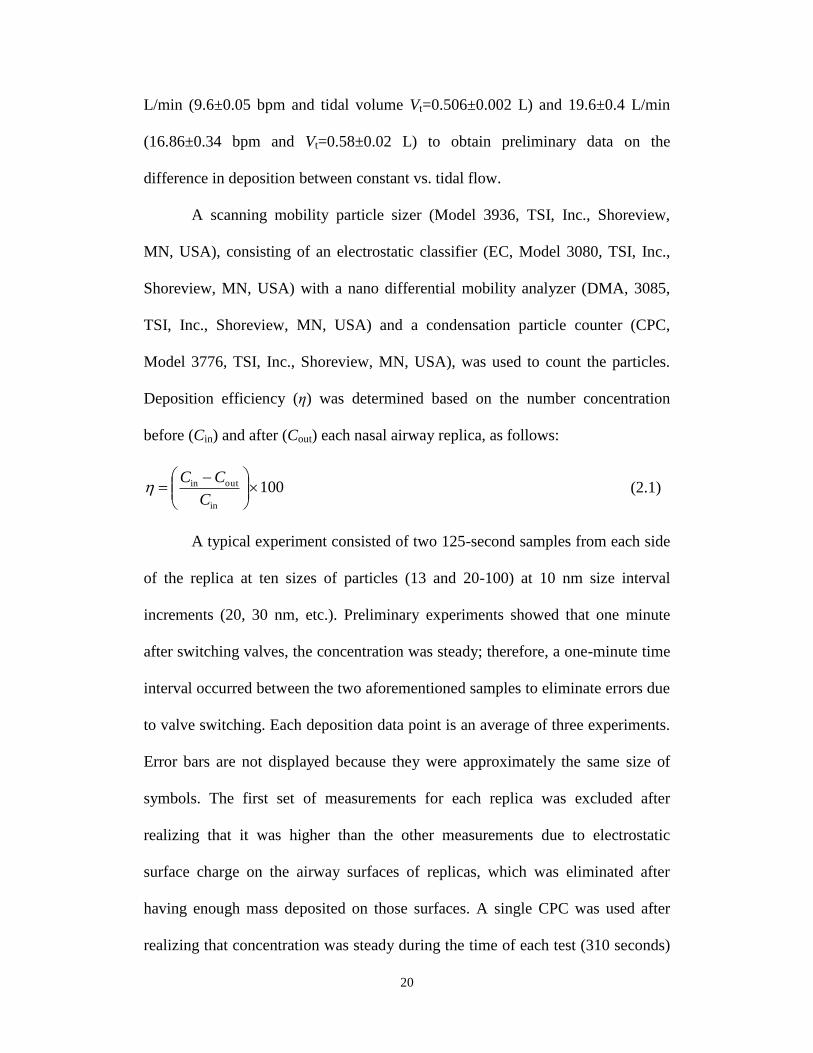
A typical experiment consisted of two 125-second samples from each side
of the replica at ten sizes of particles (13 and 20-100) at 10 nm size interval
increments (20, 30 nm, etc.). Preliminary experiments showed that one minute
after switching valves, the concentration was steady; therefore, a one-minute time
interval occurred between the two aforementioned samples to eliminate errors due
to valve switching. Each deposition data point is an average of three experiments.
Error bars are not displayed because they were approximately the same size of
symbols. The first set of measurements for each replica was excluded after
realizing that it was higher than the other measurements due to electrostatic
surface charge on the airway surfaces of replicas, which was eliminated after
having enough mass deposited on those surfaces. A single CPC was used after
realizing that concentration was steady during the time of each test (310 seconds)
21
for the selected particle sizes. Using a single CPC also eliminated any systematic
error in determining the deposition efficiency. Count concentration of smaller
particles (<13 nm) was too variable over the time of experiment (coefficient of
variation- COV>5%) due to the low concentration of those particles coming out
of the Collison atomizer; therefore, only deposition of particles larger than 13 nm
was determined.
Correction was needed for multicharged particles passing through the
DMA with the mobility of the singly-charged target size. For example, when the
electrostatic classifier was set at 30 nm (n=1), in actuality a fraction of 43 nm
(n=2) and 54 nm (n=3) particles would also be counted by the CPC. Therefore,
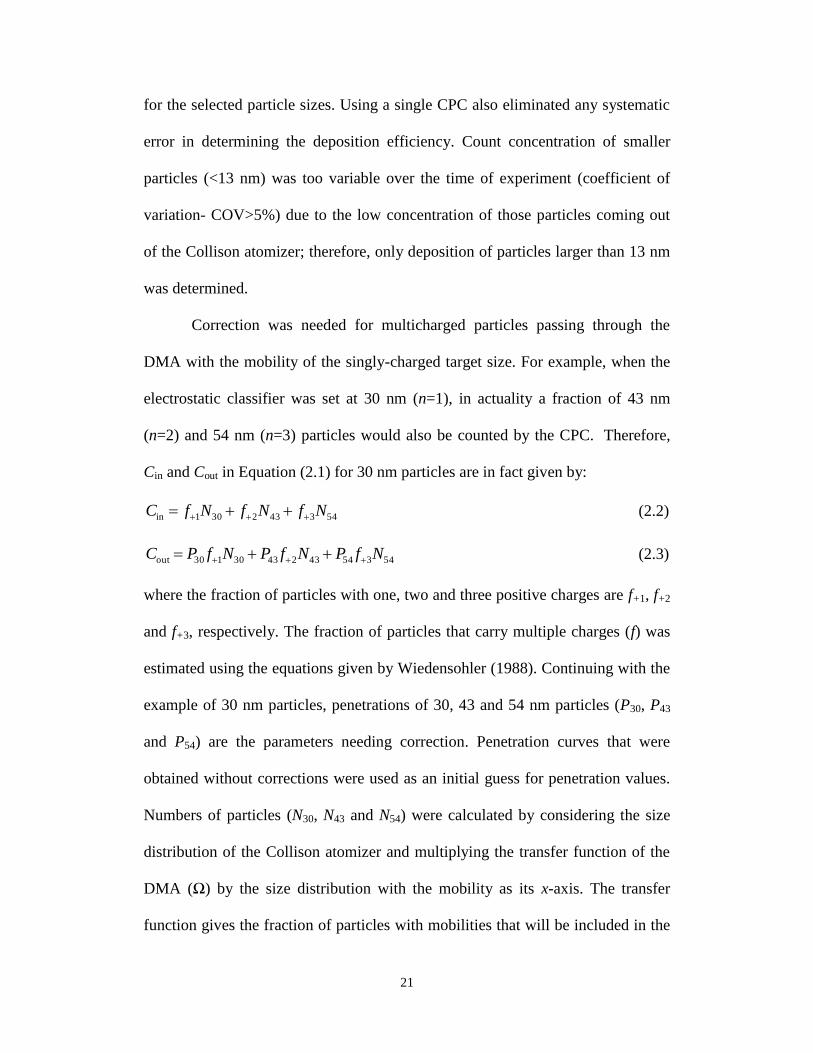
Cin and Cout in Equation (2.1) for 30 nm particles are in fact given by:
543432301in NfNfNfC (2.2)
543544324330130out NfPNfPNfPC (2.3)
where the fraction of particles with one, two and three positive charges are f+1, f+2
and f+3, respectively. The fraction of particles that carry multiple charges (f) was
estimated using the equations given by Wiedensohler (1988). Continuing with the
example of 30 nm particles, penetrations of 30, 43 and 54 nm particles (P30, P43
and P54) are the parameters needing correction. Penetration curves that were
obtained without corrections were used as an initial guess for penetration values.
Numbers of particles (N30, N43 and N54) were calculated by considering the size
distribution of the Collison atomizer and multiplying the transfer function of the
DMA (Ω) by the size distribution with the mobility as its x-axis. The transfer
function gives the fraction of particles with mobilities that will be included in the
22
sample to the CPC and is calculated according to the equation given by Wang and
Flagan (1990). Corrected penetration values were obtained by matching both
sides of Equation (2.3) for each subject at each flow rate; however, those
corrections did not change the deposition values significantly (maximum change
0.5%). Losses of the lines were also subtracted from the deposition data.
Since pressure drop measurements are a means of indirectly validating the
build procedure of the models, the pressure drop across each infant and adult
replica was measured with a low range digital manometer (OMEGA HHP-103).
Steady inspiratory flow rates in the ranges of 4-75 L/min and 0-16 L/min were
used to obtain pressure measurements for the adult and infant replicas,
respectively. The pressure drops of the connections were subtracted from the total
pressure drop and the presented net values are averages of triplicate
measurements.
2.3. Results and Discussion
2.3.1. Method Validation
The transnasal pressure drop measurements in our six adult replicas for
inspiratory flow rates ranging from 4-75 L/min are compared to literature values
in Figure 2.3. Comparison of the in vitro data of Cheng et al. (1988, 1990) and
Garcia et al. (2009) as well as the in vivo measurements of pressure drop across
the nasal passages and nasopharynx on human volunteers performed by Pattle
(1961), Hounam et al. (1971) and Heyder and Rudolf (1977) shows that despite
all the obvious intersubject variability, airway resistance across our adult replicas
23
is within the range of existing data in the literature. This gives us confidence that
the methodology we have chosen for fabricating replicas is adequate.
Figure 2.3 Pressure drop data points across six adult human nasal replicas as a
function of inspiratory air flow rate compared with available in vivo and in vitro
measurements in the literature.
Deposition in our six adult replicas is compared for a flow rate of 20
L/min with existing in vivo and in vitro data in Figure 2.4. Good agreement is
seen. A paired t-test between mean deposition in six replicas vs. the mean of all
previous studies at a given flow rate (4 and 10 L/min) and particle size (20, 50,
and 100 nm) yielded no significant difference between our in vitro data and that
given by these previous studies (p>0.05).
24
The above pressure and deposition data provides validation of our
experimental method, given that no similar in vivo data on infants exists for
validation purposes.
Figure 2.4 Deposition data for adults at a flow rate of 20 L/min compared to
available in vivo and in vitro data.
The pressure drop data for inspiratory flow in ten infant replicas are shown
in Figure 2.5. The range of in vivo physiologic data for upper airway resistance
(ratio of pressure drop to airflow at a particular time) reported in the literature is
3.7-23.9 cm H2O L-1
sec (362.85-2343.8 Pa L-1
sec) for Caucasian infants
weighing 1.5-10.2 kg (Stocks and Godfrey 1978). The Janssens et al. (2001)
Sophia Anatomical Infant Nose-Throat (SAINT) replica, an anatomically correct
model of the upper airways of a 9-month old child, has previously been found to
lie in this range. Figure 2.5 shows that our replicas have similar values.
25
Additional post-built validation of geometrical features of our replicas (volume,
airway surface, minimum cross sectional area, and length) is given elsewhere
(Storey-Bishoff et al. 2008).
Figure 2.5 Pressure drop data for inspiratory flows in infant subjects.
2.3.2. Comparison of Infant Data with Existing Adult Correlations
Having obtained deposition measurements in our ten infant replicas, let us
first examine whether this data can be predicted using existing correlations
developed for adults. Table 2.2 summarizes all the available correlations that we
have found in the literature for prediction of deposition of ultrafine particles in
nasal airways of adults. They have been fitted to our infant data and their
attributed R-squared values are given.
26
Table 2.2 Summary of equations in the literature for predicting deposition of
ultrafine particles in nasal airways of adults and their related R2 values when fitted
to our infant data
D, diffusion coefficient (cm2/s); Q, flow rate (unit is specified in each study); As, total surface area
of the nasal airway; Amin, minimum cross-sectional area of nasal airway in a plane perpendicular to
air flow; fS , average airway shape factor of the nasal turbinate region defined as the ratio of the
airway perimeter to a reference perimeter that is the periphery of the rectangle bounding maximum
horizontal and vertical boundaries of each 3 mm bilateral airway slice;cA , average cross-sectional
area of nasal airway, which is calculated by dividing the volume of airways by the length of the
centerline passing through the airways; dh, hydraulic diameter for calculating Reynolds; Re,
Reynolds number; Sc, Schmidt number; Pr , average perimeter of the nasal airways; v,
kinematic viscosity.
TABLE 2
Summary of equations in the literature for predicting deposition of ultrafine particles in nasal
airways of adults and their related R2 values when fitted to our infant data.
Deposition Equation Comments R2 Reference
))6.16exp((1 28.05.0 QD [4] Q (L/min) 0.58 Cheng (2003)
]9.15exp[1 28.039.0 QD [5] Q (cm3/s) 0.32 Cheng, K. H. et al.
(1996)
]4.1exp[1 28.039.024.1
f
27.0
min
s
QDS
A
A [6]
Q (cm3/s) 0.55 Cheng, K. H. et al.
(1996)
125.05.08.11exp1 QD [7] Q (L/min) 0.55 Swift and Strong
(1996)
]65.12exp[1 125.05.0 QD [8] Q (L/min) 0.64 Swift et al. (1992)
45.04.0
75.0
c
s ReSc853.0exp1A
A [9]
PrAd ch 4
PrQ 4Re
DSc
0.27 Cheng, Y. S. et al.
(1996)
D, diffusion coefficient (cm2/s); Q, flow rate (unit is specified in each study); As, total surface
area of the nasal airway; Amin, minimum cross-sectional area of nasal airway in a plane
perpendicular to air flow; fS , average airway shape factor of the nasal turbinate region defined
as the ratio of the airway perimeter to a reference perimeter that is the periphery of the rectangle
bounding maximum horizontal and vertical boundaries of each 3 mm bilateral airway slice; cA ,
average cross-sectional area of nasal airway, which is calculated by dividing the volume of
airways by the length of the centerline passing through the airways; dh, hydraulic diameter for
R2
(2.4)
(2.5)
(2.6)
(2.7)
(2.8)
(2.9)
27
Figure 2.6 compares deposition values calculated using an equation
developed for adults by Swift et al. (1992), which gives the highest R-squared
value when compared with our infant experimental data. Similar to Figure 2.6, we
find that most of the literature equations (given in Table 2) pass through the cloud
of our infant data. However, there is large intersubject variability that scatters the
data and reduces the ability of any of the above equations to accurately predict
deposition in a given individual.
Figure 2.6 The correlation of Swift et al. (1992) developed for adults is shown
with our infant deposition data. Error bars on our experimental data points are
approximately the same size as the symbols and so are not shown.
The respiratory tract is still under development in children and the airway
dimensions are a function of age (Phalen et al. 1985), which causes age-
associated changes in nasal deposition. The effect of age on nasal deposition has
D0.5
Q-0.125
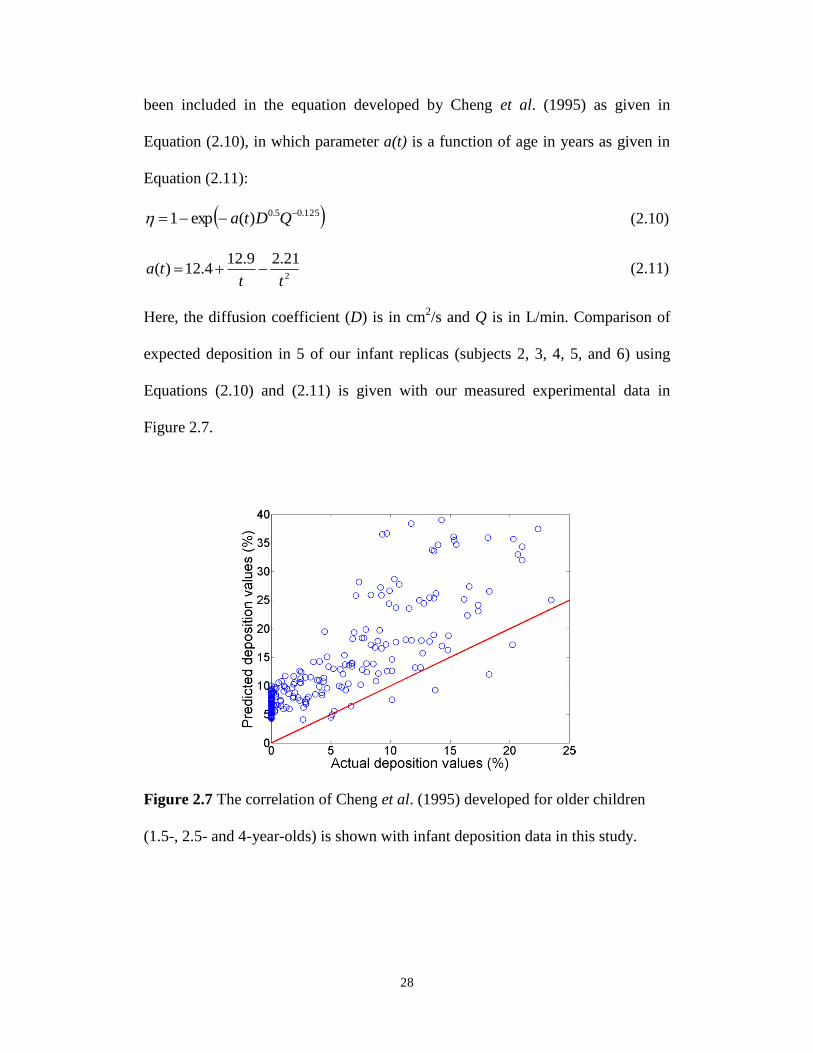
28
been included in the equation developed by Cheng et al. (1995) as given in
Equation (2.10), in which parameter a(t) is a function of age in years as given in
Equation (2.11):
125.05.0)(exp1 QDta (2.10)
2
21.29.124.12)(
ttta (2.11)
Here, the diffusion coefficient (D) is in cm2/s and Q is in L/min. Comparison of
expected deposition in 5 of our infant replicas (subjects 2, 3, 4, 5, and 6) using
Equations (2.10) and (2.11) is given with our measured experimental data in
Figure 2.7.
Figure 2.7 The correlation of Cheng et al. (1995) developed for older children
(1.5-, 2.5- and 4-year-olds) is shown with infant deposition data in this study.
29
Previous authors provide predictions with much reduced intersubject
variability by using dimensionless analysis with subject specific length scales
(Storey-Bishoff et al. 2008; Garcia et al. 2009; Grgic et al. 2004). Developed for
adults, Eqn. 2.9 includes the subject specific dimensionless parameters Sc and Re.
However, it does not include a dimensionless parameter governing unsteady
effects, which is reasonable for adults (Kelly et al. 2004; Swift and Strong 1996;
Wang et al. 2009), but may not be reasonable in infants for particles governed by
diffusion as is seen in Figure 2.8, where deposition with constant flow rate is
compared to that occurring with sinusoidal tidal breathing. It is seen that
deposition is higher for unsteady vs. steady flow rates. The breathing frequency in
infants is much higher than adults and is apparently responsible for the increased
importance of unsteadiness in infants. Haussermann et al. (2002) found
unsteadiness to be important at high breathing frequency in adults for micron-
sized particles.
30
Figure 2.8 Comparison of deposition in infant replicas vs. particle diameter (dp)
using tidal breathing (solid markers) and constant flow rate (empty markers).
While the difference between steady and tidal flow deposition is
noticeable in infants, this is in contrast to what we observe for adults as shown in
Figure 2.9. Although our data for detailed comparison of inhalation patterns in
adults is limited (since adults are not the focus of this study), careful examination
of Figure 2.9 shows that in most cases tidal deposition is slightly higher than
constant flow deposition. Heyder et al. (1982) noted enhanced deposition in
adults with tidal flow patterns for micron sized particles compared to deposition
using a controlled breathing pattern. However, Heyder et al. proposed that most
of the intersubject variability was due to morphological parameters and the effect
of physiological parameters was not significant in their study.
dp (nm)
31
Figure 2.9 Comparison of deposition in adult replicas vs. particle diameter (dp)
using tidal breathing (solid markers) and constant flow rate (empty markers).
As will be noted later, prolonged residence in recirculation regions may
play a stronger role in causing deposition in infants and may explain these
differences between infant and adult deposition of ultrafine particles. In mass
transport applications with large Peclet number, similar to this study, it is known
that flow-assisted diffusion is present as a result of enhanced cross-stream
advection due to recirculation regions and the recirculation zone resembles a well
mixed region at steady-state with a resulting reduced distance for diffusive
transport (Trevelyan et al. 2002).
2.3.3. Predictive Correlations for Infants
Given the above considerations, unsteadiness appears to be important in the
deposition of ultrafine particles in infants and we therefore add the dimensionless
dp (nm)
32
Womersley number, Wo (defined in Eqn. (2.15)), to the list of governing
dimensionless dynamical parameters. Following Finlay and Martin (Finlay and
Martin 2008), we then define the parameter X as a rational combination of the
governing dimensionless parameters and determine the best fit form of X.
However, it cannot be known a priori which characteristic diameter used in the
calculation of dimensionless parameters will result in the best predictive fit. Some
of the characteristic diameters that have been proposed in literature for reducing
intersubject variability either in micron-sized or ultrafine range and tested in this
study have been summarized in Table 2.3.
Table 2.3 Characteristic diameters that are suggested in literature and tested in
this study for calculation of dimensionless parameters to reduce intersubject
variability
TABLE 3
Characteristic diameters that are suggested in literature and tested in this study for calculation
of dimensionless parameters to reduce intersubject variability
Characteristic diameter (dc) Reference
V/As Storey-Bishoff et al. (2008)
V/Amin Storey-Bishoff et al. (2008)
L Storey-Bishoff et al. (2008)
As/L Storey-Bishoff et al. (2008)
LV Grgic et al. (2004)
LAc This study
minA Cheng Y. S. 2003
(0.0181 Lnose/Rnose)4/19
Garcia et al. (2009)
4An/Pn This study
PrAc4 Cheng, Y. S. et al. (1996)
V, volume of the nasal cavity; L, length of the representative line passing through airway; Lnose,
length of the nasal airways from nostrils to the end of the septum; Rnose, nasal resistance; An,
surface area of nostrils; Pn, perimeter of nostrils. All the other parameters have been introduced
in the caption of Table 2.
33
V, volume of the nasal cavity; L, length of the representative line passing through airway; Lnose,
length of the nasal airways from nostrils to the end of the septum; Rnose, nasal resistance; An,
surface area of nostrils; Pn, perimeter of nostrils. All the other parameters have been introduced in
the caption of Table 2.2.
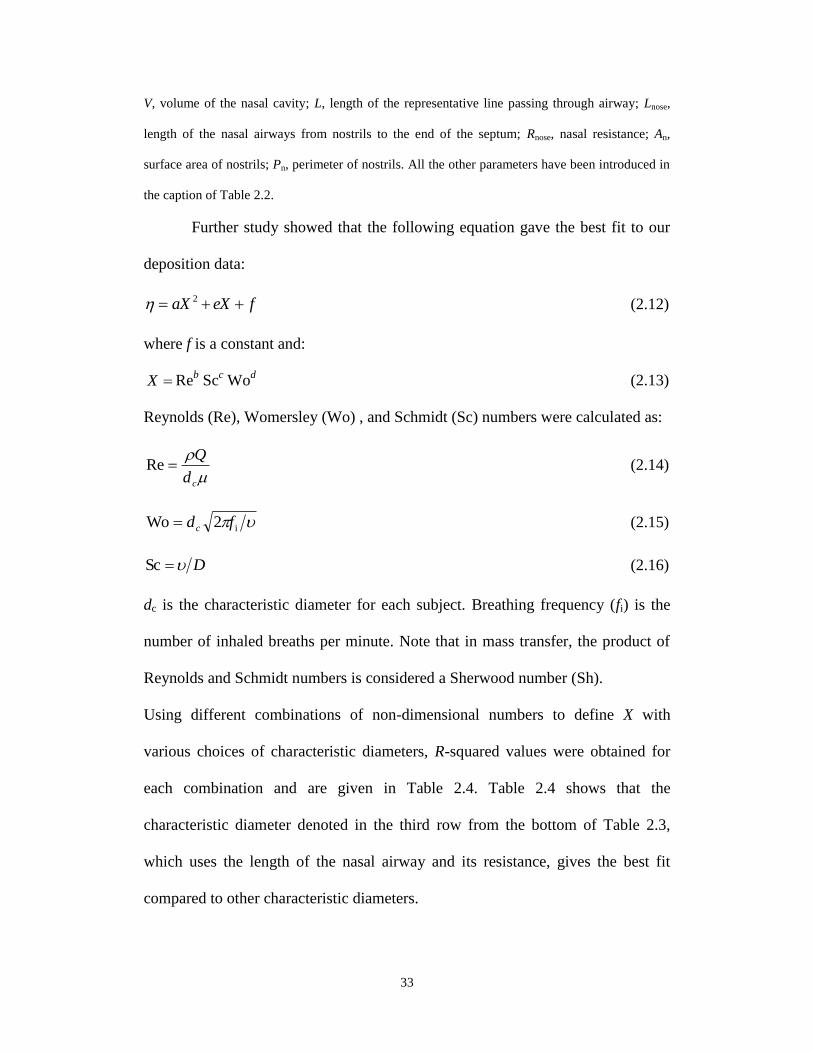
Further study showed that the following equation gave the best fit to our
deposition data:
feXaX 2 (2.12)
where f is a constant and:
X Reb Sc
c Wo
d (2.13)
Reynolds (Re), Womersley (Wo) , and Schmidt (Sc) numbers were calculated as:
cd
QRe (2.14)
i2Wo fdc (2.15)
DSc (2.16)
dc is the characteristic diameter for each subject. Breathing frequency (fi) is the
number of inhaled breaths per minute. Note that in mass transfer, the product of
Reynolds and Schmidt numbers is considered a Sherwood number (Sh).
Using different combinations of non-dimensional numbers to define X with
various choices of characteristic diameters, R-squared values were obtained for
each combination and are given in Table 2.4. Table 2.4 shows that the
characteristic diameter denoted in the third row from the bottom of Table 2.3,
which uses the length of the nasal airway and its resistance, gives the best fit
compared to other characteristic diameters.
34
Table 2.4 R-squared values of equation (2.12) fitted to infant data using different
characteristic diameters
It can be seen that including the Womersley number also gives a better fit
with a higher R-squared value. Although including the ratio of dc/dc_ave, where
dc_ave is the average characteristic diameter for all subjects, improves R-squared
values as much as including Womersley number does, Womersley number is
included in the following further exploration of the parameter X due to our
observed effect of unsteady flow. Inclusion of the Womersley number may be
TABLE 4
R-squared values of equation (12) fitted to infant data using different characteristic diameters
Deposition Parameter (X) dc=V/As dc =V/Amin dc =L dc =As/L dc = LV
Scc
0.70 0.70 0.70 0.70 0.70
Reb .Sc
c 0.77
0.78 0.72 0.73 0.75
Reb .Sc
c.Wo
d 0.84 0.80 0.72 0.73 0.81
Reb .Sc
c.(dc/dc_ave)
g 0.84
0.80 0.72 0.73 0.81
Deposition Parameter (X) dc = LAc dc = minA dc =(0.0181 Lnose/Rnose)4/19
dc =4An/Pn
Scc
0.70 0.70 0.70 0.70
Reb .Sc
c 0.79 0.71 0.79 0.70
Reb .Sc
c.Wo
d 0.82 0.71 0.89 0.71
Reb .Sc
c.(dc/dc_ave)
g 0.82
0.73 0.89 0.72
Deposition Parameter (X) dc = PrAc4
Scc
0.70
Reb .Sc
c 0.71
Reb .Sc
c.Wo
d 0.83
Reb .Sc
c.(dc/dc_ave)
g 0.83
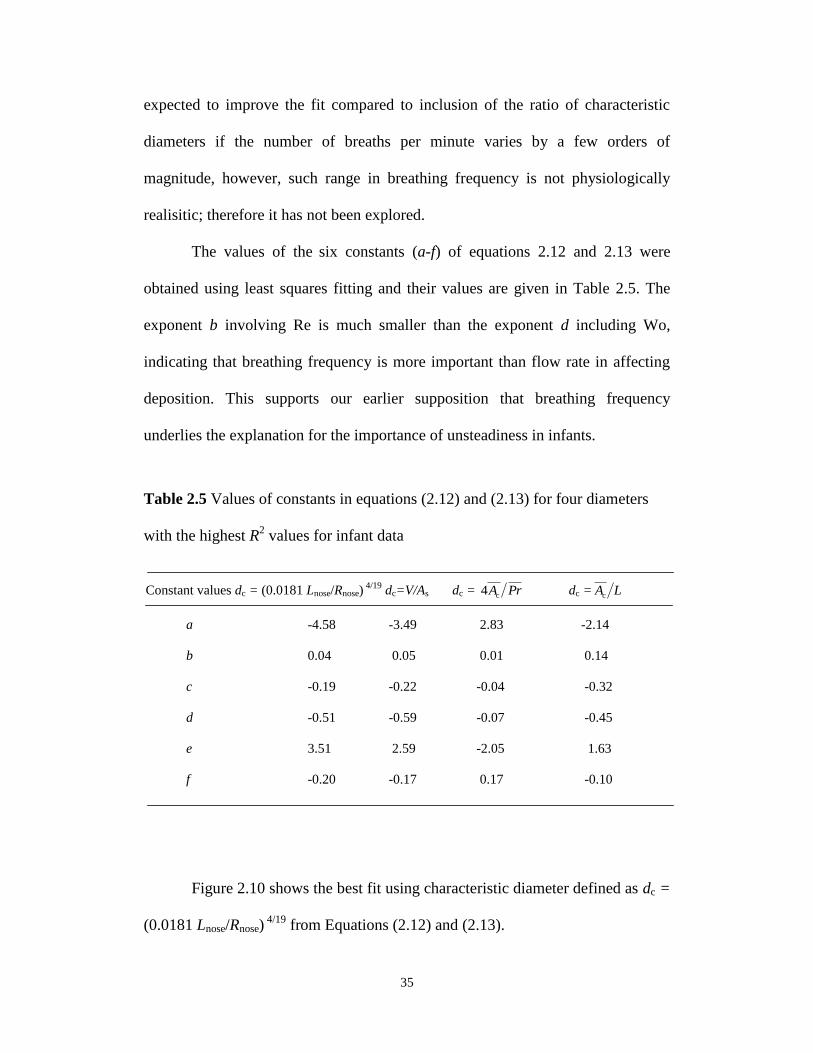
35
expected to improve the fit compared to inclusion of the ratio of characteristic
diameters if the number of breaths per minute varies by a few orders of
magnitude, however, such range in breathing frequency is not physiologically
realisitic; therefore it has not been explored.
The values of the six constants (a-f) of equations 2.12 and 2.13 were
obtained using least squares fitting and their values are given in Table 2.5. The
exponent b involving Re is much smaller than the exponent d including Wo,
indicating that breathing frequency is more important than flow rate in affecting
deposition. This supports our earlier supposition that breathing frequency
underlies the explanation for the importance of unsteadiness in infants.
Table 2.5 Values of constants in equations (2.12) and (2.13) for four diameters
with the highest R2 values for infant data
Figure 2.10 shows the best fit using characteristic diameter defined as dc =
(0.0181 Lnose/Rnose) 4/19
from Equations (2.12) and (2.13).
TABLE 5
Values of constants in equations (12) and (13) for four diameters with the highest R2 values for
infant data
Constant values dc = (0.0181 Lnose/Rnose) 4/19
dc=V/As dc = PrAc4 dc = LAc
a -4.58 -3.49 2.83 -2.14
b 0.04 0.05 0.01 0.14
c -0.19 -0.22 -0.04 -0.32
d -0.51 -0.59 -0.07 -0.45
e 3.51 2.59 -2.05 1.63
f -0.20 -0.17 0.17 -0.10
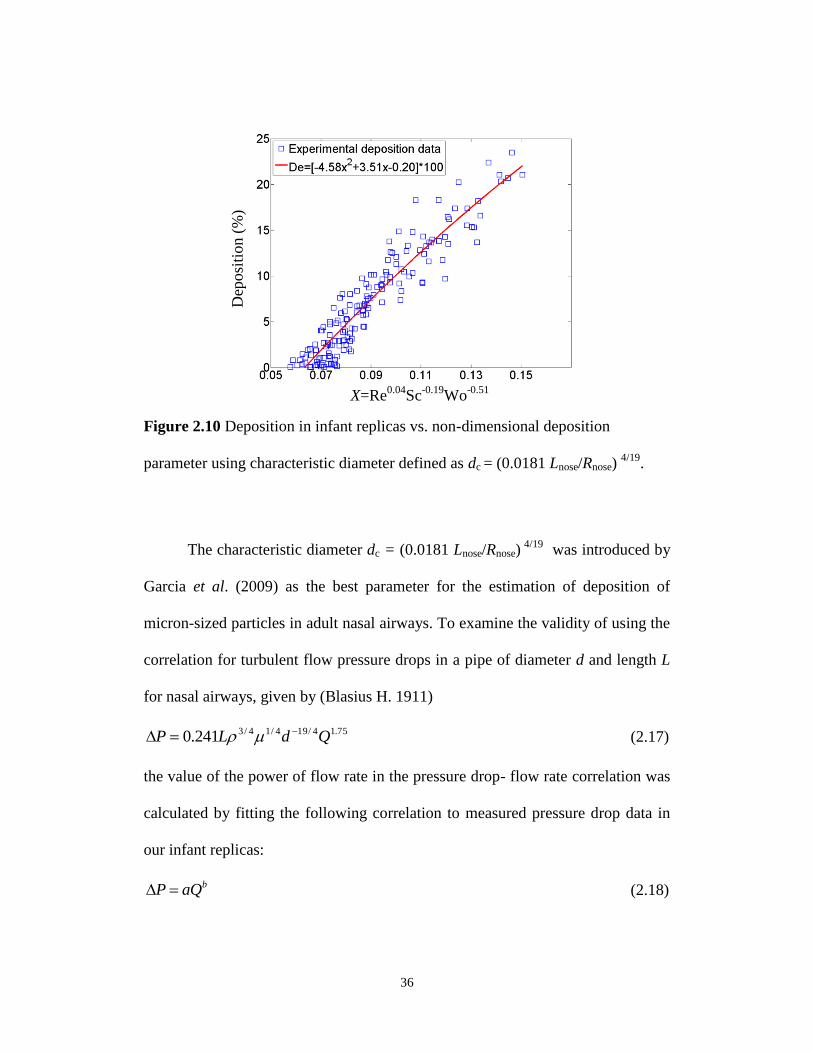
36
Figure 2.10 Deposition in infant replicas vs. non-dimensional deposition
parameter using characteristic diameter defined as dc = (0.0181 Lnose/Rnose) 4/19
.
The characteristic diameter dc = (0.0181 Lnose/Rnose) 4/19
was introduced by
Garcia et al. (2009) as the best parameter for the estimation of deposition of
micron-sized particles in adult nasal airways. To examine the validity of using the
correlation for turbulent flow pressure drops in a pipe of diameter d and length L
for nasal airways, given by (Blasius H. 1911)
75.14/194/14/3241.0 QdLP (2.17)
the value of the power of flow rate in the pressure drop- flow rate correlation was
calculated by fitting the following correlation to measured pressure drop data in
our infant replicas:
baQP (2.18)
X=Re0.04
Sc-0.19
Wo-0.51
Dep
osi
tion (
%)
37
Values of the parameter b for infants were 1.8-2 (mean 1.91±0.06), which is close
to the value of 1.75 seen in the turbulent flow pressure drop correlation for pipes
(Equation (2.17)). Therefore, nasal resistance Rnose was calculated by fitting the
following equation to our measured infant replica pressure drop data:
75.1
noseQRP (2.19)
A characteristic diameter attributed to Rnose is then calculated as follows (Garcia et
al. 2009):
19/4
nosenosec /0181.0 RLd (2.20)
Nasal resistance values and characteristic diameters for our infant replicas are
given in Table 2.6. The values of Lnose (the length of the nasal airways from
nostrils to the end of the septum) were determined using the electronic CAD files
of the infant replicas.
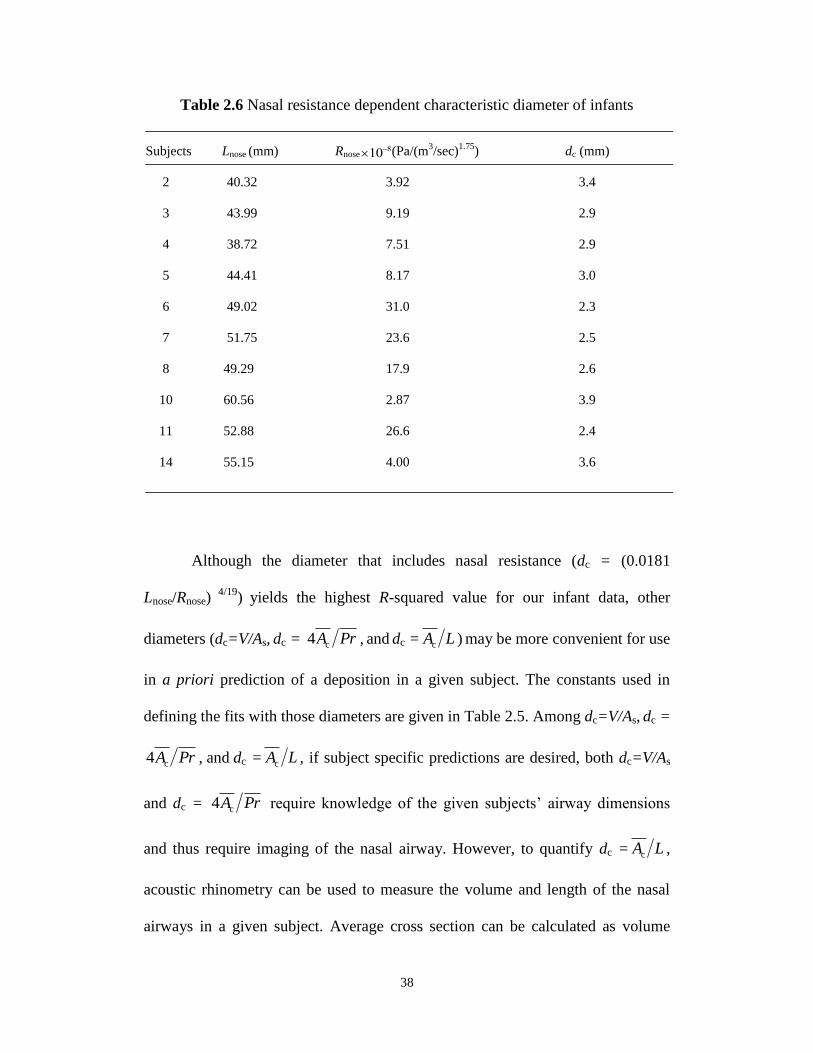
38
Table 2.6 Nasal resistance dependent characteristic diameter of infants
Although the diameter that includes nasal resistance (dc = (0.0181
Lnose/Rnose) 4/19
) yields the highest R-squared value for our infant data, other
diameters (dc=V/As, dc = PrAc4 , and dc = LAc ) may be more convenient for use
in a priori prediction of a deposition in a given subject. The constants used in
defining the fits with those diameters are given in Table 2.5. Among dc=V/As, dc =
PrAc4 , and dc = LAc , if subject specific predictions are desired, both dc=V/As
and dc = PrAc4 require knowledge of the given subjects’ airway dimensions
and thus require imaging of the nasal airway. However, to quantify dc = LAc ,
acoustic rhinometry can be used to measure the volume and length of the nasal
airways in a given subject. Average cross section can be calculated as volume
TABLE 6
Nasal resistance dependent characteristic diameter of infants
Subjects Lnose (mm) Rnose
108(Pa/(m3/sec)
1.75) dc (mm)
2 40.32 3.92 3.4
3 43.99 9.19 2.9
4 38.72 7.51 2.9
5 44.41 8.17 3.0
6 49.02 31.0 2.3
7 51.75 23.6 2.5
8 49.29 17.9 2.6
10 60.56 2.87 3.9
11 52.88 26.6 2.4
14 55.15 4.00 3.6
TABLE 7
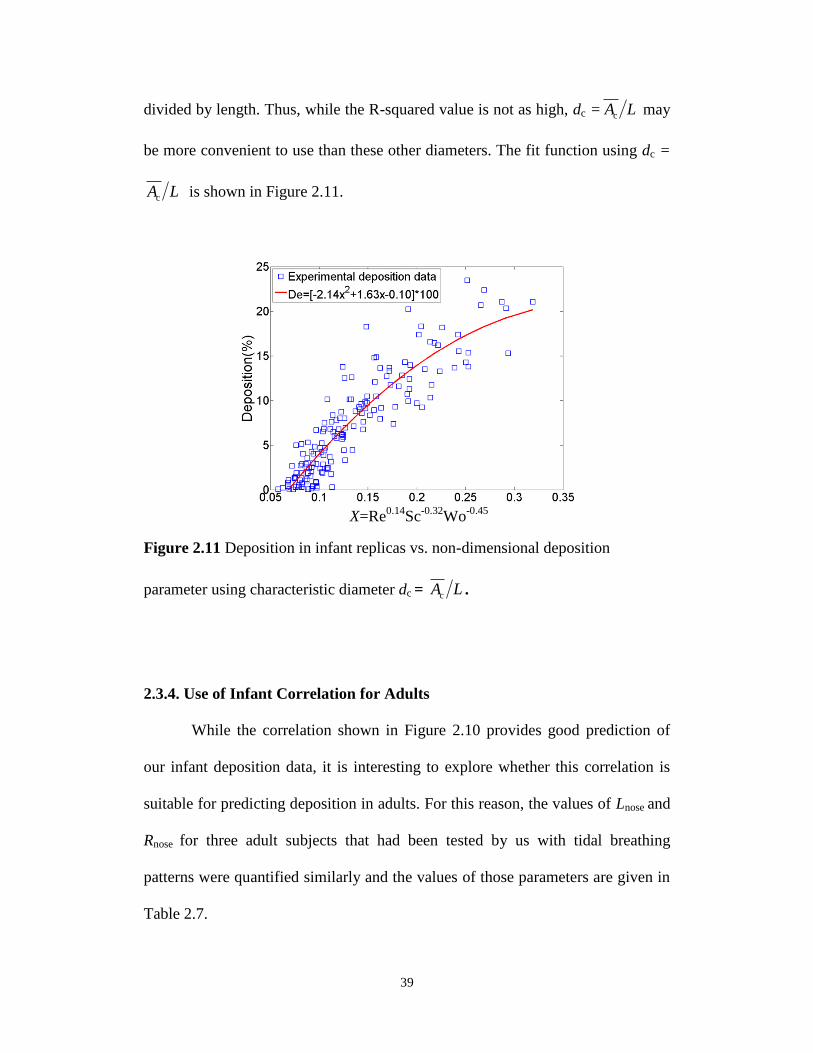
39
divided by length. Thus, while the R-squared value is not as high, dc = LAc may
be more convenient to use than these other diameters. The fit function using dc =
LAc is shown in Figure 2.11.
Figure 2.11 Deposition in infant replicas vs. non-dimensional deposition
parameter using characteristic diameter dc = LAc .
2.3.4. Use of Infant Correlation for Adults
While the correlation shown in Figure 2.10 provides good prediction of
our infant deposition data, it is interesting to explore whether this correlation is
suitable for predicting deposition in adults. For this reason, the values of Lnose and
Rnose for three adult subjects that had been tested by us with tidal breathing
patterns were quantified similarly and the values of those parameters are given in
Table 2.7.
X=Re0.14
Sc-0.32
Wo-0.45
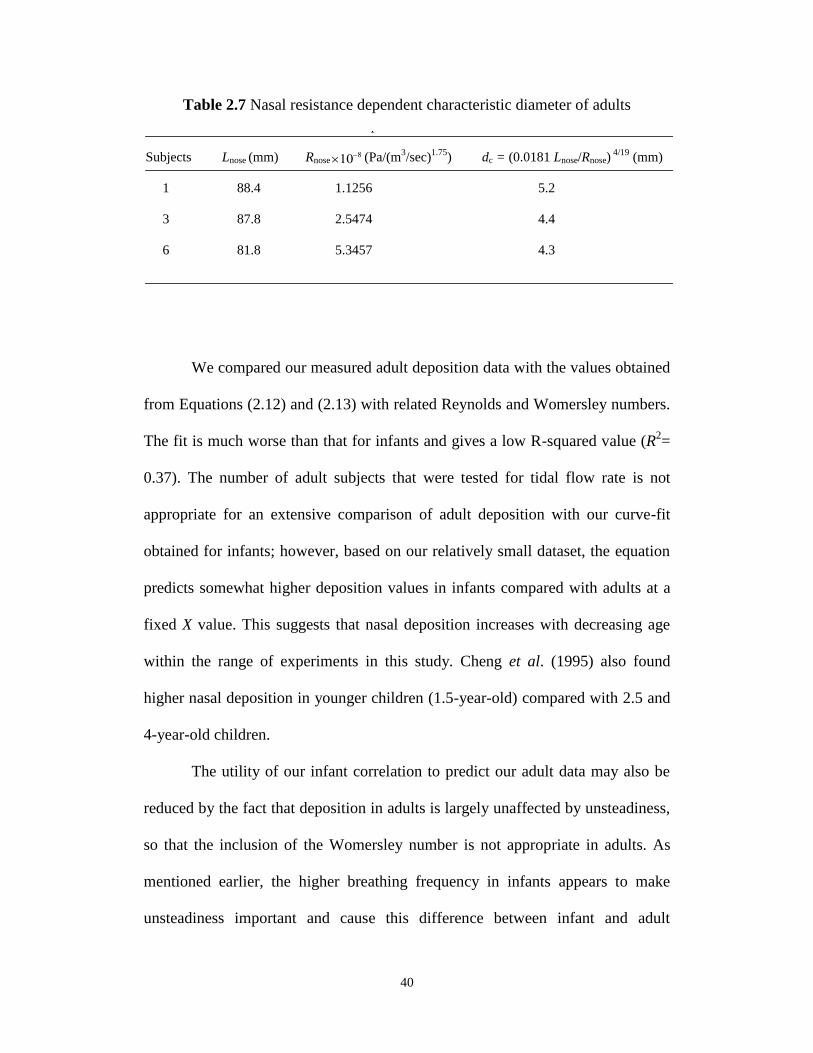
40
Table 2.7 Nasal resistance dependent characteristic diameter of adults
We compared our measured adult deposition data with the values obtained
from Equations (2.12) and (2.13) with related Reynolds and Womersley numbers.
The fit is much worse than that for infants and gives a low R-squared value (R2=
0.37). The number of adult subjects that were tested for tidal flow rate is not
appropriate for an extensive comparison of adult deposition with our curve-fit
obtained for infants; however, based on our relatively small dataset, the equation
predicts somewhat higher deposition values in infants compared with adults at a
fixed X value. This suggests that nasal deposition increases with decreasing age
within the range of experiments in this study. Cheng et al. (1995) also found
higher nasal deposition in younger children (1.5-year-old) compared with 2.5 and
4-year-old children.
The utility of our infant correlation to predict our adult data may also be
reduced by the fact that deposition in adults is largely unaffected by unsteadiness,
so that the inclusion of the Womersley number is not appropriate in adults. As
mentioned earlier, the higher breathing frequency in infants appears to make
unsteadiness important and cause this difference between infant and adult
TABLE 7
Nasal resistance dependent characteristic diameter of adults
Subjects Lnose (mm) Rnose
108 (Pa/(m3/sec)
1.75) dc = (0.0181 Lnose/Rnose)
4/19 (mm)
1 88.4 1.1256 5.2
3 87.8 2.5474 4.4
6 81.8 5.3457 4.3
41
deposition for ultrafine particles. Unsteadiness is known to reduce entrainment of
jets and affect deposition of micrometer sized particles in the larynx in adults
(Grgic et al. 2006). From a fluid mechanics perspective, reduced entrainment in
separated shear regions may enhance the size of recirculation regions in our infant
replicas with unsteady flow. Increased residence time in such enhanced
recirculation regions may result in enhanced diffusional deposition and could
explain the importance of unsteady effects in infants that we observe. This
explanation is supported by other studies where it is found that the presence of
recirculation regions significantly enhances cross-stream diffusional mass
transport (Trevelyan et al. 2002).
2.4. Conclusions
Deposition within a subject (intrasubject variability) is found to be a
function of Reynolds number, Schmidt number, and Womersley number. Strong
dependence of deposition on the steady vs. unsteady nature of the flow was
noticed within the range of this study, with deposition using tidal breathing found
to be higher than deposition using a constant flow pattern. These observations
may be due to the fact that in unsteady flow patterns, a higher proportion of the
flow area is part of recirculating flows having lower than average velocity.
Enhanced recirculation regions would increase particle residence time and
diffusional deposition. For adults, however, deposition for tidal flow was almost
identical to deposition using steady flow rates. This may be due to the much lower
42
breathing frequency in adults, and concomitant reduction in differences in
recirculating regions between steady and unsteady flow rates.
For our ten infant replicas, the best fit correlation to our data is
20.0)WoSc(Re51.3)WoSc(Re58.4 51.02.004.0251.02.004.0 , where dc=
(0.0181Lnose/Rnose) 4/19
, introduced by Garcia et al. (2009) and obtained by fitting
pressure-flow data with equations (2.19) and (2.20), is used as the length scale for
calculating Reynolds and Womersley numbers. The average value of dc=
(0.0181Lnose/Rnose) 4/19
for our infants is 2.95 mm. This equation requires
knowledge of nasal resistance to predict deposition in a given subject. A
correlation that fits nearly as well, but which requires only geometric information
is 10.0)WoSc(Re63.1)WoSc(Re14.2 45.032.014.0245.032.014.0 where dc =
LAc , defined as the ratio of the average cross-sectional area to a representative
length of the nose from the nostrils to the trachea, is used as the length scale for
calculating Reynolds and Womersley numbers. The average value of dc = LAc
for our infants is 1.1 mm. Use of either of these correlations allows fairly accurate
subject specific predictions of ultrafine particle deposition in the nasal airways of
infants. Such predictive capabilities may be useful in the development of
improved health effect models for infants.
2.5 Bibliography
Arens, R., Sin, S., McDonough, J. M., Palmer, J. M., Dominguez, T., Meyer, H.,
Wootton, D. M., and Pack, A. I. (2005) Changes in upper airway size during tidal
43
breathing in children with obstructive sleep apnea syndrome. American Journal of
Respiratory and Critical Care Medicine, 171, 1298-1304.
Blasius, H. (1911) The similarity law in friction processes. Physikalische
Zeitschrift, 12, 1175-1177.
Cheng, Y. S., Yamada, Y., Yeh, H. C., and Swift, D. L. (1988) Diffusional
deposition of ultrafine aerosols in a human nasal cast. Journal of Aerosol Science,
19(6), 741-751.
Cheng, Y. S., Yamada, Y., Yeh, H. C., and Swift, D. L. (1990) Deposition of
ultrafine aerosols in a human oral cast. Aerosol Science and Technology, 12(4),
1075-1081.
Cheng, Y. S., Su, Y. F., Yeh, H. C., and Swift, D. L. (1993) Deposition of thoron
progeny in human head airways. Aerosol Science and Technology, 18(4), 359-
375.
Cheng, Y. S., Smith, S. M., Yeh, H. C., Kim, D. B., Cheng, K. H., and Swift, D.
L. (1995) Deposition of ultrafine aerosols and thoron progeny in replicas of nasal
airways of young children. Aerosol Science and Technology, 23, 541-552.
Cheng, Y. S., Yeh, H. C., Guilmette, R. A., Simpson, S. Q., Cheng, K. H., and
Swift, D. L. (1996) Nasal deposition of ultrafine particles in human volunteers
and its relationship to airway geometry. Aerosol Science and Technology, 25,
274-291.
Cheng, K. H., Cheng, Y. S., Yeh, H. C., Guilmette, R. A., Simpson, S.Q., Yang,
S. Q., and Swift, D. L. (1996) In vivo measurements of nasal airway dimensions
44
and ultrafine aerosols depositing in human nasal and oral airways. Journal of
Aerosol Science, 27(5), 785-801.
Cheng, Y. S. (2003) Aerosol deposition in the extrathoracic region. Aerosol
Science and Technology, 37, 659-671.
Finlay, W. H. (2008) At the frontiers of understanding: inhaled aerosols in
neonates. Pediatric Research, 64(2), 121-122.
Finlay W. H., and Martin, A. R. (2008) Recent advances in predictive
understanding of respiratory tract deposition. Journal of Aerosol Medicine
Pulmonary Drug Delivery, 21(2), 1-17.
Garcia, G. J. M., Tewksbury, E. W., Wong, B. A., and Kimbell, J. S. (2009)
Interindividual variability in nasal filtration as a function of nasal cavity
geometry. Journal of Aerosol Medicine Pulmonary Drug Delivery, 22(2), 139-
155.
Gill, S., Lobenberg, R., Ku, T., Azarmi, S., Roa, W. and Prenner, E. J. (2007)
Nanoparticles: characteristics, mechanisms of action and toxicity in pulmonary
drug delivery- a review. Journal of Biomedical Nanotechnology, 3, 107-119.
Grgic, B., Finlay, W. H., Burnell, P. K. P., and Heenan, A. F. (2004) In vitro
intersubject and intrasubject deposition measurements in realistic mouth-throat
geometries. Journal of Aerosol Science, 35, 1025-1040.
Grgic, B., Martin, A. R., and Finlay W. H. (2006) The effect of unsteady flow rate
increase on in vitro mouth-throat deposition of inhaled boluses. Journal of
Aerosol Science, 37, 1222-1233.
45
Guilmette, R. A., Cheng, Y. S., Yeh, H. C., Swift, D. L. (1994) Deposition of
0.005-12 m monodisperse particles in a computer-milled, MRI based nasal
airway replica. Inhalation Toxicology, 6(s1), 395-399.
Halonen, J. I., Lanki, T., Yli-Tuomi, T., Tiittanen, P., Kulmala, M., and
Pekkanen, J. (2009) Particulate air pollution and acute cardiorespiratory hospital
admissions and mortality among the elderly. Epidemiology, 20(1), 143-153.
Haussermann, S., Bailey, A. G., Bailey, M. R., Etherington, G., and Youngman,
M. (2002) The influence of breathing patterns on particle deposition in a nasal
replicate cast. Journal of Aerosol Science, 33, 923-933.
Heyder, J., and Rudolf, G. (1977) Deposition of aerosol particles in the human
nose. In: Walton, W. H., editor. Inhaled Particles IV, Pergamon Press; Oxford,
UK, 107-126.
Heyder, J., Gebhart, J., Stahlhofen, W., and Stuck, B. (1982) Biological
variability of particle deposition in the human respiratory tract during controlled
and spontaneous mouth-breathing. Annals of Occupational Hygiene, 26 (1-4),
137-147.
Hounam, R. F., Black, A., and Walsh, M. (1971) The deposition of aerosol
particles in the nasopharyngeal region of the human respiratory tract. Journal of
Aerosol Science, 2, 47-61.
Janssens, H. M., De Jongste, J. C., Fokkens, W. J., Robben, S. G. F., Wouters, K.,
and Tiddens, H. A. W. M. (2001) The Sophia anatomical infant nose-throat
(Saint) model: a valuable tool to study aerosol deposition in infants. Journal of
Aerosol Medicine, 14(4), 433-441.
46
Kelly, J. T., Asgharian, B., Kimbell, J. S., Wong, B. (2004) Particle deposition in
human nasal airway replicas manufactured by different methods. Part II: Ultrafine
particles, Aerosol Science and Technology, 38, 1072-1079.
Kreyling, W. G., Semmler-Behnke, M., and Moller, W. (2006). Ultrafine particle-
lung interactions: does size matter? Journal of Aerosol Medicine, 19, 74-83.
Martonen, T. B., and Zhang, Z. (1992) Comments on recent data for particle
deposition in human nasal passages. Journal of Aerosol Science, 23(6), 667-674.
Minocchieri, S., Burren, J. M., Bachmann, M. A., Stern, G., Wildhaber, J., Buob,
S., Schindel, R., Kraemer, R., Frey, U. P., Nelle, M. (2008) Development of the
premature neonate for the study of aerosol delivery. Pediatric Research, 64(2),
141-146.
National research council (NRC) (1988). Health risks of radon and other
internally deposited alpha emitters. Committee on the biological effects of
ionizing radiations, National Academy Press, Washington, DC.
Oberdorster, G., Sharp, Z., Atudorei, V., Elder, A., Gelein, R., Kreyling, W., Cox.
C. (2004) Translocation of inhaled ultrafine particles to the brain. Inhalation
Toxicology, 16, 437-445.
Orr, C., Hurd, F. K., and Corbett, W. J. (1958) Aerosol size and relative humidity.
Journal of Colloid Science, 13, 472-482.
Park, S. H., Kim, H. O., Han, Y. T., Kwon, S. B., and Lee, K. W. (2001) Wall
loss rate of polydispersed aerosols. Aerosol Science and Technology, 35, 710-717.
47
Pattle, R. E. (1961) The retention of gases and particles in the human nose. In:
Davies C. N., editor. Inhaled Particles and Vapors, Pergamon Press; New York,
US, 302-309.
Phalen, R. F., Oldham, M. J., Beaucage, C. B., Crocker, T. T., Mortensen, J. D.
(1985) Postnatal enlargement of human tracheobronchial airways and
implications for particle deposition. Anatomical Record, 212, 368-380.
Polgar, G., Kong, G. P. (1965) The nasal resistance of newborn infants. Journal of
Pediatrics, 67, 557-567.
Schlichting, H. (1968) Boundary layer theory (Translated by Kestin, J.) McGraw-
Hill, Stanford.
Schuepp, K. G., Jauernig, J., Janssens, H. M., Tiddens, H. A., Straub, D. A.,
Stangl, R., Keller, M., and Wildhaber, J. H. (2005) In vitro determination of the
optimal particle size for nebulized aerosol delivery to infants. Journal of Aerosol
Medicine, 18, 225-235.
Shi, H., Kleinstreuer, C., Zhang, Z. (2006) Laminar airflow and nanoparticle or
vapor deposition in a human nasal cavity model. Journal of Biomechanical
Engineering, 128, 697-706.
Stocks, J., Godfrey, S. (1978) Nasal resistance during infancy. Respiratory
Physiology, 34, 233-246.
Storey-Bishoff, J., Noga, M., and Finlay, W. H. (2008). Deposition of
micrometer-sized aerosol particles in infant nasal airway replicas. Journal of
Aerosol Science, 39, 1055-1065.
48
Swift, D. L., Cheng, Y. S., Su, Y. F., and Yeh, H. C. (1990) In Indoor radon and
lung cancer: reality and myth? (F. Cross, eds.). 29th
Hanford symposium on health
and the environment, Richland, Washington, p.213.
Swift, D. L. (1991) Inspiratory inertial deposition of aerosols in human nasal
airway replicate casts: implications for the proposed NCRP lung model. Radiation
Protection Dosimetry, 38, 29-34.
Swift, D. L., Montassier, N., Hopke, P. K., Kim, K. H., Cheng, Y. S., Su, Y. F.,
Yeh, H. C., and Strong, J. C. (1992) Inspiratory deposition of ultrafine particles in
human nasal replicate cast. Journal of Aerosol Science, 23(1), 65-72.
Swift, D. L., and Strong, J. C. (1996) Nasal deposition of ultrafine 218Po aerosols
in human subjects. Journal of Aerosol Science, 27(7), 1125-1132.
Tang, I. N., and Murkelwitz, H. R. (1984) An Investigation of Solute Nucleation
in Levitated Solution Droplets. Journal of Colloid and Interface Science, 98(2),
430-438.
Trevelyan P.M.J., Kalliadasis, S., Merkin, J. H., and Scott, S. K. (2002) Mass-
transport enhancement in regions bounded by rigid walls. Journal of Engineering
Mathematics, 42, 45-64.
Van Woensel, J. B. M., Van Aalderen, W. M. C., Kimpen, J. L. L. (2003). Viral
lower respiratory tract infection in infants and young children. British Medical
Journal, 327, 36-40.
Vincent, J. H. (2005) Health-related aerosol measurement: a review of existing
sampling criteria and proposals for new ones. Journal of Environmental
Monitoring, 7, 1037-1053.
49
Wang, S. C., and Flagan, R. C. (1990) Scanning electrical mobility spectrometer.
Aerosol Science and Technology, 13(2), 230-240.
Wang, S. M., Inthavong, K., Wen, J., Tu, J. Y., and Xue, C. L. (2009)
Comparison of micron- and nanoparticle deposition patterns in a realistic human
nasal cavity. Respiratory Physiology and Neurobiology, 166, 142-151.
Wiedensohler, A. (1988) An approximation of the bipolar charge distribution for
particles in the submicron size range. Journal of Aerosol Science, 19(3), 387-389.
Xi, J., Longest, P. W. (2008). Effects of oral airway geometry characteristics on
the diffusional deposition of inhaled nanoparticles. Journal of Biomechanical
Engineering, 130, 011008:1-16.
Xi, J., and Longest, P. W. (2008) Numerical predictions of submicrometer aerosol
deposition in the nasal cavity using a novel drift flux approach. International
Journal of Heat and Mass Transfer, 51, 5562-5577.
Yamada, Y., Cheng, Y. S., Yeh, H. C., and Swift, D. L. (1988) Inspiratory and
expiratory deposition of ultrafine particles in a human nasal cast. Inhalation
Toxicology, Premier Issue 1:1-11.
Yu, G., Zhang, Z., Lessman, R. (1998) Fluid flow and particle deposition in the
human upper respiratory system. Aerosol Science and Technology, 28, 146-158.
Zamankhan, P., Ahmadi, G., Wang, Z., Hopke, P.H., Cheng, Y.S., Su, W. C.,
Leonard, D. (2006) Airflow and deposition of nano-particles in a human nasal
cavity. Aerosol Science and Technology, 40, 463-476.
50
CHAPTER 3 : IN VITRO DEPOSITION MEASUREMENT OF
INHALED MICROMETER-SIZED PARTICLES IN
EXTRATHORACIC AIRWAYS OF CHILDREN AND
ADOLESCENTS DURING NOSE BREATHING2
A very similar version of this chapter has been published as:
Golshahi, L., Noga, M. L., Thompson, R. B., and Finlay, W. H. (2011). In vitro
deposition measurement of inhaled micrometer-sized particles in extrathoracic
airways of children and adolescents during nose breathing. Journal of Aerosol
Science, 42(7), 474-488.
3.1 Introduction
Exposure to toxic aerosols in working and living environments causes
certain health related problems depending on several parameters such as the size
of inhaled particles, the region of respiratory tract deposition, breathing rate, type
of breathing (oral vs. nasal), and anatomical features of airways (U.S. EPA 1994;
Ginsberg et al. 2008). Environmental standards were developed to regulate health
related risks once the size dependency of deposition in the respiratory tract
became apparent (Vincent 2005). However, risk assessment methods have
focused on adults, with children addressed typically by extrapolation, despite
behavioral and physiological differences between adults and children, such as
spending more time playing outdoors and greater ventilation rate per body weight
and lung surface area (Ginsberg et al. 2008). As a result of such extrapolations,
age-specific uncertainties exist in particulate deposition prediction using current
2 Reproduced with permission from Elsevier, Copyright 2011.

51
exposure models such as the ICRP human respiratory tract model (ICRP 1994;
Harvey and Hamby 2002). The uncertainty in regional deposition in airways
(extrathoracic, tracheobronchial, and alveolar), which is dependent upon age, sex,
and breathing pattern, contribute to total uncertainty in inhalation dose estimates
(Harvey and Hamby 2002); thus, focusing on decreasing uncertainties in each
region solidifies our understandings of exposure to unwanted aerosol and can also
be used to optimize pharmaceutical aerosol delivery via face masks.
Nasal breathing is the preferred mode of breathing at rest among all ages
and the contribution of nasal breathing is also significant at higher activity levels
compared to oral breathing (Bennett et al. 2008). Nasal airways filter inhaled
aerosols on their way to the lungs; however, local deposition in nasal airways may
cause allergic responses and cancers due to accumulation with time (Cheng 2003).
Moreover, extrathoracic deposition of micrometer-sized pharmaceutical aerosols
from inhalers and nasal sprays determines the efficiency of drug delivery. Hence,
improved protection of children and enhanced drug delivery via nasal inhalers and
face masks requires knowledge of the deposition of inhaled micrometer-sized
aerosols. Such aerosols are ubiquitous in the environment as allergens and
toxicants, and on the other hand therapeutic particles.
Despite numerous in vivo (Landahl and Black 1947; Landahl and
Tracewell 1949; Pattle 1961; Hounam et al. 1969, 1971; Lippmann 1970;
Giacomelli-Maltoni et al. 1972; Heyder and Rudolf 1977; Heyder et al. 1986;
Kesavanathan et al. 1998; Kesavanathan and Swift 1998; Keck et al. 2000;
Rasmussen et al. 1990, 2000;Wiesmiller et al. 2003; Bennett and Zeman 2005),
52
in vitro (Itoh et al. 1985; Swift 1991; Guilmette et al. 1994; Swift and
Kesavanathan 1996; Yeh et al. 1997; Zwartz and Guilmette 2001; Kelly et al.
2004, 2005; Dai et al. 2007; Garcia et al. 2009), computational fluid dynamics
(CFD) (Kimbell 2006; Liu et al. 2007, 2009, 2010; Shi et al. 2007; Wang et al.
2009), and theoretical modeling (Scott et al. 1978; Yu et al. 1981; Cheng et al.
1991) studies on deposition of micrometer-sized particles that give correlations
including airway dimensions and flow patterns to predict deposition of
micrometer-sized particles in nasal airways of adults, only a few studies have
focused on children. Two studies involving children (Becquemin et al. 1991;
Bennett et al. 2008) (one for 5.5-15 year olds and the other for 6-10 year olds)
included only a few monodisperse particle sizes and we are not aware of any
empirical nasal correlation including geometry and breathing pattern of children
based on the measured deposition data. Furthermore, existing results are
inconsistent since some report higher deposition in nasal airways of children
(Phalen et al. 1989) while others report lower deposition compared to adults
(Becquemin et al. 1991; Bennett et al. 2008). In order to address such
uncertainties and fill the available knowledge gaps, we have performed an in vitro
study characterizing deposition of micrometer-sized particles in multiple nasal
airway replicas of school-aged children and adolescents (4-14 years old).
Considering compliance related and relevant ethical issues in pediatric in vivo
deposition measurements, and the existence of well validated in vitro deposition
measurement methods for adults, such in vitro methodologies are attractive.
Previously, a study focusing on deposition of micrometer-sized particles in nasal
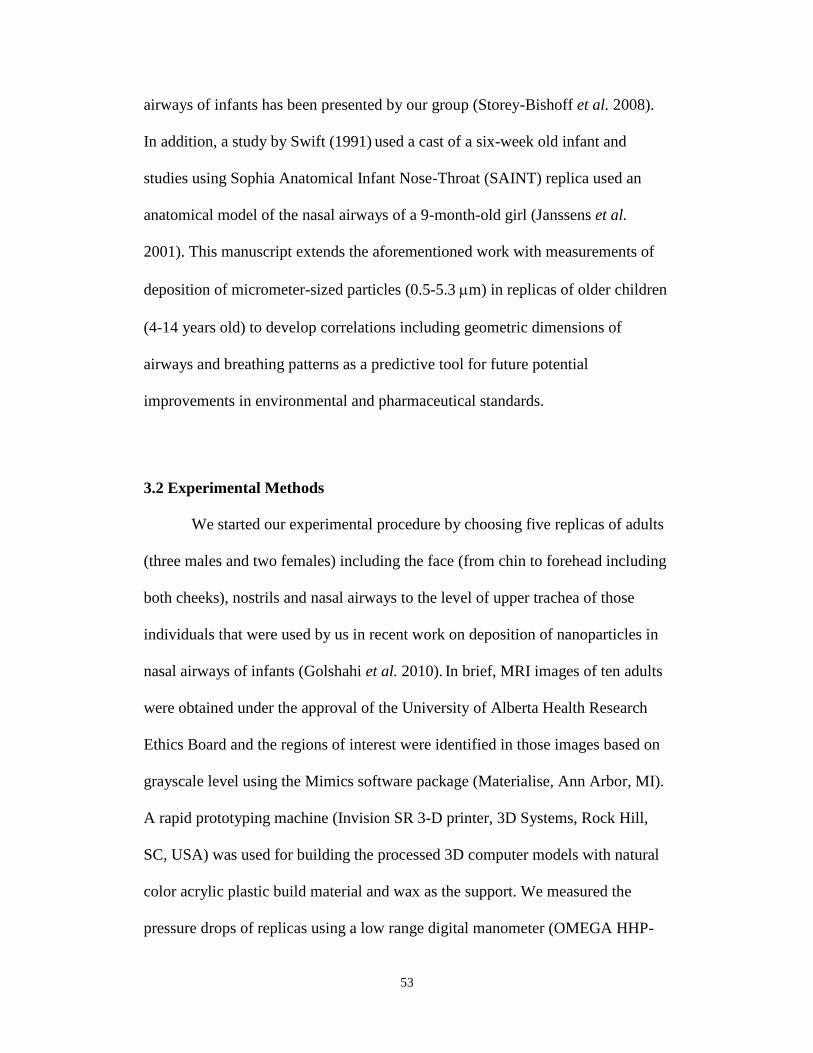
53
airways of infants has been presented by our group (Storey-Bishoff et al. 2008).
In addition, a study by Swift (1991) used a cast of a six-week old infant and
studies using Sophia Anatomical Infant Nose-Throat (SAINT) replica used an
anatomical model of the nasal airways of a 9-month-old girl (Janssens et al.
2001). This manuscript extends the aforementioned work with measurements of
deposition of micrometer-sized particles (0.5-5.3 m) in replicas of older children
(4-14 years old) to develop correlations including geometric dimensions of
airways and breathing patterns as a predictive tool for future potential
improvements in environmental and pharmaceutical standards.
3.2 Experimental Methods
We started our experimental procedure by choosing five replicas of adults
(three males and two females) including the face (from chin to forehead including
both cheeks), nostrils and nasal airways to the level of upper trachea of those
individuals that were used by us in recent work on deposition of nanoparticles in
nasal airways of infants (Golshahi et al. 2010). In brief, MRI images of ten adults
were obtained under the approval of the University of Alberta Health Research
Ethics Board and the regions of interest were identified in those images based on
grayscale level using the Mimics software package (Materialise, Ann Arbor, MI).
A rapid prototyping machine (Invision SR 3-D printer, 3D Systems, Rock Hill,
SC, USA) was used for building the processed 3D computer models with natural
color acrylic plastic build material and wax as the support. We measured the
pressure drops of replicas using a low range digital manometer (OMEGA HHP-
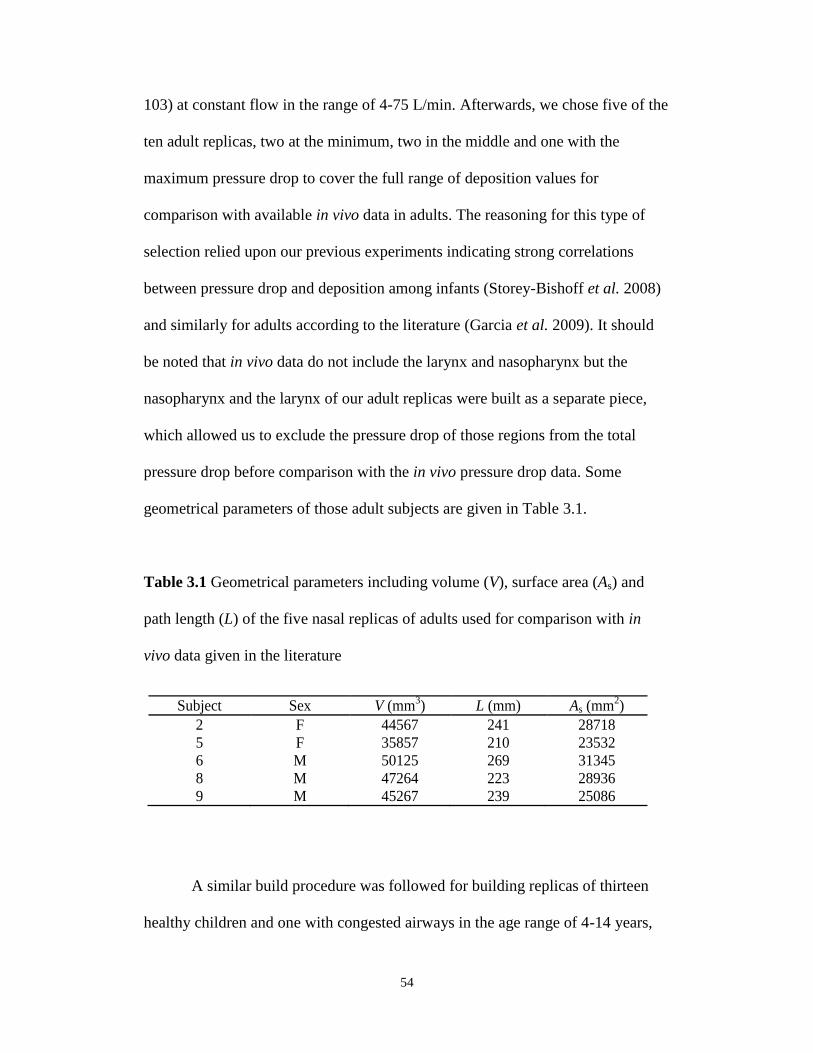
54
103) at constant flow in the range of 4-75 L/min. Afterwards, we chose five of the
ten adult replicas, two at the minimum, two in the middle and one with the
maximum pressure drop to cover the full range of deposition values for
comparison with available in vivo data in adults. The reasoning for this type of
selection relied upon our previous experiments indicating strong correlations
between pressure drop and deposition among infants (Storey-Bishoff et al. 2008)
and similarly for adults according to the literature (Garcia et al. 2009). It should
be noted that in vivo data do not include the larynx and nasopharynx but the
nasopharynx and the larynx of our adult replicas were built as a separate piece,
which allowed us to exclude the pressure drop of those regions from the total
pressure drop before comparison with the in vivo pressure drop data. Some
geometrical parameters of those adult subjects are given in Table 3.1.
Table 3.1 Geometrical parameters including volume (V), surface area (As) and
path length (L) of the five nasal replicas of adults used for comparison with in
vivo data given in the literature
A similar build procedure was followed for building replicas of thirteen
healthy children and one with congested airways in the age range of 4-14 years,
Table 1
Geometrical parameters including volume (V), surface area (As) and path length (L) of the five
nasal replicas of adults used for comparison with in vivo data given in the literature.
Subject Sex V (mm3) L (mm) As (mm
2)
2 F 44567 241 28718
5 F 35857 210 23532
6 M 50125 269 31345
8 M 47264 223 28936
9 M 45267 239 25086
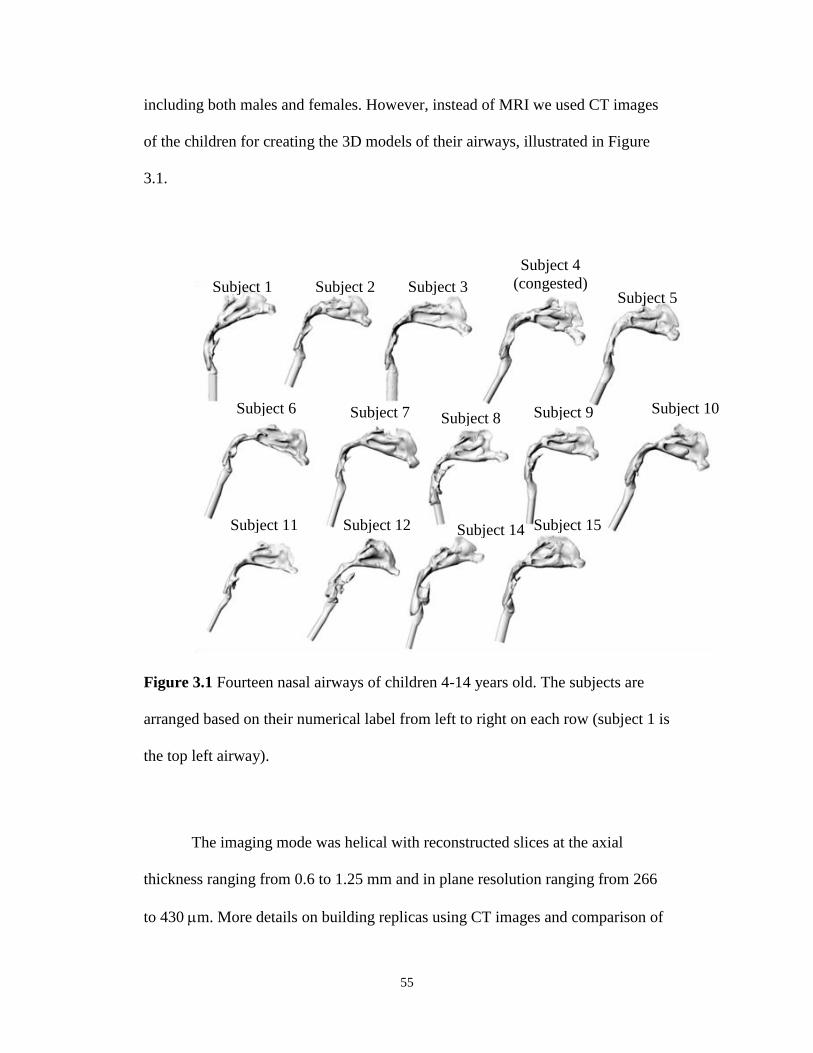
55
including both males and females. However, instead of MRI we used CT images
of the children for creating the 3D models of their airways, illustrated in Figure
3.1.
Figure 3.1 Fourteen nasal airways of children 4-14 years old. The subjects are
arranged based on their numerical label from left to right on each row (subject 1 is
the top left airway).
The imaging mode was helical with reconstructed slices at the axial
thickness ranging from 0.6 to 1.25 mm and in plane resolution ranging from 266
to 430 m. More details on building replicas using CT images and comparison of
Subject 1 Subject 2 Subject 3
Subject 4
(congested)
Subject 5
Subject 6 Subject 7 Subject 8 Subject 9 Subject 10
Subject 11 Subject 12 Subject 14 Subject 15
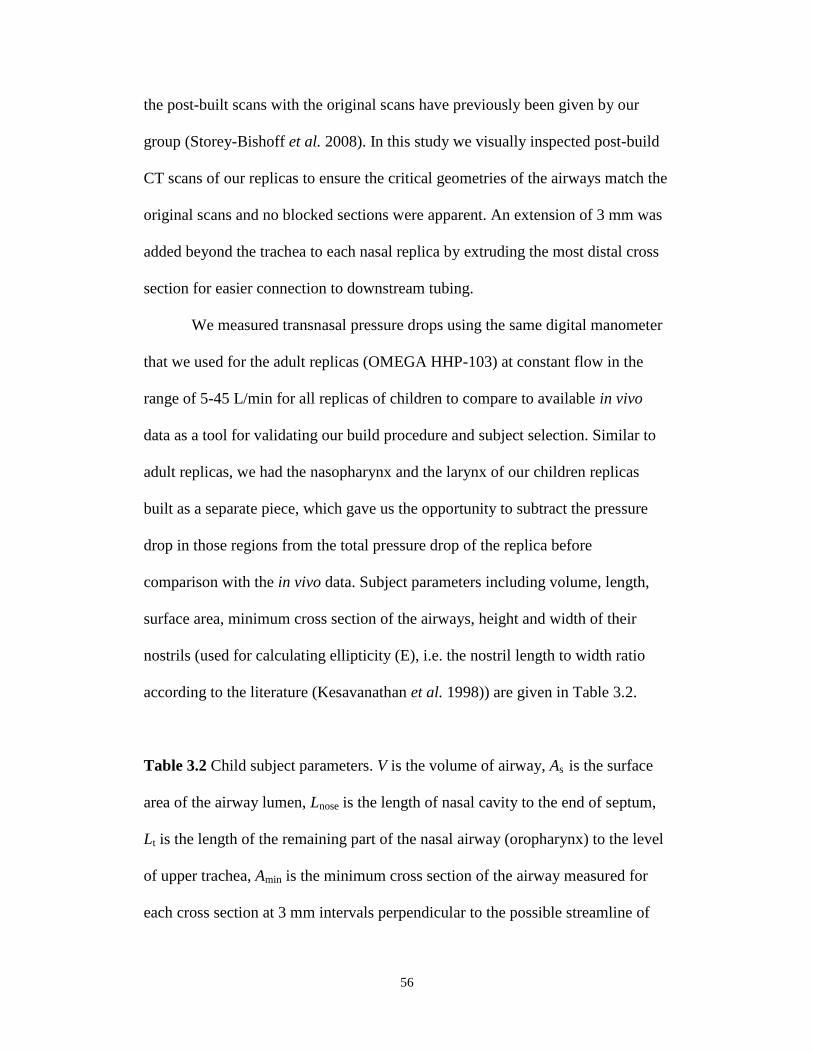
56
the post-built scans with the original scans have previously been given by our
group (Storey-Bishoff et al. 2008). In this study we visually inspected post-build
CT scans of our replicas to ensure the critical geometries of the airways match the
original scans and no blocked sections were apparent. An extension of 3 mm was
added beyond the trachea to each nasal replica by extruding the most distal cross
section for easier connection to downstream tubing.
We measured transnasal pressure drops using the same digital manometer
that we used for the adult replicas (OMEGA HHP-103) at constant flow in the
range of 5-45 L/min for all replicas of children to compare to available in vivo
data as a tool for validating our build procedure and subject selection. Similar to
adult replicas, we had the nasopharynx and the larynx of our children replicas
built as a separate piece, which gave us the opportunity to subtract the pressure
drop in those regions from the total pressure drop of the replica before
comparison with the in vivo data. Subject parameters including volume, length,
surface area, minimum cross section of the airways, height and width of their
nostrils (used for calculating ellipticity (E), i.e. the nostril length to width ratio
according to the literature (Kesavanathan et al. 1998)) are given in Table 3.2.
Table 3.2 Child subject parameters. V is the volume of airway, As is the surface
area of the airway lumen, Lnose is the length of nasal cavity to the end of septum,
Lt is the length of the remaining part of the nasal airway (oropharynx) to the level
of upper trachea, Amin is the minimum cross section of the airway measured for
each cross section at 3 mm intervals perpendicular to the possible streamline of
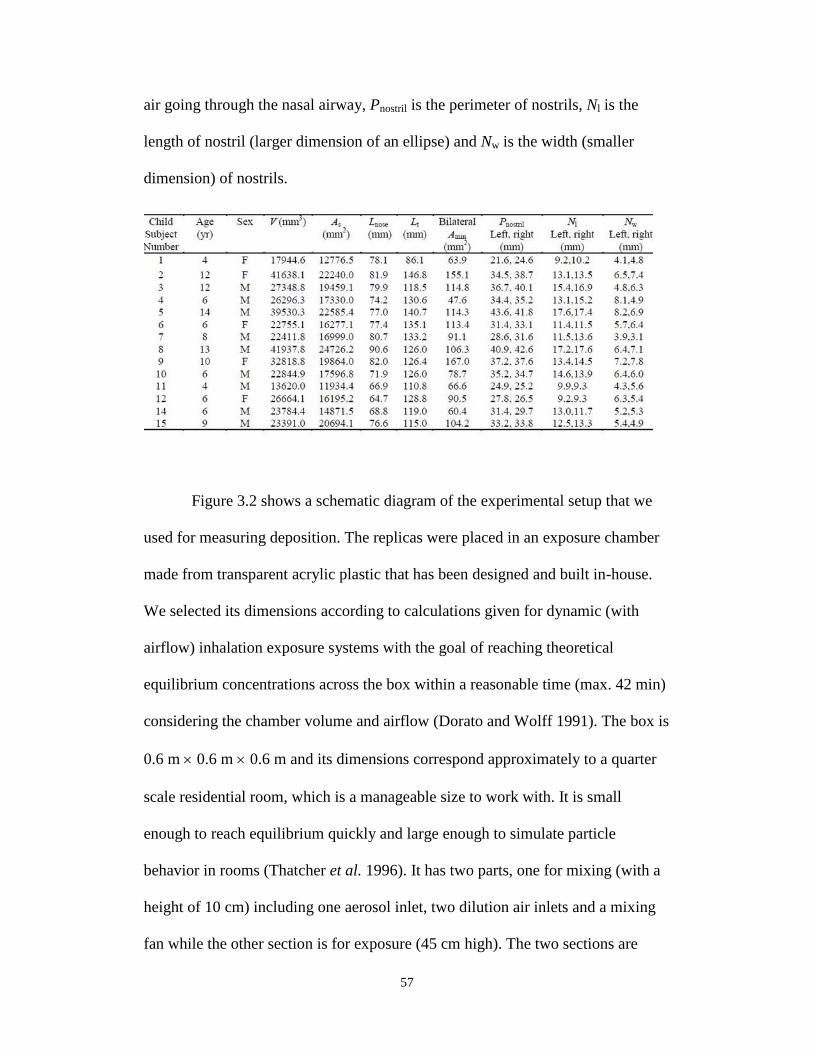
57
air going through the nasal airway, Pnostril is the perimeter of nostrils, Nl is the
length of nostril (larger dimension of an ellipse) and Nw is the width (smaller
dimension) of nostrils.
Figure 3.2 shows a schematic diagram of the experimental setup that we
used for measuring deposition. The replicas were placed in an exposure chamber
made from transparent acrylic plastic that has been designed and built in-house.
We selected its dimensions according to calculations given for dynamic (with
airflow) inhalation exposure systems with the goal of reaching theoretical
equilibrium concentrations across the box within a reasonable time (max. 42 min)
considering the chamber volume and airflow (Dorato and Wolff 1991). The box is
0.6 m 0.6 m 0.6 m and its dimensions correspond approximately to a quarter
scale residential room, which is a manageable size to work with. It is small
enough to reach equilibrium quickly and large enough to simulate particle
behavior in rooms (Thatcher et al. 1996). It has two parts, one for mixing (with a
height of 10 cm) including one aerosol inlet, two dilution air inlets and a mixing
fan while the other section is for exposure (45 cm high). The two sections are
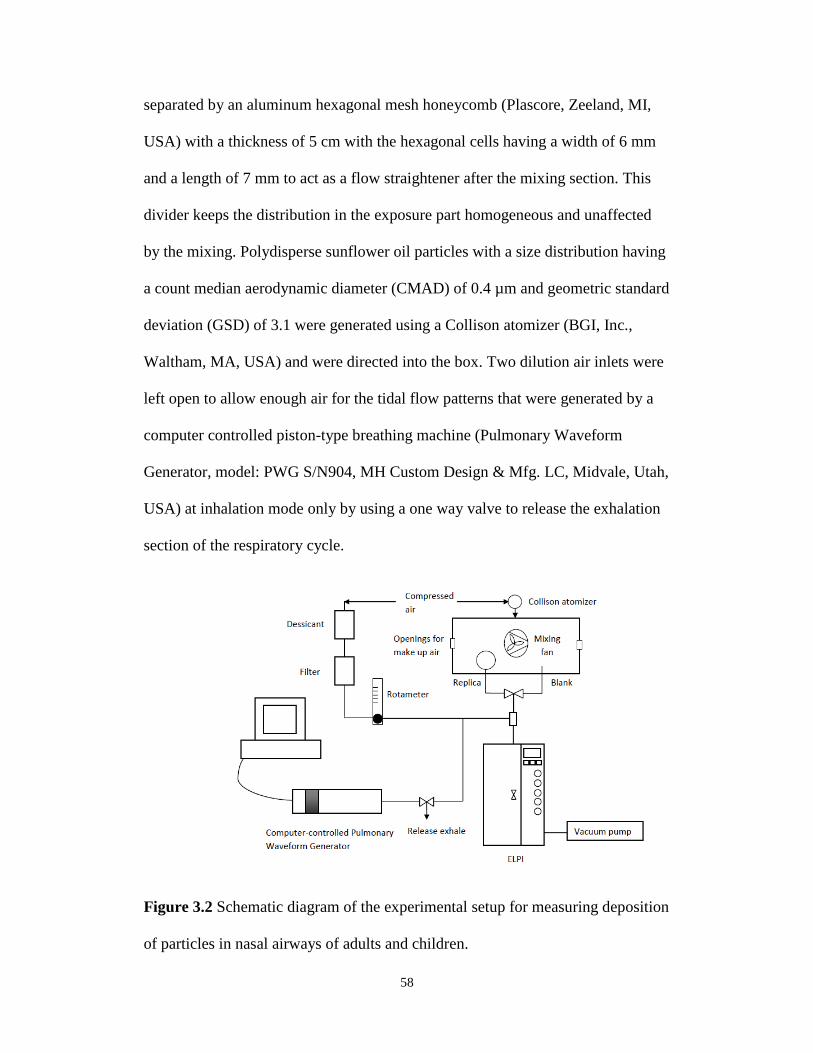
58
separated by an aluminum hexagonal mesh honeycomb (Plascore, Zeeland, MI,
USA) with a thickness of 5 cm with the hexagonal cells having a width of 6 mm
and a length of 7 mm to act as a flow straightener after the mixing section. This
divider keeps the distribution in the exposure part homogeneous and unaffected
by the mixing. Polydisperse sunflower oil particles with a size distribution having
a count median aerodynamic diameter (CMAD) of 0.4 µm and geometric standard
deviation (GSD) of 3.1 were generated using a Collison atomizer (BGI, Inc.,
Waltham, MA, USA) and were directed into the box. Two dilution air inlets were
left open to allow enough air for the tidal flow patterns that were generated by a
computer controlled piston-type breathing machine (Pulmonary Waveform
Generator, model: PWG S/N904, MH Custom Design & Mfg. LC, Midvale, Utah,
USA) at inhalation mode only by using a one way valve to release the exhalation
section of the respiratory cycle.
Figure 3.2 Schematic diagram of the experimental setup for measuring deposition
of particles in nasal airways of adults and children.
59
Four types of sinusoidal physiological breathing patterns for the children
at the two age groups of 5.5-12 and 12-15 years old at two different levels of
activity (i.e. at rest and moderate exercise) were generated using the breathing
machine according to the data given in the literature (Becquemin et al. 1991;
Bennett et al. 2008). The tidal volume (Vt) and breathing frequency for each
simulated subject were measured based on recorded flow using a digital mass
flow meter (Model 4043, TSI, Inc., St.Paul, MN, USA) downstream of each
replica individually when the atomizer was not on and there was no aerosol in the
box. On average the following breathing patterns were used: 1) 22.6± 0.07
breaths/min (bpm) and tidal volume Vt =0.215±0.017 L, 2) 17.7± 0.07 bpm and
tidal volume Vt =0.360±0.031 L, 3) 29.4± 0.16 bpm and tidal volume Vt
=0.313±0.034 L, and 4) 24.6± 0.15 bpm and tidal volume Vt =0.498±0.058 L.
In the same setup, deposition of micrometer-sized particles in our five
adult replicas was measured while a tidal flow pattern was passed through the
replicas. For the adult replicas, the tidal volume and breathing frequency were
determined using the recorded breathing patterns downstream of each replica.
Average tidal volume for the adult replicas was 0.385±0.009 L and average
breathing frequency was 14.8±0.045 bpm.
Samples were taken from the box using a tube with no replica and
alternatively using a tube that was connected to the replica. A gate valve was used
for switching the sampling line between the two lines at one minute intervals with
a one minute stabilizing time after each switch used to exclude the effect of the
valve on the sampled concentration after switching the valve. Each single test was
60
5 minutes: one minute from the blank line, one minute stabilizing time, one
minute from the replica line, one minute stabilizing and a second one minute
sample from the blank line. It should be noted that prior to each set of
experiments with a new replica the uniformity of the concentration between the
two points in the chamber were checked: one at the nostrils and one at the point
where the sample was taken with the blank line. Also, the stability of the
atomizer’s output was examined for each experiment and no drift was noticed
within the time of each experiment (i.e. 5 minutes). The samples were drawn into
a manifold where an inlet of filtered dried dilution air on the side provided the
additional flow needed for the Electrical Low Pressure Impactor (ELPI)
(DEKATI, Tampere, Finland), followed by an outlet vertically down to the ELPI.
The ELPI was used for size and concentration measurements. The amount of
make up air for the ELPI (approx. 30 L/min, controlled by keeping a rotameter at
a certain reading that was calibrated using Model 4043 TSI mass flow meter) was
adjusted by checking that zero flow occurred through the box when the breathing
machine was off. There was a three way connection on the way to breathing
machine with one limb including the dilution line providing the sampling flow to
ELPI, one limb to the breathing machine and one limb to the manifold upstream
of the ELPI unit. Average number concentration of the blank line (C1) and replica
line (C2) were obtained using the concentration profiles recorded at 40,000 fA
with the application of ELPIVI 4.0 software including corrections for diffusion
and particle bounce provided by Dekati Ltd. (Tampere, Finland). Deposition in
the replicas for particles smaller than 0.5 m in diameter, as far as diffusion was
61
not their dominant deposition mechanism, was close to zero and the number of
particles larger than 5.3 m was not large enough to allow meaningful data
analysis; thus, we only used the concentration data for the ELPI stages with
aerodynamic cut sizes within 0.5- 5.3 m.
Due to additional flow resistance in the replica, corrections have been
made to the particle counts measured via the blank line by multiplying the
average concentration of samples taken via the blank line (C1) by a correction
factor to correct for the difference between the particle count through the blank
line and the particle count of the sample that actually goes through the nostrils.
The correction factor was calculated for each subject and flow rate separately by
dividing the measured tidal volume of each subject at a given flow rate with the
sample line by the measured tidal volume with the blank line at the same flow
rate. Deposition efficiency () (equivalent to 1-penetration) was then determined
using the corrected C1 and C2, as follows:
1001
21
C
CC (3.1)
Five repetitions of each experiment have been used for each data point given in
the results. All the curve fits were done based on least squares using functions
available in the statistical toolbox of MATLAB. Student t-tests were used to
determine significance with =0.05.
62
3.3. Results and Discussion
Before we present our data, it is useful to first provide an outline of what
follows. We begin by first comparing transnasal pressure drops of our replicas
with in vivo pressure drop data available for both adults and children, in order to
validate the build procedure we followed for making our replicas, since a direct
relation between deposition and pressure drop is proposed in an in vivo study with
adult subjects by Hounam et al. (1971). Next, due to the scarcity of in vivo data
for children, we will compare deposition in our adult replicas with the in vivo data
available for adults in order to assure ourselves of the close proximity of our in
vitro data measurement with the in vivo measurements. Furthermore, we will
compare the few in vivo deposition datapoints for children that are available for
limited particle sizes with our systematically obtained in vitro data with children
replicas. Next, we will initially examine the possibility of reducing intersubject
variability with the application of dimensional deposition parameters that have
previously been proposed by other researchers such as impaction parameter
(da2Q) and a deposition parameter that includes transnasal pressure drop (da
2∆p).
Subsequently, we examine possible non-dimensionalized correlations that can be
used for predicting deposition of aerosols with different particle sizes inhaled by
children during different activity levels in a more general setting. This includes
exploration of the applicability of multiple characteristic diameters, on the basis
of anatomical dimensions of our replicas, in an equation that includes
theoretically relevant non-dimensional numbers such as Reynolds and Stokes
numbers. To emphasize that our proposed dimensionless correlation can only be
63
used to predict average amount of particle deposition in an anatomically normal
population, we will look at a single anatomically abnormal replica. Finally, we
will compare deposition within different age groups (i.e. infants, children, and
adults).
3.3.1. Method Validation
3.3. 1.1. Transnasal Pressure Drop Values
The transnasal pressure drop data measured for our adult replicas (i.e.
excluding the larynx and nasopharynx) were compared with in vivo and in vitro
data given in the literature. The transnasal pressure drop for 24 subjects is given
in an in vivo study by Hounam (1971) in the range 0.021-0.447 kPa at 20 L/min.
At the same flow rate (i.e. 20 L/min) the range of pressure drop in an in vitro
study by Garcia et al. (2009) is given in the range of 14-43 Pa for four healthy
adults and for our adult replicas at 20 L/min the transnasal pressure drop
(excluding the larynx and pharynx) is 0.028-0.042 kPa, which is in the range of
the aforementioned studies. From the ten adult replicas, five subjects were
selected for deposition measurements in order to span the range of pressure drop,
as noted earlier.
Transnasal pressure drop across our children replicas (excluding the
larynx and pharynx) were compared with in vivo data given by Becquemin et al.
(1991), which is in the range of 0.012-0.449 (mean=0.105, stdev=0.115) kPa (at
rest) to 0.076-1.097 (mean=0.256, stdev=0.306) (at moderate exercise) kPa for the
range of flow rate that was in our interest. Our data approximately lie within the
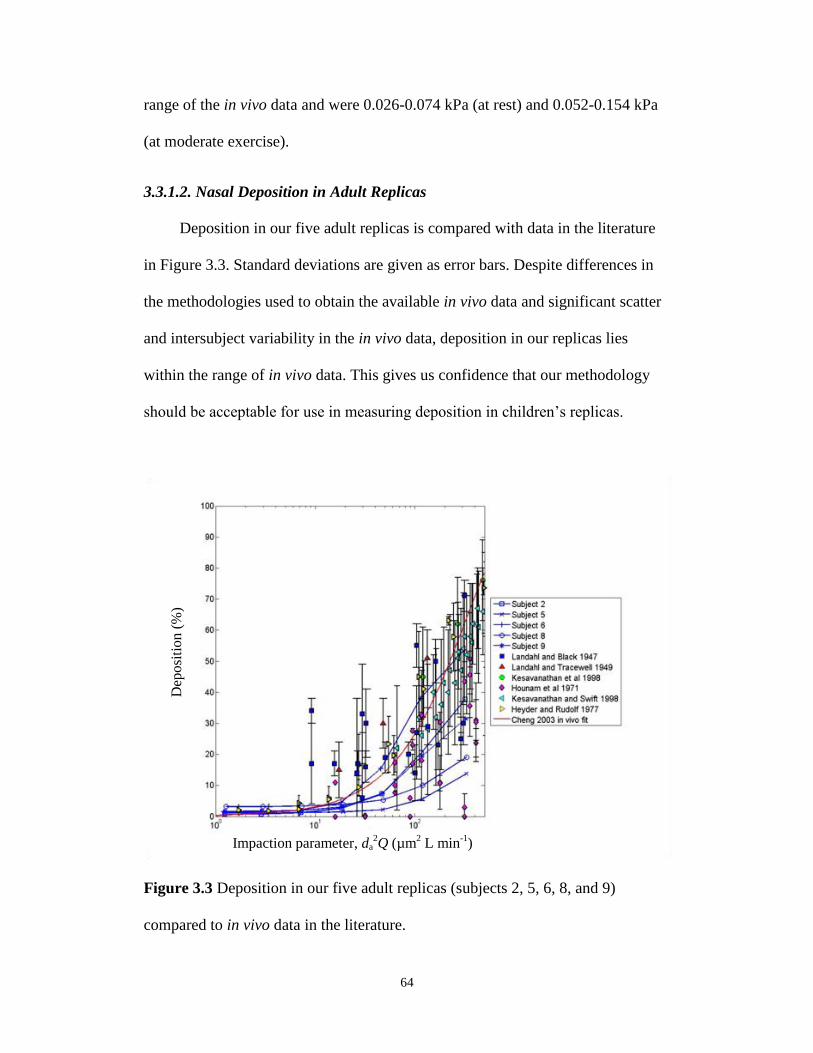
64
range of the in vivo data and were 0.026-0.074 kPa (at rest) and 0.052-0.154 kPa
(at moderate exercise).
3.3.1.2. Nasal Deposition in Adult Replicas
Deposition in our five adult replicas is compared with data in the literature
in Figure 3.3. Standard deviations are given as error bars. Despite differences in
the methodologies used to obtain the available in vivo data and significant scatter
and intersubject variability in the in vivo data, deposition in our replicas lies
within the range of in vivo data. This gives us confidence that our methodology
should be acceptable for use in measuring deposition in children’s replicas.
Figure 3.3 Deposition in our five adult replicas (subjects 2, 5, 6, 8, and 9)
compared to in vivo data in the literature.
Impaction parameter, da2Q (µm
2 L min
-1)
Dep
osi
tion (
%)
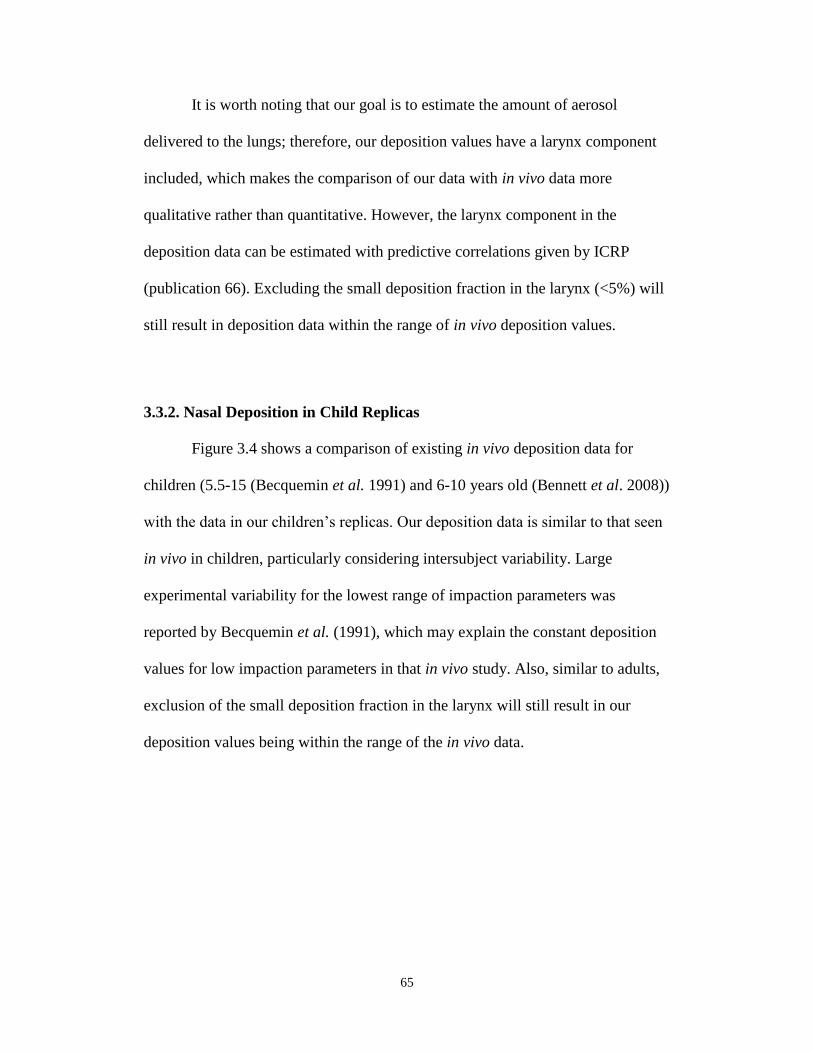
65
It is worth noting that our goal is to estimate the amount of aerosol
delivered to the lungs; therefore, our deposition values have a larynx component
included, which makes the comparison of our data with in vivo data more
qualitative rather than quantitative. However, the larynx component in the
deposition data can be estimated with predictive correlations given by ICRP
(publication 66). Excluding the small deposition fraction in the larynx (<5%) will
still result in deposition data within the range of in vivo deposition values.
3.3.2. Nasal Deposition in Child Replicas
Figure 3.4 shows a comparison of existing in vivo deposition data for
children (5.5-15 (Becquemin et al. 1991) and 6-10 years old (Bennett et al. 2008))
with the data in our children’s replicas. Our deposition data is similar to that seen
in vivo in children, particularly considering intersubject variability. Large
experimental variability for the lowest range of impaction parameters was
reported by Becquemin et al. (1991), which may explain the constant deposition
values for low impaction parameters in that in vivo study. Also, similar to adults,
exclusion of the small deposition fraction in the larynx will still result in our
deposition values being within the range of the in vivo data.
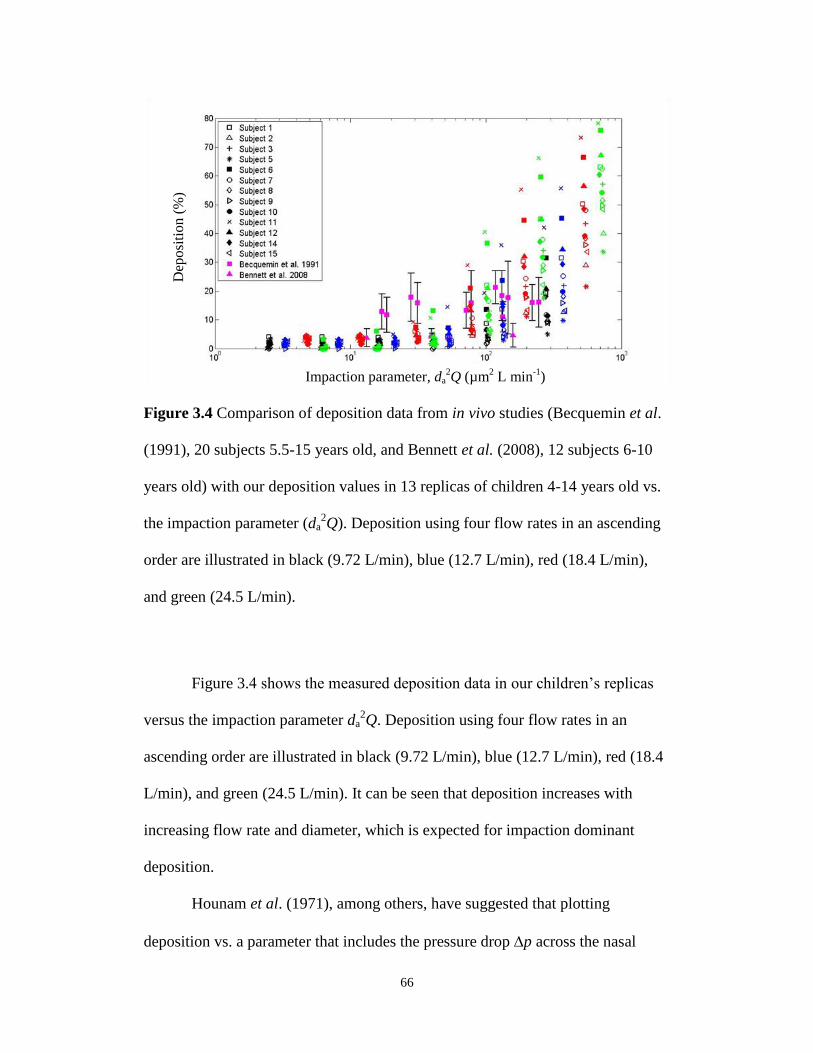
66
Figure 3.4 Comparison of deposition data from in vivo studies (Becquemin et al.
(1991), 20 subjects 5.5-15 years old, and Bennett et al. (2008), 12 subjects 6-10
years old) with our deposition values in 13 replicas of children 4-14 years old vs.
the impaction parameter (da2Q). Deposition using four flow rates in an ascending
order are illustrated in black (9.72 L/min), blue (12.7 L/min), red (18.4 L/min),
and green (24.5 L/min).
Figure 3.4 shows the measured deposition data in our children’s replicas
versus the impaction parameter da2Q. Deposition using four flow rates in an
ascending order are illustrated in black (9.72 L/min), blue (12.7 L/min), red (18.4
L/min), and green (24.5 L/min). It can be seen that deposition increases with
increasing flow rate and diameter, which is expected for impaction dominant
deposition.
Hounam et al. (1971), among others, have suggested that plotting
deposition vs. a parameter that includes the pressure drop p across the nasal
Impaction parameter, da2Q (µm
2 L min
-1)
Dep
osi
tio
n (
%)
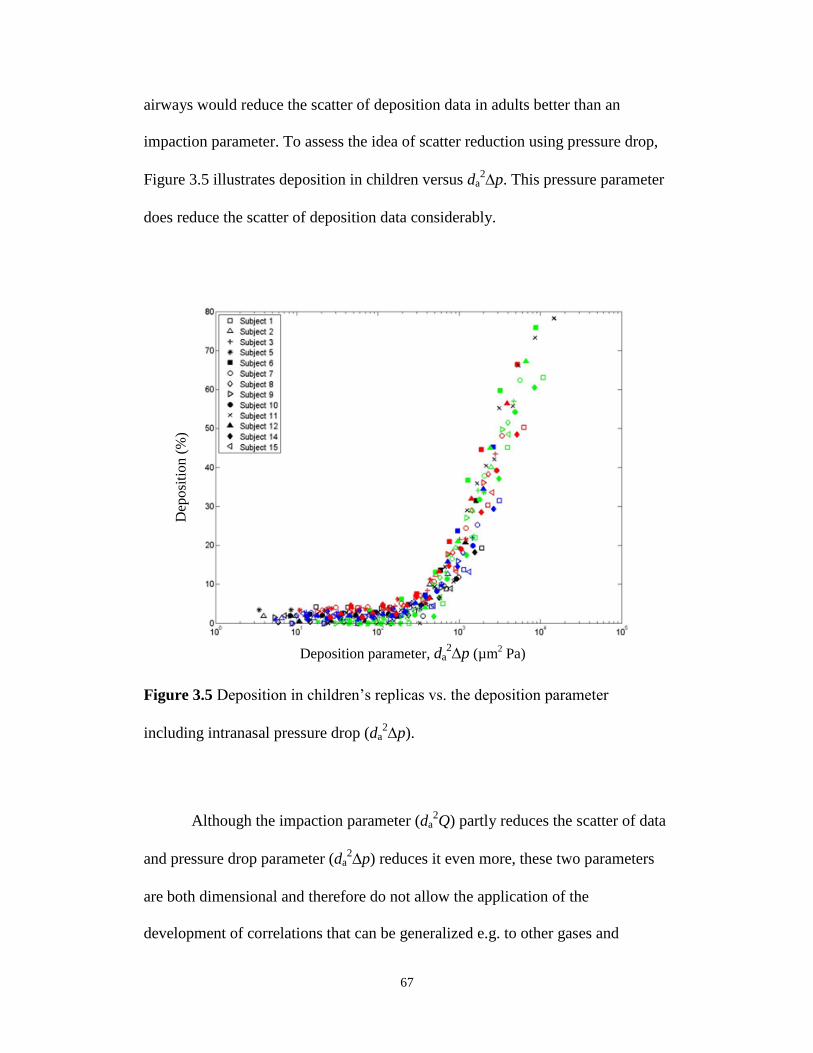
67
airways would reduce the scatter of deposition data in adults better than an
impaction parameter. To assess the idea of scatter reduction using pressure drop,
Figure 3.5 illustrates deposition in children versus da2p. This pressure parameter
does reduce the scatter of deposition data considerably.
Figure 3.5 Deposition in children’s replicas vs. the deposition parameter
including intranasal pressure drop (da2p).
Although the impaction parameter (da2Q) partly reduces the scatter of data
and pressure drop parameter (da2p) reduces it even more, these two parameters
are both dimensional and therefore do not allow the application of the
development of correlations that can be generalized e.g. to other gases and
Dep
osi
tion (
%)
Deposition parameter, da2p (µm
2 Pa)
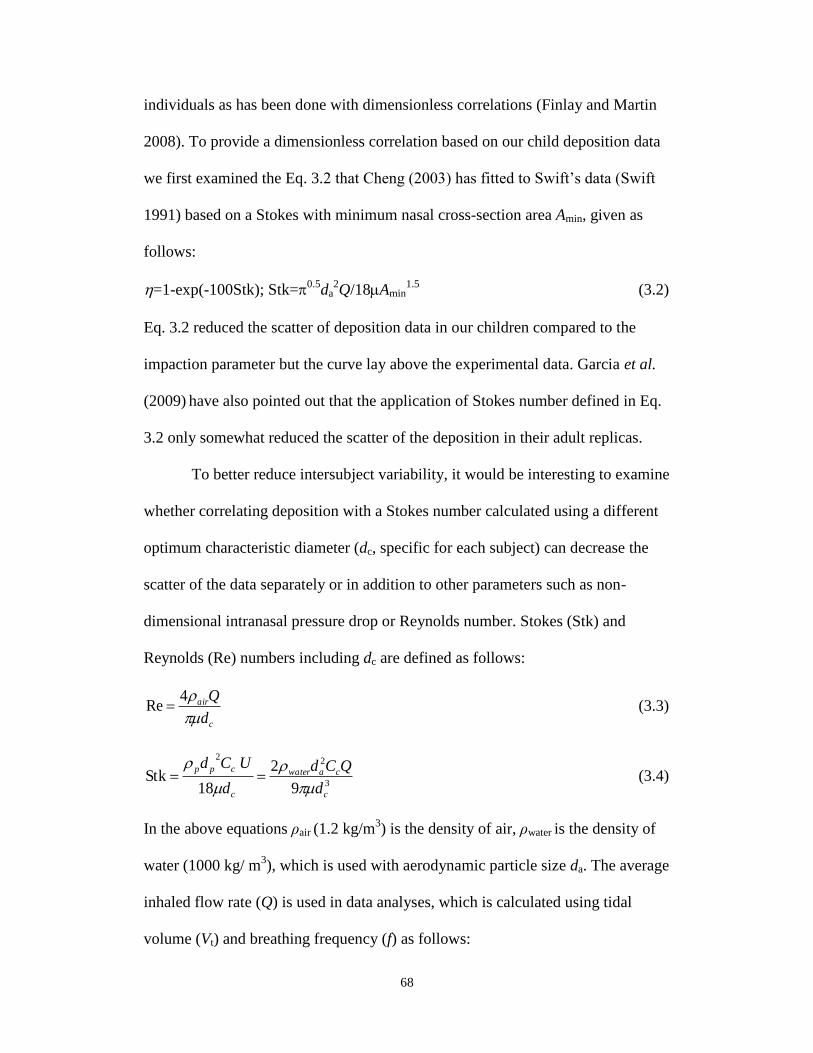
68
individuals as has been done with dimensionless correlations (Finlay and Martin
2008). To provide a dimensionless correlation based on our child deposition data
we first examined the Eq. 3.2 that Cheng (2003) has fitted to Swift’s data (Swift
1991) based on a Stokes with minimum nasal cross-section area Amin, given as
follows:
=1-exp(-100Stk); Stk=0.5
da2Q/18Amin
1.5 (3.2)
Eq. 3.2 reduced the scatter of deposition data in our children compared to the
impaction parameter but the curve lay above the experimental data. Garcia et al.
(2009) have also pointed out that the application of Stokes number defined in Eq.
3.2 only somewhat reduced the scatter of the deposition in their adult replicas.
To better reduce intersubject variability, it would be interesting to examine
whether correlating deposition with a Stokes number calculated using a different
optimum characteristic diameter (dc, specific for each subject) can decrease the
scatter of the data separately or in addition to other parameters such as non-
dimensional intranasal pressure drop or Reynolds number. Stokes (Stk) and
Reynolds (Re) numbers including dc are defined as follows:
c
air
d
Q
4Re
(3.3)
3
22
9
2
18Stk
c
cawater
c
cpp
d
QCd
d
UCd
(3.4)
In the above equations ρair (1.2 kg/m3) is the density of air, ρwater is the density of
water (1000 kg/ m3), which is used with aerodynamic particle size da. The average
inhaled flow rate (Q) is used in data analyses, which is calculated using tidal
volume (Vt) and breathing frequency (f) as follows:
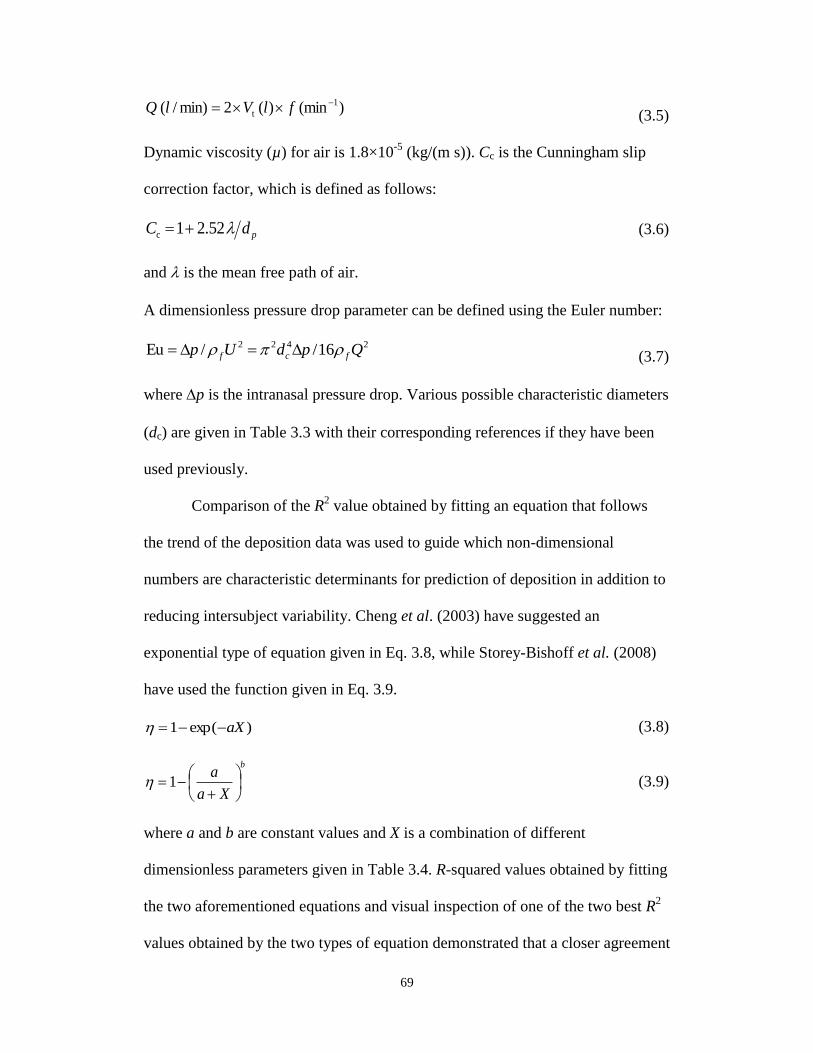
69
)(min)(2min)/( 1
t
flVlQ (3.5)
Dynamic viscosity (µ) for air is 1.8×10⁻⁵
(kg/(m s)). Cc is the Cunningham slip
correction factor, which is defined as follows:
pdC 52.21c
(3.6)
and is the mean free path of air.
A dimensionless pressure drop parameter can be defined using the Euler number:
2422 16//Eu QpdUp fcf (3.7)
where p is the intranasal pressure drop. Various possible characteristic diameters
(dc) are given in Table 3.3 with their corresponding references if they have been
used previously.
Comparison of the R2 value obtained by fitting an equation that follows
the trend of the deposition data was used to guide which non-dimensional
numbers are characteristic determinants for prediction of deposition in addition to
reducing intersubject variability. Cheng et al. (2003) have suggested an
exponential type of equation given in Eq. 3.8, while Storey-Bishoff et al. (2008)
have used the function given in Eq. 3.9.
)exp(1 aX (3.8)
b
Xa
a
1 (3.9)
where a and b are constant values and X is a combination of different
dimensionless parameters given in Table 3.4. R-squared values obtained by fitting
the two aforementioned equations and visual inspection of one of the two best R2
values obtained by the two types of equation demonstrated that a closer agreement
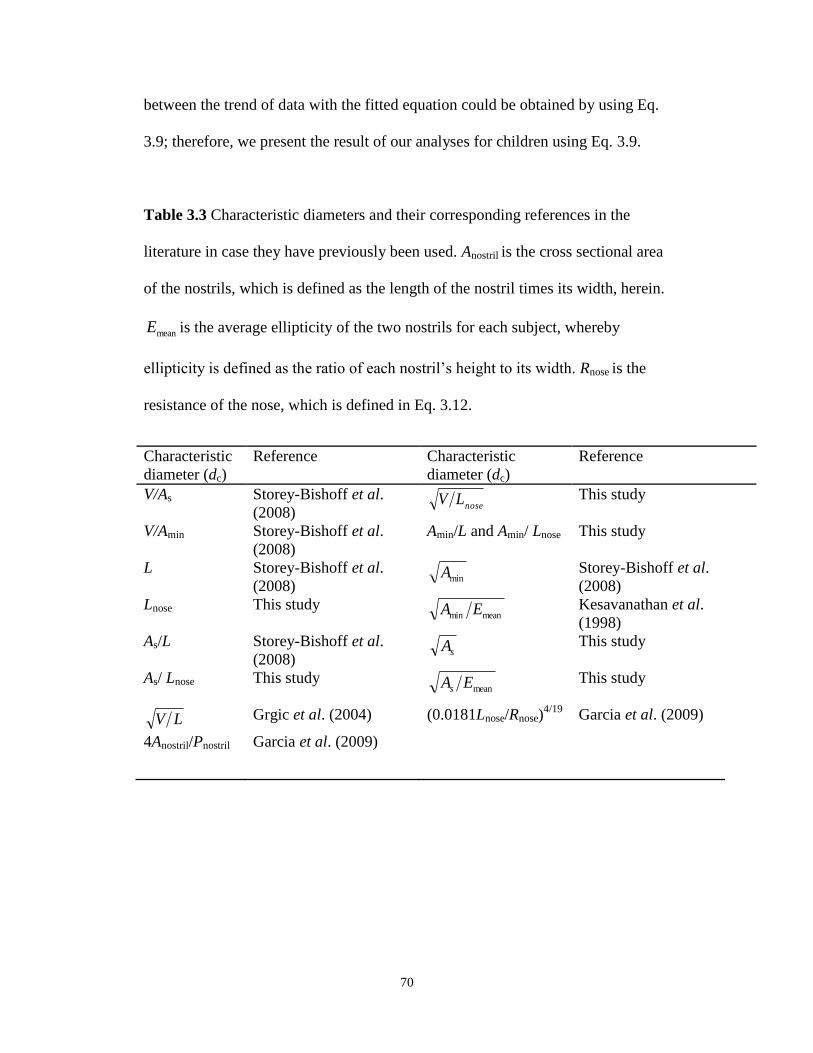
70
between the trend of data with the fitted equation could be obtained by using Eq.
3.9; therefore, we present the result of our analyses for children using Eq. 3.9.
Table 3.3 Characteristic diameters and their corresponding references in the
literature in case they have previously been used. Anostril is the cross sectional area
of the nostrils, which is defined as the length of the nostril times its width, herein.
meanE is the average ellipticity of the two nostrils for each subject, whereby
ellipticity is defined as the ratio of each nostril’s height to its width. Rnose is the
resistance of the nose, which is defined in Eq. 3.12.
Characteristic
diameter (dc)
Reference Characteristic
diameter (dc)
Reference
V/As Storey-Bishoff et al.
(2008) nose
LV This study
V/Amin Storey-Bishoff et al.
(2008)
Amin/L and Amin/ Lnose This study
L Storey-Bishoff et al.
(2008) minA Storey-Bishoff et al.
(2008)
Lnose This study meanmin EA Kesavanathan et al.
(1998)
As/L Storey-Bishoff et al.
(2008) sA This study
As/ Lnose This study meanEAs This study
LV Grgic et al. (2004) (0.0181Lnose/Rnose)4/19
Garcia et al. (2009)
4Anostril/Pnostril Garcia et al. (2009)
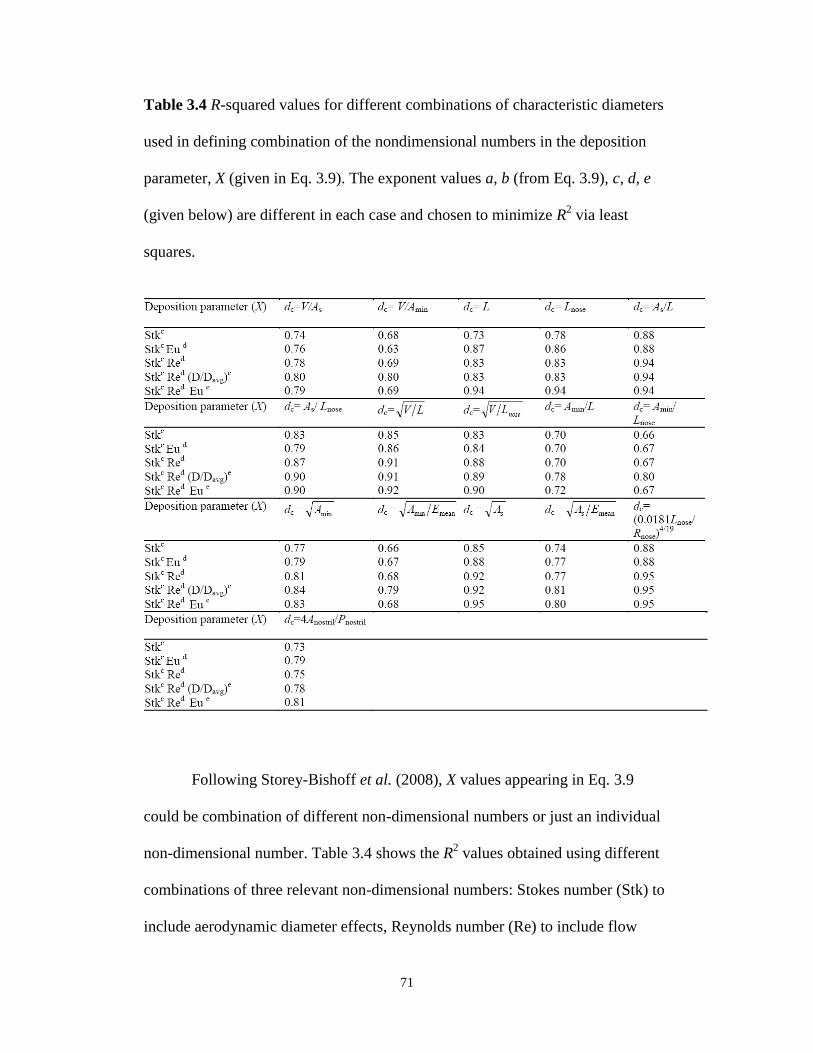
71
Table 3.4 R-squared values for different combinations of characteristic diameters
used in defining combination of the nondimensional numbers in the deposition
parameter, X (given in Eq. 3.9). The exponent values a, b (from Eq. 3.9), c, d, e
(given below) are different in each case and chosen to minimize R2 via least
squares.
Following Storey-Bishoff et al. (2008), X values appearing in Eq. 3.9
could be combination of different non-dimensional numbers or just an individual
non-dimensional number. Table 3.4 shows the R2 values obtained using different
combinations of three relevant non-dimensional numbers: Stokes number (Stk) to
include aerodynamic diameter effects, Reynolds number (Re) to include flow
72
effects and Euler number (Eu) to include the dependence of deposition values on
intranasal pressure drop that was seen in Figure 3.5.
Table 3.4 demonstrates that the addition of Euler number and the ratio of
characteristic diameter D over the average diameter Davg to the combination of
Stokes and Reynolds numbers do not improve the fit significantly. Thus for
simplicity of the proposed correlating equation we will not consider these
parameters further.
We have also compared deposition in our children replicas at four
constant flow rates vs. the four unsteady breathing patterns that have average flow
rate similar to the constant values. Although deposition under unsteady breathing
was consistently slightly higher than at constant flow rate (except at the highest
flow rate in the subject with the maximum intranasal pressure drop), the
difference between the two patterns was not statistically significant (P>0.05).
Therefore, we did not examine the use of a dimensionless number, such as
Womersley number, that has a component of breathing frequency in it. It is worth
mentioning that Reynolds, Euler, and Womersley numbers that we considered
herein come from the non-dimensionalized Navier-Stokes equation, whereas
Stokes number comes from the non-dimensionalized particle equation of motion.
The characteristic diameter defined by Garcia et al. (2009), which results
in the highest R2 value, includes transnasal pressure drop. The considerable
reduction in scatter of the data with the application of pressure drop has also
previously been illustrated in Figure 3.5. Equation 3.10, gives the form of an
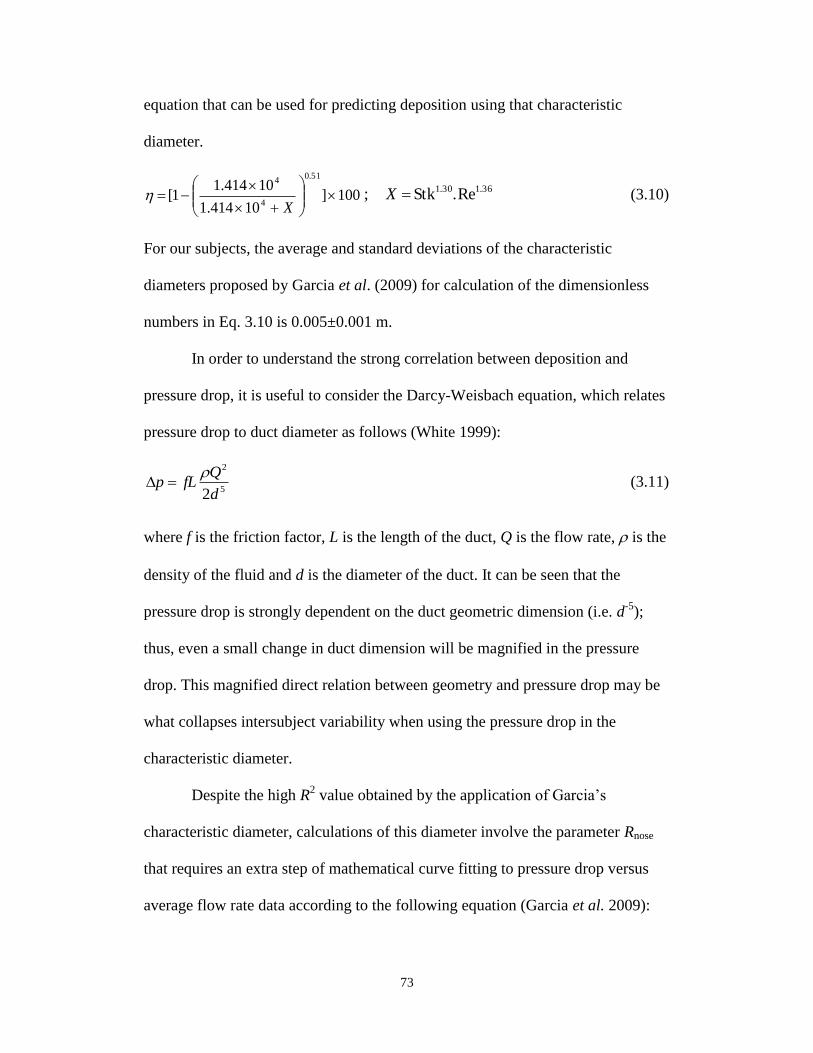
73
equation that can be used for predicting deposition using that characteristic
diameter.
100]10414.1
10414.11[
51.0
4
4
X
36.130.1 Re.Stk; X (3.10)
For our subjects, the average and standard deviations of the characteristic
diameters proposed by Garcia et al. (2009) for calculation of the dimensionless
numbers in Eq. 3.10 is 0.005±0.001 m.
In order to understand the strong correlation between deposition and
pressure drop, it is useful to consider the Darcy-Weisbach equation, which relates
pressure drop to duct diameter as follows (White 1999):
5
2
2d
QfLp
(3.11)
where f is the friction factor, L is the length of the duct, Q is the flow rate, is the
density of the fluid and d is the diameter of the duct. It can be seen that the
pressure drop is strongly dependent on the duct geometric dimension (i.e. d-5
);
thus, even a small change in duct dimension will be magnified in the pressure
drop. This magnified direct relation between geometry and pressure drop may be
what collapses intersubject variability when using the pressure drop in the
characteristic diameter.
Despite the high R2 value obtained by the application of Garcia’s
characteristic diameter, calculations of this diameter involve the parameter Rnose
that requires an extra step of mathematical curve fitting to pressure drop versus
average flow rate data according to the following equation (Garcia et al. 2009):
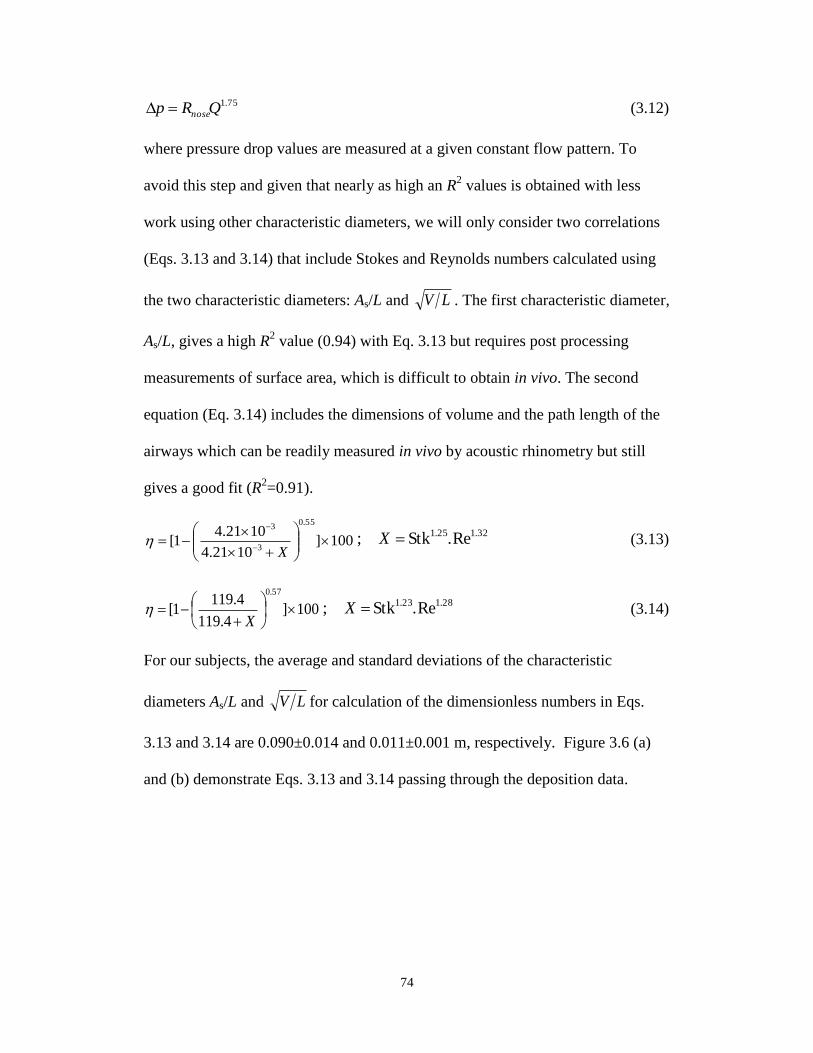
74
75.1QRp nose (3.12)
where pressure drop values are measured at a given constant flow pattern. To
avoid this step and given that nearly as high an R2 values is obtained with less
work using other characteristic diameters, we will only consider two correlations
(Eqs. 3.13 and 3.14) that include Stokes and Reynolds numbers calculated using
the two characteristic diameters: As/L and LV . The first characteristic diameter,
As/L, gives a high R2 value (0.94) with Eq. 3.13 but requires post processing
measurements of surface area, which is difficult to obtain in vivo. The second
equation (Eq. 3.14) includes the dimensions of volume and the path length of the
airways which can be readily measured in vivo by acoustic rhinometry but still
gives a good fit (R2=0.91).
100]1021.4
1021.41[
55.0
3
3
X
32.125.1 Re.Stk; X (3.13)
100]4.119
4.1191[
57.0
X
28.123.1 Re.Stk; X (3.14)
For our subjects, the average and standard deviations of the characteristic
diameters As/L and LV for calculation of the dimensionless numbers in Eqs.
3.13 and 3.14 are 0.090±0.014 and 0.011±0.001 m, respectively. Figure 3.6 (a)
and (b) demonstrate Eqs. 3.13 and 3.14 passing through the deposition data.
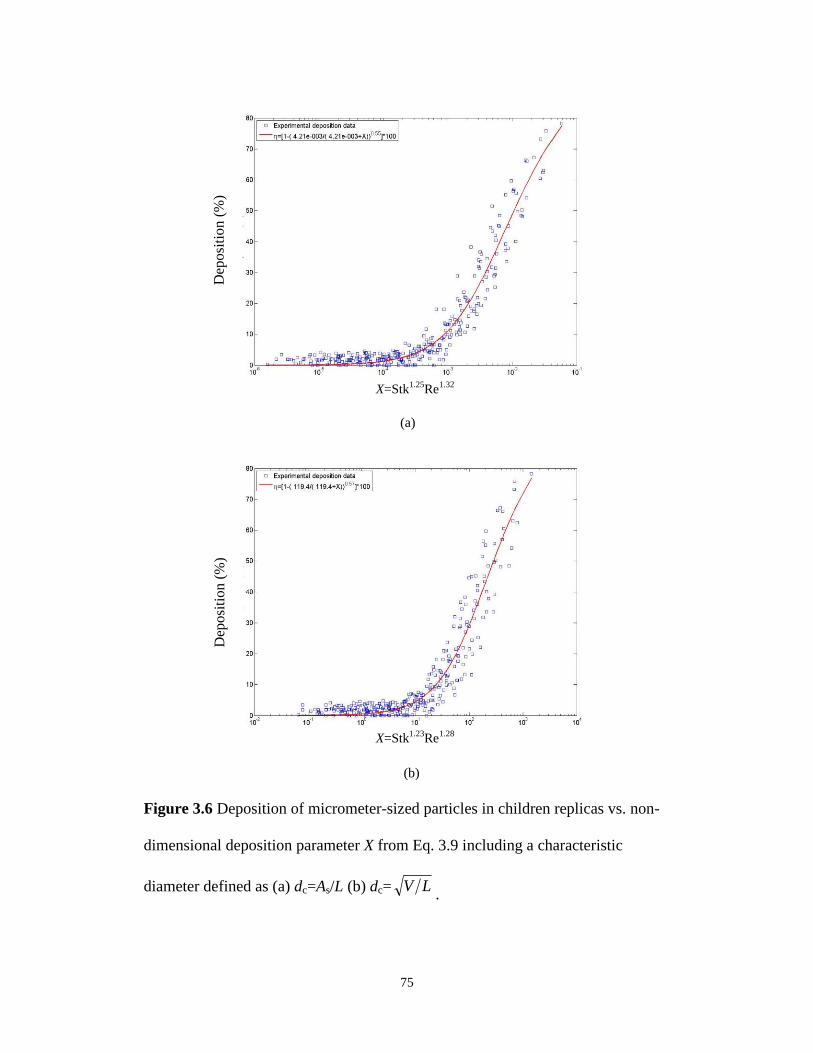
75
Figure 3.6 Deposition of micrometer-sized particles in children replicas vs. non-
dimensional deposition parameter X from Eq. 3.9 including a characteristic
diameter defined as (a) dc=As/L (b) dc= LV.
(a)
(b)
Fig. 6.
X=Stk1.25
Re1.32
X=Stk1.23
Re1.28
Dep
osi
tio
n (
%)
Dep
osi
tion (
%)
76
Note that the characteristic diameter As/L and LV that resulted in good
fits are the average perimeter and the average cross section of the nasal airways,
respectively. Both of these two diameters can be viewed as indicators of the
distance between central flow streamlines and the wall of the nasal airways. This
distance is directly correlated to the probability of deposition of particles by
impaction (i.e. the shorter the distance the higher the probability of deposition by
impaction), so that it is sensible that these characteristic diameters result in good
collapse of the data.
3.3.3. Comparison of Deposition in Normal vs. Congested Nose
In addition to the thirteen healthy subjects that we have identified based on
similarity between their intranasal pressure drop and the in vivo pressure drop
values, we also had an additional replica of an individual (subject 4), which had
an unusually high pressure drop. By examining a post build scan we knew that
there was no residual wax build up in the replica and that abnormalities in the
airways were apparent in the original in vivo scan as well. The abnormalities in
this subject’s airways are believed to have been due to congestion of the airways
in that subject since isolated volumes of air were seen to be present surrounded by
mucus in the proximal nasal regions, a feature not seen in any other subject.
Deposition in this one congested replica of a six year old male is compared with
other healthy subjects in Figure 3.7(a). Deposition for the congested subject is
outside the range used to develop our proposed equations 3.13 and 3.14 and
caution should thus be used in the application of equations developed for normal
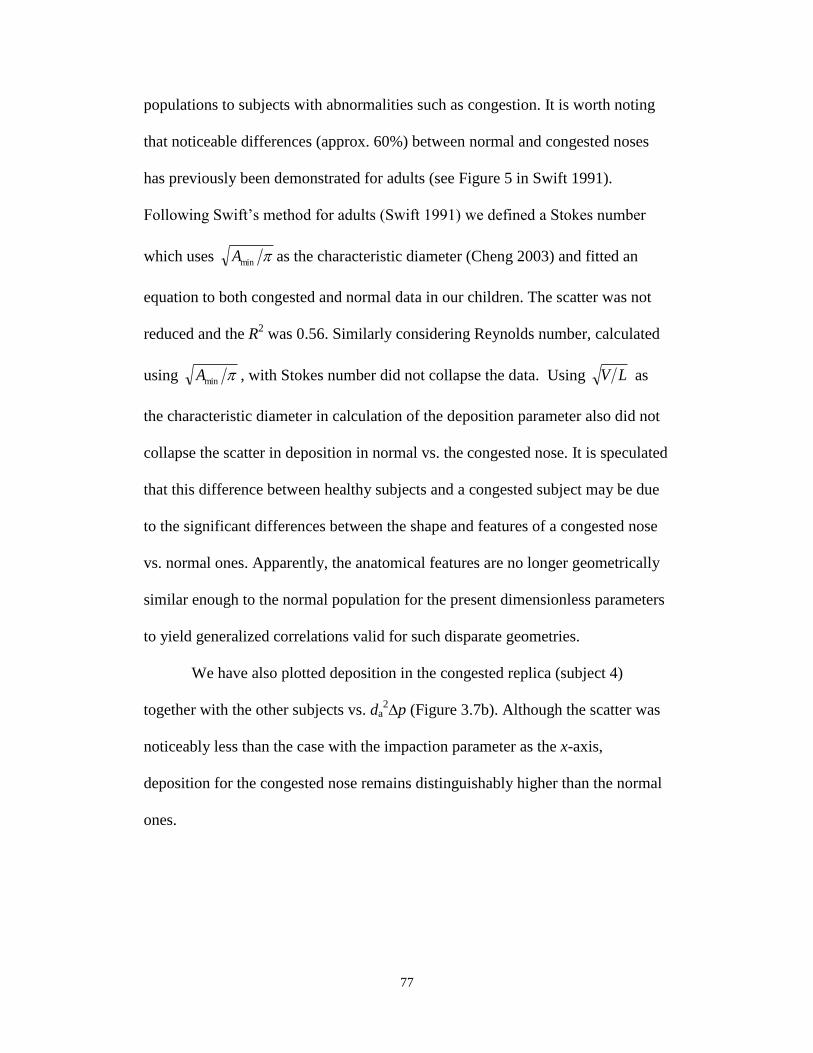
77
populations to subjects with abnormalities such as congestion. It is worth noting
that noticeable differences (approx. 60%) between normal and congested noses
has previously been demonstrated for adults (see Figure 5 in Swift 1991).
Following Swift’s method for adults (Swift 1991) we defined a Stokes number
which uses minA as the characteristic diameter (Cheng 2003) and fitted an
equation to both congested and normal data in our children. The scatter was not
reduced and the R2 was 0.56. Similarly considering Reynolds number, calculated
using minA , with Stokes number did not collapse the data. Using LV as
the characteristic diameter in calculation of the deposition parameter also did not
collapse the scatter in deposition in normal vs. the congested nose. It is speculated
that this difference between healthy subjects and a congested subject may be due
to the significant differences between the shape and features of a congested nose
vs. normal ones. Apparently, the anatomical features are no longer geometrically
similar enough to the normal population for the present dimensionless parameters
to yield generalized correlations valid for such disparate geometries.
We have also plotted deposition in the congested replica (subject 4)
together with the other subjects vs. da2∆p (Figure 3.7b). Although the scatter was
noticeably less than the case with the impaction parameter as the x-axis,
deposition for the congested nose remains distinguishably higher than the normal
ones.
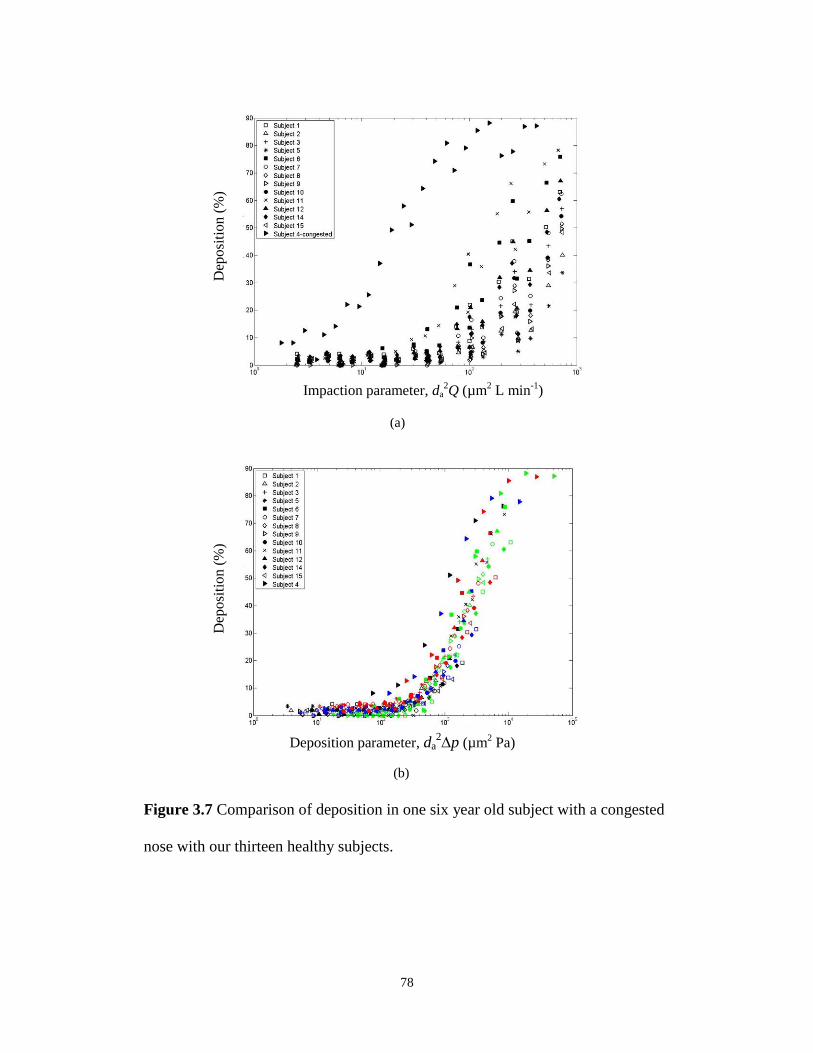
78
Figure 3.7 Comparison of deposition in one six year old subject with a congested
nose with our thirteen healthy subjects.
(a)
(b)
Fig. 7.
Impaction parameter, da2Q (µm
2 L min
-1)
Deposition parameter, da2p (µm
2 Pa)
Dep
osi
tio
n (
%)
Dep
osi
tion (
%)
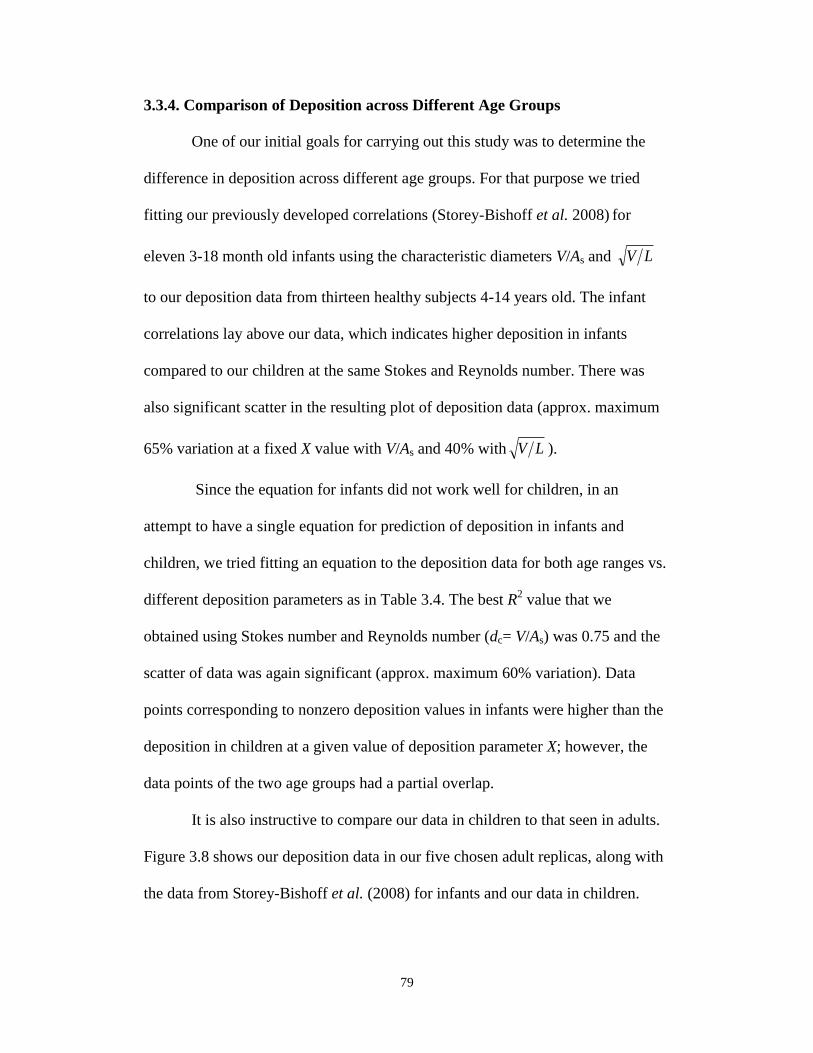
79
3.3.4. Comparison of Deposition across Different Age Groups
One of our initial goals for carrying out this study was to determine the
difference in deposition across different age groups. For that purpose we tried
fitting our previously developed correlations (Storey-Bishoff et al. 2008) for
eleven 3-18 month old infants using the characteristic diameters V/As and LV
to our deposition data from thirteen healthy subjects 4-14 years old. The infant
correlations lay above our data, which indicates higher deposition in infants
compared to our children at the same Stokes and Reynolds number. There was
also significant scatter in the resulting plot of deposition data (approx. maximum
65% variation at a fixed X value with V/As and 40% with LV ).
Since the equation for infants did not work well for children, in an
attempt to have a single equation for prediction of deposition in infants and
children, we tried fitting an equation to the deposition data for both age ranges vs.
different deposition parameters as in Table 3.4. The best R2 value that we
obtained using Stokes number and Reynolds number (dc= V/As) was 0.75 and the
scatter of data was again significant (approx. maximum 60% variation). Data
points corresponding to nonzero deposition values in infants were higher than the
deposition in children at a given value of deposition parameter X; however, the
data points of the two age groups had a partial overlap.
It is also instructive to compare our data in children to that seen in adults.
Figure 3.8 shows our deposition data in our five chosen adult replicas, along with
the data from Storey-Bishoff et al. (2008) for infants and our data in children.
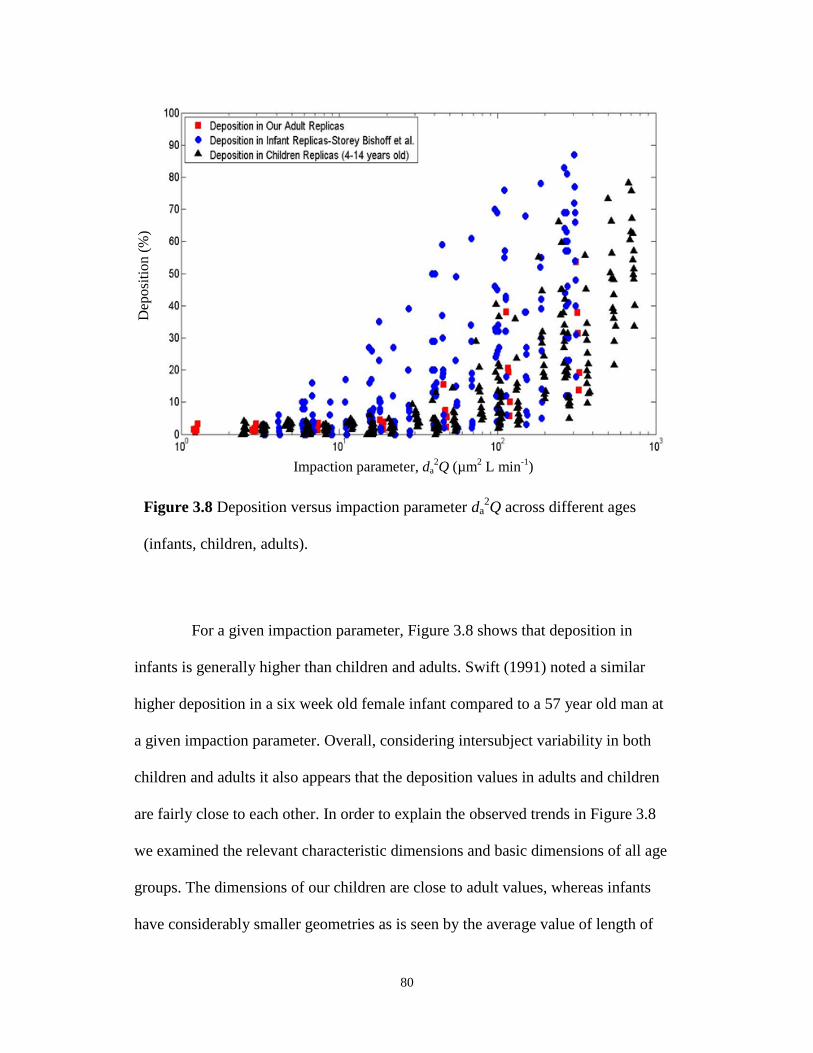
80
Figure 3.8 Deposition versus impaction parameter da2Q across different ages
(infants, children, adults).
For a given impaction parameter, Figure 3.8 shows that deposition in
infants is generally higher than children and adults. Swift (1991) noted a similar
higher deposition in a six week old female infant compared to a 57 year old man at
a given impaction parameter. Overall, considering intersubject variability in both
children and adults it also appears that the deposition values in adults and children
are fairly close to each other. In order to explain the observed trends in Figure 3.8
we examined the relevant characteristic dimensions and basic dimensions of all age
groups. The dimensions of our children are close to adult values, whereas infants
have considerably smaller geometries as is seen by the average value of length of
Impaction parameter, da2Q (µm
2 L min
-1)
Dep
osi
tio
n (
%)
81
nasal airways for our children (20.1±1.73 cm) being close to the average length for
our adults (23.6±2.22 cm), whereas for infants it is 10.4±0.8 cm. It thus appears
that the much smaller infant nasal dimensions, but not dissimilar dimensions
between adults and children, explain the above noted age trends in Figure 3.8.
3.4 Conclusions
Considerable intersubject variability was observed in deposition of
micrometer-sized particles in our fourteen children replicas if only impaction
parameter is considered when plotting the data. When instead a characteristic
diameter in the form of the ratio of surface area to the length of nasal airway is
used for calculation of Reynolds and Stokes numbers, the scatter of the data
largely collapses. However, since measuring the surface area of the airways in
vivo, requires imaging, it is useful to note that a characteristic diameter including
nasal airway volume and length (i.e LV ), which can be measured by acoustic
rhinometry, allows prediction of deposition with good accuracy (R2= 0.91) via the
following equation:
100]4.119
4.1191[
57.0
X
where 28.123.1 Re.Stk; X .The average value of the
characteristic diameter LV used in Stokes and Reynolds for our thirteen healthy
subjects is 1.1±0.14 cm. Comparing deposition across different age groups at a
constant impaction parameter shows that deposition in infants is higher than in
both adults and children, whereas deposition in our children is not significantly
different from our five tested adults. The proposed equation can be used for
82
estimating the fraction of nasally inhaled aerosol that reaches the lungs of school
aged children and adolescents.
3.5 Bibliography
Becquemin, M. H., Swift, D. L., Bouchikhi, A., Roy, M., and Teillac, A. (1991).
Particle deposition and resistance in the noses of adults and children. The
European Respiratory Journal, 4, 694-702.
Bennett, W. D., and Zeman, K. L. (2005). Effect of race on fine particle
deposition for oral and nasal breathing. Inhalation Toxicology, 17, 641-648.
Bennett, W. D., Zeman, K. L., and Jarabek, A. M. (2008). Nasal contribution to
breathing and fine particle deposition in children versus adults. Journal of
Toxicology and Environmental Health, Part A, 71, 227-237.
Cheng, Y. S., Yeh, H. C., and Swift, D. L. (1991). Aerosol Deposition in Human
Nasal Airway for Particles 1 nm to 20 m: A Model Study. Radiation Protection
Dosimetry, 38, 41-47.
Cheng, Y.S. (2003). Aerosol deposition in the extrathoracic region. Aerosol
Science and Technology, 37, 659-671.
Dai, Y., Chang, C., Tu, L., and Hsu, D. (2007). Development of a Taiwanese head
model for studying occupational particle exposure. Inhalation Toxicology, 19,
383-392.
Dorato, M. A., and Wolff, R. K. (1991). Inhalation exposure technology,
dosimetry, and regulatory issues. Toxicologic Pathology, 19(4), 373-383.
83
Finlay, W. H., and Martin A. R. (2008). Recent advances in predictive
understanding of respiratory tract deposition. Journal of Aerosol Medicine and
Pulmonary Drug Delivery, 21(2), 189-205.
Garcia, G. J. M., Tewksbury, E. W., Wong, B. A., and Kimbell, J. S. (2009).
Interindividual variability in nasal filtration as a function of nasal cavity
geometry. Journal of Aerosol Medicine and Pulmonary Drug Delivery, 22(2),
139-155.
Giacomelli-Maltoni, G., Melandri, C., Prodis, V., and Tarroni, G. (1972).
Deposition efficiency of monodisperse particles in human respiratory tract.
American Industrial Hygiene Association Journal, 33(9), 603-610.
Ginsberg, G. L., Asgharian, B., Kimbell, J. S., Ultman, J. S., and Jarabek, A. M.
(2008). Modeling approaches for estimating the dosimetry of inhaled toxicants in
children. Journal of Toxicology and Environmental Health, Part A, 71, 166-195.
Golshahi, L., Finlay, W. H., Olfert, J. S., Thompson, R. B., and Noga, M. L.
(2010). Deposition of Inhaled Ultrafine Aerosols in Replicas of Nasal Airways of
Infants. Aerosol Science and Technology, 44 (9), 741-752.
Guilmette, R. A., Cheng, Y. S., Yeh, H. C., and Swift, D. L. (1994). Deposition of
0.005-12 m monodisperse particles in a computer-milled, MRI-based nasal
airway replica. Inhalation Toxicology, 6, 395-399.
Harvey, R. P., and Hamby D. M. (2002). Age-specific uncertainty in particulate
deposition for 1 mm AMAD particles using the ICRP 66 lung model. Health
Physics, 82(6), 807-816.
84
Heyder, J., and Rudolf, G. (1977). Deposition of aerosol in the human nose. In:
W. H. Walton (Ed.), Inhaled Particle IV. Pergamon Press: Oxford, pp. 107-125.
Heyder, J., Gebhart, J., Rudolf, G., Schiller, C. F., and Stahlhofen, W. (1986).
Deposition of particles in the human respiratory tract in the size range 0.005-15
m. Journal of Aerosol Science, 17(5), 811-825.
Hounam, R. F., Black, A., and Walsh, M. (1969). Deposition of aerosol particles
in the nasopharyngeal region of the human respiratory tract. Nature, 221, 1254-
1255.
Hounam, R. F., Black, A., and Walsh, M. (1971). The deposition of aerosol
particles in the nasopharyngeal region of the human respiratory tract. Journal of
Aerosol Science, 2, 47-61.
International Commission on Radiological Protection (ICRP), Publication 66
(1994). Human respiratory tract model for radiological protection. Pergamon
Press: Oxford.
Itoh, H., Smaldone, G. C., Swift, D. L., and Wagner, Jr., H. N. (1985).
Mechanisms of aerosol deposition in a nasal model. Journal of Aerosol Science,
16, 529-534.
Janssens, H.M., De Jongste, J. C., Fokkens,W. J., Robben, S. G. F.,Wouters, K.,
and Tiddens,H.A.W.M. (2001). The Sophia Anatomical Infant Nose–Throat
(Saint) Model: A Valuable Tool to Study Aerosol Deposition in Infants. Journal
of Aerosol Medicine and Pulmonary Drug Delivery, 14(4), 433–441.
85
Keck, T., Leiacker, R., Klotz, M., Lindemann, J., Riechelmann, H., Rettinger, G.
(2000). Detection of particles within the nasal airways during respiration.
European Archives of Oto-rhino-laryngology, 257, 493-497.
Kelly, J. T., Asgharian, B., Kimbell, J. S., and Wong, B. A. (2004). Particle
deposition in human nasal airway replicas manufactured by different methods.
Part I: Inertial Regime Particles. Aerosol Science and Technology, 38, 1063-1071.
Kelly, J. T., Asgharian, B., and Wong, B. A. (2005). Inertial particle deposition in
a monkey nasal mold compared with that in human nasal replicas. Inhalation
toxicology, 17(14), 823-830.
Kesavanathan, J., Bascom, R., and Swift, D. L. (1998). The effect of nasal
passage characteristics on particle deposition. Journal of Aerosol Medicine and
Pulmonary Drug Delivery, 11(1), 27-39.
Kesavanathan, J., and Swift, D. L. (1998). Human nasal passage particle
deposition: the effect of particle size, flow rate, and anatomical factors. Aerosol
Science and Technology, 28, 457-463.
Kimbell, J. S. (2006). Nasal dosimetry of inhaled gases and particles: where do
inhaled agents go in the nose? Toxicology Pathology, 34, 270-273.
Landahl, H. D., and Black, S. (1947). Penetration of air-borne particulates through
the human nose. Journal of Industrial Hygiene and Toxicology, 29(4), 269-277.
Landahl, H. D., and Tracewell, T. (1949). Penetration of air-borne particulates
through the human nose. Journal of Industrial Hygiene and Toxicology, 31(1), 55-
59.
86
Lippmann, M. (1970). Deposition and clearance of inhaled particles in the human
nose. Annals of Otology, Rhinology and Laryngology, 70, 519-528.
Liu, Y., Matida, E. A., Gu, J., and Johnson, M. R. (2007). numerical simulation of
aerosol deposition in a 3-D human nasal cavity using RANS, RANS/EIM, and
LES. Journal of Aerosol Science, 38(7), 683-700.
Liu, Y., Johnson, M. R., Matida, E. A., Kherani, S., and Marsan, J. (2009).
Creation of a standardized geometry of the human nasal cavity. Journal of
Applied Physiology, 106, 784-795.
Liu, Y., Matida, E. A., and Johnson, M. R. (2010). Experimental measurements
and computational modeling of aerosol deposition in the Carleton-Civic
standardized human nasal cavity. Journal of Aerosol Science, 41(6), 569-586.
Pattle, R. E. (1961). The retention of gases and particles in the human nose. In: C.
N. Davies (Ed.), Inhaled Particles and Vapours. Pergamon Press: Oxford, pp.302-
309.
Phalen, R. F., Oldham, M. J., and Mautz, W. J. (1989). Aerosol deposition in the
nose as a function of body size. Health Physics, 57(Suppl. 1), 299-305.
Rasmussen, T. R., Swift, D. L., Hilberg, O., and Pedersen, O. F. (1990). Influence
of nasal passage geometry on aerosol particle deposition in the nose, Journal of
Aerosol Medicine and Pulmonary Drug Delivery, 3(1), 15-25.
Rasmussen, T. R., Anderson, A., Pedersen, O. F. (2000). Particle deposition in the
nose related to nasal cavity geometry. Rhinology, 38, 102-107.
Scott, W. R., Taulbee, D. B., and Yu, C. P. (1978). Theoretical study of nasal
deposition. Bulletin of Mathematical Biology, 40, 581-603.
87
Shi, H., Kleinstreuer, C., and Zhang, Z. (2007). Modeling of inertial particle
transport and deposition in human nasal cavities with wall roughness. Journal of
Aerosol Science, 38, 398-419.
Storey-Bishoff, J., Noga, M., and Finlay, W. H. (2008). Deposition of
Micrometer-Sized Aerosol Particles in Infant Nasal Airway Replicas. Journal of
Aerosol Science, 39, 1055–1065.
Swift, D. L. (1991). Inspiratory inertial deposition of aerosols in human nasal
airway replicate casts: implication for the proposed NCRP lung model. Radiation
Protection Dosimetry, 38, 29-34.
Swift, D. L. and Kesavanathan, J. (1996). The anterior human nasal passage as a
fibrous filter for particles. Chemical Engineering Communications, 151(1), 65-78.
Thatcher, T. L., Fairchild, W. A., Nazaroff, W. W. (1996). Particle deposition
from natural convection enclosure flow onto smooth surfaces. Aerosol Science
and Technology, 25, 359-374.
U. S. EPA. (U.S. Environmental Protection Agency) (1994). Methods for
derivation of inhalation reference concentrations and application of inhalation
dosimetry. EPA/600/8-90/066F.
Vincent, J. H. (2005). Health-related aerosol measurement: a review of existing
sampling criteria and proposals for new ones. Journal of Environmental
Monitoring, 7, 1037-1053.
Wang, S. W., Inthavong, K., Wen, J., Tu, J. Y., and Xue, C. L. (2009).
Comparison of micron- and nanoparticle deposition patterns in a realistic human
nasal cavity. Respiratory Physiology & Neurobiology, 166, 142-151.
88
White, F. M. (1999). Fluid Mechanics (4th
ed.). McGraw-Hill: Boston.
Wiesmiller, K., Keck, T., Leiacker, R., Sikora, T., Rettinger, G., and Lindemann,
J. (2003). The impact of expiration on particle deposition within the nasal cavity.
Clinical Otolaryngology, 28, 304-307.
Yeh, H. C., Brinker, R. M., Harkema, J. R., and Muggenburg, B. A. (1997). A
comparative analysis of primate nasal airways using magnetic resonance imaging
and nasal casts. Journal of Aerosol Medicine, 10(4), 319-329.
Yu, C. P., Diu, C. K., and Soong, T. T. (1981). Statistical analysis of aerosol
deposition in nose and mouth. American Industrial Hygiene Association, 42, 726-
733.
Zwartz, G. J., and Guilmette, R. A. (2001). Effect of flow rate on particle
deposition in a replica of a human nasal airway. Inhalation Toxicology, 13, 109-
127.
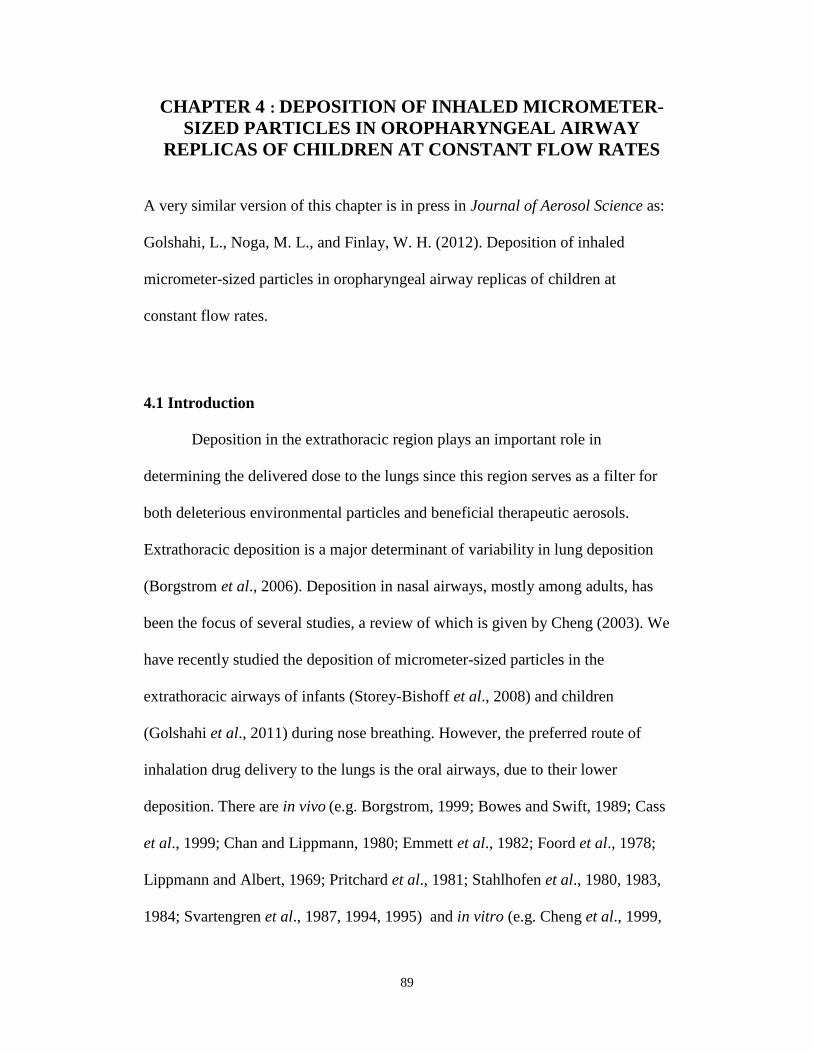
89
CHAPTER 4 : DEPOSITION OF INHALED MICROMETER-
SIZED PARTICLES IN OROPHARYNGEAL AIRWAY
REPLICAS OF CHILDREN AT CONSTANT FLOW RATES
A very similar version of this chapter is in press in Journal of Aerosol Science as:
Golshahi, L., Noga, M. L., and Finlay, W. H. (2012). Deposition of inhaled
micrometer-sized particles in oropharyngeal airway replicas of children at
constant flow rates.
4.1 Introduction
Deposition in the extrathoracic region plays an important role in
determining the delivered dose to the lungs since this region serves as a filter for
both deleterious environmental particles and beneficial therapeutic aerosols.
Extrathoracic deposition is a major determinant of variability in lung deposition
(Borgstrom et al., 2006). Deposition in nasal airways, mostly among adults, has
been the focus of several studies, a review of which is given by Cheng (2003). We
have recently studied the deposition of micrometer-sized particles in the
extrathoracic airways of infants (Storey-Bishoff et al., 2008) and children
(Golshahi et al., 2011) during nose breathing. However, the preferred route of
inhalation drug delivery to the lungs is the oral airways, due to their lower
deposition. There are in vivo (e.g. Borgstrom, 1999; Bowes and Swift, 1989; Cass
et al., 1999; Chan and Lippmann, 1980; Emmett et al., 1982; Foord et al., 1978;
Lippmann and Albert, 1969; Pritchard et al., 1981; Stahlhofen et al., 1980, 1983,
1984; Svartengren et al., 1987, 1994, 1995) and in vitro (e.g. Cheng et al., 1999,
90
2001; DeHaan and Finlay, 2001, 2004; Grgic et al., 2004 a, b, 2006; Swift, 1992;
Zhou et al., 2011) studies available with a focus on deposition of particles in oral
airways of adults. Comprehensive evaluations and representative correlations
based on the experimental data of in vivo adult studies have been given by
Stahlhofen et al. (1989) and Cheng (2003). A recent review on in vivo and in vitro
deposition in the oropharyngeal airways (mouth-throat) and lungs is given by
Finlay and Martin (2008).
Little data exists on oral airway deposition in children. The lack of such
data is unfortunate since inhalation drug delivery is an efficient common practice
for the noninvasive treatment of pediatric lung diseases, and oropharyngeal
deposition is of significant importance in the estimation of delivered drug dose to
the lungs. A limited number of in vivo studies have been carried out to quantify
the total deposition of particles in children’s lungs during oral inhalation
(Becquemin et al., 1991; Bennett and Zeman, 1998, 2004; Schiller-Scotland et al.,
1992). In addition, in vivo oropharyngeal and lung deposition of aerosols (with
radioactive tracers) emitted from specific types of aerosol inhalers such as the
Turbuhaler® and QVAR® have been studied in children with cystic fibrosis
(Devadason et al., 1997) and asthma (Devadason et al., 2003; Roller et al., 2007).
However, comprehensive data on the deposition of particles of various sizes
during inhalation at different flow rates in children’s oral airways with known
dimensions are missing from the literature.
In vitro deposition measurements using high-fidelity replicas have been
considered as robust alternatives to in vivo measurements and have been validated
91
against in vivo deposition data in the literature (Cheng, 2003). However, one
should be cautious in interpreting the data taken with cadaver-based replicas due
to possible post-mortem changes in the airways and distortion of their geometry
during the casting process involved in their fabrication (Pritchard et al., 2004;
McRobbie et al., 2003). On the other hand, imaging of the oropharyngeal airways,
which has been a core part of the recently common in vitro studies, is considered
complex because of the time- and flow-dependent dynamics of the airways,
especially around the larynx area (Martonen and Lowe, 1983). To address this
issue, gated MRI images have been considered to keep the airways of adults open
consistently during the time of imaging (McRobbie et al., 2003). Although, MRI
gating could also be used for imaging the oropharyngeal airways of children, the
long duration of this technique is considered a major drawback because of the
short attention span common among the children as well as the discomfort due to
wearing a neck coil during imaging. Note that the neck coil is used to reduce the
motion artifacts and for consistent positioning of the region of interest during the
imaging process (McRobbie et al., 2003).
Computed tomography (CT) is known as the fastest mode of imaging thus
far, which is believed to result in the most anatomically-accurate replicas
(McRobbie et al., 2003). However, exposure to unwarranted X-ray radiation is a
concern. Therefore, it is important to recruit subjects from a population who
require CT for their clinical diagnosis. This type of subject selection imposes the
need for making the imaging as simple as possible, while the oropharyngeal
airways are still required to stay open during imaging to mimic the inhalation
92
scenario. Delivering constant flow rates at the time of imaging is thus considered
as a solution to keep the airways open in the imaging region, while making the
timing as short as possible.
The present study examines the deposition of micrometer-sized particles
in oropharyngeal airway replicas of nine children 6-14 years old during inhalation
at constant flow rates. The CT images, taken while the subjects inhaled from a
standard mouthpiece, were used to make anatomically accurate replicas in order
to explore intersubject variation in the deposition. To reduce the scatter of the data
we used the two non-dimensional numbers, Reynolds and Stokes number,
calculated using the geometrical dimensions of the airways of each subject, in a
predictive correlation. This correlation is used to estimate deposition of the
particles among children during oral inhalation at moderate to high constant flow
rates. Such a correlation may be used for better individualized dosing of inhaled
medication delivered via inhalers such as dry powder inhalers (DPIs) or
pressurized metered dose inhalers (pMDIs) with holding chambers.
4.2 Experimental Methods
4.2.1 Imaging of the Airways
An AKITA®
inhalation system (Activaero GmbH, Germany) was used to
deliver a fixed flow rate to children who required CT as a part of their clinical
protocol at the PET/CT center of Stollery Children’s Hospital under the approval
of the University of Alberta Health Research Ethics Board (HREB). AKITA®
is a
nebulizer aerosol administration system and has been used by children 3 years of
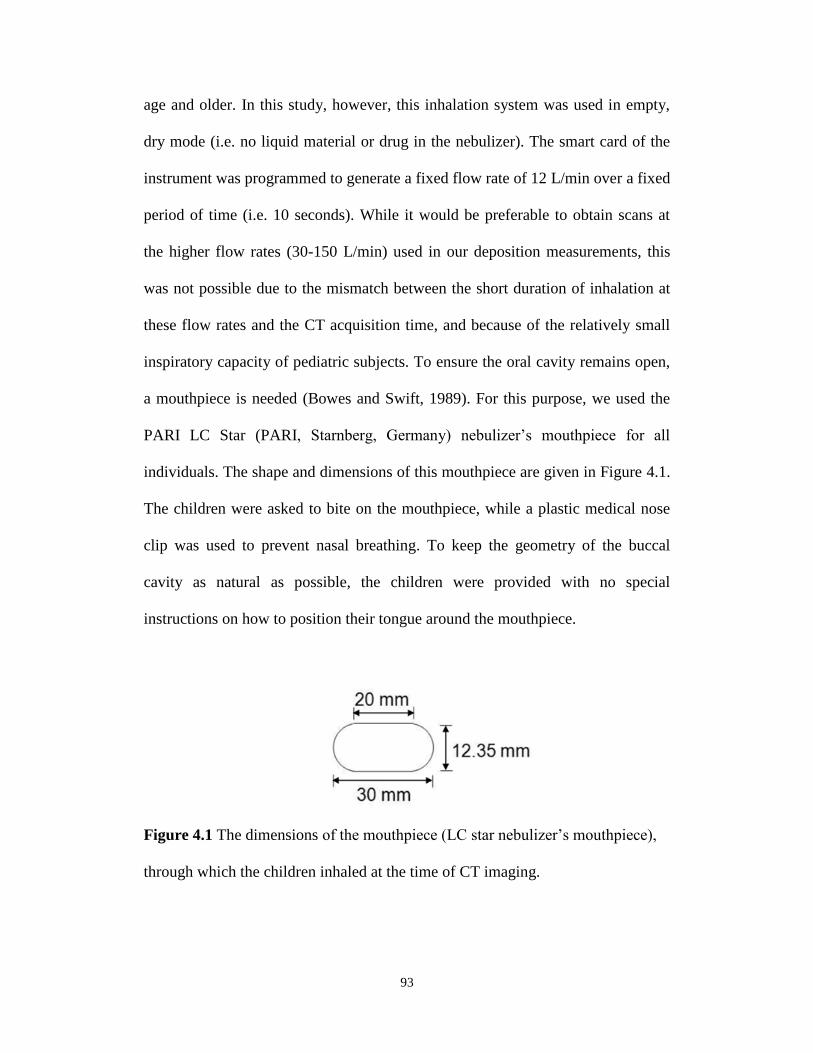
93
age and older. In this study, however, this inhalation system was used in empty,
dry mode (i.e. no liquid material or drug in the nebulizer). The smart card of the
instrument was programmed to generate a fixed flow rate of 12 L/min over a fixed
period of time (i.e. 10 seconds). While it would be preferable to obtain scans at
the higher flow rates (30-150 L/min) used in our deposition measurements, this
was not possible due to the mismatch between the short duration of inhalation at
these flow rates and the CT acquisition time, and because of the relatively small
inspiratory capacity of pediatric subjects. To ensure the oral cavity remains open,
a mouthpiece is needed (Bowes and Swift, 1989). For this purpose, we used the
PARI LC Star (PARI, Starnberg, Germany) nebulizer’s mouthpiece for all
individuals. The shape and dimensions of this mouthpiece are given in Figure 4.1.
The children were asked to bite on the mouthpiece, while a plastic medical nose
clip was used to prevent nasal breathing. To keep the geometry of the buccal
cavity as natural as possible, the children were provided with no special
instructions on how to position their tongue around the mouthpiece.
Figure 4.1 The dimensions of the mouthpiece (LC star nebulizer’s mouthpiece),
through which the children inhaled at the time of CT imaging.
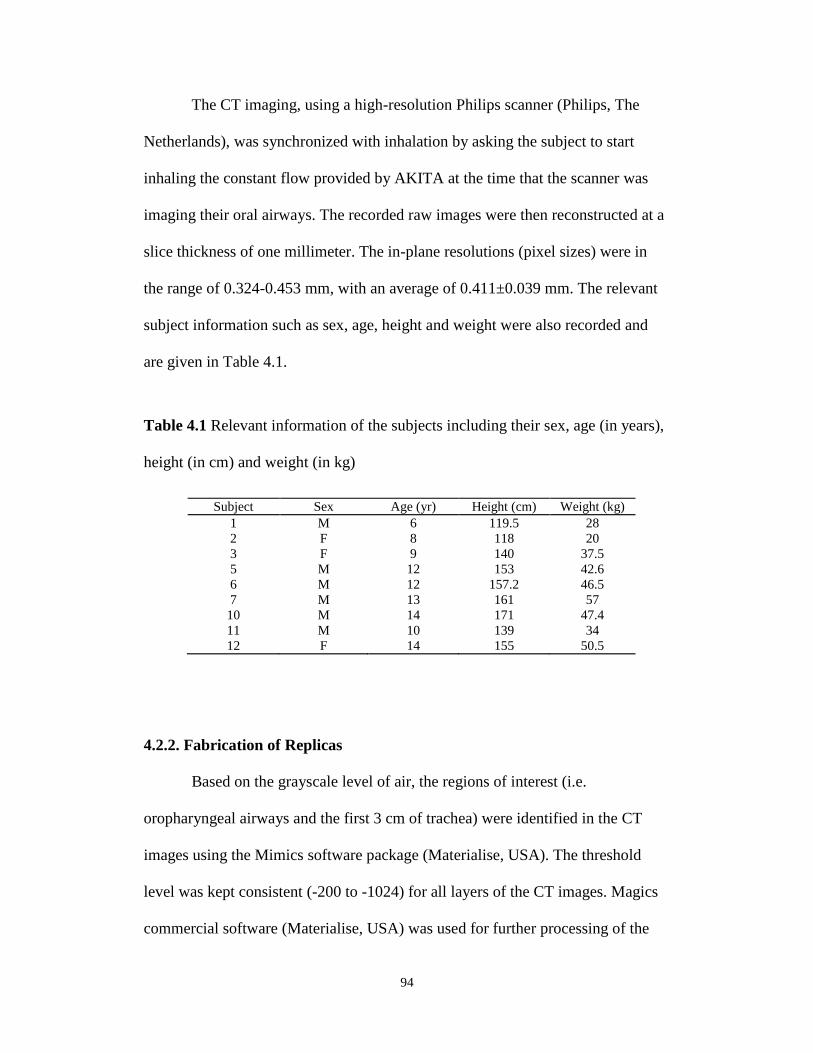
94
The CT imaging, using a high-resolution Philips scanner (Philips, The
Netherlands), was synchronized with inhalation by asking the subject to start
inhaling the constant flow provided by AKITA at the time that the scanner was
imaging their oral airways. The recorded raw images were then reconstructed at a
slice thickness of one millimeter. The in-plane resolutions (pixel sizes) were in
the range of 0.324-0.453 mm, with an average of 0.411±0.039 mm. The relevant
subject information such as sex, age, height and weight were also recorded and
are given in Table 4.1.
Table 4.1 Relevant information of the subjects including their sex, age (in years),
height (in cm) and weight (in kg)
4.2.2. Fabrication of Replicas
Based on the grayscale level of air, the regions of interest (i.e.
oropharyngeal airways and the first 3 cm of trachea) were identified in the CT
images using the Mimics software package (Materialise, USA). The threshold
level was kept consistent (-200 to -1024) for all layers of the CT images. Magics
commercial software (Materialise, USA) was used for further processing of the
Table 1
Relevant information of the subjects including their sex, age (in years), height (in cm) and
weight (in kg)
Subject Sex Age (yr) Height (cm) Weight (kg)
1 M 6 119.5 28
2 F 8 118 20
3 F 9 140 37.5
5 M 12 153 42.6
6 M 12 157.2 46.5
7 M 13 161 57
10 M 14 171 47.4
11 M 10 139 34
12 F 14 155 50.5
95
3D models imported from Mimics to build a two-millimeter thick shell of the
airways. At this stage, a cylinder was added around the trachea for easier tube
connection during the experiments. The mouthpiece was also subtracted in
Magics. A rapid prototyping machine (Invision SR 3-D printer, 3D Systems,
USA) was used for building the processed 3D computer models using acrylic
plastic build material and wax as the support. The wax was removed from the
airways afterwards by heating the replicas to ~60 ºC. The mouthpieces that were
used for imaging were air-sealed to the built replicas using Parafilm® and putty
prior to the experiments. Figure 4.2 shows our nine replicas at the final fabrication
stage, prior to the experiments.
Figure 4.2 Nine oral airway replicas of children 6-14 years old. The replicas are
arranged in an ascending order based on their numerical label from left to right on
each row.
96
The replicas were re-scanned by CT after rapid prototyping to ensure the
important anatomical features of the airways had been precisely maintained
during fabrication. By segmenting these images, the geometrical dimensions of
the airway replicas were measured (Table 4.2). Note that these data are the
dimensions of the 3D airways truncated at the tip of the mouthpiece (the emission
point of aerosols). Only the dimensions of the remaining part, i.e. excluding the
mouthpiece, were used for further analysis.
Table 4.2 Geometrical parameters of the replicas post-build: volume (mm3),
surface area (mm2) and length (mm)
We also fabricated a plastic version of the commercially-available adult
idealized throat, known as the ‘Alberta Idealized Throat’, with the same rapid
prototyping machine used to build our children’s replicas. The details of the
methodology, followed for the design of this Idealized Throat, have been noted in
our previous study (Stapleton et al., 2000). This adult replica was utilized to
validate our deposition measurements.
Subject Volume
(mm3)
Surface area
(mm2)
Length
(mm)
1 17584.6 7680.9 125.7
2 19554.1 9172.5 130.4
3 39003.5 12557.8 154.9
5 33828.8 11711.1 167.6
6 31275.7 10181.3 158.8
7 38788.3 14428.3 160.3
10 50915.9 16735.5 171.6
11 35877.8 13112.2 150.9
12 30937.8 11229.8 136.9
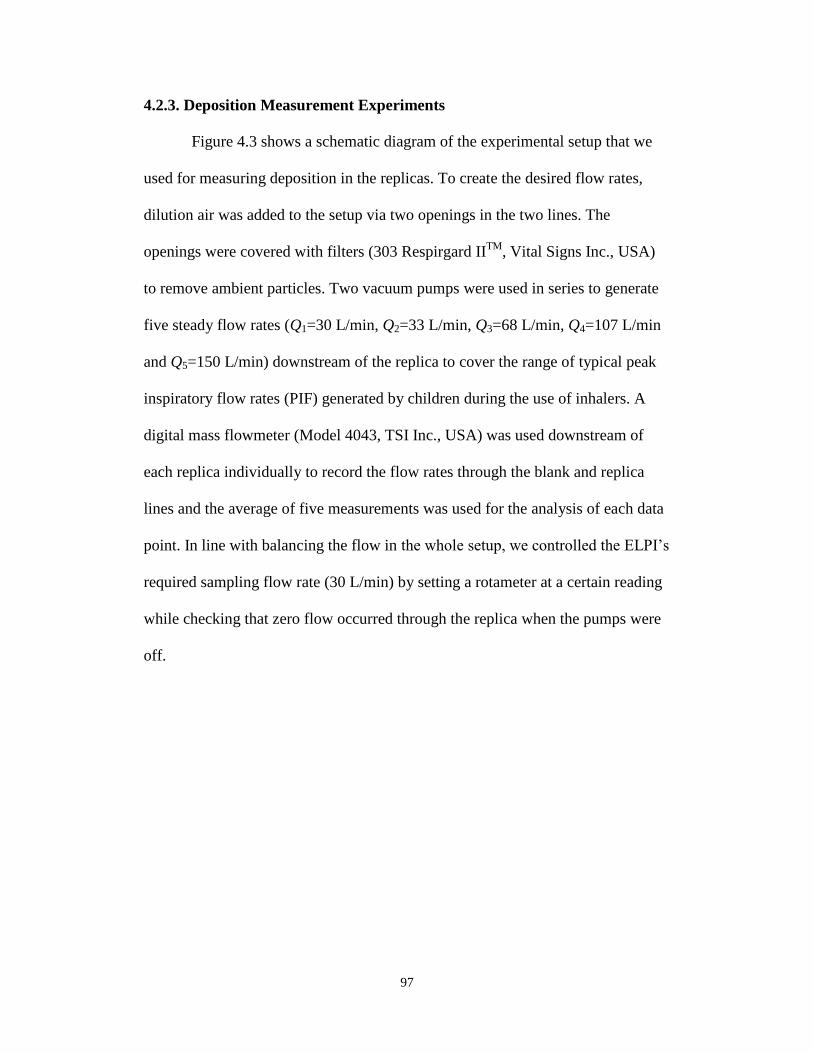
97
4.2.3. Deposition Measurement Experiments
Figure 4.3 shows a schematic diagram of the experimental setup that we
used for measuring deposition in the replicas. To create the desired flow rates,
dilution air was added to the setup via two openings in the two lines. The
openings were covered with filters (303 Respirgard IITM
, Vital Signs Inc., USA)
to remove ambient particles. Two vacuum pumps were used in series to generate
five steady flow rates (Q1=30 L/min, Q2=33 L/min, Q3=68 L/min, Q4=107 L/min
and Q5=150 L/min) downstream of the replica to cover the range of typical peak
inspiratory flow rates (PIF) generated by children during the use of inhalers. A
digital mass flowmeter (Model 4043, TSI Inc., USA) was used downstream of
each replica individually to record the flow rates through the blank and replica
lines and the average of five measurements was used for the analysis of each data
point. In line with balancing the flow in the whole setup, we controlled the ELPI’s
required sampling flow rate (30 L/min) by setting a rotameter at a certain reading
while checking that zero flow occurred through the replica when the pumps were
off.
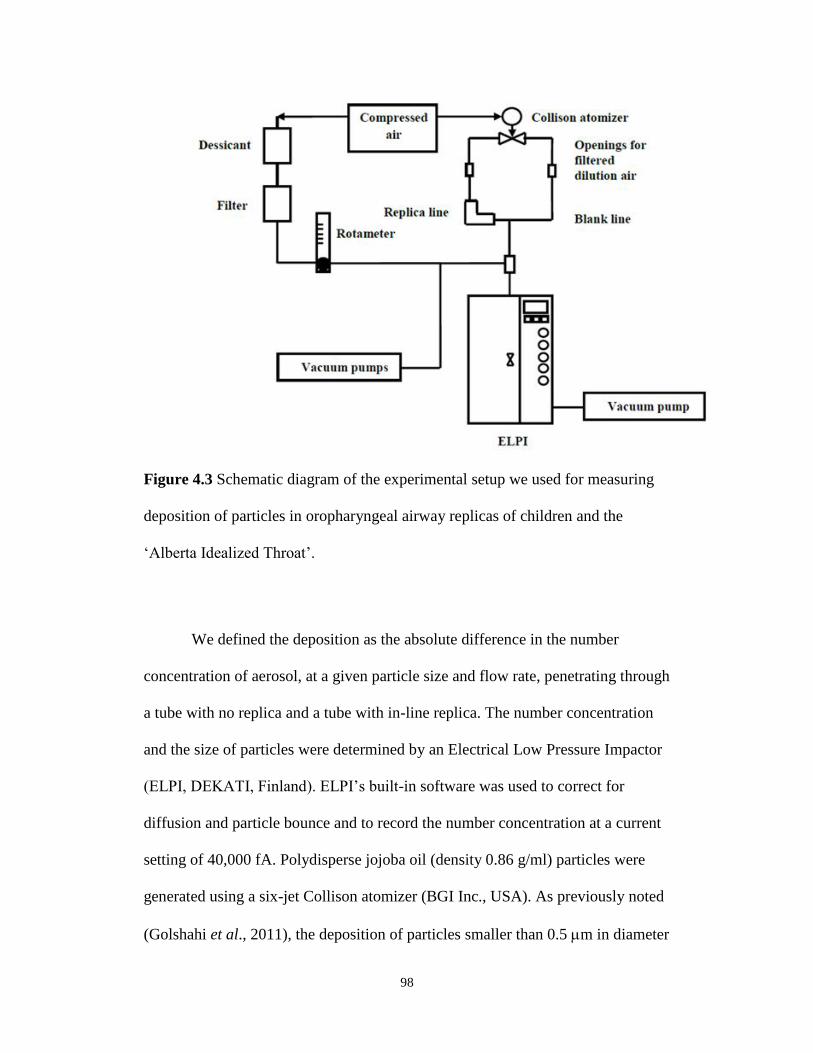
98
Figure 4.3 Schematic diagram of the experimental setup we used for measuring
deposition of particles in oropharyngeal airway replicas of children and the
‘Alberta Idealized Throat’.
We defined the deposition as the absolute difference in the number
concentration of aerosol, at a given particle size and flow rate, penetrating through
a tube with no replica and a tube with in-line replica. The number concentration
and the size of particles were determined by an Electrical Low Pressure Impactor
(ELPI, DEKATI, Finland). ELPI’s built-in software was used to correct for
diffusion and particle bounce and to record the number concentration at a current
setting of 40,000 fA. Polydisperse jojoba oil (density 0.86 g/ml) particles were
generated using a six-jet Collison atomizer (BGI Inc., USA). As previously noted
(Golshahi et al., 2011), the deposition of particles smaller than 0.5 m in diameter
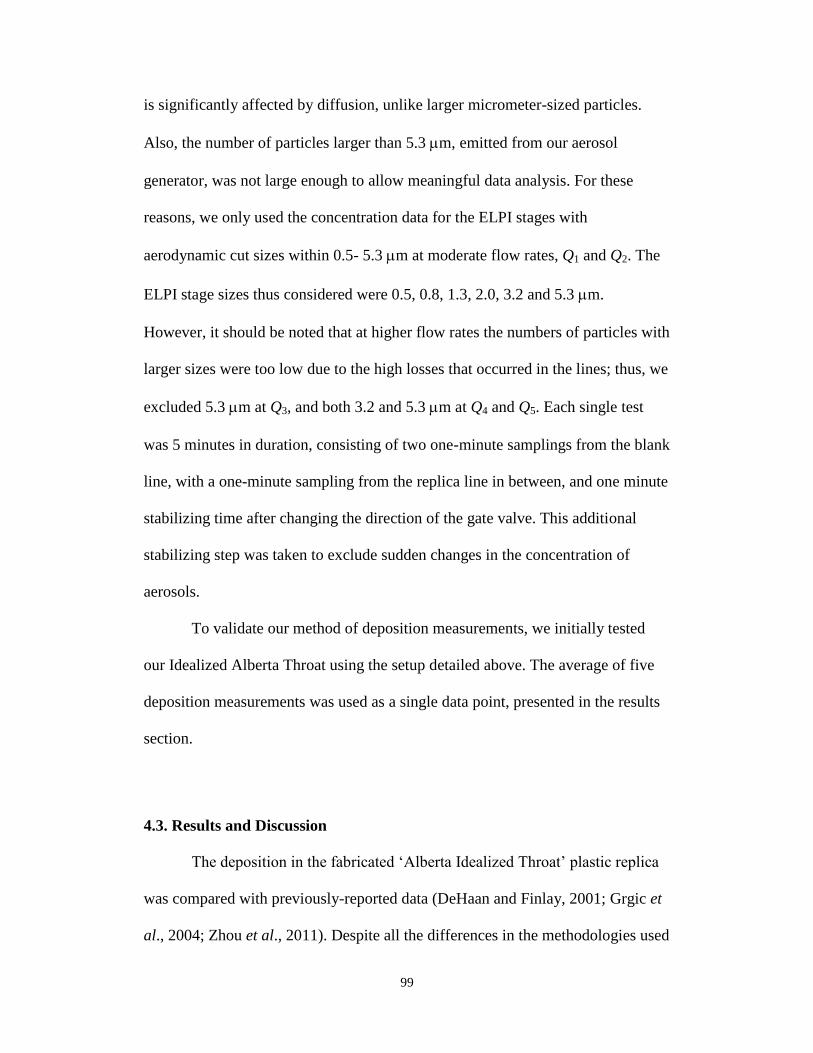
99
is significantly affected by diffusion, unlike larger micrometer-sized particles.
Also, the number of particles larger than 5.3 m, emitted from our aerosol
generator, was not large enough to allow meaningful data analysis. For these
reasons, we only used the concentration data for the ELPI stages with
aerodynamic cut sizes within 0.5- 5.3 m at moderate flow rates, Q1 and Q2. The
ELPI stage sizes thus considered were 0.5, 0.8, 1.3, 2.0, 3.2 and 5.3 m.
However, it should be noted that at higher flow rates the numbers of particles with
larger sizes were too low due to the high losses that occurred in the lines; thus, we
excluded 5.3 m at Q3, and both 3.2 and 5.3 m at Q4 and Q5. Each single test
was 5 minutes in duration, consisting of two one-minute samplings from the blank
line, with a one-minute sampling from the replica line in between, and one minute
stabilizing time after changing the direction of the gate valve. This additional
stabilizing step was taken to exclude sudden changes in the concentration of
aerosols.
To validate our method of deposition measurements, we initially tested
our Idealized Alberta Throat using the setup detailed above. The average of five
deposition measurements was used as a single data point, presented in the results
section.
4.3. Results and Discussion
The deposition in the fabricated ‘Alberta Idealized Throat’ plastic replica
was compared with previously-reported data (DeHaan and Finlay, 2001; Grgic et
al., 2004; Zhou et al., 2011). Despite all the differences in the methodologies used
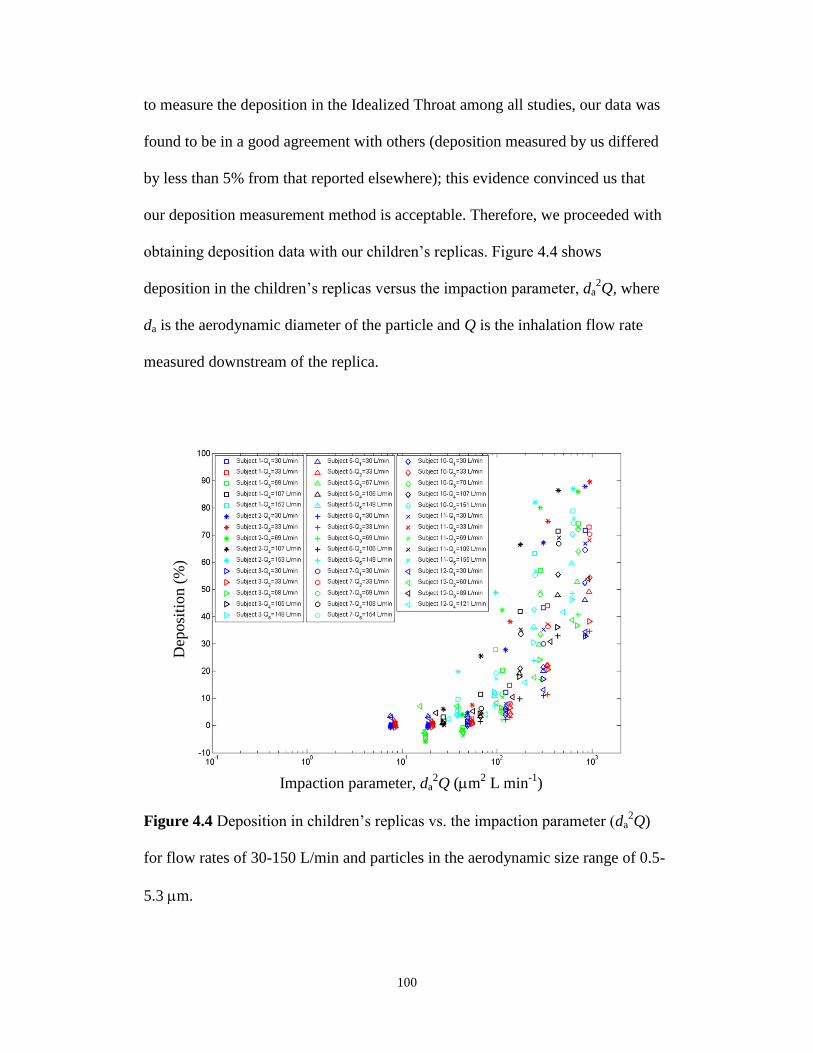
100
to measure the deposition in the Idealized Throat among all studies, our data was
found to be in a good agreement with others (deposition measured by us differed
by less than 5% from that reported elsewhere); this evidence convinced us that
our deposition measurement method is acceptable. Therefore, we proceeded with
obtaining deposition data with our children’s replicas. Figure 4.4 shows
deposition in the children’s replicas versus the impaction parameter, da2Q, where
da is the aerodynamic diameter of the particle and Q is the inhalation flow rate
measured downstream of the replica.
Figure 4.4 Deposition in children’s replicas vs. the impaction parameter (da2Q)
for flow rates of 30-150 L/min and particles in the aerodynamic size range of 0.5-
5.3 m.
Dep
osi
tion (
%)
Impaction parameter, da2Q (m
2 L min
-1)
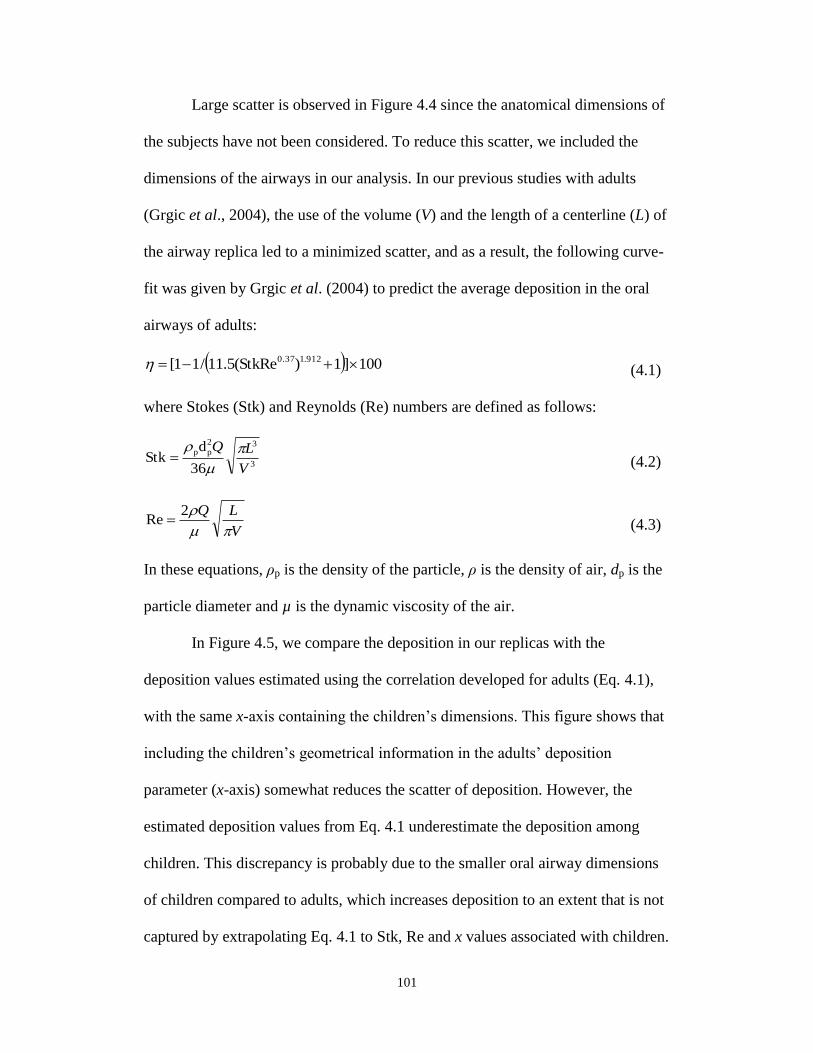
101
Large scatter is observed in Figure 4.4 since the anatomical dimensions of
the subjects have not been considered. To reduce this scatter, we included the
dimensions of the airways in our analysis. In our previous studies with adults
(Grgic et al., 2004), the use of the volume (V) and the length of a centerline (L) of
the airway replica led to a minimized scatter, and as a result, the following curve-
fit was given by Grgic et al. (2004) to predict the average deposition in the oral
airways of adults:
100]1)StkRe(5.11/11[ 912.10.37 (4.1)
where Stokes (Stk) and Reynolds (Re) numbers are defined as follows:
3
32
pp
36
dStk
V
LQ
(4.2)
V
LQ
2Re (4.3)
In these equations, ρp is the density of the particle, ρ is the density of air, dp is the
particle diameter and µ is the dynamic viscosity of the air.
In Figure 4.5, we compare the deposition in our replicas with the
deposition values estimated using the correlation developed for adults (Eq. 4.1),
with the same x-axis containing the children’s dimensions. This figure shows that
including the children’s geometrical information in the adults’ deposition
parameter (x-axis) somewhat reduces the scatter of deposition. However, the
estimated deposition values from Eq. 4.1 underestimate the deposition among
children. This discrepancy is probably due to the smaller oral airway dimensions
of children compared to adults, which increases deposition to an extent that is not
captured by extrapolating Eq. 4.1 to Stk, Re and x values associated with children.
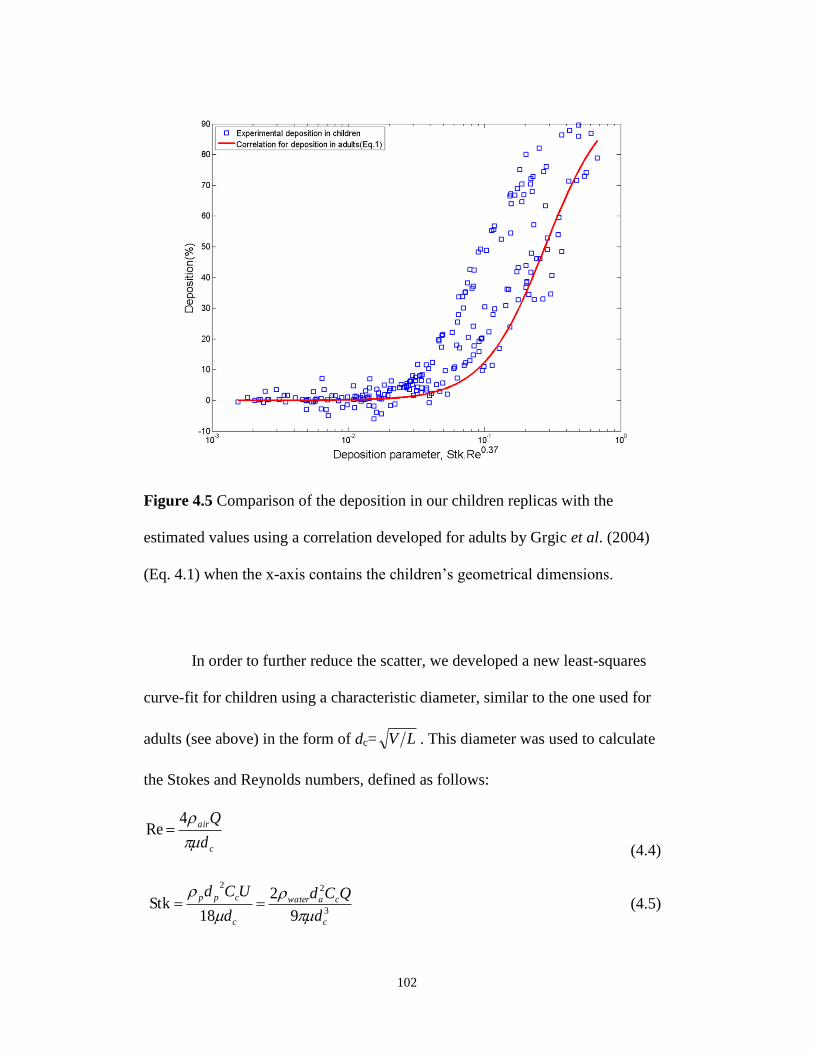
102
Figure 4.5 Comparison of the deposition in our children replicas with the
estimated values using a correlation developed for adults by Grgic et al. (2004)
(Eq. 4.1) when the x-axis contains the children’s geometrical dimensions.
In order to further reduce the scatter, we developed a new least-squares
curve-fit for children using a characteristic diameter, similar to the one used for
adults (see above) in the form of dc= LV . This diameter was used to calculate
the Stokes and Reynolds numbers, defined as follows:
c
air
d
Q
4Re
(4.4)
3
22
9
2
18Stk
c
cawater
c
cpp
d
QCd
d
UCd
(4.5)
103
where ρair (1.2 kg/m3) is the density of air, ρwater is the density of water (1000 kg/
m3). Cc is the Cunningham slip correction factor. The subscripts ‘p’ and ‘a’ refer
to the particle diameter (dp) and aerodynamic diameter (da), respectively. Cc is
defined as follows:
pc dC 52.21
(4.6)
where is the mean free path of air, which is 0.067 m at the standard room
conditions.
Figure 4.6 shows the correlation developed based on the approach
explained above. Although the scatter has been further decreased compared to
Figure 4.5, the R-squared value is still relatively poor (0.84).
Figure 4.6 Deposition of micrometer-sized particles in oropharyngeal replicas of
children vs. non-dimensional deposition parameter (X) as a combination of
X=Stk1.33
Re0.58
Dep
osi
tion (
%)
104
Stokes and Reynolds numbers that include a characteristic diameter defined as dc=
LV .
In an attempt to further reduce the existing scatter of the deposition data
apparent in Figure 4.6, we used the diameter dc=V/As in the calculation of the
Stokes and Reynolds numbers using Eqs. 4.4 and 4.5. The parameter As is the
total surface area of the airways. We considered this characteristic diameter since
it successfully reduced the scatter in the deposition of inhaled micrometer-sized
particles among infants (Storey-Bishoff et al., 2008). Figure 4.7 displays the
developed correlation using this characteristic diameter. A high R-squared value
of 0.94 was achieved using this approach.
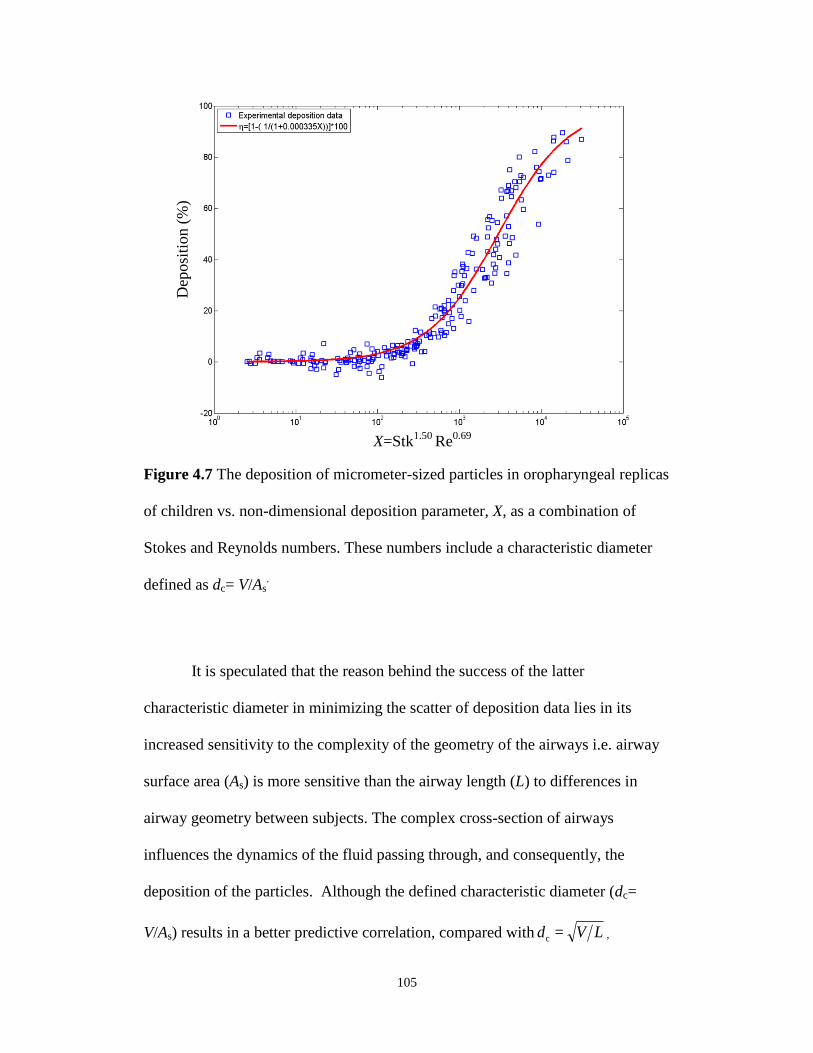
105
Figure 4.7 The deposition of micrometer-sized particles in oropharyngeal replicas
of children vs. non-dimensional deposition parameter, X, as a combination of
Stokes and Reynolds numbers. These numbers include a characteristic diameter
defined as dc= V/As.
It is speculated that the reason behind the success of the latter
characteristic diameter in minimizing the scatter of deposition data lies in its
increased sensitivity to the complexity of the geometry of the airways i.e. airway
surface area (As) is more sensitive than the airway length (L) to differences in
airway geometry between subjects. The complex cross-section of airways
influences the dynamics of the fluid passing through, and consequently, the
deposition of the particles. Although the defined characteristic diameter (dc=
V/As) results in a better predictive correlation, compared with LVd =c ,
X=Stk1.50
Re0.69
Dep
osi
tion (
%)
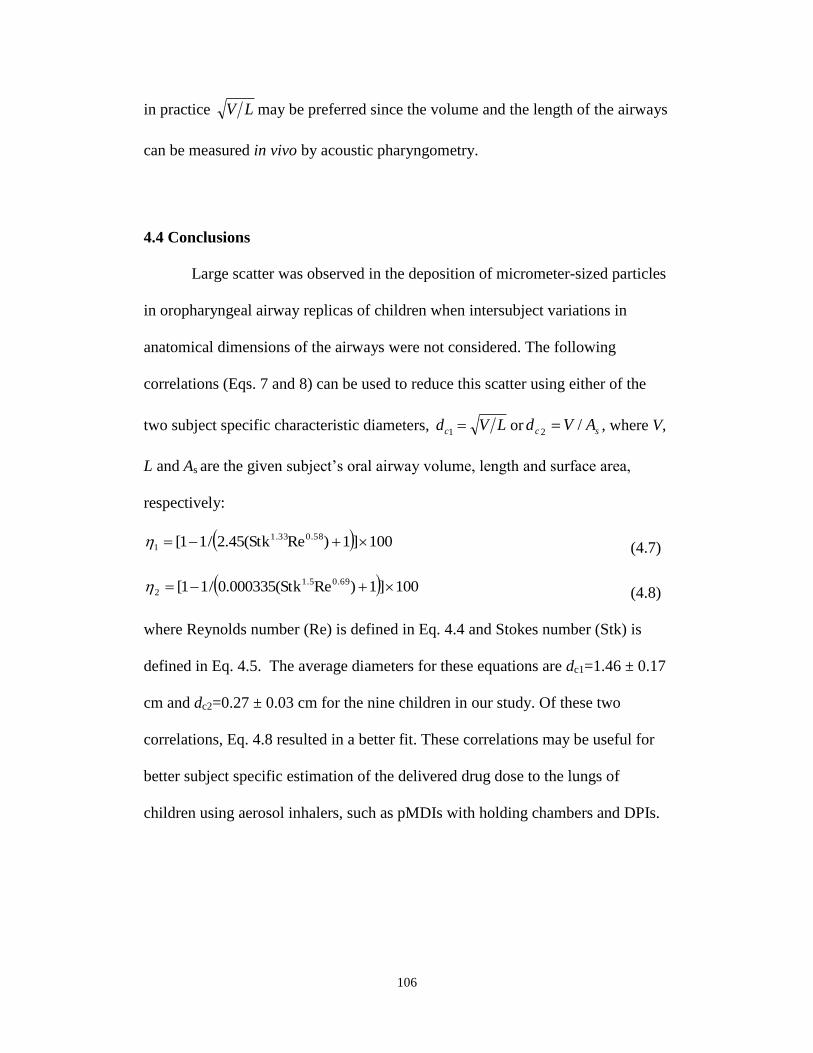
106
in practice
LV may be preferred since the volume and the length of the airways
can be measured in vivo by acoustic pharyngometry.
4.4 Conclusions
Large scatter was observed in the deposition of micrometer-sized particles
in oropharyngeal airway replicas of children when intersubject variations in
anatomical dimensions of the airways were not considered. The following
correlations (Eqs. 7 and 8) can be used to reduce this scatter using either of the
two subject specific characteristic diameters, LVdc 1
or sc AVd /2 , where V,
L and As are the given subject’s oral airway volume, length and surface area,
respectively:
100]1)ReStk(45.2/11[ 0.581.33
1 (4.7)
100]1)ReStk(000335.0/11[ 0.691.5
2 (4.8)
where Reynolds number (Re) is defined in Eq. 4.4 and Stokes number (Stk) is
defined in Eq. 4.5. The average diameters for these equations are dc1=1.46 ± 0.17
cm and dc2=0.27 ± 0.03 cm for the nine children in our study. Of these two
correlations, Eq. 4.8 resulted in a better fit. These correlations may be useful for
better subject specific estimation of the delivered drug dose to the lungs of
children using aerosol inhalers, such as pMDIs with holding chambers and DPIs.
107
4.5 Bibliography
Becquemin, M. H., Yu, C. P., Roy, M., and Bouchikhi, A. (1991). Total
deposition of inhaled particles related to age: comparison with age dependent
model calculations. Radiation Protection Dosimetry, 38, 23-28.
Bennett, W. D., and Zeman, K. L. (1998). Deposition of fine particles in children
spontaneously breathing at rest. Inhalation Toxicology, 10, 831-842.
Bennett, W. D., and Zeman, K. L. (2004). Effect of body size on breathing pattern
and fine-particle deposition in children. Journal of Applied Physiology, 97, 821-
826.
Borgstrom, L. (1999). In vitro, ex vivo, in vivo veritas. Allergy, 54, 88-92.
Borgstrom, L. Olsson, B., and Thorsson, L. (2006). Degree of throat deposition
can explain the variability in lung deposition of inhaled drugs. Journal of Aerosol
Medicine, 19(4), 473-483.
Bowes, S. M., and Swift, D. L. (1989). Deposition of inhaled particles in the oral
airway during oronasal breathing. Aerosol Science and Technology, 11, 157-167.
Cass, L. M. R., Brown, J., Pickford, M., Fayinka, S., Newman, S. P., Johansson,
C. J., and Bye, A. (1999). Pharmacoscintigraphic evaluation of lung deposition of
inhaled zanamivir in healthy volunteers. Clinical Pharmacokinetics, 36(Suppl. 1),
21-31.
Chan, T. L., and Lippmann, M. (1980). Experimental measurements and
empirical modeling of the regional deposition of inhaled particles in humans.
American Industrial Hygiene Association Journal, 41, 399-409.
108
Cheng, Y. S., Zhou, Y., and Chen, T. B. (1999). Particle deposition in a cast of
human oral airways. Aerosol Science and Technology, 31, 286-300.
Cheng, Y. S., Yazzie, D., and Zhou, Y. (2001). Respiratory deposition patterns of
salbutamol pMDI with CFC and HFA-134a formulations in a human airway
replica. Journal of Aerosol Medicine, 14(2), 255-266.
Cheng, Y. S. (2003). Aerosol Deposition in the Extrathoracic Region. Aerosol
Science and Technology, 37, 659-671.
DeHaan, W. H., and Finlay, W. H. (2001). In vitro monodisperse aerosol
deposition in a mouth and throat with six different inhalation devices. Journal of
Aerosol Medicine, 14(3), 361-367.
DeHaan, W. H., and Finlay, W. H. (2004). Predicting extrathoracic deposition
from dry powder inhalers. Journal of Aerosol Science, 35(3), 309-331.
Devadason, S. G., Everard, M. L., MacEarlan, C., Roller, C., Summers, Q. A.,
Swift, P., Borgstrom, L., and Le Souef, P. N. (1997). Lung deposition from the
Turbuhaler in children with cystic fibrosis. The European Respiratory Journal,
10, 2023-2028.
Devadason, S. G., Huang, T., Walker, S., Troedson, R., and Le Souef, P. N.
(2003). Distribution of technetium-99m-labelled QVARTM
delivered using an
AutohalerTM
device in children. The European Respiratory Journal, 21, 1007-
1011.
Emmett, P. C., Aitken, R. J., and Hannan, W. J. (1982). Measurements of the total
and regional deposition of inhaled particles in the human respiratory tract.
Journal of Aerosol Science, 13(6), 549-560.
109
Finlay, W. H., and Martin, A. R. (2008). Recent advances in predictive
understanding of respiratory tract deposition. Journal of Aerosol Medicine, 21(2),
1-17.
Foord, N., Black, A., and Walsh, M. (1978). Regional deposition of 2.5–7.5 μm
diameter inhaled particles in healthy male non-smokers. Journal of Aerosol
Science, 9, 343-357.
Golshahi, L., Noga, M. L., Thompson, R. B., and Finlay W. H. (2011). In vitro
deposition measurement of inhaled micrometer-sized particles in extrathoracic
airways of children and adolescents during nose breathing. Journal of Aerosol
Science, 42(7), 474-488.
Grgic, B., Finlay W. H., Burnell, P. K. P., Heenan, A. F. (2004a). In vitro
intersubject and intrasubject deposition measurements in realistic mouth-throat
geometries. Journal of Aerosol Science, 35, 1025-1040.
Grgic, B., Finlay W. H., Heenan, A. F. (2004b). Regional aerosol deposition and
flow measurements in an idealized mouth and throat. Journal of Aerosol Science,
35, 21-32.
Grgic, B., Martin, A. R., and Finlay W. H. (2006). The effect of unsteady flow
rate increase on in vitro mouth-throat deposition of inhaled boluses. Journal of
Aerosol Science, 37, 1222-1233.
Lippmann, M., and Albert, R. E. (1969). The effect of particle size on the regional
deposition of inhaled aerosols in the human respiratory tract. American Industrial
Hygiene Association Journal, 30, 257-275.
110
Martonen, T. B., and Lowe, J. (1983). Assessment of aerosol deposition patterns
in human respiratory tract casts. In Marple, V. A., and Liu, B. Y. H., eds.
Aerosols in the mining and industrial work environments. Ann Arbor Science
Publishers, Ann Arbor, 151-164.
McRobbie, D. W., Pritchard, S., and Quest, R. A. (2003). Studies of the human
oropharyngeal airspaces using magnetic resonance imaging. I. Validation of a
three-dimensional MRI method for producing ex vivo virtual and physical casts of
the oropharyngeal airways during inspiration. Journal of Aerosol Medicine, 16(4),
401-415.
Pritchard, J. N., Black, A., Foord, N., Walsh, M. (1981). A comparison of the
regional deposition of monodisperse polystyrene aerosols in the respiratory tracts
of healthy male smokers and non-smokers. Journal of Aerosol Science, 12(3),
Page 214.
Pritchard, S. E., and McRobbie, D. W. (2004). Studies of the human
oropharyngeal airspaces using magnetic resonance imaging. II. The use of three-
dimensional gated MRI to determine the influence of mouthpiece diameter and
resistance of inhalation devices on the oropharyngeal airspace geometry. Journal
of Aerosol Medicine, 17(4), 310-324.
Roller, C. M., Zhang, G., Troedson, R. G., Leach, C. L., Le Souef, P. N., and
Devadason, S. G. (2007). Spacer inhalation technique and deposition of extrafine
aerosol in asthmatic children. The European Respiratory Journal, 29, 299-306.
Schiller-Scotland, C. H. F., Hlawa, R., Gebhart, J., Wonne, R., and Heyder, J.
(1992) Total deposition of aerosol particles in the respiratory tract of children
111
during spontaneous and controlled mouth breathing. Journal of Aerosol Science,
23(Suppl. 1), S457-S460.
Stahlhofen, W., Gebhart, J., and Heyder, J. (1980). Experimental determination of
the regional deposition of aerosol particles in the human respiratory tract.
American Industrial Hygiene Association Journal, 41(6): 385-398a.
Stahlhofen, W., Gebhart, J., Heyder, J., Scheuch, G. (1983). New regional
deposition data of the human respiratory tract. Journal of Aerosol Science, 14(3),
186-188.
Stahlhofen, W., Gebhart, J., Heyder, J., Scheuch, G., Juraske, P. (1984). Particle
deposition in extrathoracic airways of healthy subjects and of patients with early
stages of laryngeal carcinoma. Journal of Aerosol Science, 15(3), 215-217.
Stahlhofen, W., Rudolf, G., and James, A. C. (1989). Intercomparison of
experimental regional aerosol deposition data. Journal of Aerosol Medicine, 2(3),
285-308.
Stapleton, K. W., Guentsch, E., Hoskinson, M. K., and Finlay, W. H. (2000). On
the suitability of k-turbulence modeling for aerosol deposition in the mouth and
throat: a comparison with experiment. Journal of Aerosol Science, 31, 739-749.
Storey-Bishoff, J., Noga, M., and Finlay, W. H. (2008). Deposition of
Micrometer-Sized Aerosol Particles in Infant Nasal Airway Replicas. Journal of
Aerosol Science, 39, 1055–1065.
Svartengren, M., Falk, R., Linnman, L., Philipson, K., and Camner, P. (1987).
Deposition of large particles in human lung. Experimental Lung Research, 12(1),
75-88.
112
Svartengren, K., Lindestad, A. P., Svartengren, M., Bylin, G., Philipson, K., and
Camner, P. (1994). Deposition of inhaled particles in the mouth and throat of
asthmatic subjects. European Respiratory Journal, 7, 1467-1473.
Svartengren, K., Lindestad, A. P., Svartengren, M., Philipson, K., Bylin, G., and
Camner, P. (1995). Added external resistance reduces oropharyngeal deposition
and increases lung deposition of aerosol particles in asthmatics. American Journal
of Respiratory and Critical Care Medicine, 152(1), 32-37.
Swift, D. L. (1992). Apparatus and method for measuring regional distribution of
therapeutic aerosols and comparing delivery systems. Journal of Aerosol Science,
23(Suppl. 1), S495-S498.
Zhou, Y., Sun, J., and Cheng Y. S. (2011). Comparison of deposition in the USP
and physical mouth-throat models with solid and liquid particles. Journal of
Aerosol Medicine and Pulmonary Drug Delivery, 24, 1-8.
113
CHAPTER 5 : AN IDEALIZED CHILD THROAT THAT
MIMICS AVERAGE PEDIATRIC OROPHARYNGEAL
DEPOSITION
A very similar version of this chapter is in press as an Aerosol Research Letter:
Golshahi, L., and Finlay, W. H. (2012). An Idealized Child Throat that Mimics
Average Pediatric Oropharyngeal Deposition. Aerosol Science and Technology,
46(5), i-iv. Copyright 2012. Mount Laurel, NJ. Reprinted with permission.
5.1 Introduction
Extrathoracic deposition plays an important role in determining the total lung
dose (TLD) of pharmaceutical inhalers (Borgstrom et al. 2006; Stahlhofen et al.
1989). Because of possible fluid mechanic interactions between the oral cavity and
the flow exiting an inhaler (DeHaan and Finlay 2004), geometric mimics of the
mouth-throat are useful in aiding inhaler design. Thus, there has been a long-term
interest in simplifying the testing of drug delivery devices by having a simple
geometry that can be used to mimic average extrathoracic deposition among
adults and children.
In vitro methods using physical oral airway models have been successful in
mimicking TLD for adult subjects (Delvadia et al. 2012; Ehtezazi et al. 2005;
Finlay and Martin 2008). The use of a single geometry such as the United States
Pharmacopeia (USP) induction port to mimic throat deposition and thereby
measure TLD has been popular for testing inhalers due to its relative simplicity.
However, the USP throat is far from resembling a realistic human airway; thus, it

114
has not been successful in replicating mouth-throat deposition of gently delivered
aerosols (Srichana et al. 2000; Zhang et al. 2007; Zhou et al. 2011). To address
these limitations of the highly simplified USP throat, an idealized adult throat, the
‘Alberta Idealized Throat’, has previously been developed by our group based on
the actual geometry of human extrathoracic airways (Stapleton et al. 2000). This
throat has been successful in replicating extrathoraic deposition (Zhang et al.
2007; Grgic et al. 2004 a, b; Zhou et al. 2011) and is commercially available
(Copley Scientific, UK).
Due to recent interest in optimizing pediatric drug delivery, pediatric models
are needed for in vitro testing. Studies have been done by our group (Storey-
Bishoff et al. 2008; Golshahi et al. 2011a) and others (Janssens et al. 2001;
Minocchieri et al. 2008; Corcoran et al. 2003; Laube et al. 2010) to mimic
pediatric deposition with airway models, mostly among infants and young
children who are nose breathers. However, as for adults, there is a need for a
single idealized model to consistently predict average pediatric deposition.
Previously, MRI scans of children, younger than five years old, have been used to
modify the laryngeal region of the Alberta Idealized Throat to replicate the oral
airway of a five year old child (Wachtel et al. 2010). This modified idealized
throat was used to test Respimat® Soft MistTM
inhalers (Boehringer Ingelheim,
Germany) with and without a holding chamber. The capability of this non-
uniformly modified idealized throat to give average deposition among children
younger than five years old remains to be examined. Since inhalers are more
common among older children, we recently completed a systematic study to
115
examine and reduce the intersubject variability in deposition of micrometer-sized
particles in oral airways of children aged 6-14 years (Golshahi et al. 2011b). The
present communication examines the possibility of uniformly scaling the Alberta
Idealized Throat to replicate average deposition among children with a single
simplified geometry. This scaling is based on our recent measurements of the
dimensions of children’s oropharyngeal airways and deposition of micrometer-
sized particles in replicas of these airways (Golshahi et al. 2011b). The
development of such a simple geometry can be considered a major advance in the
field of pediatric drug delivery since it will provide a standard platform for
optimizing the treatment of children with inhaled pharmaceutical aerosols.
5.2 Methods
In our recent study with oropharyngeal airway replicas of children, the
characteristic diameter that resulted in the most reduction in scatter due to
intersubject variability was the ratio of the volume to the surface area of the
airway (dc=V/As) (Golshahi et al. 2011b). By examining CT scans of oral airways
of children and adults, it appears that the main geometrical features of the child
and adult airways are similar. Thus, it would seem logical that scaling the Alberta
Idealized Throat by a uniform factor based on the average characteristic diameter
would be suitable to mimic average oral deposition among children. The scale
factor of 0.62 was thus used for scaling the Adult Idealized Throat in Magics
software (Materialise, USA) based on the above reasoning. This scaling resulted
in a characteristic diameter (V/As) of 2.7 mm, which is equal to the average of the
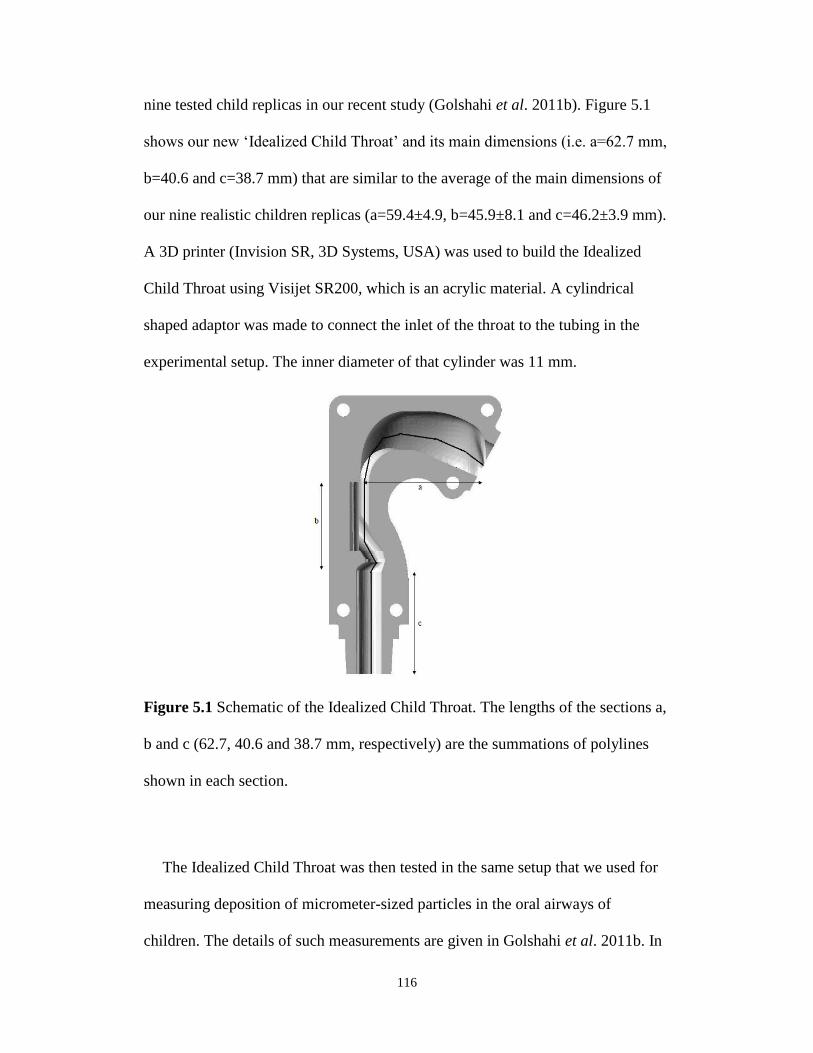
116
nine tested child replicas in our recent study (Golshahi et al. 2011b). Figure 5.1
shows our new ‘Idealized Child Throat’ and its main dimensions (i.e. a=62.7 mm,
b=40.6 and c=38.7 mm) that are similar to the average of the main dimensions of
our nine realistic children replicas (a=59.4±4.9, b=45.9±8.1 and c=46.2±3.9 mm).
A 3D printer (Invision SR, 3D Systems, USA) was used to build the Idealized
Child Throat using Visijet SR200, which is an acrylic material. A cylindrical
shaped adaptor was made to connect the inlet of the throat to the tubing in the
experimental setup. The inner diameter of that cylinder was 11 mm.
Figure 5.1 Schematic of the Idealized Child Throat. The lengths of the sections a,
b and c (62.7, 40.6 and 38.7 mm, respectively) are the summations of polylines
shown in each section.
The Idealized Child Throat was then tested in the same setup that we used for
measuring deposition of micrometer-sized particles in the oral airways of
children. The details of such measurements are given in Golshahi et al. 2011b. In
117
brief, an Electrical Low Pressure Impactor (Dekati, Finland) was used for
measuring the size distribution of polydisperse jojoba oil aerosols, generated by a
six jet Collison atomizer (BGI Inc., USA). The absolute difference between
number concentration in the line with no replica and the line with the replica was
defined as the deposition for each particle size, given as the cut sizes of ELPI,
which were 0.5, 0.8, 1.3, 2.0, 3.2 and 5.3 micrometers. The tested flow rates were
30, 60, 90 and 120 L/min, which were generated using two vacuum pumps in
parallel and recorded using a digital mass flow meter (TSI Model 4043, USA) for
both lines (blank and replica line). At 60 L/min the number concentration of 5.3
m particles was too low to be considered and at 90 and 120 L/min the number of
3.2 and 5.3 m were too low; thus, those sizes were excluded at the associated
flow rates. The variable dilution air, as a result of the resistance of the replica
compared to the blank line, was corrected similar to our previous work (Storey-
Bishoff et al. 2008; Golshahi et al. 2011 a, b). The replica was also removed and
the difference between the number concentration through the blank line and the
replica line was measured and defined as the baseline, which was then subtracted
from the total deposition. Five measurements were made for each data point.
5.3 Results and Discussion
Figure 5.2 shows the deposition of particles in the “Idealized Child Throat”
versus the impaction parameter (da2Q, where da is aerodynamic diameter and Q is
inhalation flow rate) compared with the nine children (aged 6-14 years) in our
previous study (Golshahi et al. 2011b). It is observed that deposition in the
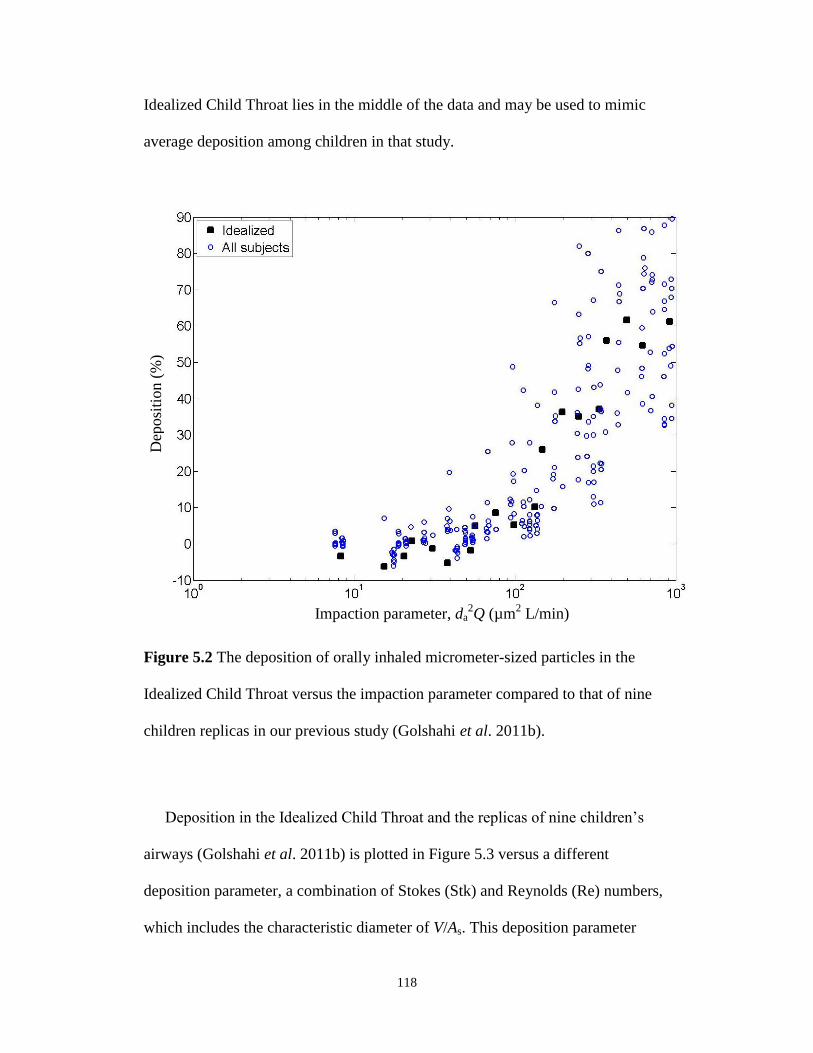
118
Idealized Child Throat lies in the middle of the data and may be used to mimic
average deposition among children in that study.
Figure 5.2 The deposition of orally inhaled micrometer-sized particles in the
Idealized Child Throat versus the impaction parameter compared to that of nine
children replicas in our previous study (Golshahi et al. 2011b).
Deposition in the Idealized Child Throat and the replicas of nine children’s
airways (Golshahi et al. 2011b) is plotted in Figure 5.3 versus a different
deposition parameter, a combination of Stokes (Stk) and Reynolds (Re) numbers,
which includes the characteristic diameter of V/As. This deposition parameter
Impaction parameter, da2Q (µm
2 L/min)
Dep
osi
tion
(%
)
119
successfully minimized the scatter of the deposition data among our child airway
replicas (Golshahi et al. 2011b). It appears that deposition in the Idealized Child
Throat for the deposition parameter in the mid range of 600-2000 is slightly
(~10%) higher than the average predictive correlation given in Golshahi et al.
2011b for nine children 6-14 years old. This is presumably because the Idealized
Child Throat is a simplified geometry and does not include all of the complex
features of the anatomical airways. Hence, this simplification may affect the
dynamics of aerosol and flow in a way that is reflected in the data. This slight
overestimation was similarly observed in the data with our Adult Idealized Throat
(Grgic et al. 2004 a). Despite this overestimation, however, the adult Alberta
Idealized Throat was successful in replicating average in vivo deposition (Zhang
et al. 2007; Grgic et al. 2004 a, b; Zhou et al. 2011).
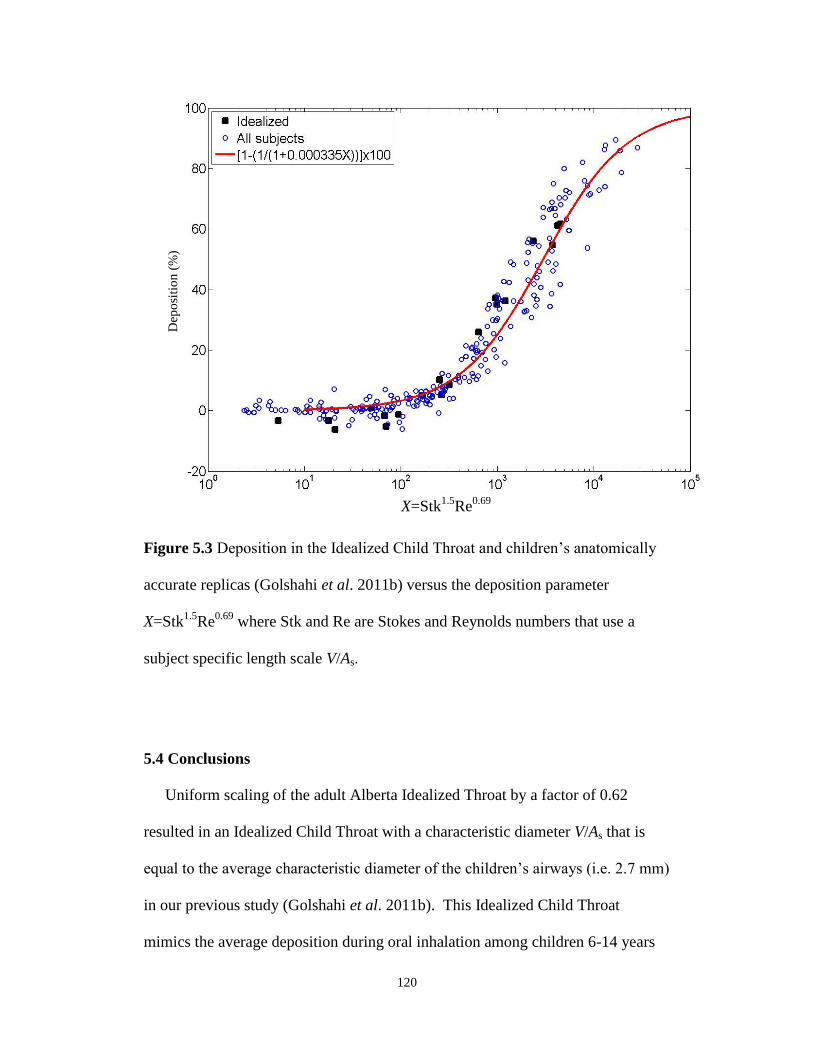
120
Figure 5.3 Deposition in the Idealized Child Throat and children’s anatomically
accurate replicas (Golshahi et al. 2011b) versus the deposition parameter
X=Stk1.5
Re0.69
where Stk and Re are Stokes and Reynolds numbers that use a
subject specific length scale V/As.
5.4 Conclusions
Uniform scaling of the adult Alberta Idealized Throat by a factor of 0.62
resulted in an Idealized Child Throat with a characteristic diameter V/As that is
equal to the average characteristic diameter of the children’s airways (i.e. 2.7 mm)
in our previous study (Golshahi et al. 2011b). This Idealized Child Throat
mimics the average deposition during oral inhalation among children 6-14 years
X=Stk1.5
Re0.69
Dep
osi
tio
n (
%)
121
old in that study. Thus, this geometry may be useful for substantially simplifying
experimental studies involving the design and development of inhalers for oral
inhaled aerosol drug delivery to the lungs in child patient populations.
5.5 Bibliography
Borgstrom, L., Olsson, B., and Thorsson, L. (2006). Degree of throat deposition
can explain the variability in lung deposition of inhaled drugs. Journal of Aerosol
Medicine and Pulmonary Drug Delivery, 19, 473-483.
Corcoran, T.E., Shortall, B.P., Kim, I.K., Meza, M.P., Chigier, N. (2003). Aerosol
drug delivery using heliox and nebulizer reservoirs: Results from an MRI-based
pediatric model. Journal of Aerosol Medicine and Pulmonary Drug Delivery, 16,
365-271.
DeHaan, W. H., and Finlay, W. H. (2004). Predicting extrathoracic deposition
from dry powder inhalers. Journal of Aerosol Science, 35, 309-331.
Delvadia, R. R., Longest, P. W., and Byron P. R. (2012). In vitro tests for aerosol
deposition. I: scaling a physical model of the upper airways to predict drug
deposition variation in normal humans. Journal of Aerosol Medicine and
Pulmonary Drug Delivery, 25(1), 32-40.
Ehtezazi, T., Southern, K. W., Allanson, D., Jenkinson, I., and O’Callaghan, C.
(2005). Suitability of the upper airway models obtained from MRI studies in
simulating drug lung deposition from inhalers. Pharmaceutical Research, 22,
166-170.
122
Finlay, W. H., and Martin, A. R. (2008). Recent advances in predictive
understanding of respiratory tract deposition. Journal of Aerosol Medicine and
Pulmonary Drug Delivery, 21, 189-205.
Golshahi, L., Noga M. L., Thompson, R. B., and Finlay W.H. (2011a). In vitro
deposition measurement of inhaled micrometer-sized particles in nasal airways of
children and adolescents during nose breathing. Journal of Aerosol Science, 42,
447-488.
Golshahi, L., Noga, M. L., and Finlay, W. H. (2011b). Deposition of inhaled
micrometer-sized particles in oropharyngeal airway replicas of children at
constant flow rates. Submitted to Journal of Aerosol Science.
Grgic, B., Heenan, A. F., Burnell, P.K.P., and Finlay, W. H. (2004a). In vitro
intersubject and intrasubject deposition measurements in realistic mouth-throat
geometries. Journal of Aerosol Science, 35, 1025-1040.
Grgic, B., Finlay, W. H., and Heenan, A. F. (2004b) Regional aerosol deposition
and flow measurements in an idealized mouth and throat. Journal of Aerosol
Science, 35, 21-32.
Janssens, H.M., De Jongste, J.C., Fokkens, W.J., Robben, S.G.F., Wouters, K.,
Tiddens, H.A.W.M. (2001). The Sophia anatomical infant nose-throat (saint)
model: A valuable tool to study aerosol deposition in infants. Journal of Aerosol
Medicine and Pulmonary Drug Delivery, 14, 433-441.
Laube, B.L., Sharpless, G., Shermer, C., Nasir, O., Sullivan, V., Powell, K.
(2010). Deposition of albuterol aerosol generated by pneumatic nebulizer in the
123
Sophia Anatomical Infant Nose-Throat (SAINT) model. Pharmaceutical
Research, 27,1722-1729.
Minocchieri, S., Burren, J.M., Bachmann, M.A., Stern, G., Wildhaber, J., Buob,
S., Schindel, R., Kraemer, R., Frey, U.P., Nelle, M. (2008). Development of the
premature infant nose throat-model (PrINT-Model)-an upper airway replica of a
premature neonate for the study of aerosol delivery. Pediatric Research, 64,141-
146.
Srichana, T., Martin, G., and Marriott, C. (2000). A human oral-throat cast
integrated with a twin-stage impinger for evaluation of dry powder inhalers.
Journal of Pharmacy and Pharmacology, 52, 771-778.
Stahlhofen, W., Rudolf, G., and James, A.C. (1989). Intercomparison of
experimental regional aerosol deposition data. Journal of Aerosol Medicine and
Pulmonary Drug Delivery, 2, 285-308.
Stapleton, K. W., Guentsch, E., Hoskinson, M. K., and Finlay W. H. (2000). On
the suitability of the k-ε turbulence model for aerosol deposition in the mouth and
throat: a comparison with experiments. Journal of Aerosol Science, 31, 739-749.
Storey-Bishoff, J., Noga, M. and Finlay, W. H. (2008). Deposition of micrometer-
sized aerosol particles in infant nasal airway replicas. Journal of Aerosol Science,
39, 1055-1065.
Wachtel, H., Bickmann, D., Breitkreutz, J., Langguth, P. (2010). Can Pediatric
Throat Models and Air Flow Profiles Improve Our Dose Finding Strategy. In
Respiratory Drug Delivery 2010, pp. 195-204, ed. Dalby, R.N., Byron, P. R.,
124
Peart, J., Suman, J. D., Farr, S. J., Young, P.M., Davis Healthcare, Rivergrove,
Illinois.
Zhang, Y., Gilbertson, K., and Finlay, W. H. (2007). In vivo-in vitro comparison
of deposition in three mouth-throat models with Qvar and Turbuhaler inhalers.
Journal of Aerosol Medicine and Pulmonary Drug Delivery, 20, 227-35.
Zhou, Y., Sun, J., Cheng, Y. S. (2011). Comparison of deposition in the USP and
physical mouth-throat models with solid and liquid particles. Journal of Aerosol
Medicine and Pulmonary Drug Delivery, 24(6), 277-284.
125
CHAPTER 6 : COMPARISON OF THE LUNG DOSE IN ADULTS AND
CHILDREN USING THE DEVELOPED CORRELATIONS FOR
EXTRATHORACIC DEPOSITION
A similar version of this chapter’s analyses will appear in Respiratory Drug
Delivery 2012 and is reprinted with permission:
Finlay, W. H., Golshahi, L., and Noga, M. L. (2012). New validated extrathoracic
and pulmonary deposition models for infants and children. Accepted to appear in
Respiratory Drug Delivery 2012 (ISBN Volume 3, 1-933722-59-2), Richard N.
Dalby, Peter R. Byron, Joanne Peart, Stephen J. Farr, Julie D. Suman and Paul
Young, Editors, Davis Healthcare, River Grove, Illinois (May, 2012).
6.1 Introduction
Several competing factors determine the fate of the inhaled medications
among pediatric subjects. Smaller extrathoracic airways of children raise the
expectation of higher deposition during inhalation; however, the effect of the size
of airways is counterbalanced by the lower inhalation flow rate of children, which
lowers the chance of impaction of particles on the surfaces of airways. It is
equally important to consider that the common fashion for drug dose
administration involves either the body mass or the body surface area of the
subjects; thus, the smaller body size of the pediatric subjects should be considered
in studies comparing the total lung dose among various age groups.
126
To address the above uncertainties, the possibility of combining all of the
available extrathoracic correlations to perform a comparison of lung dose among
infants, children and adults is explored in this brief note. In previous chapters, the
development of new correlations to predict the deposition of inhalable aerosols in
the extrathoracic airways of children was explained in detail. Similar correlations
have previously been developed in our group for adults (Grgic et al., 2004). It is
hoped that combining such correlations in the form of a comparative study can be
useful in giving us a perspective on extending the current knowledge of drug dose
administration in adults to yet not fully explored pediatric population.
6.2 Methods
The predictive correlations and their required parameters are listed in Table 6.1.
The average height, weight and tidal breathing flow rates have been taken from
the International Commission on Radiological Protection (ICRP, 1994). Body
surface area (BSA) was calculated using Eq. 6.1 based on a study by Mosteller
(1987).
)kg()cm()(mBSA 2 WH (6.1)
Lung dose (LD) fraction was estimated by subtracting the extrathoracic (ET)
deposition fraction from the inhaled dose as follows:
LD=1-ET (6.2)
The exhaled fraction was assumed negligible considering the breath hold for the
oral inhalation cases, which is typical during the use of single breath inhalers. For
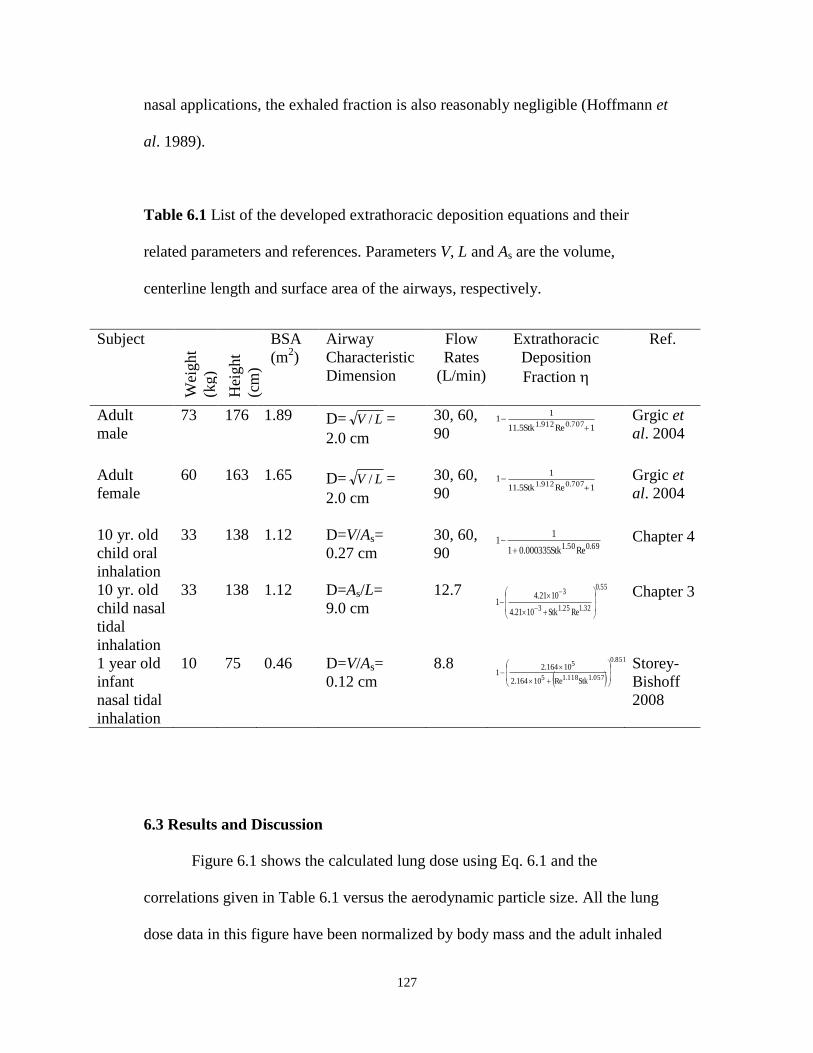
127
nasal applications, the exhaled fraction is also reasonably negligible (Hoffmann et
al. 1989).
Table 6.1 List of the developed extrathoracic deposition equations and their
related parameters and references. Parameters V, L and As are the volume,
centerline length and surface area of the airways, respectively.
Subject
Wei
ght
(kg)
Hei
ght
(cm
)
BSA
(m2)
Airway
Characteristic
Dimension
Flow
Rates
(L/min)
Extrathoracic
Deposition
Fraction
Ref.
Adult
male
73 176 1.89 D= LV / =
2.0 cm
30, 60,
90 1ReStk5.11
11
707.0912.1 Grgic et
al. 2004
Adult
female
60 163 1.65 D= LV / =
2.0 cm
30, 60,
90 1ReStk5.11
11
707.0912.1 Grgic et
al. 2004
10 yr. old
child oral
inhalation
33 138 1.12 D=V/As=
0.27 cm
30, 60,
90 69.050.1 ReStk000335.01
11
Chapter 4
10 yr. old
child nasal
tidal
inhalation
33 138 1.12 D=As/L=
9.0 cm
12.7 55.0
32.125.13
3
ReStk1021.4
1021.41
Chapter 3
1 year old
infant
nasal tidal
inhalation
10 75 0.46 D=V/As=
0.12 cm
8.8
851.0
057.1118.15
5
StkRe10164.2
10164.21
Storey-
Bishoff
2008
6.3 Results and Discussion
Figure 6.1 shows the calculated lung dose using Eq. 6.1 and the
correlations given in Table 6.1 versus the aerodynamic particle size. All the lung
dose data in this figure have been normalized by body mass and the adult inhaled
128
dose. The flow rate of 60 L/min was used for the calculation of constant-flow
cases and the flow rates given in Table 6.1 were used for other age groups and
breathing paths. The actual lung dose can be obtained by multiplying the values
given in y-axis of Figure 6.1 by the adult inhaled dose.
Figure 6.1 illustrates that the 1-year old infant’s lung dose is
approximately triple the lung dose of an adult, while a 10-year old child breathing
tidally through the nose receives almost double the adult dose. This observed
trend is due to the large difference in the body mass of the studied age groups.
When the 10-year old child breathes orally the lung dose is less than the adult
dose for the two large sizes of particles (4 and 5 m) examined herein. This is an
interesting observation considering that the nose is normally considered a better
filter compared to the oral airways. Our data, however, show that the lower
breathing flow through the nose results in lower losses in nasal airways. Also,
more losses occur in oropharyngeal airways of children during high constant flow
rates that are typical of what happens during inhalation of the dose emitted from
the common inhalers.
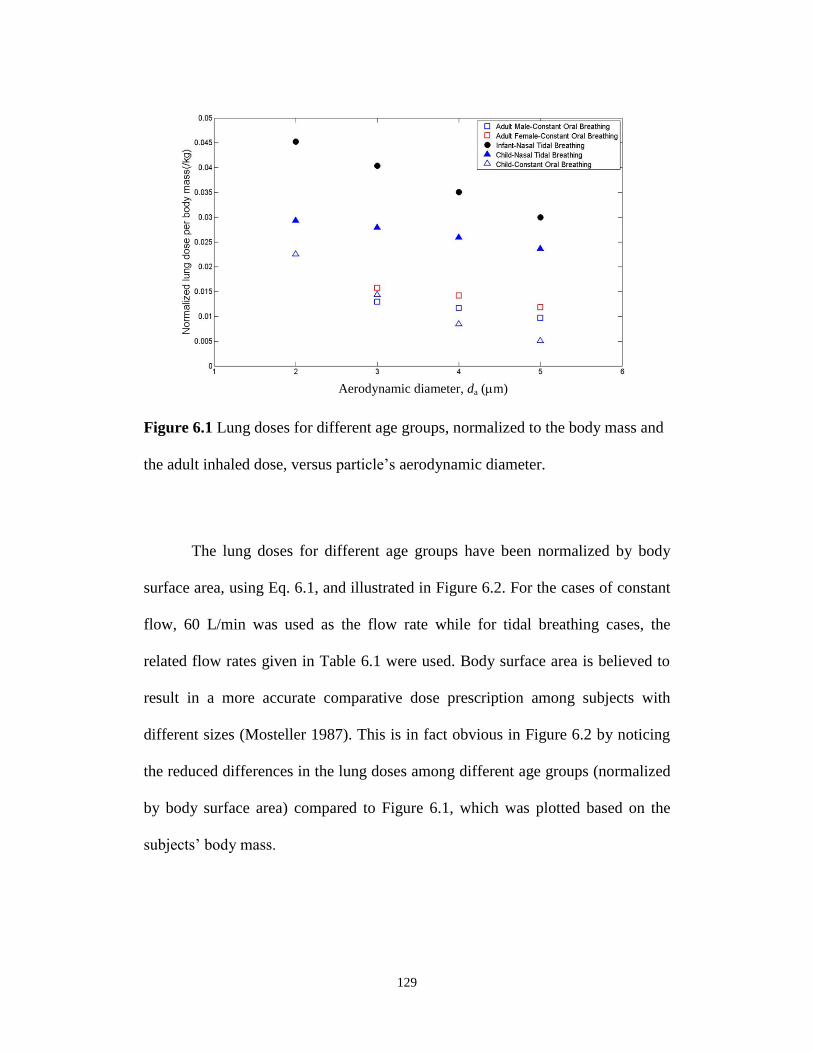
129
Figure 6.1 Lung doses for different age groups, normalized to the body mass and
the adult inhaled dose, versus particle’s aerodynamic diameter.
The lung doses for different age groups have been normalized by body
surface area, using Eq. 6.1, and illustrated in Figure 6.2. For the cases of constant
flow, 60 L/min was used as the flow rate while for tidal breathing cases, the
related flow rates given in Table 6.1 were used. Body surface area is believed to
result in a more accurate comparative dose prescription among subjects with
different sizes (Mosteller 1987). This is in fact obvious in Figure 6.2 by noticing
the reduced differences in the lung doses among different age groups (normalized
by body surface area) compared to Figure 6.1, which was plotted based on the
subjects’ body mass.
Aerodynamic diameter, da (m)
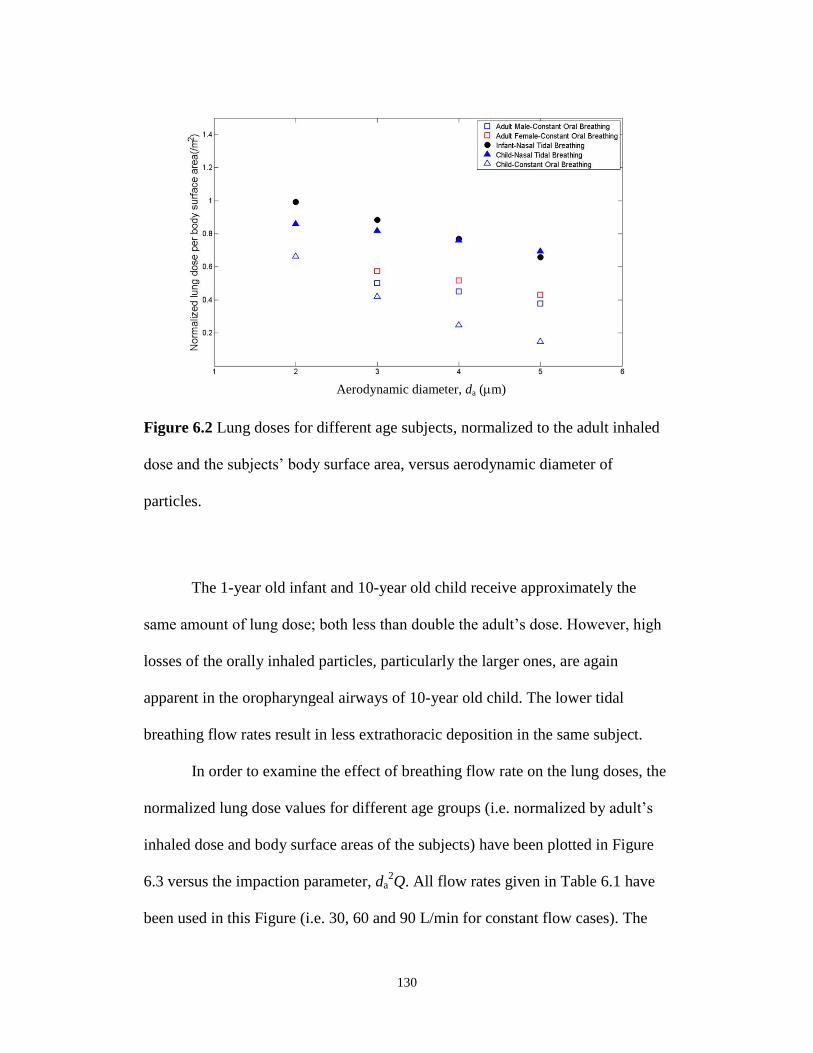
130
Figure 6.2 Lung doses for different age subjects, normalized to the adult inhaled
dose and the subjects’ body surface area, versus aerodynamic diameter of
particles.
The 1-year old infant and 10-year old child receive approximately the
same amount of lung dose; both less than double the adult’s dose. However, high
losses of the orally inhaled particles, particularly the larger ones, are again
apparent in the oropharyngeal airways of 10-year old child. The lower tidal
breathing flow rates result in less extrathoracic deposition in the same subject.
In order to examine the effect of breathing flow rate on the lung doses, the
normalized lung dose values for different age groups (i.e. normalized by adult’s
inhaled dose and body surface areas of the subjects) have been plotted in Figure
6.3 versus the impaction parameter, da2Q. All flow rates given in Table 6.1 have
been used in this Figure (i.e. 30, 60 and 90 L/min for constant flow cases). The
Aerodynamic diameter, da (m)
131
least square method was used in Matlab to fit a linear equation to the normalized
lung dose. The approximate collapse of all the data (R2=0.83) on a line suggests
the possibility of correcting pediatric lung doses to achieve approximately
uniform dose per body surface area among different age groups. For instance, by
knowing that infant’s breathing flow rate is about one-tenth of adult’s breathing
flow rate, for a known particle size released from an inhaler the impaction
parameter of infant (da2Q) is also one-tenth of adult’s case. By substituting the
parameter x in the fitted equation (Eq. 6.2) with 1 and 0.1, the difference between
the y values would be 0.44. This means that by prescribing approximately half
(precisely 44%) of the labeled dose to an infant, the same dose per unit body mass
as adults would be obtained by an infant.
xy 10log44.07.1 (6.2)
Note that different results would be obtained by considering different inhaled
fractions by infants and children compared with adults. In Figures 6.1, 6.2 and 6.3
the infant’s inhaled dose was considered as half of the adult’s dose whereby
child’s inhaled dose was considered equal to the adult’s inhaled dose (Chambers
et al. 2009).

132
Figure 6.3 Lung doses for different age group subjects, normalized to the adult
inhaled dose and the body surface area of different age groups, versus the inertial
impaction parameter da2Q.
6.4 Conclusions
Application of the correlations, developed for the prediction of extrathoracic
deposition, in the estimation of lung dose was examined. Also, relating the dose
efficacious for adults to the pediatric subjects was learned to be promising with
the use of Eq. 6.2. Such comparative estimations may be useful for developing
new inhalers and improving the inhalation drug delivery to the children suffering
from respiratory diseases.
Impaction parameter, da2Q (m
2 L min
-1)

133
6.5 Bibliography
Chambers, F. E., Brown, S., and Ludzik, A. J. (2009). Comparative in vitro
performance of valved holding chambers with a budesonide/formoterol
pressurized metered-dose inhaler. Allergy and Asthma Proceedings, 30(4), 424-
432.
Grgic, B., Finlay W. H., Burnell, P. K. P., Heenan, A. F. (2004). In vitro
intersubject and intrasubject deposition measurements in realistic mouth-throat
geometries. Journal of Aerosol Science, 35, 1025-1040.
Hofmann, W., Martonen, T.B., Graham, R.C. (1989), Predicted deposition of
nonhygroscopic aerosols in the human lung as a function of subject age. Journal
of Aerosol Medicine, 2, 49-68.
ICRP (International Commission on Radiological Protection) (1994), Human
respiratory tract model for radiological protection, Annals of the ICRP, ICRP
Publication 66, Elsevier, New York.
Mosteller R. D. (1987), Simplified calculation of body surface area. New England
Journal of Medicine, 317(17), 1098.
Storey-Bishoff, J., Noga, M. and Finlay, W. H. (2008). Deposition of Micrometer-
sized Aerosol Particles in Infant Nasal Airway Replicas. Journal of Aerosol
Science, 39, 1055-1065.
134
CHAPTER 7 : CONCLUSIONS
7. 1 Summary and Conclusions
In this thesis, a collection of in vitro predictive correlations were
developed to estimate the deposition of aerosols of various sizes in the
extrathoracic airways of children of different ages. The correlations will be useful
for exposure studies and inhalation drug delivery. Intersubject variability was
reduced by characterizing the geometry of the airways and relating the most
relevant characteristic diameter to deposition in each case.
In summary, the deposition of ultrafine particles in nasal airways of
infants was measured and a single predictive correlation was proposed to estimate
the deposition of a known ultrafine particle in the range of 13-100 nm at a known
breathing pattern for an individual (3-18 months) with a given airway volume and
length. Airway volume and length can be relatively easily measured by acoustic
rhinometry in vivo. Also, the deposition of micrometer-sized particles (0.5-5.3
m) was measured in nasal airways of children 4-14 years old and a single
predictive correlation was developed. The ratio of surface area to the length of
airway was characterized as the most relevant characteristic diameter in this case.
However, a second correlation based on the airway volume and the centerline
length of the airways was presented as an alternative to simplify the in vivo
measurements of the dimensions of the airways. In addition, the development of a
technique to CT scan the oral airways of children 6-14 years of age was
presented. In vitro measurement of the deposition of micrometer-sized particles
(0.5-5.3 m) in the oropharyngeal airway replicas, fabricated using the recorded
135
CT scans images and rapid prototyping, was related to the volume and surface
area of the airway and a single predictive individualized correlation was
introduced. An alternative equation was also proposed based on the volume and
length of the centerline of the oral airways. Moreover, the development of an
idealized child throat, based on our findings in Chapter 4, was presented here.
Such an idealized child throat is hoped to significantly facilitate bench-top
inhalation drug testing. As an illustrative example, the application of the
developed correlations in the comparative studies, relating adult’s lung dose to
pediatric lung dose, was also reported as a part of this study.
7.2 Future Work
1. Deposition in Oropharyngeal Airways during Tidal Breathing
In this study, experiments were performed to measure the deposition of
micrometer-sized particles in nine children replicas and the idealized child throat
during tidal breathing. Completion of the analysis of recorded data will result in a
predictive correlation with an application in drug delivery using nebulizers.
Computed tomography images of eleven adults were also recorded during
this study, following the same methodology that was used for imaging children’s
oral airways. Eleven airway replicas of these adult subjects were rapid prototyped
and further experiments similar to the ones completed for children will extend
Stahlhofen’s findings (Stahlhofen et al. 1989) for improved individualized drug
delivery to adults using nebulizers. This will be invaluable to address the current
136
lack of individualized correlations including the airway dimensions of adult
subjects.
There are in vivo data available on the lung dose of children during
inhalation of specified medications (Devadason et al., 1997, 2003; Roller et al.,
2007). Experiments are required to measure the deposition of the exact inhalers in
the developed child throat to validate this throat based on the available in vivo
data.
In this study, the focus has been on measuring the deposition during
inhalation only since the lungs geometry was needed to simulate the exhaled
breath realistically; thus, studies are needed to develop lung geometries and
measure the deposition during exhalation. These experiments could be extended
to measure regional deposition of aerosols in the developed lung geometries
during both inhalation and exhalation.
Possible in vivo experiments are also recommended to validate the
developed correlations for a known particle size during controlled breathing in
subjects with known airway geometries.
7.3 Bibliography
Devadason, S. G., Everard, M. L., MacEarlan, C., Roller, C., Summers, Q. A.,
Swift, P., Borgstrom, L., and Le Souef, P. N. (1997). Lung deposition from the
Turbuhaler in children with cystic fibrosis. The European Respiratory Journal,
10, 2023-2028.
137
Devadason, S. G., Huang, T., Walker, S., Troedson, R., and Le Souef, P. N.
(2003). Distribution of technetium-99m-labelled QVARTM
delivered using an
AutohalerTM
device in children. The European Respiratory Journal, 21, 1007-
1011.
Roller, C. M., Zhang, G., Troedson, R. G., Leach, C. L., Le Souef, P. N., and
Devadason, S. G. (2007). Spacer inhalation technique and deposition of extrafine
aerosol in asthmatic children. The European Respiratory Journal, 29, 299-306.
Stahlhofen, W., Rudolf, G., and James, A. C. (1989). Intercomparison of
experimental regional aerosol deposition data. Journal of Aerosol Medicine, 2(3),
285-308.
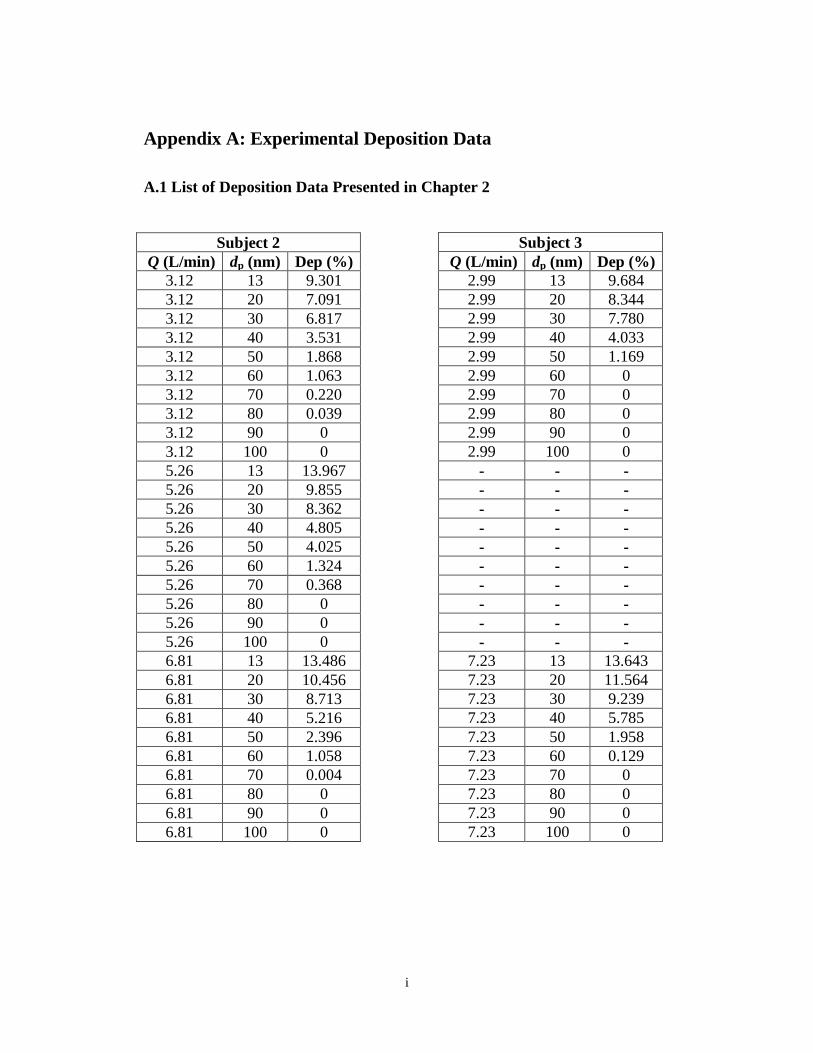
i
Appendix A: Experimental Deposition Data
A.1 List of Deposition Data Presented in Chapter 2
Subject 3
Q (L/min) dp (nm) Dep (%)
2.99 13 9.684
2.99 20 8.344
2.99 30 7.780
2.99 40 4.033
2.99 50 1.169
2.99 60 0
2.99 70 0
2.99 80 0
2.99 90 0
2.99 100 0
- - -
- - -
- - -
- - -
- - -
- - -
- - -
- - -
- - -
- - -
7.23 13 13.643
7.23 20 11.564
7.23 30 9.239
7.23 40 5.785
7.23 50 1.958
7.23 60 0.129
7.23 70 0
7.23 80 0
7.23 90 0
7.23 100 0
Subject 2
Q (L/min) dp (nm) Dep (%)
3.12 13 9.301
3.12 20 7.091
3.12 30 6.817
3.12 40 3.531
3.12 50 1.868
3.12 60 1.063
3.12 70 0.220
3.12 80 0.039
3.12 90 0
3.12 100 0
5.26 13 13.967
5.26 20 9.855
5.26 30 8.362
5.26 40 4.805
5.26 50 4.025
5.26 60 1.324
5.26 70 0.368
5.26 80 0
5.26 90 0
5.26 100 0
6.81 13 13.486
6.81 20 10.456
6.81 30 8.713
6.81 40 5.216
6.81 50 2.396
6.81 60 1.058
6.81 70 0.004
6.81 80 0
6.81 90 0
6.81 100 0
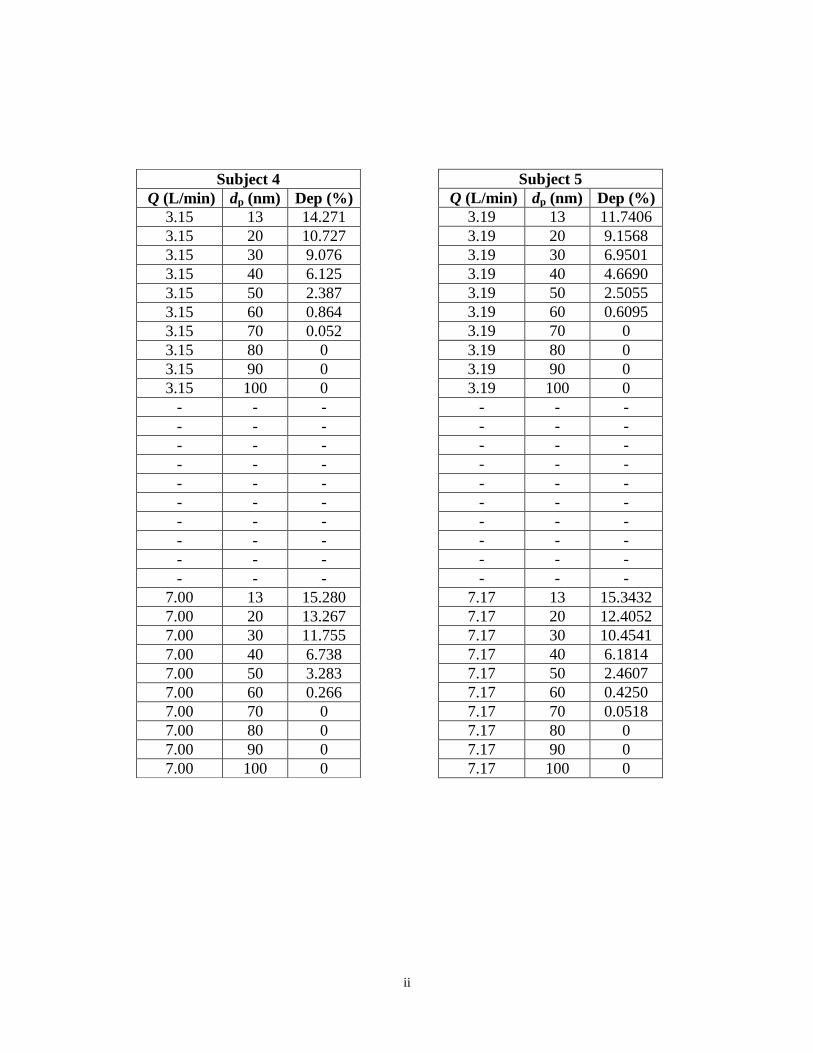
ii
Subject 5
Q (L/min) dp (nm) Dep (%)
3.19 13 11.7406
3.19 20 9.1568
3.19 30 6.9501
3.19 40 4.6690
3.19 50 2.5055
3.19 60 0.6095
3.19 70 0
3.19 80 0
3.19 90 0
3.19 100 0
- - -
- - -
- - -
- - -
- - -
- - -
- - -
- - -
- - -
- - -
7.17 13 15.3432
7.17 20 12.4052
7.17 30 10.4541
7.17 40 6.1814
7.17 50 2.4607
7.17 60 0.4250
7.17 70 0.0518
7.17 80 0
7.17 90 0
7.17 100 0
Subject 4
Q (L/min) dp (nm) Dep (%)
3.15 13 14.271
3.15 20 10.727
3.15 30 9.076
3.15 40 6.125
3.15 50 2.387
3.15 60 0.864
3.15 70 0.052
3.15 80 0
3.15 90 0
3.15 100 0
- - -
- - -
- - -
- - -
- - -
- - -
- - -
- - -
- - -
- - -
7.00 13 15.280
7.00 20 13.267
7.00 30 11.755
7.00 40 6.738
7.00 50 3.283
7.00 60 0.266
7.00 70 0
7.00 80 0
7.00 90 0
7.00 100 0
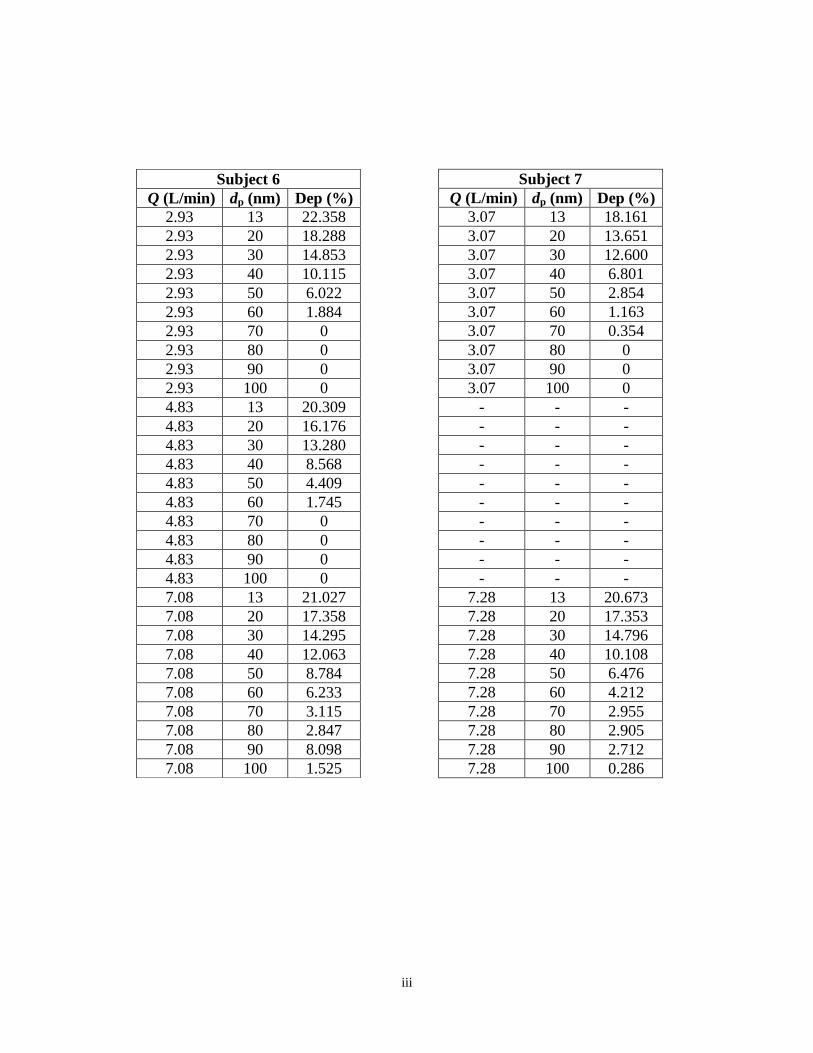
iii
Subject 7
Q (L/min) dp (nm) Dep (%)
3.07 13 18.161
3.07 20 13.651
3.07 30 12.600
3.07 40 6.801
3.07 50 2.854
3.07 60 1.163
3.07 70 0.354
3.07 80 0
3.07 90 0
3.07 100 0
- - -
- - -
- - -
- - -
- - -
- - -
- - -
- - -
- - -
- - -
7.28 13 20.673
7.28 20 17.353
7.28 30 14.796
7.28 40 10.108
7.28 50 6.476
7.28 60 4.212
7.28 70 2.955
7.28 80 2.905
7.28 90 2.712
7.28 100 0.286
Subject 6
Q (L/min) dp (nm) Dep (%)
2.93 13 22.358
2.93 20 18.288
2.93 30 14.853
2.93 40 10.115
2.93 50 6.022
2.93 60 1.884
2.93 70 0
2.93 80 0
2.93 90 0
2.93 100 0
4.83 13 20.309
4.83 20 16.176
4.83 30 13.280
4.83 40 8.568
4.83 50 4.409
4.83 60 1.745
4.83 70 0
4.83 80 0
4.83 90 0
4.83 100 0
7.08 13 21.027
7.08 20 17.358
7.08 30 14.295
7.08 40 12.063
7.08 50 8.784
7.08 60 6.233
7.08 70 3.115
7.08 80 2.847
7.08 90 8.098
7.08 100 1.525
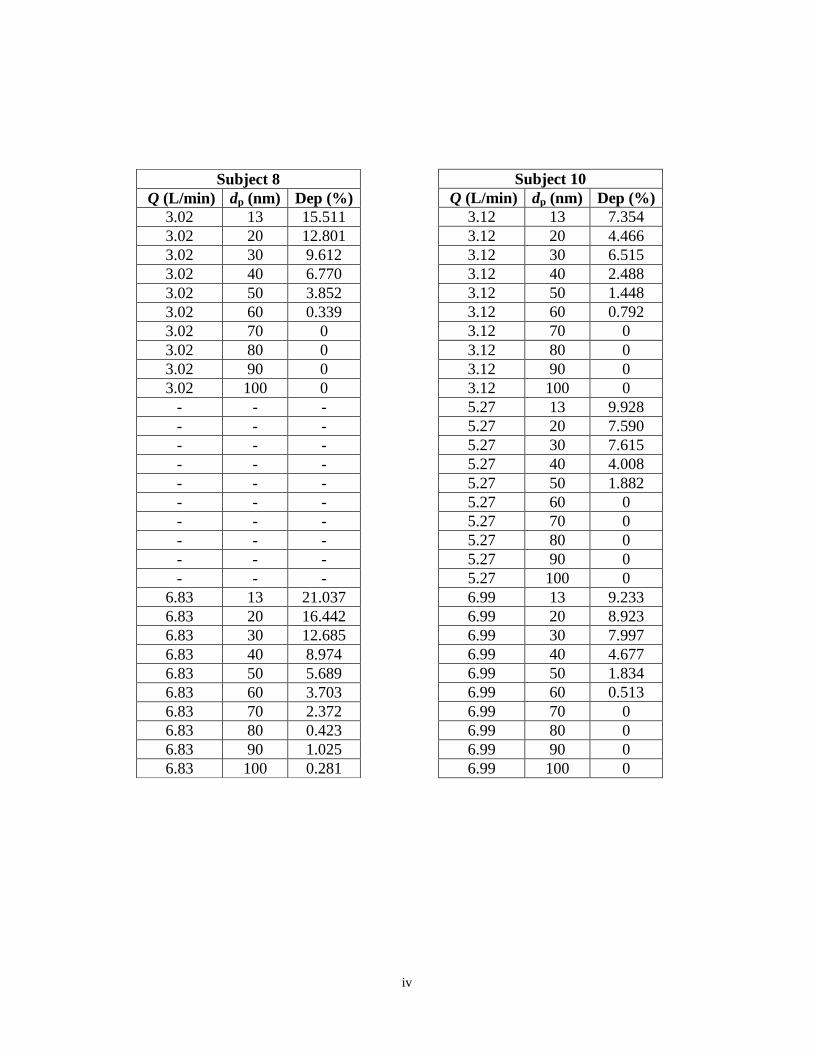
iv
Subject 10
Q (L/min) dp (nm) Dep (%)
3.12 13 7.354
3.12 20 4.466
3.12 30 6.515
3.12 40 2.488
3.12 50 1.448
3.12 60 0.792
3.12 70 0
3.12 80 0
3.12 90 0
3.12 100 0
5.27 13 9.928
5.27 20 7.590
5.27 30 7.615
5.27 40 4.008
5.27 50 1.882
5.27 60 0
5.27 70 0
5.27 80 0
5.27 90 0
5.27 100 0
6.99 13 9.233
6.99 20 8.923
6.99 30 7.997
6.99 40 4.677
6.99 50 1.834
6.99 60 0.513
6.99 70 0
6.99 80 0
6.99 90 0
6.99 100 0
Subject 8
Q (L/min) dp (nm) Dep (%)
3.02 13 15.511
3.02 20 12.801
3.02 30 9.612
3.02 40 6.770
3.02 50 3.852
3.02 60 0.339
3.02 70 0
3.02 80 0
3.02 90 0
3.02 100 0
- - -
- - -
- - -
- - -
- - -
- - -
- - -
- - -
- - -
- - -
6.83 13 21.037
6.83 20 16.442
6.83 30 12.685
6.83 40 8.974
6.83 50 5.689
6.83 60 3.703
6.83 70 2.372
6.83 80 0.423
6.83 90 1.025
6.83 100 0.281
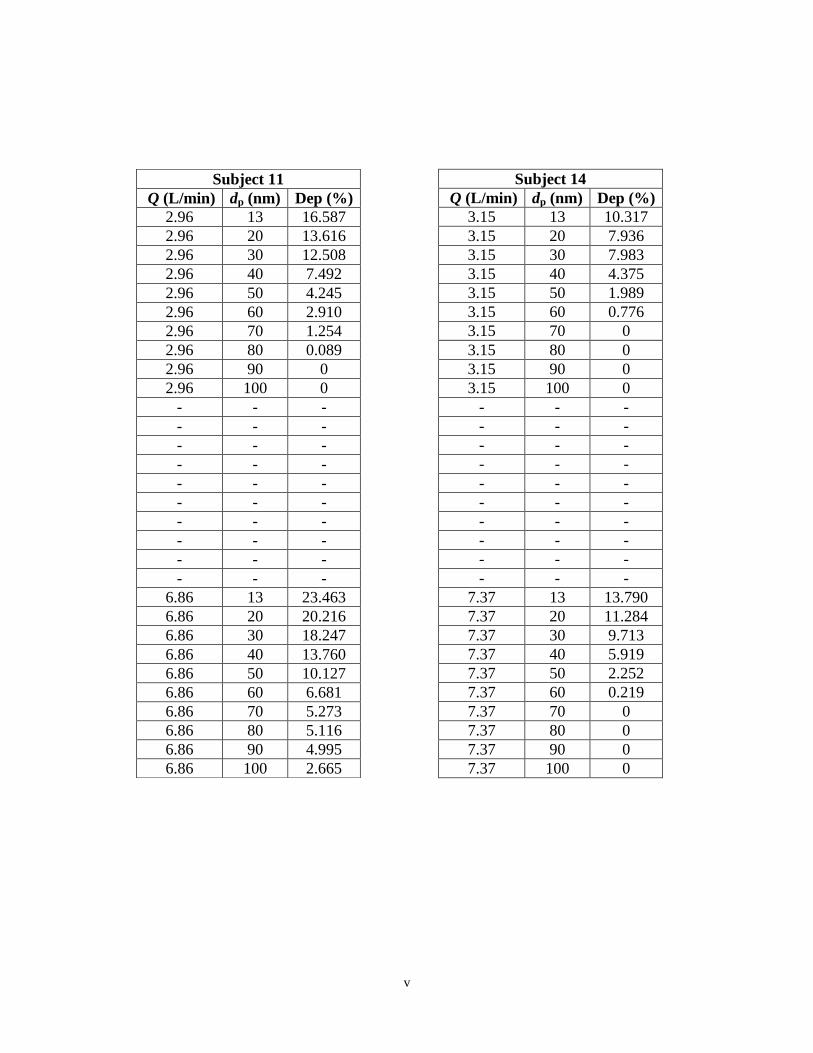
v
Subject 14
Q (L/min) dp (nm) Dep (%)
3.15 13 10.317
3.15 20 7.936
3.15 30 7.983
3.15 40 4.375
3.15 50 1.989
3.15 60 0.776
3.15 70 0
3.15 80 0
3.15 90 0
3.15 100 0
- - -
- - -
- - -
- - -
- - -
- - -
- - -
- - -
- - -
- - -
7.37 13 13.790
7.37 20 11.284
7.37 30 9.713
7.37 40 5.919
7.37 50 2.252
7.37 60 0.219
7.37 70 0
7.37 80 0
7.37 90 0
7.37 100 0
Subject 11
Q (L/min) dp (nm) Dep (%)
2.96 13 16.587
2.96 20 13.616
2.96 30 12.508
2.96 40 7.492
2.96 50 4.245
2.96 60 2.910
2.96 70 1.254
2.96 80 0.089
2.96 90 0
2.96 100 0
- - -
- - -
- - -
- - -
- - -
- - -
- - -
- - -
- - -
- - -
6.86 13 23.463
6.86 20 20.216
6.86 30 18.247
6.86 40 13.760
6.86 50 10.127
6.86 60 6.681
6.86 70 5.273
6.86 80 5.116
6.86 90 4.995
6.86 100 2.665
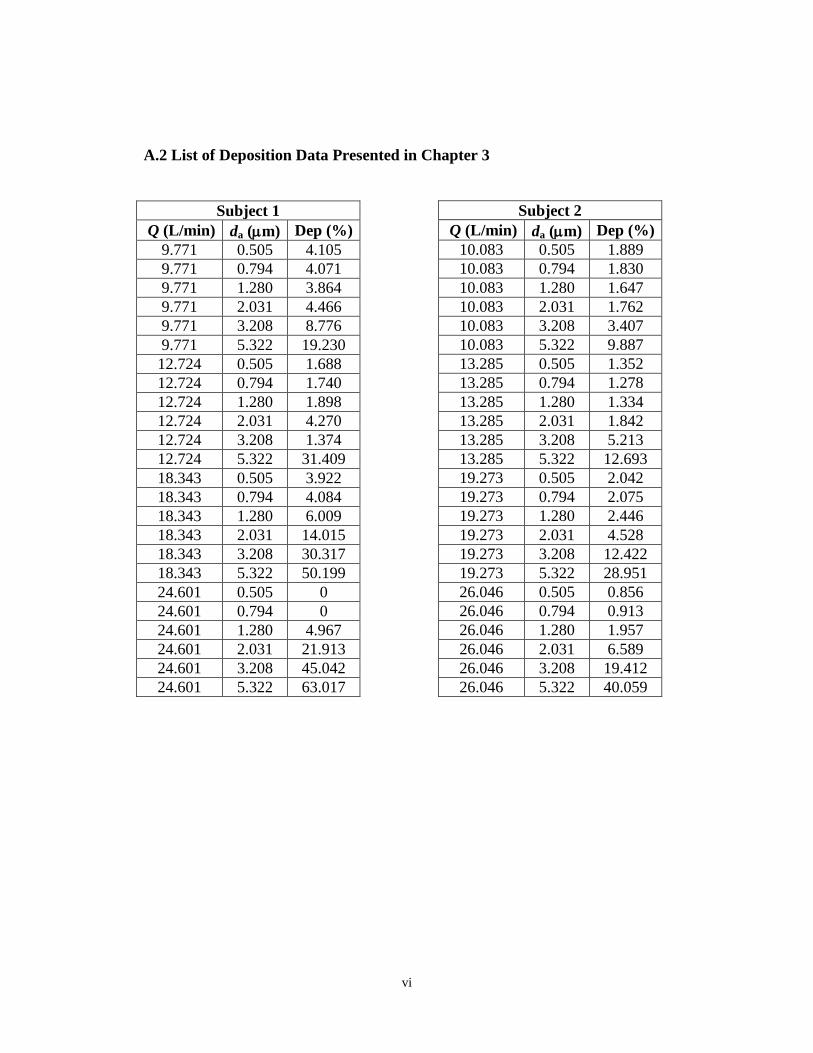
vi
A.2 List of Deposition Data Presented in Chapter 3
Subject 2
Q (L/min) da (m) Dep (%)
10.083 0.505 1.889
10.083 0.794 1.830
10.083 1.280 1.647
10.083 2.031 1.762
10.083 3.208 3.407
10.083 5.322 9.887
13.285 0.505 1.352
13.285 0.794 1.278
13.285 1.280 1.334
13.285 2.031 1.842
13.285 3.208 5.213
13.285 5.322 12.693
19.273 0.505 2.042
19.273 0.794 2.075
19.273 1.280 2.446
19.273 2.031 4.528
19.273 3.208 12.422
19.273 5.322 28.951
26.046 0.505 0.856
26.046 0.794 0.913
26.046 1.280 1.957
26.046 2.031 6.589
26.046 3.208 19.412
26.046 5.322 40.059
Subject 1
Q (L/min) da (m) Dep (%)
9.771 0.505 4.105
9.771 0.794 4.071
9.771 1.280 3.864
9.771 2.031 4.466
9.771 3.208 8.776
9.771 5.322 19.230
12.724 0.505 1.688
12.724 0.794 1.740
12.724 1.280 1.898
12.724 2.031 4.270
12.724 3.208 1.374
12.724 5.322 31.409
18.343 0.505 3.922
18.343 0.794 4.084
18.343 1.280 6.009
18.343 2.031 14.015
18.343 3.208 30.317
18.343 5.322 50.199
24.601 0.505 0
24.601 0.794 0
24.601 1.280 4.967
24.601 2.031 21.913
24.601 3.208 45.042
24.601 5.322 63.017
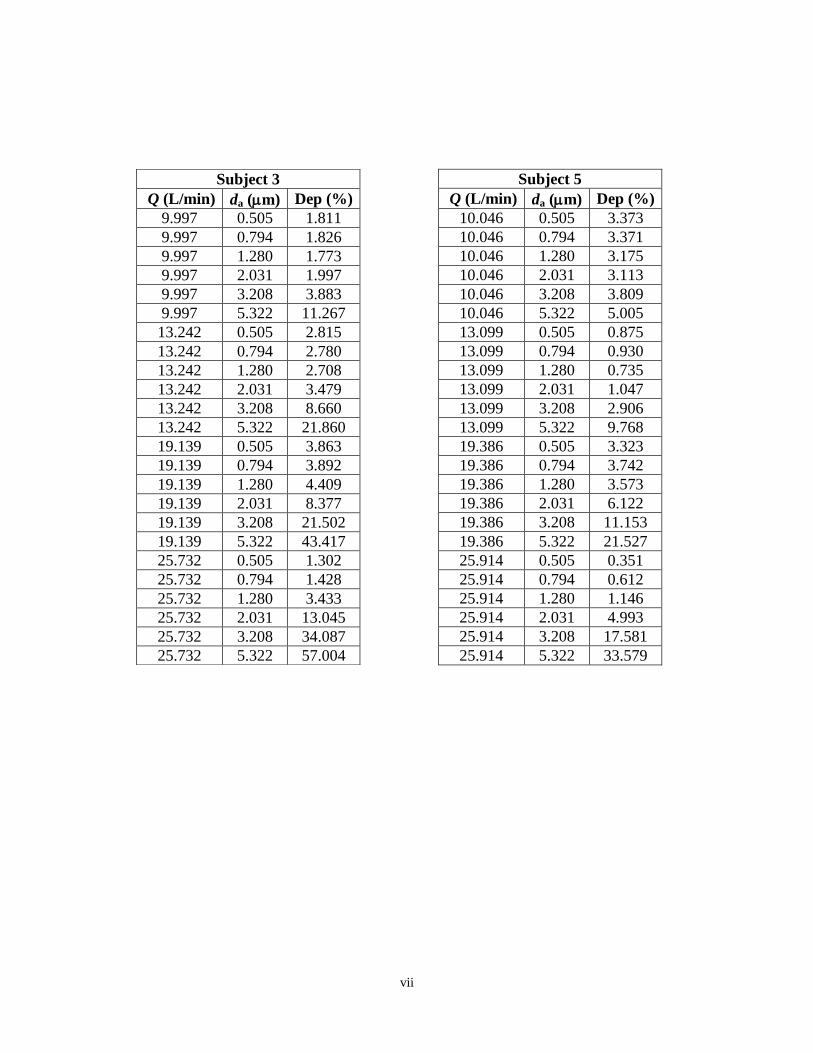
vii
Subject 5
Q (L/min) da (m) Dep (%)
10.046 0.505 3.373
10.046 0.794 3.371
10.046 1.280 3.175
10.046 2.031 3.113
10.046 3.208 3.809
10.046 5.322 5.005
13.099 0.505 0.875
13.099 0.794 0.930
13.099 1.280 0.735
13.099 2.031 1.047
13.099 3.208 2.906
13.099 5.322 9.768
19.386 0.505 3.323
19.386 0.794 3.742
19.386 1.280 3.573
19.386 2.031 6.122
19.386 3.208 11.153
19.386 5.322 21.527
25.914 0.505 0.351
25.914 0.794 0.612
25.914 1.280 1.146
25.914 2.031 4.993
25.914 3.208 17.581
25.914 5.322 33.579
Subject 3
Q (L/min) da (m) Dep (%)
9.997 0.505 1.811
9.997 0.794 1.826
9.997 1.280 1.773
9.997 2.031 1.997
9.997 3.208 3.883
9.997 5.322 11.267
13.242 0.505 2.815
13.242 0.794 2.780
13.242 1.280 2.708
13.242 2.031 3.479
13.242 3.208 8.660
13.242 5.322 21.860
19.139 0.505 3.863
19.139 0.794 3.892
19.139 1.280 4.409
19.139 2.031 8.377
19.139 3.208 21.502
19.139 5.322 43.417
25.732 0.505 1.302
25.732 0.794 1.428
25.732 1.280 3.433
25.732 2.031 13.045
25.732 3.208 34.087
25.732 5.322 57.004
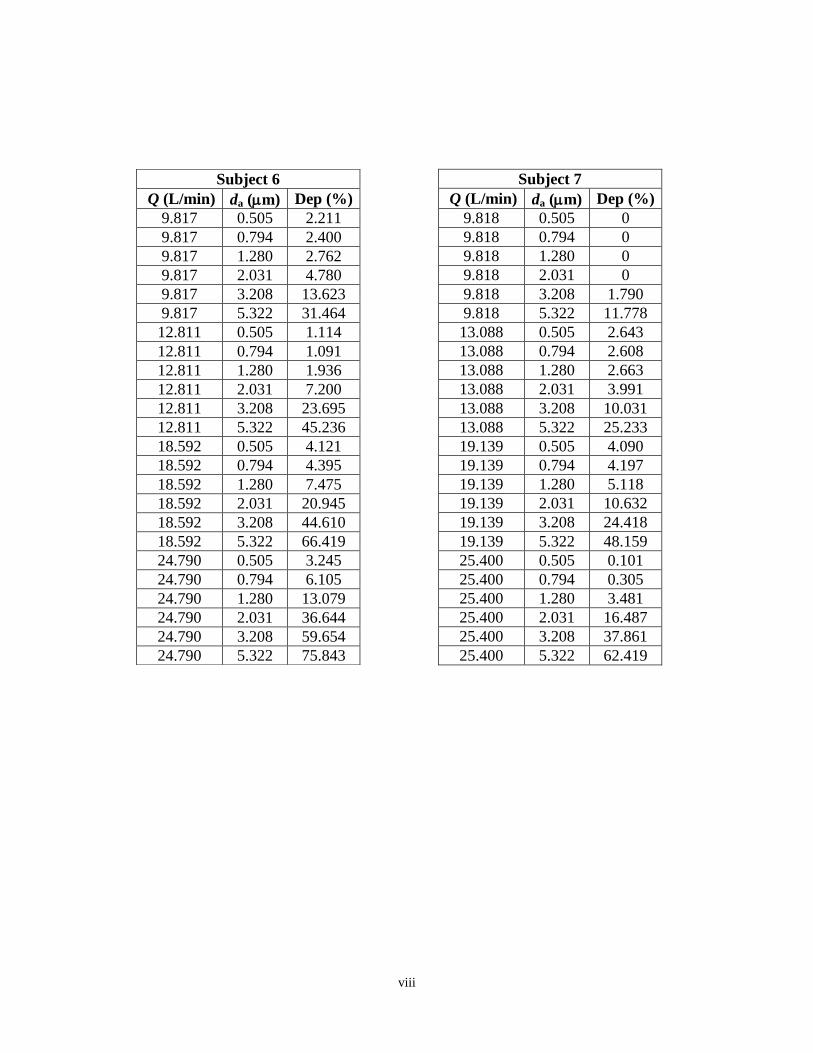
viii
Subject 7
Q (L/min) da (m) Dep (%)
9.818 0.505 0
9.818 0.794 0
9.818 1.280 0
9.818 2.031 0
9.818 3.208 1.790
9.818 5.322 11.778
13.088 0.505 2.643
13.088 0.794 2.608
13.088 1.280 2.663
13.088 2.031 3.991
13.088 3.208 10.031
13.088 5.322 25.233
19.139 0.505 4.090
19.139 0.794 4.197
19.139 1.280 5.118
19.139 2.031 10.632
19.139 3.208 24.418
19.139 5.322 48.159
25.400 0.505 0.101
25.400 0.794 0.305
25.400 1.280 3.481
25.400 2.031 16.487
25.400 3.208 37.861
25.400 5.322 62.419
Subject 6
Q (L/min) da (m) Dep (%)
9.817 0.505 2.211
9.817 0.794 2.400
9.817 1.280 2.762
9.817 2.031 4.780
9.817 3.208 13.623
9.817 5.322 31.464
12.811 0.505 1.114
12.811 0.794 1.091
12.811 1.280 1.936
12.811 2.031 7.200
12.811 3.208 23.695
12.811 5.322 45.236
18.592 0.505 4.121
18.592 0.794 4.395
18.592 1.280 7.475
18.592 2.031 20.945
18.592 3.208 44.610
18.592 5.322 66.419
24.790 0.505 3.245
24.790 0.794 6.105
24.790 1.280 13.079
24.790 2.031 36.644
24.790 3.208 59.654
24.790 5.322 75.843
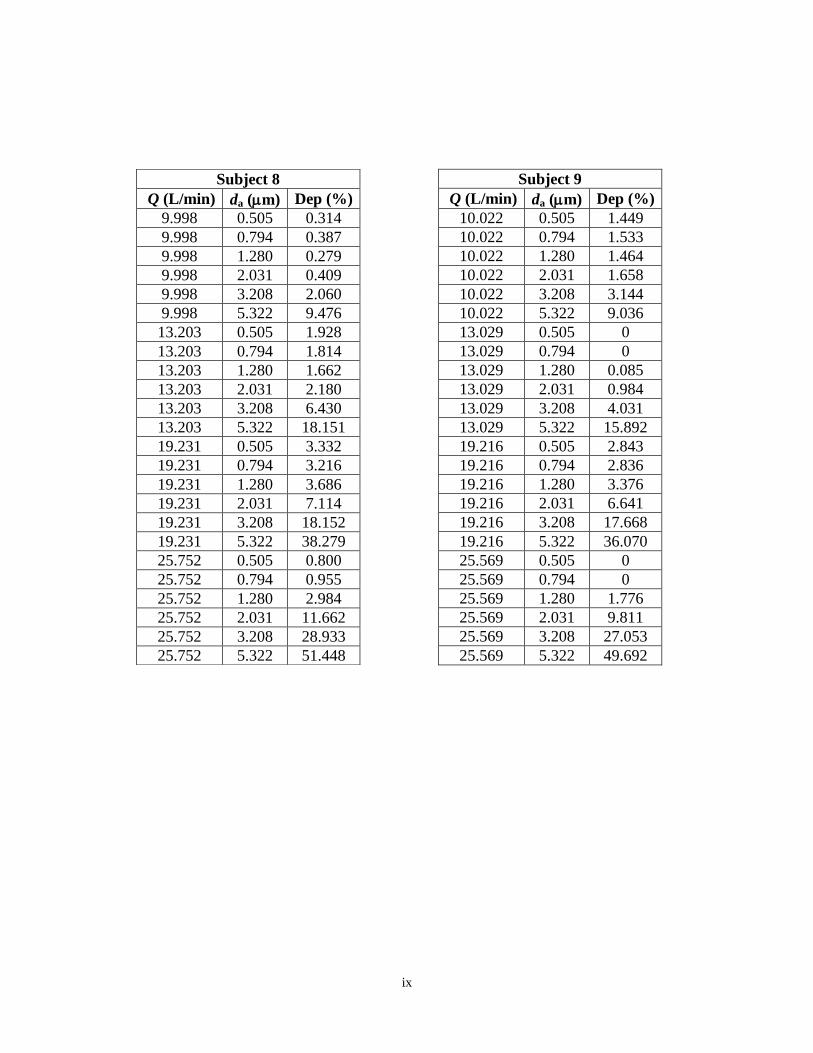
ix
Subject 9
Q (L/min) da (m) Dep (%)
10.022 0.505 1.449
10.022 0.794 1.533
10.022 1.280 1.464
10.022 2.031 1.658
10.022 3.208 3.144
10.022 5.322 9.036
13.029 0.505 0
13.029 0.794 0
13.029 1.280 0.085
13.029 2.031 0.984
13.029 3.208 4.031
13.029 5.322 15.892
19.216 0.505 2.843
19.216 0.794 2.836
19.216 1.280 3.376
19.216 2.031 6.641
19.216 3.208 17.668
19.216 5.322 36.070
25.569 0.505 0
25.569 0.794 0
25.569 1.280 1.776
25.569 2.031 9.811
25.569 3.208 27.053
25.569 5.322 49.692
Subject 8
Q (L/min) da (m) Dep (%)
9.998 0.505 0.314
9.998 0.794 0.387
9.998 1.280 0.279
9.998 2.031 0.409
9.998 3.208 2.060
9.998 5.322 9.476
13.203 0.505 1.928
13.203 0.794 1.814
13.203 1.280 1.662
13.203 2.031 2.180
13.203 3.208 6.430
13.203 5.322 18.151
19.231 0.505 3.332
19.231 0.794 3.216
19.231 1.280 3.686
19.231 2.031 7.114
19.231 3.208 18.152
19.231 5.322 38.279
25.752 0.505 0.800
25.752 0.794 0.955
25.752 1.280 2.984
25.752 2.031 11.662
25.752 3.208 28.933
25.752 5.322 51.448
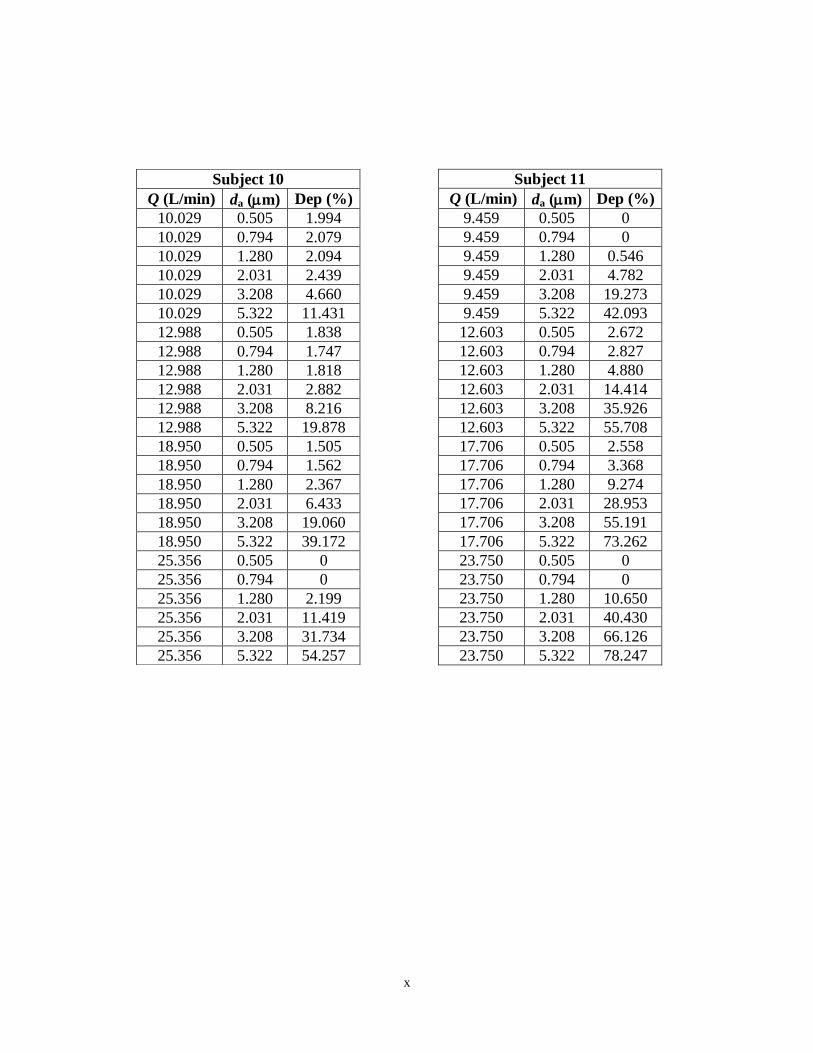
x
Subject 11
Q (L/min) da (m) Dep (%)
9.459 0.505 0
9.459 0.794 0
9.459 1.280 0.546
9.459 2.031 4.782
9.459 3.208 19.273
9.459 5.322 42.093
12.603 0.505 2.672
12.603 0.794 2.827
12.603 1.280 4.880
12.603 2.031 14.414
12.603 3.208 35.926
12.603 5.322 55.708
17.706 0.505 2.558
17.706 0.794 3.368
17.706 1.280 9.274
17.706 2.031 28.953
17.706 3.208 55.191
17.706 5.322 73.262
23.750 0.505 0
23.750 0.794 0
23.750 1.280 10.650
23.750 2.031 40.430
23.750 3.208 66.126
23.750 5.322 78.247
Subject 10
Q (L/min) da (m) Dep (%)
10.029 0.505 1.994
10.029 0.794 2.079
10.029 1.280 2.094
10.029 2.031 2.439
10.029 3.208 4.660
10.029 5.322 11.431
12.988 0.505 1.838
12.988 0.794 1.747
12.988 1.280 1.818
12.988 2.031 2.882
12.988 3.208 8.216
12.988 5.322 19.878
18.950 0.505 1.505
18.950 0.794 1.562
18.950 1.280 2.367
18.950 2.031 6.433
18.950 3.208 19.060
18.950 5.322 39.172
25.356 0.505 0
25.356 0.794 0
25.356 1.280 2.199
25.356 2.031 11.419
25.356 3.208 31.734
25.356 5.322 54.257
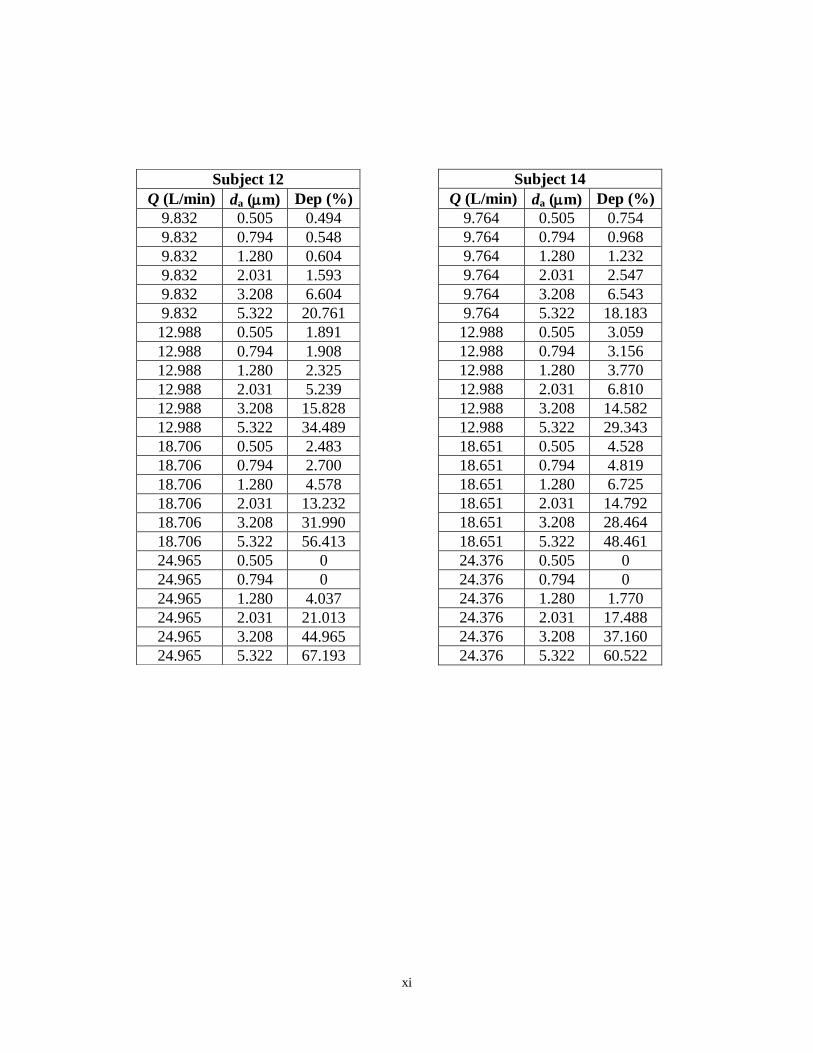
xi
Subject 14
Q (L/min) da (m) Dep (%)
9.764 0.505 0.754
9.764 0.794 0.968
9.764 1.280 1.232
9.764 2.031 2.547
9.764 3.208 6.543
9.764 5.322 18.183
12.988 0.505 3.059
12.988 0.794 3.156
12.988 1.280 3.770
12.988 2.031 6.810
12.988 3.208 14.582
12.988 5.322 29.343
18.651 0.505 4.528
18.651 0.794 4.819
18.651 1.280 6.725
18.651 2.031 14.792
18.651 3.208 28.464
18.651 5.322 48.461
24.376 0.505 0
24.376 0.794 0
24.376 1.280 1.770
24.376 2.031 17.488
24.376 3.208 37.160
24.376 5.322 60.522
Subject 12
Q (L/min) da (m) Dep (%)
9.832 0.505 0.494
9.832 0.794 0.548
9.832 1.280 0.604
9.832 2.031 1.593
9.832 3.208 6.604
9.832 5.322 20.761
12.988 0.505 1.891
12.988 0.794 1.908
12.988 1.280 2.325
12.988 2.031 5.239
12.988 3.208 15.828
12.988 5.322 34.489
18.706 0.505 2.483
18.706 0.794 2.700
18.706 1.280 4.578
18.706 2.031 13.232
18.706 3.208 31.990
18.706 5.322 56.413
24.965 0.505 0
24.965 0.794 0
24.965 1.280 4.037
24.965 2.031 21.013
24.965 3.208 44.965
24.965 5.322 67.193
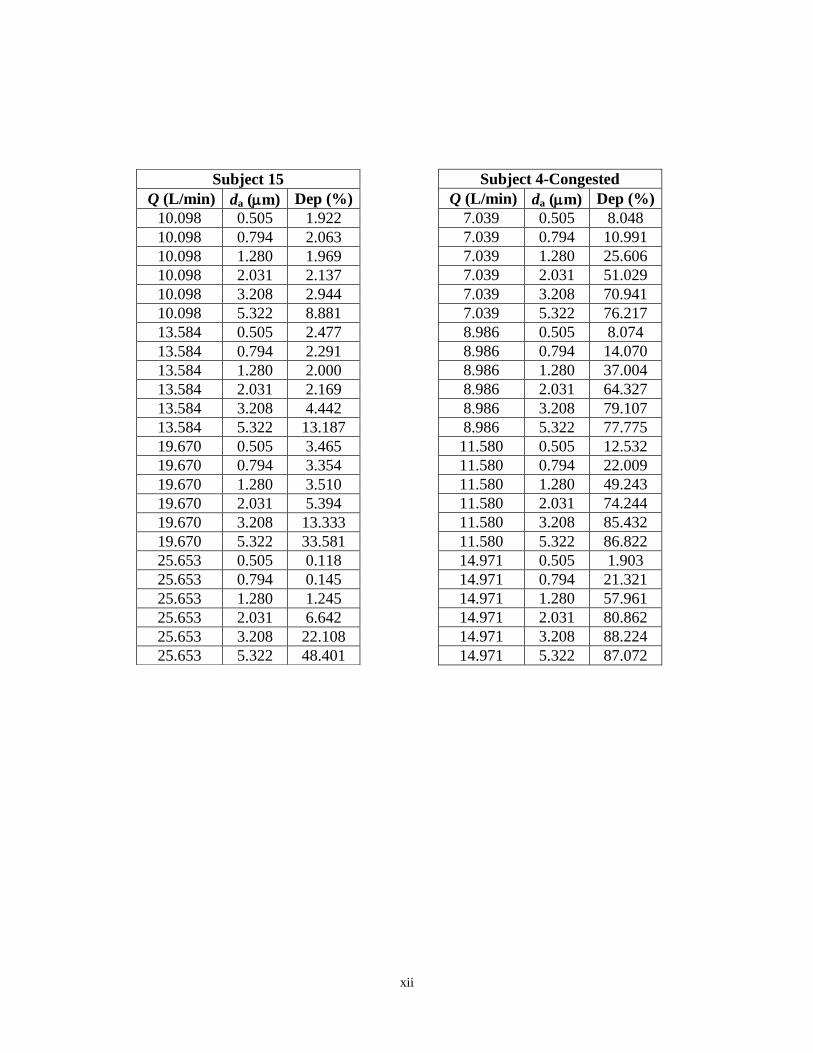
xii
Subject 4-Congested
Q (L/min) da (m) Dep (%)
7.039 0.505 8.048
7.039 0.794 10.991
7.039 1.280 25.606
7.039 2.031 51.029
7.039 3.208 70.941
7.039 5.322 76.217
8.986 0.505 8.074
8.986 0.794 14.070
8.986 1.280 37.004
8.986 2.031 64.327
8.986 3.208 79.107
8.986 5.322 77.775
11.580 0.505 12.532
11.580 0.794 22.009
11.580 1.280 49.243
11.580 2.031 74.244
11.580 3.208 85.432
11.580 5.322 86.822
14.971 0.505 1.903
14.971 0.794 21.321
14.971 1.280 57.961
14.971 2.031 80.862
14.971 3.208 88.224
14.971 5.322 87.072
Subject 15
Q (L/min) da (m) Dep (%)
10.098 0.505 1.922
10.098 0.794 2.063
10.098 1.280 1.969
10.098 2.031 2.137
10.098 3.208 2.944
10.098 5.322 8.881
13.584 0.505 2.477
13.584 0.794 2.291
13.584 1.280 2.000
13.584 2.031 2.169
13.584 3.208 4.442
13.584 5.322 13.187
19.670 0.505 3.465
19.670 0.794 3.354
19.670 1.280 3.510
19.670 2.031 5.394
19.670 3.208 13.333
19.670 5.322 33.581
25.653 0.505 0.118
25.653 0.794 0.145
25.653 1.280 1.245
25.653 2.031 6.642
25.653 3.208 22.108
25.653 5.322 48.401
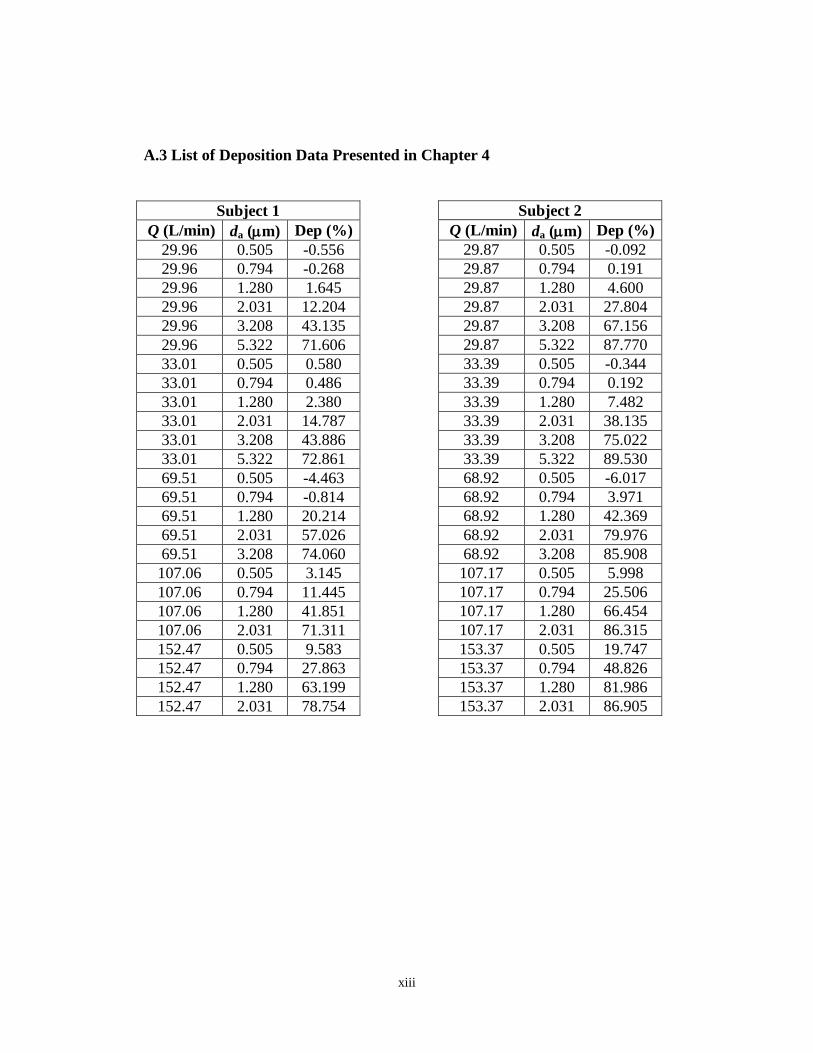
xiii
A.3 List of Deposition Data Presented in Chapter 4
Subject 2
Q (L/min) da (m) Dep (%)
29.87 0.505 -0.092
29.87 0.794 0.191
29.87 1.280 4.600
29.87 2.031 27.804
29.87 3.208 67.156
29.87 5.322 87.770
33.39 0.505 -0.344
33.39 0.794 0.192
33.39 1.280 7.482
33.39 2.031 38.135
33.39 3.208 75.022
33.39 5.322 89.530
68.92 0.505 -6.017
68.92 0.794 3.971
68.92 1.280 42.369
68.92 2.031 79.976
68.92 3.208 85.908
107.17 0.505 5.998
107.17 0.794 25.506
107.17 1.280 66.454
107.17 2.031 86.315
153.37 0.505 19.747
153.37 0.794 48.826
153.37 1.280 81.986
153.37 2.031 86.905
Subject 1
Q (L/min) da (m) Dep (%)
29.96 0.505 -0.556
29.96 0.794 -0.268
29.96 1.280 1.645
29.96 2.031 12.204
29.96 3.208 43.135
29.96 5.322 71.606
33.01 0.505 0.580
33.01 0.794 0.486
33.01 1.280 2.380
33.01 2.031 14.787
33.01 3.208 43.886
33.01 5.322 72.861
69.51 0.505 -4.463
69.51 0.794 -0.814
69.51 1.280 20.214
69.51 2.031 57.026
69.51 3.208 74.060
107.06 0.505 3.145
107.06 0.794 11.445
107.06 1.280 41.851
107.06 2.031 71.311
152.47 0.505 9.583
152.47 0.794 27.863
152.47 1.280 63.199
152.47 2.031 78.754
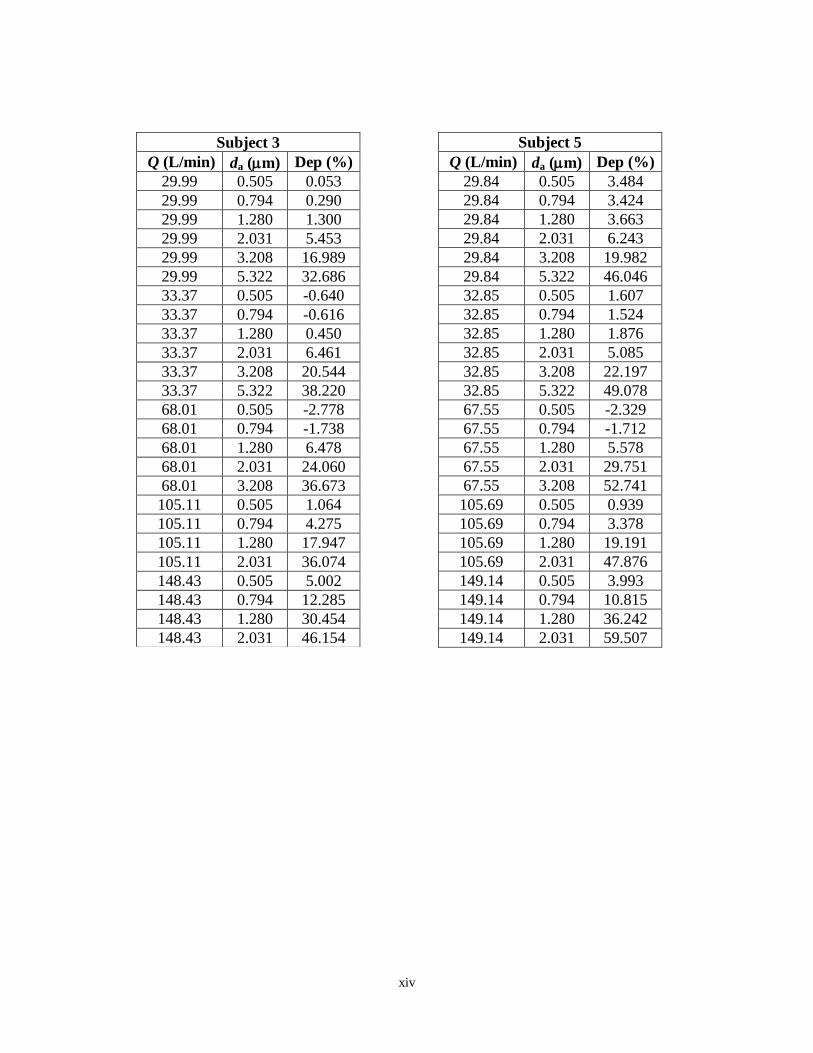
xiv
Subject 5
Q (L/min) da (m) Dep (%)
29.84 0.505 3.484
29.84 0.794 3.424
29.84 1.280 3.663
29.84 2.031 6.243
29.84 3.208 19.982
29.84 5.322 46.046
32.85 0.505 1.607
32.85 0.794 1.524
32.85 1.280 1.876
32.85 2.031 5.085
32.85 3.208 22.197
32.85 5.322 49.078
67.55 0.505 -2.329
67.55 0.794 -1.712
67.55 1.280 5.578
67.55 2.031 29.751
67.55 3.208 52.741
105.69 0.505 0.939
105.69 0.794 3.378
105.69 1.280 19.191
105.69 2.031 47.876
149.14 0.505 3.993
149.14 0.794 10.815
149.14 1.280 36.242
149.14 2.031 59.507
Subject 3
Q (L/min) da (m) Dep (%)
29.99 0.505 0.053
29.99 0.794 0.290
29.99 1.280 1.300
29.99 2.031 5.453
29.99 3.208 16.989
29.99 5.322 32.686
33.37 0.505 -0.640
33.37 0.794 -0.616
33.37 1.280 0.450
33.37 2.031 6.461
33.37 3.208 20.544
33.37 5.322 38.220
68.01 0.505 -2.778
68.01 0.794 -1.738
68.01 1.280 6.478
68.01 2.031 24.060
68.01 3.208 36.673
105.11 0.505 1.064
105.11 0.794 4.275
105.11 1.280 17.947
105.11 2.031 36.074
148.43 0.505 5.002
148.43 0.794 12.285
148.43 1.280 30.454
148.43 2.031 46.154
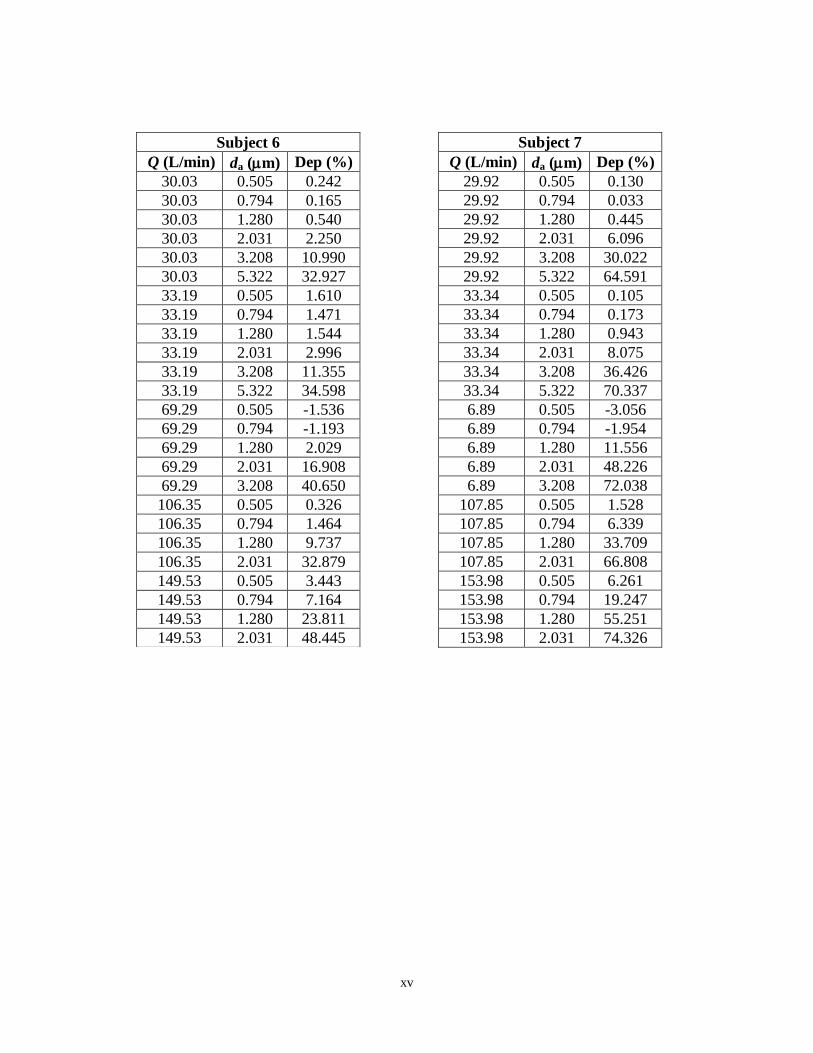
xv
Subject 7
Q (L/min) da (m) Dep (%)
29.92 0.505 0.130
29.92 0.794 0.033
29.92 1.280 0.445
29.92 2.031 6.096
29.92 3.208 30.022
29.92 5.322 64.591
33.34 0.505 0.105
33.34 0.794 0.173
33.34 1.280 0.943
33.34 2.031 8.075
33.34 3.208 36.426
33.34 5.322 70.337
6.89 0.505 -3.056
6.89 0.794 -1.954
6.89 1.280 11.556
6.89 2.031 48.226
6.89 3.208 72.038
107.85 0.505 1.528
107.85 0.794 6.339
107.85 1.280 33.709
107.85 2.031 66.808
153.98 0.505 6.261
153.98 0.794 19.247
153.98 1.280 55.251
153.98 2.031 74.326
Subject 6
Q (L/min) da (m) Dep (%)
30.03 0.505 0.242
30.03 0.794 0.165
30.03 1.280 0.540
30.03 2.031 2.250
30.03 3.208 10.990
30.03 5.322 32.927
33.19 0.505 1.610
33.19 0.794 1.471
33.19 1.280 1.544
33.19 2.031 2.996
33.19 3.208 11.355
33.19 5.322 34.598
69.29 0.505 -1.536
69.29 0.794 -1.193
69.29 1.280 2.029
69.29 2.031 16.908
69.29 3.208 40.650
106.35 0.505 0.326
106.35 0.794 1.464
106.35 1.280 9.737
106.35 2.031 32.879
149.53 0.505 3.443
149.53 0.794 7.164
149.53 1.280 23.811
149.53 2.031 48.445
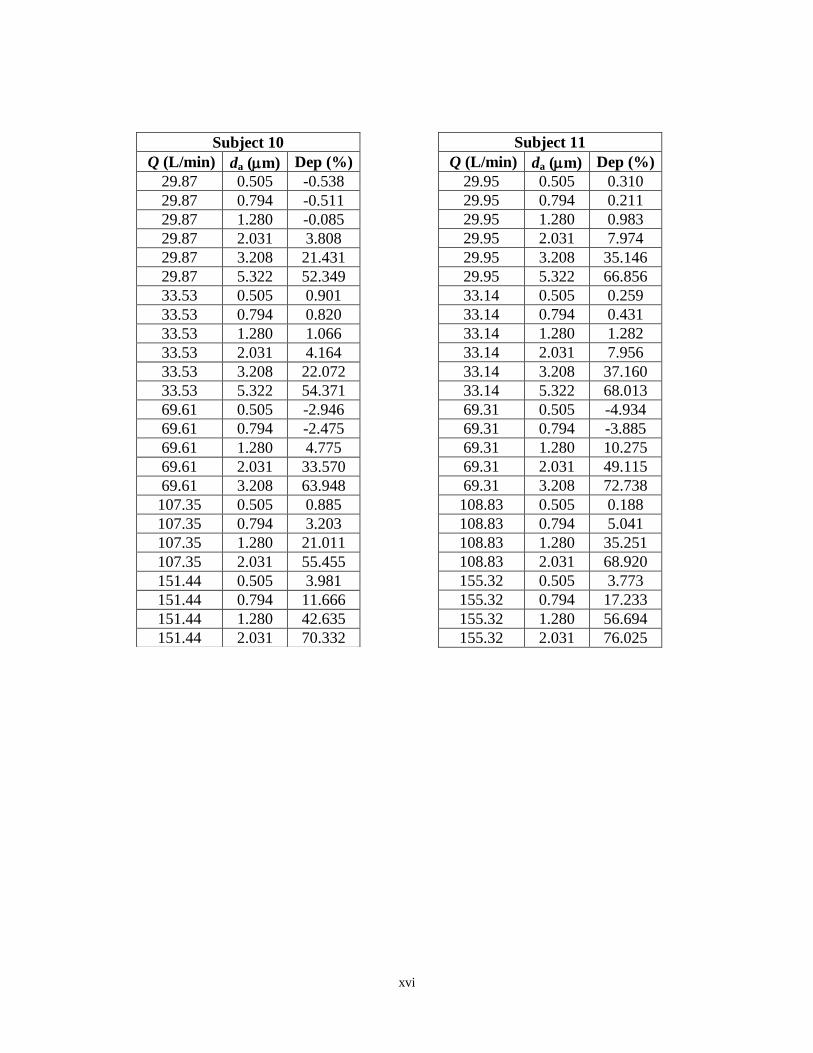
xvi
Subject 11
Q (L/min) da (m) Dep (%)
29.95 0.505 0.310
29.95 0.794 0.211
29.95 1.280 0.983
29.95 2.031 7.974
29.95 3.208 35.146
29.95 5.322 66.856
33.14 0.505 0.259
33.14 0.794 0.431
33.14 1.280 1.282
33.14 2.031 7.956
33.14 3.208 37.160
33.14 5.322 68.013
69.31 0.505 -4.934
69.31 0.794 -3.885
69.31 1.280 10.275
69.31 2.031 49.115
69.31 3.208 72.738
108.83 0.505 0.188
108.83 0.794 5.041
108.83 1.280 35.251
108.83 2.031 68.920
155.32 0.505 3.773
155.32 0.794 17.233
155.32 1.280 56.694
155.32 2.031 76.025
Subject 10
Q (L/min) da (m) Dep (%)
29.87 0.505 -0.538
29.87 0.794 -0.511
29.87 1.280 -0.085
29.87 2.031 3.808
29.87 3.208 21.431
29.87 5.322 52.349
33.53 0.505 0.901
33.53 0.794 0.820
33.53 1.280 1.066
33.53 2.031 4.164
33.53 3.208 22.072
33.53 5.322 54.371
69.61 0.505 -2.946
69.61 0.794 -2.475
69.61 1.280 4.775
69.61 2.031 33.570
69.61 3.208 63.948
107.35 0.505 0.885
107.35 0.794 3.203
107.35 1.280 21.011
107.35 2.031 55.455
151.44 0.505 3.981
151.44 0.794 11.666
151.44 1.280 42.635
151.44 2.031 70.332
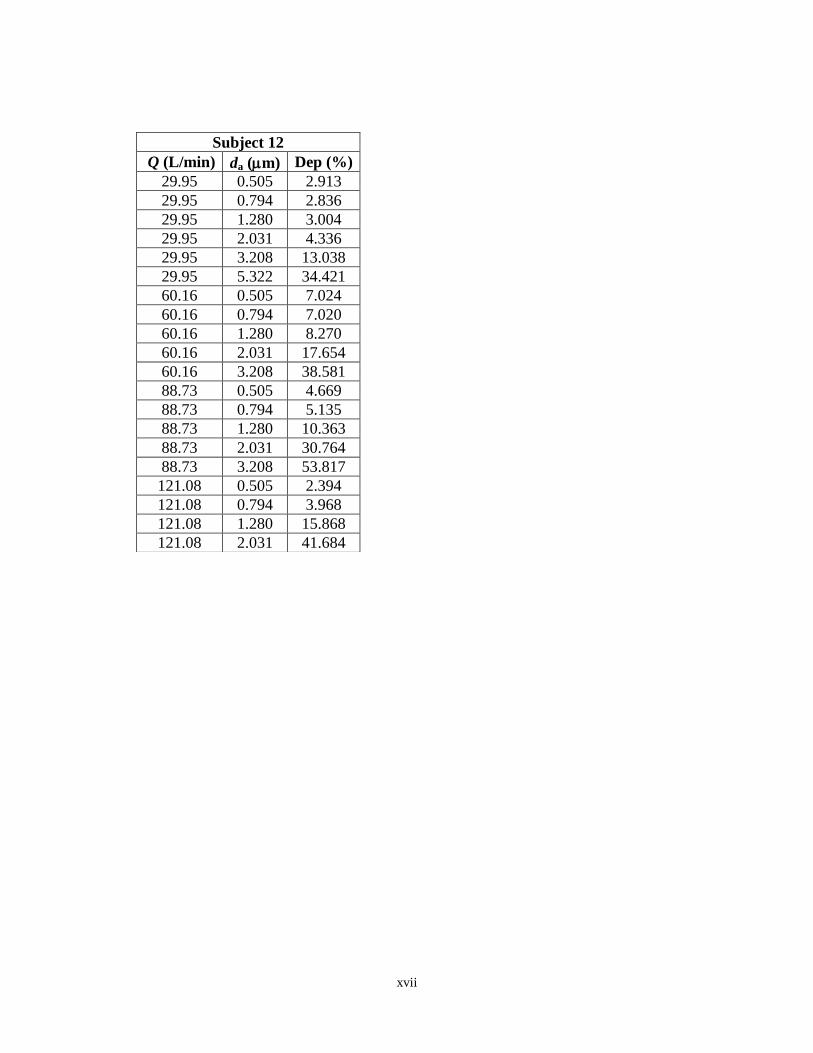
xvii
Subject 12
Q (L/min) da (m) Dep (%)
29.95 0.505 2.913
29.95 0.794 2.836
29.95 1.280 3.004
29.95 2.031 4.336
29.95 3.208 13.038
29.95 5.322 34.421
60.16 0.505 7.024
60.16 0.794 7.020
60.16 1.280 8.270
60.16 2.031 17.654
60.16 3.208 38.581
88.73 0.505 4.669
88.73 0.794 5.135
88.73 1.280 10.363
88.73 2.031 30.764
88.73 3.208 53.817
121.08 0.505 2.394
121.08 0.794 3.968
121.08 1.280 15.868
121.08 2.031 41.684
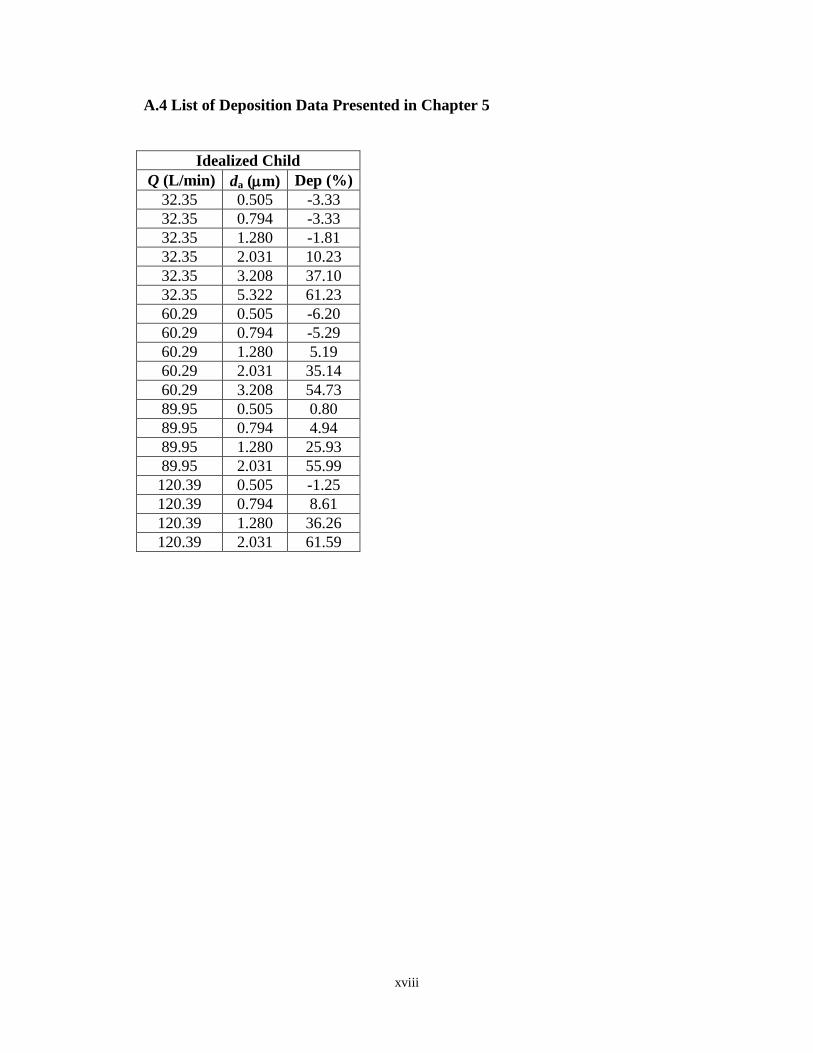
xviii
A.4 List of Deposition Data Presented in Chapter 5
Idealized Child
Q (L/min) da (m) Dep (%)
32.35 0.505 -3.33
32.35 0.794 -3.33
32.35 1.280 -1.81
32.35 2.031 10.23
32.35 3.208 37.10
32.35 5.322 61.23
60.29 0.505 -6.20
60.29 0.794 -5.29
60.29 1.280 5.19
60.29 2.031 35.14
60.29 3.208 54.73
89.95 0.505 0.80
89.95 0.794 4.94
89.95 1.280 25.93
89.95 2.031 55.99
120.39 0.505 -1.25
120.39 0.794 8.61
120.39 1.280 36.26
120.39 2.031 61.59