Embed Size (px)
Citation preview
SSRG International Journal of Mechanical Engineering - (ICRTESTM) - Special Issue – April 2017
ISSN: 2348 – 8360 www.internationaljournalssrg.org Page 1
The improvement of Overall Equipment
Effectiveness of machines using TPM study in
a small scale industry (A case study on Milling Machine and Chasing Machine used in a CTC roller
sharpening industry)
Subhankur Dutta
PG Scholar
Department of Mechanical Engineering
Jorhat Engineering College
Jorhat, Assam, India
Ajoy Krishna Dutta
Assistant Professor
Department of Mechanical Engineering
Jorhat Engineering College
Jorhat, Assam, India
Abstract—In this project, a CTC roller
sharpening enterprise under small scale industry of
Golaghat district of Assam is chosen. The roller
sharpening action in the enterprise is accomplished
through a set of three milling machines and a chasing
machine. This case study aims at determining the
OEE of the four machines and suggesting steps to
improve it using TPM tools. Improvement in OEE is
indirectly the improvement of its parameters viz.
availability, performance and quality. First and
foremost, the general working conditions and
parameters of all the machines are noted down and
the initial OEE values are noted down. Later a ten
week survey is conducted to determine the actual
downtime, theoretical cycle time and number of
defective rollers produced on a weekly basis on the
four machines and average OEE is
calculated.Ishikawa fishbone diagram is used to
analyze the cause of downtime loss, defective rollers,
roller costs, high cycle time and reduced OEE.Pareto
Analysis is used to single out the most influencing
cause leading to the aforesaid effects. A detailed
literature survey on a number of research papers is
done to study the effects of TPM on OEE.Two
significant research papers are taken from the lot and
their average improvement in availability and
performance is taken as a base for the improvement
of the aforesaid parameters of this project. However
for quality improvement, a TPM team is formed with
a theme of total employee participation and creating
enthusiastic work environment. Finally the target
values obtained are found to be higher than the
initially noted values of OEE.This improvement in
OEE using TPM is shown to the personnel’s of the
industry and provided them the freedom and
confidence to implement TPM in near future.
Keywords—CTC; OEE; Availabiilty;
Performance; Quality; TPM
I. INTRODUCTION
In the present scenario of world class manufacturing,
effectiveness and efficiency of machines play a vital
part for the commercial benefit of any industrial
organization. Overall Equipment Effectiveness
analysis is a procedure to determine how effectively a
manufacturing operation is utilized. To boost the
manufacturing system, Total Productive Maintenance
is incorporated with Overall Equipment
Effectiveness. Various TPM programmes are
suggested by the researchers to improve OEE.This
case study aims at determination, calculation, analysis
and improvement of Overall Equipment Effectiveness
of four machines used in a CTC rolling sharpening
industry using TPM.
A. Objective of the research
To meaure the Overall Equipment
Effectiveness of machines utilised in a small scale
industry.
Analyze the contributors of OEE for
improvement.
B. Enterprise of the project undertaken
Hydron Engineering Works, an enterprise under
small scale industry located in Dergaon, Golaghat,
Assam is the chosen place for the project undertaken.
The industry is primarily involved in the sharpening
action of CTC rollers used in tea industries. The
sharpened products are supplied to the tea
manufacturing units located in Golaghat, Jorhat and
Nagaon districts of Assam.
C. CTC Rollers
Crush, Tear, Curl is a technique of manufacturing tea
in where the tea leaves go through a series of
SSRG International Journal of Mechanical Engineering - (ICRTESTM) - Special Issue – April 2017
ISSN: 2348 – 8360 www.internationaljournalssrg.org Page 2
cylindrical rollers with sharp teeth. They crush, tear
and curl the tea into small, hard pellets. The rollers
possess two types of grooves a milling and a chasing,
both of which needs resharpening using suitable
cutting tools. Rollers in batches of 6-8 arrive from
various sources. Thread cutting operations are
performed in the milling machines at a rate of 8 tpi-
10tpi depending upon the length and diameter of the
rollers.
II. METHODOLOGY
A. Steps followed for OEE calculation
a) Data collection, Machine history study.
b) Identification of the problems in the
machine.
c) Determine the OEE of four machines over a
period of 10 weeks and make a
comparative study.
d) Analyze the three OEE parameters and their
role in effecting the overall effectiveness of
the production system.
e) Listing the causes of reduced downtime and
defective products with the help of Ishikawa
Fishbone diagram.
f) Making a Pareto Analysis of all the root
causes and finding out the one most
affecting the aforesaid parameters.
g) Detailed literature survey is conducted to
determine the improved values of
Availability and Performance by the
influence of TPM.
h) Creating a TPM team to improve the values
of Quality.
i) Finally improved OEE values are calculated
using TPM and suggested to the enterprise
for futuristic implementation.
B. Oee calculation from data given by the machine
incharge in the visited industry
Working days in a week = 6 days
Working hours per day = 10 hours
Working hours per week = 6*10 = 60 hours
Downtime per day (includes material not available,
job setting, rework, meal break) = 1.5 hours
Total down time per week = 1.5*6 = 9 hours
Operating time per month = Running Time - Total
down time = 60 hrs. - 9hrs. = 51 hrs.
Calculation of Availability
The operating time for all the 3 machines is
approximately equal.
Now, Availability = Operating Time/ Planned
Production Time
Planned Production Time = 60 hours
Operating Time = 51 hours
So Availability = 51 hours/ 60 hours
= 0.85 * 100%
= 85%
Calculation of Performance
Performance = {Processed Numbers/ (Operating
Time/ Theoretical Cycle Time)}
a) Milling M/c 1
Targeted Numbers = 15 rollers/ week
Theoretical Cycle Time = 4 hours/roller
Processed Numbers = 1.5 rollers/ day
= 9 rollers/week
Performance = [9/ {51/4}]
= 0.706 * 100%
= 70.5 %
b) Milling M/c 2
Targeted Numbers = 15 rollers/ week
Theoretical Cycle Time = 4 hours/roller
Processed Numbers = 1 rollers/ day
= 6 rollers/ week
Performance = [6/ {51/4}]
= 0.470 * 100%
= 47 %
c) Chasing M/c
Targeted Numbers = 3 rollers/ 8 hours
= 22.5 rollers/ week
Theoretical Cycle Time = 2.67 hours / roller
Processed Numbers = 2 rollers/ 8hours
= 15 rollers/ week
Performance = [15/ {51/2.67}]
= 0.785 * 100%
=78.5 %
SSRG International Journal of Mechanical Engineering - (ICRTESTM) - Special Issue – April 2017
ISSN: 2348 – 8360 www.internationaljournalssrg.org Page 3
Calculation of Quality
Quality = (Processed Numbers-Defect Numbers)/
Processed Numbers
Defective numbers (DN) = 1/week (approx.)
a) Milling M/c 1
Quality = {9-1/9}
= 0.88 * 100%
= 88.0%
b) Milling M/c 2
Quality = {6-1/6}
= 0 .8333 * 100%
= 83.33%
c) Chasing M/c
Processed numbers/week = 15/ week
Defective number/week = 3/week (approx)
Quality = {15-3/15}
= 0 .80 * 100%
= 80.0%
Calculation of Overall Equipment Effectiveness
OEE = Availability*Performance *Quality
a)Milling M/c 1
OEE = 0.85 * 0.706 * 0.88
= 0.5280 * 100%
= 52.80 %
b) Milling M/c 2
OEE = 0.85 * 0.470 *0.8333
= 0.332 *100%
= 33.2 %
c) Chasing M/C
OEE = 0.85 * 0.785 *0.80
= 0.5338 * 100%
= 53.38 %
C. Tables for weekly calculation of OEE over ten
weeks of all four machines after undergoing
survey
Estimation of Milling Machine 1
a) Considering 6 days/week:
Planned Production Time = 60 hrs
Downtime = 12.25 hrs
Operating Time = 47.75 hrs
Availability = .80
Targeted Numbers = 15
Processed Numbers = 9
Theoretical Cycle Time = 240 min
Performance = .705
Defective Rollers varies from week to week ranging
from 1 to 4.
So Quality varies accordingly.
b) Considering 5 days/week:
Planned Production Time = 60 hrs
Downtime = 20.22 hrs
Operating Time = 39.78 hrs
Availability = .663
Targeted Numbers = 15
Processed Numbers = 7.5
Theoretical Cycle Time = 200 min
Performance = .588
Defective Rollers varies from week to week ranging
from 1 to 4.So Quality varies accordingly.
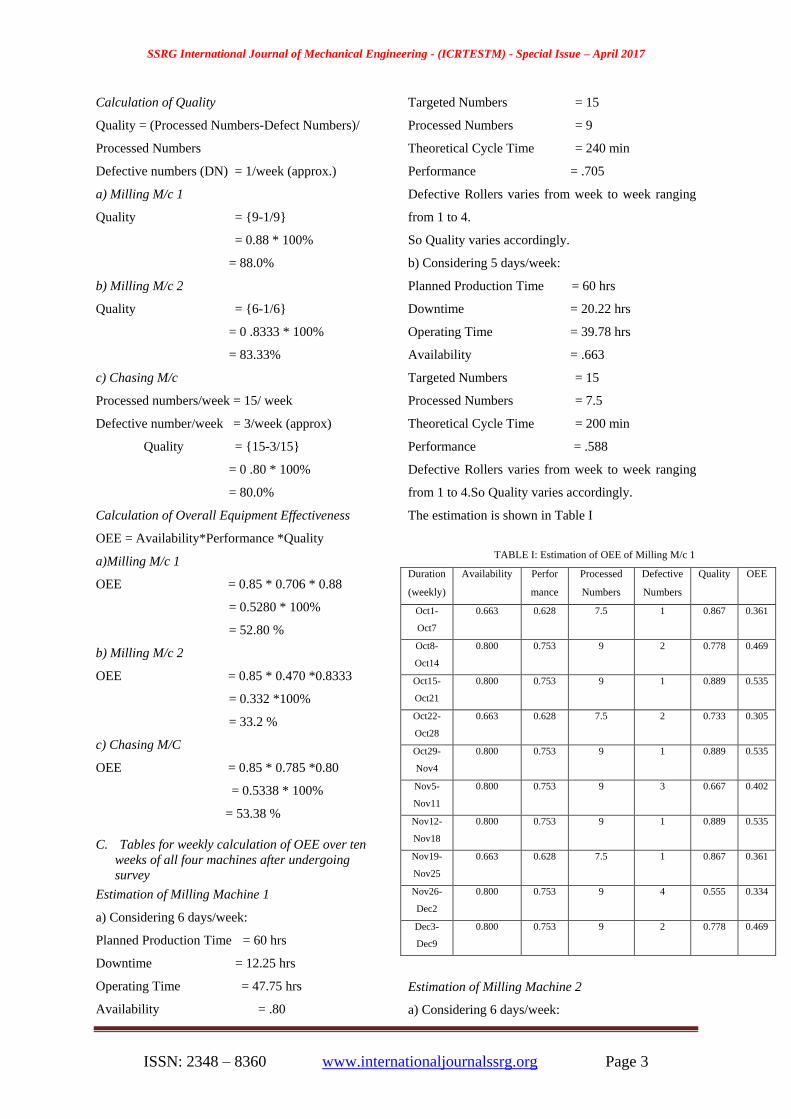
The estimation is shown in Table I
TABLE I: Estimation of OEE of Milling M/c 1
Duration
(weekly)
Availability Perfor
mance
Processed
Numbers
Defective
Numbers
Quality OEE
Oct1-
Oct7
0.663 0.628 7.5 1 0.867 0.361
Oct8-
Oct14
0.800 0.753 9 2 0.778 0.469
Oct15-
Oct21
0.800 0.753 9 1 0.889 0.535
Oct22-
Oct28
0.663 0.628 7.5 2 0.733 0.305
Oct29-
Nov4
0.800 0.753 9 1 0.889 0.535
Nov5-
Nov11
0.800 0.753 9 3 0.667 0.402
Nov12-
Nov18
0.800 0.753 9 1 0.889 0.535
Nov19-
Nov25
0.663 0.628 7.5 1 0.867 0.361
Nov26-
Dec2
0.800 0.753 9 4 0.555 0.334
Dec3-
Dec9
0.800 0.753 9 2 0.778 0.469
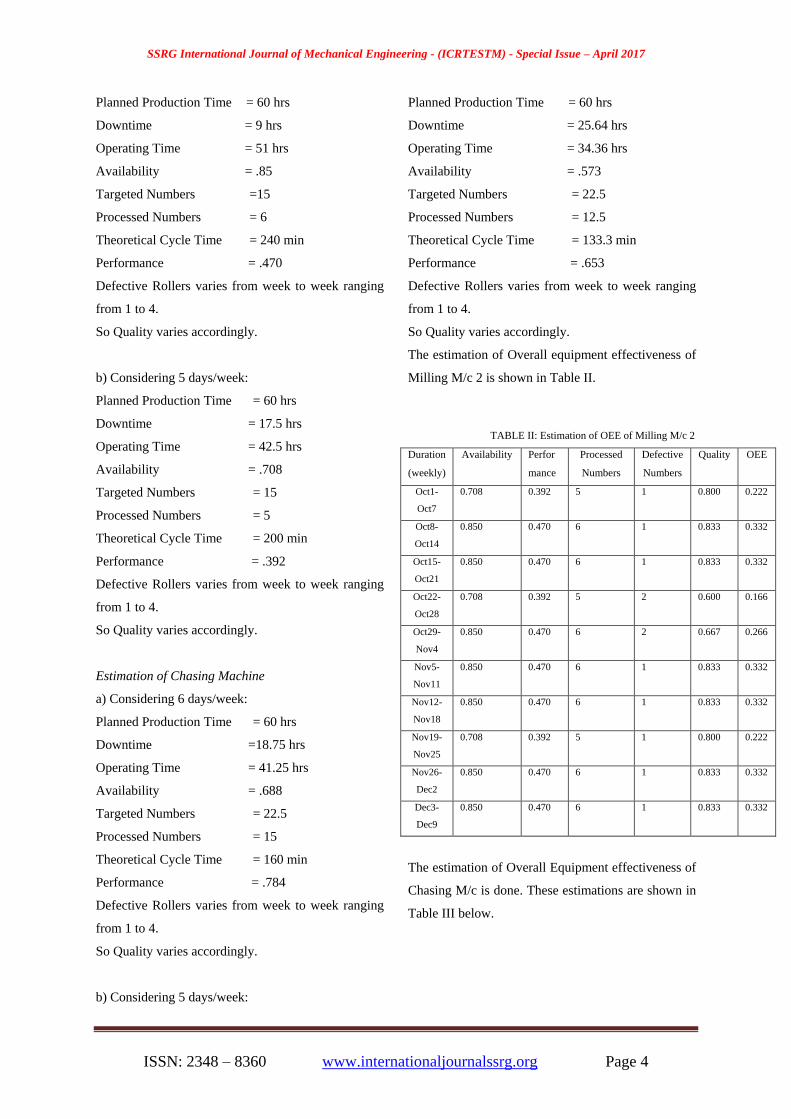
Estimation of Milling Machine 2
a) Considering 6 days/week:
SSRG International Journal of Mechanical Engineering - (ICRTESTM) - Special Issue – April 2017
ISSN: 2348 – 8360 www.internationaljournalssrg.org Page 4
Planned Production Time = 60 hrs
Downtime = 9 hrs
Operating Time = 51 hrs
Availability = .85
Targeted Numbers =15
Processed Numbers = 6
Theoretical Cycle Time = 240 min
Performance = .470
Defective Rollers varies from week to week ranging
from 1 to 4.
So Quality varies accordingly.
b) Considering 5 days/week:
Planned Production Time = 60 hrs
Downtime = 17.5 hrs
Operating Time = 42.5 hrs
Availability = .708
Targeted Numbers = 15
Processed Numbers = 5
Theoretical Cycle Time = 200 min
Performance = .392
Defective Rollers varies from week to week ranging
from 1 to 4.
So Quality varies accordingly.
Estimation of Chasing Machine
a) Considering 6 days/week:
Planned Production Time = 60 hrs
Downtime =18.75 hrs
Operating Time = 41.25 hrs
Availability = .688
Targeted Numbers = 22.5
Processed Numbers = 15
Theoretical Cycle Time = 160 min
Performance = .784
Defective Rollers varies from week to week ranging
from 1 to 4.
So Quality varies accordingly.
b) Considering 5 days/week:
Planned Production Time = 60 hrs
Downtime = 25.64 hrs
Operating Time = 34.36 hrs
Availability = .573
Targeted Numbers = 22.5
Processed Numbers = 12.5
Theoretical Cycle Time = 133.3 min
Performance = .653
Defective Rollers varies from week to week ranging
from 1 to 4.
So Quality varies accordingly.
The estimation of Overall equipment effectiveness of
Milling M/c 2 is shown in Table II.
TABLE II: Estimation of OEE of Milling M/c 2
Duration
(weekly)
Availability Perfor
mance
Processed
Numbers
Defective
Numbers
Quality OEE
Oct1-
Oct7
0.708 0.392 5 1 0.800 0.222
Oct8-
Oct14
0.850 0.470 6 1 0.833 0.332
Oct15-
Oct21
0.850 0.470 6 1 0.833 0.332
Oct22-
Oct28
0.708 0.392 5 2 0.600 0.166
Oct29-
Nov4
0.850 0.470 6 2 0.667 0.266
Nov5-
Nov11
0.850 0.470 6 1 0.833 0.332
Nov12-
Nov18
0.850 0.470 6 1 0.833 0.332
Nov19-
Nov25
0.708 0.392 5 1 0.800 0.222
Nov26-
Dec2
0.850 0.470 6 1 0.833 0.332
Dec3-
Dec9
0.850 0.470 6 1 0.833 0.332
The estimation of Overall Equipment effectiveness of
Chasing M/c is done. These estimations are shown in
Table III below.
SSRG International Journal of Mechanical Engineering - (ICRTESTM) - Special Issue – April 2017
ISSN: 2348 – 8360 www.internationaljournalssrg.org Page 5
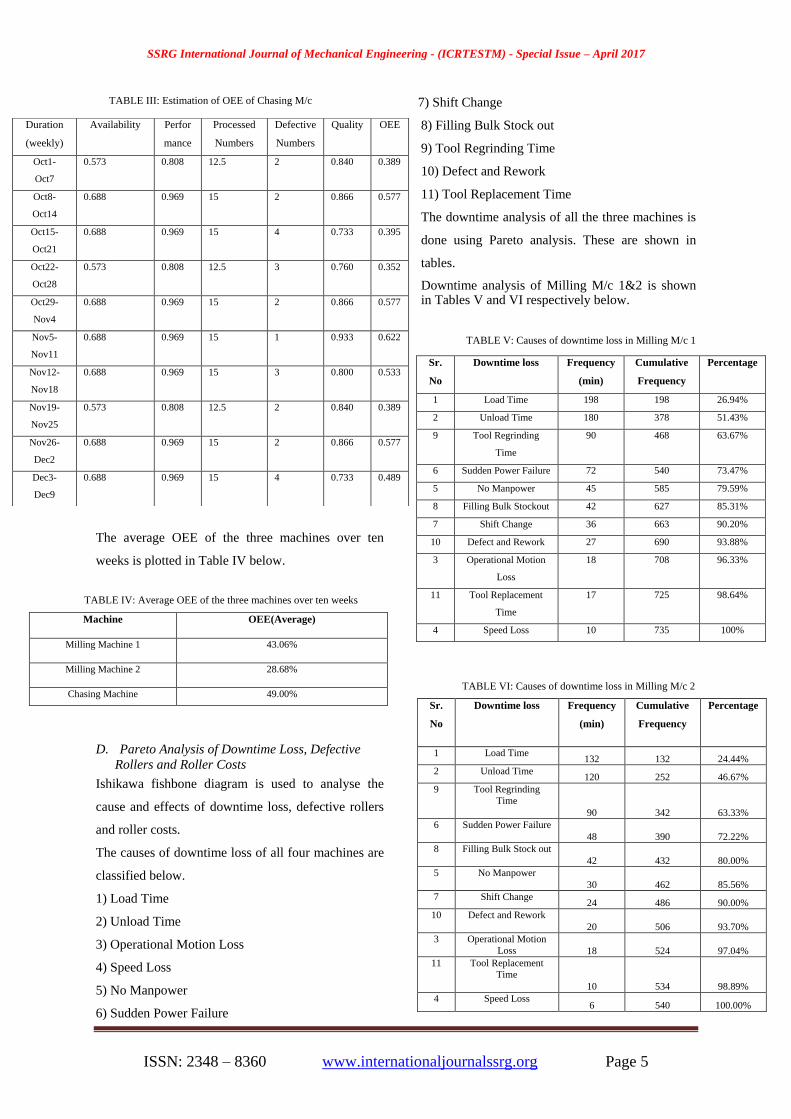
TABLE III: Estimation of OEE of Chasing M/c
The average OEE of the three machines over ten
weeks is plotted in Table IV below.
TABLE IV: Average OEE of the three machines over ten weeks
Machine OEE(Average)
Milling Machine 1 43.06%
Milling Machine 2 28.68%
Chasing Machine 49.00%
D. Pareto Analysis of Downtime Loss, Defective
Rollers and Roller Costs
Ishikawa fishbone diagram is used to analyse the
cause and effects of downtime loss, defective rollers
and roller costs.
The causes of downtime loss of all four machines are
classified below.
1) Load Time
2) Unload Time
3) Operational Motion Loss
4) Speed Loss
5) No Manpower
6) Sudden Power Failure
7) Shift Change
8) Filling Bulk Stock out
9) Tool Regrinding Time
10) Defect and Rework
11) Tool Replacement Time
The downtime analysis of all the three machines is
done using Pareto analysis. These are shown in
tables.
Downtime analysis of Milling M/c 1&2 is shown in Tables V and VI respectively below.
TABLE V: Causes of downtime loss in Milling M/c 1
TABLE VI: Causes of downtime loss in Milling M/c 2
Sr.
No
Downtime loss Frequency
(min)
Cumulative
Frequency
Percentage
1 Load Time 132 132 24.44%
2 Unload Time 120 252 46.67%
9 Tool Regrinding
Time
90 342 63.33%
6 Sudden Power Failure
48 390 72.22%
8 Filling Bulk Stock out
42 432 80.00%
5 No Manpower
30 462 85.56%
7 Shift Change 24 486 90.00%
10 Defect and Rework
20 506 93.70%
3 Operational Motion
Loss 18 524 97.04%
11 Tool Replacement
Time
10 534 98.89%
4 Speed Loss 6 540 100.00%
Duration
(weekly)
Availability Perfor
mance
Processed
Numbers
Defective
Numbers
Quality OEE
Oct1-
Oct7
0.573 0.808 12.5 2 0.840 0.389
Oct8-
Oct14
0.688 0.969 15 2 0.866 0.577
Oct15-
Oct21
0.688 0.969 15 4 0.733 0.395
Oct22-
Oct28
0.573 0.808 12.5 3 0.760 0.352
Oct29-
Nov4
0.688 0.969 15 2 0.866 0.577
Nov5-
Nov11
0.688 0.969 15 1 0.933 0.622
Nov12-
Nov18
0.688 0.969 15 3 0.800 0.533
Nov19-
Nov25
0.573 0.808 12.5 2 0.840 0.389
Nov26-
Dec2
0.688 0.969 15 2 0.866 0.577
Dec3-
Dec9
0.688 0.969 15 4 0.733 0.489
Sr.
No
Downtime loss Frequency
(min)
Cumulative
Frequency
Percentage
1 Load Time 198 198 26.94%
2 Unload Time 180 378 51.43%
9 Tool Regrinding
Time
90 468 63.67%
6 Sudden Power Failure 72 540 73.47%
5 No Manpower 45 585 79.59%
8 Filling Bulk Stockout 42 627 85.31%
7 Shift Change 36 663 90.20%
10 Defect and Rework 27 690 93.88%
3 Operational Motion
Loss
18 708 96.33%
11 Tool Replacement
Time
17 725 98.64%
4 Speed Loss 10 735 100%
SSRG International Journal of Mechanical Engineering - (ICRTESTM) - Special Issue – April 2017
ISSN: 2348 – 8360 www.internationaljournalssrg.org Page 6
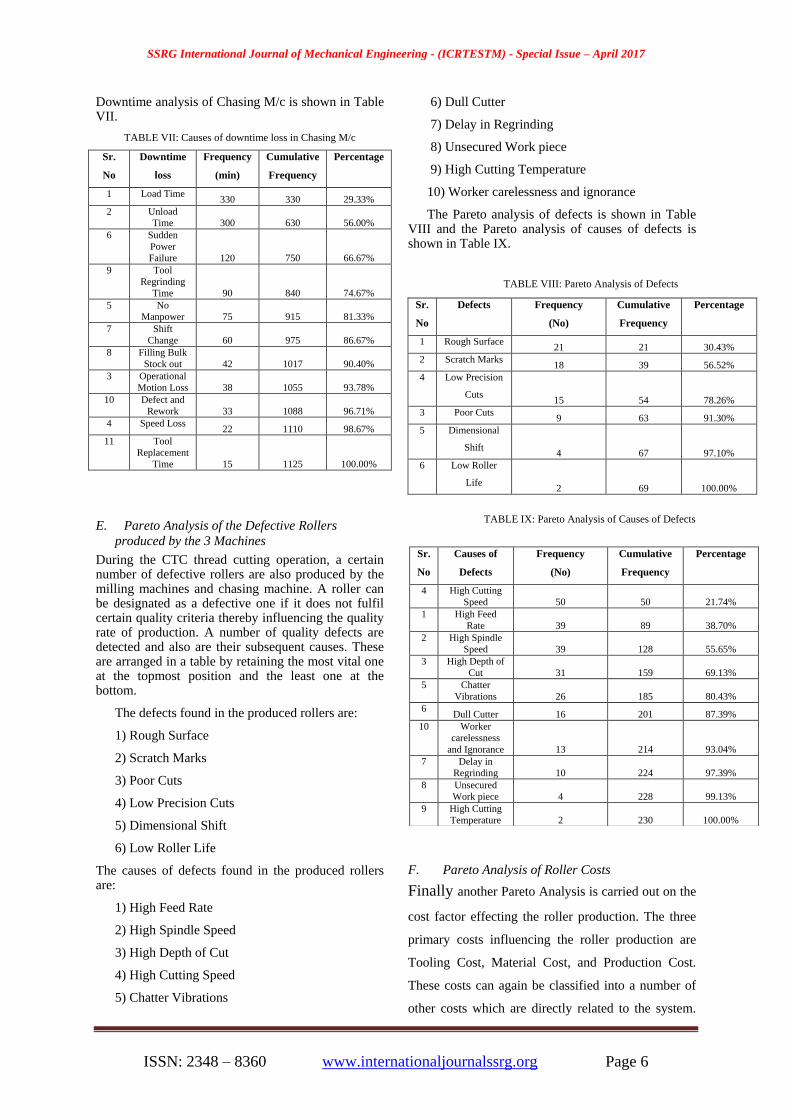
Downtime analysis of Chasing M/c is shown in Table VII.
TABLE VII: Causes of downtime loss in Chasing M/c
Sr.
No
Downtime
loss
Frequency
(min)
Cumulative
Frequency
Percentage
1 Load Time 330 330 29.33%
2 Unload
Time 300 630 56.00%
6 Sudden
Power
Failure 120 750 66.67%
9 Tool
Regrinding
Time 90 840 74.67%
5 No
Manpower 75 915 81.33%
7 Shift
Change 60 975 86.67%
8 Filling Bulk
Stock out 42 1017 90.40%
3 Operational
Motion Loss 38 1055 93.78%
10 Defect and
Rework 33 1088 96.71%
4 Speed Loss 22 1110 98.67%
11 Tool
Replacement
Time 15 1125 100.00%
E. Pareto Analysis of the Defective Rollers
produced by the 3 Machines
During the CTC thread cutting operation, a certain number of defective rollers are also produced by the milling machines and chasing machine. A roller can be designated as a defective one if it does not fulfil certain quality criteria thereby influencing the quality rate of production. A number of quality defects are detected and also are their subsequent causes. These are arranged in a table by retaining the most vital one at the topmost position and the least one at the bottom.
The defects found in the produced rollers are:
1) Rough Surface
2) Scratch Marks
3) Poor Cuts
4) Low Precision Cuts
5) Dimensional Shift
6) Low Roller Life
The causes of defects found in the produced rollers are:
1) High Feed Rate
2) High Spindle Speed
3) High Depth of Cut
4) High Cutting Speed
5) Chatter Vibrations
6) Dull Cutter
7) Delay in Regrinding
8) Unsecured Work piece
9) High Cutting Temperature
10) Worker carelessness and ignorance
The Pareto analysis of defects is shown in Table VIII and the Pareto analysis of causes of defects is shown in Table IX.
TABLE VIII: Pareto Analysis of Defects
Sr.
No
Defects Frequency
(No)
Cumulative
Frequency
Percentage
1 Rough Surface 21 21 30.43%
2 Scratch Marks 18 39 56.52%
4 Low Precision
Cuts 15 54 78.26%
3 Poor Cuts 9 63 91.30%
5 Dimensional
Shift 4 67 97.10%
6 Low Roller
Life 2 69 100.00%
TABLE IX: Pareto Analysis of Causes of Defects
F. Pareto Analysis of Roller Costs
Finally another Pareto Analysis is carried out on the
cost factor effecting the roller production. The three
primary costs influencing the roller production are
Tooling Cost, Material Cost, and Production Cost.
These costs can again be classified into a number of
other costs which are directly related to the system.
Sr.
No
Causes of
Defects
Frequency
(No)
Cumulative
Frequency
Percentage
4 High Cutting
Speed 50 50 21.74%
1 High Feed
Rate 39 89 38.70%
2 High Spindle
Speed 39 128 55.65%
3 High Depth of
Cut 31 159 69.13%
5 Chatter
Vibrations 26 185 80.43%
6 Dull Cutter 16 201 87.39%
10 Worker
carelessness
and Ignorance 13 214 93.04%
7 Delay in
Regrinding 10 224 97.39%
8 Unsecured
Work piece 4 228 99.13%
9 High Cutting
Temperature 2 230 100.00%
SSRG International Journal of Mechanical Engineering - (ICRTESTM) - Special Issue – April 2017
ISSN: 2348 – 8360 www.internationaljournalssrg.org Page 7
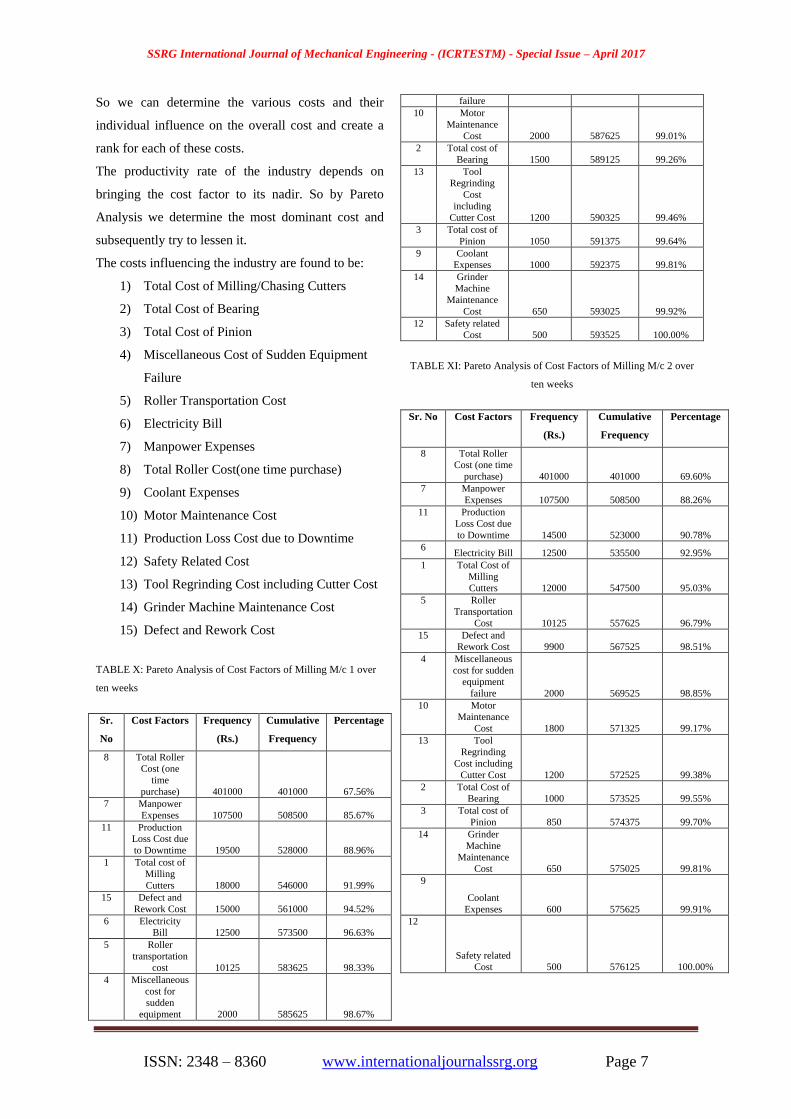
So we can determine the various costs and their
individual influence on the overall cost and create a
rank for each of these costs.
The productivity rate of the industry depends on
bringing the cost factor to its nadir. So by Pareto
Analysis we determine the most dominant cost and
subsequently try to lessen it.
The costs influencing the industry are found to be:
1) Total Cost of Milling/Chasing Cutters
2) Total Cost of Bearing
3) Total Cost of Pinion
4) Miscellaneous Cost of Sudden Equipment
Failure
5) Roller Transportation Cost
6) Electricity Bill
7) Manpower Expenses
8) Total Roller Cost(one time purchase)
9) Coolant Expenses
10) Motor Maintenance Cost
11) Production Loss Cost due to Downtime
12) Safety Related Cost
13) Tool Regrinding Cost including Cutter Cost
14) Grinder Machine Maintenance Cost
15) Defect and Rework Cost
TABLE X: Pareto Analysis of Cost Factors of Milling M/c 1 over
ten weeks
Sr.
No
Cost Factors Frequency
(Rs.)
Cumulative
Frequency
Percentage
8 Total Roller
Cost (one
time
purchase) 401000 401000 67.56%
7 Manpower
Expenses 107500 508500 85.67%
11 Production
Loss Cost due
to Downtime 19500 528000 88.96%
1 Total cost of
Milling
Cutters 18000 546000 91.99%
15 Defect and
Rework Cost 15000 561000 94.52%
6 Electricity
Bill 12500 573500 96.63%
5 Roller
transportation
cost 10125 583625 98.33%
4 Miscellaneous
cost for
sudden
equipment 2000 585625 98.67%
failure
10 Motor
Maintenance
Cost 2000 587625 99.01%
2 Total cost of
Bearing 1500 589125 99.26%
13 Tool
Regrinding
Cost
including
Cutter Cost 1200 590325 99.46%
3 Total cost of
Pinion 1050 591375 99.64%
9 Coolant
Expenses 1000 592375 99.81%
14 Grinder
Machine
Maintenance
Cost 650 593025 99.92%
12 Safety related
Cost 500 593525 100.00%
TABLE XI: Pareto Analysis of Cost Factors of Milling M/c 2 over
ten weeks
Sr. No Cost Factors Frequency
(Rs.)
Cumulative
Frequency
Percentage
8 Total Roller
Cost (one time
purchase) 401000 401000 69.60%
7 Manpower
Expenses 107500 508500 88.26%
11 Production
Loss Cost due
to Downtime 14500 523000 90.78%
6 Electricity Bill 12500 535500 92.95%
1 Total Cost of
Milling
Cutters 12000 547500 95.03%
5 Roller
Transportation
Cost 10125 557625 96.79%
15 Defect and
Rework Cost 9900 567525 98.51%
4 Miscellaneous
cost for sudden
equipment
failure 2000 569525 98.85%
10 Motor
Maintenance
Cost 1800 571325 99.17%
13 Tool
Regrinding
Cost including
Cutter Cost 1200 572525 99.38%
2 Total Cost of
Bearing 1000 573525 99.55%
3 Total cost of
Pinion 850 574375 99.70%
14 Grinder
Machine
Maintenance
Cost 650 575025 99.81%
9
Coolant
Expenses 600 575625 99.91%
12
Safety related
Cost 500 576125 100.00%
SSRG International Journal of Mechanical Engineering - (ICRTESTM) - Special Issue – April 2017
ISSN: 2348 – 8360 www.internationaljournalssrg.org Page 8
TABLE XII: Pareto Analysis of Cost Factors of Chasing M/c over
ten weeks
Sr.
No
Cost Factors Frequency
(Rs.)
Cumulative
Frequency
Percentage
8 Total Roller
Cost (one
time
purchase) 401000 401000 62.03%
7 Manpower
Expenses 107500 508500 78.65%
11 Production
Loss Cost due
to Downtime 42500 551000 85.23%
1 Total cost of
Chasing
Cutters 39900 590900 91.40%
15 Defect and
Rework Cost 20825 611725 94.62%
6 Electricity
Bill 12500 624225 96.55%
5 Roller
transportation
cost 10125 634350 98.12%
2 Total cost of
Bearing 2500 636850 98.51%
4 Miscellaneous
cost for
sudden
equipment
failure 2000 638850 98.82%
10 Motor
Maintenance
Cost 2000 640850 99.13%
3 Total cost of
Pinion 1800 642650 99.40%
9 Coolant
Expenses 1500 644150 99.64%
13 Tool
Regrinding
Cost
including
Cutter Cost 1200 645350 99.82%
14 Grinder
Machine
Maintenance
Cost 650 646000 99.92%
12 Safety related
Cost 500 646500 100.00%
III. RESULTS AND DISCUSSION
From the data analysis, we have seen that the OEE of
all the three machines are varying from each other.
Availability depends on the downtime loss as shown
in the above analysis. Performance depends on the
theoretical cycle time of each machine, which varies
from one machine to other. So improvement in OEE
of each machine can be achieved by reducing the
theoretical cycle time of each machine.
The defective number of rollers produced by all the
machines varied from a minimum value of one to a
maximum value of four. The maximum quality rate is
obtained from the Milling Machine 1 over the weeks
Oct 15 to Oct 21, Oct 29 to Nov 4, Nov 20 to Nov 27
and its value is 0.889.The minimum quality rate is
obtained from the Milling Machine 1 for the week
Nov 26 to Dec 2 and the value is 0.555.
So calculating the OEE of the respective machines
weekly over a period of 10 weeks, it is found that the
highest value is 0.622 given by the Chasing Machine
on the week Nov 5 to Nov 11.The Milling Machine 2
is found to be the least effective as it continuously
produces below par values of OEE.A value of 0.166
is found for the week Oct 22 to Oct 28,another value
of 0.222 was found for week Oct 1 to Oct 7 and
0.266 for Oct 29 to Nov 4.The Milling Machine 2 is
deprived of even a single OEE score of 50% over the
calculated period compared to the other machines. So
it is the worst machine in terms of effectiveness
amongst all.
As the rollers are one time purchase, so we are
practically considering the Material Cost of all
machines as constant.
TABLE XIII: Table showing main causes of Downtime Loss,
Defect & Root cause of Defect, High Cost Incurred
Machine
Main Cause of
Down Time
Loss
Main Defect &
Root Cause of
Defect
Main Cause of
High Cost
Incurred
Milling
Machine 1
Load Time
Rough Surface,
High Cutting
Speed
Production Loss
Due To Downtime
Milling
Machine 2
Load Time
Rough Surface,
High Cutting
Speed
Production Loss
Due To Downtime
Chasing
Machine
Load Time
Rough Surface,
High Cutting
Speed
Production Loss
Due To Downtime
A. Literature Analysis to measure improved OEE
From the above discussions, we have seen that
the OEE of the machines are relatively very poor
compared to the benchmark. Also the various factors
SSRG International Journal of Mechanical Engineering - (ICRTESTM) - Special Issue – April 2017
ISSN: 2348 – 8360 www.internationaljournalssrg.org Page 9
contributing heavily to such values have been
discussed and analyzed in detail.
The numero uno cause of downtime loss for all the
machines operating for six days a week is found to be
the “Load time”. We can neither make any influence
on the “Cut Time” as operational motion loss and
speed loss are beyond manual interference. These
factors totally depend on the motor speed, cutting
speed, spindle speed, voltage supply and fluctuate
with unnoticeable uncertainty. Hence trying to reduce
these time units is of no avail as it won’t guarantee a
significant reduction always.
1) Review of Research Articles
From literature,
Amit Kumar Gupta & Dr. R. K Garg, (2012) [1]
implemented TPM in an automobile manufacturing
organization for OEE improvement. They used
various pillars of TPM like 5S, Jishu Hozen, Kobetsu
Kaizen, Planned maintenance and education and
training of employees. They selected four machines
for the implementation viz. Broaching machines,
Cylindrical Grinder and Surface Grinder.
The data before and after the implementation of TPM
for improvement in OEE in the Broaching Machine is
shown in Table XIV and Table XV respectively.
Similarly they implemented TPM on the rest of the
machines as well and found them to be quite
satisfactory. The OEE of the Broaching Machine 2
increased from 60% to 69%, Cylindrical Grinder
from 53% to 67%, Surface Grinder from 50% to
65%.
Ranteshwar Singh, Ashish M Gohil, Dhaval B
Shah, Sanjay Desai, (2012) [2] implemented TPM in
a machine shop. They used pillars like 5S, Jishu
Hozen, Planned Maintenance, Kaizen, Quality
maintenance, Training, Office TPM, Safety health
and environment. They addressed a number of
problems in their case study starting from coolant
leakage problem from hose, filter and tank, loose nut
and bolts in the machine assembly, parts kept in an
unorderly manner in the workplace etc and rectified
them primarily through 5S and Kaizen.In a nut shell
the conclusions were:
Success of TPM depends on various pillars like 5-S,
Jishu Hozen, Planned Maintenance, Quality
maintenance, Kaizen, Office TPM and Safety, Health
& Environment and world class TPM implementation
is possible with continuous support from various
quarters.
The data before and after TPM implementation is
shown in Table XVI.
TABLE XIV: Data before TPM implementation
Before TPM implementation
A Shift Time(General) 450
B Planned Downtime 60
C Running Time(A-B) 390
D Running Time Losses 78
E Operating Time(C-D) 312
F Availability(E/C)*100 80%
G Output 180
H Machine Speed(No of components/min) 0.75
I Expected Output(O*E) 234
J Efficiency(G*100)/I 76.9%
K Rejection 8
L Quality(G-K*100)/G 95.5%
M OEE(F*J*L) 58.7%
TABLE XV: Data after TPM implementation
After TPM implementation
A Shift Time(General) 450
B Planned Downtime 60
C Running Time(A-B) 390
D Running Time Losses 58
E Operating Time(C-D) 332
F Availability(E/C)*100 85.1%
G Output 207
H Machine Speed(No of components/min) 0.75
I Expected Output(O*E) 249
J Efficiency(G*100)/I 83.1%
K Rejection 2
L Quality(G-K*100)/G 99%
M OEE(F*J*L) 70%
TABLE XVI: Data before and after TPM implementation
Sl.
No
.
Category Before TPM
implementation
After TPM
implementation
1 Shift Time 720 min 720 min
SSRG International Journal of Mechanical Engineering - (ICRTESTM) - Special Issue – April 2017
ISSN: 2348 – 8360 www.internationaljournalssrg.org Page 10
2 Total production in a shift 160 nos. 72 nos.
3 Scheduled Break 50 min 50 min
4 Non Scheduled Break 5 min 0 min
5 Breakdown 4 min 0 min
6 Cleaning, Inspection and
Tightening of Insert
15 min 15min
7 Operator Absent 55 min 6.5 min
8 Non-conforming Product 5 nos. 3 nos.
9 Theoretical Cycle Time 3 min 7.5 min
10 Availability(A) 0.90 0.98
11 Performance
Efficiency(PE)
0.73 0.85
12 Quality Rate(QR) 0.96 0.95
13 OEE(A*PE*QR) 0.63 0.79
2) Targeted improvement in OEE of the three
machines:
On the basis of these three papers, the average
reduction in downtime loss is calculated and
accordingly applied in the project undertaken.
In the first paper, planned production time is 390
mins and the reduction in downtime is 20 mins. In the
second paper, planned production time is 720 mins
and the reduction in downtime is 57.6 mins.
Calculating the average value of planned production
time and reduction in downtime, we get them as 555
mins and 38.8 mins respectively.
Applying the same logical criteria of the above
researchers to our undertaken project, we can
accordingly reduce the downtime with respect to the
planned production time.
The performance rate increase in the above two cases
before and after TPM implementation is noted and
their average increase is used to determine the
improvement in performance in our project. In the
first paper, the performance rate after the
implementation of TPM increased from 76.9% to
83.1%.In the second paper, the performance rate after
TPM implementation increased from 73% to 85%.So
on an average, the increase in performance rate was
74.95% to 84.05%.
However in the case of quality improvement, the
process is not so simple. Quality rates depend on a
number of factors starting from improving machine
conditions, cutter specifications, regrinding machine
conditions, coolant used, handling of rollers and
cutters and good work collaboration. In the ten weeks
taken for the survey, the defective number of rollers
ranged from 1 to 4 in all the four machines.
To improve the quality rate, a general get together of
all the workers and employees of the industry was
conducted as an initiative for TPM implementation.
The above mentioned factors were explained to them
in detail and the benefits of quality improvement
were discussed. The target value of maximum
number of defective rollers was set as 1 after a
discussion with the team. Moreover further
discussions were held regarding the practical
reduction of downtime and improvement of
performance steps.
Target values for TPM implementation on Milling
M/c 1
TABLE XVII: Initial values and final target values for Milling
M/c 1
Category Initial Values Final Target Values
Downtime Loss (min) 735 483.33
Availability 0.800 0.870
Performance 0.753 0.844
Quality(average) 0.778 0.889
OEE(average) 0.468 0.653
Target values for TPM implementation on Milling
M/c 2
TABLE XVIII: Initial values and final target values for Milling
M/c 2
Category Initial Values Final Target Values
Downtime Loss (min) 540 288.33
Availability 0.850 0.919
Performance 0.470 0.527
Quality(average) 0.809 0.833
OEE(average) 0.323 0.403
Target values for TPM implementation on Chasing
M/c
TABLE XIX: Initial values and final target values for Chasing M/c
Category Initial Values Final Target
Values
Downtime Loss (min) 1125 873.33
Availability 0.688 0.757
SSRG International Journal of Mechanical Engineering - (ICRTESTM) - Special Issue – April 2017
ISSN: 2348 – 8360 www.internationaljournalssrg.org Page 11
Performance 0.969 0.969
Quality(average) 0.828 0.933
OEE(average) 0.552 0.684
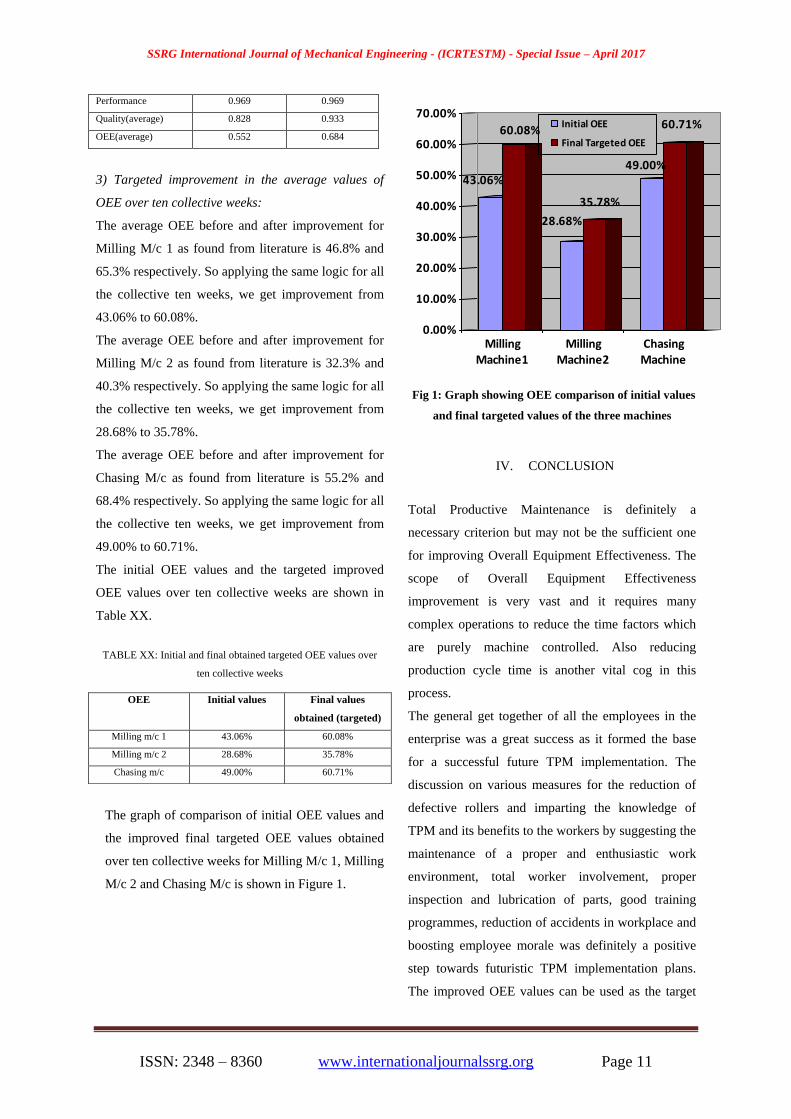
3) Targeted improvement in the average values of
OEE over ten collective weeks:
The average OEE before and after improvement for
Milling M/c 1 as found from literature is 46.8% and
65.3% respectively. So applying the same logic for all
the collective ten weeks, we get improvement from
43.06% to 60.08%.
The average OEE before and after improvement for
Milling M/c 2 as found from literature is 32.3% and
40.3% respectively. So applying the same logic for all
the collective ten weeks, we get improvement from
28.68% to 35.78%.
The average OEE before and after improvement for
Chasing M/c as found from literature is 55.2% and
68.4% respectively. So applying the same logic for all
the collective ten weeks, we get improvement from
49.00% to 60.71%.
The initial OEE values and the targeted improved
OEE values over ten collective weeks are shown in
Table XX.
TABLE XX: Initial and final obtained targeted OEE values over
ten collective weeks
The graph of comparison of initial OEE values and
the improved final targeted OEE values obtained
over ten collective weeks for Milling M/c 1, Milling
M/c 2 and Chasing M/c is shown in Figure 1.
43.06%
60.08%
28.68%
35.78%
49.00%
60.71%
0.00%
10.00%
20.00%
30.00%
40.00%
50.00%
60.00%
70.00%
MillingMachine1
MillingMachine2
ChasingMachine
Initial OEE
Final Targeted OEE
Fig 1: Graph showing OEE comparison of initial values
and final targeted values of the three machines
IV. CONCLUSION
Total Productive Maintenance is definitely a
necessary criterion but may not be the sufficient one
for improving Overall Equipment Effectiveness. The
scope of Overall Equipment Effectiveness
improvement is very vast and it requires many
complex operations to reduce the time factors which
are purely machine controlled. Also reducing
production cycle time is another vital cog in this
process.
The general get together of all the employees in the
enterprise was a great success as it formed the base
for a successful future TPM implementation. The
discussion on various measures for the reduction of
defective rollers and imparting the knowledge of
TPM and its benefits to the workers by suggesting the
maintenance of a proper and enthusiastic work
environment, total worker involvement, proper
inspection and lubrication of parts, good training
programmes, reduction of accidents in workplace and
boosting employee morale was definitely a positive
step towards futuristic TPM implementation plans.
The improved OEE values can be used as the target
OEE Initial values Final values
obtained (targeted)
Milling m/c 1 43.06% 60.08%
Milling m/c 2 28.68% 35.78%
Chasing m/c 49.00% 60.71%
SSRG International Journal of Mechanical Engineering - (ICRTESTM) - Special Issue – April 2017
ISSN: 2348 – 8360 www.internationaljournalssrg.org Page 12
values by the enterprise for future TPM
implementation.
To achieve this target efficient maintenance is
necessary, in order to establish autonomous
maintenance teams, better communication and team-
work must be promoted. It is essential that the
enterprise devices an efficient data recording system,
so that up-to date and accurate information will be
available to the management and information
provided by the trend analysis can provide a basis for
forming- long-term plans.
Acknowledgment
I offer my sincere and deep sense of gratitude to my
respected teacher, Dr.Parimal Bakul Barua, Professor
and Head, Deptt. of Mechanical Engineering, Jorhat
Engineering College for his priceless motivation and
providing the opportunity to undergo the research
work. I would like to extend my sincere regards for
my respected teacher and guide, Mr.Ajoy Krishna
Dutta, Assistant Professor, Deptt. of Mechanical
Engineering, Jorhat Engineering College for his
constant inspiration, erudite guidance and indelible
suggestions throughout the course of the research
work. Finally I would like to extend my heartfelt
gratitude to Mr. Anindra Sundar, machine incharge of
Hydron Engineering Works and all those who are
directly or indirectly involved in myself conducting
the project.
References
[1] Gupta K. Amit & Garg R.K., “OEE improvement by TPM
implementation: A case study”, International Journal of IT,
Engineering and Applied Sciences Research (IJIEASR), Volume 1,
No. 1, October 2012.
[2] Singh Ranteshwar, Gohil M. Ashish, Shah B. Dhaval, “Total
Productive Maintenance implementation in a machine shop: A
Case Study”, ELSEVEIR, Procedia Engineering 51 (2013) 592-
599.
[3] Ljungberg O., “Measurement of overall equipment
effectiveness as a basic for TPM activities”, International Journal
of Operations & Production Management, 18(5), 495-507 (1998).
http://dx.doi.org/10.1108/01443579810206334.
[4] Jonsson P. & Lesshammar M., “Evaluation and improvement of
manufacturing performance measurement systems – the role of
OEE”, International Journal of Operations & Production
Management, 19(1), 55-78 (1999)
http://dx.doi.org/10.1108/01443579910244223.
[5] Ireland F. & Dale B.G, “A study of total productive
maintenance implementation”, Journal of Quality in Maintenance
Engineering, Vol.7 No.3, (2001), pp. 183-191.
[6] McKone E. Kathleen & Schroeder G. Roger, “Total Productive
Maintenance: a contextual view”, ELSEVEIR, Journal of
Operations Management 17(1999).
[7] Varambally K.V.M, Rodrigues L.R. Lewlyn, “A Methodology
for Implementing Total Productive Maintenance in Manufacturing
Industries-A Case Study”, International Journal of Engineering
Research and Development, Vol 5, Issue 2(Dec 2012), pp.32-39.
[8] Poduval S. Prasanth, Pramod V.R., “Barriers in TPM
Implementation in Industries”, International Journal of Scientific
and Technology Research, Vol 2, Issue 5, May 2013.
[9] Bangar A., Sahu Hemlata, Batham Jagmohan, “Improving
Overall equipment Effectiveness by Implementing Total
Productive Maintenance in Auto Industry”, International Journal of
Emerging Technology and Advanced Engineering, ISSN 2250-
2459, ISO 9001:2008 Certified Journal, Vol 3,Issue 6, June 2013.
[10] Khan FirdosJahan, T.Z. Quazi, “Implementation of Kobetsu
Kaizen pillar in Improving Overall Equipment Effectiveness of
Machine”, International Journal of Engineering Sciences and
Research Technology , ISSN 2277-9655, July 2014.
[11] Jayaswal Pratesh, Rajput S. Hemant, “Implementation of
Kaizen and Jishu Hozen to enhance Overall Equipment
Performance in a manufacturing industry”, IJRIM, ISSN 2231-
4334, Vol 2, Issue 8, August 2012.
[12] H. Kamath Nagaraj, Rodrigues L.R. Lewlyn, “A Pilot study
for Total Production Management in Printing Industry”,
International Journal of Applied Research, Vol 4, Issue 12, Dec
2014, ISSN-2249-555X.
[13] Phoewhawm Ravee, “A Case Study on Kaizen as a Learning
Tool for a Management Team”, Asian Journal of Management and
Innovation, January-May 2014.
[14] Hedge G. Harsha, Mahesh N.S., Doss Kishan, “Overall
Equipment Effectiveness Improvement by TPM and 5S Techniques
in a CNC Machine Shop”, SASTECH, Vol 8, Issue 2, September
2009.
[15] Mulla Mohammedasif, C.G.Ramesh, “Enhancing Overall
Equipment Effectiveness of HMC machines through TPM and 5S
techniques in a manufacturing company.”, International Journal on
Mechanical Engineering and Robotics, Vol 2, Issue 2, 2014.
[16] Tamizharasi G., Kathiresan S., “Optimizing Overall
Equipment Effectiveness of high precision SPM using TPM
tools.”, International Journal of Computer Trends and Technology,
Vol 3, Issue 4, Number 1, July 2012.
[17] Gudadhe Mangesh, “A Review Study on Improvement of
Overall Equipment Effectiveness in Construction Equipments.”,
International Journal of Engineering Development and Research,
Vol 3, Issue 2, 2015.
[18] Gautam Rajesh, Kumar Sushil, Singh Sultan, “Kaizen
Implementation in an Industry in India: A Case Study.”,
International Journal of Research in Mechanical Engineering and
Technology, Vol 2, Issue 1, April 2012.