Embed Size (px)
Citation preview
8/7/2019 THE INDIAN CAPITAL GOODS INDUSTRY
http://slidepdf.com/reader/full/the-indian-capital-goods-industry 1/36
THE INDIAN CAPITAL GOODS INDUSTRY
Origins
� The development of a strong and vibrant engineering and capital goods sector
has been at the core of the industrial strategy in India since the planning process
was initiated in 1951. The emphasis that this sector received was primarily
influenced by the erstwhile Soviet Union model, which had made impressive
progress by rapid state-led industrialization through the development of the core
engineering and capital goods sector.
� The µMahalanobis Model¶, which was a µsupply oriented¶ model with a basic
emphasis on increasing the rate of capital accumulation and saving, gave the
engineering and capital goods sector a central place. Superimposed over this
were the other objectives of balanced regional development, prevention of the
concentration of economic power and the development of small-scale industries.
One of the primary objectives was import substitution, which was pursued as a
priority.
� Owing to these historical factors, today India has a strong engineering and
capital goods base. The Indian capital goods sector is characterized by a large
width of products (almost all major capital goods are domestically manufactured)
± a legacy of the import substitution policy. Even nations with advanced capital
goods sectors do not produce the entire range of capital goods, but instead focus
on segments, or sub segments. The range of machinery produced in India
includes heavy electrical machinery, textile machinery, machine tools,
earthmoving and construction equipment including mining equipment, road
construction equipment, material handling equipment, oil & gas equipment, sugar
machinery, food processing and packaging machinery, railway equipment,
8/7/2019 THE INDIAN CAPITAL GOODS INDUSTRY
http://slidepdf.com/reader/full/the-indian-capital-goods-industry 2/36
metallurgical equipment, cement machinery, rubber machinery, process plants &
equipment, paper & pulp machinery, printing machinery, dairy machinery,
industrial refrigeration, industrial furnaces etc. However, the raw materials used
are largely domestic in origin and in many instances, the quality of domestic raw
materials is not up to the international standards in terms of dimensional
tolerances and metallurgical properties, which in turn affects the quality of the
final product.
The Policy Environment
� Delicensing was initiated in 1975. Among the industries de-licensed were
industrial machinery, machine tools and other equipment.
� Broad banding of the machine tools industry in 1983 followed this. The year 1985
saw a further delicensing of 25 broad groups of industries including several items
of industrial machinery for non - MRTP, non-FERA companies. The industrial
machinery sector was also broad-banded covering chemicals, pharmaceuticals,
petrochemicals and fertilizer machinery subsequently. In August 1987, a Technology
Upgradation Fund was launched for five product groups in the capital
goods sector.
-4.1
24.8
17.9
11.4
12.6
1.7
-3.4
10.5

8/7/2019 THE INDIAN CAPITAL GOODS INDUSTRY
http://slidepdf.com/reader/full/the-indian-capital-goods-industry 3/36
13.6 13.9
25
20
7
5.8
-0.1
25
25 25
20
20 20
15
55
35
25 25 25
5.1
5.9
7.3 7.3 7.8
4.8
6.5
6.1 5.8
4
8.5 6.9
6.8
4.4
-5
8/7/2019 THE INDIAN CAPITAL GOODS INDUSTRY
http://slidepdf.com/reader/full/the-indian-capital-goods-industry 4/36
5
15
25
35
45
55
65
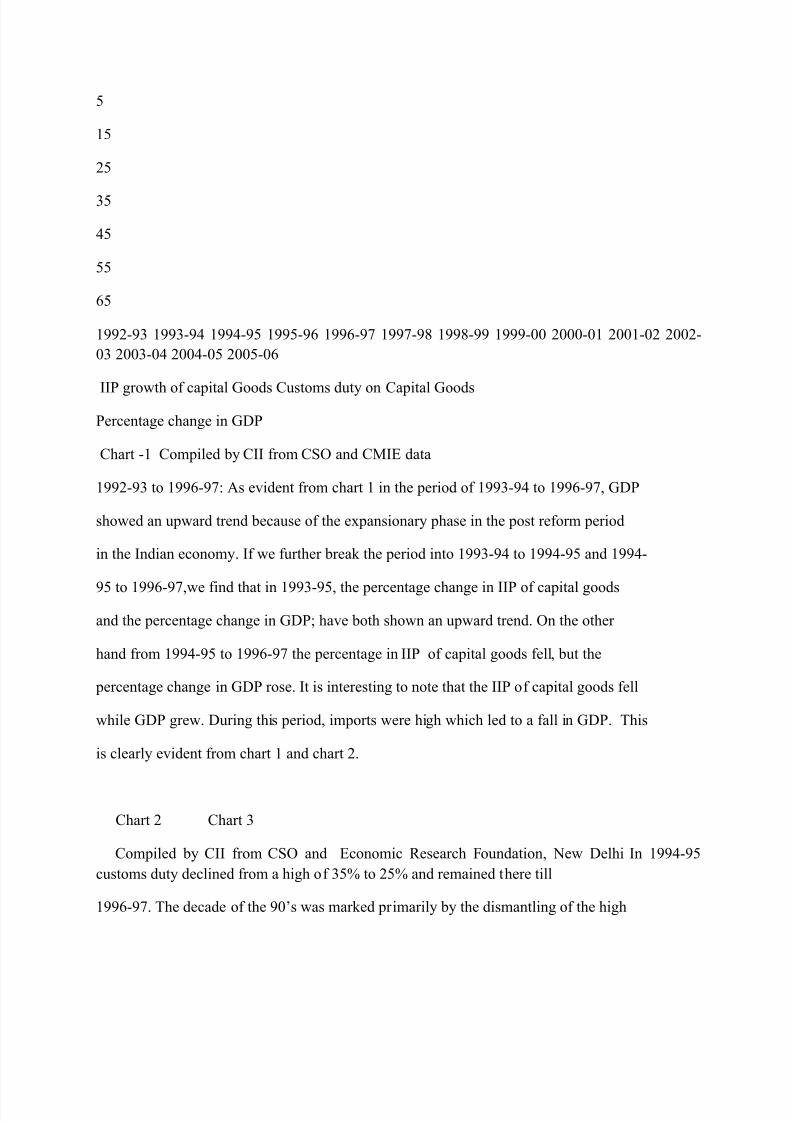
1992-93 1993-94 1994-95 1995-96 1996-97 1997-98 1998-99 1999-00 2000-01 2001-02 2002-
03 2003-04 2004-05 2005-06
IIP growth of capital Goods Customs duty on Capital Goods
Percentage change in GDP
Chart -1 Compiled by CII from CSO and CMIE data
1992-93 to 1996-97: As evident from chart 1 in the period of 1993-94 to 1996-97, GDP
showed an upward trend because of the expansionary phase in the post reform period
in the Indian economy. If we further break the period into 1993-94 to 1994-95 and 1994-
95 to 1996-97,we find that in 1993-95, the percentage change in IIP of capital goods
and the percentage change in GDP; have both shown an upward trend. On the other
hand from 1994-95 to 1996-97 the percentage in IIP of capital goods fell, but the
percentage change in GDP rose. It is interesting to note that the IIP of capital goods fell
while GDP grew. During this period, imports were high which led to a fall in GDP. This
is clearly evident from chart 1 and chart 2.
Chart 2 Chart 3
Compiled by CII from CSO and Economic Research Foundation, New Delhi In 1994-95
customs duty declined from a high of 35% to 25% and remained there till
1996-97. The decade of the 90¶s was marked primarily by the dismantling of the high

8/7/2019 THE INDIAN CAPITAL GOODS INDUSTRY
http://slidepdf.com/reader/full/the-indian-capital-goods-industry 5/36
tariff walls. After having to adjust in the initial years, this sector in fact responded very
positively and successfully retooled, restructured and reengineered to clock very healthy
growth rates in the years 1995-96 and 1996-97.
1996-97 to 2004-05: From 1996-97 to 1997-98 both IIP of capital goods fell with the
GDP. This was because of the beginning of a recessionary phase in the Indian
economy. The customs duty on capital goods was reduced from 25% to 20% in 1997-98
to make domestic production more competitive. The economy saw an increase in IIP
growth of capital goods and GDP in 1998-99. Customs duty on capital goods remained
at 20% during this year.
The phase of transition from 1998-99 to 1999-00 saw a downturn in IIP growth of the
capital goods sector from 12.6% to7%. GDP growth was more or less the same at
6.1%. However the customs duty was increased to 25%. This was because a Special
Additional Duty (SAD) of 4% was levied in the 1998-99 Budget. The period 1999-00 to
2001-02 saw a drastic fall in percentage change in the IIP of the capital goods sector.
This fall came down to a negative of ±3.4%. Customs duty was constant in this period at
25%. However, a percentage change in GDP saw a decline to 4.4% in 2000-01 and
again rose to 5.8% in 2001-02, which was attributable to a significant improvement of
growth rates in agriculture and the financial, real estate and business service sectors.
The period from 2001-02 to 2005-06 saw a growth in IIP of capital goods and GDP.
However the variation of GDP growth from 2001-02 at 5.8% to 4% in 2002-03 was
mainly because of very low growth in agriculture due to drought. 2002-03 onwards,
customs duty has been going down backed by higher IIP growth in capital goods and
GDP growth.
A Special Additional Duty (SAD) of 4%, which was levied in the 1998-99 Budget, was
subsequently removed in the 2003-04 Budget.
8/7/2019 THE INDIAN CAPITAL GOODS INDUSTRY
http://slidepdf.com/reader/full/the-indian-capital-goods-industry 6/36
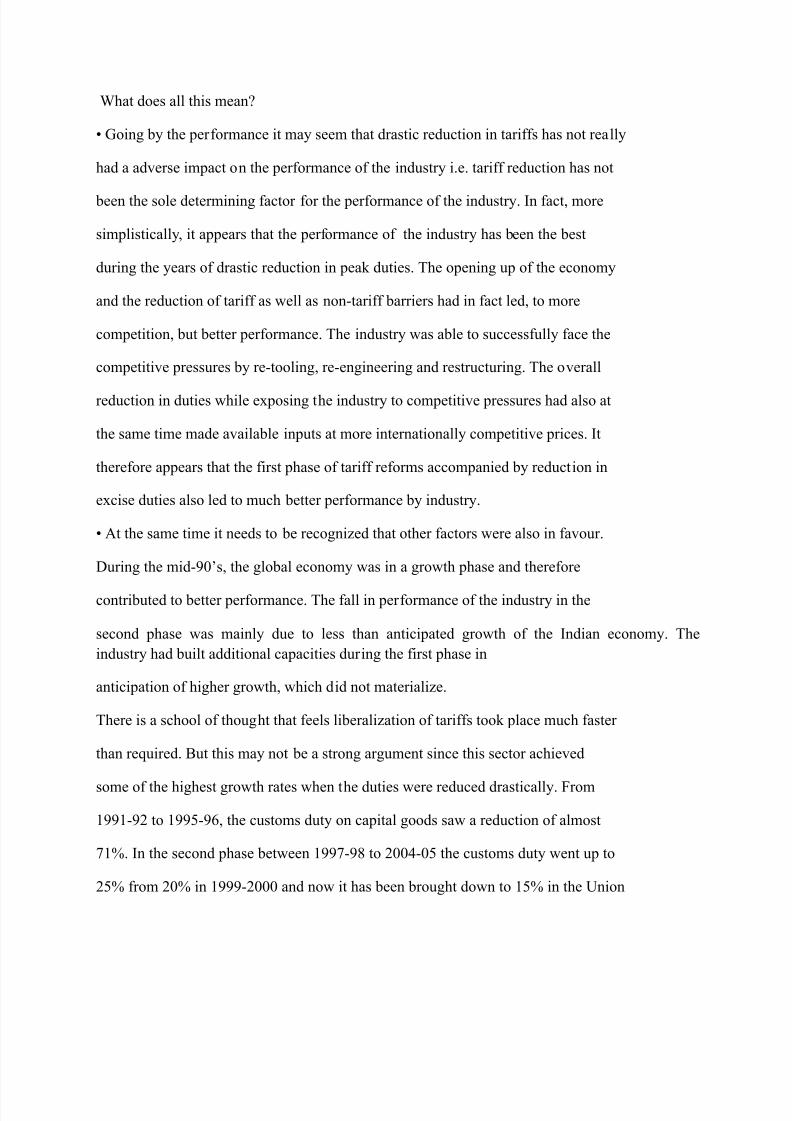
What does all this mean?
� Going by the performance it may seem that drastic reduction in tariffs has not really
had a adverse impact on the performance of the industry i.e. tariff reduction has not
been the sole determining factor for the performance of the industry. In fact, more
simplistically, it appears that the performance of the industry has been the best
during the years of drastic reduction in peak duties. The opening up of the economy
and the reduction of tariff as well as non-tariff barriers had in fact led, to more
competition, but better performance. The industry was able to successfully face the
competitive pressures by re-tooling, re-engineering and restructuring. The overall
reduction in duties while exposing the industry to competitive pressures had also at
the same time made available inputs at more internationally competitive prices. It
therefore appears that the first phase of tariff reforms accompanied by reduction in
excise duties also led to much better performance by industry.
� At the same time it needs to be recognized that other factors were also in favour.
During the mid-90¶s, the global economy was in a growth phase and therefore
contributed to better performance. The fall in performance of the industry in the
second phase was mainly due to less than anticipated growth of the Indian economy. The
industry had built additional capacities during the first phase in
anticipation of higher growth, which did not materialize.
There is a school of thought that feels liberalization of tariffs took place much faster
than required. But this may not be a strong argument since this sector achieved
some of the highest growth rates when the duties were reduced drastically. From
1991-92 to 1995-96, the customs duty on capital goods saw a reduction of almost
71%. In the second phase between 1997-98 to 2004-05 the customs duty went up to
25% from 20% in 1999-2000 and now it has been brought down to 15% in the Union
8/7/2019 THE INDIAN CAPITAL GOODS INDUSTRY
http://slidepdf.com/reader/full/the-indian-capital-goods-industry 7/36

8/7/2019 THE INDIAN CAPITAL GOODS INDUSTRY
http://slidepdf.com/reader/full/the-indian-capital-goods-industry 8/36
05 Mar'
Apr'05
5 May'0
Jun'05
05 July'
Aug'05
IIP
0
200
400
600
800
1000
1200
1400
1600
1800
In Million $
IIP Machinery and Equipment IIP Transport Equipment
IIP Mining and quarring Total CG imports ($ million)
Chart ±4 Compiled by CII based on CMIE and CSO data
� Most Indian capital goods are functionally at par with equipment made elsewhere
in the world, but in some cases they rank poorly as far as finish is concerned.
The limited presence of Indian capital goods firms in the value chain leads to
diminished cost and differentiation advantage. An emerging trend among capital
8/7/2019 THE INDIAN CAPITAL GOODS INDUSTRY
http://slidepdf.com/reader/full/the-indian-capital-goods-industry 9/36
goods companies around the world is the transformation of these engineering
companies to a more service based organization. Operational Efficiencies
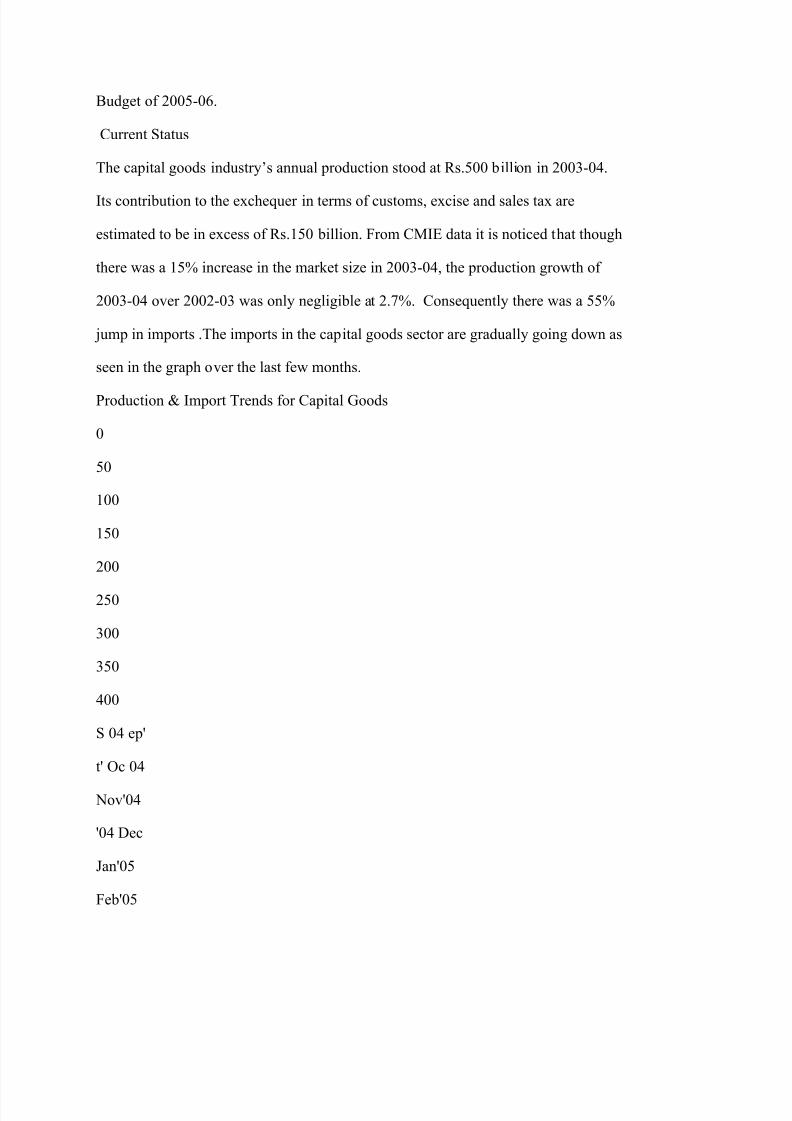
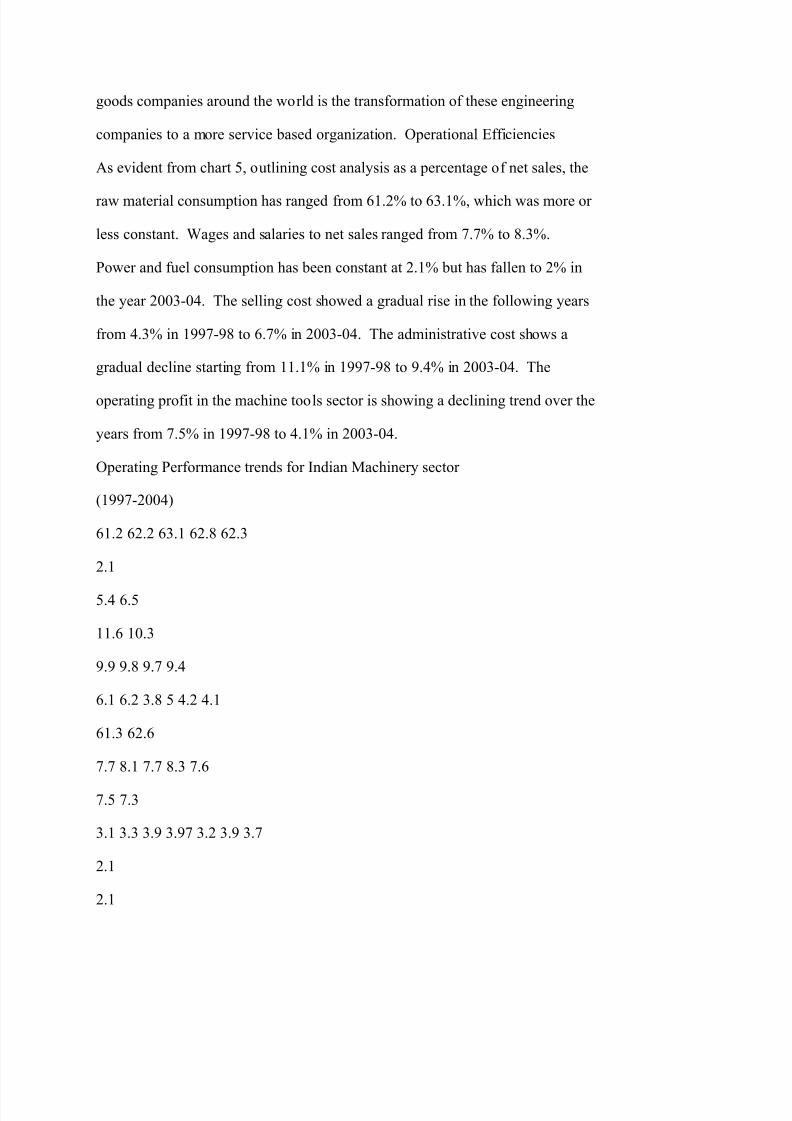
As evident from chart 5, outlining cost analysis as a percentage of net sales, the
raw material consumption has ranged from 61.2% to 63.1%, which was more or
less constant. Wages and salaries to net sales ranged from 7.7% to 8.3%.
Power and fuel consumption has been constant at 2.1% but has fallen to 2% in
the year 2003-04. The selling cost showed a gradual rise in the following years
from 4.3% in 1997-98 to 6.7% in 2003-04. The administrative cost shows a
gradual decline starting from 11.1% in 1997-98 to 9.4% in 2003-04. The
operating profit in the machine tools sector is showing a declining trend over the
years from 7.5% in 1997-98 to 4.1% in 2003-04.
Operating Performance trends for Indian Machinery sector
(1997-2004)
61.2 62.2 63.1 62.8 62.3
2.1
5.4 6.5
11.6 10.3
9.9 9.8 9.7 9.4
6.1 6.2 3.8 5 4.2 4.1
61.3 62.6
7.7 8.1 7.7 8.3 7.6
7.5 7.3
3.1 3.3 3.9 3.97 3.2 3.9 3.7
2.1
2.1
8/7/2019 THE INDIAN CAPITAL GOODS INDUSTRY
http://slidepdf.com/reader/full/the-indian-capital-goods-industry 10/36
4.5 2.1 2.1 2.1 2
4.4
4.3
5.7 6.7
11.1
7.5
0%
20%
40%
60%
80%
100%
1997-98 98-99 99-00 00-01 2001-02 2002-03 2003-04
Total Raw Material Consumption Wages and Salaries
Other Operating Expenses Power and Fuel Expenses
Selling Costs Administrative Costs
Operating Pro? t
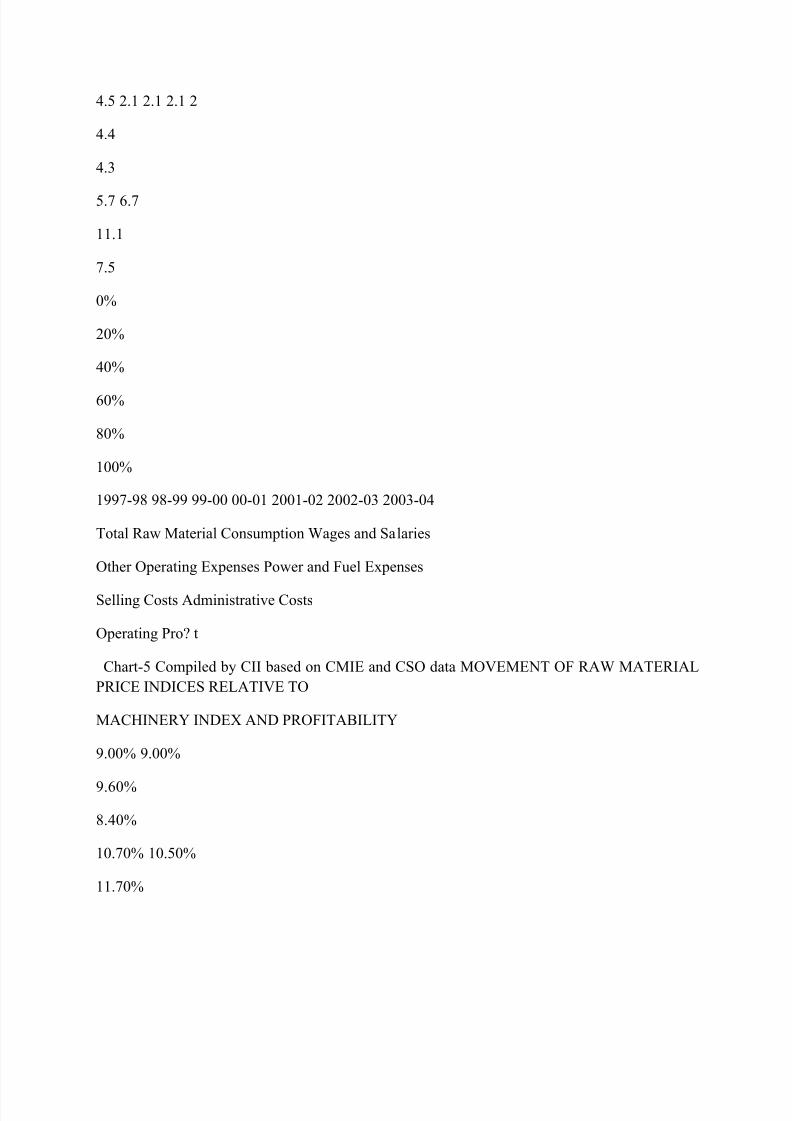
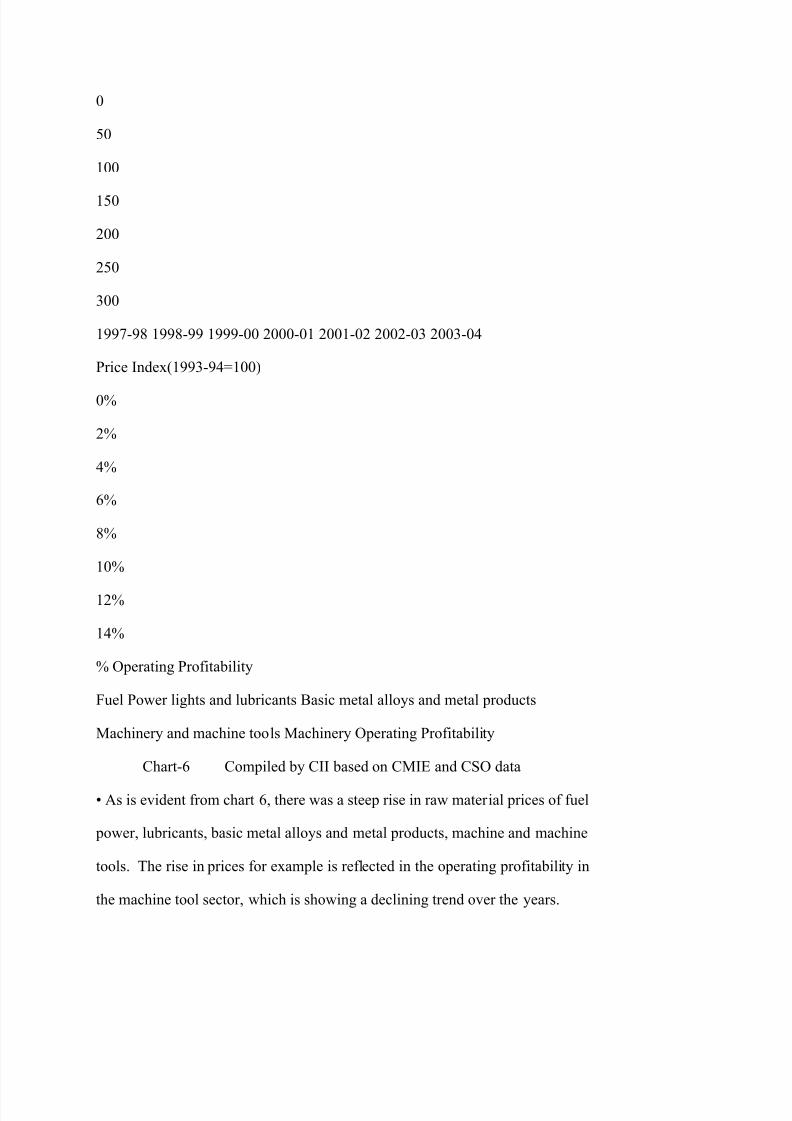
Chart-5 Compiled by CII based on CMIE and CSO data MOVEMENT OF RAW MATERIAL
PRICE INDICES RELATIVE TO
MACHINERY INDEX AND PROFITABILITY
9.00% 9.00%
9.60%
8.40%
10.70% 10.50%
11.70%
8/7/2019 THE INDIAN CAPITAL GOODS INDUSTRY
http://slidepdf.com/reader/full/the-indian-capital-goods-industry 11/36
0
50
100
150
200
250
300
1997-98 1998-99 1999-00 2000-01 2001-02 2002-03 2003-04
Price Index(1993-94=100)
0%
2%
4%
6%
8%
10%
12%
14%
% Operating Profitability
Fuel Power lights and lubricants Basic metal alloys and metal products
Machinery and machine tools Machinery Operating Profitability
Chart-6 Compiled by CII based on CMIE and CSO data
� As is evident from chart 6, there was a steep rise in raw material prices of fuel
power, lubricants, basic metal alloys and metal products, machine and machine
tools. The rise in prices for example is reflected in the operating profitability in
the machine tool sector, which is showing a declining trend over the years.
8/7/2019 THE INDIAN CAPITAL GOODS INDUSTRY
http://slidepdf.com/reader/full/the-indian-capital-goods-industry 12/36
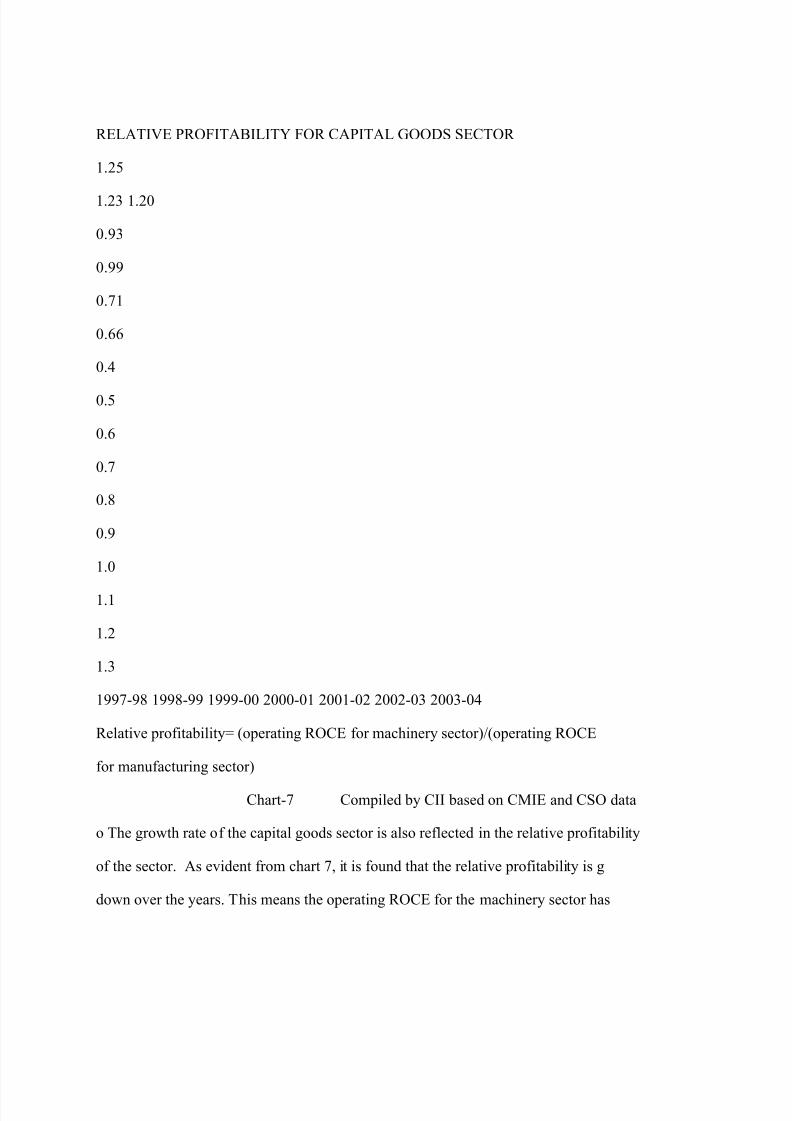
RELATIVE PROFITABILITY FOR CAPITAL GOODS SECTOR
1.25
1.23 1.20
0.93
0.99
0.71
0.66
0.4
0.5
0.6
0.7
0.8
0.9
1.0
1.1
1.2
1.3
1997-98 1998-99 1999-00 2000-01 2001-02 2002-03 2003-04
Relative profitability= (operating ROCE for machinery sector)/(operating ROCE
for manufacturing sector)
Chart-7 Compiled by CII based on CMIE and CSO data
o The growth rate of the capital goods sector is also reflected in the relative profitability
of the sector. As evident from chart 7, it is found that the relative profitability is g
down over the years. This means the operating ROCE for the machinery sector has
8/7/2019 THE INDIAN CAPITAL GOODS INDUSTRY
http://slidepdf.com/reader/full/the-indian-capital-goods-industry 13/36
been going down over the years.
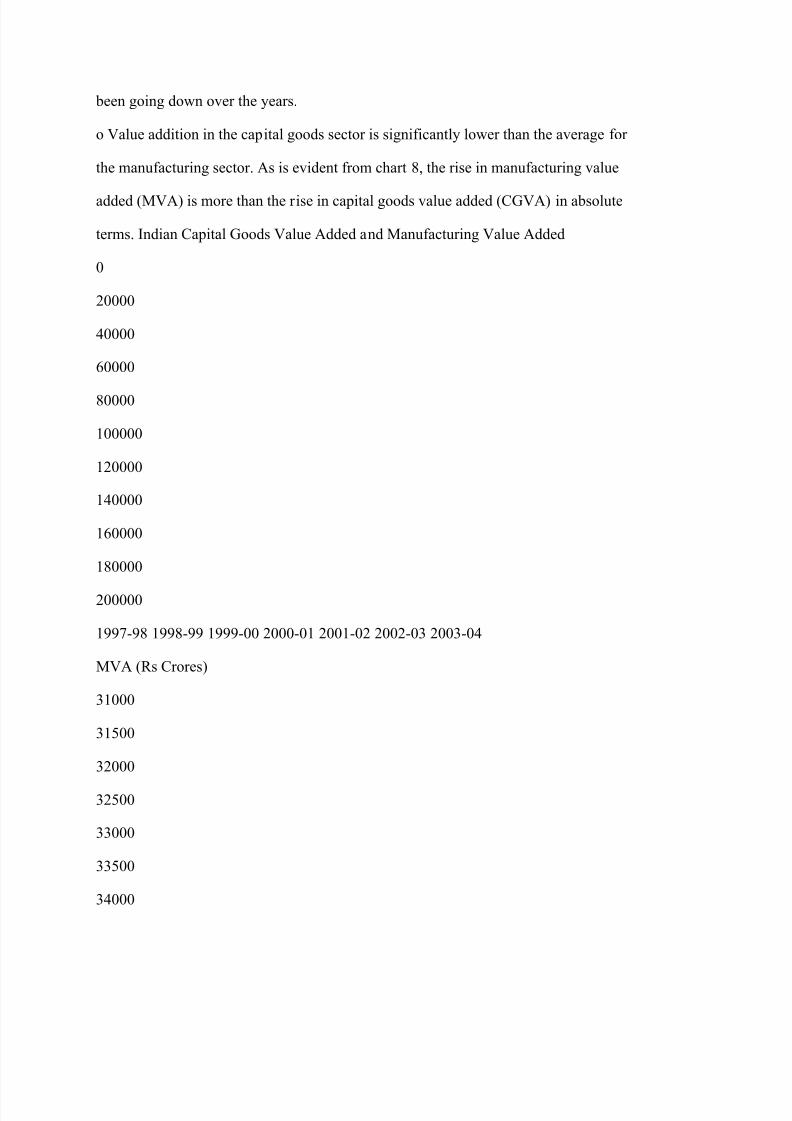
o Value addition in the capital goods sector is significantly lower than the average for
the manufacturing sector. As is evident from chart 8, the rise in manufacturing value
added (MVA) is more than the rise in capital goods value added (CGVA) in absolute
terms. Indian Capital Goods Value Added and Manufacturing Value Added
0
20000
40000
60000
80000
100000
120000
140000
160000
180000
200000
1997-98 1998-99 1999-00 2000-01 2001-02 2002-03 2003-04
MVA (Rs Crores)
31000
31500
32000
32500
33000
33500
34000
8/7/2019 THE INDIAN CAPITAL GOODS INDUSTRY
http://slidepdf.com/reader/full/the-indian-capital-goods-industry 14/36
34500
35000
35500
36000
36500
CGVA (Rs Crores)
MVA CGVA
Chart 8 Compiled by CII based on CMIE and CSO data
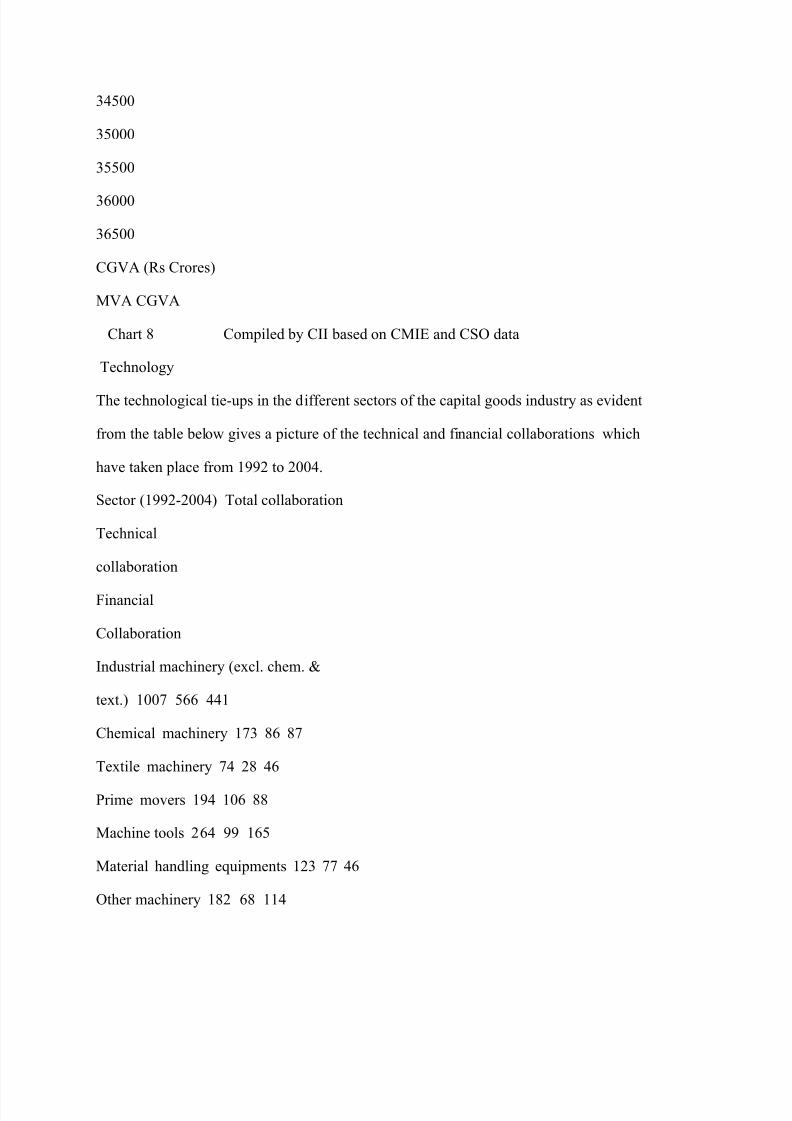
Technology
The technological tie-ups in the different sectors of the capital goods industry as evident
from the table below gives a picture of the technical and financial collaborations which
have taken place from 1992 to 2004.
Sector (1992-2004) Total collaboration
Technical
collaboration
Financial
Collaboration
Industrial machinery (excl. chem. &
text.) 1007 566 441
Chemical machinery 173 86 87
Textile machinery 74 28 46
Prime movers 194 106 88
Machine tools 264 99 165
Material handling equipments 123 77 46
Other machinery 182 68 114
8/7/2019 THE INDIAN CAPITAL GOODS INDUSTRY
http://slidepdf.com/reader/full/the-indian-capital-goods-industry 15/36
Motors & generators 53 25 28
Transformers 67 42 25
Misc. electrical machinery 516 267 249
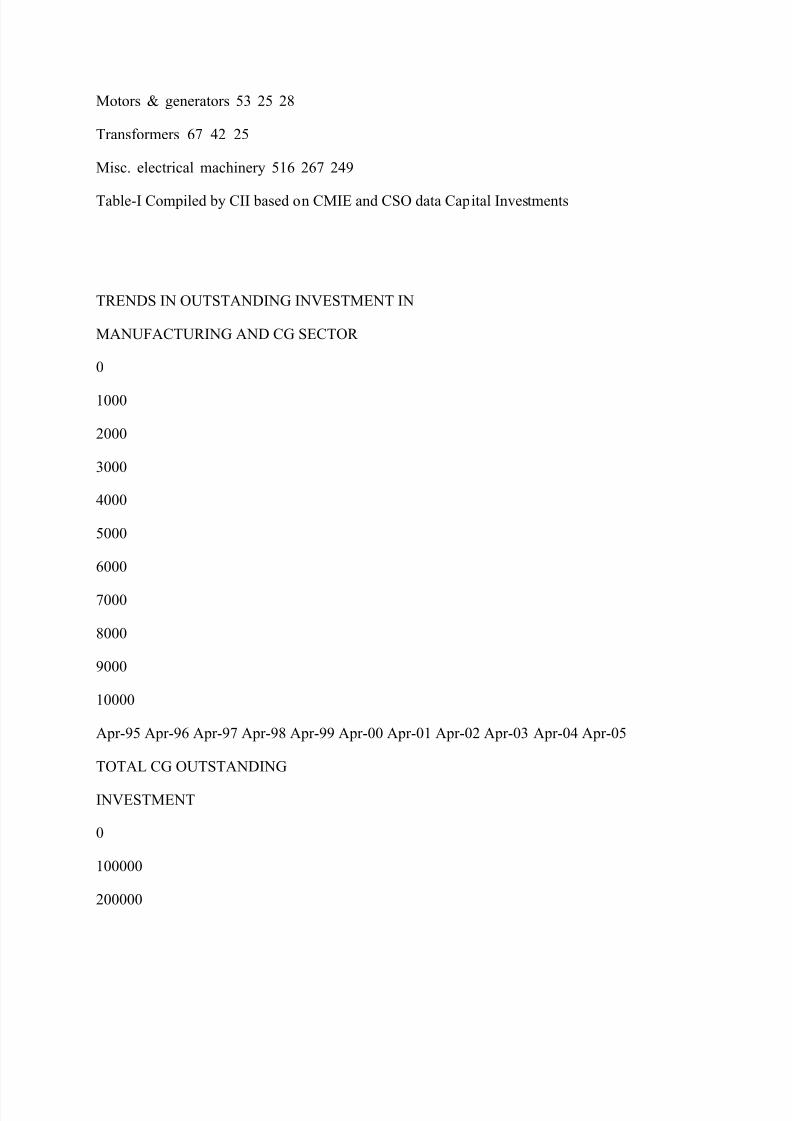
Table-I Compiled by CII based on CMIE and CSO data Capital Investments
TRENDS IN OUTSTANDING INVESTMENT IN
MANUFACTURING AND CG SECTOR
0
1000
2000
3000
4000
5000
6000
7000
8000
9000
10000
Apr-95 Apr-96 Apr-97 Apr-98 Apr-99 Apr-00 Apr-01 Apr-02 Apr-03 Apr-04 Apr-05
TOTAL CG OUTSTANDING
INVESTMENT
0
100000
200000
8/7/2019 THE INDIAN CAPITAL GOODS INDUSTRY
http://slidepdf.com/reader/full/the-indian-capital-goods-industry 16/36
300000
400000
500000
600000
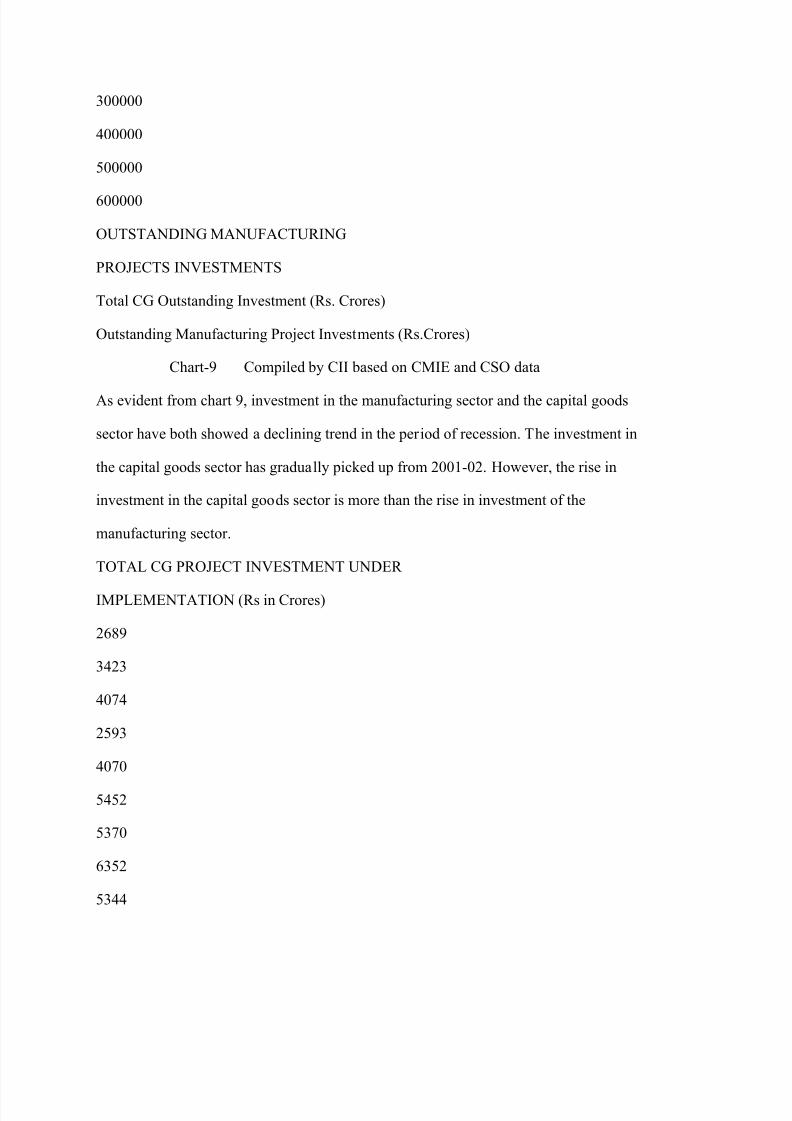
OUTSTANDING MANUFACTURING
PROJECTS INVESTMENTS
Total CG Outstanding Investment (Rs. Crores)
Outstanding Manufacturing Project Investments (Rs.Crores)
Chart-9 Compiled by CII based on CMIE and CSO data
As evident from chart 9, investment in the manufacturing sector and the capital goods
sector have both showed a declining trend in the period of recession. The investment in
the capital goods sector has gradually picked up from 2001-02. However, the rise in
investment in the capital goods sector is more than the rise in investment of the
manufacturing sector.
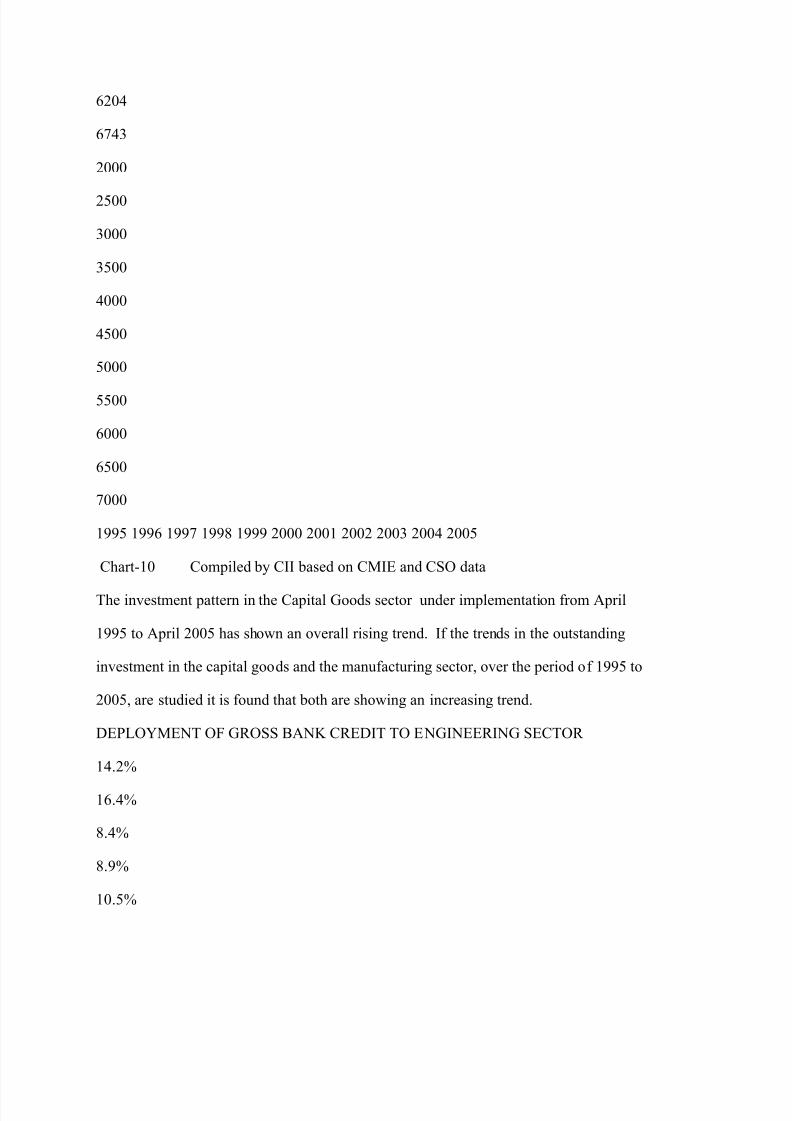
TOTAL CG PROJECT INVESTMENT UNDER
IMPLEMENTATION (Rs in Crores)
2689
3423
4074
2593
4070
5452
5370
6352
5344
8/7/2019 THE INDIAN CAPITAL GOODS INDUSTRY
http://slidepdf.com/reader/full/the-indian-capital-goods-industry 17/36
6204
6743
2000
2500
3000
3500
4000
4500
5000
5500
6000
6500
7000
1995 1996 1997 1998 1999 2000 2001 2002 2003 2004 2005
Chart-10 Compiled by CII based on CMIE and CSO data
The investment pattern in the Capital Goods sector under implementation from April
1995 to April 2005 has shown an overall rising trend. If the trends in the outstanding
investment in the capital goods and the manufacturing sector, over the period of 1995 to
2005, are studied it is found that both are showing an increasing trend.
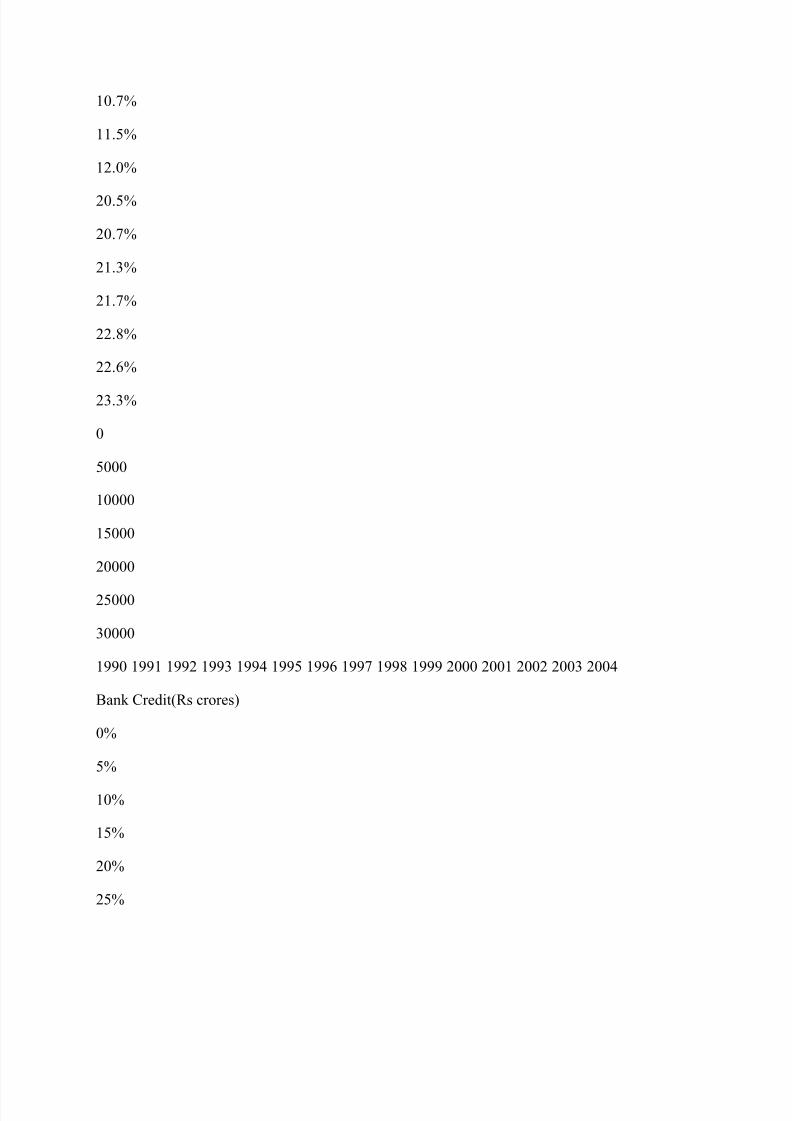
DEPLOYMENT OF GROSS BANK CREDIT TO ENGINEERING SECTOR
14.2%
16.4%
8.4%
8.9%
10.5%
8/7/2019 THE INDIAN CAPITAL GOODS INDUSTRY
http://slidepdf.com/reader/full/the-indian-capital-goods-industry 18/36
10.7%
11.5%
12.0%
20.5%
20.7%
21.3%
21.7%
22.8%
22.6%
23.3%
0
5000
10000
15000
20000
25000
30000
1990 1991 1992 1993 1994 1995 1996 1997 1998 1999 2000 2001 2002 2003 2004
Bank Credit(Rs crores)
0%
5%
10%
15%
20%
25%
8/7/2019 THE INDIAN CAPITAL GOODS INDUSTRY
http://slidepdf.com/reader/full/the-indian-capital-goods-industry 19/36
Credit to Engineering Sector as %
share of Credit to total Industry
Credit to Engineering Sector % Share of Engg in Industry
Chart-11 Compiled by CII based on CMIE and CSO data
As is evident from chart 11, credit to the engineering sector has shown an increasing
trend after 1996 but has gone down slightly between 1997 to 2002 and has again
started rising from 2003 onwards.
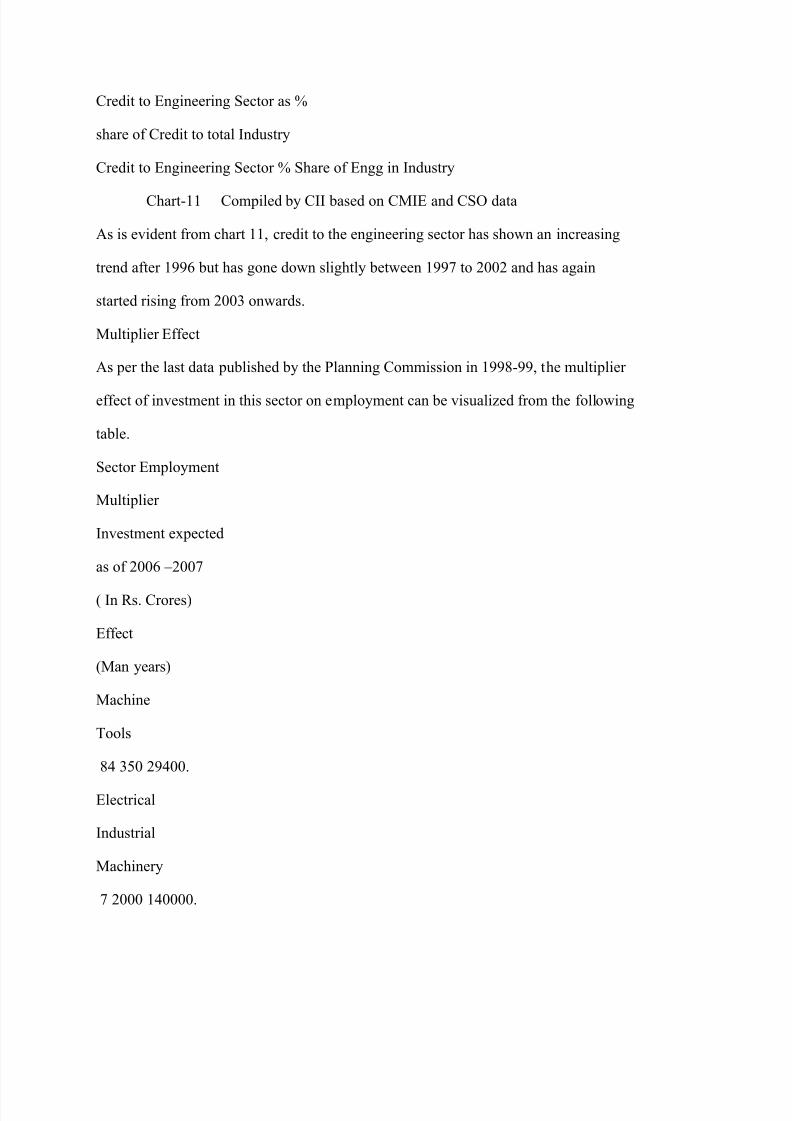
Multiplier Effect
As per the last data published by the Planning Commission in 1998-99, the multiplier
effect of investment in this sector on employment can be visualized from the following
table.
Sector Employment
Multiplier
Investment expected
as of 2006 ±2007
( In Rs. Crores)
Effect
(Man years)
Machine
Tools
84 350 29400.
Electrical
Industrial
Machinery
7 2000 140000.
8/7/2019 THE INDIAN CAPITAL GOODS INDUSTRY
http://slidepdf.com/reader/full/the-indian-capital-goods-industry 20/36
Industrial
machinery
(Others)
76 1200 91200.
Table 2 Exports
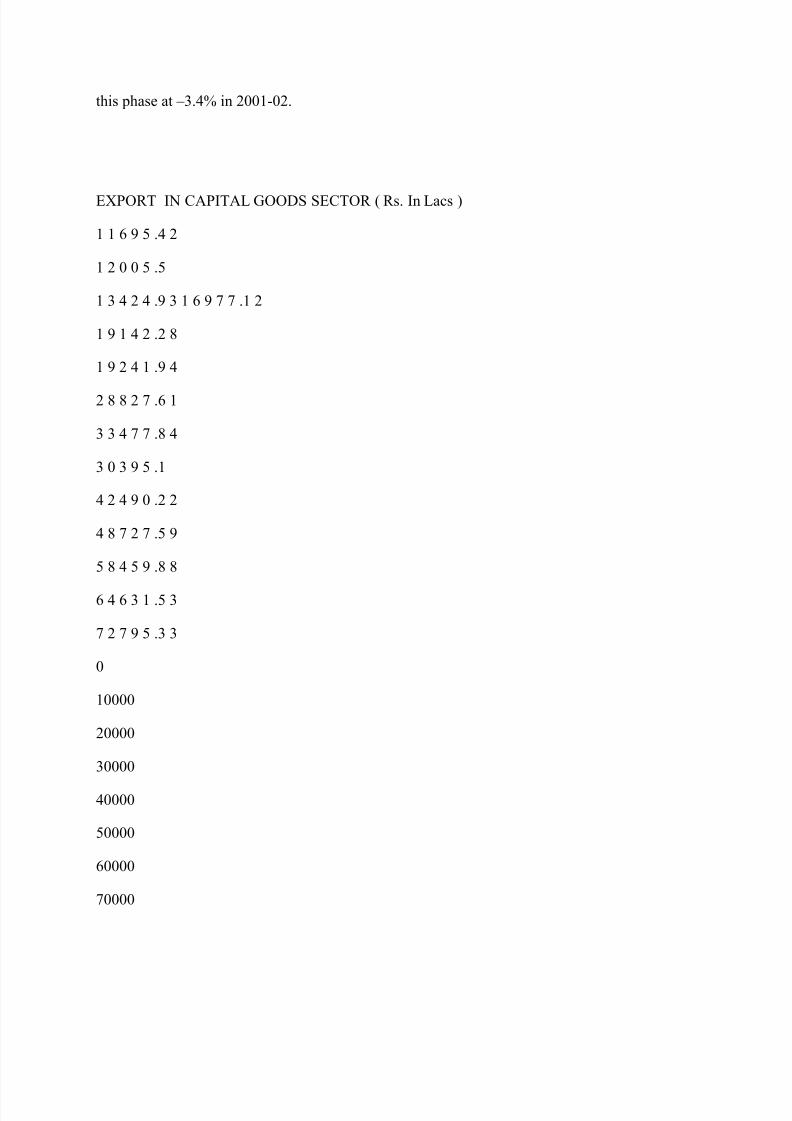
TRENDS IN CAPITAL GOODS EXPORTS
177.14
135.26
145.65 151.06
200.1
270.53
231.97
0
50
100
150
200
250
300
1998-99 1999-00 2000-01 2001-02 2002-03 2003-04 2004-05
Chart-12 Compiled by CII based on CMIE and CSO data
As evident from chart 12, exports of capital goods has seen a growth starting from
2000-01 however the percentage change in IIP of capital goods fell drastically during
8/7/2019 THE INDIAN CAPITAL GOODS INDUSTRY
http://slidepdf.com/reader/full/the-indian-capital-goods-industry 21/36
this phase at ±3.4% in 2001-02.
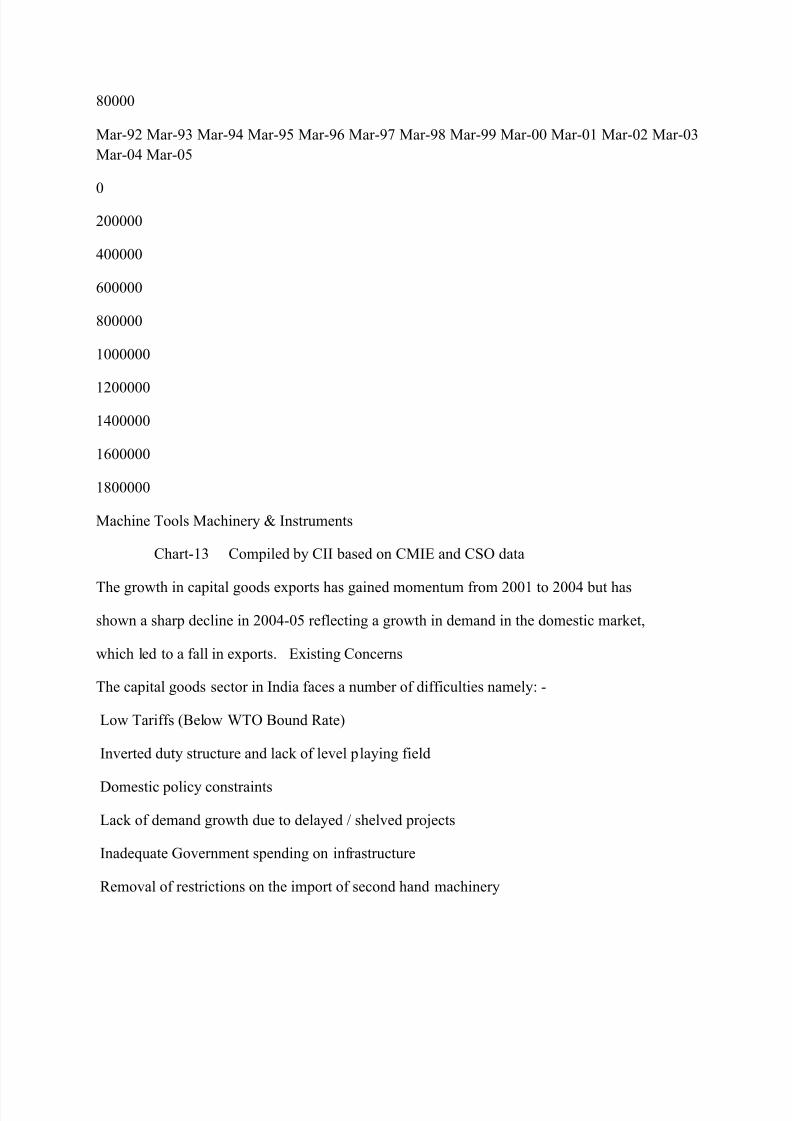
EXPORT IN CAPITAL GOODS SECTOR ( Rs. In Lacs )
1 1 6 9 5 .4 2
1 2 0 0 5 .5
1 3 4 2 4 .9 3 1 6 9 7 7 .1 2
1 9 1 4 2 .2 8
1 9 2 4 1 .9 4
2 8 8 2 7 .6 1
3 3 4 7 7 .8 4
3 0 3 9 5 .1
4 2 4 9 0 .2 2
4 8 7 2 7 .5 9
5 8 4 5 9 .8 8
6 4 6 3 1 .5 3
7 2 7 9 5 .3 3
0
10000
20000
30000
40000
50000
60000
70000
8/7/2019 THE INDIAN CAPITAL GOODS INDUSTRY
http://slidepdf.com/reader/full/the-indian-capital-goods-industry 22/36
80000
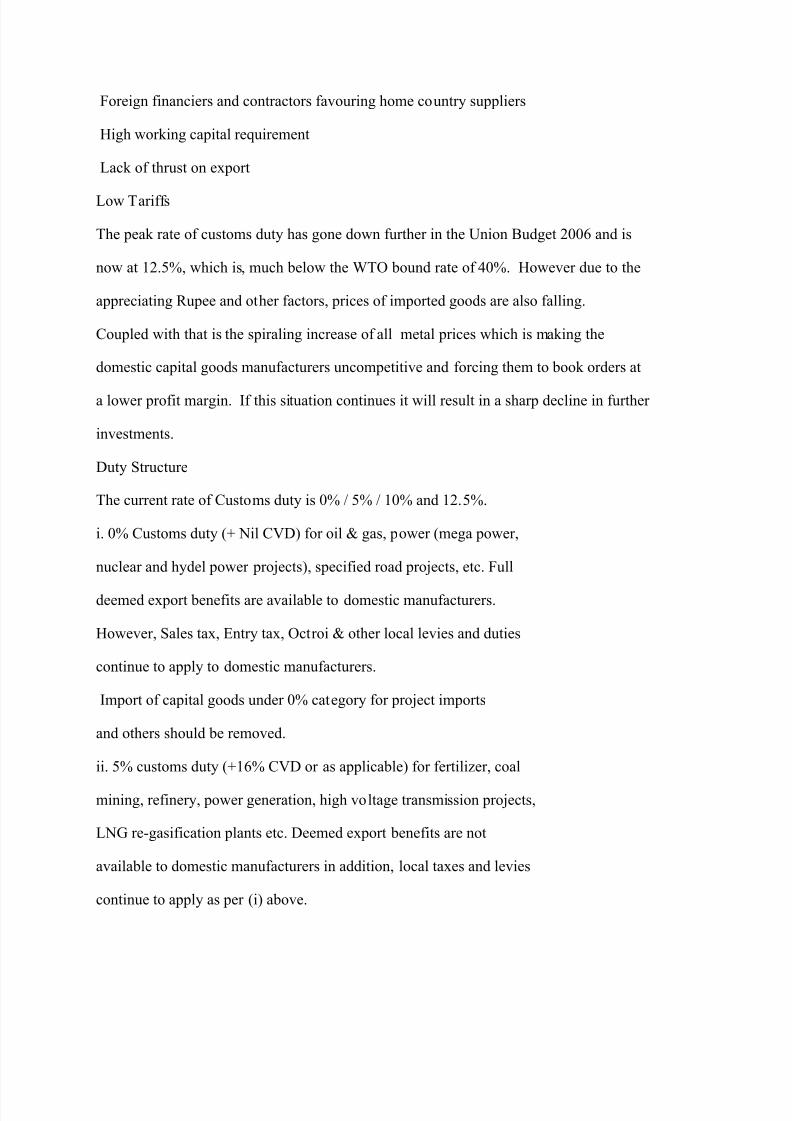
Mar-92 Mar-93 Mar-94 Mar-95 Mar-96 Mar-97 Mar-98 Mar-99 Mar-00 Mar-01 Mar-02 Mar-03
Mar-04 Mar-05
0
200000
400000
600000
800000
1000000
1200000
1400000
1600000
1800000
Machine Tools Machinery & Instruments
Chart-13 Compiled by CII based on CMIE and CSO data
The growth in capital goods exports has gained momentum from 2001 to 2004 but has
shown a sharp decline in 2004-05 reflecting a growth in demand in the domestic market,
which led to a fall in exports. Existing Concerns
The capital goods sector in India faces a number of difficulties namely: -
Low Tariffs (Below WTO Bound Rate)
Inverted duty structure and lack of level playing field
Domestic policy constraints
Lack of demand growth due to delayed / shelved projects
Inadequate Government spending on infrastructure
Removal of restrictions on the import of second hand machinery
8/7/2019 THE INDIAN CAPITAL GOODS INDUSTRY
http://slidepdf.com/reader/full/the-indian-capital-goods-industry 23/36
Foreign financiers and contractors favouring home country suppliers
High working capital requirement
Lack of thrust on export
Low Tariffs
The peak rate of customs duty has gone down further in the Union Budget 2006 and is
now at 12.5%, which is, much below the WTO bound rate of 40%. However due to the
appreciating Rupee and other factors, prices of imported goods are also falling.
Coupled with that is the spiraling increase of all metal prices which is making the
domestic capital goods manufacturers uncompetitive and forcing them to book orders at
a lower profit margin. If this situation continues it will result in a sharp decline in further
investments.
Duty Structure
The current rate of Customs duty is 0% / 5% / 10% and 12.5%.
i. 0% Customs duty (+ Nil CVD) for oil & gas, power (mega power,
nuclear and hydel power projects), specified road projects, etc. Full
deemed export benefits are available to domestic manufacturers.
However, Sales tax, Entry tax, Octroi & other local levies and duties
continue to apply to domestic manufacturers.
Import of capital goods under 0% category for project imports
and others should be removed.
ii. 5% customs duty (+16% CVD or as applicable) for fertilizer, coal
mining, refinery, power generation, high voltage transmission projects,
LNG re-gasification plants etc. Deemed export benefits are not
available to domestic manufacturers in addition, local taxes and levies
continue to apply as per (i) above.
8/7/2019 THE INDIAN CAPITAL GOODS INDUSTRY
http://slidepdf.com/reader/full/the-indian-capital-goods-industry 24/36
Extend deemed export benefits to coal mining projects, LNG
regassification plants, aerial passenger ropeway projects,
fertilizer projects, crude petroleum refinery in 10
th
Plan and
specified equipment for high voltage power transmission
projects, as all these attract basic customs duty of 5%. iii. On an average, capital goods constitute
about 30% - 40% of the cost
of a project. Customs duty of 12.5% on capital goods is considered a
dis-incentive to investment. The logic, which demands that duty rates
on capital goods should be brought down when extended to capital
goods manufacturers imply that they should also get their inputs at 5%
lower duty. In addition to this for any item imported under the Early
Harvest Scheme of an FTA, inputs for manufacture of this item in India
must be allowed to be imported at 5% rate of duty.
In certain cases where the complete equipment is coming in at 5% or 10%, some
of the components or sub-assemblies are at a peak rate of 12.5% resulting in an
inverted duty structure.
Customs duty of special components and some raw materials required by the
four sectors covered under the study (list has been detailed out in the report )
to be brought down to 5% to make the indigenously manufactured equipment
cost competitive. For example CRGO steel, an important raw material for the
manufacture of transformers, is not manufactured in India and has to be
imported by the manufacturers. This should attract only 5% duty. Other such
raw materials and components are mentioned in detail under each section of
8/7/2019 THE INDIAN CAPITAL GOODS INDUSTRY
http://slidepdf.com/reader/full/the-indian-capital-goods-industry 25/36
the report.
Lack of Level playing field
All domestic manufacturers of equipment as mentioned under Sl.No.1 are
uncompetitive due to the additional burden of Sales Tax, Entry Tax, Octroi, VAT
and other local duties and levies, etc.
To provide a level playing field, domestic manufacturers were considered to
be deemed exporters and given the benefits of procuring their raw materials
also at zero duty, besides getting a refund on the excise duty paid at the last
stage. The complexion of these benefits has been altered from time to time.
The refund on excise duty paid involves a time lag of 6 to 9 months and adds
to the cost of the domestic manufacturer. The deemed exports route is an
equalizer for domestic capital goods manufacturers and this benefit must be
given without exception wherever imports are currently allowed at 0% or 5%
duty.
Imposing a 4% additional CVD on all capital goods and project imports
attracting nil or 5% duty to counter balance CST/VAT on indigenous capital
goods. Imposing a CVD equivalent to the prevailing VAT rates on all imports
and on the revenues for reimbursing the States that have provided VAT credit
to manufacturers importing these inputs.
o This has been partially granted in the Budget 2006-2007 through
notification No. D.O.F. No. 334/3/2006-TRU dated 28.2.06 on the
basis of this recommendation being forwarded to the Ministry of
Finance by the Ministry of Heavy Industry. However, this is not
applicable to the electrical sector including mega power projects and transmission and
distribution projects and this requires
8/7/2019 THE INDIAN CAPITAL GOODS INDUSTRY
http://slidepdf.com/reader/full/the-indian-capital-goods-industry 26/36
further consideration.
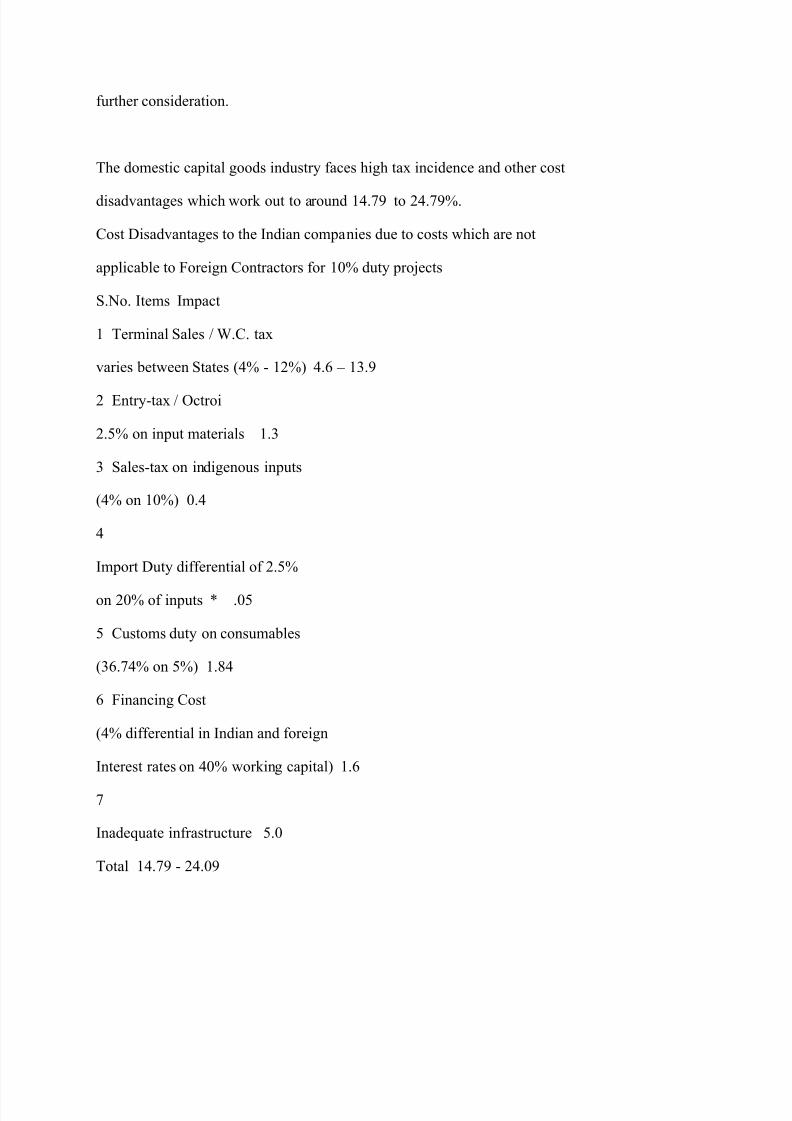
The domestic capital goods industry faces high tax incidence and other cost
disadvantages which work out to around 14.79 to 24.79%.
Cost Disadvantages to the Indian companies due to costs which are not
applicable to Foreign Contractors for 10% duty projects
S.No. Items Impact
1 Terminal Sales / W.C. tax
varies between States (4% - 12%) 4.6 ± 13.9
2 Entry-tax / Octroi
2.5% on input materials 1.3
3 Sales-tax on indigenous inputs
(4% on 10%) 0.4
4
Import Duty differential of 2.5%
on 20% of inputs * .05
5 Customs duty on consumables
(36.74% on 5%) 1.84
6 Financing Cost
(4% differential in Indian and foreign
Interest rates on 40% working capital) 1.6
7
Inadequate infrastructure 5.0
Total 14.79 - 24.09
8/7/2019 THE INDIAN CAPITAL GOODS INDUSTRY
http://slidepdf.com/reader/full/the-indian-capital-goods-industry 27/36
* Since import duty on finished capital goods is 10% and domestic capital goods
manufacturers can
import only certain items at 10% duty. Remaining inputs will have to be imported at 12.5%
duty.
Domestic capital goods manufacturers will pay additional duty of 2.5% on 20% items.
Domestic Policy Constraints
� The delay in imposition of a uniform VAT replacing the CST and State taxes
has been a major disadvantage for the domestic manufacturers.
� Continuation of purchase preference to the profitable PSU¶s is further affecting
fair competition.
� The domestic manufacturers also bear the burden of various local taxes, which
importers do not have to pay. In addition, there are other disadvantages in the
form of external factors and costs like inadequate and low quality power,
infrastructure, high cost of finance and inefficiencies in logistics ± warehousing,
transportation and distribution. In case of tenders specifying that ³Form C´ will
not be issued indigenous supplies suffer additional 10% price disadvantage.
Owing to these factors, the cost disadvantage suffered by the domestic capital
goods industry is to the extent of 24%. Lack of demand growth due to delayed / shelved
projects
Though there has been an upturn in the economy, many sectors are witnessing
inadequate investment as a result of delays or shelving of projects. More than
Rs.2500 billion of investment has been shelved or delayed slowing down the
growth momentum in the capital goods sector.
Capital outlays have been cut and many customers are cash strapped.
Profitable companies are utilizing their resources in investing abroad and making

8/7/2019 THE INDIAN CAPITAL GOODS INDUSTRY
http://slidepdf.com/reader/full/the-indian-capital-goods-industry 28/36
acquisitions abroad.
Inadequate Government Spending on Infrastructure
In the Budget 2005-06 an allocation of Rs.14 billion had been provided for
development of highways, which is not very significant. A SPV has been
proposed for infrastructure financing which is likely to invest Rs.100 billion in
2005-06.
The Union Budget 2006-07 has indicated that 5083 MW will be added to power
generation capacity in 2005-06. The total addition during the Tenth Plan period
the total addition is estimated at 34000 MW. However, no significant addition is
being made to the road network.
There are a number of proposals for development of 1000 kms of access-
controlled highways and to enhance the budgetary allocation to the Department
of Shipping by 37%. It is necessary for Government to ensure that a greater
momentum is given to infrastructure growth. This will also help to promote the
growth and development of the Indian Capital Goods industry.
Import of Second Hand Machines
Many companies believe that second-hand machinery and equipment from
industrialized countries represent a low-cost and quick solution to the problem of
replacing outdated machinery and/or building up new capacities.
There are many problems that occur when imported second hand machinery is
used in India. Even if second-hand machinery may seem to be a low-cost
alternative, their transfer is not always unproblematic and their use does not
always provide the desired results. This is partly to do with the machinery itself,
which has usually been constructed under different conditions in developed
countries.
8/7/2019 THE INDIAN CAPITAL GOODS INDUSTRY
http://slidepdf.com/reader/full/the-indian-capital-goods-industry 29/36
In India second hand equipment is coming in mostly in construction &
earthmoving machinery, machine tools, plastic processing machines, refineries,
paper, packaging, printing and mining machinery. In the estimation of the US
Commercial Service, 75% of all imported capital goods in India are second-hand.
For a developing nation such as India, we cannot do without imports of second
hand machinery. However, to safeguard against indiscriminate imports and to protect the
domestic manufacturers, it is imperative that Government should
impose certain guidelines.
Foreign Financiers & Contractors
There are several handicaps faced by the Indian capital goods manufacturers
especially for projects overseas. These are:
� International competitors offer cheap supplier¶s credit
� Distortion in multilaterally financed projects
� No Government support for pre-qualification for overseas projects.
High Working Capital Requirements
Indian capital goods manufacturers have working capital requirements upto 40-
45% of net sales (against the global benchmark of 15%). This is primarily due to
the high inventory required to be carried as a result of delays in supply of inputs
and consumables. Such delays result from transport bottlenecks; delays in
customs clearance and supply commitments. The interest rate regime in the
country results in a substantial 7 to 8% interest rate differential relative to the
reference countries, amounting to a 3.1 to 3.6% capital cost disadvantage due to
interest differential and 0.9% due to higher working capital requirements.
Lack of Thrust on Exports
Indian firms, in general, lack export thrust in their marketing strategies. They
8/7/2019 THE INDIAN CAPITAL GOODS INDUSTRY
http://slidepdf.com/reader/full/the-indian-capital-goods-industry 30/36
8/7/2019 THE INDIAN CAPITAL GOODS INDUSTRY
http://slidepdf.com/reader/full/the-indian-capital-goods-industry 31/36
manufacturing facilities to a SEZ. An added complexity is that many companies
need to be located near the source of raw material (e.g. steel), or skilled labour
pools, or clusters of suppliers. It would, therefore, not make economic, or
business sense to relocate such units.
In the case of the capital goods industry, many of the units have been set up
some decades ago and the relationships mentioned above have matured. Apart
from this, the very significant capital costs which will need to be incurred by such
a unit for re-locating its production facility, would not allow such a unit to benefit
from such re-location. The policy benefits of SEZ's could in no way be made
available to the existing capital goods industry, or manufacturing exporters
located in the various parts of the country. UNIDO has identified 370 industry
clusters in various parts of India and many of the units located in these areas
cannot benefit from the policy on SEZ's.
Another issue is that there is a substantial lead time involved in building a SEZ
and even if a unit were to consider re-location, it would be unable to benefit from
this in the short term. The solution lies in introducing a policy of Virtual SEZ
which is similar in concept to the current EOUs. Any unit with exports more than
50% of its production in a block of 3 years, wherever it may be located, can be a
deemed VSEZ.
Such units could enjoy all the benefits available to a unit located in a SEZ. The
minimum qualifying criteria could be -
� Turnover of Rs.25 crores.
8/7/2019 THE INDIAN CAPITAL GOODS INDUSTRY
http://slidepdf.com/reader/full/the-indian-capital-goods-industry 32/36
� Export of 50% of its production in a block of 3 years.
Technology constraint
In many sectors of capital goods industry, the current levels of technology in use
are not contemporary. This is especially the case in SME¶s who very often
provide components or intermediates to the OEM¶s .In some of the sectors there
is a problem in organizing technology from overseas.
GOI should constitute a national technology policy for critical areas. It
should ensure that for all major projects in India, foreign vendors
desirous of supplying capital goods must necessarily source 30% of
the proposed bid from local companies. India should leverage its
market to make it obligatory for foreign companies securing orders to
transfer technology to competent local companies. All approved foreign collaboration projects
of more than Rs.2 crores
should submit a detailed technology absorption, adaptation and
assimilation plan.
The Department of Heavy Industry, Government of India may like to
consider constituting a Modernization Fund to help the Capital Goods
sector to upgrade technology, retool, install balancing equipment and
achieve international benchmarking through absorption of soft
technologies.
The Modernization Fund should cover the following: -
a) Machine tools and accessories.
b) Electrical equipment including motors, rotating machines,
switchgears, cables, transformers, capacitors, meters and
transmission lines.
8/7/2019 THE INDIAN CAPITAL GOODS INDUSTRY
http://slidepdf.com/reader/full/the-indian-capital-goods-industry 33/36
c) Mining, Earthmoving and Construction Equipment
d) Process Plant Industry
The Modernization Fund Scheme should have the following three components:
Technology Upgradation & Modernization (TUM) to assist the
industry in installing modern machinery. The objective should
be to make the funds available to the industry at globally
competitive rates and thereby encourage technology
upgradation and modernization.
Business Development Services (BDS) to assist the industry in
availing of competent techno-commercial services. The
objective should be to make the globally acknowledged best
practices and know-how available to the industry through
accredited service providers, which would enable the industry
in sharpening its competitive edge.
Common R&D Facilities (CRDF) to address the critical R&D
needs. The objective should be to address the critical needs
with respect to common R&D facilities in the identified subsectors on a Public-Private-
Partnership (PPP) model that would
favourably impact the competitiveness of the industry.
The Modernization Fund should provide loans, subject to the following terms and
conditions:
a) Eligibility of the companies seeking loans against this fund should
have to fulfill two criteria: -
i. An investment of Rs.5 crores as minimum and Rs.20
crores as maximum needs to be made.
8/7/2019 THE INDIAN CAPITAL GOODS INDUSTRY
http://slidepdf.com/reader/full/the-indian-capital-goods-industry 34/36
ii. A company which has approached the capital market
through an IPO will not be eligible. b) The Scheme should be in operation for a total of 5 years
from 1
st
April 2006. Loans sanctioned by the lending agency till the last date
of the duration of the scheme period, will be eligible under the
Scheme and the reimbursement would continue to be available till
the same is repaid as per the normal lending period of the nodal
agency.
Research and Development
To encourage domestic companies to invest more into R&D the customs duties /
excise duties of laboratory testing equipment should be reduced to make it
affordable.
150% weighted deduction on R&D expenditure should be allowed
under the Income Tax Act Section 35 to encourage companies to set
up full fledged R&D departments with requisite manpower and
laboratory.
Customs duty or excise duty for laboratory testing equipment should
be reduced to 5 %, or exempted respectively. (A separate notification
giving details of laboratory and testing equipment may be issued.)
Information and Communication Technology (ICT)
To encourage higher investment into ICT the following may be considered.
Higher depreciation on IT hardware and shoftware to encourage more
companies to use ICT.
Computer software is present attracting a 60% rate of depreciation under

8/7/2019 THE INDIAN CAPITAL GOODS INDUSTRY
http://slidepdf.com/reader/full/the-indian-capital-goods-industry 35/36
8/7/2019 THE INDIAN CAPITAL GOODS INDUSTRY
http://slidepdf.com/reader/full/the-indian-capital-goods-industry 36/36
procuring either from the domestic market or importing. The companies chosen
are thus mainly those who are manufacturing or trading in complete equipment in
India.
Process Plants
For process plant equipment the sample size included 80 major companies
which had a total market share of 90% of the domestic demand. The companies
surveyed were manufacturers of process plant and equipment.
Machine Tools
For the machine tool sector, the sample size included 155 large units and SME¶s
which had a total market share of 56% of the Indian market .The companies
surveyed are manufacturers of complete machine tools as well as importers of
both metal cutting and metal forming machines.
Electrical Machinery
For the electrical machinery sector the sample size included 120 major
companies which had a total market share of 97% of the domestic demand. The
companies surveyed were heavy electrical equipment manufacturers
manufacturing transformers, motors, generators, alternators, capacitors,
switchgears, HT circuit breakers, turbines, power contactors and energy meters.