Embed Size (px)
Citation preview
Market Research Report on
THE INDIAN METAL CUTTING MACHINE
TOOL INDUSTRY
Preface
2
Indian Machine Tool Manufacturers Association (IMTMA) is the apex body of machine tool industry in India . The
association aims to enhance the competitiveness of Indian industry through its various initiatives on productivity,
quality enhancement and technology exposures to Indian machine tool manufacturers and end-users.
As a part of various initiatives IMTMA has commissioned a market research to study the market and technology
adoption levels in cutting technology in Indian market.
In this regard, they have engaged BDB India Private Limited to carry out a Market Research Study to evaluate the
market and technology adoption levels in metal cutting technology in India for the products under the scope of the
study.
The Study has transformed to a detailed report on market dynamics and technology trends in short, medium and
long term for Indian market.
The market forecasting focused on market size estimation, product type wise demand assessment, end user
segment wise share and preference, need gaps and pain areas .
BDB India Private Limited was set up 2 decades ago with the objective of providing world class management inputs
to engineering businesses in India. Today, BDB offer business consulting including market research services to most
market savvy organizations worldwide.
BDB has offered market research inputs for setting up new businesses and in expanding existing ones. BDB has
assisted in identifying new opportunity areas and in evaluating their short, medium and long term commercial
potential. BDB has developed business analysis expertise in industrial products, systems & consumables, consumer
durables and medical equipment.
Continued...
3
BDB also has a division (BDB QSAMM) that assists our customers to analyze and establish customer satisfaction
indices.
BDB specializes in the following :
- Analysis for estimating the market size and potential
- Technology and emerging trends
- Competition analysis
- Distribution channel analysis
- Market entry strategies
- Partner identification
The study has been successfully completed and its output is being presented in the form of this report.
The findings of the study are presented in this report, and its contents are strictly confidential and meant for
the exclusive use of IMTMA.
The statements and analyses in this report are based on the information and opinion obtained during field
investigations and from various published sources.
Contents
4
Page No
Preface
CHAPTER 1 PROJECT BACKGROUND 5
Objectives of the study 6
Scope of the study 7
CHAPTER 2 EXECUTIVE SUMMARY 11
CHAPTER 3 CONCLUSIONS 42
CHAPTER 4 PRODUCT WISE ANALYSIS 48
Electric discharge machines 49
Turning centers 59
Machining centers 84
Milling machines 108
Grinding Machines 120
Tool grinding machines 131
SPMs 142
CHAPTER 5 TRENDS IN THE END USER SECTORS 150
Automotive 151
Auto components 157
General Engineering 165
Heavy Engineering 170
Aerospace & Defence 176
Die & Mould 182
APPENDIX
1. PROJECT BACKGROUND
- OBJECTIVES OF THE STUDY
- SCOPE OF THE STUDY
Objectives of the study
6
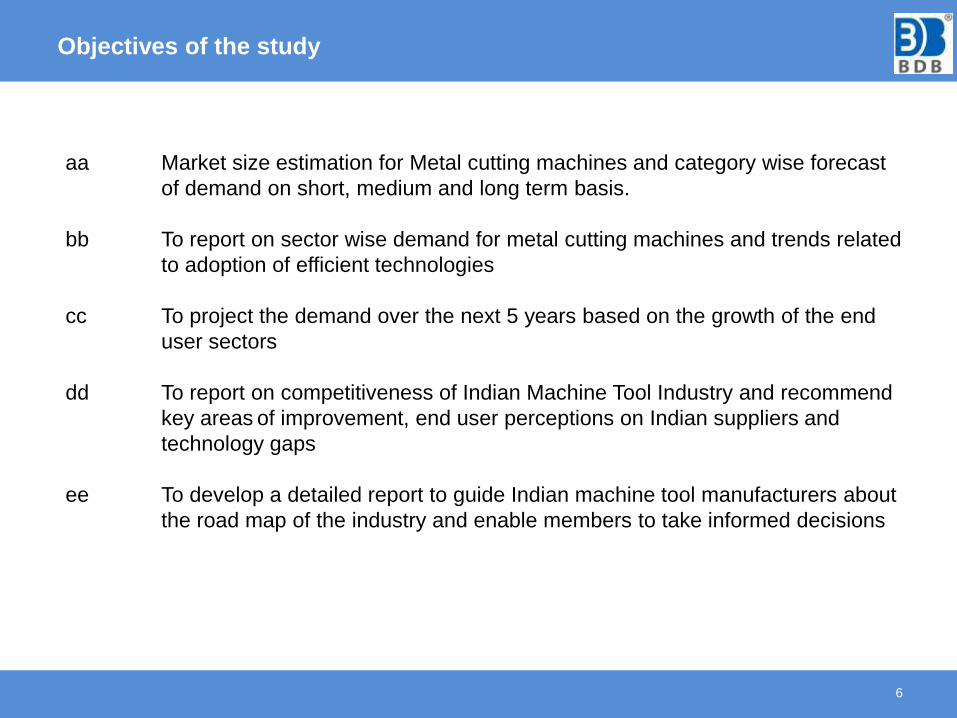
aa Market size estimation for Metal cutting machines and category wise forecast
of demand on short, medium and long term basis.
bb To report on sector wise demand for metal cutting machines and trends related
to adoption of efficient technologies
cc To project the demand over the next 5 years based on the growth of the end
user sectors
dd To report on competitiveness of Indian Machine Tool Industry and recommend
key areas of improvement, end user perceptions on Indian suppliers and
technology gaps
ee To develop a detailed report to guide Indian machine tool manufacturers about
the road map of the industry and enable members to take informed decisions
Scope of the study
7
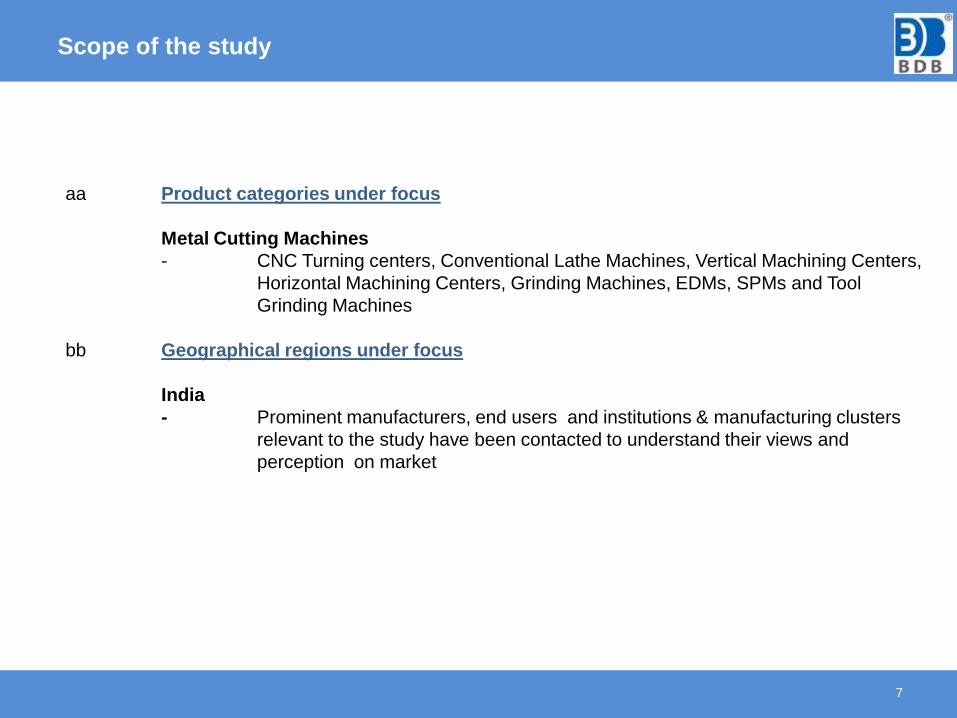
aa Product categories under focus
Metal Cutting Machines
- CNC Turning centers, Conventional Lathe Machines, Vertical Machining Centers,
Horizontal Machining Centers, Grinding Machines, EDMs, SPMs and Tool
Grinding Machines
bb Geographical regions under focus
India
- Prominent manufacturers, end users and institutions & manufacturing clusters
relevant to the study have been contacted to understand their views and
perception on market
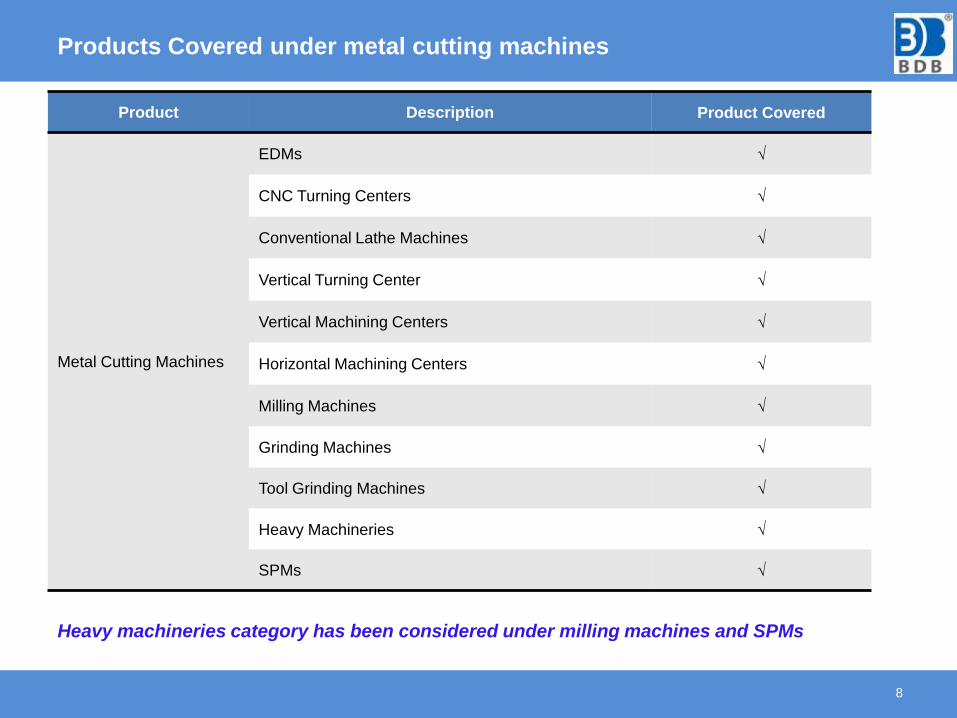
Products Covered under metal cutting machines
Product Description Product Covered
Metal Cutting Machines
EDMs √
CNC Turning Centers √
Conventional Lathe Machines √
Vertical Turning Center √
Vertical Machining Centers √
Horizontal Machining Centers √
Milling Machines √
Grinding Machines √
Tool Grinding Machines √
Heavy Machineries √
SPMs √
8
Heavy machineries category has been considered under milling machines and SPMs
Study Methodology
9
The study was carried out with a multi pronged approach involving stakeholders like
end users, domestic manufacturers of machine tool, importers, component suppliers
key industry bodies and industry experts of the user industries.
Analysis regarding the total market potential and the product wise trends were sourced
from the domestic manufacturers, importers and import export data. Where as
discussions with end users were carried out to understand types of machinery used,
source, technology trends prevailing and the growth potential of the metal cutting
machinery based on their growth trends. The end users provided the vital inputs which
led to analyzing their buying behaviour.
A detailed analysis of the customs data on imports was carried out to understand the
extent of machine tool imports into the country and sources for such procurement;
information pertaining to imports of new and used machines were separately analyzed
to arrive at meaningful inputs for the industry.
A representative sample of stakeholders has been included in key demand and
manufacturing clusters covering companies from small, medium and large scale
categories.
Discussions with various stake holders were carried out through an intensive primary
research exercise involving personal meeting between BDB analysts and respondents.
Market Forecasting : Approach
10
Approach - Overview
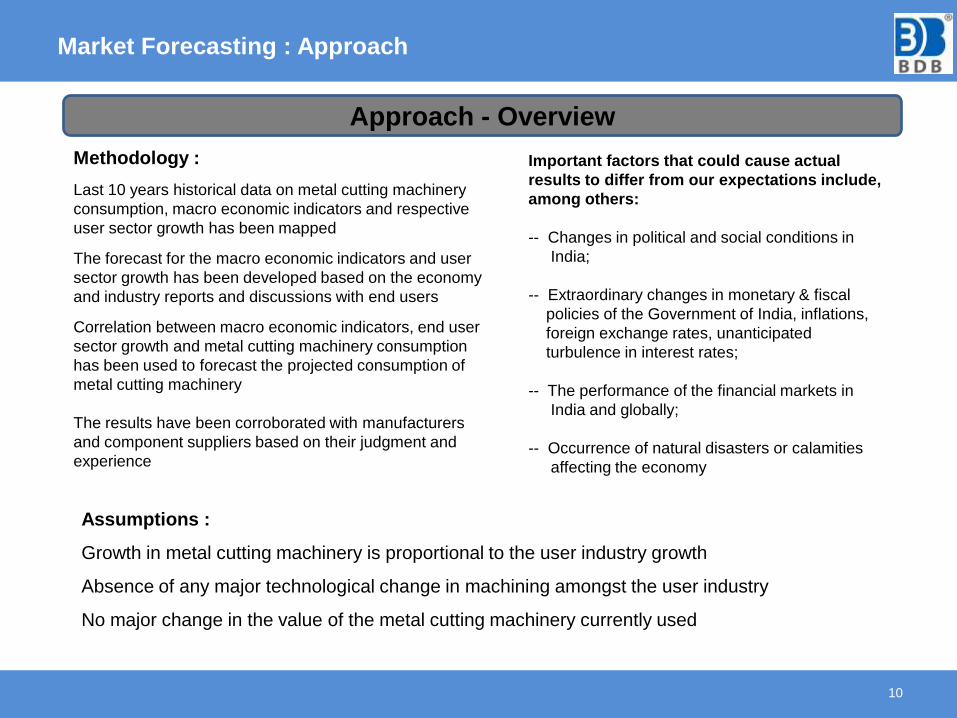
Methodology :
Last 10 years historical data on metal cutting machinery
consumption, macro economic indicators and respective
user sector growth has been mapped
The forecast for the macro economic indicators and user
sector growth has been developed based on the economy
and industry reports and discussions with end users
Correlation between macro economic indicators, end user
sector growth and metal cutting machinery consumption
has been used to forecast the projected consumption of
metal cutting machinery
The results have been corroborated with manufacturers
and component suppliers based on their judgment and
experience
Important factors that could cause actual
results to differ from our expectations include,
among others:
-- Changes in political and social conditions in
India;
-- Extraordinary changes in monetary & fiscal
policies of the Government of India, inflations,
foreign exchange rates, unanticipated
turbulence in interest rates;
-- The performance of the financial markets in
India and globally;
-- Occurrence of natural disasters or calamities
affecting the economy
Assumptions :
Growth in metal cutting machinery is proportional to the user industry growth
Absence of any major technological change in machining amongst the user industry
No major change in the value of the metal cutting machinery currently used
2. EXECUTIVE SUMMARY
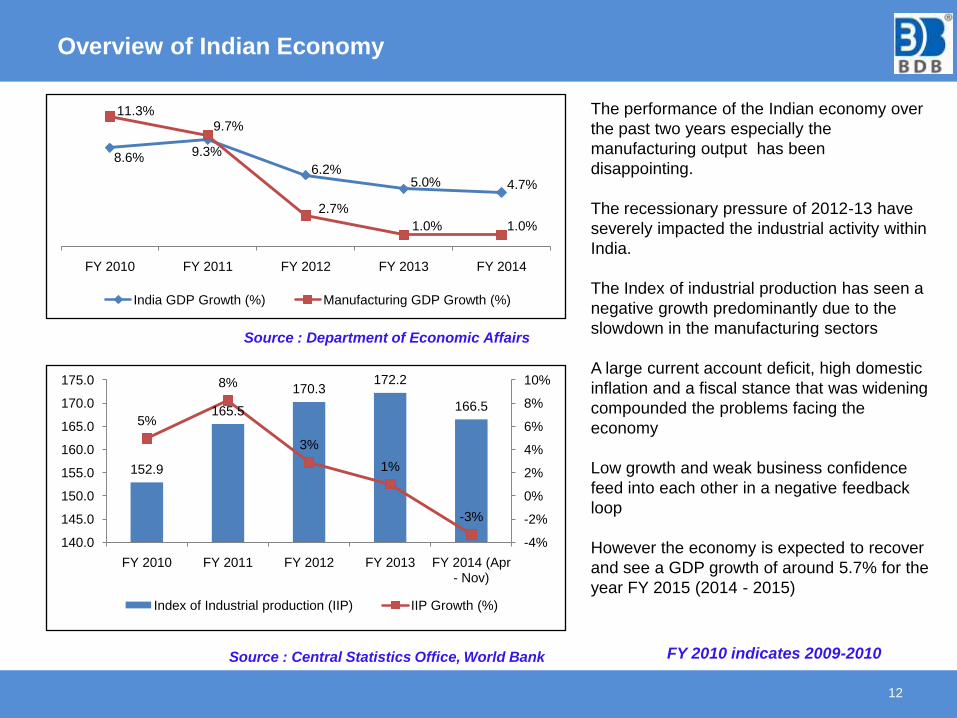
Overview of Indian Economy
12
8.6% 9.3%
6.2%5.0% 4.7%
11.3%9.7%
2.7%
1.0% 1.0%
FY 2010 FY 2011 FY 2012 FY 2013 FY 2014
India GDP Growth (%) Manufacturing GDP Growth (%)
The performance of the Indian economy over
the past two years especially the
manufacturing output has been
disappointing.
The recessionary pressure of 2012-13 have
severely impacted the industrial activity within
India.
The Index of industrial production has seen a
negative growth predominantly due to the
slowdown in the manufacturing sectors
A large current account deficit, high domestic
inflation and a fiscal stance that was widening
compounded the problems facing the
economy
Low growth and weak business confidence
feed into each other in a negative feedback
loop
However the economy is expected to recover
and see a GDP growth of around 5.7% for the
year FY 2015 (2014 - 2015)
152.9
165.5
170.3172.2
166.55%
8%
3%
1%
-3%
-4%
-2%
0%
2%
4%
6%
8%
10%
140.0
145.0
150.0
155.0
160.0
165.0
170.0
175.0
FY 2010 FY 2011 FY 2012 FY 2013 FY 2014 (Apr - Nov)
Index of Industrial production (IIP) IIP Growth (%)
Source : Central Statistics Office, World Bank
Source : Department of Economic Affairs
FY 2010 indicates 2009-2010
Overview of Indian machine tool industry
13
India is the 16th largest manufacturer of machine tools in the world as per Gardner’s world consumption report 2013.
The Indian machine tool industry consists of around1000 manufacturing units covering large, medium and small
companies. Domestic manufacturers account for about 36% of consumption within the Indian machine tools market.
Since 2002, the Indian engineering sector especially the auto and auto ancillary sector has witnessed increased
investments as global engineering giants have started outsourcing from India and have started to establish their
manufacturing facilities based in India. This led to a spurt in demand for machine tools in India. Now the Indian machine
tool industry is in a position to export the general purpose and standard machine tools to even industrially advanced
countries.
The recessionary pressure of 2012-13 have severely impacted the industrial activity within India.
Decline in turnover is due to the slowdown of industrial activity in the country particularly in the
automotive, infrastructure, heavy engineering and construction industries as a result the growth of the Indian machine
tools industry was hampered. However the recent revival in the index of industrial production can be construed as a
harbinger of growth for the Indian machine tools industry.
Indian Machine Tool Industry Journey
14
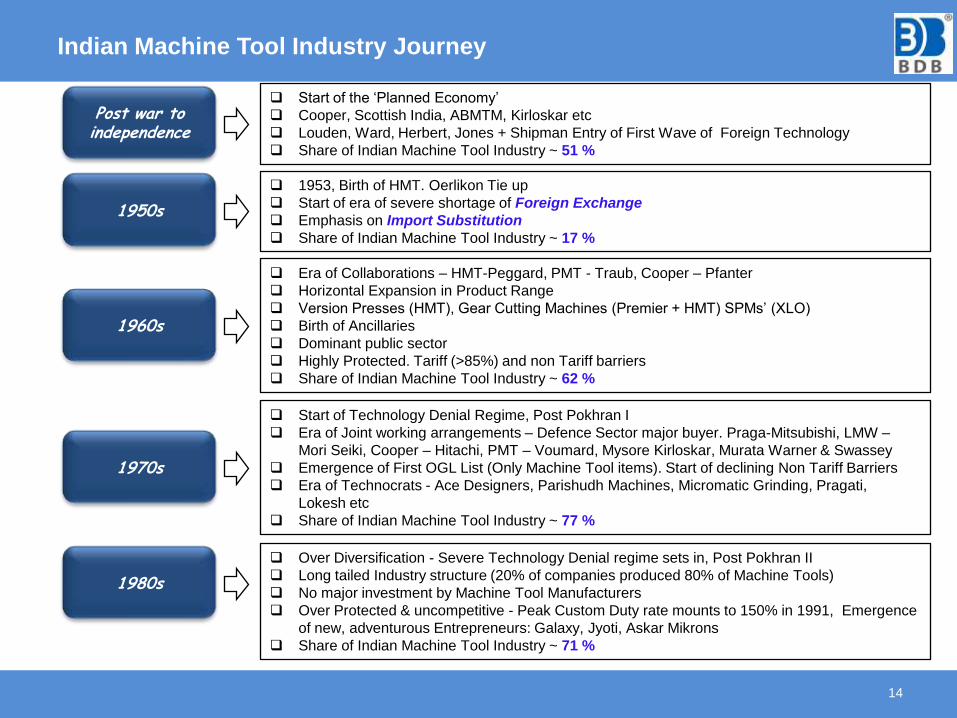
Post war to independence
Start of the ‘Planned Economy’
Cooper, Scottish India, ABMTM, Kirloskar etc
Louden, Ward, Herbert, Jones + Shipman Entry of First Wave of Foreign Technology
Share of Indian Machine Tool Industry ~ 51 %
1950s
1953, Birth of HMT. Oerlikon Tie up
Start of era of severe shortage of Foreign Exchange
Emphasis on Import Substitution
Share of Indian Machine Tool Industry ~ 17 %
1960s
Era of Collaborations – HMT-Peggard, PMT - Traub, Cooper – Pfanter
Horizontal Expansion in Product Range
Version Presses (HMT), Gear Cutting Machines (Premier + HMT) SPMs’ (XLO)
Birth of Ancillaries
Dominant public sector
Highly Protected. Tariff (>85%) and non Tariff barriers
Share of Indian Machine Tool Industry ~ 62 %
1970s
Start of Technology Denial Regime, Post Pokhran I
Era of Joint working arrangements – Defence Sector major buyer. Praga-Mitsubishi, LMW –
Mori Seiki, Cooper – Hitachi, PMT – Voumard, Mysore Kirloskar, Murata Warner & Swassey
Emergence of First OGL List (Only Machine Tool items). Start of declining Non Tariff Barriers
Era of Technocrats - Ace Designers, Parishudh Machines, Micromatic Grinding, Pragati,
Lokesh etc
Share of Indian Machine Tool Industry ~ 77 %
1980s
Over Diversification - Severe Technology Denial regime sets in, Post Pokhran II
Long tailed Industry structure (20% of companies produced 80% of Machine Tools)
No major investment by Machine Tool Manufacturers
Over Protected & uncompetitive - Peak Custom Duty rate mounts to 150% in 1991, Emergence
of new, adventurous Entrepreneurs: Galaxy, Jyoti, Askar Mikrons
Share of Indian Machine Tool Industry ~ 71 %
Indian Machine Tool Industry Journey
15
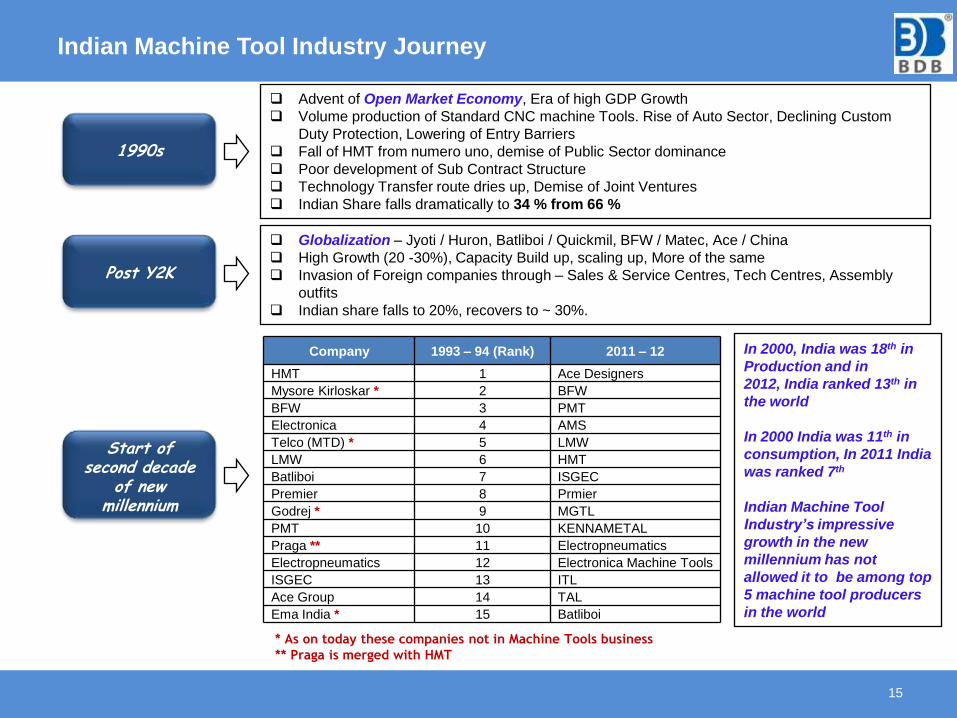
1990s
Advent of Open Market Economy, Era of high GDP Growth
Volume production of Standard CNC machine Tools. Rise of Auto Sector, Declining Custom
Duty Protection, Lowering of Entry Barriers
Fall of HMT from numero uno, demise of Public Sector dominance
Poor development of Sub Contract Structure
Technology Transfer route dries up, Demise of Joint Ventures
Indian Share falls dramatically to 34 % from 66 %
Post Y2K
Globalization – Jyoti / Huron, Batliboi / Quickmil, BFW / Matec, Ace / China
High Growth (20 -30%), Capacity Build up, scaling up, More of the same
Invasion of Foreign companies through – Sales & Service Centres, Tech Centres, Assembly
outfits
Indian share falls to 20%, recovers to ~ 30%.
Company 1993 – 94 (Rank) 2011 – 12
HMT 1 Ace Designers
Mysore Kirloskar * 2 BFW
BFW 3 PMT
Electronica 4 AMS
Telco (MTD) * 5 LMW
LMW 6 HMT
Batliboi 7 ISGEC
Premier 8 Prmier
Godrej * 9 MGTL
PMT 10 KENNAMETAL
Praga ** 11 Electropneumatics
Electropneumatics 12 Electronica Machine Tools
ISGEC 13 ITL
Ace Group 14 TAL
Ema India * 15 Batliboi
Start of second decade
of new millennium
In 2000, India was 18th in
Production and in
2012, India ranked 13th in
the world
In 2000 India was 11th in
consumption, In 2011 India
was ranked 7th
Indian Machine Tool
Industry’s impressive
growth in the new
millennium has not
allowed it to be among top
5 machine tool producers
in the world
* As on today these companies not in Machine Tools business
** Praga is merged with HMT
Overview of metal cutting machines in India
16
The current market size of the metal cutting industry stands at INR 6750 crores, off which the domestic
production makes for around 45% of the total consumption.
The Indian players have grown rapidly over the last ten years and now have their presence across all
product categories.
High value machines dominate the import market.
There are three major clusters of countries from which India imports machines:
-- Spain and Switzerland forming the high average value, low volume segment;
-- Japan, Germany, Italy and South Korea primarily operating in the high to medium
value, high volume segment;
-- China, Taiwan and USA forming the low value high volume segment.
India imports four critical components viz., CNC systems, ball screws, precision bearings and LM
guides which makes for around 40% of the total cost of a typical CNC Machine tool. India also imports
other major sub systems like , APC’s, Rotary indexing tables, motorized spindles etc.
Additionally, lack of development in high precision, multi-axes machines is currently hindering the rapid
growth in key strategic industries such as the nuclear and defense sectors. Due to India not being a
signatory to the NPT and CTBT, it cannot import these machines and hence it is imperative for the
country to develop these technologies at the earliest.
The consumption in this industry is primarily driven by the automobile sector which accounts for nearly
40% of the market, die and mould and industrial machinery are the other key user sectors in this
industry.
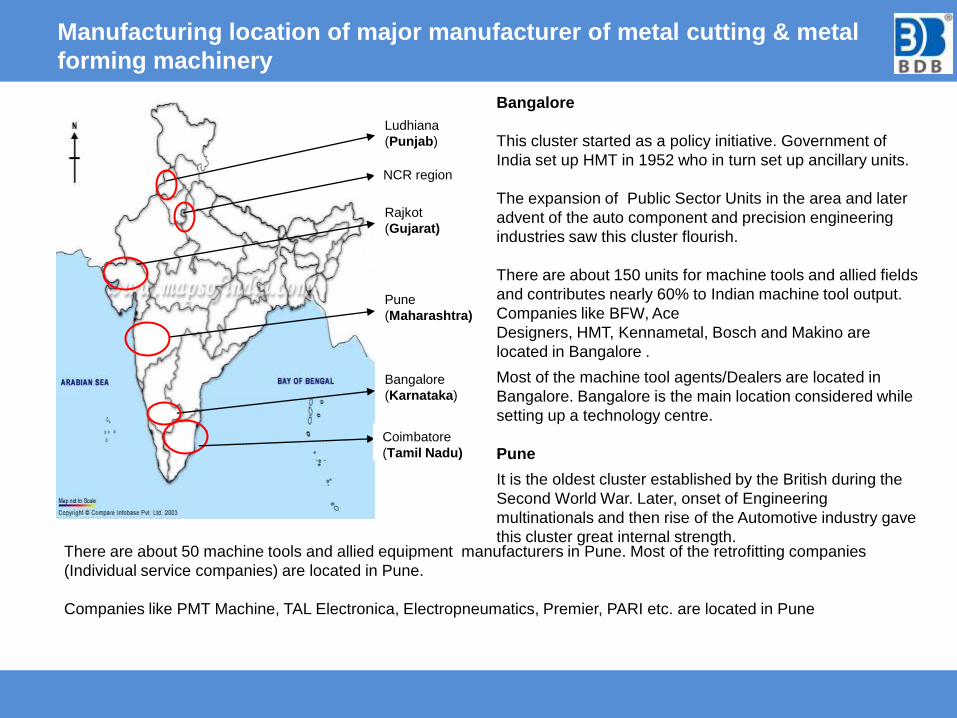
Manufacturing location of major manufacturer of metal cutting & metal
forming machinery
Ludhiana
(Punjab)
Rajkot
(Gujarat)
Pune
(Maharashtra)
Bangalore
(Karnataka)
Coimbatore
(Tamil Nadu)
Bangalore
This cluster started as a policy initiative. Government of
India set up HMT in 1952 who in turn set up ancillary units.
The expansion of Public Sector Units in the area and later
advent of the auto component and precision engineering
industries saw this cluster flourish.
There are about 150 units for machine tools and allied fields
and contributes nearly 60% to Indian machine tool output.
Companies like BFW, Ace
Designers, HMT, Kennametal, Bosch and Makino are
located in Bangalore .
Most of the machine tool agents/Dealers are located in
Bangalore. Bangalore is the main location considered while
setting up a technology centre.
Pune
It is the oldest cluster established by the British during the
Second World War. Later, onset of Engineering
multinationals and then rise of the Automotive industry gave
this cluster great internal strength. There are about 50 machine tools and allied equipment manufacturers in Pune. Most of the retrofitting companies
(Individual service companies) are located in Pune.
Companies like PMT Machine, TAL Electronica, Electropneumatics, Premier, PARI etc. are located in Pune
NCR region
Continue...
Rajkot
Traditionally a centre of turned parts, the cluster grew due to high demand from diesel engine industry. For long
languishing as craftsmen, Rajkot is at the nascent stage of the genuine engineering phase. Rajkot has emerged as the
second largest base for manufacture of CNC machine tools after Bangalore and overtaking Pune. Jyoti and
Manpower CNC Machines are the most prominent suppliers based in Rajkot.
NCR:
NCR is a cluster with a few large companies like ISGEC, Micromatic, Parishudh, SRB Hindustan Hydraulics etc.
Ludhiana
This cluster was developed as a natural cluster. Craftsmanship and reverse engineering capabilities coupled with
demand from a thriving bicycle and hand tool manufacturing segments, the cluster grew rapidly.
Dotted with tiny units, the cluster has around 400 units covering nearby areas such as Jalandhar and Batala producing
low end workshop machinery for small and tiny sectors and providing limited service (mechanical service, repair etc.)
Marshall machines and Rattan Hammers are the most prominent suppliers in this region.
Coimbatore
Essentially a domain of a few large companies, this is a modern cluster with high standards in Quality & Technology.
Around 20 companies represent this close knit cluster which caters to automotive sector mainly. LMW is located in
Coimbatore
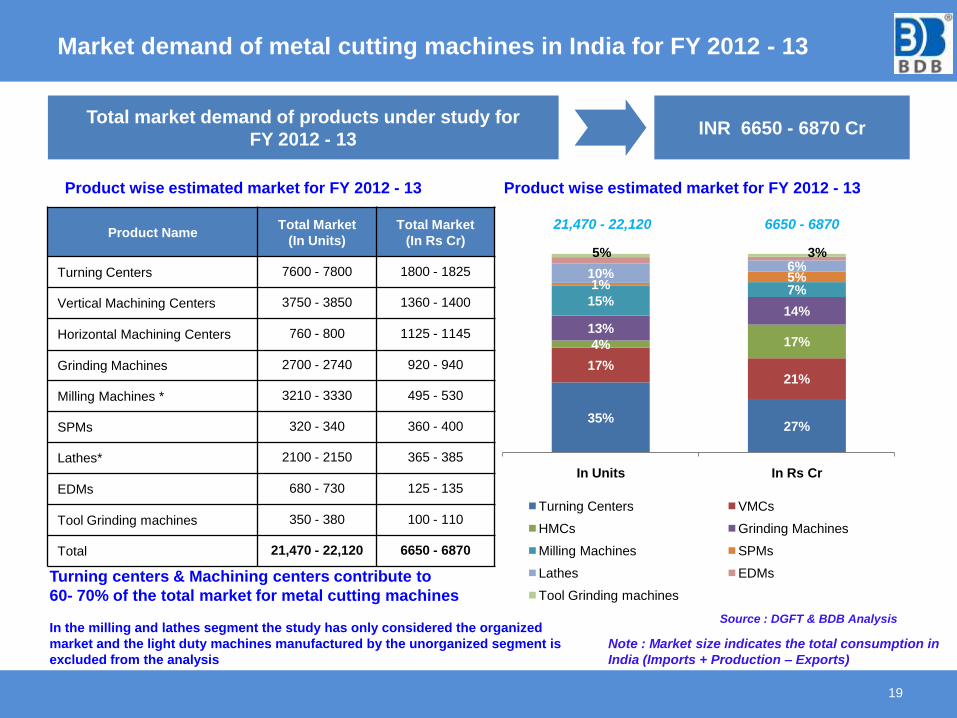
Market demand of metal cutting machines in India for FY 2012 - 13
19
Total market demand of products under study for
FY 2012 - 13INR 6650 - 6870 Cr
Product NameTotal Market
(In Units)
Total Market
(In Rs Cr)
Turning Centers 7600 - 7800 1800 - 1825
Vertical Machining Centers 3750 - 3850 1360 - 1400
Horizontal Machining Centers 760 - 800 1125 - 1145
Grinding Machines 2700 - 2740 920 - 940
Milling Machines * 3210 - 3330 495 - 530
SPMs 320 - 340 360 - 400
Lathes* 2100 - 2150 365 - 385
EDMs 680 - 730 125 - 135
Tool Grinding machines 350 - 380 100 - 110
Total 21,470 - 22,120 6650 - 6870
Product wise estimated market for FY 2012 - 13 Product wise estimated market for FY 2012 - 13
21,470 - 22,120 6650 - 6870
Note : Market size indicates the total consumption in
India (Imports + Production – Exports)
Source : DGFT & BDB Analysis
Turning centers & Machining centers contribute to
60- 70% of the total market for metal cutting machines
35%27%
17%21%
4% 17%13%
14%15%
7%1%5%10%6%
In Units In Rs Cr
Turning Centers VMCs
HMCs Grinding Machines
Milling Machines SPMs
Lathes EDMs
Tool Grinding machines
3%5%
In the milling and lathes segment the study has only considered the organized
market and the light duty machines manufactured by the unorganized segment is
excluded from the analysis
5%
24%17%
22%18%
17%
10%
13%29%
12%16%
7%
In Units In Rs Cr
HMCs Turning Centers
Grinding Machines VMCs
Milling Machines Lathes
SPMs EDMs
Tool Grinding machines
52%
34%
25%
30%
8%
10%
2%9%
2% 9%5%3%
In Units In Rs Cr
Turning Centers VMCsGrinding Machines SPMs HMCs LathesEDMs Tool Grinding machines Milling Machines
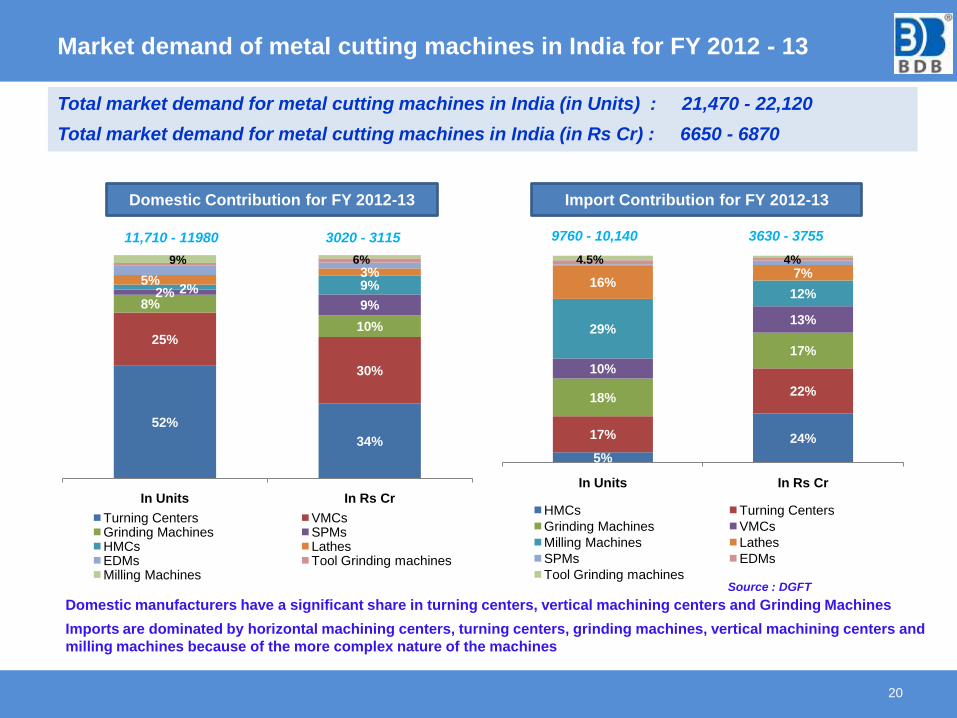
Market demand of metal cutting machines in India for FY 2012 - 13
20
Domestic Contribution for FY 2012-13 Import Contribution for FY 2012-13
Total market demand for metal cutting machines in India (in Units) : 21,470 - 22,120
Total market demand for metal cutting machines in India (in Rs Cr) : 6650 - 6870
11,710 - 11980 3020 - 3115 9760 - 10,140 3630 - 3755
Domestic manufacturers have a significant share in turning centers, vertical machining centers and Grinding Machines
Imports are dominated by horizontal machining centers, turning centers, grinding machines, vertical machining centers and
milling machines because of the more complex nature of the machines
6%9% 4%4.5%
Source : DGFT
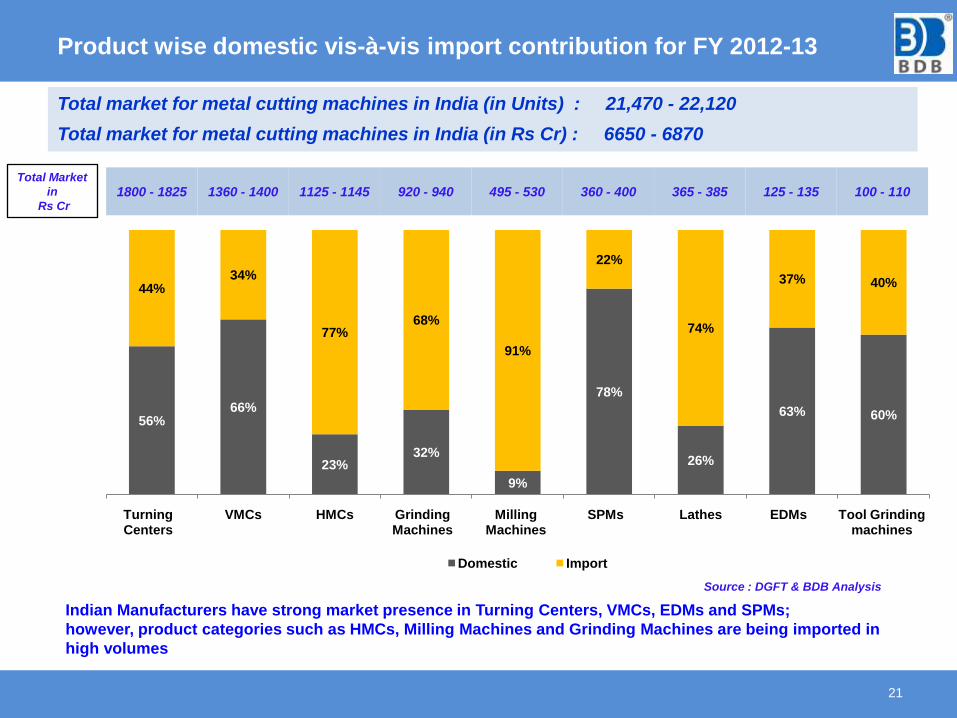
Product wise domestic vis-à-vis import contribution for FY 2012-13
21
1800 - 1825 1360 - 1400 1125 - 1145 920 - 940 495 - 530 360 - 400 365 - 385 125 - 135 100 - 110
Total market for metal cutting machines in India (in Units) : 21,470 - 22,120
Total market for metal cutting machines in India (in Rs Cr) : 6650 - 6870
Source : DGFT & BDB Analysis
Indian Manufacturers have strong market presence in Turning Centers, VMCs, EDMs and SPMs;
however, product categories such as HMCs, Milling Machines and Grinding Machines are being imported in
high volumes
56%66%
23%32%
9%
78%
26%
63% 60%
44%34%
77%68%
91%
22%
74%
37% 40%
Turning Centers
VMCs HMCs Grinding Machines
Milling Machines
SPMs Lathes EDMs Tool Grinding machines
Domestic Import
Total Market
in
Rs Cr
52%
34%
25%
30%
8%
10%
2%9%
2% 9%5%3%
In Units In Rs Cr
Turning Centers VMCs
Grinding Machines SPMs
HMCs Lathes
EDMs Tool Grinding machines
Milling Machines
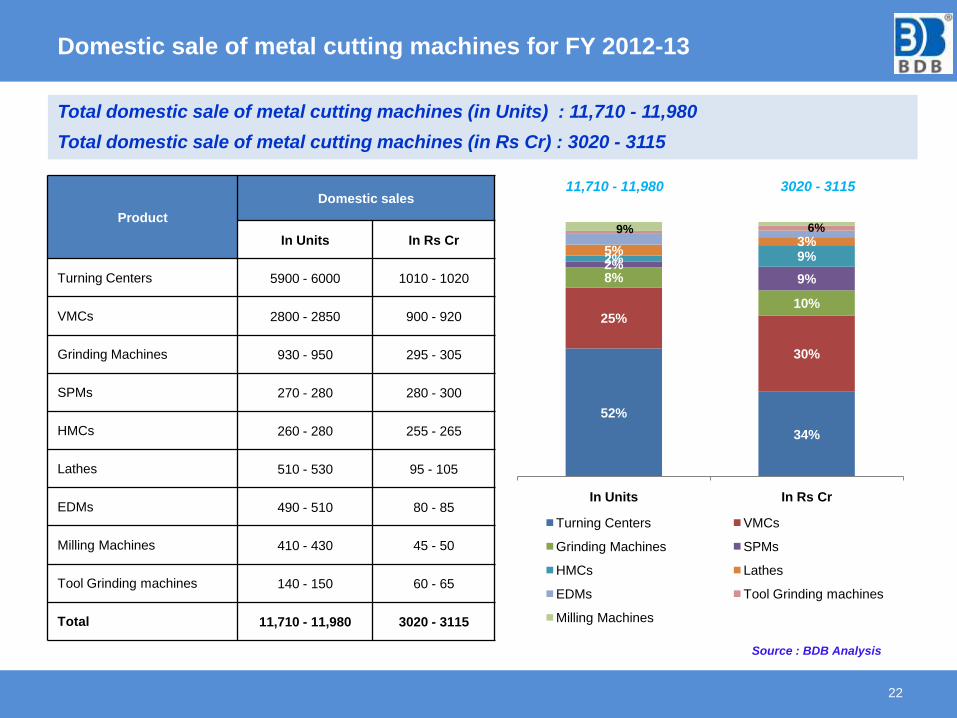
Domestic sale of metal cutting machines for FY 2012-13
22
Product
Domestic sales
In Units In Rs Cr
Turning Centers 5900 - 6000 1010 - 1020
VMCs 2800 - 2850 900 - 920
Grinding Machines 930 - 950 295 - 305
SPMs 270 - 280 280 - 300
HMCs 260 - 280 255 - 265
Lathes 510 - 530 95 - 105
EDMs 490 - 510 80 - 85
Milling Machines 410 - 430 45 - 50
Tool Grinding machines 140 - 150 60 - 65
Total 11,710 - 11,980 3020 - 3115
Total domestic sale of metal cutting machines (in Units) : 11,710 - 11,980
Total domestic sale of metal cutting machines (in Rs Cr) : 3020 - 3115
11,710 - 11,980 3020 - 3115
Source : BDB Analysis
6%9%
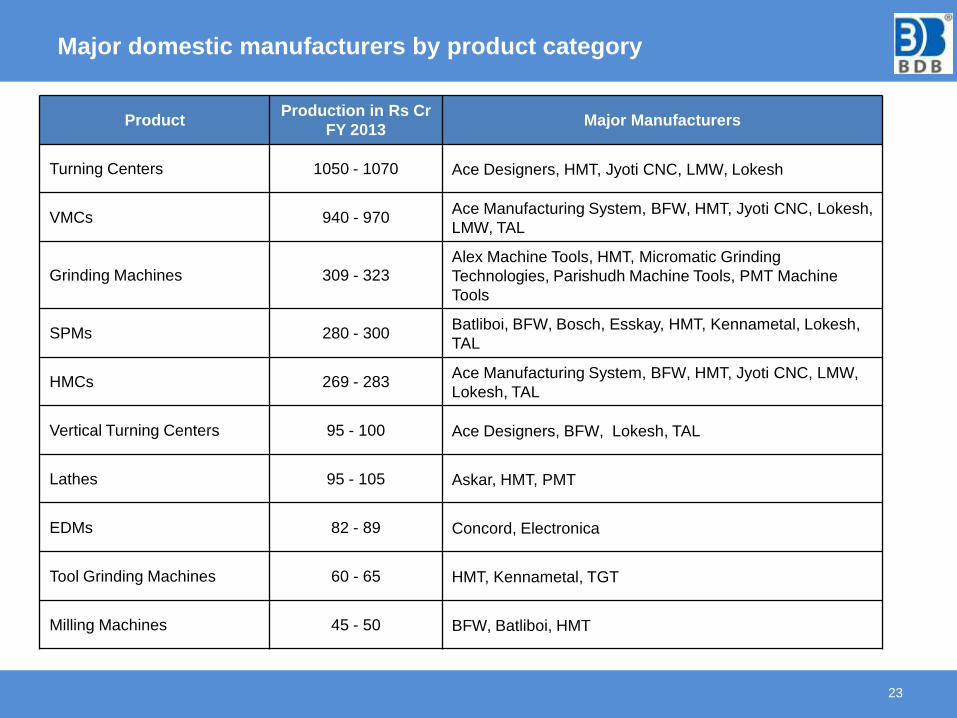
Major domestic manufacturers by product category
23
ProductProduction in Rs Cr
FY 2013Major Manufacturers
Turning Centers 1050 - 1070 Ace Designers, HMT, Jyoti CNC, LMW, Lokesh
VMCs 940 - 970Ace Manufacturing System, BFW, HMT, Jyoti CNC, Lokesh,
LMW, TAL
Grinding Machines 309 - 323Alex Machine Tools, HMT, Micromatic Grinding
Technologies, Parishudh Machine Tools, PMT Machine
Tools
SPMs 280 - 300Batliboi, BFW, Bosch, Esskay, HMT, Kennametal, Lokesh,
TAL
HMCs 269 - 283Ace Manufacturing System, BFW, HMT, Jyoti CNC, LMW,
Lokesh, TAL
Vertical Turning Centers 95 - 100 Ace Designers, BFW, Lokesh, TAL
Lathes 95 - 105 Askar, HMT, PMT
EDMs 82 - 89 Concord, Electronica
Tool Grinding Machines 60 - 65 HMT, Kennametal, TGT
Milling Machines 45 - 50 BFW, Batliboi, HMT
5%
24%17%
22%18%
17%
10%
13%29%
12%16%
7%
In Units In Rs Cr
HMCs Turning Centers
Grinding Machines VMCs
Milling Machines Lathes
SPMs EDMs
Tool Grinding machines
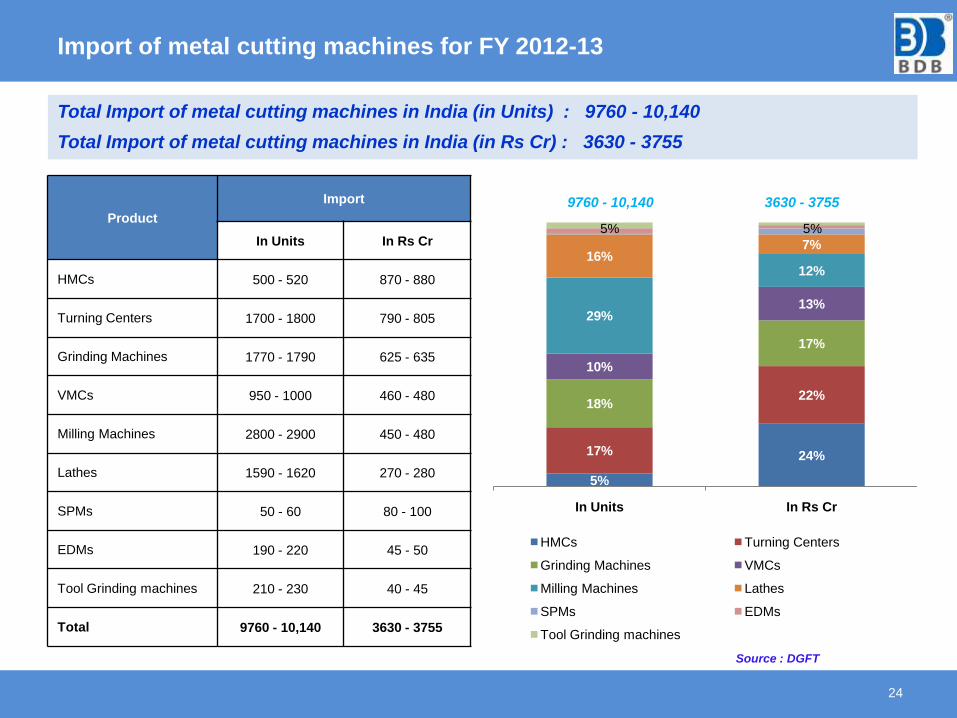
Import of metal cutting machines for FY 2012-13
24
Product
Import
In Units In Rs Cr
HMCs 500 - 520 870 - 880
Turning Centers 1700 - 1800 790 - 805
Grinding Machines 1770 - 1790 625 - 635
VMCs 950 - 1000 460 - 480
Milling Machines 2800 - 2900 450 - 480
Lathes 1590 - 1620 270 - 280
SPMs 50 - 60 80 - 100
EDMs 190 - 220 45 - 50
Tool Grinding machines 210 - 230 40 - 45
Total 9760 - 10,140 3630 - 3755
Total Import of metal cutting machines in India (in Units) : 9760 - 10,140
Total Import of metal cutting machines in India (in Rs Cr) : 3630 - 3755
5%5%
Source : DGFT
9760 - 10,140 3630 - 3755
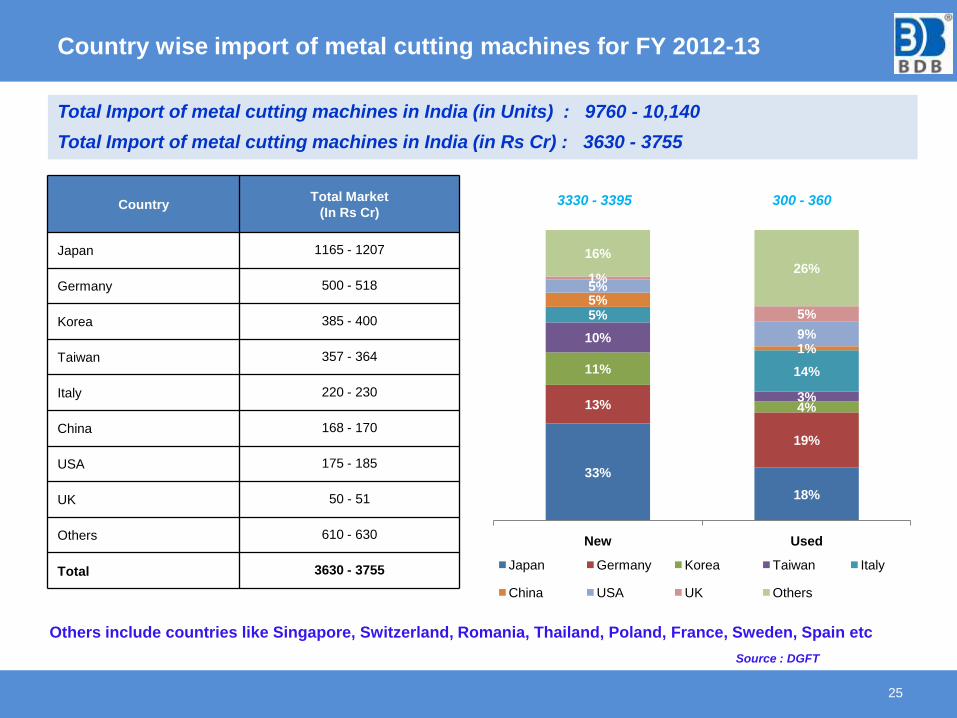
Country wise import of metal cutting machines for FY 2012-13
25
CountryTotal Market
(In Rs Cr)
Japan 1165 - 1207
Germany 500 - 518
Korea 385 - 400
Taiwan 357 - 364
Italy 220 - 230
China 168 - 170
USA 175 - 185
UK 50 - 51
Others 610 - 630
Total 3630 - 3755
3330 - 3395 300 - 360
Others include countries like Singapore, Switzerland, Romania, Thailand, Poland, France, Sweden, Spain etc
Source : DGFT
33%
18%
13%
19%
11%
4%
10%
3%
5%
14%
5%
1%
5%
9%
1%
5%
16%26%
New Used
Japan Germany Korea Taiwan Italy
China USA UK Others
Total Import of metal cutting machines in India (in Units) : 9760 - 10,140
Total Import of metal cutting machines in India (in Rs Cr) : 3630 - 3755
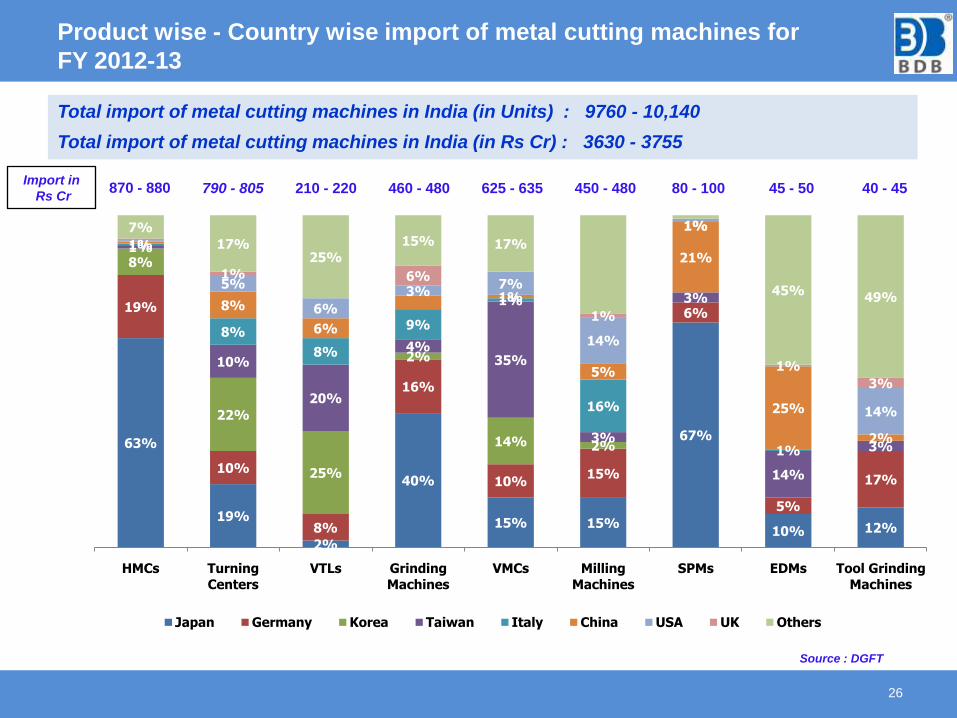
Product wise - Country wise import of metal cutting machines for
FY 2012-13
26
Source : DGFT
Total import of metal cutting machines in India (in Units) : 9760 - 10,140
Total import of metal cutting machines in India (in Rs Cr) : 3630 - 3755
870 - 880 790 - 805 210 - 220 460 - 480 625 - 635 450 - 480 80 - 100 45 - 50 40 - 45Import in
Rs Cr
63%
19%
2%
40%
15% 15%
67%
10% 12%
19%
10%
8%
16%
10%15%
6%
5%
17%
8%
22%
25%
2%
14% 2%
1%
10%
20%
4%35%
3%
3%
14%
3%
1%
8%
8%
9%
1%
16%
1%
8%
6%
1%
5%
21%
25%
2%
5%
6%
3%7%
14%
1%
1%
14%
1% 6%
1%
3%
7%
17%25%
15% 17%
1%
45%49%
HMCs Turning
Centers
VTLs Grinding
Machines
VMCs Milling
Machines
SPMs EDMs Tool Grinding
Machines
Japan Germany Korea Taiwan Italy China USA UK Others
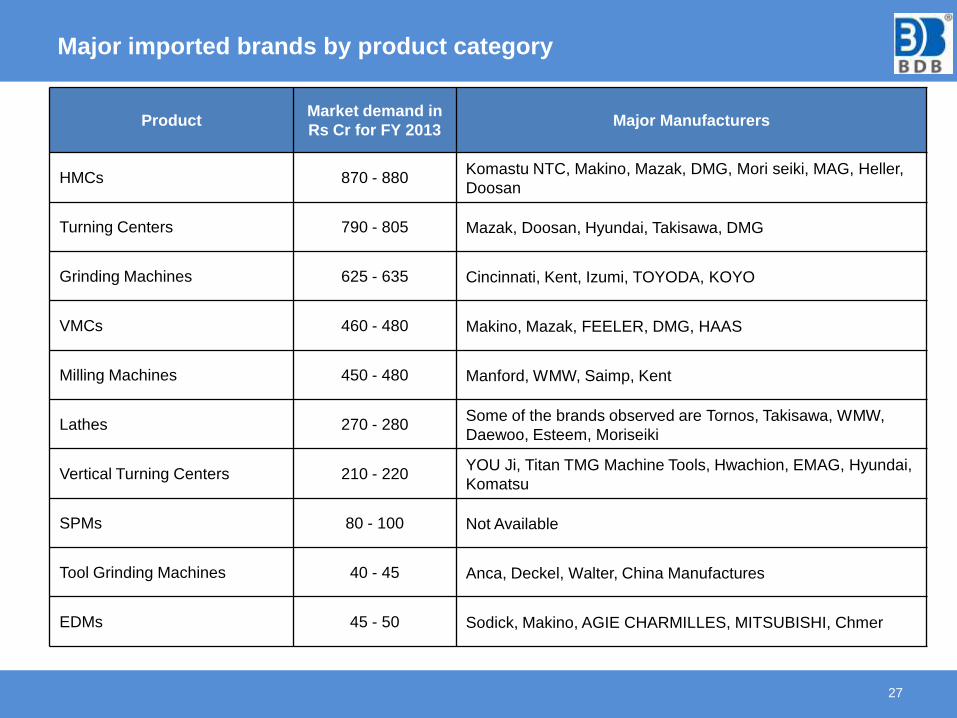
27
ProductMarket demand in
Rs Cr for FY 2013Major Manufacturers
HMCs 870 - 880Komastu NTC, Makino, Mazak, DMG, Mori seiki, MAG, Heller,
Doosan
Turning Centers 790 - 805 Mazak, Doosan, Hyundai, Takisawa, DMG
Grinding Machines 625 - 635 Cincinnati, Kent, Izumi, TOYODA, KOYO
VMCs 460 - 480 Makino, Mazak, FEELER, DMG, HAAS
Milling Machines 450 - 480 Manford, WMW, Saimp, Kent
Lathes 270 - 280Some of the brands observed are Tornos, Takisawa, WMW,
Daewoo, Esteem, Moriseiki
Vertical Turning Centers 210 - 220YOU Ji, Titan TMG Machine Tools, Hwachion, EMAG, Hyundai,
Komatsu
SPMs 80 - 100 Not Available
Tool Grinding Machines 40 - 45 Anca, Deckel, Walter, China Manufactures
EDMs 45 - 50 Sodick, Makino, AGIE CHARMILLES, MITSUBISHI, Chmer
Major imported brands by product category
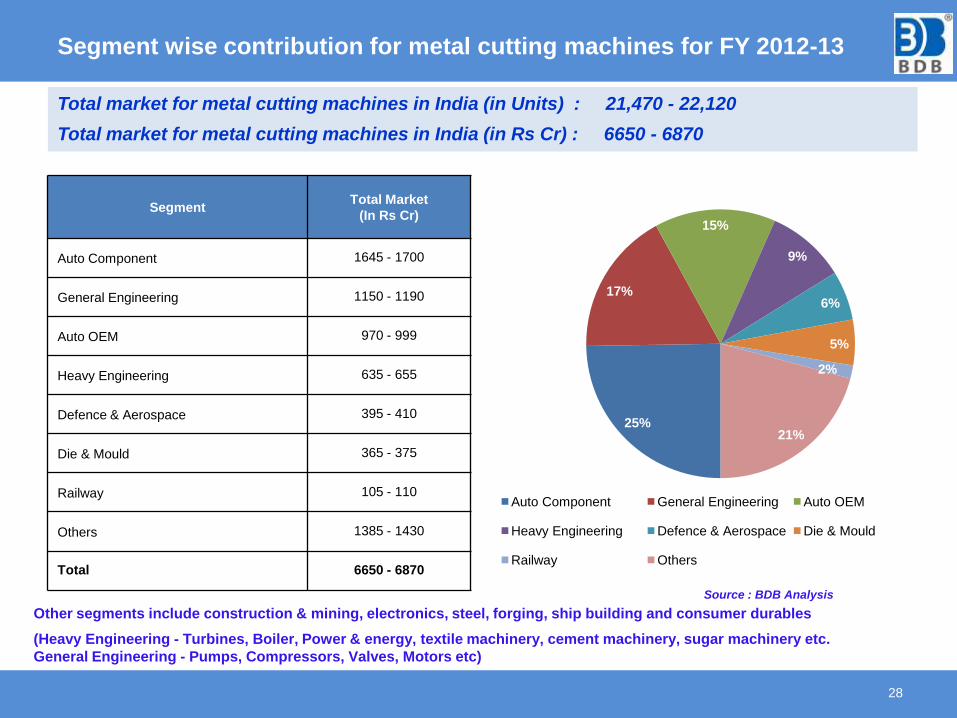
Segment wise contribution for metal cutting machines for FY 2012-13
28
SegmentTotal Market
(In Rs Cr)
Auto Component 1645 - 1700
General Engineering 1150 - 1190
Auto OEM 970 - 999
Heavy Engineering 635 - 655
Defence & Aerospace 395 - 410
Die & Mould 365 - 375
Railway 105 - 110
Others 1385 - 1430
Total 6650 - 6870
Other segments include construction & mining, electronics, steel, forging, ship building and consumer durables
(Heavy Engineering - Turbines, Boiler, Power & energy, textile machinery, cement machinery, sugar machinery etc.
General Engineering - Pumps, Compressors, Valves, Motors etc)
Source : BDB Analysis
Total market for metal cutting machines in India (in Units) : 21,470 - 22,120
Total market for metal cutting machines in India (in Rs Cr) : 6650 - 6870
25%
17%
15%
9%
6%
5%
2%
21%
Auto Component General Engineering Auto OEM
Heavy Engineering Defence & Aerospace Die & Mould
Railway Others
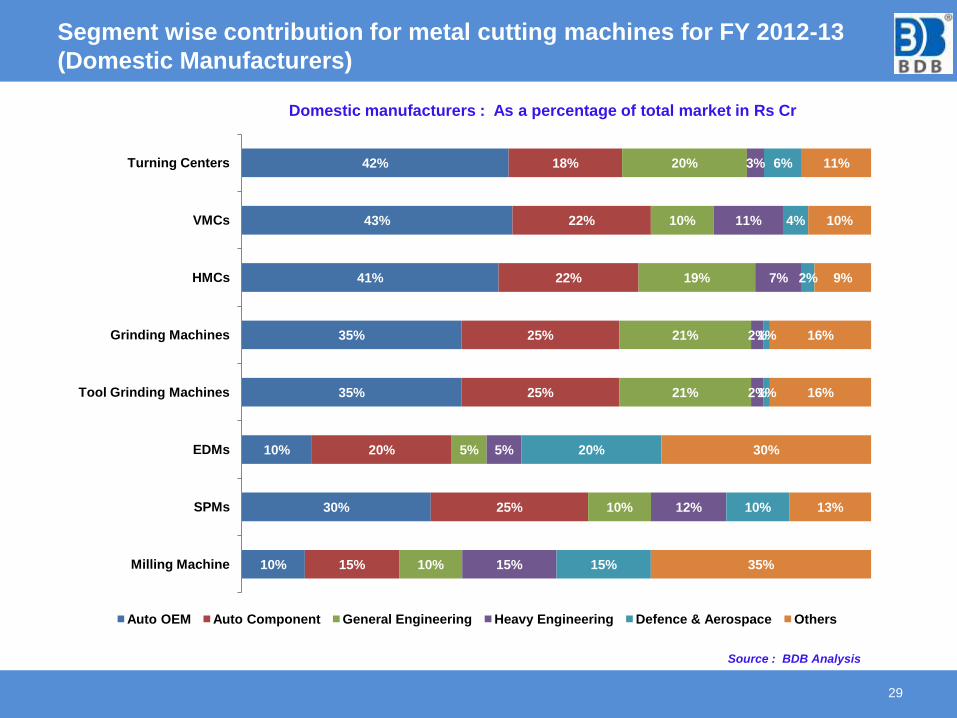
Segment wise contribution for metal cutting machines for FY 2012-13
(Domestic Manufacturers)
29
Domestic manufacturers : As a percentage of total market in Rs Cr
Source : BDB Analysis
42%
43%
41%
35%
35%
10%
30%
10%
18%
22%
22%
25%
25%
20%
25%
15%
20%
10%
19%
21%
21%
5%
10%
10%
3%
11%
7%
2%
2%
5%
12%
15%
6%
4%
2%
1%
1%
20%
10%
15%
11%
10%
9%
16%
16%
30%
13%
35%
Turning Centers
VMCs
HMCs
Grinding Machines
Tool Grinding Machines
EDMs
SPMs
Milling Machine
Auto OEM Auto Component General Engineering Heavy Engineering Defence & Aerospace Others
30
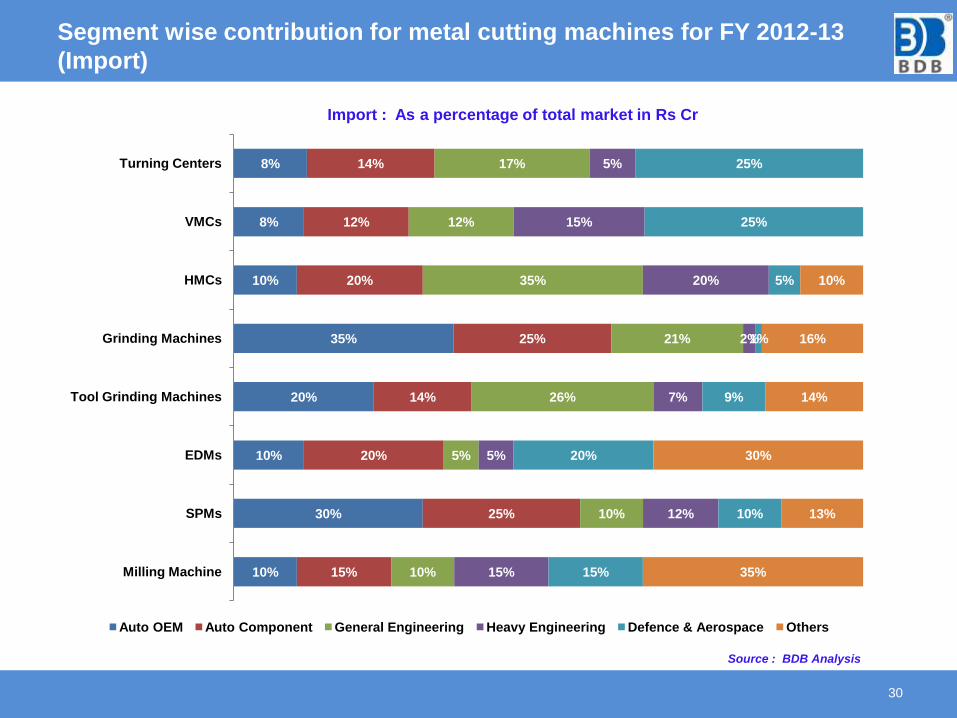
Segment wise contribution for metal cutting machines for FY 2012-13
(Import)
Import : As a percentage of total market in Rs Cr
Source : BDB Analysis
8%
8%
10%
35%
20%
10%
30%
10%
14%
12%
20%
25%
14%
20%
25%
15%
17%
12%
35%
21%
26%
5%
10%
10%
5%
15%
20%
2%
7%
5%
12%
15%
25%
25%
5%
1%
9%
20%
10%
15%
10%
16%
14%
30%
13%
35%
Turning Centers
VMCs
HMCs
Grinding Machines
Tool Grinding Machines
EDMs
SPMs
Milling Machine
Auto OEM Auto Component General Engineering Heavy Engineering Defence & Aerospace Others
38%
31%
28%
13%
-1%
-41%
42%
30%
-1%
-0.455
-0.45
-0.445
-0.44
-0.435
-0.43
-0.425
-0.42
-0.415
-0.41
-0.405
-0.4
-0.395
-0.39
-0.385
-0.38
-0.375
-0.37
-0.365
-0.36
-0.355
-0.35
-0.345
-0.34
-0.335
-0.33
-0.325
-0.32
-0.315
-0.31
-0.305
-0.3
-0.295
-0.29
-0.285
-0.28
-0.275
-0.27
-0.265
-0.26
-0.255
-0.25
-0.245
-0.24
-0.235
-0.23
-0.225
-0.22
-0.215
-0.21
-0.205
-0.2
-0.195
-0.19
-0.185
-0.18
-0.175
-0.17
-0.165
-0.16
-0.155
-0.15
-0.145
-0.14
-0.135
-0.13
-0.125
-0.12
-0.115
-0.11
-0.105
-0.1
-0.095
-0.09
-0.085
-0.08
-0.075
-0.07
-0.065
-0.06
-0.055
-0.05
-0.045
-0.04
-0.035
-0.03
-0.025
-0.02
-0.015
-0.01
-0.005
2E-17
0.005
0.01
0.015
0.02
0.025
0.03
0.035
0.04
0.045
0.05
0.055
0.06
0.065
0.07
0.075
0.08
0.085
0.09
0.095
0.1
0.105
0.11
0.115
0.12
0.125
0.13
0.135
0.14
0.145
0.15
0.155
0.16
0.165
0.17
0.175
0.18
0.185
0.19
0.195
0.2
0.205
0.21
0.215
0.22
0.225
0.23
0.235
0.24
0.245
0.25
0.255
0.26
0.265
0.27
0.275
0.28
0.285
0.29
0.295
0.3
0.305
0.31
0.315
0.32
0.325
0.33
0.335
0.34
0.345
0.35
0.355
0.36
0.365
0.37
0.375
0.38
0.385
0.39
0.395
0.4
0.405
0.41
0.415
0.42
0.425
0.43
0.435
0.44
0.445
0.45
0.455
0.46
0
1000
2000
3000
4000
5000
6000
7000
8000
FY 03-04 FY 04-05 FY 05-06 FY 06-07 FY 07-08 FY 08-09 FY 09-10 FY 10-11 FY 11-12 FY 12-13
INR
Cr
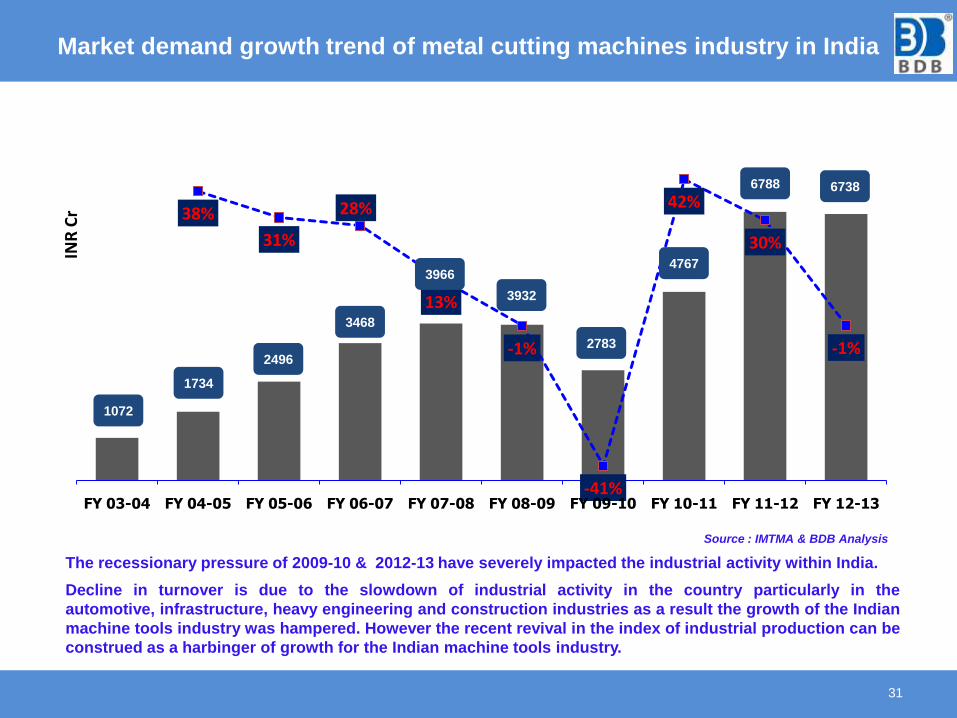
Market demand growth trend of metal cutting machines industry in India
31
1072
1734
2496
3468
3966
3932
2783
6788
4767
6738
The recessionary pressure of 2009-10 & 2012-13 have severely impacted the industrial activity within India.
Decline in turnover is due to the slowdown of industrial activity in the country particularly in the
automotive, infrastructure, heavy engineering and construction industries as a result the growth of the Indian
machine tools industry was hampered. However the recent revival in the index of industrial production can be
construed as a harbinger of growth for the Indian machine tools industry.
Source : IMTMA & BDB Analysis
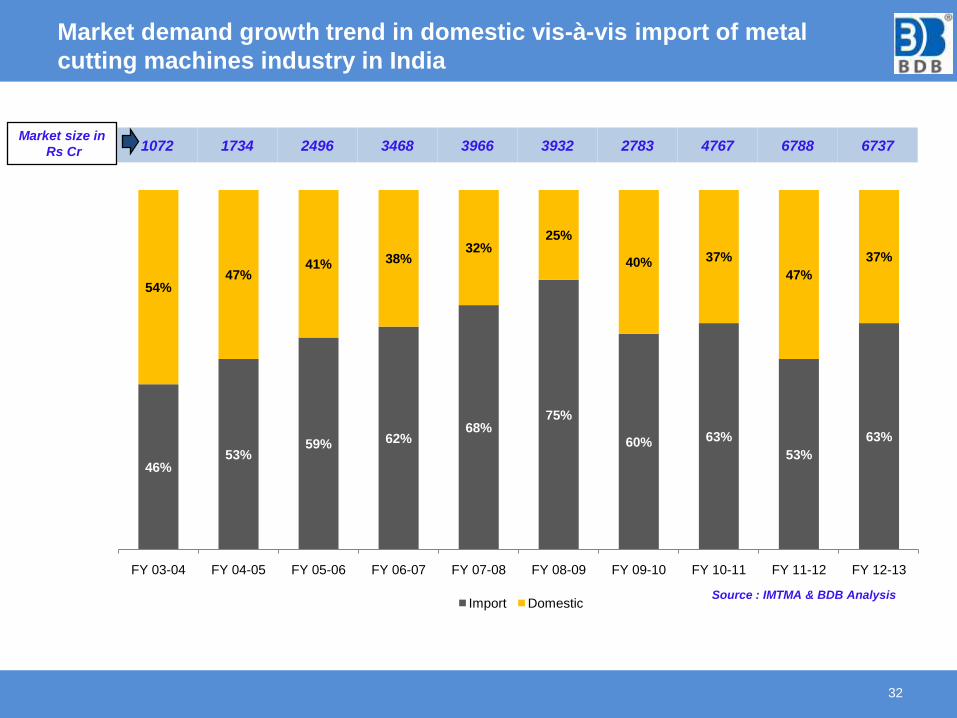
Market demand growth trend in domestic vis-à-vis import of metal
cutting machines industry in India
32
1072 1734 2496 3468 3966 3932 2783 4767 6788 6737Market size in
Rs Cr
Source : IMTMA & BDB Analysis
46%53%
59% 62%68%
75%
60% 63%
53%
63%
54%47%
41% 38%32%
25%
40% 37%
47%
37%
FY 03-04 FY 04-05 FY 05-06 FY 06-07 FY 07-08 FY 08-09 FY 09-10 FY 10-11 FY 11-12 FY 12-13
Import Domestic
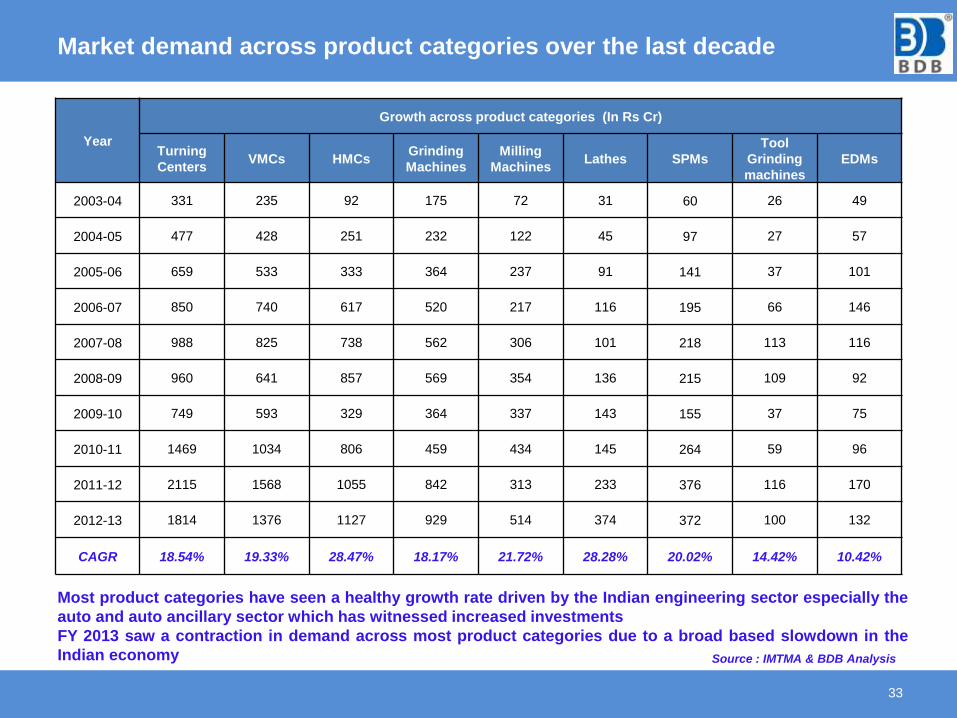
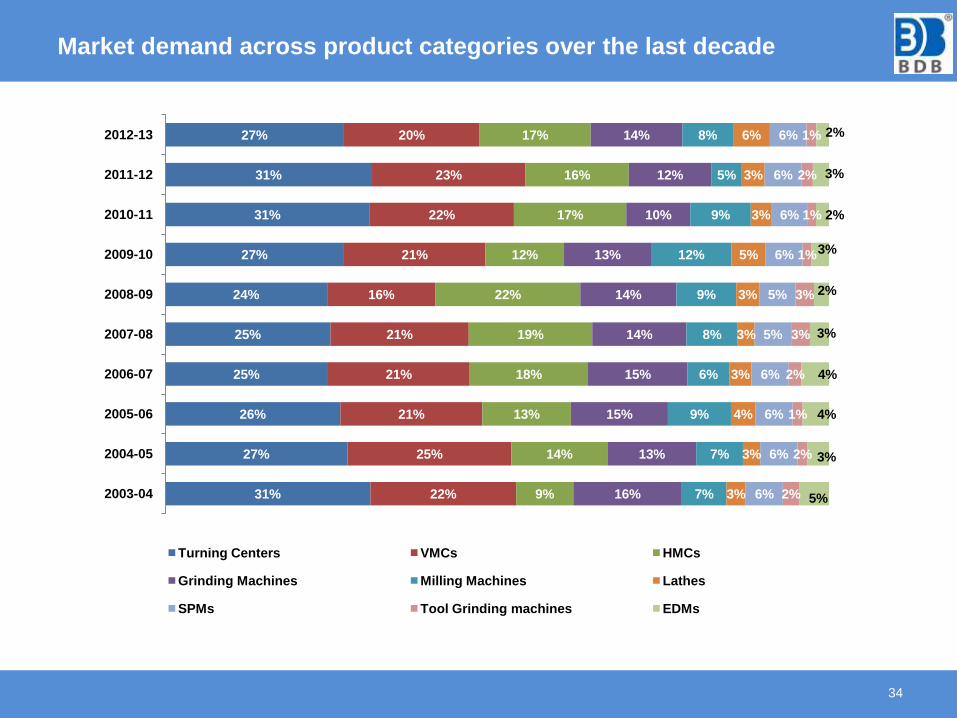
Market demand across product categories over the last decade
33
Most product categories have seen a healthy growth rate driven by the Indian engineering sector especially the
auto and auto ancillary sector which has witnessed increased investments
FY 2013 saw a contraction in demand across most product categories due to a broad based slowdown in the
Indian economy
Year
Growth across product categories (In Rs Cr)
Turning
CentersVMCs HMCs
Grinding
Machines
Milling
Machines Lathes SPMs
Tool
Grinding
machines
EDMs
2003-04 331 235 92 175 72 31 60 26 49
2004-05 477 428 251 232 122 45 97 27 57
2005-06 659 533 333 364 237 91 141 37 101
2006-07 850 740 617 520 217 116 195 66 146
2007-08 988 825 738 562 306 101 218 113 116
2008-09 960 641 857 569 354 136 215 109 92
2009-10 749 593 329 364 337 143 155 37 75
2010-11 1469 1034 806 459 434 145 264 59 96
2011-12 2115 1568 1055 842 313 233 376 116 170
2012-13 1814 1376 1127 929 514 374 372 100 132
CAGR 18.54% 19.33% 28.47% 18.17% 21.72% 28.28% 20.02% 14.42% 10.42%
Source : IMTMA & BDB Analysis
34
31%
27%
26%
25%
25%
24%
27%
31%
31%
27%
22%
25%
21%
21%
21%
16%
21%
22%
23%
20%
9%
14%
13%
18%
19%
22%
12%
17%
16%
17%
16%
13%
15%
15%
14%
14%
13%
10%
12%
14%
7%
7%
9%
6%
8%
9%
12%
9%
5%
8%
3%
3%
4%
3%
3%
3%
5%
3%
3%
6%
6%
6%
6%
6%
5%
5%
6%
6%
6%
6%
2%
2%
1%
2%
3%
3%
1%
1%
2%
1%
5%
3%
4%
4%
3%
2%
3%
2%
3%
2%
2003-04
2004-05
2005-06
2006-07
2007-08
2008-09
2009-10
2010-11
2011-12
2012-13
Turning Centers VMCs HMCs
Grinding Machines Milling Machines Lathes
SPMs Tool Grinding machines EDMs
Market demand across product categories over the last decade
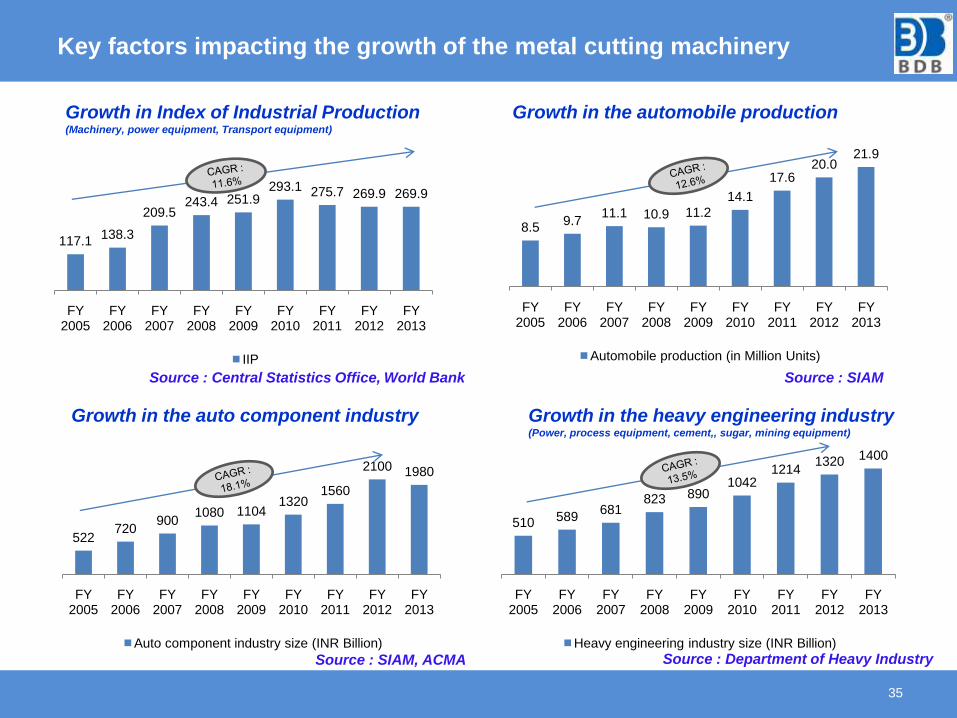
117.1138.3
209.5243.4 251.9
293.1 275.7 269.9 269.9
FY 2005
FY 2006
FY 2007
FY 2008
FY 2009
FY 2010
FY 2011
FY 2012
FY 2013
IIP
Key factors impacting the growth of the metal cutting machinery
35
8.59.7
11.1 10.9 11.2
14.1
17.620.0
21.9
FY 2005
FY 2006
FY 2007
FY 2008
FY 2009
FY 2010
FY 2011
FY 2012
FY 2013
Automobile production (in Million Units)
Growth in Index of Industrial Production (Machinery, power equipment, Transport equipment)
Growth in the automobile production
522720
9001080 1104
13201560
2100 1980
FY 2005
FY 2006
FY 2007
FY 2008
FY 2009
FY 2010
FY 2011
FY 2012
FY 2013
Auto component industry size (INR Billion)
Growth in the auto component industry
510 589681
823 8901042
12141320 1400
FY 2005
FY 2006
FY 2007
FY 2008
FY 2009
FY 2010
FY 2011
FY 2012
FY 2013
Heavy engineering industry size (INR Billion)
Growth in the heavy engineering industry(Power, process equipment, cement,, sugar, mining equipment)
Source : SIAM
Source : SIAM, ACMA Source : Department of Heavy Industry
Source : Central Statistics Office, World Bank
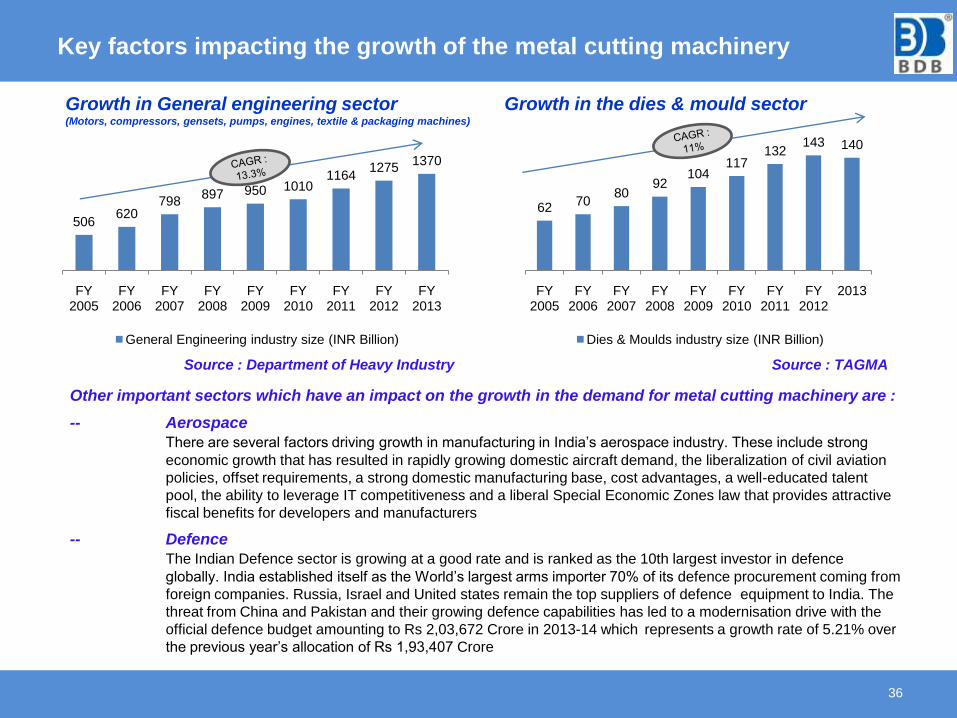
6270
8092
104117
132143 140
FY 2005
FY 2006
FY 2007
FY 2008
FY 2009
FY 2010
FY 2011
FY 2012
2013
Dies & Moulds industry size (INR Billion)
Key factors impacting the growth of the metal cutting machinery
36
Growth in General engineering sector (Motors, compressors, gensets, pumps, engines, textile & packaging machines)
Growth in the dies & mould sector
506620
798897 950 1010
11641275
1370
FY 2005
FY 2006
FY 2007
FY 2008
FY 2009
FY 2010
FY 2011
FY 2012
FY 2013
General Engineering industry size (INR Billion)
Other important sectors which have an impact on the growth in the demand for metal cutting machinery are :
-- Aerospace
There are several factors driving growth in manufacturing in India’s aerospace industry. These include strong
economic growth that has resulted in rapidly growing domestic aircraft demand, the liberalization of civil aviation
policies, offset requirements, a strong domestic manufacturing base, cost advantages, a well-educated talent
pool, the ability to leverage IT competitiveness and a liberal Special Economic Zones law that provides attractive
fiscal benefits for developers and manufacturers
-- Defence
The Indian Defence sector is growing at a good rate and is ranked as the 10th largest investor in defence
globally. India established itself as the World’s largest arms importer 70% of its defence procurement coming from
foreign companies. Russia, Israel and United states remain the top suppliers of defence equipment to India. The
threat from China and Pakistan and their growing defence capabilities has led to a modernisation drive with the
official defence budget amounting to Rs 2,03,672 Crore in 2013-14 which represents a growth rate of 5.21% over
the previous year’s allocation of Rs 1,93,407 Crore
Source : TAGMASource : Department of Heavy Industry
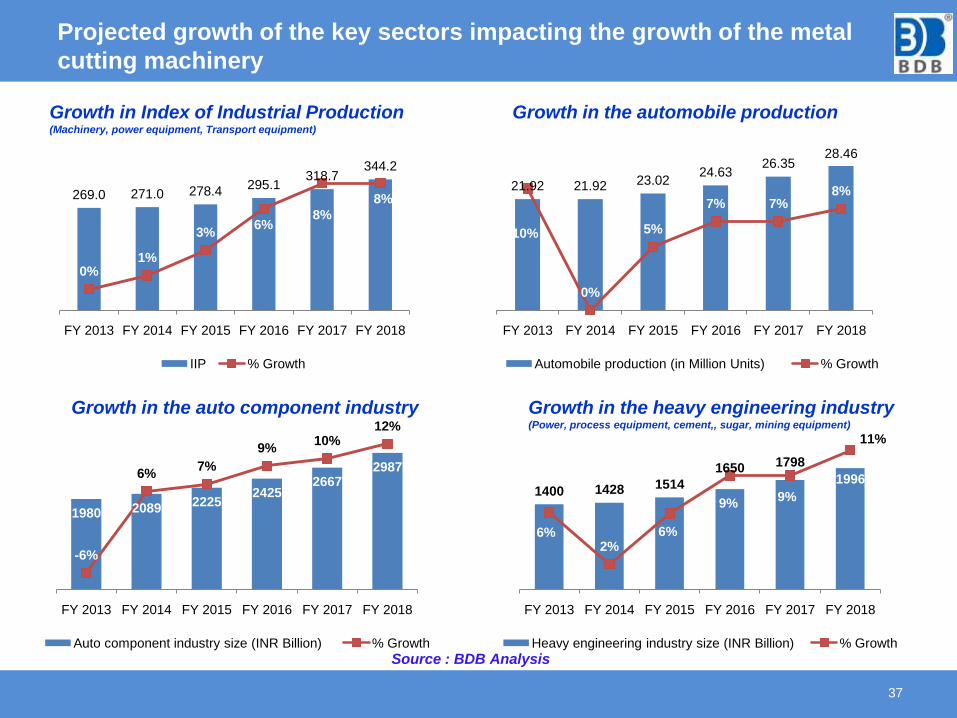
Projected growth of the key sectors impacting the growth of the metal
cutting machinery
37
Growth in Index of Industrial Production (Machinery, power equipment, Transport equipment)
Growth in the automobile production
Growth in the auto component industry Growth in the heavy engineering industry(Power, process equipment, cement,, sugar, mining equipment)
269.0 271.0 278.4295.1
318.7344.2
0%1%
3%6%
8%
8%
-2%
0%
2%
4%
6%
8%
10%
0.0
50.0
100.0
150.0
200.0
250.0
300.0
350.0
400.0
FY 2013 FY 2014 FY 2015 FY 2016 FY 2017 FY 2018
IIP % Growth
21.92 21.92 23.0224.63
26.3528.46
10%
0%
5%
7% 7%8%
0%
2%
4%
6%
8%
10%
12%
0
5
10
15
20
25
30
FY 2013 FY 2014 FY 2015 FY 2016 FY 2017 FY 2018
Automobile production (in Million Units) % Growth
1980 2089 22252425
26672987
-6%
6%7%
9%10%
12%
-8%-6%-4%-2%0%2%4%6%8%10%12%14%
0
500
1000
1500
2000
2500
3000
3500
FY 2013 FY 2014 FY 2015 FY 2016 FY 2017 FY 2018
Auto component industry size (INR Billion) % Growth
1400 1428 1514
1650 1798
1996
6%2%
6%
9%9%
11%
0%
2%
4%
6%
8%
10%
12%
0
500
1000
1500
2000
2500
FY 2013 FY 2014 FY 2015 FY 2016 FY 2017 FY 2018
Heavy engineering industry size (INR Billion) % Growth
Source : BDB Analysis
Projected growth of the key sectors impacting the growth of the metal
cutting machinery
38
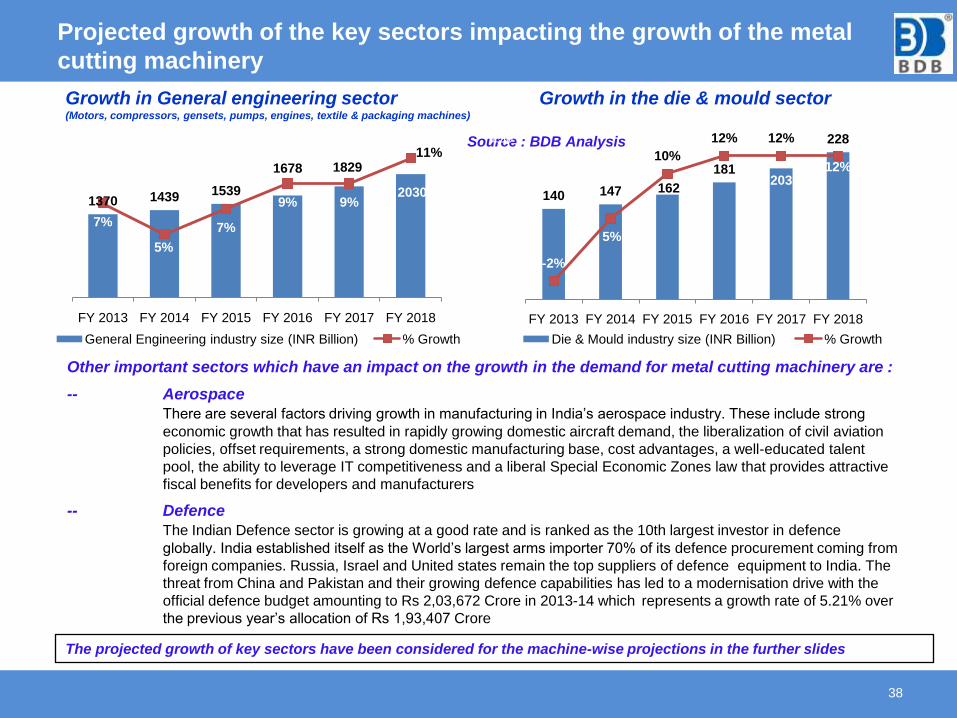
Growth in General engineering sector (Motors, compressors, gensets, pumps, engines, textile & packaging machines)
Growth in the die & mould sector
1370 1439 1539
1678 1829
2030
7%
5%
7%
9% 9%
11%
0%
2%
4%
6%
8%
10%
12%
0
500
1000
1500
2000
2500
FY 2013 FY 2014 FY 2015 FY 2016 FY 2017 FY 2018
General Engineering industry size (INR Billion) % Growth
Source : BDB Analysis
140 147 162
181203
228
-2%
5%
10%
12% 12%
12%
-4%
-2%
0%
2%
4%
6%
8%
10%
12%
14%
0
50
100
150
200
250
FY 2013 FY 2014 FY 2015 FY 2016 FY 2017 FY 2018
Die & Mould industry size (INR Billion) % Growth
Other important sectors which have an impact on the growth in the demand for metal cutting machinery are :
-- Aerospace
There are several factors driving growth in manufacturing in India’s aerospace industry. These include strong
economic growth that has resulted in rapidly growing domestic aircraft demand, the liberalization of civil aviation
policies, offset requirements, a strong domestic manufacturing base, cost advantages, a well-educated talent
pool, the ability to leverage IT competitiveness and a liberal Special Economic Zones law that provides attractive
fiscal benefits for developers and manufacturers
-- Defence
The Indian Defence sector is growing at a good rate and is ranked as the 10th largest investor in defence
globally. India established itself as the World’s largest arms importer 70% of its defence procurement coming from
foreign companies. Russia, Israel and United states remain the top suppliers of defence equipment to India. The
threat from China and Pakistan and their growing defence capabilities has led to a modernisation drive with the
official defence budget amounting to Rs 2,03,672 Crore in 2013-14 which represents a growth rate of 5.21% over
the previous year’s allocation of Rs 1,93,407 Crore
The projected growth of key sectors have been considered for the machine-wise projections in the further slides
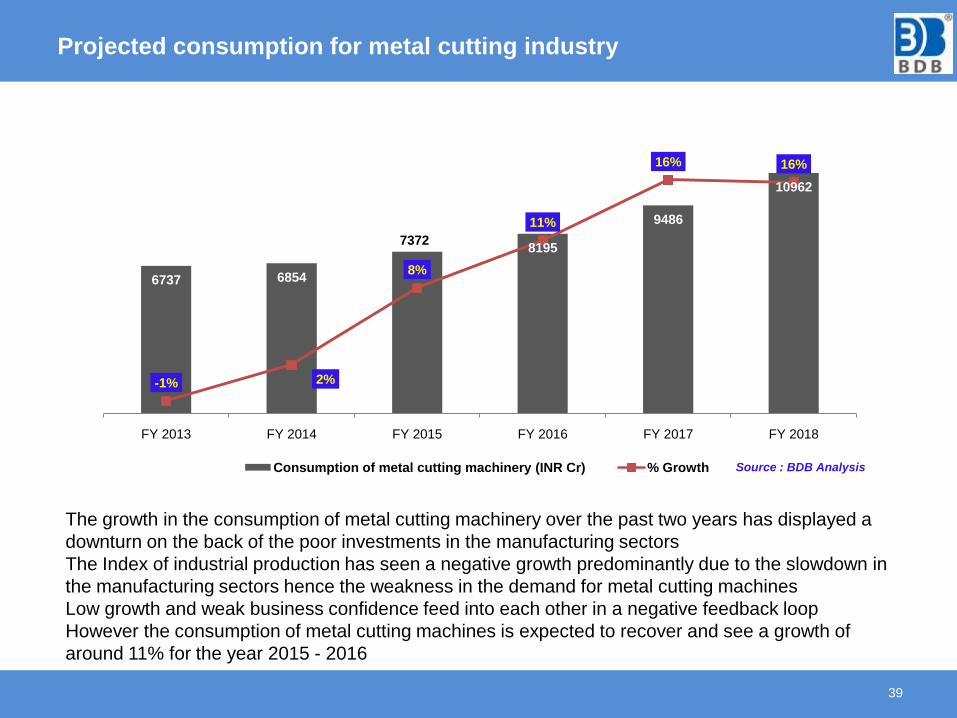
Projected consumption for metal cutting industry
39
6737 6854
73728195
9486
10962
-1% 2%
8%
11%
16% 16%
-2%
0%
2%
4%
6%
8%
10%
12%
14%
16%
18%
0
2000
4000
6000
8000
10000
12000
FY 2013 FY 2014 FY 2015 FY 2016 FY 2017 FY 2018
Consumption of metal cutting machinery (INR Cr) % Growth Source : BDB Analysis
The growth in the consumption of metal cutting machinery over the past two years has displayed a
downturn on the back of the poor investments in the manufacturing sectors
The Index of industrial production has seen a negative growth predominantly due to the slowdown in
the manufacturing sectors hence the weakness in the demand for metal cutting machines
Low growth and weak business confidence feed into each other in a negative feedback loop
However the consumption of metal cutting machines is expected to recover and see a growth of
around 11% for the year 2015 - 2016
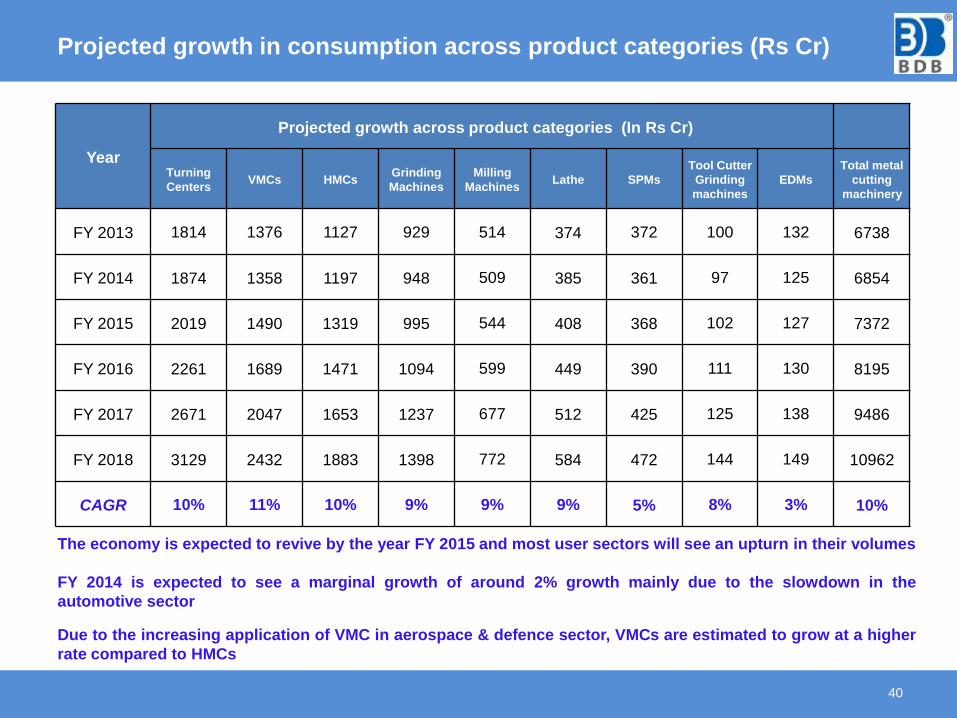
Projected growth in consumption across product categories (Rs Cr)
40
The economy is expected to revive by the year FY 2015 and most user sectors will see an upturn in their volumes
FY 2014 is expected to see a marginal growth of around 2% growth mainly due to the slowdown in the
automotive sector
Due to the increasing application of VMC in aerospace & defence sector, VMCs are estimated to grow at a higher
rate compared to HMCs
Year
Projected growth across product categories (In Rs Cr)
Turning
CentersVMCs HMCs
Grinding
Machines
Milling
Machines Lathe SPMs
Tool Cutter
Grinding
machines
EDMs
Total metal
cutting
machinery
FY 2013 1814 1376 1127 929 514 374 372 100 132 6738
FY 2014 1874 1358 1197 948 509 385 361 97 125 6854
FY 2015 2019 1490 1319 995 544 408 368 102 127 7372
FY 2016 2261 1689 1471 1094 599 449 390 111 130 8195
FY 2017 2671 2047 1653 1237 677 512 425 125 138 9486
FY 2018 3129 2432 1883 1398 772 584 472 144 149 10962
CAGR 10% 11% 10% 9% 9% 9% 5% 8% 3% 10%
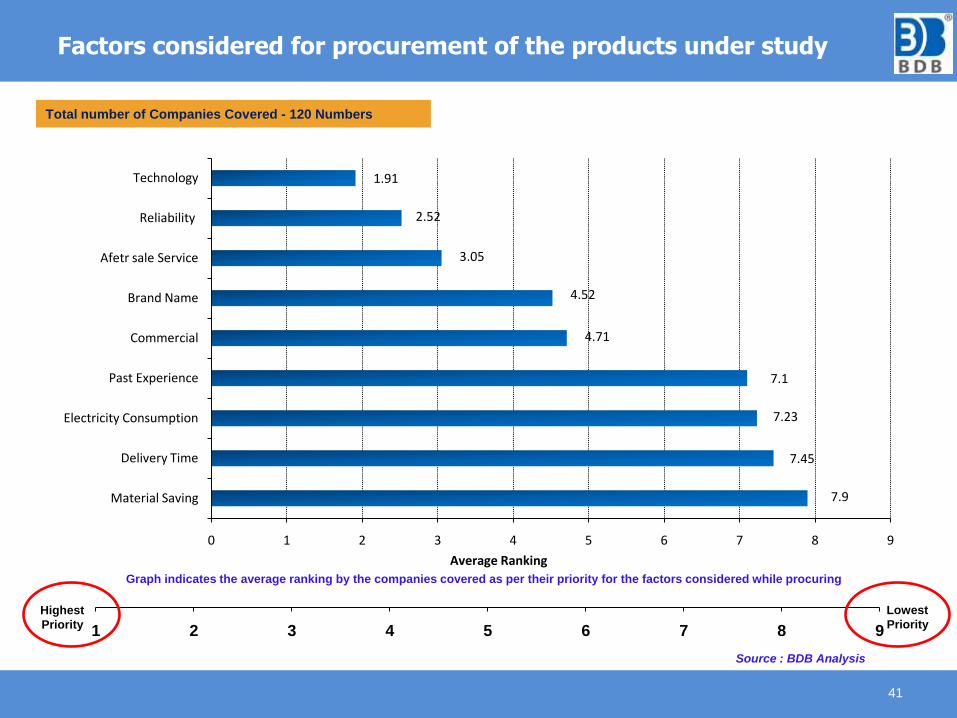
Factors considered for procurement of the products under study
41
Total number of Companies Covered - 120 Numbers
1 2 3 4 5 6 7 8 9
Graph indicates the average ranking by the companies covered as per their priority for the factors considered while procuring
Highest
Priority
Lowest
Priority
Source : BDB Analysis
7.9
7.45
7.23
7.1
4.71
4.52
3.05
2.52
1.91
0 1 2 3 4 5 6 7 8 9
Material Saving
Delivery Time
Electricity Consumption
Past Experience
Commercial
Brand Name
Afetr sale Service
Reliability
Technology
Average Ranking
3. CONCLUSIONS
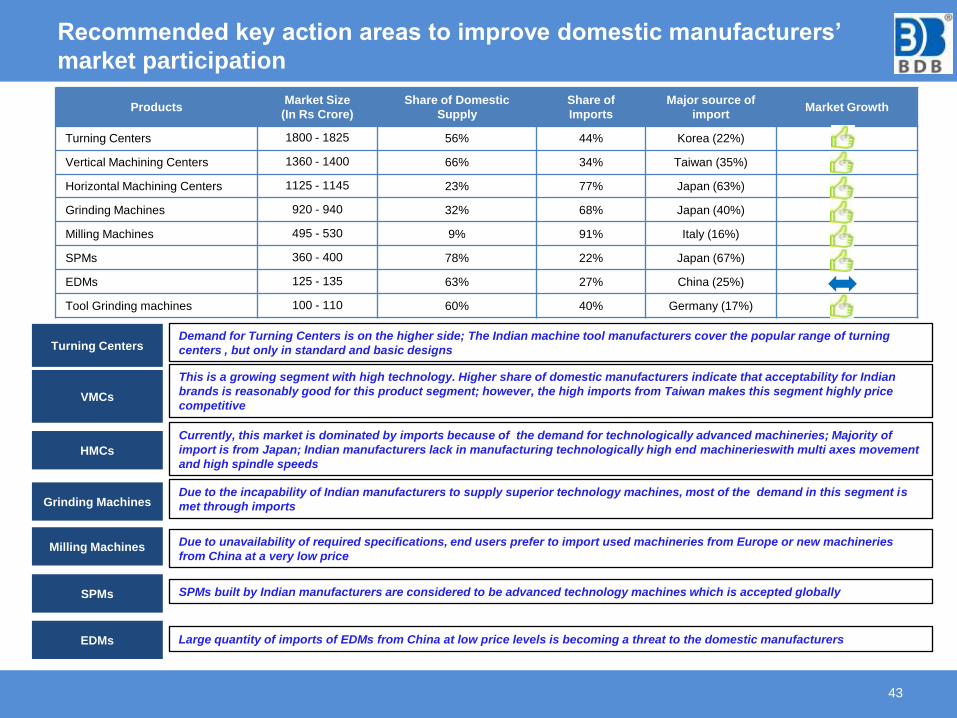
Recommended key action areas to improve domestic manufacturers’
market participation
43
ProductsMarket Size
(In Rs Crore)
Share of Domestic
Supply
Share of
Imports
Major source of
importMarket Growth
Turning Centers 1800 - 1825 56% 44% Korea (22%)
Vertical Machining Centers 1360 - 1400 66% 34% Taiwan (35%)
Horizontal Machining Centers 1125 - 1145 23% 77% Japan (63%)
Grinding Machines 920 - 940 32% 68% Japan (40%)
Milling Machines 495 - 530 9% 91% Italy (16%)
SPMs 360 - 400 78% 22% Japan (67%)
EDMs 125 - 135 63% 27% China (25%)
Tool Grinding machines 100 - 110 60% 40% Germany (17%)
Turning CentersDemand for Turning Centers is on the higher side; The Indian machine tool manufacturers cover the popular range of turning
centers , but only in standard and basic designs
VMCs
This is a growing segment with high technology. Higher share of domestic manufacturers indicate that acceptability for Indian
brands is reasonably good for this product segment; however, the high imports from Taiwan makes this segment highly price
competitive
HMCs
Currently, this market is dominated by imports because of the demand for technologically advanced machineries; Majority of
import is from Japan; Indian manufacturers lack in manufacturing technologically high end machinerieswith multi axes movement
and high spindle speeds
Grinding MachinesDue to the incapability of Indian manufacturers to supply superior technology machines, most of the demand in this segment is
met through imports
Milling Machines Due to unavailability of required specifications, end users prefer to import used machineries from Europe or new machineries
from China at a very low price
SPMs SPMs built by Indian manufacturers are considered to be advanced technology machines which is accepted globally
EDMs Large quantity of imports of EDMs from China at low price levels is becoming a threat to the domestic manufacturers
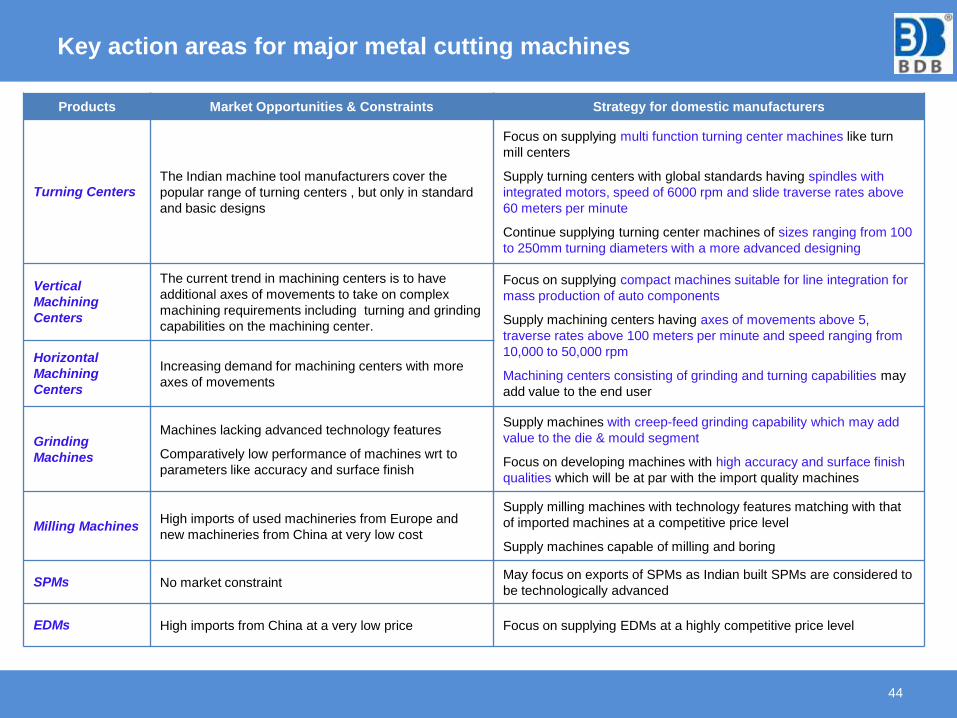
Key action areas for major metal cutting machines
44
Products Market Opportunities & Constraints Strategy for domestic manufacturers
Turning Centers The Indian machine tool manufacturers cover the
popular range of turning centers , but only in standard
and basic designs
Focus on supplying multi function turning center machines like turn
mill centers
Supply turning centers with global standards having spindles with
integrated motors, speed of 6000 rpm and slide traverse rates above
60 meters per minute
Continue supplying turning center machines of sizes ranging from 100
to 250mm turning diameters with a more advanced designing
Vertical
Machining
Centers
The current trend in machining centers is to have
additional axes of movements to take on complex
machining requirements including turning and grinding
capabilities on the machining center.
Focus on supplying compact machines suitable for line integration for
mass production of auto components
Supply machining centers having axes of movements above 5,
traverse rates above 100 meters per minute and speed ranging from
10,000 to 50,000 rpm
Machining centers consisting of grinding and turning capabilities may
add value to the end user
Horizontal
Machining
Centers
Increasing demand for machining centers with more
axes of movements
Grinding
Machines
Machines lacking advanced technology features
Comparatively low performance of machines wrt to
parameters like accuracy and surface finish
Supply machines with creep-feed grinding capability which may add
value to the die & mould segment
Focus on developing machines with high accuracy and surface finish
qualities which will be at par with the import quality machines
Milling Machines High imports of used machineries from Europe and
new machineries from China at very low cost
Supply milling machines with technology features matching with that
of imported machines at a competitive price level
Supply machines capable of milling and boring
SPMs No market constraintMay focus on exports of SPMs as Indian built SPMs are considered to
be technologically advanced
EDMs High imports from China at a very low price Focus on supplying EDMs at a highly competitive price level
Technology gaps between domestic manufacturers and imports
45
Parts, peripherals and assemblies procured or manufactured in India::
Domestic manufacturers have the capability to build the machine body of similar quality as that of imported
machines; however, end users perceive that the difference is in the quality of parts, peripherals and
assemblies used within the machines as compared to machines from Europe and Japan.
Accuracy in positioning:
It is opined that domestically manufactured machines lack in precision and accuracy in positioning
compared to the import quality machines
Lack of installed base for new specification requirements:
End user segments opined that they are not willing to procure domestically manufactured machines in
case of upgraded specifications requirements though the Indian manufacturers have the capability to
supply the same; this is mainly due to lack of installed base or unproven technology due to which end
users feel that these machines would not be able to deliver the expected quality; hence they depend on
imports
Other areas where Indian manufacturers lack behind global manufacturers include:
Multi-functioning machines
Non reliability to achieve uptime above 98%
Lack in parameters like safety and eco-friendliness
Low performace rating compared to imported machines wrt parameters like tool change
time, chip to chip time, pallet change time, footprint, acceleration etc.
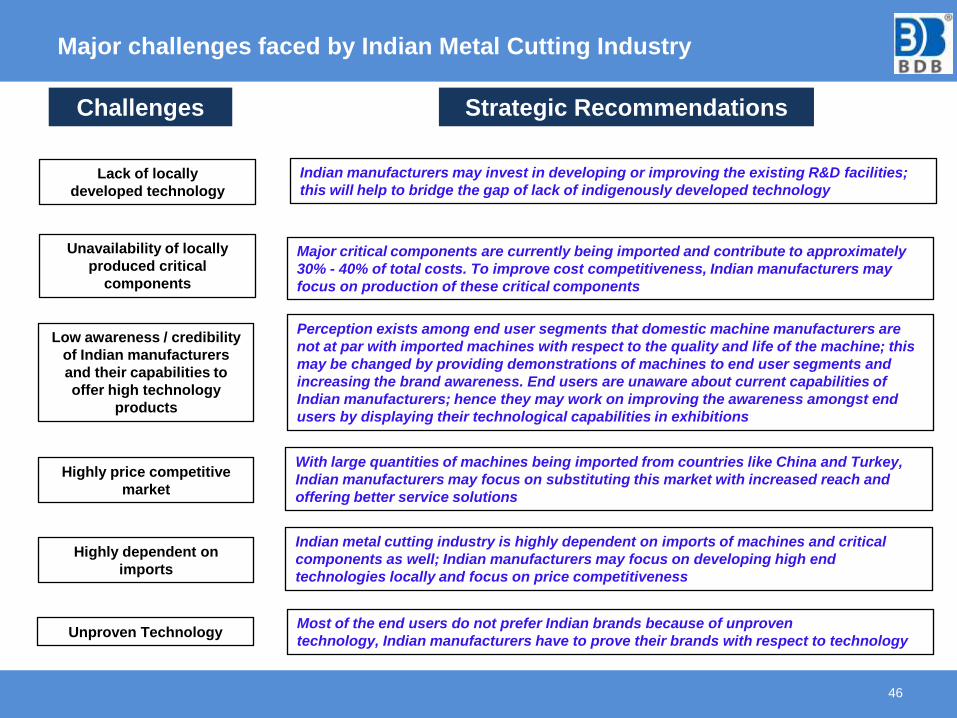
Major challenges faced by Indian Metal Cutting Industry
46
Lack of locally
developed technology
Indian manufacturers may invest in developing or improving the existing R&D facilities;
this will help to bridge the gap of lack of indigenously developed technology
Unavailability of locally
produced critical
components
Major critical components are currently being imported and contribute to approximately
30% - 40% of total costs. To improve cost competitiveness, Indian manufacturers may
focus on production of these critical components
Highly price competitive
market
With large quantities of machines being imported from countries like China and Turkey,
Indian manufacturers may focus on substituting this market with increased reach and
offering better service solutions
Highly dependent on
imports
Indian metal cutting industry is highly dependent on imports of machines and critical
components as well; Indian manufacturers may focus on developing high end
technologies locally and focus on price competitiveness
Low awareness / credibility
of Indian manufacturers
and their capabilities to
offer high technology
products
Perception exists among end user segments that domestic machine manufacturers are
not at par with imported machines with respect to the quality and life of the machine; this
may be changed by providing demonstrations of machines to end user segments and
increasing the brand awareness. End users are unaware about current capabilities of
Indian manufacturers; hence they may work on improving the awareness amongst end
users by displaying their technological capabilities in exhibitions
Challenges Strategic Recommendations
Most of the end users do not prefer Indian brands because of unproven
technology, Indian manufacturers have to prove their brands with respect to technologyUnproven Technology
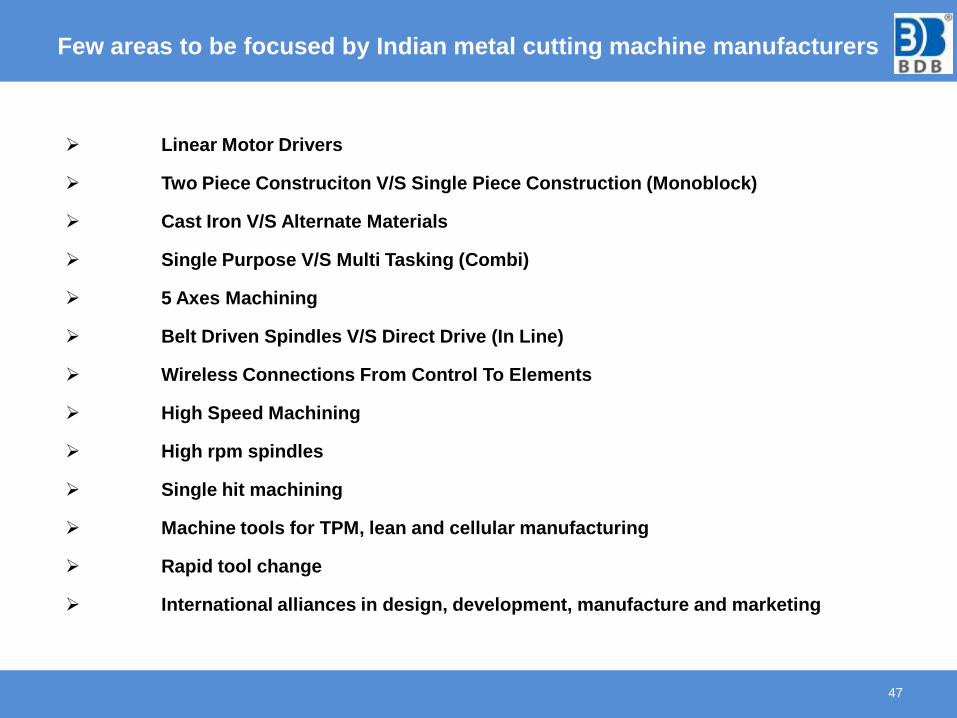
Few areas to be focused by Indian metal cutting machine manufacturers
47
Linear Motor Drivers
Two Piece Construciton V/S Single Piece Construction (Monoblock)
Cast Iron V/S Alternate Materials
Single Purpose V/S Multi Tasking (Combi)
5 Axes Machining
Belt Driven Spindles V/S Direct Drive (In Line)
Wireless Connections From Control To Elements
High Speed Machining
High rpm spindles
Single hit machining
Machine tools for TPM, lean and cellular manufacturing
Rapid tool change
International alliances in design, development, manufacture and marketing
4. PRODUCT WISE ANALYSIS
MARKET SIZE ANALYSIS OF
ELECTRICAL DISCHARGE MACHINE
Overview of electrical discharge machines
50
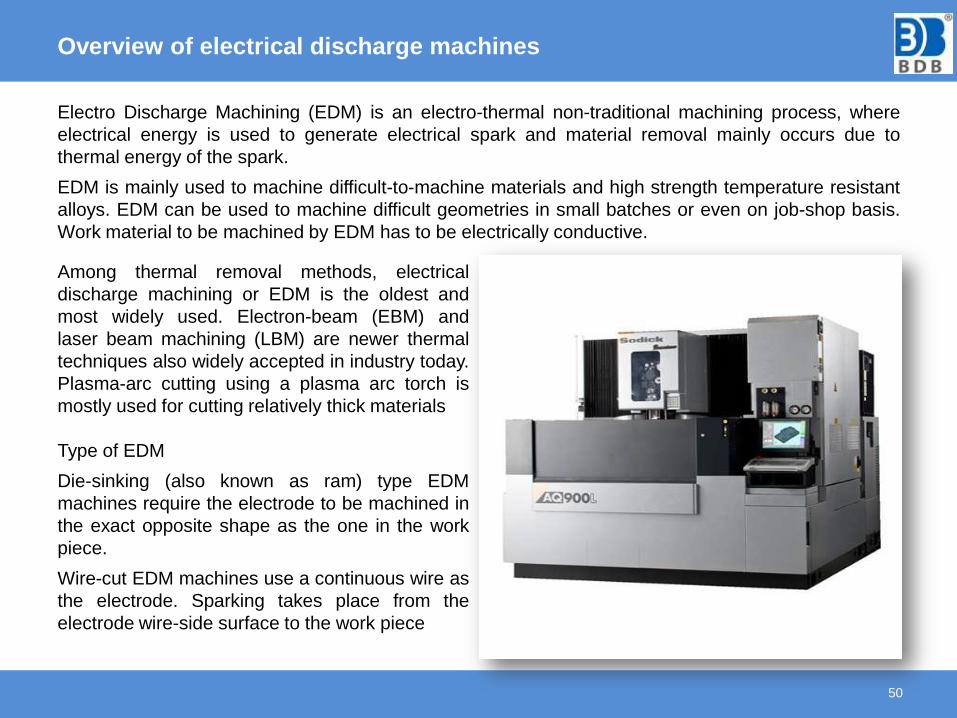
Electro Discharge Machining (EDM) is an electro-thermal non-traditional machining process, where
electrical energy is used to generate electrical spark and material removal mainly occurs due to
thermal energy of the spark.
EDM is mainly used to machine difficult-to-machine materials and high strength temperature resistant
alloys. EDM can be used to machine difficult geometries in small batches or even on job-shop basis.
Work material to be machined by EDM has to be electrically conductive.
Among thermal removal methods, electrical
discharge machining or EDM is the oldest and
most widely used. Electron-beam (EBM) and
laser beam machining (LBM) are newer thermal
techniques also widely accepted in industry today.
Plasma-arc cutting using a plasma arc torch is
mostly used for cutting relatively thick materials
Type of EDM
Die-sinking (also known as ram) type EDM
machines require the electrode to be machined in
the exact opposite shape as the one in the work
piece.
Wire-cut EDM machines use a continuous wire as
the electrode. Sparking takes place from the
electrode wire-side surface to the work piece
Major Indian electrical discharge machine manufacturers & their
locations
51
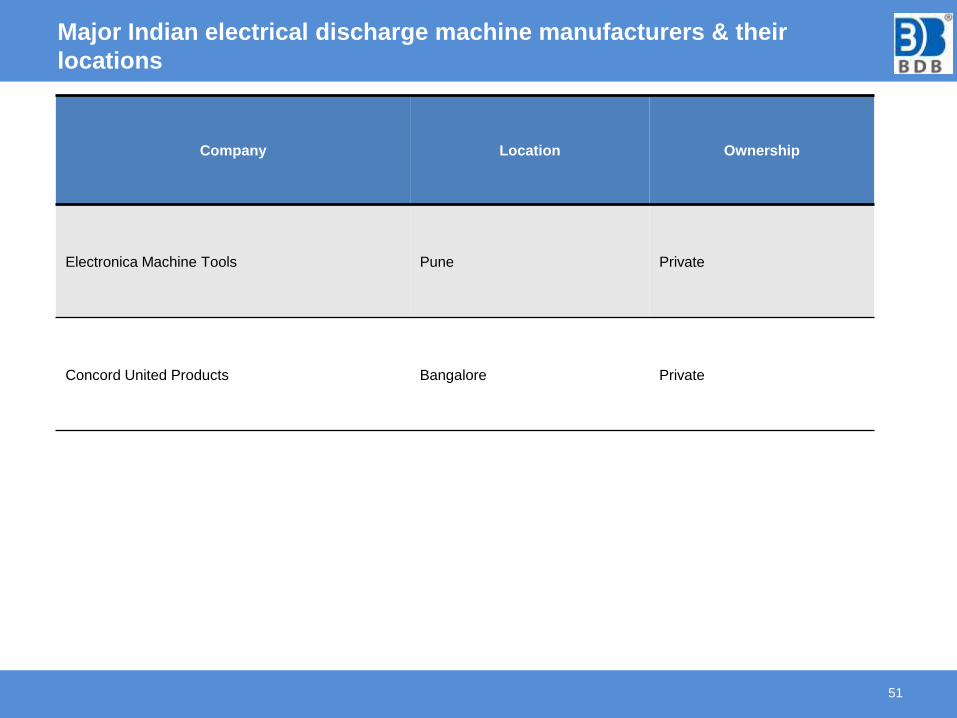
Company Location Ownership
Electronica Machine Tools Pune Private
Concord United Products Bangalore Private
Market demand for FY 2013 - electrical discharge machine
52
73%
61%
27%
39%
In Units In Rs Cr
Domestic Import
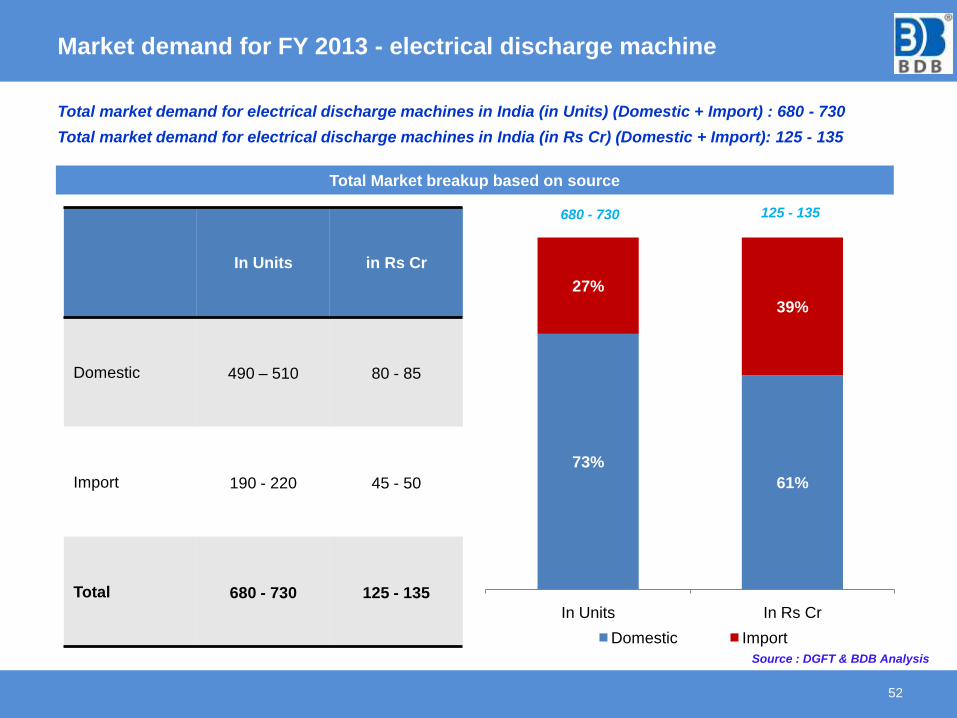
Total market demand for electrical discharge machines in India (in Units) (Domestic + Import) : 680 - 730
Total market demand for electrical discharge machines in India (in Rs Cr) (Domestic + Import): 125 - 135
680 - 730 125 - 135
Total Market breakup based on source
In Units in Rs Cr
Domestic 490 – 510 80 - 85
Import 190 - 220 45 - 50
Total 680 - 730 125 - 135
Source : DGFT & BDB Analysis
Market demand for FY 2013 - electrical discharge machine (Domestic)
53
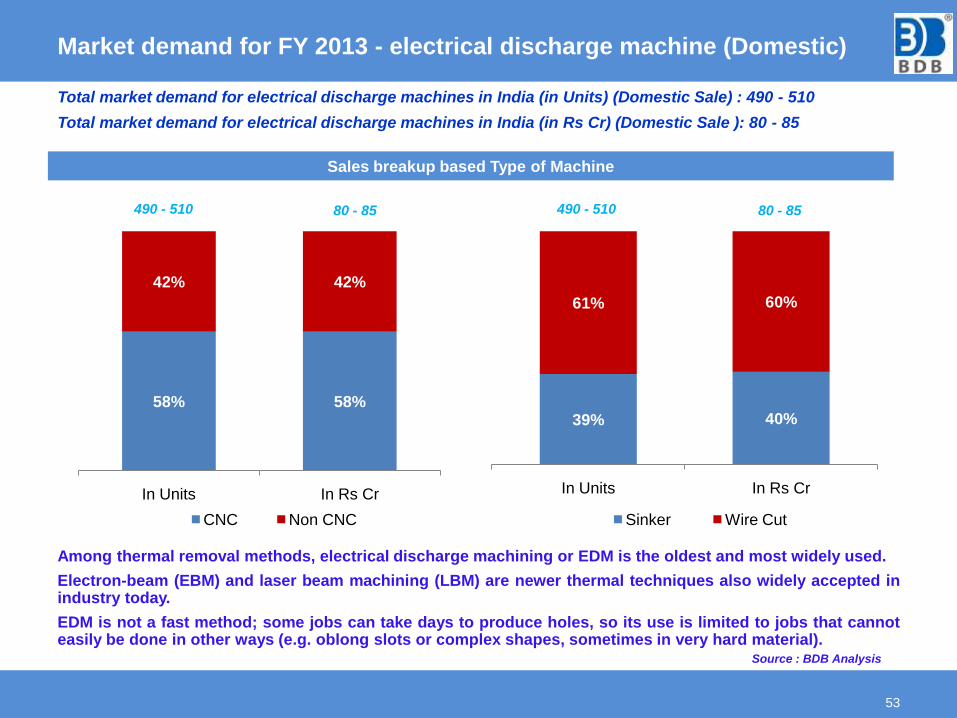
490 - 510 80 - 85
Sales breakup based Type of Machine
39% 40%
61% 60%
In Units In Rs Cr
Sinker Wire Cut
Among thermal removal methods, electrical discharge machining or EDM is the oldest and most widely used.
Electron-beam (EBM) and laser beam machining (LBM) are newer thermal techniques also widely accepted inindustry today.
EDM is not a fast method; some jobs can take days to produce holes, so its use is limited to jobs that cannoteasily be done in other ways (e.g. oblong slots or complex shapes, sometimes in very hard material).
Source : BDB Analysis
Total market demand for electrical discharge machines in India (in Units) (Domestic Sale) : 490 - 510
Total market demand for electrical discharge machines in India (in Rs Cr) (Domestic Sale ): 80 - 85
58% 58%
42% 42%
In Units In Rs Cr
CNC Non CNC
490 - 510 80 - 85
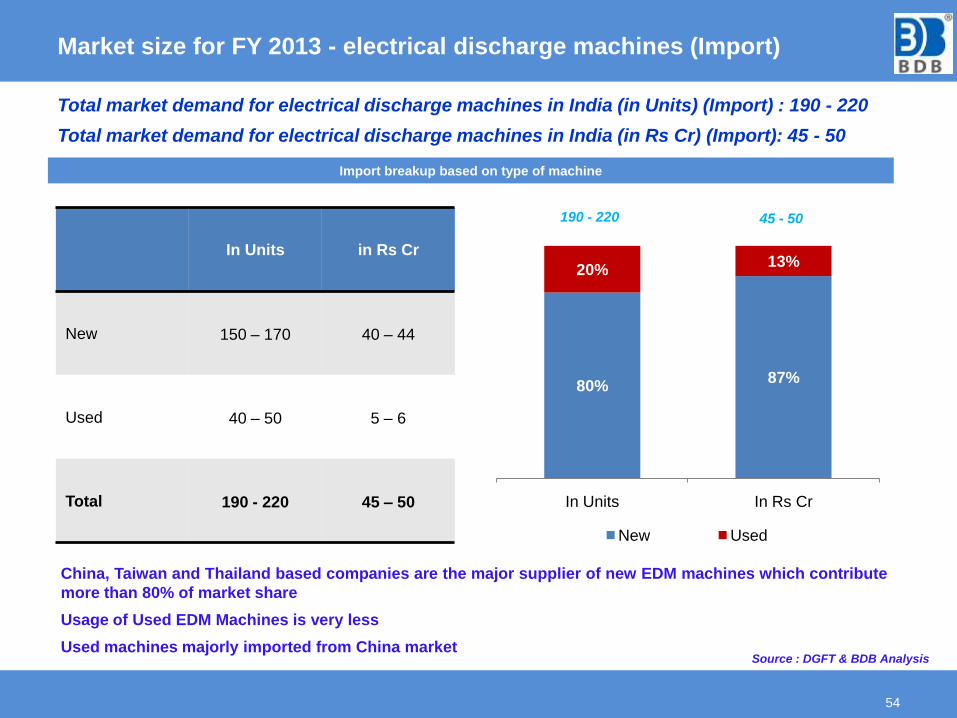
Market size for FY 2013 - electrical discharge machines (Import)
54
Total market demand for electrical discharge machines in India (in Units) (Import) : 190 - 220
Total market demand for electrical discharge machines in India (in Rs Cr) (Import): 45 - 50
80%87%
20%13%
In Units In Rs Cr
New Used
190 - 220 45 - 50
Import breakup based on type of machine
China, Taiwan and Thailand based companies are the major supplier of new EDM machines which contribute
more than 80% of market share
Usage of Used EDM Machines is very less
Used machines majorly imported from China market
In Units in Rs Cr
New 150 – 170 40 – 44
Used 40 – 50 5 – 6
Total 190 - 220 45 – 50
Source : DGFT & BDB Analysis
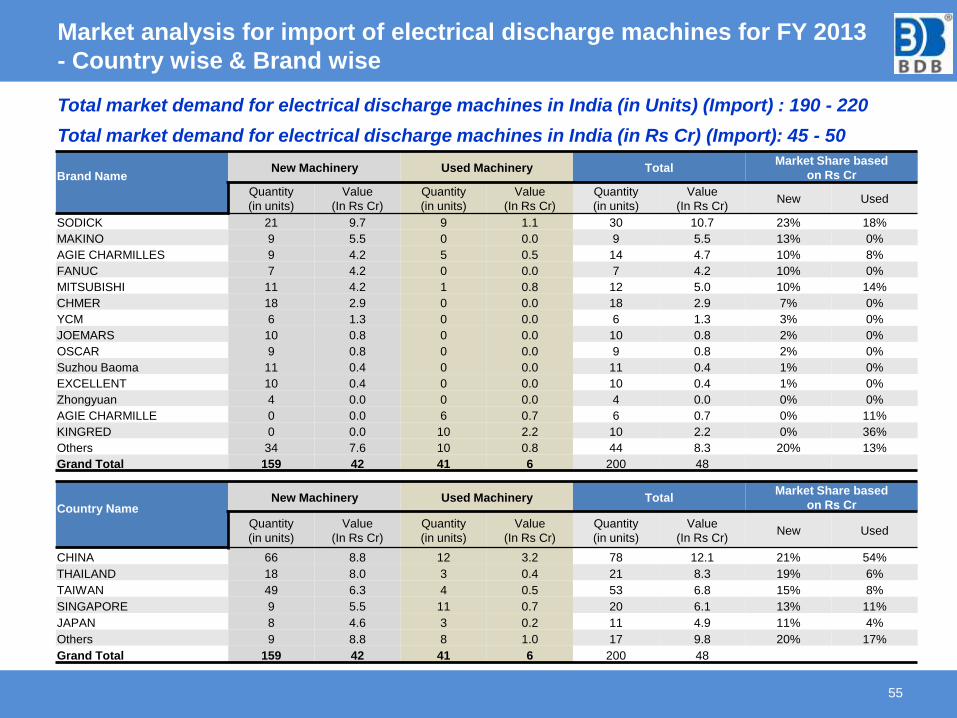
Market analysis for import of electrical discharge machines for FY 2013
- Country wise & Brand wise
55
Brand Name New Machinery Used Machinery Total
Market Share based
on Rs Cr
Quantity
(in units)
Value
(In Rs Cr)
Quantity
(in units)
Value
(In Rs Cr)
Quantity
(in units)
Value
(In Rs Cr)New Used
SODICK 21 9.7 9 1.1 30 10.7 23% 18%
MAKINO 9 5.5 0 0.0 9 5.5 13% 0%
AGIE CHARMILLES 9 4.2 5 0.5 14 4.7 10% 8%
FANUC 7 4.2 0 0.0 7 4.2 10% 0%
MITSUBISHI 11 4.2 1 0.8 12 5.0 10% 14%
CHMER 18 2.9 0 0.0 18 2.9 7% 0%
YCM 6 1.3 0 0.0 6 1.3 3% 0%
JOEMARS 10 0.8 0 0.0 10 0.8 2% 0%
OSCAR 9 0.8 0 0.0 9 0.8 2% 0%
Suzhou Baoma 11 0.4 0 0.0 11 0.4 1% 0%
EXCELLENT 10 0.4 0 0.0 10 0.4 1% 0%
Zhongyuan 4 0.0 0 0.0 4 0.0 0% 0%
AGIE CHARMILLE 0 0.0 6 0.7 6 0.7 0% 11%
KINGRED 0 0.0 10 2.2 10 2.2 0% 36%
Others 34 7.6 10 0.8 44 8.3 20% 13%
Grand Total 159 42 41 6 200 48
Country Name New Machinery Used Machinery Total
Market Share based
on Rs Cr
Quantity
(in units)
Value
(In Rs Cr)
Quantity
(in units)
Value
(In Rs Cr)
Quantity
(in units)
Value
(In Rs Cr)New Used
CHINA 66 8.8 12 3.2 78 12.1 21% 54%
THAILAND 18 8.0 3 0.4 21 8.3 19% 6%
TAIWAN 49 6.3 4 0.5 53 6.8 15% 8%
SINGAPORE 9 5.5 11 0.7 20 6.1 13% 11%
JAPAN 8 4.6 3 0.2 11 4.9 11% 4%
Others 9 8.8 8 1.0 17 9.8 20% 17%
Grand Total 159 42 41 6 200 48
Total market demand for electrical discharge machines in India (in Units) (Import) : 190 - 220
Total market demand for electrical discharge machines in India (in Rs Cr) (Import): 45 - 50
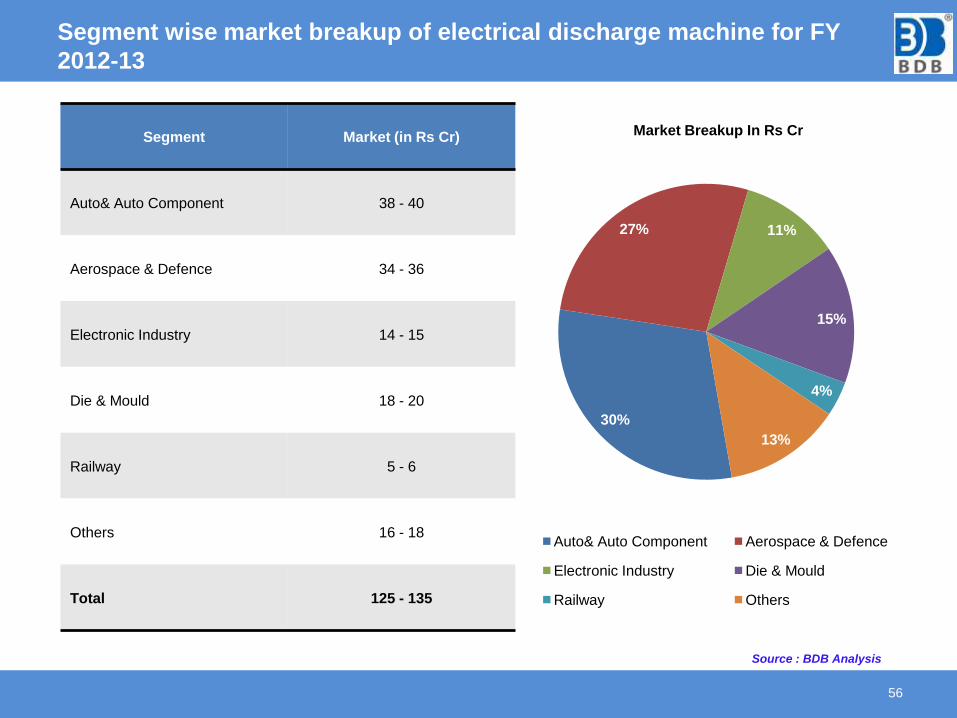
Segment wise market breakup of electrical discharge machine for FY
2012-13
56
Segment Market (in Rs Cr)
Auto& Auto Component 38 - 40
Aerospace & Defence 34 - 36
Electronic Industry 14 - 15
Die & Mould 18 - 20
Railway 5 - 6
Others 16 - 18
Total 125 - 135
30%
27% 11%
15%
4%
13%
Market Breakup In Rs Cr
Auto& Auto Component Aerospace & Defence
Electronic Industry Die & Mould
Railway Others
Source : BDB Analysis
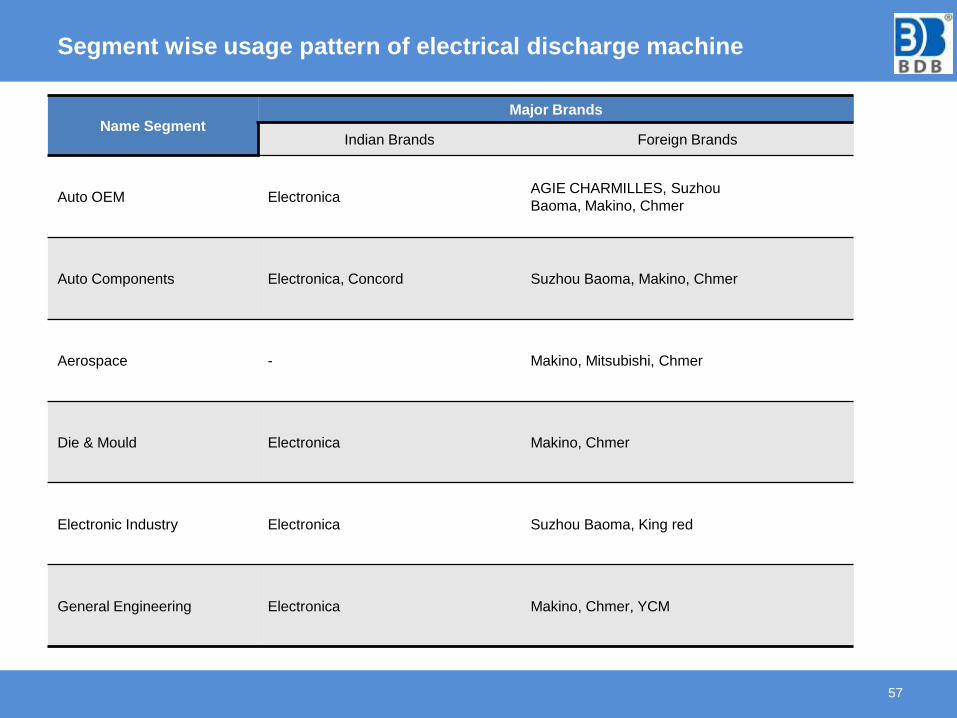
Segment wise usage pattern of electrical discharge machine
57
Name SegmentMajor Brands
Indian Brands Foreign Brands
Auto OEM ElectronicaAGIE CHARMILLES, Suzhou
Baoma, Makino, Chmer
Auto Components Electronica, Concord Suzhou Baoma, Makino, Chmer
Aerospace - Makino, Mitsubishi, Chmer
Die & Mould Electronica Makino, Chmer
Electronic Industry Electronica Suzhou Baoma, King red
General Engineering Electronica Makino, Chmer, YCM
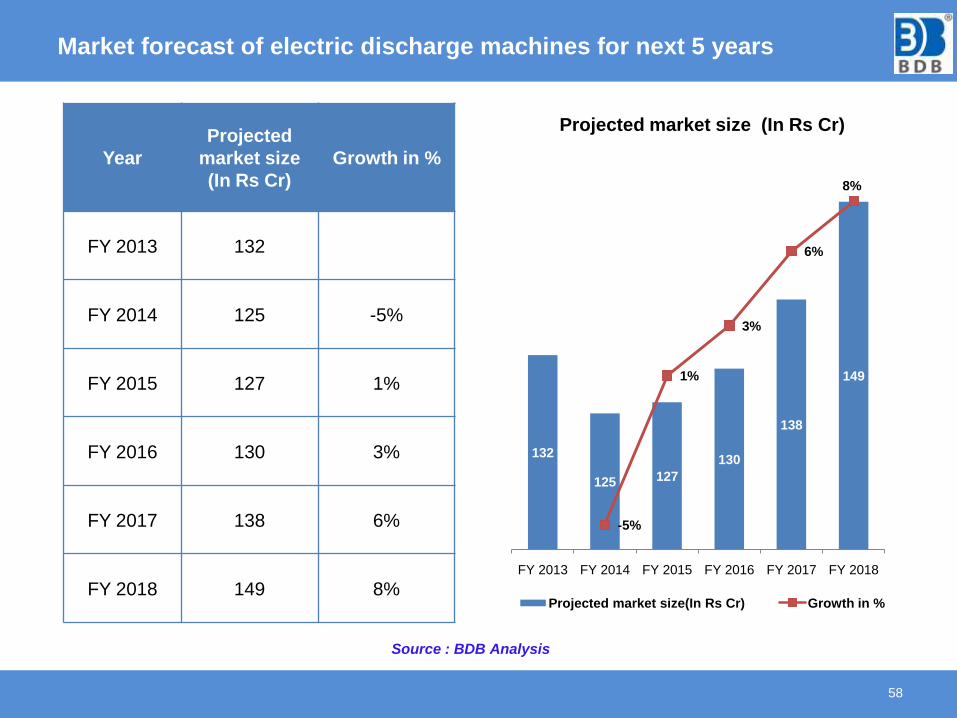
Market forecast of electric discharge machines for next 5 years
58
Year
Projected
market size
(In Rs Cr)
Growth in %
FY 2013 132
FY 2014 125 -5%
FY 2015 127 1%
FY 2016 130 3%
FY 2017 138 6%
FY 2018 149 8%
Source : BDB Analysis
132
125 127
130
138
149
-5%
1%
3%
6%
8%
-0.06
-0.04
-0.02
0
0.02
0.04
0.06
0.08
0.1
110
115
120
125
130
135
140
145
150
155
FY 2013 FY 2014 FY 2015 FY 2016 FY 2017 FY 2018
Projected market size (In Rs Cr)
Projected market size(In Rs Cr) Growth in %
ANALYSIS OF CNC TURNING
CENTERS MARKET IN INDIA
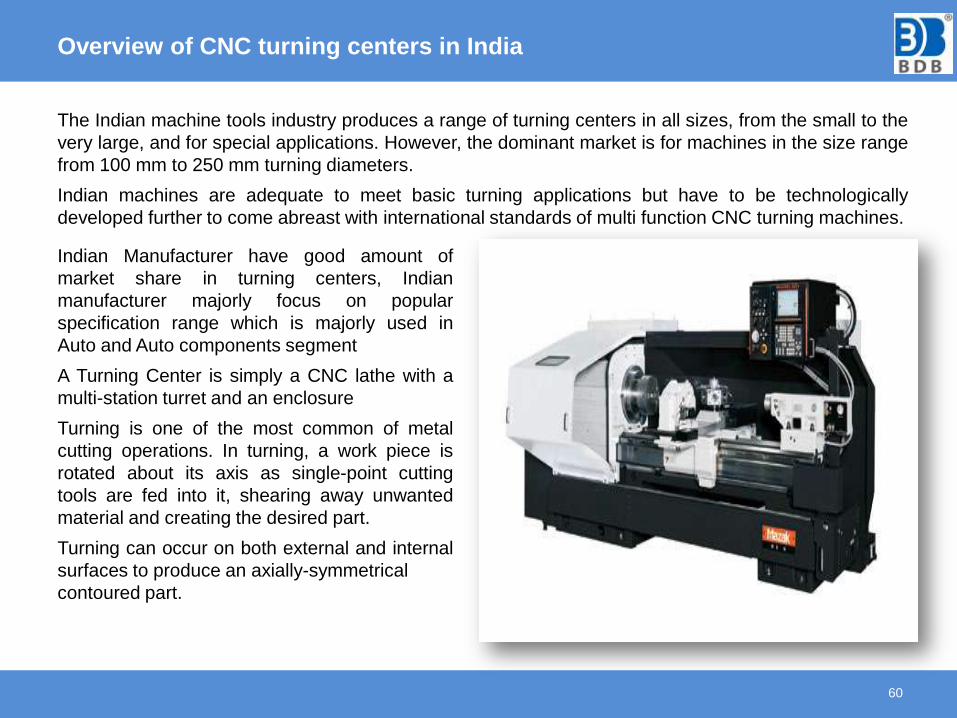
Overview of CNC turning centers in India
60
The Indian machine tools industry produces a range of turning centers in all sizes, from the small to the
very large, and for special applications. However, the dominant market is for machines in the size range
from 100 mm to 250 mm turning diameters.
Indian machines are adequate to meet basic turning applications but have to be technologically
developed further to come abreast with international standards of multi function CNC turning machines.
Indian Manufacturer have good amount of
market share in turning centers, Indian
manufacturer majorly focus on popular
specification range which is majorly used in
Auto and Auto components segment
A Turning Center is simply a CNC lathe with a
multi-station turret and an enclosure
Turning is one of the most common of metal
cutting operations. In turning, a work piece is
rotated about its axis as single-point cutting
tools are fed into it, shearing away unwanted
material and creating the desired part.
Turning can occur on both external and internal
surfaces to produce an axially-symmetrical
contoured part.
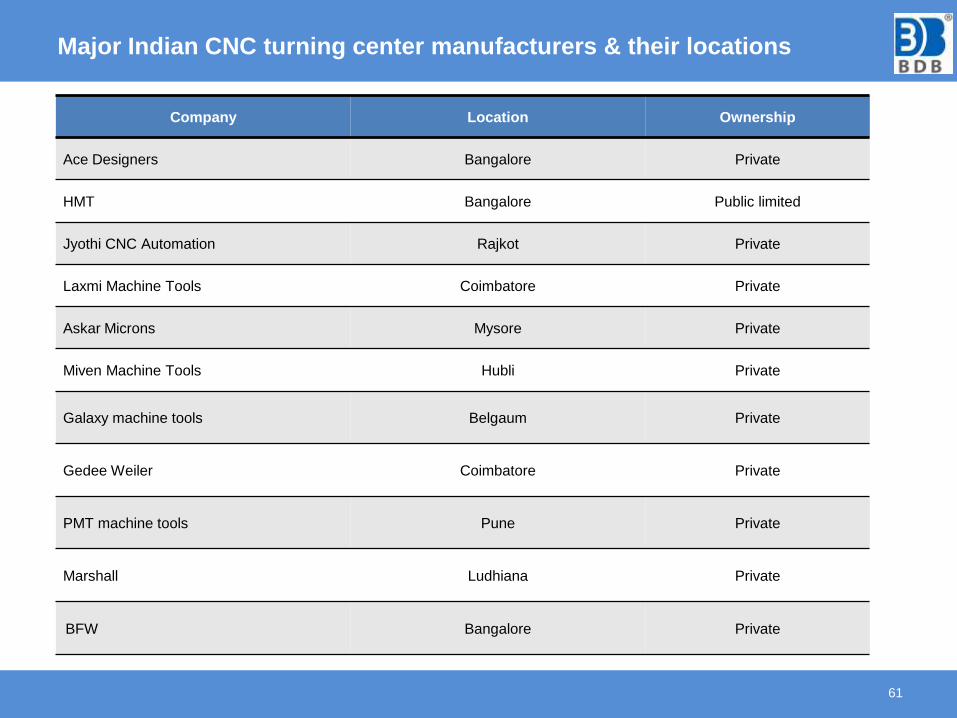
Major Indian CNC turning center manufacturers & their locations
61
Company Location Ownership
Ace Designers Bangalore Private
HMT Bangalore Public limited
Jyothi CNC Automation Rajkot Private
Laxmi Machine Tools Coimbatore Private
Askar Microns Mysore Private
Miven Machine Tools Hubli Private
Galaxy machine tools Belgaum Private
Gedee Weiler Coimbatore Private
PMT machine tools Pune Private
Marshall Ludhiana Private
BFW Bangalore Private
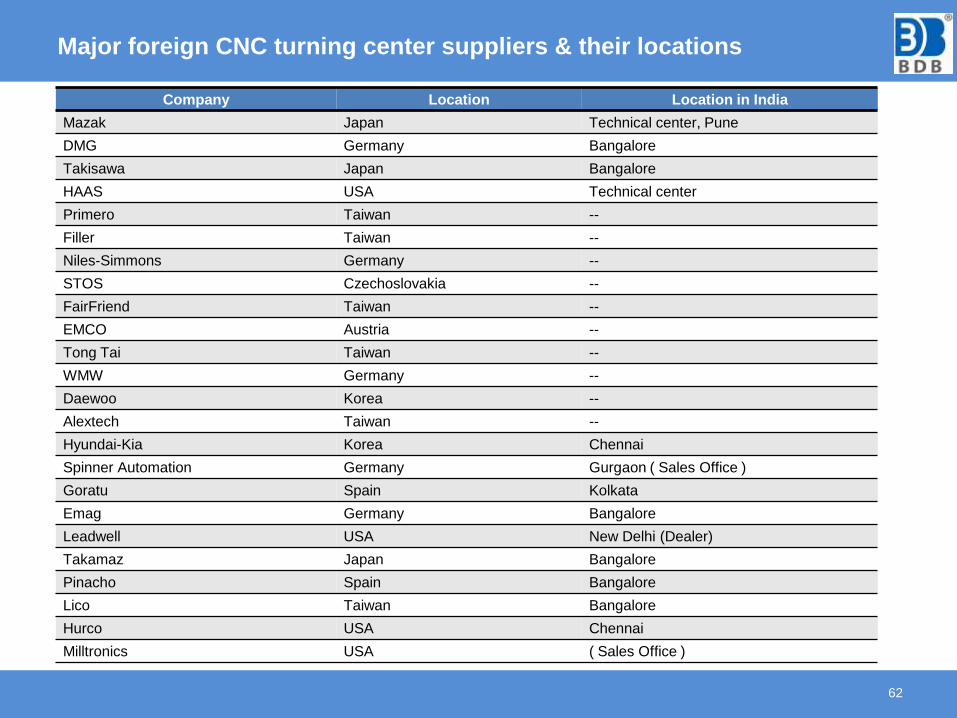
Major foreign CNC turning center suppliers & their locations
62
Company Location Location in India
Mazak Japan Technical center, Pune
DMG Germany Bangalore
Takisawa Japan Bangalore
HAAS USA Technical center
Primero Taiwan --
Filler Taiwan --
Niles-Simmons Germany --
STOS Czechoslovakia --
FairFriend Taiwan --
EMCO Austria --
Tong Tai Taiwan --
WMW Germany --
Daewoo Korea --
Alextech Taiwan --
Hyundai-Kia Korea Chennai
Spinner Automation Germany Gurgaon ( Sales Office )
Goratu Spain Kolkata
Emag Germany Bangalore
Leadwell USA New Delhi (Dealer)
Takamaz Japan Bangalore
Pinacho Spain Bangalore
Lico Taiwan Bangalore
Hurco USA Chennai
Milltronics USA ( Sales Office )
63
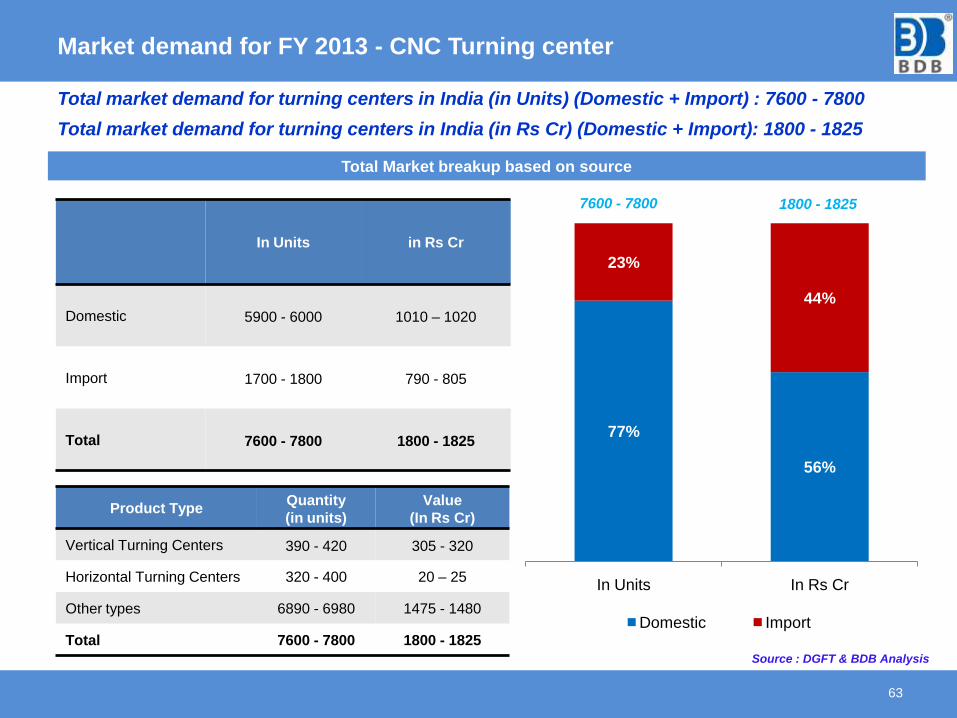
Market demand for FY 2013 - CNC Turning center
Total market demand for turning centers in India (in Units) (Domestic + Import) : 7600 - 7800
Total market demand for turning centers in India (in Rs Cr) (Domestic + Import): 1800 - 1825
Total Market breakup based on source
77%
56%
23%
44%
In Units In Rs Cr
Domestic Import
1800 - 18257600 - 7800
In Units in Rs Cr
Domestic 5900 - 6000 1010 – 1020
Import 1700 - 1800 790 - 805
Total 7600 - 7800 1800 - 1825
Source : DGFT & BDB Analysis
Product TypeQuantity
(in units)
Value
(In Rs Cr)
Vertical Turning Centers 390 - 420 305 - 320
Horizontal Turning Centers 320 - 400 20 – 25
Other types 6890 - 6980 1475 - 1480
Total 7600 - 7800 1800 - 1825
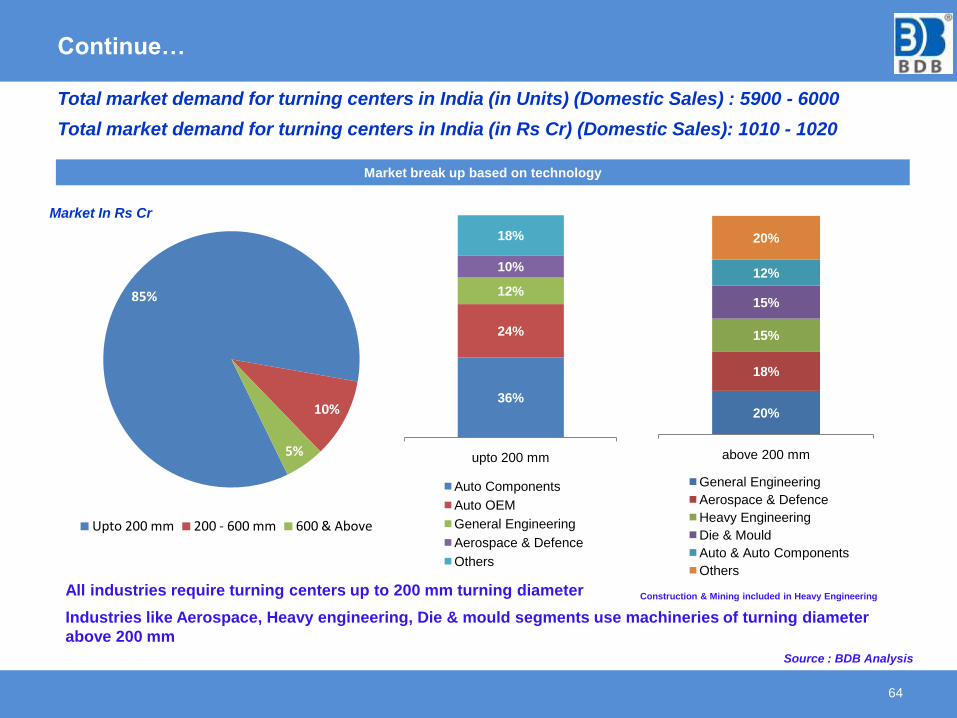
Continue…
64
Market break up based on technology
All industries require turning centers up to 200 mm turning diameter
Industries like Aerospace, Heavy engineering, Die & mould segments use machineries of turning diameter
above 200 mm
Market In Rs Cr
85%
10%
5%
Upto 200 mm 200 - 600 mm 600 & Above
Source : BDB Analysis
Total market demand for turning centers in India (in Units) (Domestic Sales) : 5900 - 6000
Total market demand for turning centers in India (in Rs Cr) (Domestic Sales): 1010 - 1020
36%
24%
12%
10%
18%
upto 200 mm
Auto Components
Auto OEM
General Engineering
Aerospace & Defence
Others
20%
18%
15%
15%
12%
20%
above 200 mm
General Engineering
Aerospace & Defence
Heavy Engineering
Die & Mould
Auto & Auto Components
Others
Construction & Mining included in Heavy Engineering
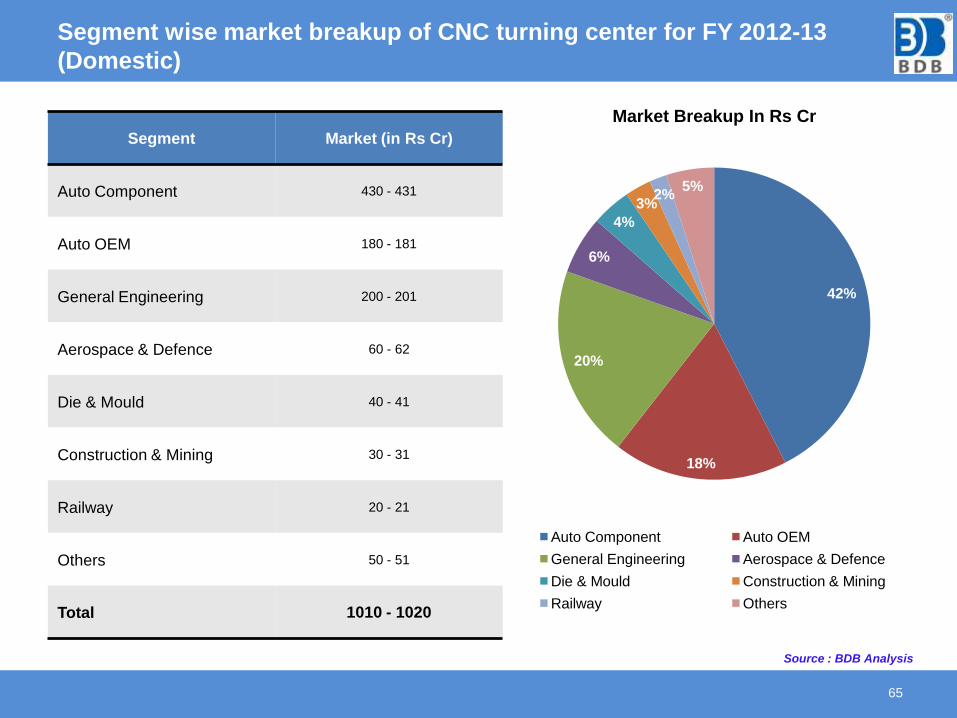
Segment wise market breakup of CNC turning center for FY 2012-13
(Domestic)
65
Segment Market (in Rs Cr)
Auto Component 430 - 431
Auto OEM 180 - 181
General Engineering 200 - 201
Aerospace & Defence 60 - 62
Die & Mould 40 - 41
Construction & Mining 30 - 31
Railway 20 - 21
Others 50 - 51
Total 1010 - 1020
42%
18%
20%
6%
4%
3%2%
5%
Market Breakup In Rs Cr
Auto Component Auto OEM
General Engineering Aerospace & Defence
Die & Mould Construction & Mining
Railway Others
Source : BDB Analysis
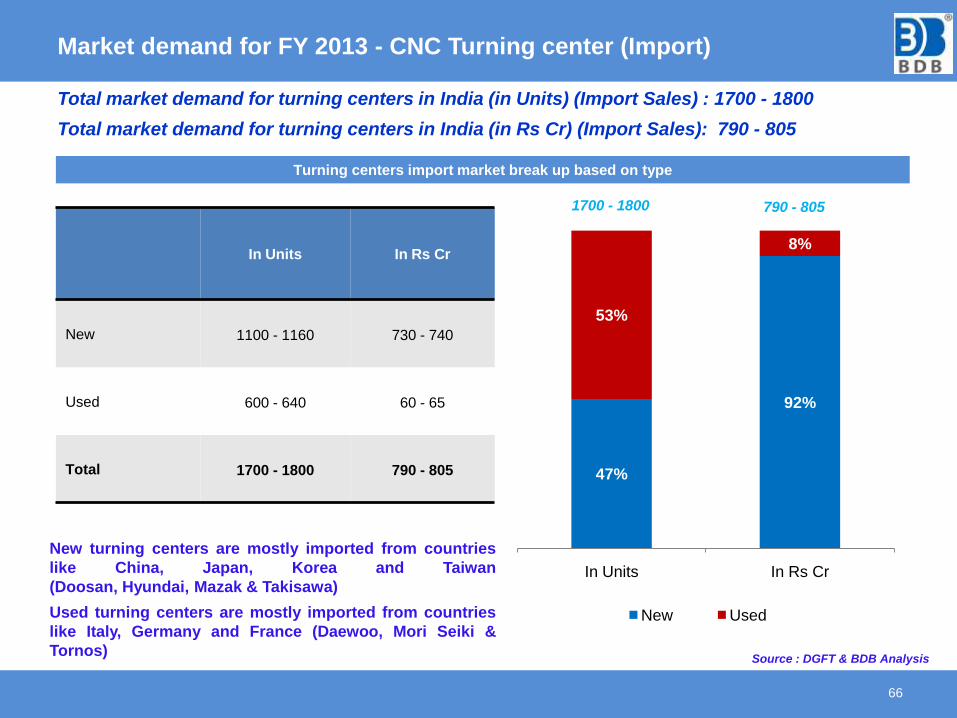
Market demand for FY 2013 - CNC Turning center (Import)
66
Turning centers import market break up based on type
1700 - 1800 790 - 805
47%
92%
53%
8%
In Units In Rs Cr
New Used
Total market demand for turning centers in India (in Units) (Import Sales) : 1700 - 1800
Total market demand for turning centers in India (in Rs Cr) (Import Sales): 790 - 805
New turning centers are mostly imported from countries
like China, Japan, Korea and Taiwan
(Doosan, Hyundai, Mazak & Takisawa)
Used turning centers are mostly imported from countries
like Italy, Germany and France (Daewoo, Mori Seiki &
Tornos)
In Units In Rs Cr
New 1100 - 1160 730 - 740
Used 600 - 640 60 - 65
Total 1700 - 1800 790 - 805
Source : DGFT & BDB Analysis
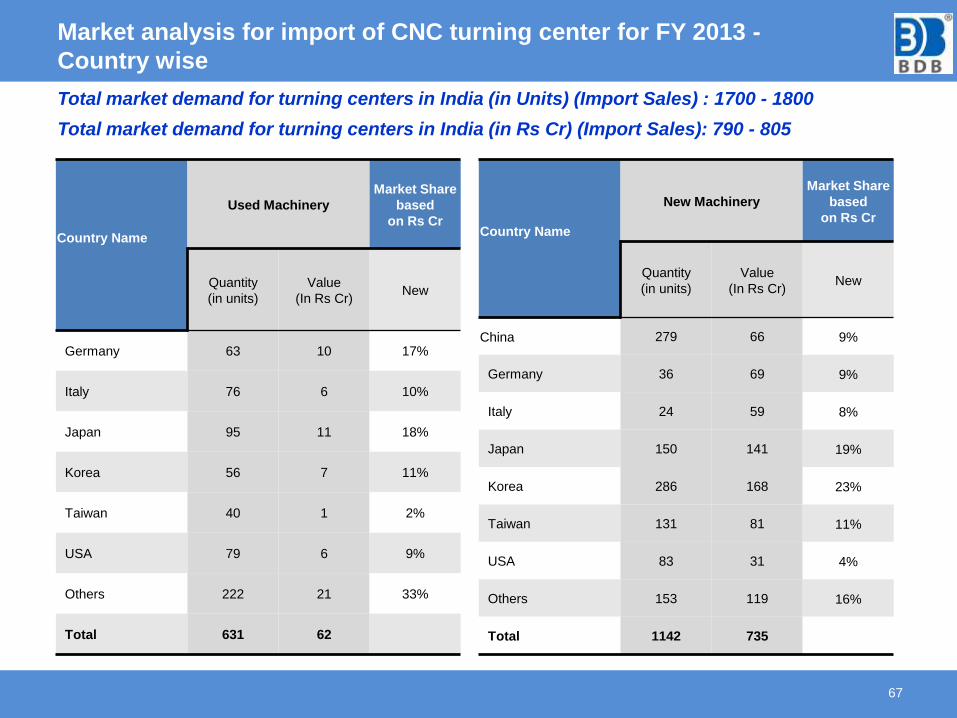
Market analysis for import of CNC turning center for FY 2013 -
Country wise
67
Total market demand for turning centers in India (in Units) (Import Sales) : 1700 - 1800
Total market demand for turning centers in India (in Rs Cr) (Import Sales): 790 - 805
Country Name
Used Machinery
Market Share
based
on Rs Cr
Quantity
(in units)
Value
(In Rs Cr)New
Germany 63 10 17%
Italy 76 6 10%
Japan 95 11 18%
Korea 56 7 11%
Taiwan 40 1 2%
USA 79 6 9%
Others 222 21 33%
Total 631 62
Country Name
New Machinery
Market Share
based
on Rs Cr
Quantity
(in units)
Value
(In Rs Cr)New
China 279 66 9%
Germany 36 69 9%
Italy 24 59 8%
Japan 150 141 19%
Korea 286 168 23%
Taiwan 131 81 11%
USA 83 31 4%
Others 153 119 16%
Total 1142 735
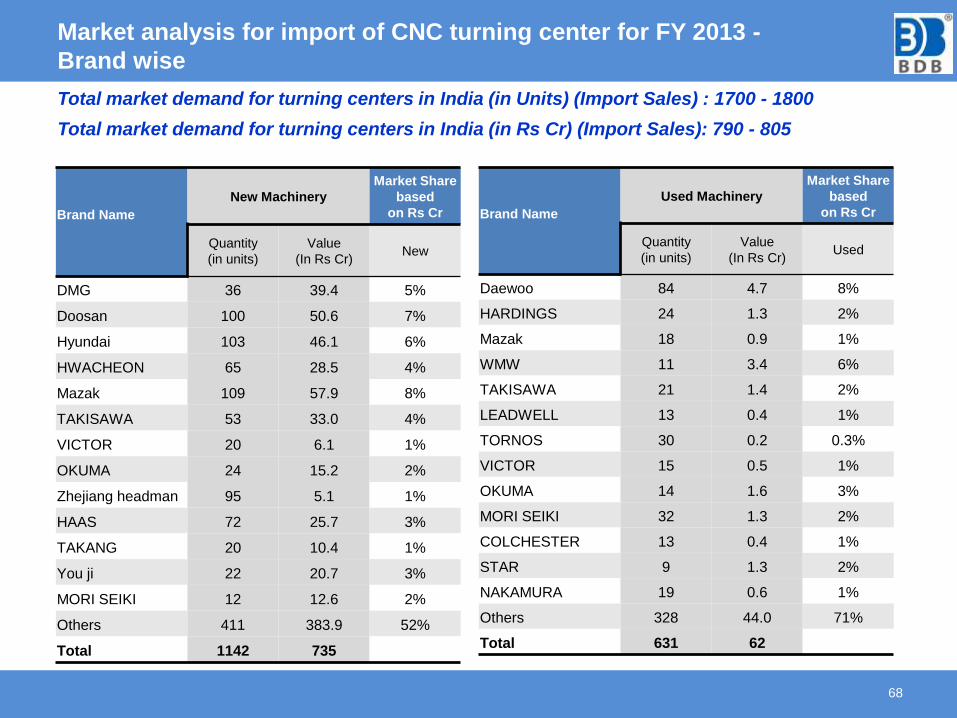
Market analysis for import of CNC turning center for FY 2013 -
Brand wise
68
Total market demand for turning centers in India (in Units) (Import Sales) : 1700 - 1800
Total market demand for turning centers in India (in Rs Cr) (Import Sales): 790 - 805
Brand Name
New Machinery
Market Share
based
on Rs Cr
Quantity
(in units)
Value
(In Rs Cr)New
DMG 36 39.4 5%
Doosan 100 50.6 7%
Hyundai 103 46.1 6%
HWACHEON 65 28.5 4%
Mazak 109 57.9 8%
TAKISAWA 53 33.0 4%
VICTOR 20 6.1 1%
OKUMA 24 15.2 2%
Zhejiang headman 95 5.1 1%
HAAS 72 25.7 3%
TAKANG 20 10.4 1%
You ji 22 20.7 3%
MORI SEIKI 12 12.6 2%
Others 411 383.9 52%
Total 1142 735
Brand Name
Used Machinery
Market Share
based
on Rs Cr
Quantity
(in units)
Value
(In Rs Cr)Used
Daewoo 84 4.7 8%
HARDINGS 24 1.3 2%
Mazak 18 0.9 1%
WMW 11 3.4 6%
TAKISAWA 21 1.4 2%
LEADWELL 13 0.4 1%
TORNOS 30 0.2 0.3%
VICTOR 15 0.5 1%
OKUMA 14 1.6 3%
MORI SEIKI 32 1.3 2%
COLCHESTER 13 0.4 1%
STAR 9 1.3 2%
NAKAMURA 19 0.6 1%
Others 328 44.0 71%
Total 631 62
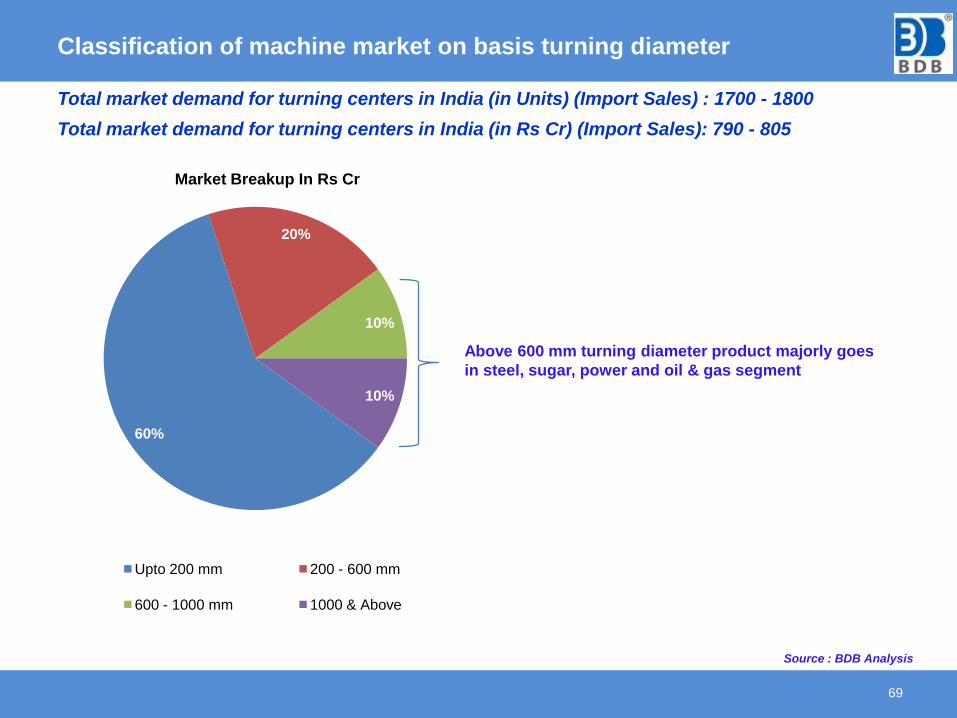
Classification of machine market on basis turning diameter
69
60%
20%
10%
10%
Market Breakup In Rs Cr
Upto 200 mm 200 - 600 mm
600 - 1000 mm 1000 & Above
Above 600 mm turning diameter product majorly goes
in steel, sugar, power and oil & gas segment
Total market demand for turning centers in India (in Units) (Import Sales) : 1700 - 1800
Total market demand for turning centers in India (in Rs Cr) (Import Sales): 790 - 805
Source : BDB Analysis
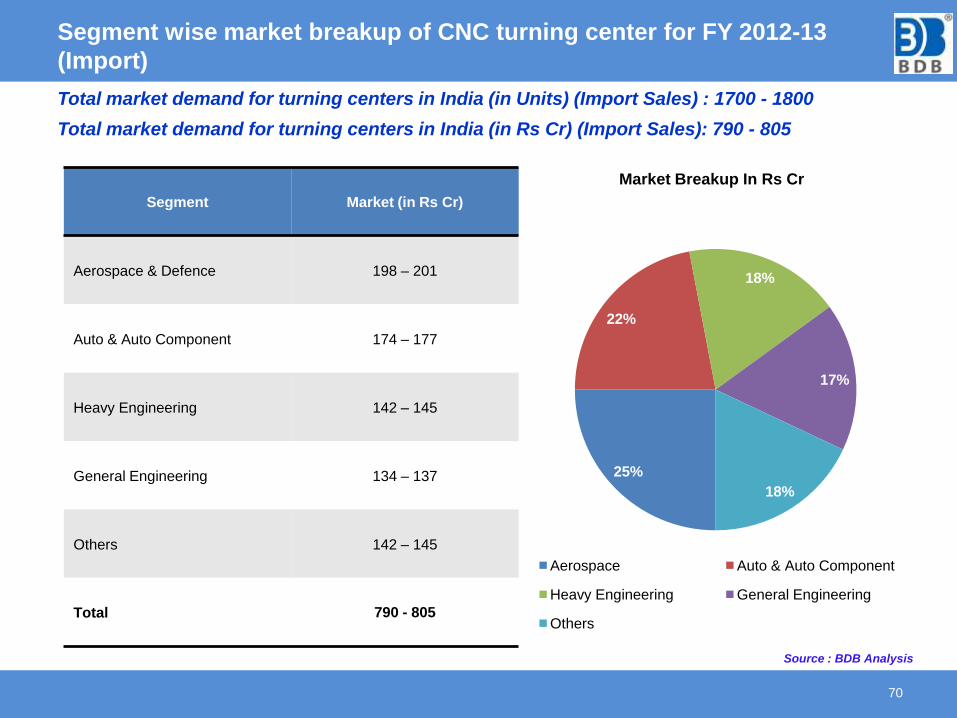
Segment wise market breakup of CNC turning center for FY 2012-13
(Import)
70
Segment Market (in Rs Cr)
Aerospace & Defence 198 – 201
Auto & Auto Component 174 – 177
Heavy Engineering 142 – 145
General Engineering 134 – 137
Others 142 – 145
Total 790 - 805
25%
22%
18%
17%
18%
Market Breakup In Rs Cr
Aerospace Auto & Auto Component
Heavy Engineering General Engineering
Others
Total market demand for turning centers in India (in Units) (Import Sales) : 1700 - 1800
Total market demand for turning centers in India (in Rs Cr) (Import Sales): 790 - 805
Source : BDB Analysis
ANALYSIS OF VERTICAL
TURNING CENTERS
MARKET IN INDIA
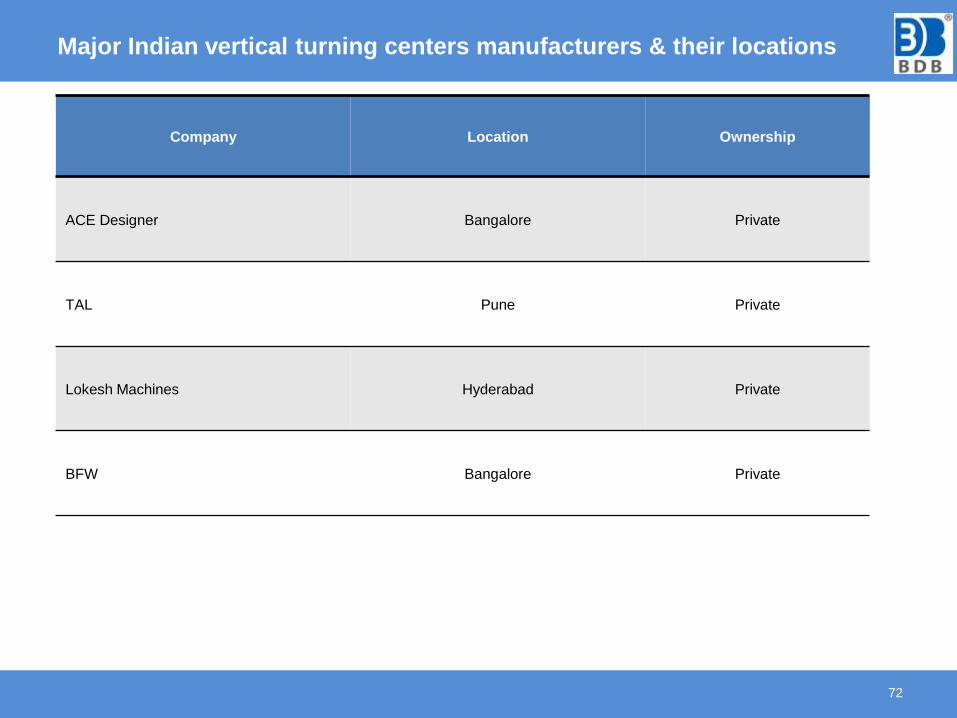
Major Indian vertical turning centers manufacturers & their locations
72
Company Location Ownership
ACE Designer Bangalore Private
TAL Pune Private
Lokesh Machines Hyderabad Private
BFW Bangalore Private
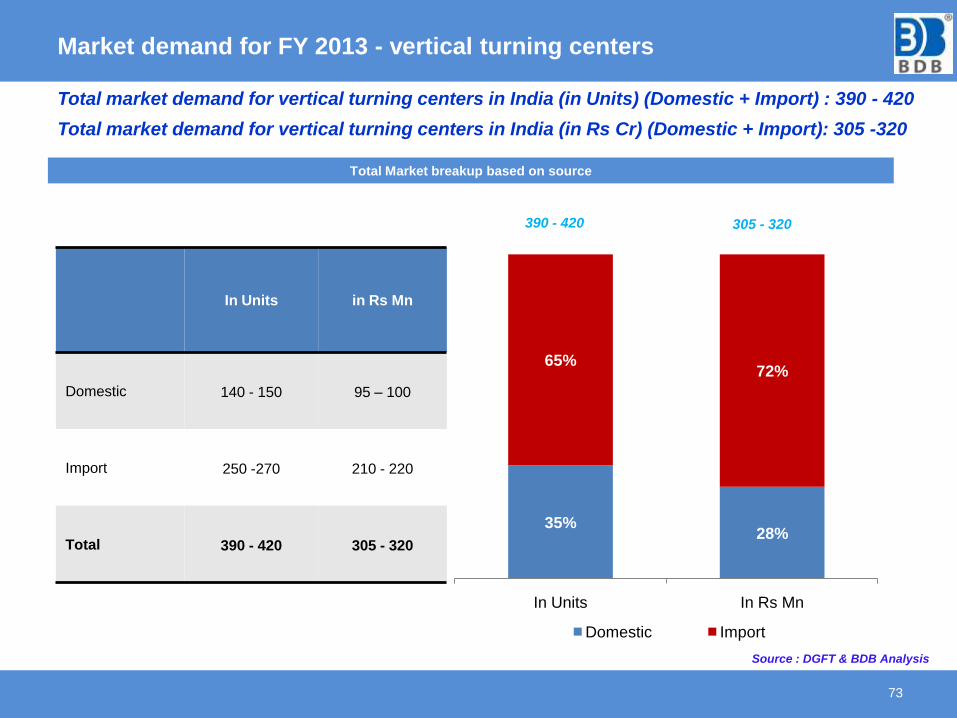
Market demand for FY 2013 - vertical turning centers
73
35%28%
65%72%
In Units In Rs Mn
Domestic Import
Total market demand for vertical turning centers in India (in Units) (Domestic + Import) : 390 - 420
Total market demand for vertical turning centers in India (in Rs Cr) (Domestic + Import): 305 -320
Total Market breakup based on source
390 - 420
In Units in Rs Mn
Domestic 140 - 150 95 – 100
Import 250 -270 210 - 220
Total 390 - 420 305 - 320
305 - 320
Source : DGFT & BDB Analysis
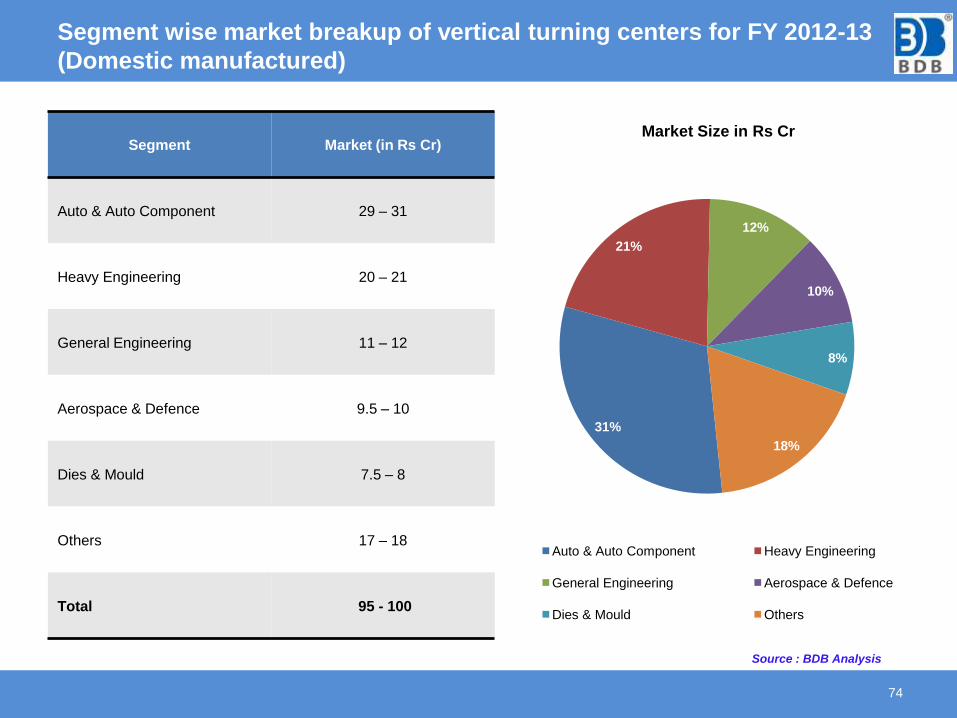
Segment wise market breakup of vertical turning centers for FY 2012-13
(Domestic manufactured)
74
Segment Market (in Rs Cr)
Auto & Auto Component 29 – 31
Heavy Engineering 20 – 21
General Engineering 11 – 12
Aerospace & Defence 9.5 – 10
Dies & Mould 7.5 – 8
Others 17 – 18
Total 95 - 100
31%
21%
12%
10%
8%
18%
Market Size in Rs Cr
Auto & Auto Component Heavy Engineering
General Engineering Aerospace & Defence
Dies & Mould Others
Source : BDB Analysis
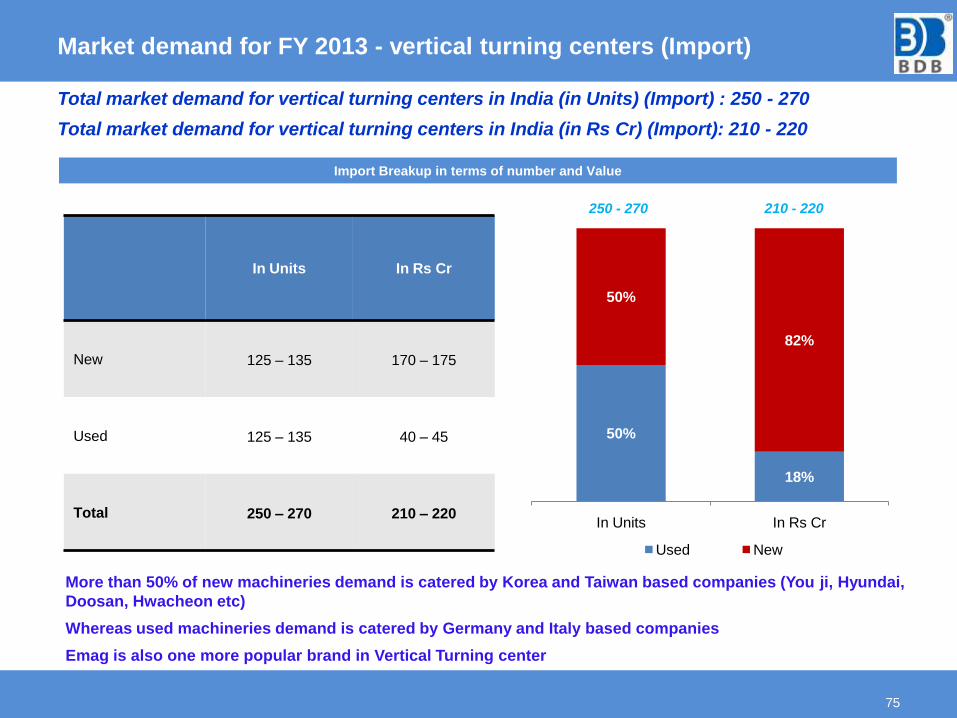
Market demand for FY 2013 - vertical turning centers (Import)
75
Total market demand for vertical turning centers in India (in Units) (Import) : 250 - 270
Total market demand for vertical turning centers in India (in Rs Cr) (Import): 210 - 220
250 - 270 210 - 220
Import Breakup in terms of number and Value
50%
18%
50%
82%
In Units In Rs Cr
Used New
More than 50% of new machineries demand is catered by Korea and Taiwan based companies (You ji, Hyundai,
Doosan, Hwacheon etc)
Whereas used machineries demand is catered by Germany and Italy based companies
Emag is also one more popular brand in Vertical Turning center
In Units In Rs Cr
New 125 – 135 170 – 175
Used 125 – 135 40 – 45
Total 250 – 270 210 – 220
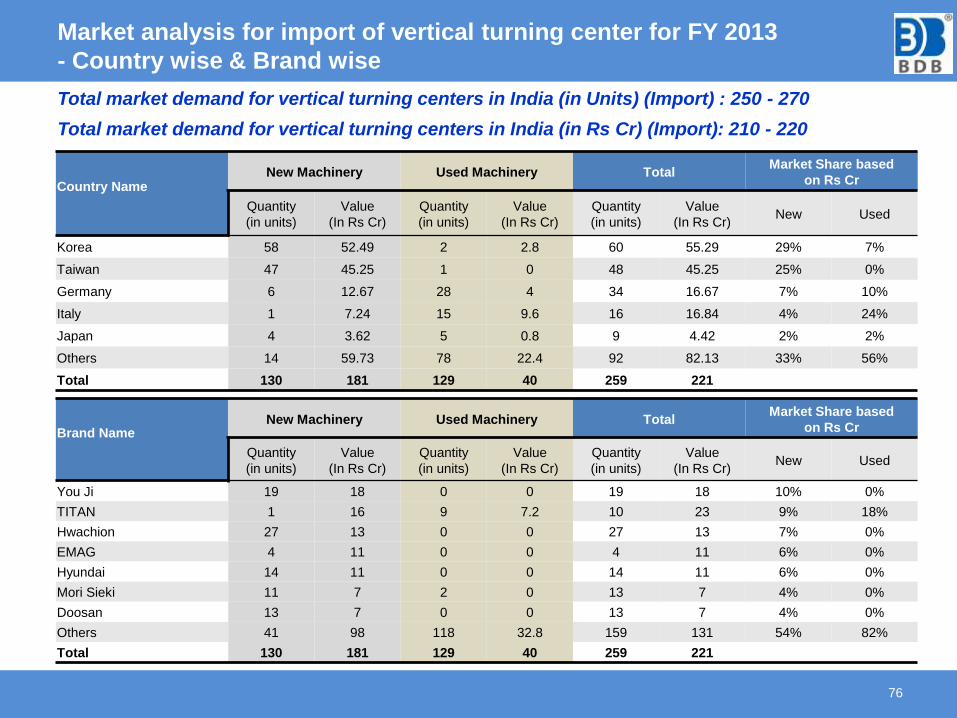
Market analysis for import of vertical turning center for FY 2013
- Country wise & Brand wise
76
Country Name New Machinery Used Machinery Total
Market Share based
on Rs Cr
Quantity
(in units)
Value
(In Rs Cr)
Quantity
(in units)
Value
(In Rs Cr)
Quantity
(in units)
Value
(In Rs Cr)New Used
Korea 58 52.49 2 2.8 60 55.29 29% 7%
Taiwan 47 45.25 1 0 48 45.25 25% 0%
Germany 6 12.67 28 4 34 16.67 7% 10%
Italy 1 7.24 15 9.6 16 16.84 4% 24%
Japan 4 3.62 5 0.8 9 4.42 2% 2%
Others 14 59.73 78 22.4 92 82.13 33% 56%
Total 130 181 129 40 259 221
Brand Name New Machinery Used Machinery Total
Market Share based
on Rs Cr
Quantity
(in units)
Value
(In Rs Cr)
Quantity
(in units)
Value
(In Rs Cr)
Quantity
(in units)
Value
(In Rs Cr)New Used
You Ji 19 18 0 0 19 18 10% 0%
TITAN 1 16 9 7.2 10 23 9% 18%
Hwachion 27 13 0 0 27 13 7% 0%
EMAG 4 11 0 0 4 11 6% 0%
Hyundai 14 11 0 0 14 11 6% 0%
Mori Sieki 11 7 2 0 13 7 4% 0%
Doosan 13 7 0 0 13 7 4% 0%
Others 41 98 118 32.8 159 131 54% 82%
Total 130 181 129 40 259 221
Total market demand for vertical turning centers in India (in Units) (Import) : 250 - 270
Total market demand for vertical turning centers in India (in Rs Cr) (Import): 210 - 220
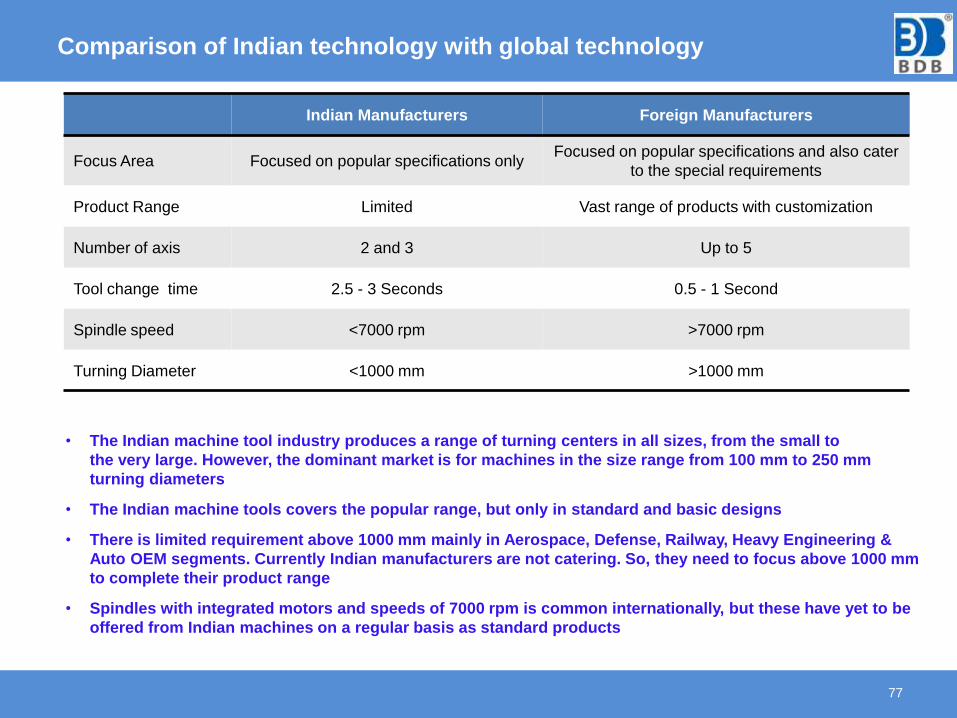
Comparison of Indian technology with global technology
77
• The Indian machine tool industry produces a range of turning centers in all sizes, from the small to
the very large. However, the dominant market is for machines in the size range from 100 mm to 250 mm
turning diameters
• The Indian machine tools covers the popular range, but only in standard and basic designs
• There is limited requirement above 1000 mm mainly in Aerospace, Defense, Railway, Heavy Engineering &
Auto OEM segments. Currently Indian manufacturers are not catering. So, they need to focus above 1000 mm
to complete their product range
• Spindles with integrated motors and speeds of 7000 rpm is common internationally, but these have yet to be
offered from Indian machines on a regular basis as standard products
Indian Manufacturers Foreign Manufacturers
Focus Area Focused on popular specifications onlyFocused on popular specifications and also cater
to the special requirements
Product Range Limited Vast range of products with customization
Number of axis 2 and 3 Up to 5
Tool change time 2.5 - 3 Seconds 0.5 - 1 Second
Spindle speed <7000 rpm >7000 rpm
Turning Diameter <1000 mm >1000 mm
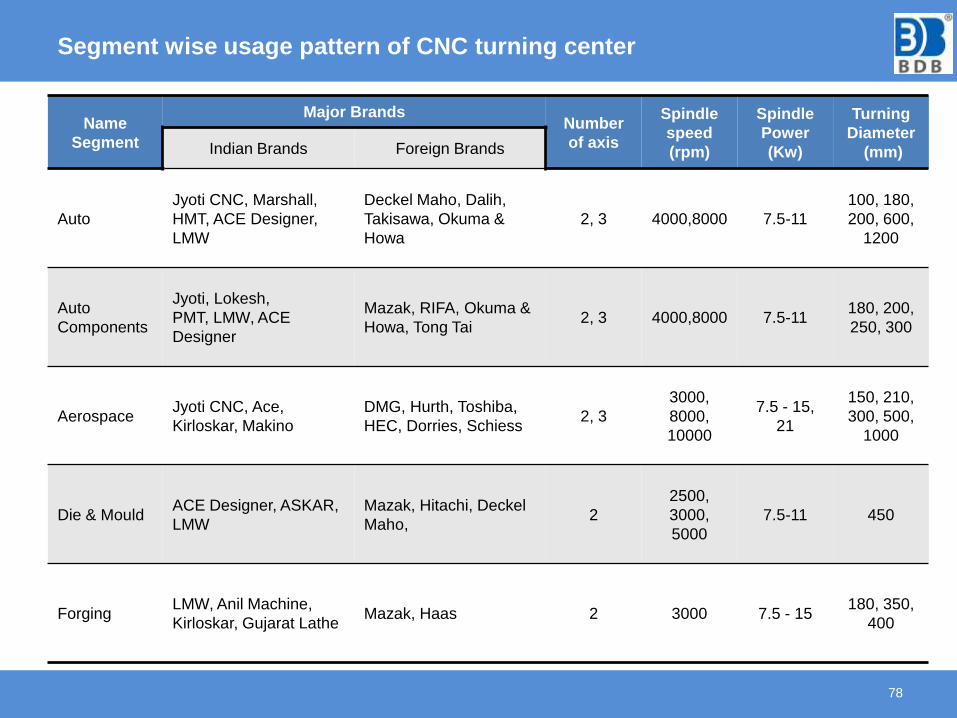
Segment wise usage pattern of CNC turning center
78
Name
Segment
Major BrandsNumber
of axis
Spindle
speed
(rpm)
Spindle
Power
(Kw)
Turning
Diameter
(mm)Indian Brands Foreign Brands
Auto
Jyoti CNC, Marshall,
HMT, ACE Designer,
LMW
Deckel Maho, Dalih,
Takisawa, Okuma &
Howa
2, 3 4000,8000 7.5-11
100, 180,
200, 600,
1200
Auto
Components
Jyoti, Lokesh,
PMT, LMW, ACE
Designer
Mazak, RIFA, Okuma &
Howa, Tong Tai2, 3 4000,8000 7.5-11
180, 200,
250, 300
AerospaceJyoti CNC, Ace,
Kirloskar, Makino
DMG, Hurth, Toshiba,
HEC, Dorries, Schiess2, 3
3000,
8000,
10000
7.5 - 15,
21
150, 210,
300, 500,
1000
Die & MouldACE Designer, ASKAR,
LMW
Mazak, Hitachi, Deckel
Maho, 2
2500,
3000,
5000
7.5-11 450
ForgingLMW, Anil Machine,
Kirloskar, Gujarat LatheMazak, Haas 2 3000 7.5 - 15
180, 350,
400
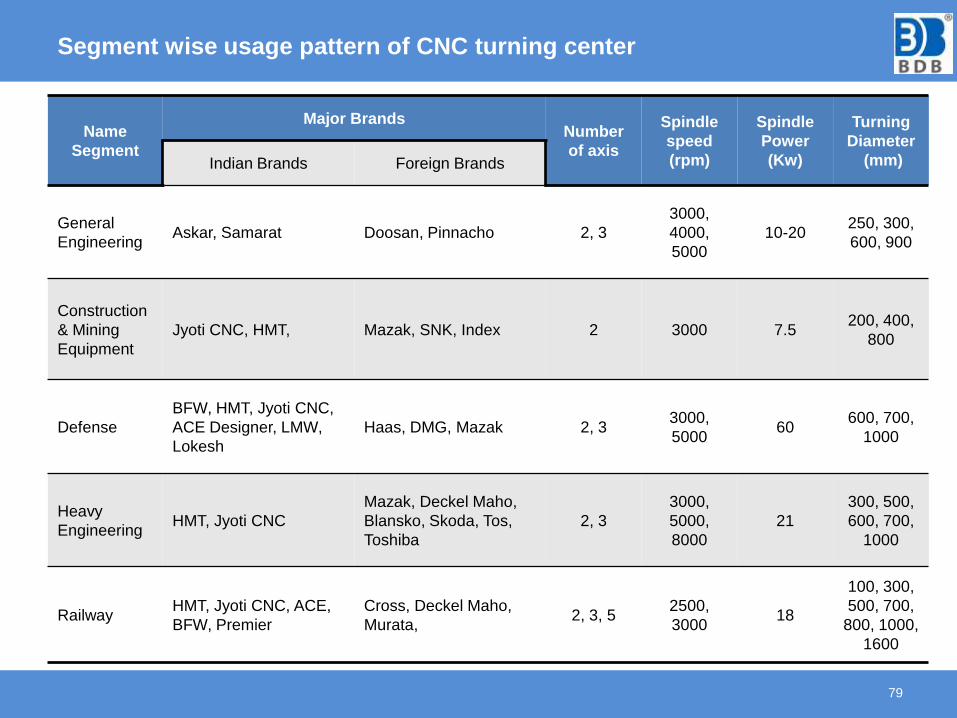
Segment wise usage pattern of CNC turning center
Name
Segment
Major BrandsNumber
of axis
Spindle
speed
(rpm)
Spindle
Power
(Kw)
Turning
Diameter
(mm)Indian Brands Foreign Brands
General
Engineering Askar, Samarat Doosan, Pinnacho 2, 3
3000,
4000,
5000
10-20250, 300,
600, 900
Construction
& Mining
Equipment
Jyoti CNC, HMT, Mazak, SNK, Index 2 3000 7.5200, 400,
800
Defense
BFW, HMT, Jyoti CNC,
ACE Designer, LMW,
Lokesh
Haas, DMG, Mazak 2, 33000,
500060
600, 700,
1000
Heavy
EngineeringHMT, Jyoti CNC
Mazak, Deckel Maho,
Blansko, Skoda, Tos,
Toshiba
2, 3
3000,
5000,
8000
21
300, 500,
600, 700,
1000
RailwayHMT, Jyoti CNC, ACE,
BFW, Premier
Cross, Deckel Maho,
Murata, 2, 3, 5
2500,
300018
100, 300,
500, 700,
800, 1000,
1600
79
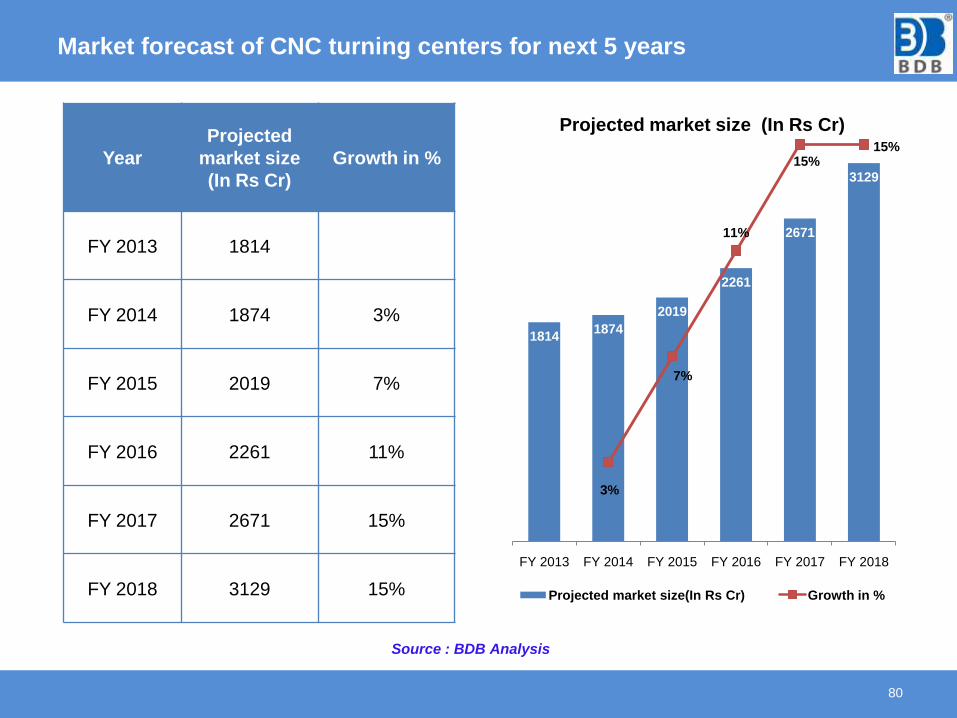
Market forecast of CNC turning centers for next 5 years
80
Year
Projected
market size
(In Rs Cr)
Growth in %
FY 2013 1814
FY 2014 1874 3%
FY 2015 2019 7%
FY 2016 2261 11%
FY 2017 2671 15%
FY 2018 3129 15%
18141874
2019
2261
2671
3129
3%
7%
11%
15%15%
0
0.02
0.04
0.06
0.08
0.1
0.12
0.14
0.16
0
500
1000
1500
2000
2500
3000
3500
FY 2013 FY 2014 FY 2015 FY 2016 FY 2017 FY 2018
Projected market size (In Rs Cr)
Projected market size(In Rs Cr) Growth in %
Source : BDB Analysis
ANALYSIS OF CONVENTIONAL LATHE
MACHINES MARKET IN INDIA
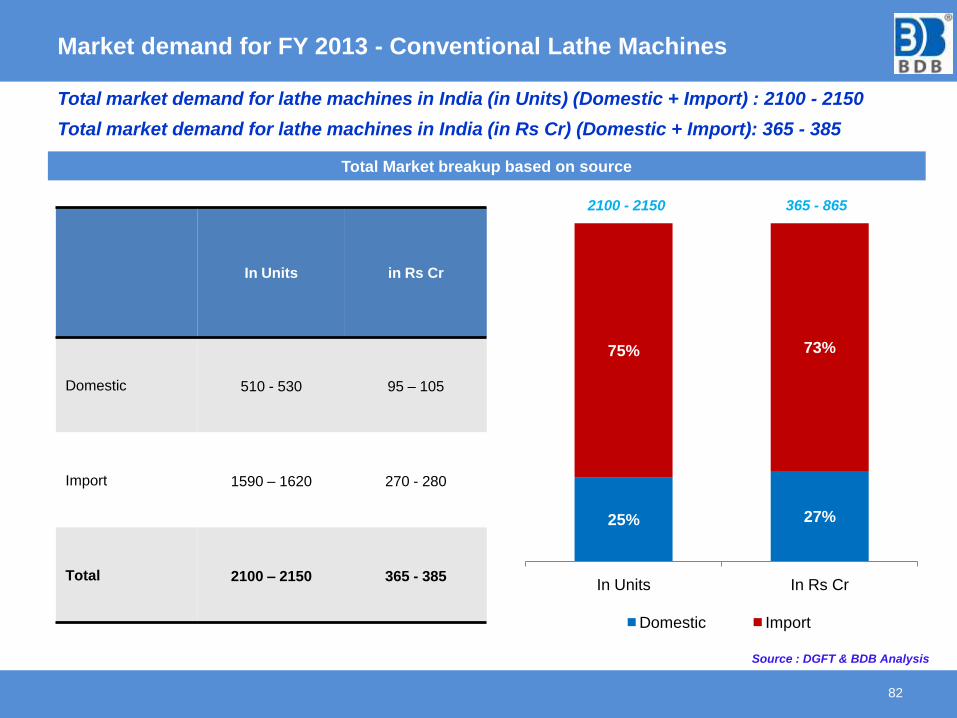
Market demand for FY 2013 - Conventional Lathe Machines
82
Total market demand for lathe machines in India (in Units) (Domestic + Import) : 2100 - 2150
Total market demand for lathe machines in India (in Rs Cr) (Domestic + Import): 365 - 385
Total Market breakup based on source
In Units in Rs Cr
Domestic 510 - 530 95 – 105
Import 1590 – 1620 270 - 280
Total 2100 – 2150 365 - 385
25% 27%
75% 73%
In Units In Rs Cr
Domestic Import
2100 - 2150 365 - 865
Source : DGFT & BDB Analysis
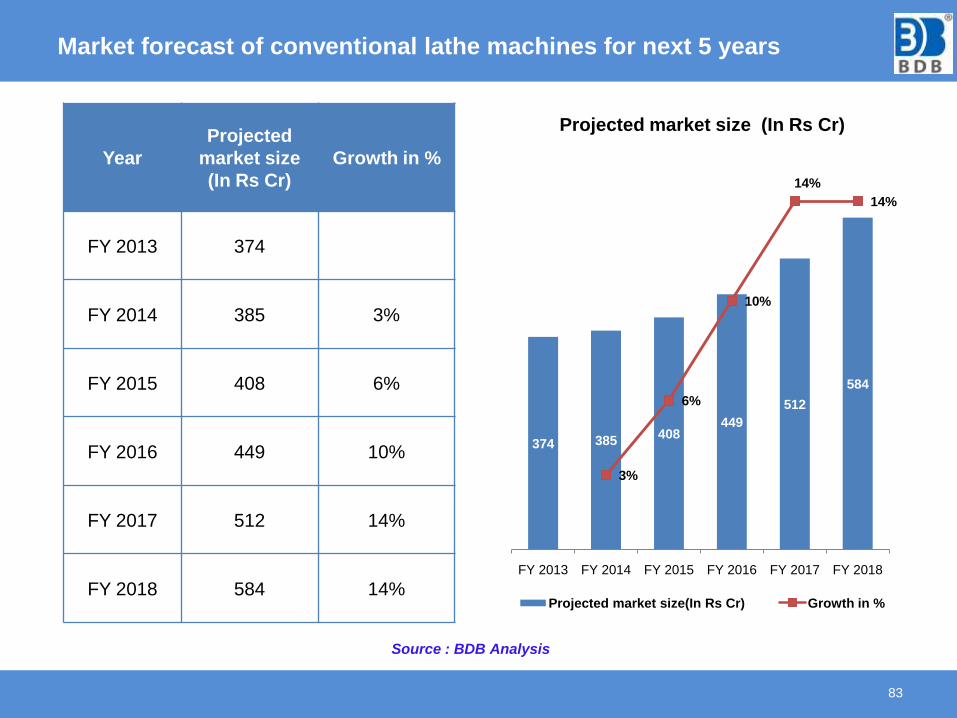
Market forecast of conventional lathe machines for next 5 years
83
Year
Projected
market size
(In Rs Cr)
Growth in %
FY 2013 374
FY 2014 385 3%
FY 2015 408 6%
FY 2016 449 10%
FY 2017 512 14%
FY 2018 584 14%
Source : BDB Analysis
374 385408
449
512
584
3%
6%
10%
14%
14%
0
0.02
0.04
0.06
0.08
0.1
0.12
0.14
0.16
0
100
200
300
400
500
600
700
FY 2013 FY 2014 FY 2015 FY 2016 FY 2017 FY 2018
Projected market size (In Rs Cr)
Projected market size(In Rs Cr) Growth in %
ANALYSIS OF MACHINING
CENTERS MARKET IN INDIA
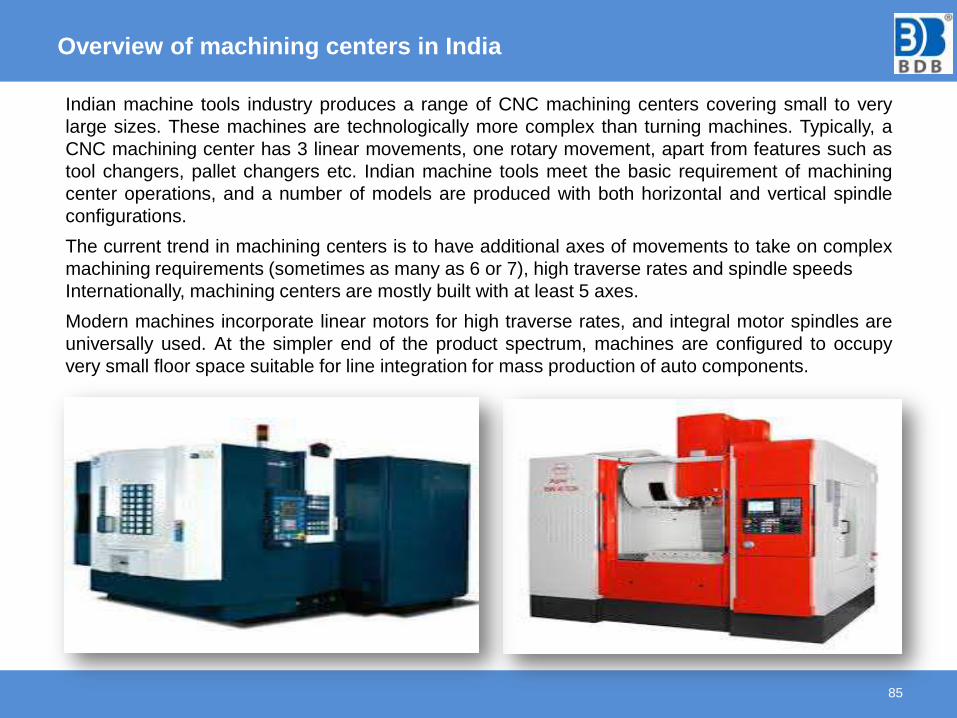
Overview of machining centers in India
85
Indian machine tools industry produces a range of CNC machining centers covering small to very
large sizes. These machines are technologically more complex than turning machines. Typically, a
CNC machining center has 3 linear movements, one rotary movement, apart from features such as
tool changers, pallet changers etc. Indian machine tools meet the basic requirement of machining
center operations, and a number of models are produced with both horizontal and vertical spindle
configurations.
The current trend in machining centers is to have additional axes of movements to take on complex
machining requirements (sometimes as many as 6 or 7), high traverse rates and spindle speeds
Internationally, machining centers are mostly built with at least 5 axes.
Modern machines incorporate linear motors for high traverse rates, and integral motor spindles are
universally used. At the simpler end of the product spectrum, machines are configured to occupy
very small floor space suitable for line integration for mass production of auto components.
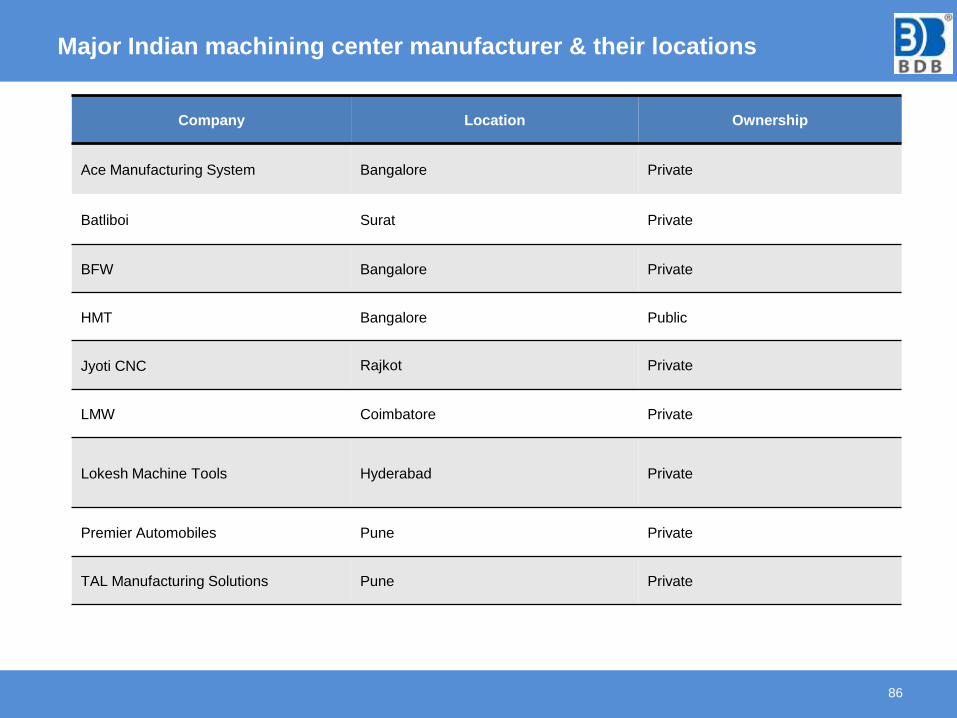
Major Indian machining center manufacturer & their locations
86
Company Location Ownership
Ace Manufacturing System Bangalore Private
Batliboi Surat Private
BFW Bangalore Private
HMT Bangalore Public
Jyoti CNC Rajkot Private
LMW Coimbatore Private
Lokesh Machine Tools Hyderabad Private
Premier Automobiles Pune Private
TAL Manufacturing Solutions Pune Private
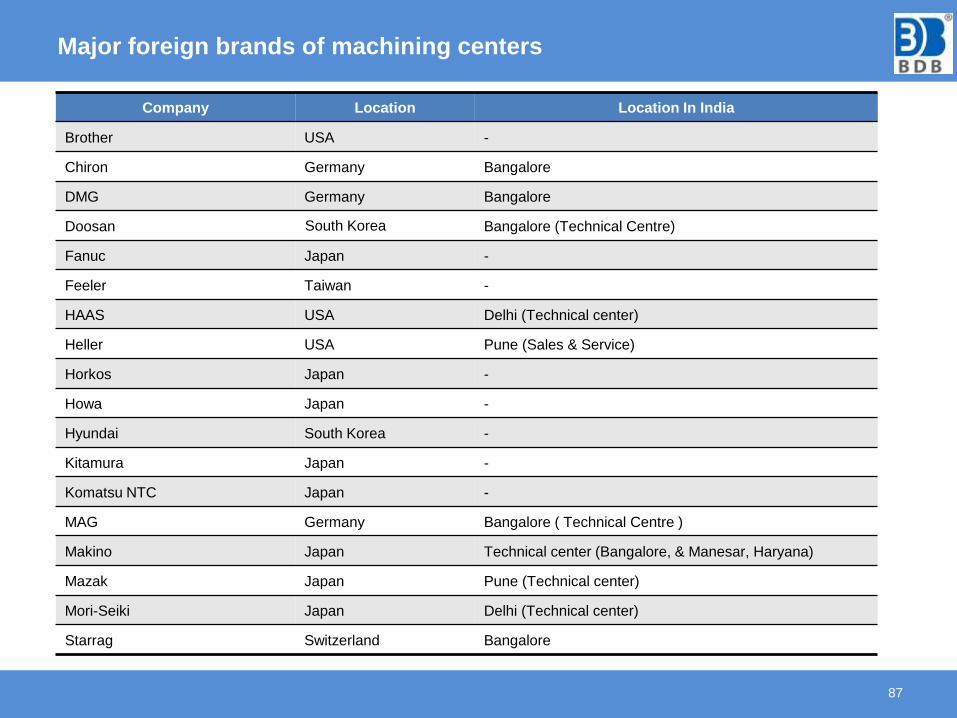
Major foreign brands of machining centers
87
Company Location Location In India
Brother USA -
Chiron Germany Bangalore
DMG Germany Bangalore
Doosan South Korea Bangalore (Technical Centre)
Fanuc Japan -
Feeler Taiwan -
HAAS USA Delhi (Technical center)
Heller USA Pune (Sales & Service)
Horkos Japan -
Howa Japan -
Hyundai South Korea -
Kitamura Japan -
Komatsu NTC Japan -
MAG Germany Bangalore ( Technical Centre )
Makino Japan Technical center (Bangalore, & Manesar, Haryana)
Mazak Japan Pune (Technical center)
Mori-Seiki Japan Delhi (Technical center)
Starrag Switzerland Bangalore
VERTICAL MACHINING CENTER
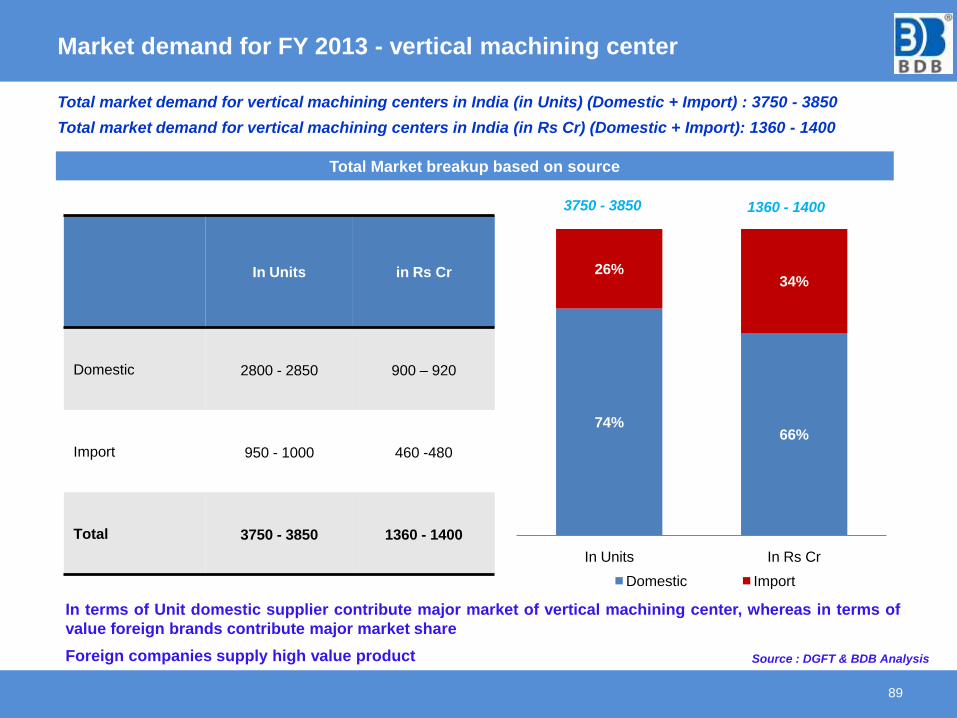
Market demand for FY 2013 - vertical machining center
89
Total market demand for vertical machining centers in India (in Units) (Domestic + Import) : 3750 - 3850
Total market demand for vertical machining centers in India (in Rs Cr) (Domestic + Import): 1360 - 1400
74%66%
26%34%
In Units In Rs Cr
Domestic Import
Total Market breakup based on source
3750 - 3850 1360 - 1400
In terms of Unit domestic supplier contribute major market of vertical machining center, whereas in terms of
value foreign brands contribute major market share
Foreign companies supply high value product
In Units in Rs Cr
Domestic 2800 - 2850 900 – 920
Import 950 - 1000 460 -480
Total 3750 - 3850 1360 - 1400
Source : DGFT & BDB Analysis
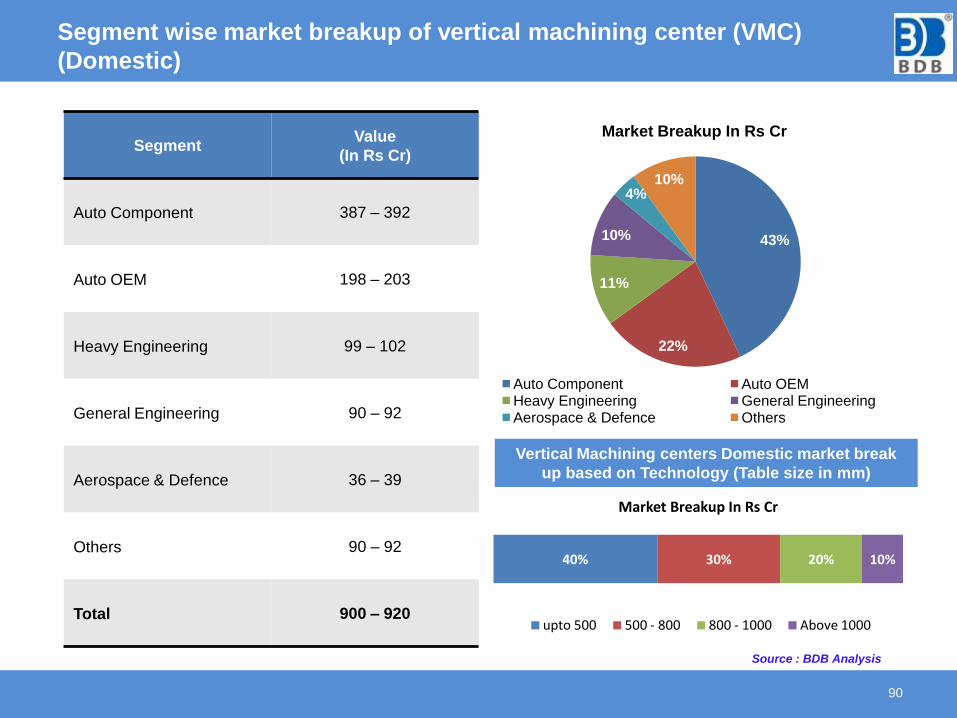
Segment wise market breakup of vertical machining center (VMC)
(Domestic)
90
SegmentValue
(In Rs Cr)
Auto Component 387 – 392
Auto OEM 198 – 203
Heavy Engineering 99 – 102
General Engineering 90 – 92
Aerospace & Defence 36 – 39
Others 90 – 92
Total 900 – 920
43%
22%
11%
10%
4%10%
Market Breakup In Rs Cr
Auto Component Auto OEMHeavy Engineering General EngineeringAerospace & Defence Others
Source : BDB Analysis
Vertical Machining centers Domestic market break
up based on Technology (Table size in mm)
40% 30% 20% 10%
Market Breakup In Rs Cr
upto 500 500 - 800 800 - 1000 Above 1000
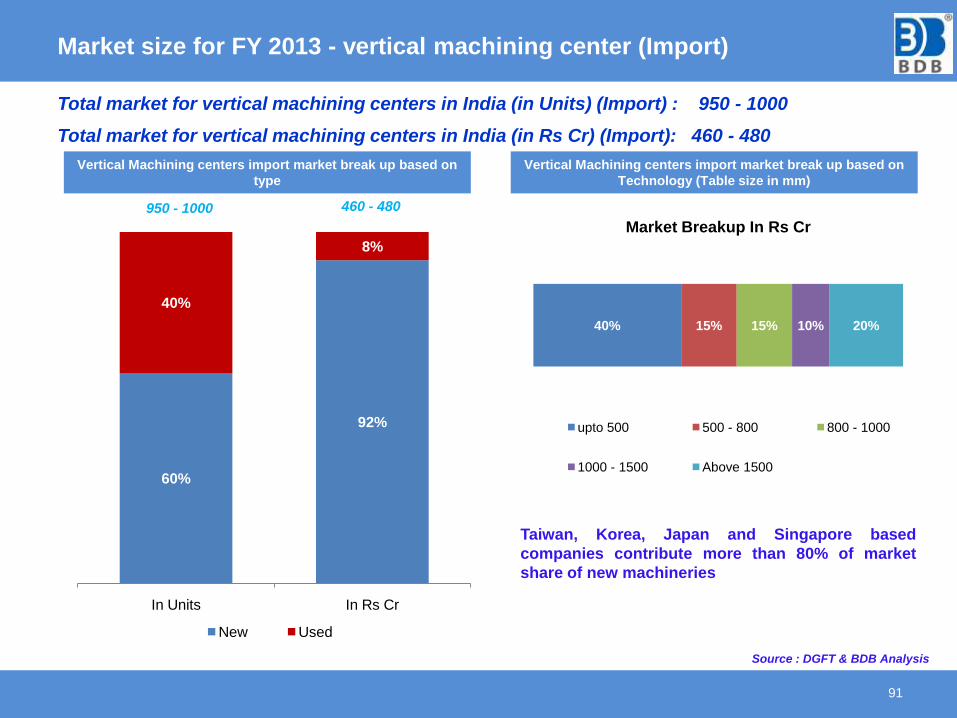
Market size for FY 2013 - vertical machining center (Import)
91
Vertical Machining centers import market break up based on
type
60%
92%
40%
8%
In Units In Rs Cr
New Used
950 - 1000 460 - 480
Total market for vertical machining centers in India (in Units) (Import) : 950 - 1000
Total market for vertical machining centers in India (in Rs Cr) (Import): 460 - 480
Vertical Machining centers import market break up based on
Technology (Table size in mm)
40% 15% 15% 10% 20%
Market Breakup In Rs Cr
upto 500 500 - 800 800 - 1000
1000 - 1500 Above 1500
Taiwan, Korea, Japan and Singapore based
companies contribute more than 80% of market
share of new machineries
Source : DGFT & BDB Analysis
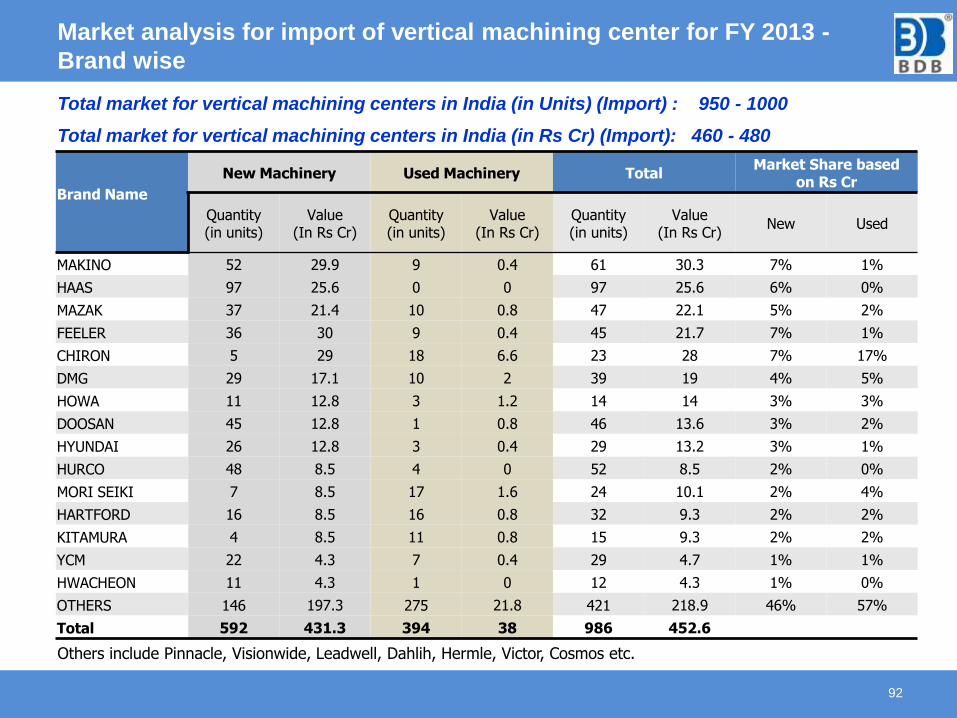
Market analysis for import of vertical machining center for FY 2013 -
Brand wise
92
Brand Name
New Machinery Used Machinery TotalMarket Share based
on Rs Cr
Quantity(in units)
Value (In Rs Cr)
Quantity (in units)
Value (In Rs Cr)
Quantity(in units)
Value (In Rs Cr)
New Used
MAKINO 52 29.9 9 0.4 61 30.3 7% 1%
HAAS 97 25.6 0 0 97 25.6 6% 0%
MAZAK 37 21.4 10 0.8 47 22.1 5% 2%
FEELER 36 30 9 0.4 45 21.7 7% 1%
CHIRON 5 29 18 6.6 23 28 7% 17%
DMG 29 17.1 10 2 39 19 4% 5%
HOWA 11 12.8 3 1.2 14 14 3% 3%
DOOSAN 45 12.8 1 0.8 46 13.6 3% 2%
HYUNDAI 26 12.8 3 0.4 29 13.2 3% 1%
HURCO 48 8.5 4 0 52 8.5 2% 0%
MORI SEIKI 7 8.5 17 1.6 24 10.1 2% 4%
HARTFORD 16 8.5 16 0.8 32 9.3 2% 2%
KITAMURA 4 8.5 11 0.8 15 9.3 2% 2%
YCM 22 4.3 7 0.4 29 4.7 1% 1%
HWACHEON 11 4.3 1 0 12 4.3 1% 0%
OTHERS 146 197.3 275 21.8 421 218.9 46% 57%
Total 592 431.3 394 38 986 452.6
Total market for vertical machining centers in India (in Units) (Import) : 950 - 1000
Total market for vertical machining centers in India (in Rs Cr) (Import): 460 - 480
Others include Pinnacle, Visionwide, Leadwell, Dahlih, Hermle, Victor, Cosmos etc.
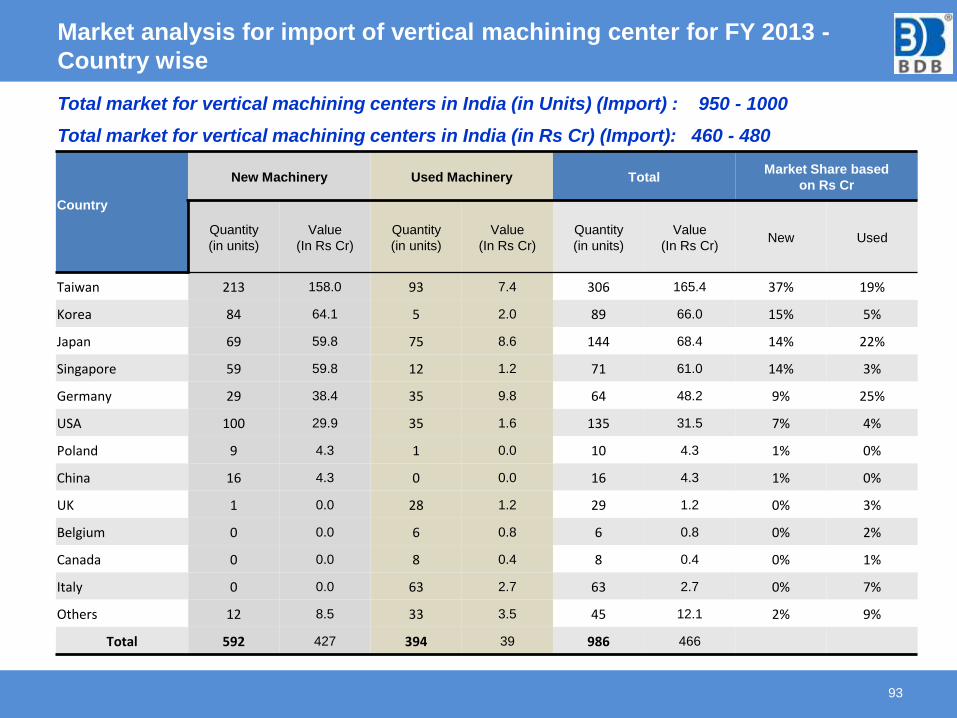
Market analysis for import of vertical machining center for FY 2013 -
Country wise
93
Country
New Machinery Used Machinery TotalMarket Share based
on Rs Cr
Quantity
(in units)
Value
(In Rs Cr)
Quantity
(in units)
Value
(In Rs Cr)
Quantity
(in units)
Value
(In Rs Cr)New Used
Taiwan 213 158.0 93 7.4 306 165.4 37% 19%
Korea 84 64.1 5 2.0 89 66.0 15% 5%
Japan 69 59.8 75 8.6 144 68.4 14% 22%
Singapore 59 59.8 12 1.2 71 61.0 14% 3%
Germany 29 38.4 35 9.8 64 48.2 9% 25%
USA 100 29.9 35 1.6 135 31.5 7% 4%
Poland 9 4.3 1 0.0 10 4.3 1% 0%
China 16 4.3 0 0.0 16 4.3 1% 0%
UK 1 0.0 28 1.2 29 1.2 0% 3%
Belgium 0 0.0 6 0.8 6 0.8 0% 2%
Canada 0 0.0 8 0.4 8 0.4 0% 1%
Italy 0 0.0 63 2.7 63 2.7 0% 7%
Others 12 8.5 33 3.5 45 12.1 2% 9%
Total 592 427 394 39 986 466
Total market for vertical machining centers in India (in Units) (Import) : 950 - 1000
Total market for vertical machining centers in India (in Rs Cr) (Import): 460 - 480
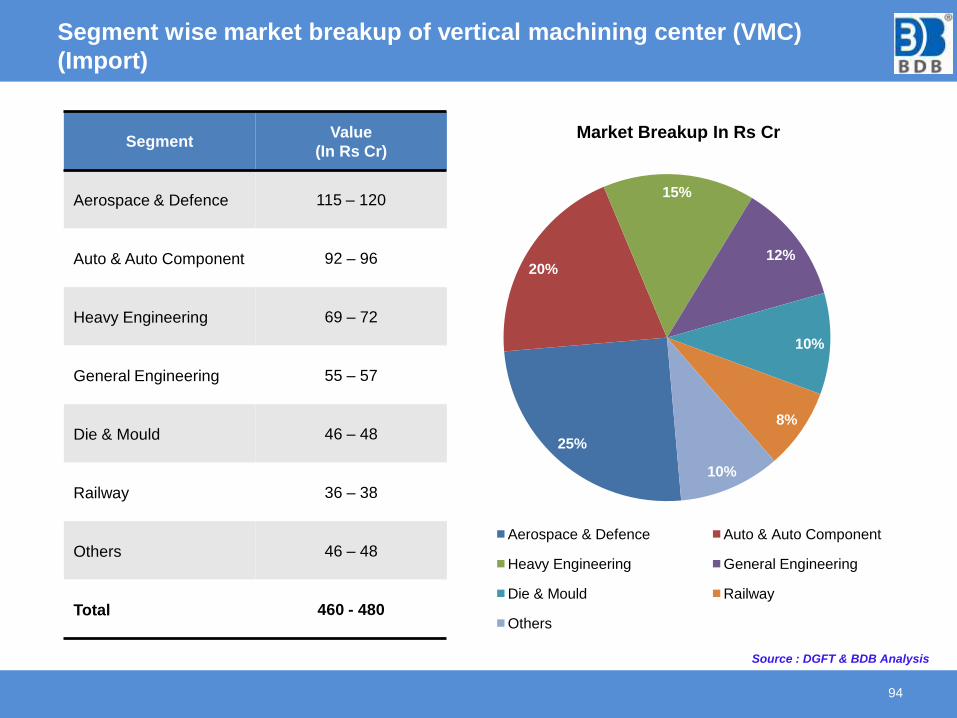
Segment wise market breakup of vertical machining center (VMC)
(Import)
94
SegmentValue
(In Rs Cr)
Aerospace & Defence 115 – 120
Auto & Auto Component 92 – 96
Heavy Engineering 69 – 72
General Engineering 55 – 57
Die & Mould 46 – 48
Railway 36 – 38
Others 46 – 48
Total 460 - 480
25%
20%
15%
12%
10%
8%
10%
Market Breakup In Rs Cr
Aerospace & Defence Auto & Auto Component
Heavy Engineering General Engineering
Die & Mould Railway
Others
Source : DGFT & BDB Analysis
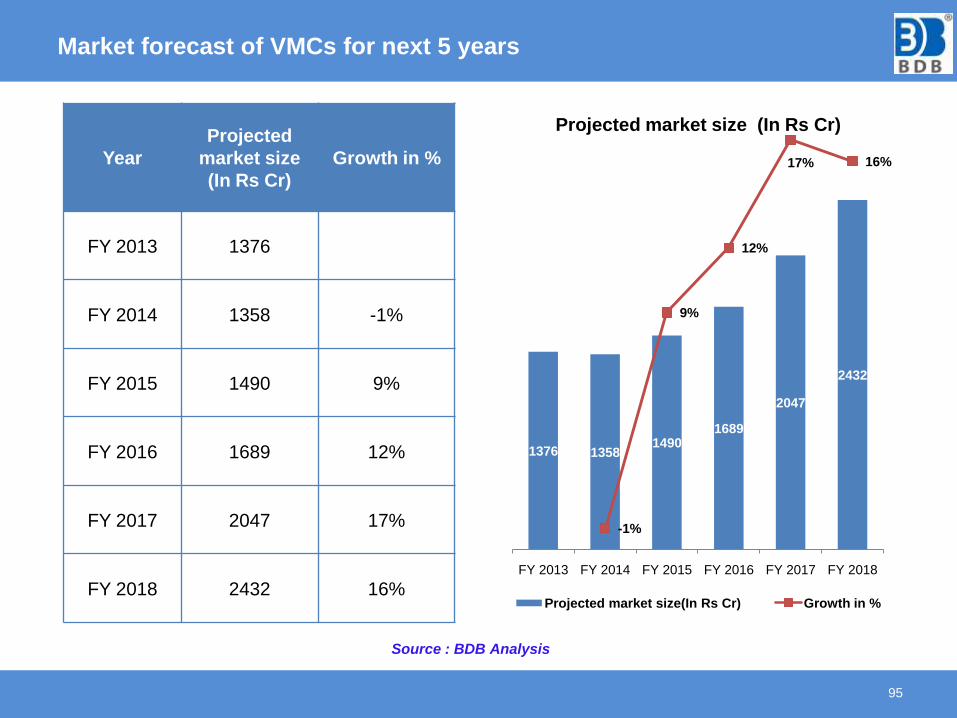
Market forecast of VMCs for next 5 years
95
Year
Projected
market size
(In Rs Cr)
Growth in %
FY 2013 1376
FY 2014 1358 -1%
FY 2015 1490 9%
FY 2016 1689 12%
FY 2017 2047 17%
FY 2018 2432 16%
1376 13581490
1689
2047
2432
-1%
9%
12%
17% 16%
-0.02
0
0.02
0.04
0.06
0.08
0.1
0.12
0.14
0.16
0.18
0
500
1000
1500
2000
2500
3000
FY 2013 FY 2014 FY 2015 FY 2016 FY 2017 FY 2018
Projected market size (In Rs Cr)
Projected market size(In Rs Cr) Growth in %
Source : BDB Analysis
HORIZONTAL MACHINING CENTER

Market demand for FY 2013 - horizontal machining center
97
Total market demand for horizontal machining centers in India (in Units) (Domestic + Import ) : 760 - 800
Total market demand for horizontal machining centers in India (in Rs Cr) (Domestic + Import): 1125 - 1145
34%
23%
66%
77%
In Units In Rs Cr
Domestic Import
760 - 800 1125 - 1145
Horizontal Machining centers market break up based on source
In Units in Rs Cr
Domestic 260 - 280 255 - 265
Import 500 - 520 870 - 880
Total 760 - 800 1125 - 1145
Source : DGFT & BDB Analysis
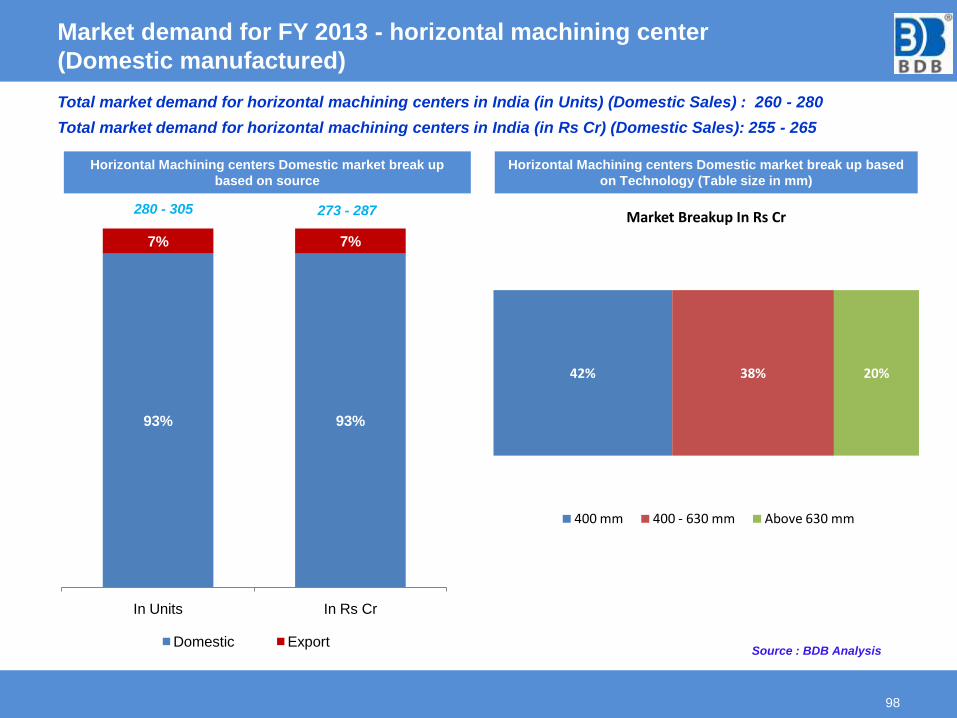
Market demand for FY 2013 - horizontal machining center
(Domestic manufactured)
98
Total market demand for horizontal machining centers in India (in Units) (Domestic Sales) : 260 - 280
Total market demand for horizontal machining centers in India (in Rs Cr) (Domestic Sales): 255 - 265
93% 93%
7% 7%
In Units In Rs Cr
Domestic Export
280 - 305 273 - 287
42% 38% 20%
Market Breakup In Rs Cr
400 mm 400 - 630 mm Above 630 mm
Horizontal Machining centers Domestic market break up
based on source
Horizontal Machining centers Domestic market break up based
on Technology (Table size in mm)
Source : BDB Analysis
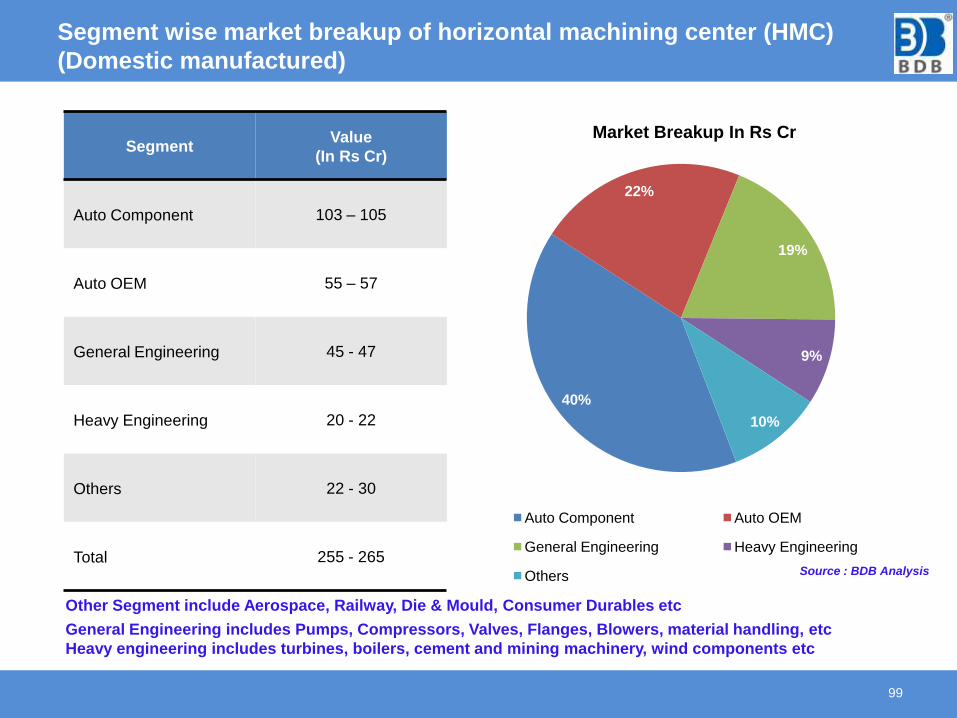
Segment wise market breakup of horizontal machining center (HMC)
(Domestic manufactured)
99
40%
22%
19%
9%
10%
Market Breakup In Rs Cr
Auto Component Auto OEM
General Engineering Heavy Engineering
Others
SegmentValue
(In Rs Cr)
Auto Component 103 – 105
Auto OEM 55 – 57
General Engineering 45 - 47
Heavy Engineering 20 - 22
Others 22 - 30
Total 255 - 265
Other Segment include Aerospace, Railway, Die & Mould, Consumer Durables etc
General Engineering includes Pumps, Compressors, Valves, Flanges, Blowers, material handling, etc
Heavy engineering includes turbines, boilers, cement and mining machinery, wind components etc
Source : BDB Analysis
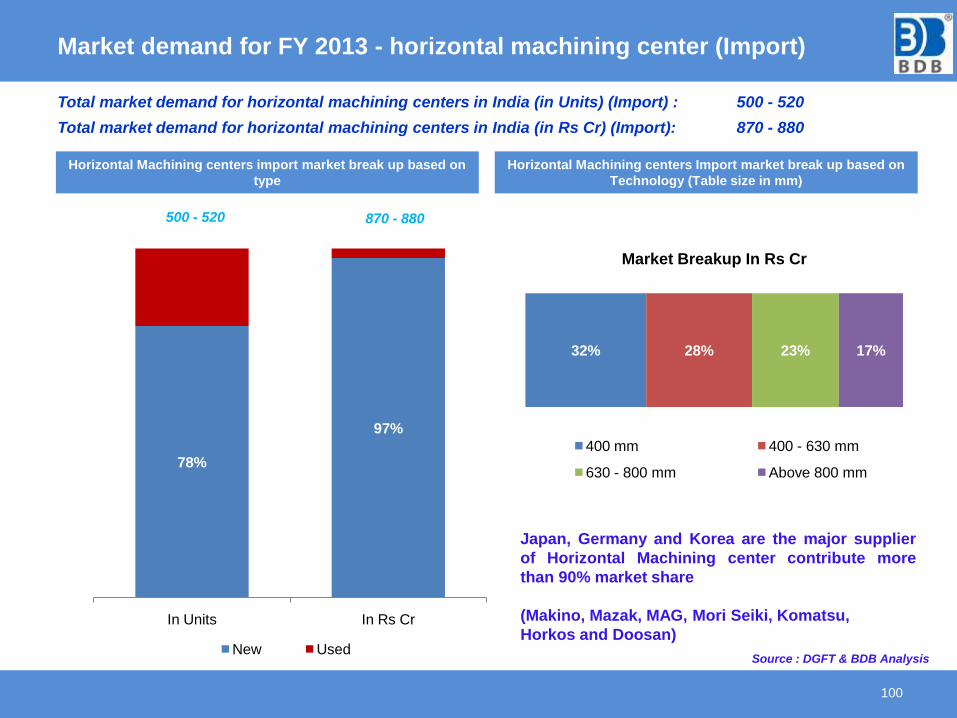
Market demand for FY 2013 - horizontal machining center (Import)
100
Horizontal Machining centers import market break up based on
type
78%
97%
In Units In Rs Cr
New Used
500 - 520 870 - 880
Total market demand for horizontal machining centers in India (in Units) (Import) : 500 - 520
Total market demand for horizontal machining centers in India (in Rs Cr) (Import): 870 - 880
32% 28% 23% 17%
Market Breakup In Rs Cr
400 mm 400 - 630 mm
630 - 800 mm Above 800 mm
Horizontal Machining centers Import market break up based on
Technology (Table size in mm)
Japan, Germany and Korea are the major supplier
of Horizontal Machining center contribute more
than 90% market share
(Makino, Mazak, MAG, Mori Seiki, Komatsu,
Horkos and Doosan)
Source : DGFT & BDB Analysis
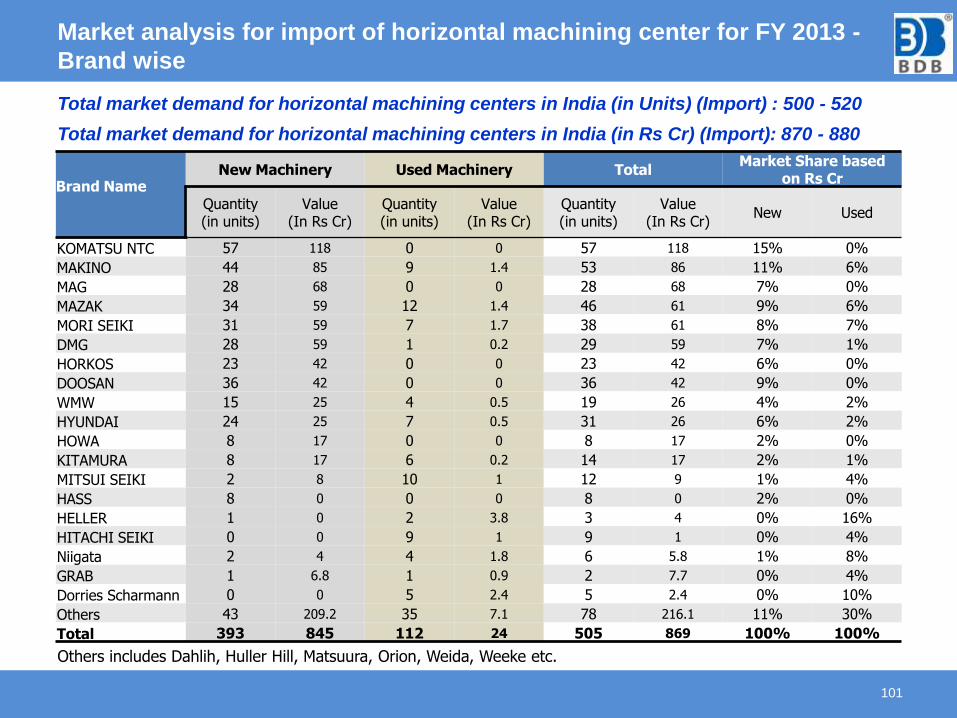
Market analysis for import of horizontal machining center for FY 2013 -
Brand wise
101
Brand Name New Machinery Used Machinery Total
Market Share based on Rs Cr
Quantity(in units)
Value (In Rs Cr)
Quantity (in units)
Value (In Rs Cr)
Quantity(in units)
Value (In Rs Cr)
New Used
KOMATSU NTC 57 118 0 0 57 118 15% 0%
MAKINO 44 85 9 1.4 53 86 11% 6%
MAG 28 68 0 0 28 68 7% 0%
MAZAK 34 59 12 1.4 46 61 9% 6%
MORI SEIKI 31 59 7 1.7 38 61 8% 7%
DMG 28 59 1 0.2 29 59 7% 1%
HORKOS 23 42 0 0 23 42 6% 0%
DOOSAN 36 42 0 0 36 42 9% 0%
WMW 15 25 4 0.5 19 26 4% 2%
HYUNDAI 24 25 7 0.5 31 26 6% 2%
HOWA 8 17 0 0 8 17 2% 0%
KITAMURA 8 17 6 0.2 14 17 2% 1%
MITSUI SEIKI 2 8 10 1 12 9 1% 4%
HASS 8 0 0 0 8 0 2% 0%
HELLER 1 0 2 3.8 3 4 0% 16%
HITACHI SEIKI 0 0 9 1 9 1 0% 4%
Niigata 2 4 4 1.8 6 5.8 1% 8%
GRAB 1 6.8 1 0.9 2 7.7 0% 4%
Dorries Scharmann 0 0 5 2.4 5 2.4 0% 10%
Others 43 209.2 35 7.1 78 216.1 11% 30%
Total 393 845 112 24 505 869 100% 100%
Total market demand for horizontal machining centers in India (in Units) (Import) : 500 - 520
Total market demand for horizontal machining centers in India (in Rs Cr) (Import): 870 - 880
Others includes Dahlih, Huller Hill, Matsuura, Orion, Weida, Weeke etc.
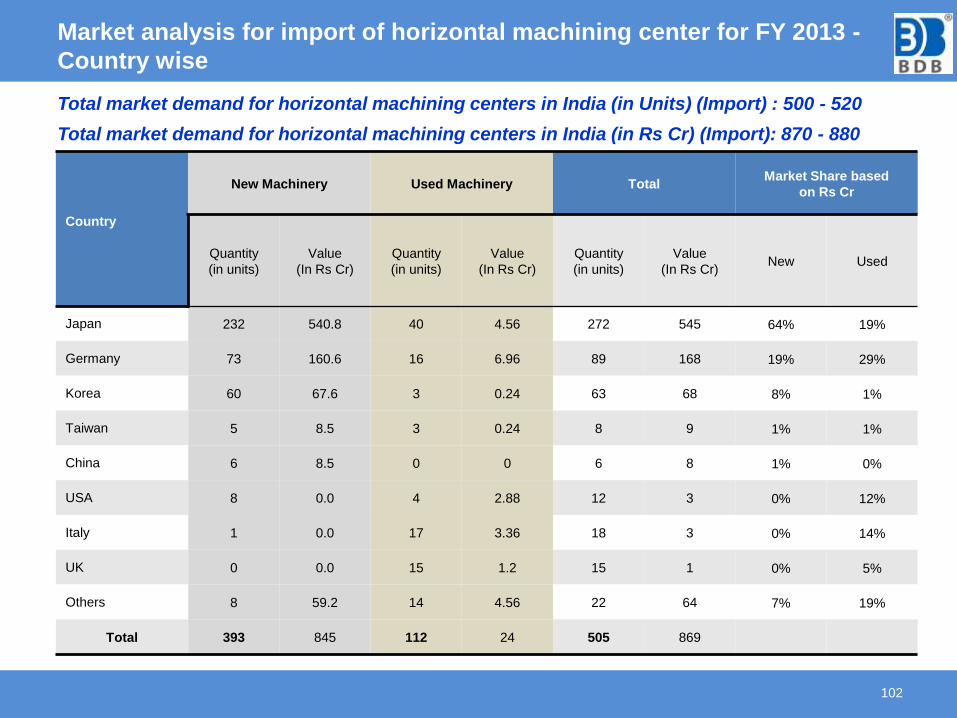
Market analysis for import of horizontal machining center for FY 2013 -
Country wise
102
Country
New Machinery Used Machinery TotalMarket Share based
on Rs Cr
Quantity
(in units)
Value
(In Rs Cr)
Quantity
(in units)
Value
(In Rs Cr)
Quantity
(in units)
Value
(In Rs Cr)New Used
Japan 232 540.8 40 4.56 272 545 64% 19%
Germany 73 160.6 16 6.96 89 168 19% 29%
Korea 60 67.6 3 0.24 63 68 8% 1%
Taiwan 5 8.5 3 0.24 8 9 1% 1%
China 6 8.5 0 0 6 8 1% 0%
USA 8 0.0 4 2.88 12 3 0% 12%
Italy 1 0.0 17 3.36 18 3 0% 14%
UK 0 0.0 15 1.2 15 1 0% 5%
Others 8 59.2 14 4.56 22 64 7% 19%
Total 393 845 112 24 505 869
Total market demand for horizontal machining centers in India (in Units) (Import) : 500 - 520
Total market demand for horizontal machining centers in India (in Rs Cr) (Import): 870 - 880
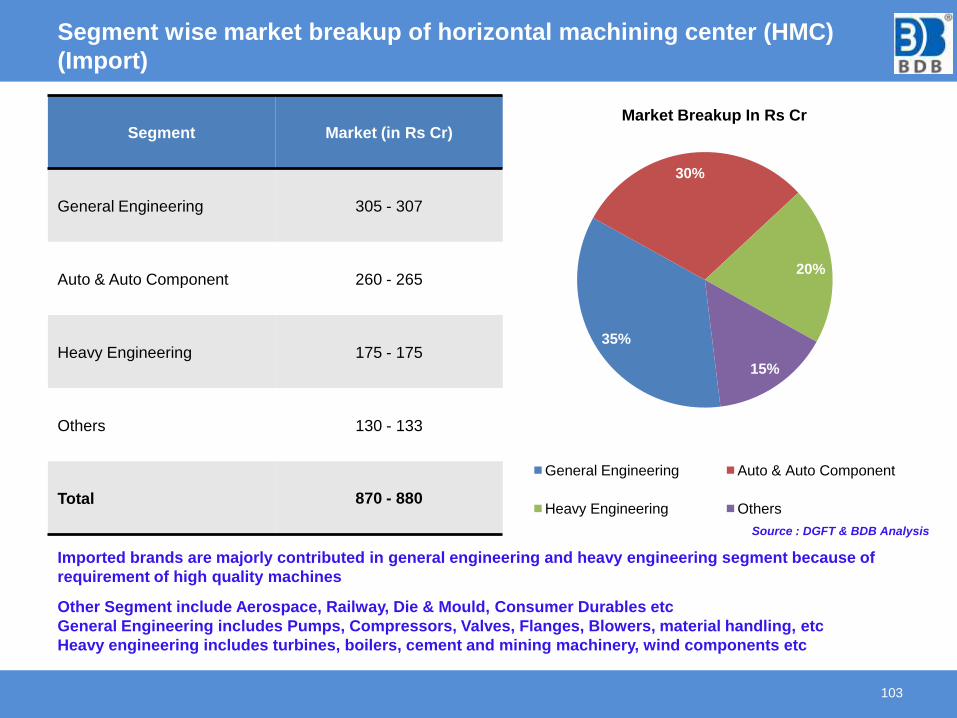
Segment wise market breakup of horizontal machining center (HMC)
(Import)
103
Segment Market (in Rs Cr)
General Engineering 305 - 307
Auto & Auto Component 260 - 265
Heavy Engineering 175 - 175
Others 130 - 133
Total 870 - 880
35%
30%
20%
15%
Market Breakup In Rs Cr
General Engineering Auto & Auto Component
Heavy Engineering Others
Imported brands are majorly contributed in general engineering and heavy engineering segment because of
requirement of high quality machines
Other Segment include Aerospace, Railway, Die & Mould, Consumer Durables etc
General Engineering includes Pumps, Compressors, Valves, Flanges, Blowers, material handling, etc
Heavy engineering includes turbines, boilers, cement and mining machinery, wind components etc
Source : DGFT & BDB Analysis
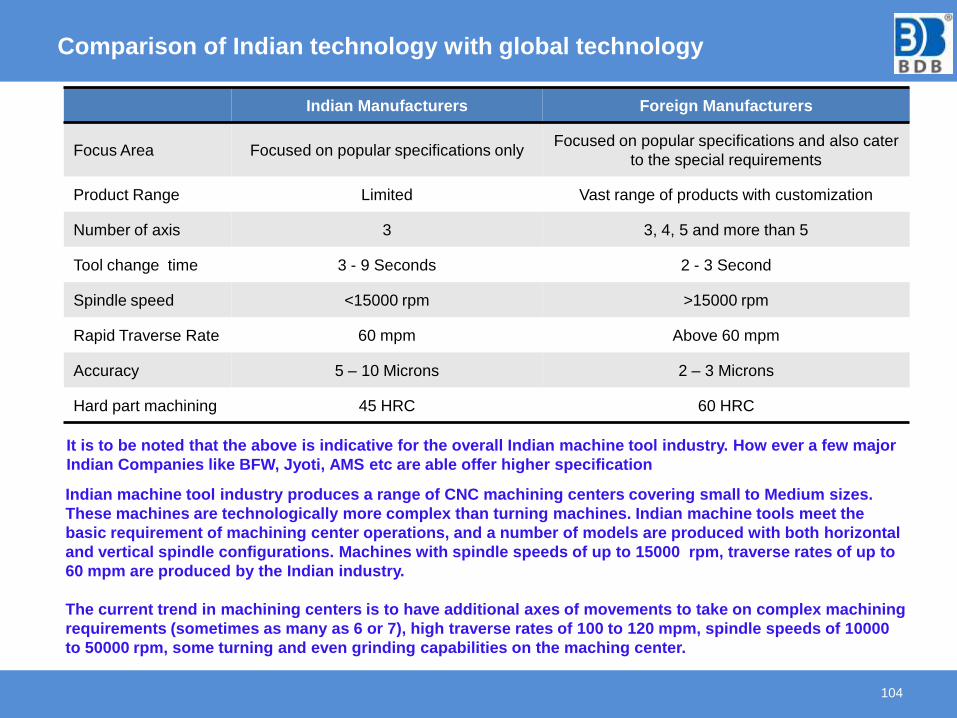
Comparison of Indian technology with global technology
104
Indian Manufacturers Foreign Manufacturers
Focus Area Focused on popular specifications onlyFocused on popular specifications and also cater
to the special requirements
Product Range Limited Vast range of products with customization
Number of axis 3 3, 4, 5 and more than 5
Tool change time 3 - 9 Seconds 2 - 3 Second
Spindle speed <15000 rpm >15000 rpm
Rapid Traverse Rate 60 mpm Above 60 mpm
Accuracy 5 – 10 Microns 2 – 3 Microns
Hard part machining 45 HRC 60 HRC
It is to be noted that the above is indicative for the overall Indian machine tool industry. How ever a few major
Indian Companies like BFW, Jyoti, AMS etc are able offer higher specification
Indian machine tool industry produces a range of CNC machining centers covering small to Medium sizes.
These machines are technologically more complex than turning machines. Indian machine tools meet the
basic requirement of machining center operations, and a number of models are produced with both horizontal
and vertical spindle configurations. Machines with spindle speeds of up to 15000 rpm, traverse rates of up to
60 mpm are produced by the Indian industry.
The current trend in machining centers is to have additional axes of movements to take on complex machining
requirements (sometimes as many as 6 or 7), high traverse rates of 100 to 120 mpm, spindle speeds of 10000
to 50000 rpm, some turning and even grinding capabilities on the maching center.
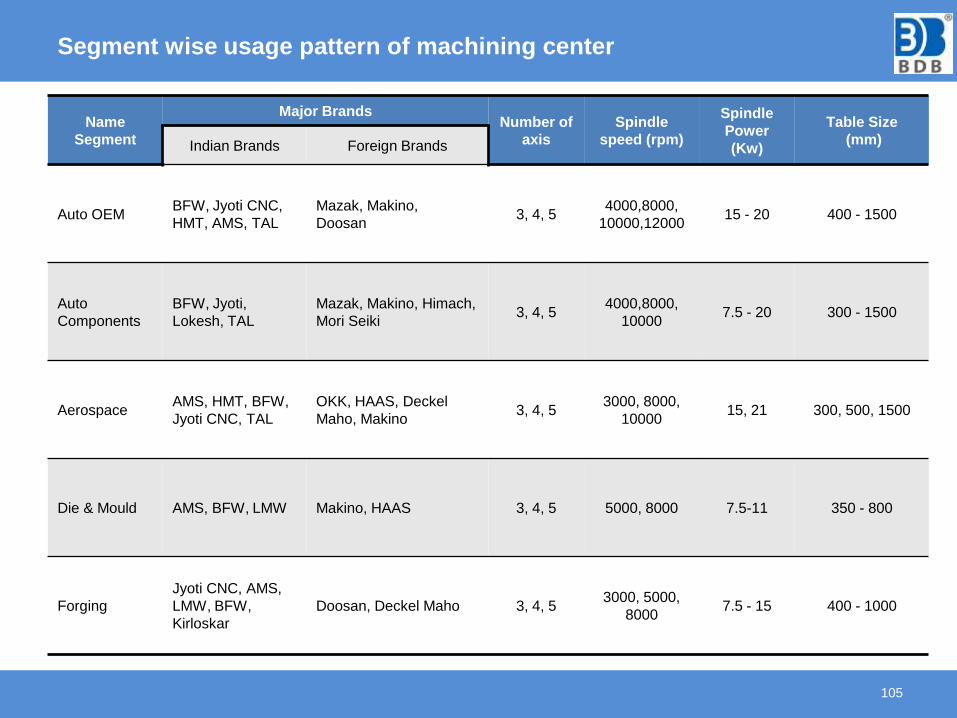
Segment wise usage pattern of machining center
105
Name
Segment
Major BrandsNumber of
axis
Spindle
speed (rpm)
Spindle
Power
(Kw)
Table Size
(mm)Indian Brands Foreign Brands
Auto OEMBFW, Jyoti CNC,
HMT, AMS, TAL
Mazak, Makino,
Doosan3, 4, 5
4000,8000,
10000,1200015 - 20 400 - 1500
Auto
Components
BFW, Jyoti,
Lokesh, TAL
Mazak, Makino, Himach,
Mori Seiki3, 4, 5
4000,8000,
100007.5 - 20 300 - 1500
AerospaceAMS, HMT, BFW,
Jyoti CNC, TAL
OKK, HAAS, Deckel
Maho, Makino3, 4, 5
3000, 8000,
1000015, 21 300, 500, 1500
Die & Mould AMS, BFW, LMW Makino, HAAS 3, 4, 5 5000, 8000 7.5-11 350 - 800
Forging
Jyoti CNC, AMS,
LMW, BFW,
Kirloskar
Doosan, Deckel Maho 3, 4, 53000, 5000,
80007.5 - 15 400 - 1000
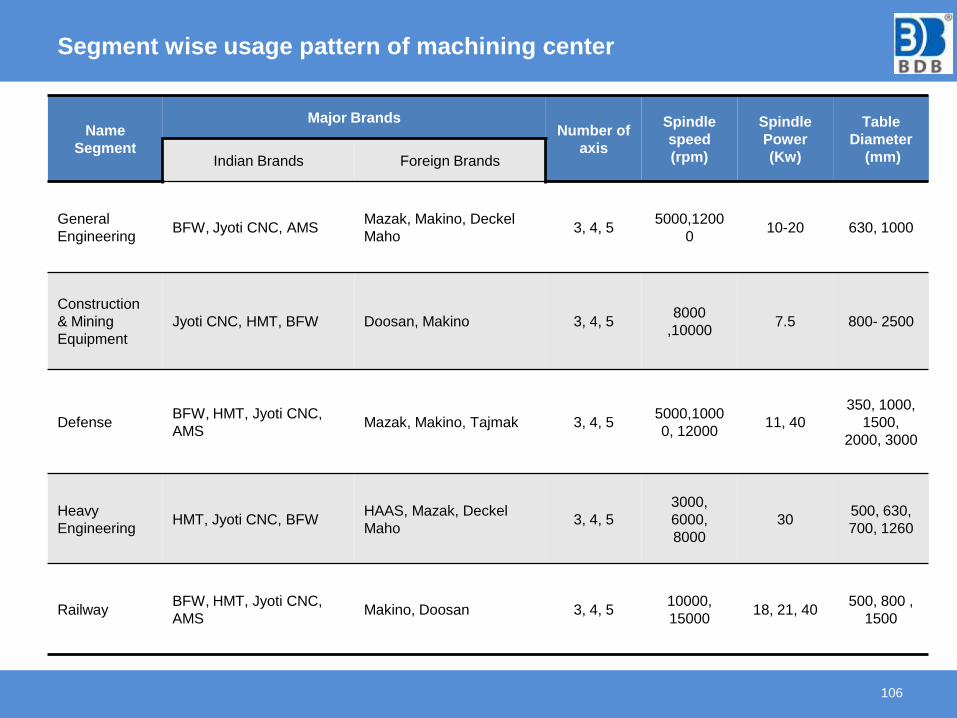
Segment wise usage pattern of machining center
Name
Segment
Major BrandsNumber of
axis
Spindle
speed
(rpm)
Spindle
Power
(Kw)
Table
Diameter
(mm)Indian Brands Foreign Brands
General
Engineering BFW, Jyoti CNC, AMS
Mazak, Makino, Deckel
Maho3, 4, 5
5000,1200
010-20 630, 1000
Construction
& Mining
Equipment
Jyoti CNC, HMT, BFW Doosan, Makino 3, 4, 58000
,100007.5 800- 2500
DefenseBFW, HMT, Jyoti CNC,
AMSMazak, Makino, Tajmak 3, 4, 5
5000,1000
0, 1200011, 40
350, 1000,
1500,
2000, 3000
Heavy
EngineeringHMT, Jyoti CNC, BFW
HAAS, Mazak, Deckel
Maho3, 4, 5
3000,
6000,
8000
30500, 630,
700, 1260
RailwayBFW, HMT, Jyoti CNC,
AMSMakino, Doosan 3, 4, 5
10000,
1500018, 21, 40
500, 800 ,
1500
106
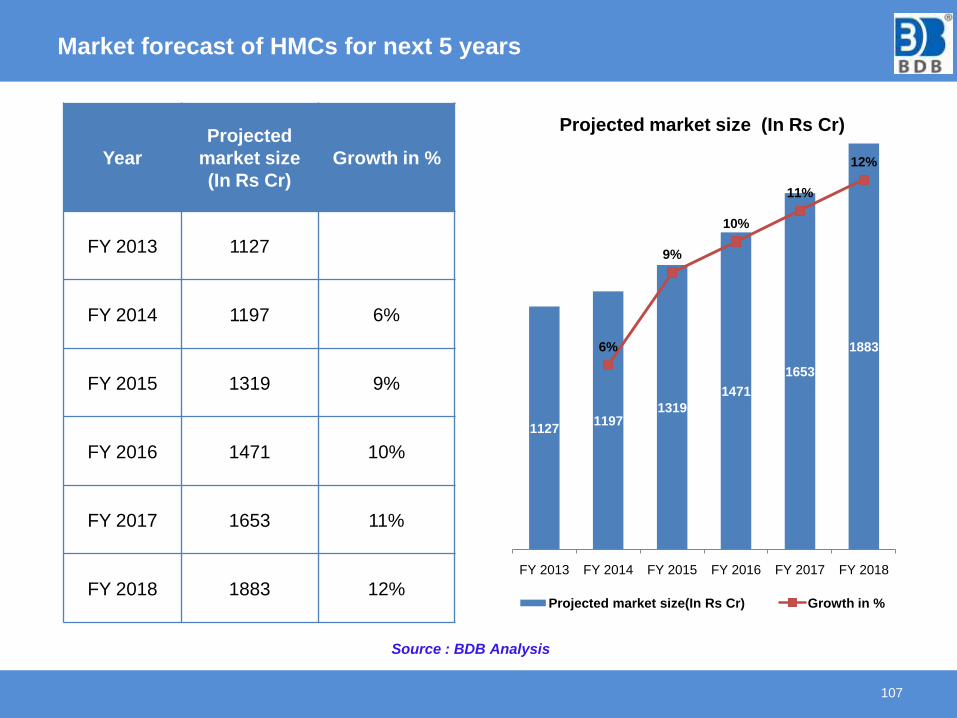
Market forecast of HMCs for next 5 years
107
Year
Projected
market size
(In Rs Cr)
Growth in %
FY 2013 1127
FY 2014 1197 6%
FY 2015 1319 9%
FY 2016 1471 10%
FY 2017 1653 11%
FY 2018 1883 12%
Source : BDB Analysis
11271197
1319
1471
1653
18836%
9%
10%
11%
12%
0
0.02
0.04
0.06
0.08
0.1
0.12
0.14
0
200
400
600
800
1000
1200
1400
1600
1800
2000
FY 2013 FY 2014 FY 2015 FY 2016 FY 2017 FY 2018
Projected market size (In Rs Cr)
Projected market size(In Rs Cr) Growth in %

MARKET SIZE ANALYSIS OF
MILLING MACHINE
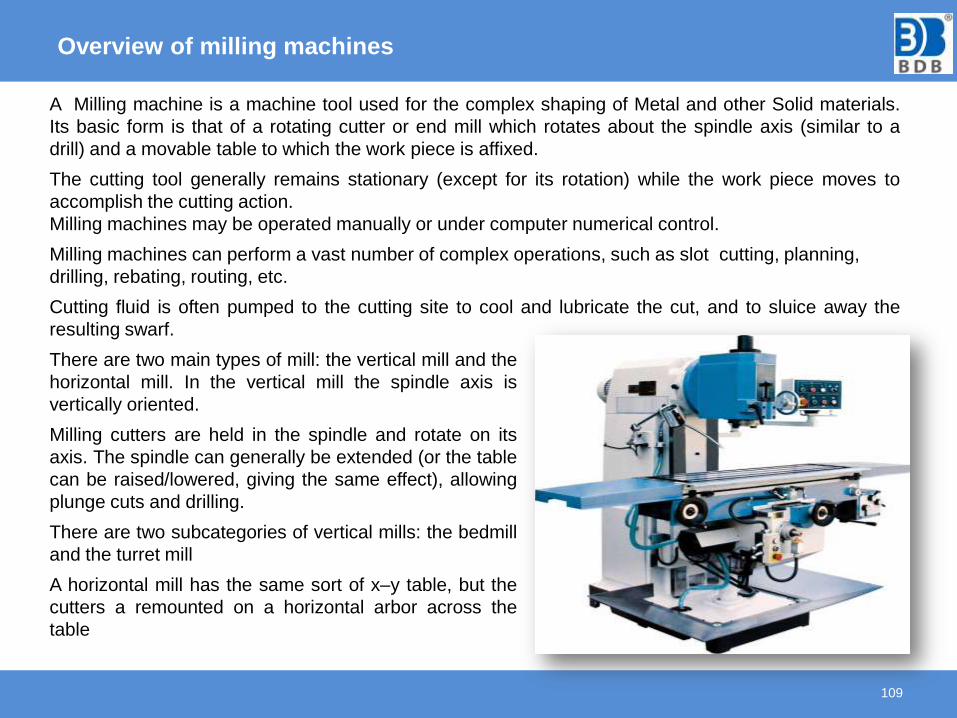
Overview of milling machines
109
A Milling machine is a machine tool used for the complex shaping of Metal and other Solid materials.
Its basic form is that of a rotating cutter or end mill which rotates about the spindle axis (similar to a
drill) and a movable table to which the work piece is affixed.
The cutting tool generally remains stationary (except for its rotation) while the work piece moves to
accomplish the cutting action.
Milling machines may be operated manually or under computer numerical control.
Milling machines can perform a vast number of complex operations, such as slot cutting, planning,
drilling, rebating, routing, etc.
Cutting fluid is often pumped to the cutting site to cool and lubricate the cut, and to sluice away the
resulting swarf.
There are two main types of mill: the vertical mill and the
horizontal mill. In the vertical mill the spindle axis is
vertically oriented.
Milling cutters are held in the spindle and rotate on its
axis. The spindle can generally be extended (or the table
can be raised/lowered, giving the same effect), allowing
plunge cuts and drilling.
There are two subcategories of vertical mills: the bedmill
and the turret mill
A horizontal mill has the same sort of x–y table, but the
cutters a remounted on a horizontal arbor across the
table
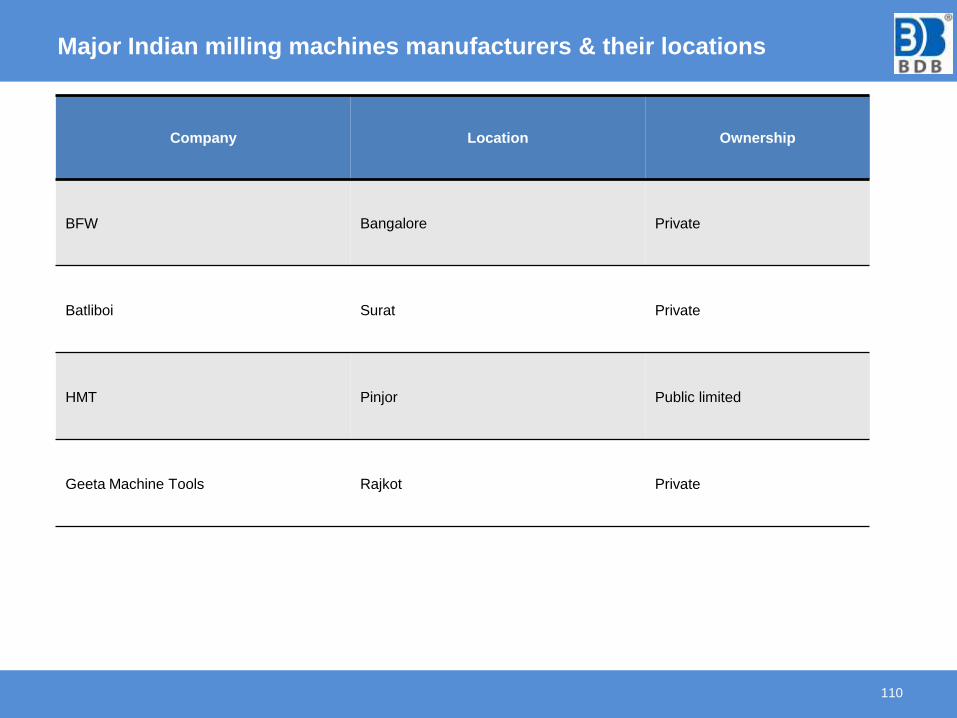
Major Indian milling machines manufacturers & their locations
110
Company Location Ownership
BFW Bangalore Private
Batliboi Surat Private
HMT Pinjor Public limited
Geeta Machine Tools Rajkot Private
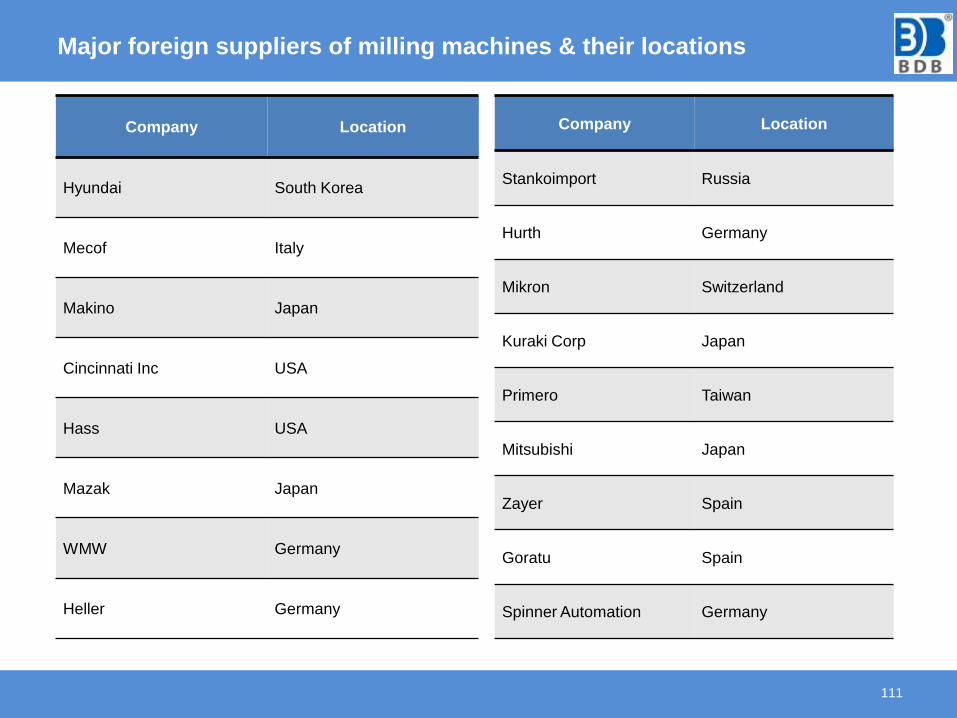
Major foreign suppliers of milling machines & their locations
111
Company Location
Hyundai South Korea
Mecof Italy
Makino Japan
Cincinnati Inc USA
Hass USA
Mazak Japan
WMW Germany
Heller Germany
Company Location
Stankoimport Russia
Hurth Germany
Mikron Switzerland
Kuraki Corp Japan
Primero Taiwan
Mitsubishi Japan
Zayer Spain
Goratu Spain
Spinner Automation Germany
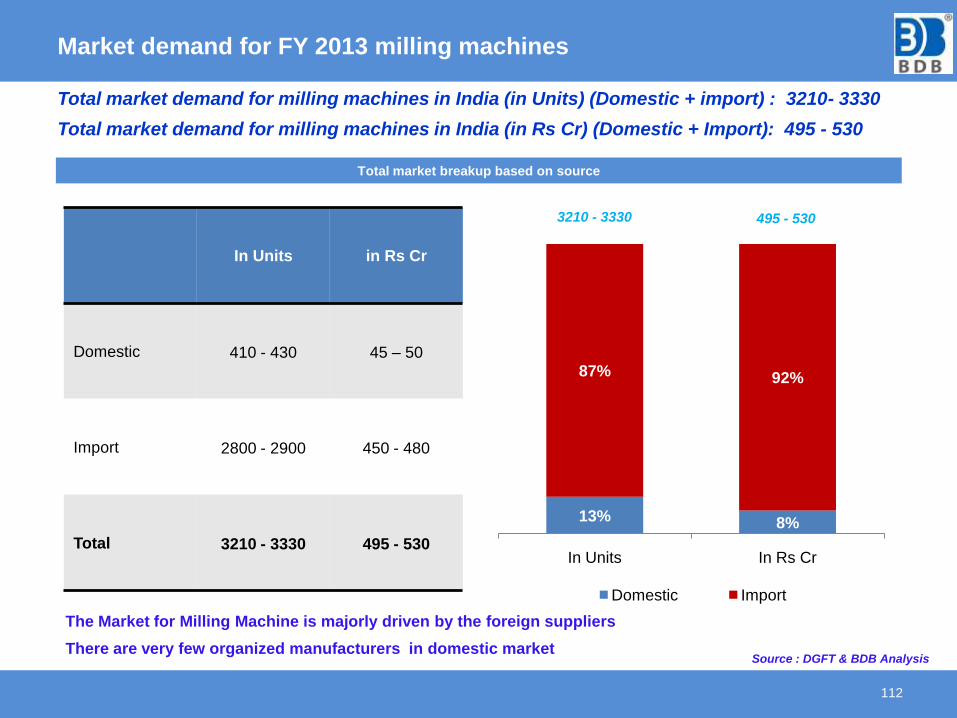
Market demand for FY 2013 milling machines
112
Total market demand for milling machines in India (in Units) (Domestic + import) : 3210- 3330
Total market demand for milling machines in India (in Rs Cr) (Domestic + Import): 495 - 530
13% 8%
87% 92%
In Units In Rs Cr
Domestic Import
3210 - 3330 495 - 530
Total market breakup based on source
The Market for Milling Machine is majorly driven by the foreign suppliers
There are very few organized manufacturers in domestic market
In Units in Rs Cr
Domestic 410 - 430 45 – 50
Import 2800 - 2900 450 - 480
Total 3210 - 3330 495 - 530
Source : DGFT & BDB Analysis
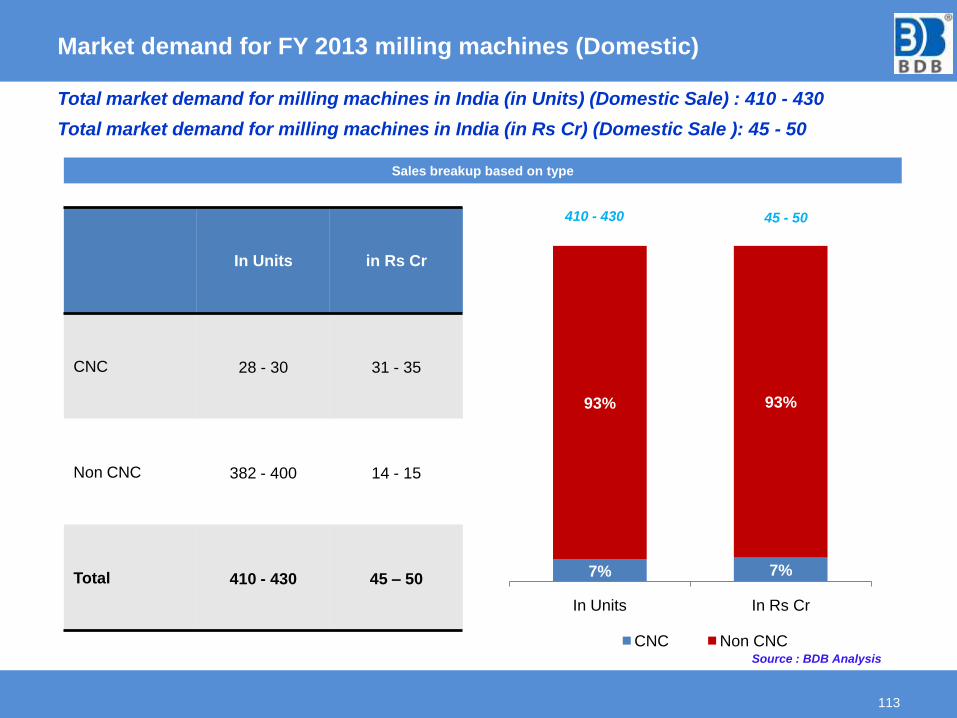
Market demand for FY 2013 milling machines (Domestic)
113
Total market demand for milling machines in India (in Units) (Domestic Sale) : 410 - 430
Total market demand for milling machines in India (in Rs Cr) (Domestic Sale ): 45 - 50
7% 7%
93% 93%
In Units In Rs Cr
CNC Non CNC
Sales breakup based on type
410 - 430 45 - 50
Source : BDB Analysis
In Units in Rs Cr
CNC 28 - 30 31 - 35
Non CNC 382 - 400 14 - 15
Total 410 - 430 45 – 50
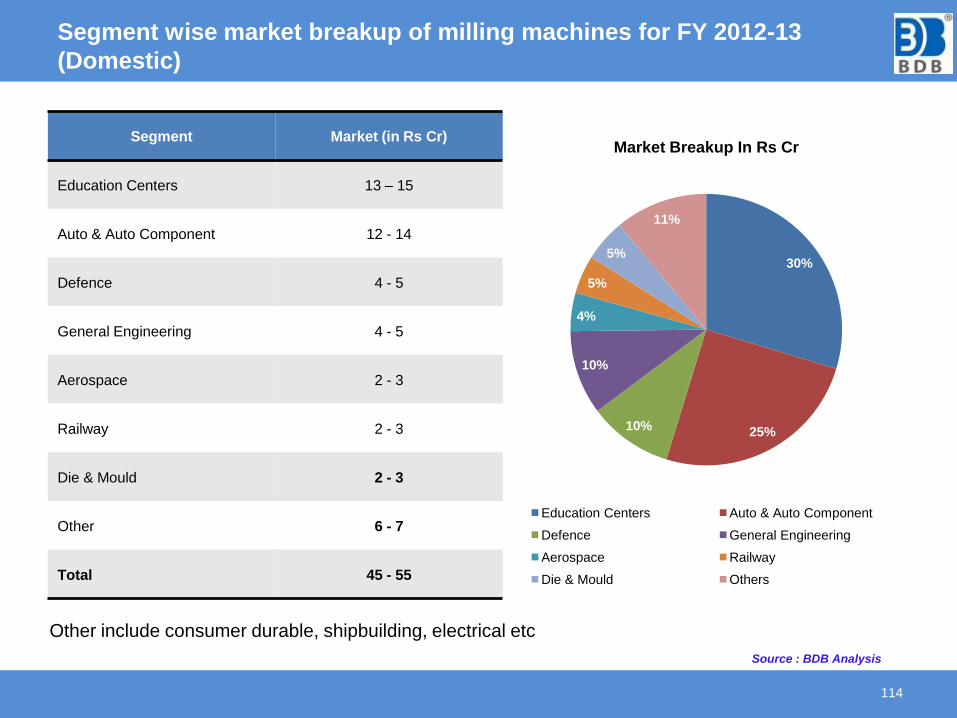
Segment wise market breakup of milling machines for FY 2012-13
(Domestic)
114
Segment Market (in Rs Cr)
Education Centers 13 – 15
Auto & Auto Component 12 - 14
Defence 4 - 5
General Engineering 4 - 5
Aerospace 2 - 3
Railway 2 - 3
Die & Mould 2 - 3
Other 6 - 7
Total 45 - 55
Other include consumer durable, shipbuilding, electrical etc
Source : BDB Analysis
30%
25%10%
10%
4%
5%
5%
11%
Market Breakup In Rs Cr
Education Centers Auto & Auto Component
Defence General Engineering
Aerospace Railway
Die & Mould Others
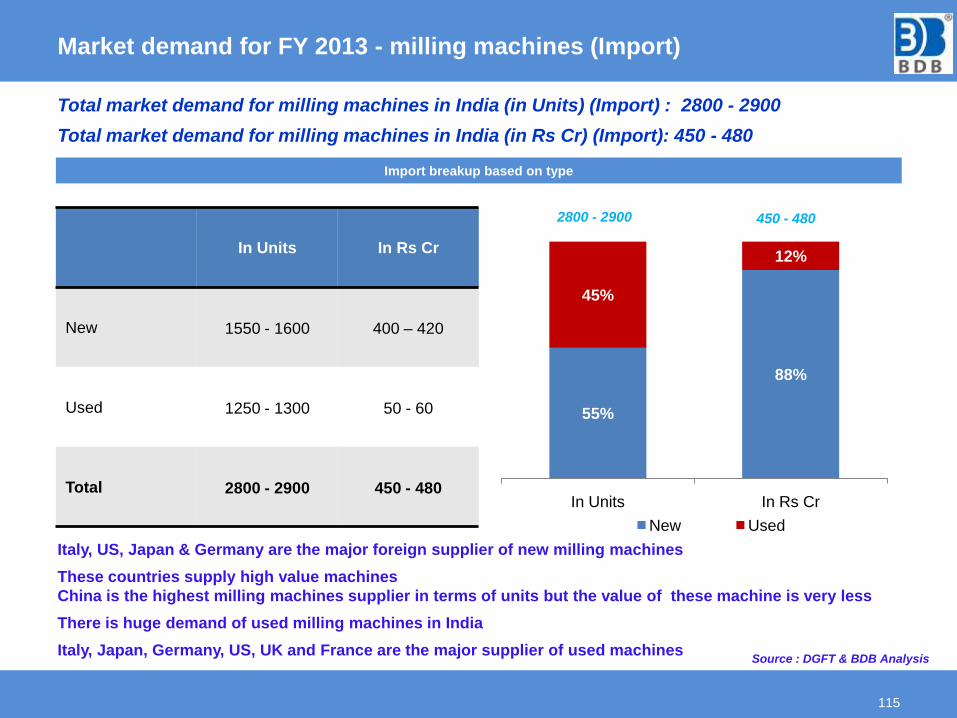
Market demand for FY 2013 - milling machines (Import)
115
Total market demand for milling machines in India (in Units) (Import) : 2800 - 2900
Total market demand for milling machines in India (in Rs Cr) (Import): 450 - 480
55%
88%
45%
12%
In Units In Rs Cr
New Used
2800 - 2900 450 - 480
Import breakup based on type
Italy, US, Japan & Germany are the major foreign supplier of new milling machines
These countries supply high value machines
China is the highest milling machines supplier in terms of units but the value of these machine is very less
There is huge demand of used milling machines in India
Italy, Japan, Germany, US, UK and France are the major supplier of used machines
In Units In Rs Cr
New 1550 - 1600 400 – 420
Used 1250 - 1300 50 - 60
Total 2800 - 2900 450 - 480
Source : DGFT & BDB Analysis
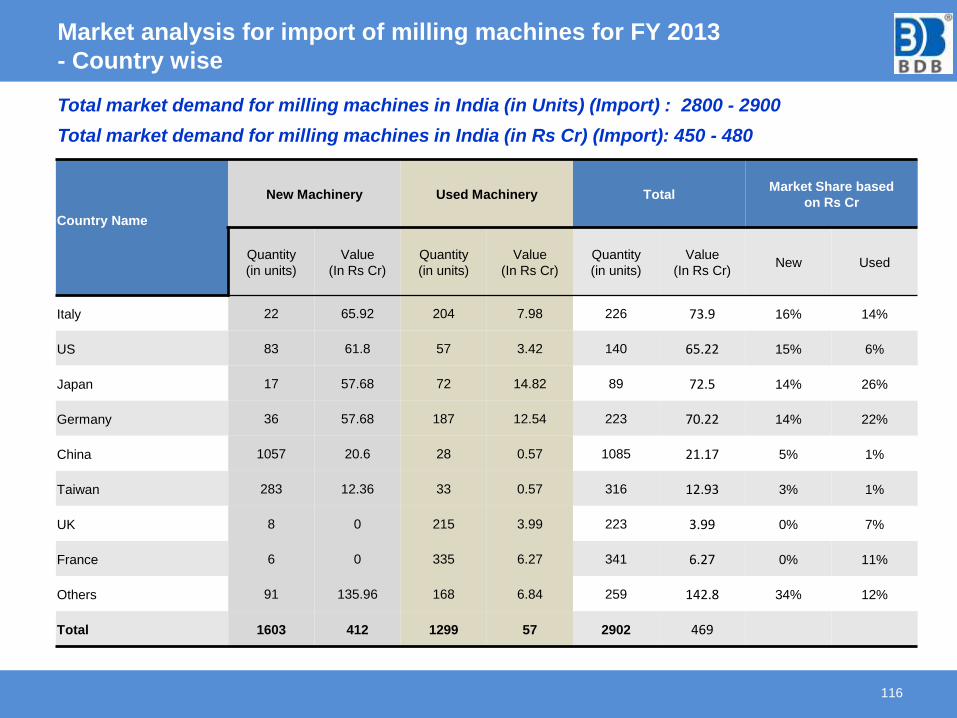
Market analysis for import of milling machines for FY 2013
- Country wise
116
Country Name
New Machinery Used Machinery TotalMarket Share based
on Rs Cr
Quantity
(in units)
Value
(In Rs Cr)
Quantity
(in units)
Value
(In Rs Cr)
Quantity
(in units)
Value
(In Rs Cr)New Used
Italy 22 65.92 204 7.98 226 73.9 16% 14%
US 83 61.8 57 3.42 140 65.22 15% 6%
Japan 17 57.68 72 14.82 89 72.5 14% 26%
Germany 36 57.68 187 12.54 223 70.22 14% 22%
China 1057 20.6 28 0.57 1085 21.17 5% 1%
Taiwan 283 12.36 33 0.57 316 12.93 3% 1%
UK 8 0 215 3.99 223 3.99 0% 7%
France 6 0 335 6.27 341 6.27 0% 11%
Others 91 135.96 168 6.84 259 142.8 34% 12%
Total 1603 412 1299 57 2902 469
Total market demand for milling machines in India (in Units) (Import) : 2800 - 2900
Total market demand for milling machines in India (in Rs Cr) (Import): 450 - 480
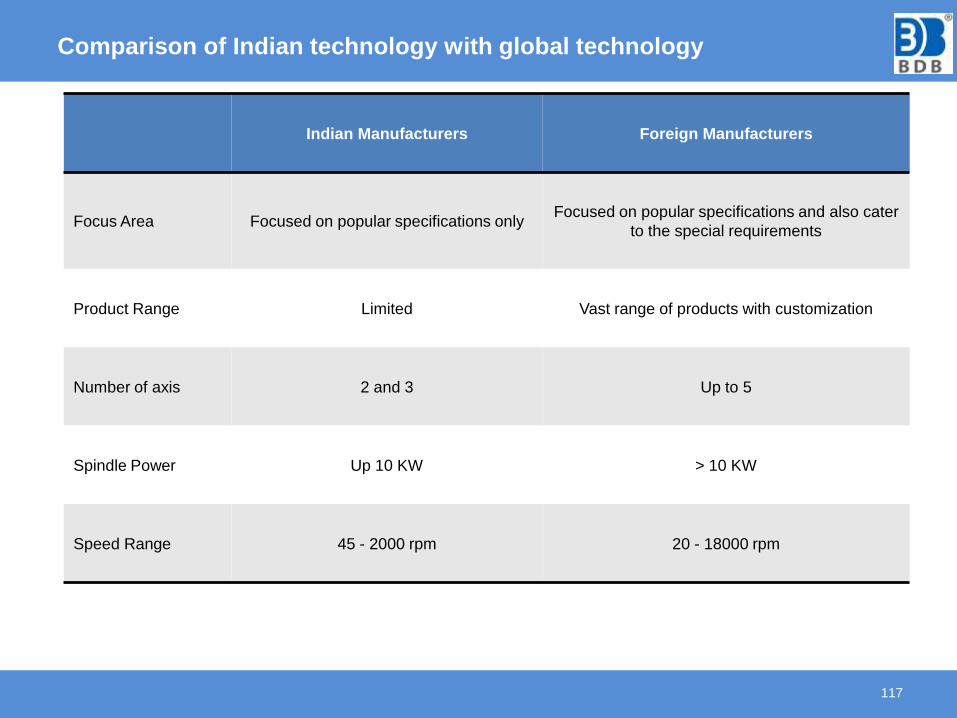
Comparison of Indian technology with global technology
117
Indian Manufacturers Foreign Manufacturers
Focus Area Focused on popular specifications onlyFocused on popular specifications and also cater
to the special requirements
Product Range Limited Vast range of products with customization
Number of axis 2 and 3 Up to 5
Spindle Power Up 10 KW > 10 KW
Speed Range 45 - 2000 rpm 20 - 18000 rpm
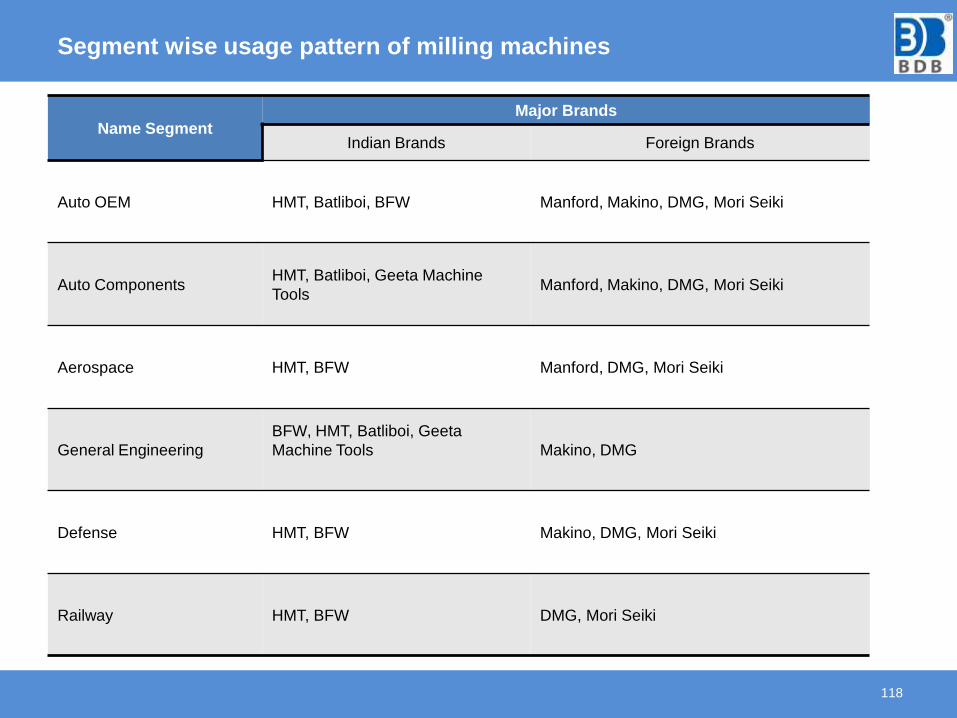
Segment wise usage pattern of milling machines
118
Name SegmentMajor Brands
Indian Brands Foreign Brands
Auto OEM HMT, Batliboi, BFW Manford, Makino, DMG, Mori Seiki
Auto Components HMT, Batliboi, Geeta Machine
ToolsManford, Makino, DMG, Mori Seiki
Aerospace HMT, BFW Manford, DMG, Mori Seiki
General Engineering
BFW, HMT, Batliboi, Geeta
Machine Tools Makino, DMG
Defense HMT, BFW Makino, DMG, Mori Seiki
Railway HMT, BFW DMG, Mori Seiki
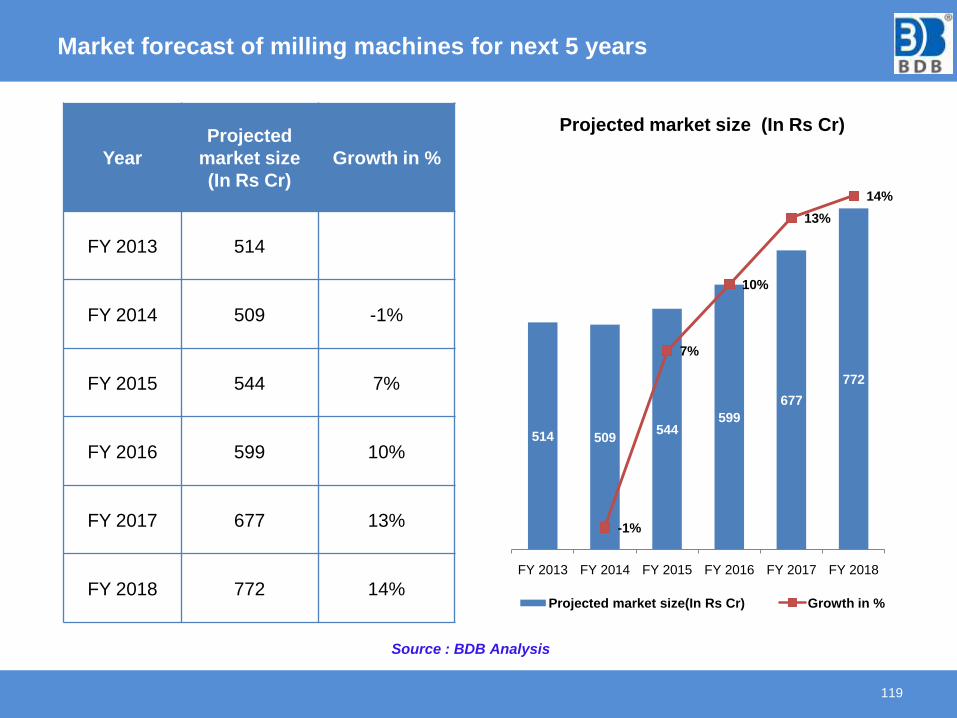
Market forecast of milling machines for next 5 years
119
Year
Projected
market size
(In Rs Cr)
Growth in %
FY 2013 514
FY 2014 509 -1%
FY 2015 544 7%
FY 2016 599 10%
FY 2017 677 13%
FY 2018 772 14%
Source : BDB Analysis
514 509544
599
677
772
-1%
7%
10%
13%
14%
-0.02
0
0.02
0.04
0.06
0.08
0.1
0.12
0.14
0.16
0
100
200
300
400
500
600
700
800
900
FY 2013 FY 2014 FY 2015 FY 2016 FY 2017 FY 2018
Projected market size (In Rs Cr)
Projected market size(In Rs Cr) Growth in %
MARKET SIZE ANALYSIS OF
GRINDING MACHINES
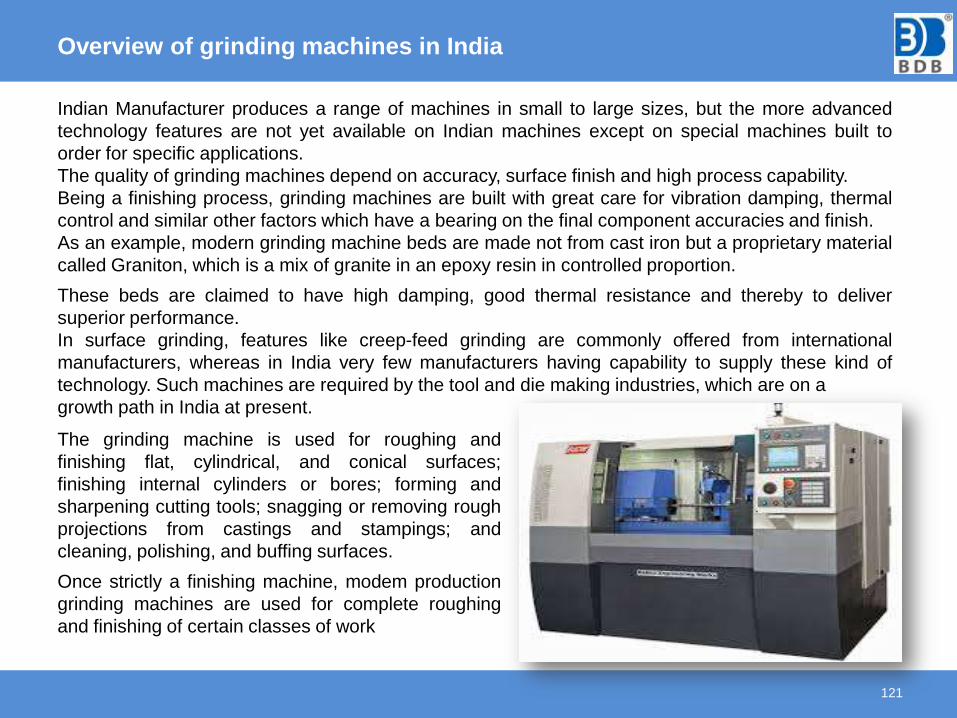
Overview of grinding machines in India
121
Indian Manufacturer produces a range of machines in small to large sizes, but the more advanced
technology features are not yet available on Indian machines except on special machines built to
order for specific applications.
The quality of grinding machines depend on accuracy, surface finish and high process capability.
Being a finishing process, grinding machines are built with great care for vibration damping, thermal
control and similar other factors which have a bearing on the final component accuracies and finish.
As an example, modern grinding machine beds are made not from cast iron but a proprietary material
called Graniton, which is a mix of granite in an epoxy resin in controlled proportion.
These beds are claimed to have high damping, good thermal resistance and thereby to deliver
superior performance.
In surface grinding, features like creep-feed grinding are commonly offered from international
manufacturers, whereas in India very few manufacturers having capability to supply these kind of
technology. Such machines are required by the tool and die making industries, which are on a
growth path in India at present.
The grinding machine is used for roughing and
finishing flat, cylindrical, and conical surfaces;
finishing internal cylinders or bores; forming and
sharpening cutting tools; snagging or removing rough
projections from castings and stampings; and
cleaning, polishing, and buffing surfaces.
Once strictly a finishing machine, modem production
grinding machines are used for complete roughing
and finishing of certain classes of work
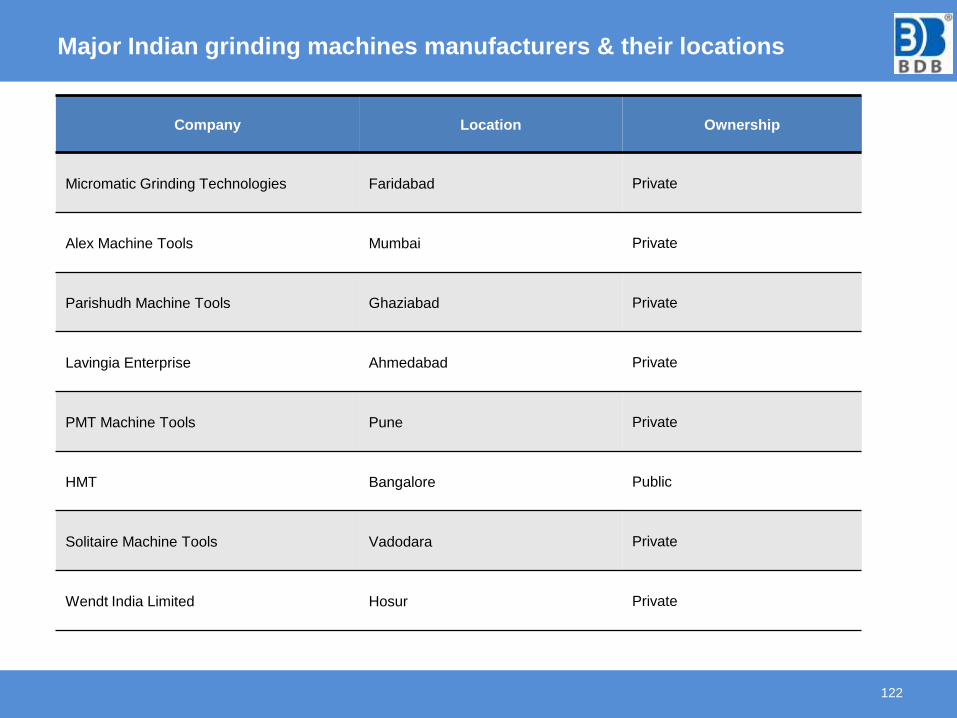
Major Indian grinding machines manufacturers & their locations
122
Company Location Ownership
Micromatic Grinding Technologies Faridabad Private
Alex Machine Tools Mumbai Private
Parishudh Machine Tools Ghaziabad Private
Lavingia Enterprise Ahmedabad Private
PMT Machine Tools Pune Private
HMT Bangalore Public
Solitaire Machine Tools Vadodara Private
Wendt India Limited Hosur Private
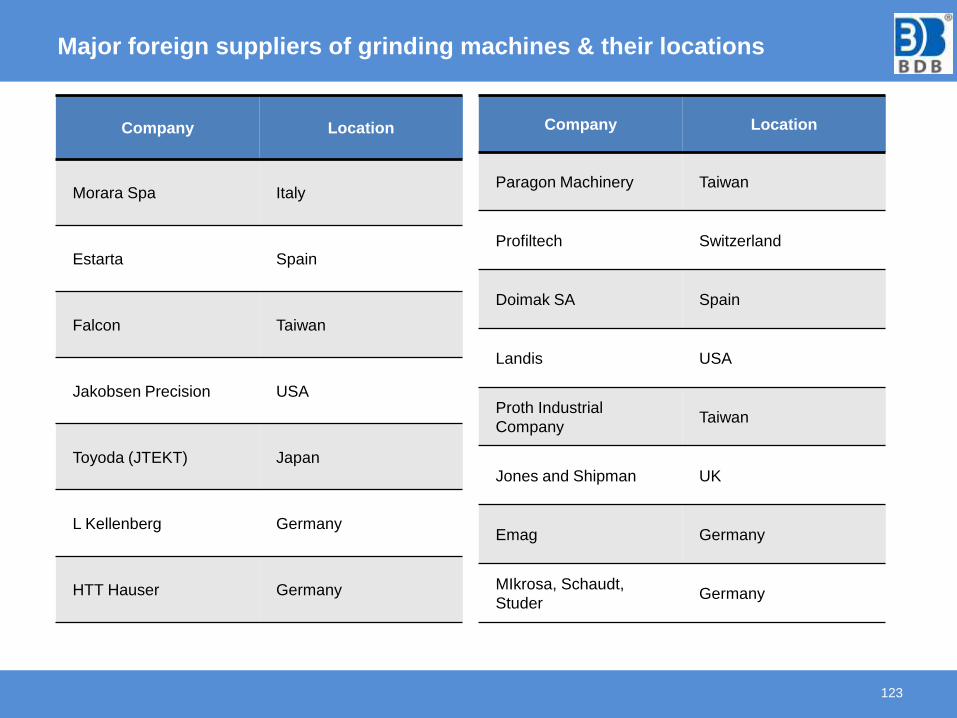
Major foreign suppliers of grinding machines & their locations
123
Company Location
Morara Spa Italy
Estarta Spain
Falcon Taiwan
Jakobsen Precision USA
Toyoda (JTEKT) Japan
L Kellenberg Germany
HTT Hauser Germany
Company Location
Paragon Machinery Taiwan
Profiltech Switzerland
Doimak SA Spain
Landis USA
Proth Industrial
CompanyTaiwan
Jones and Shipman UK
Emag Germany
MIkrosa, Schaudt,
StuderGermany
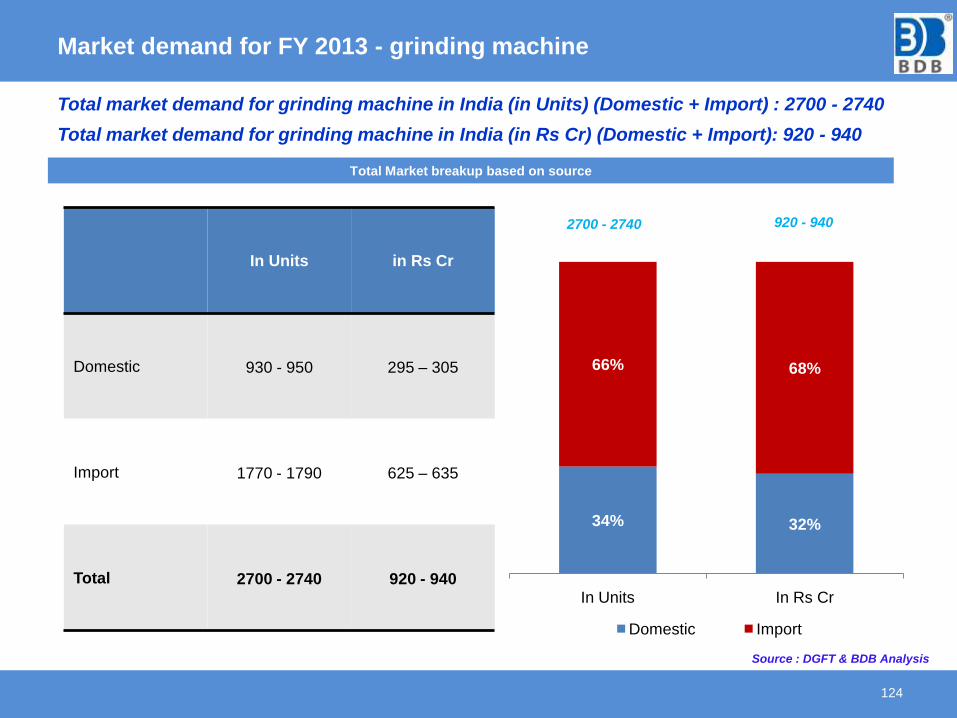
Market demand for FY 2013 - grinding machine
124
34% 32%
66% 68%
In Units In Rs Cr
Domestic Import
Total market demand for grinding machine in India (in Units) (Domestic + Import) : 2700 - 2740
Total market demand for grinding machine in India (in Rs Cr) (Domestic + Import): 920 - 940
2700 - 2740 920 - 940
Total Market breakup based on source
In Units in Rs Cr
Domestic 930 - 950 295 – 305
Import 1770 - 1790 625 – 635
Total 2700 - 2740 920 - 940
Source : DGFT & BDB Analysis
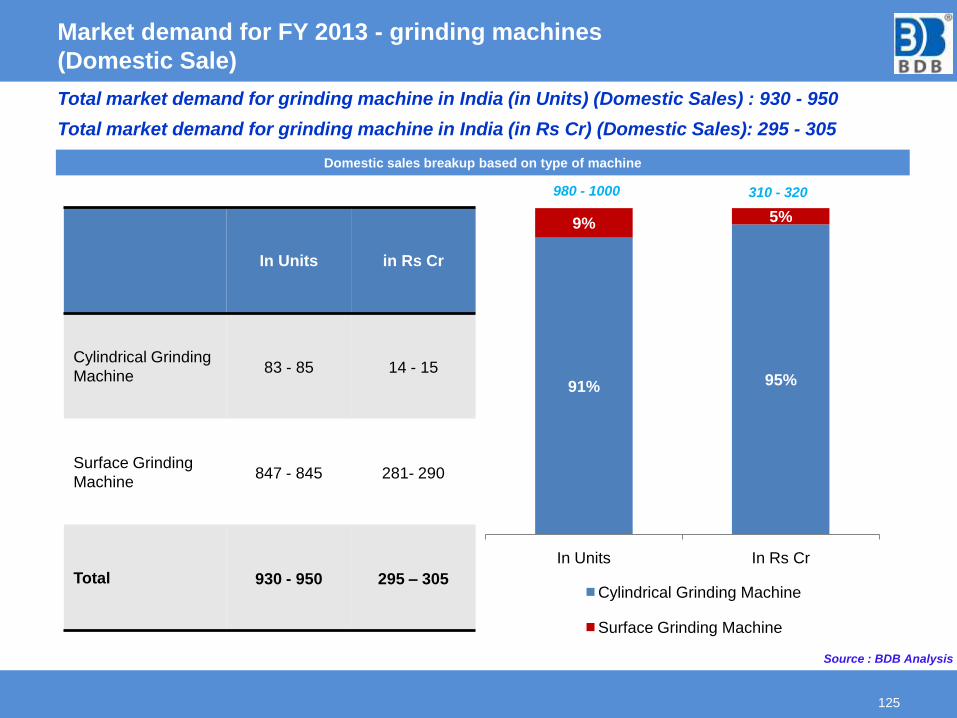
Market demand for FY 2013 - grinding machines
(Domestic Sale)
125
Total market demand for grinding machine in India (in Units) (Domestic Sales) : 930 - 950
Total market demand for grinding machine in India (in Rs Cr) (Domestic Sales): 295 - 305
Domestic sales breakup based on type of machine
980 - 1000 310 - 320
91% 95%
9% 5%
In Units In Rs Cr
Cylindrical Grinding Machine
Surface Grinding Machine
Source : BDB Analysis
In Units in Rs Cr
Cylindrical Grinding
Machine83 - 85 14 - 15
Surface Grinding
Machine847 - 845 281- 290
Total 930 - 950 295 – 305
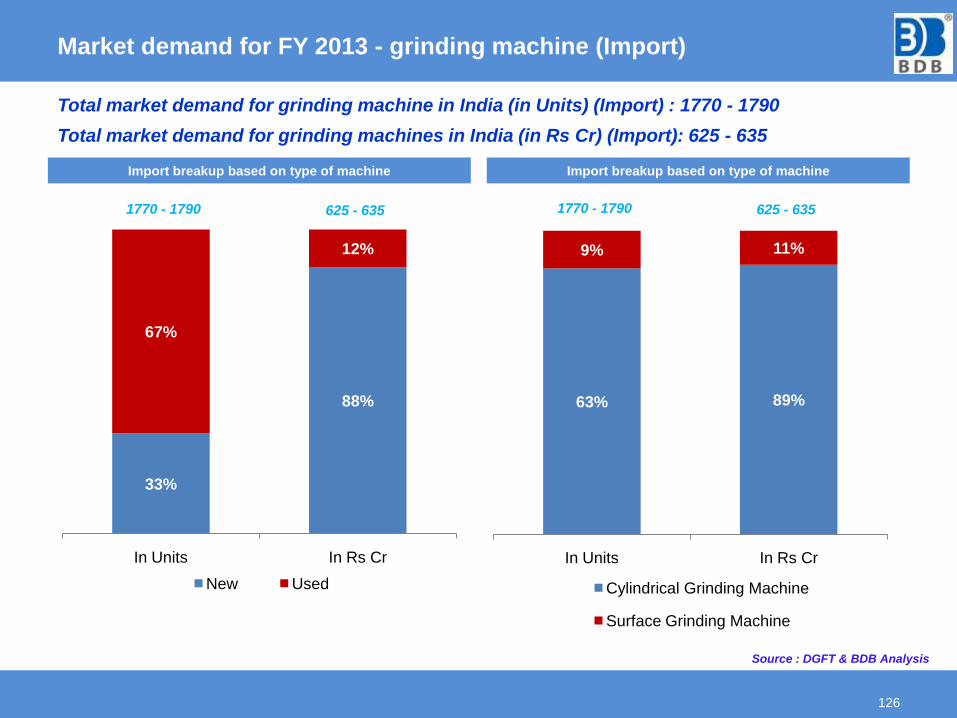
Market demand for FY 2013 - grinding machine (Import)
126
Total market demand for grinding machine in India (in Units) (Import) : 1770 - 1790
Total market demand for grinding machines in India (in Rs Cr) (Import): 625 - 635
1770 - 1790
Import breakup based on type of machine
33%
88%
67%
12%
In Units In Rs Cr
New Used
625 - 635
Import breakup based on type of machine
63% 89%
9% 11%
In Units In Rs Cr
Cylindrical Grinding Machine
Surface Grinding Machine
1770 - 1790 625 - 635
Source : DGFT & BDB Analysis
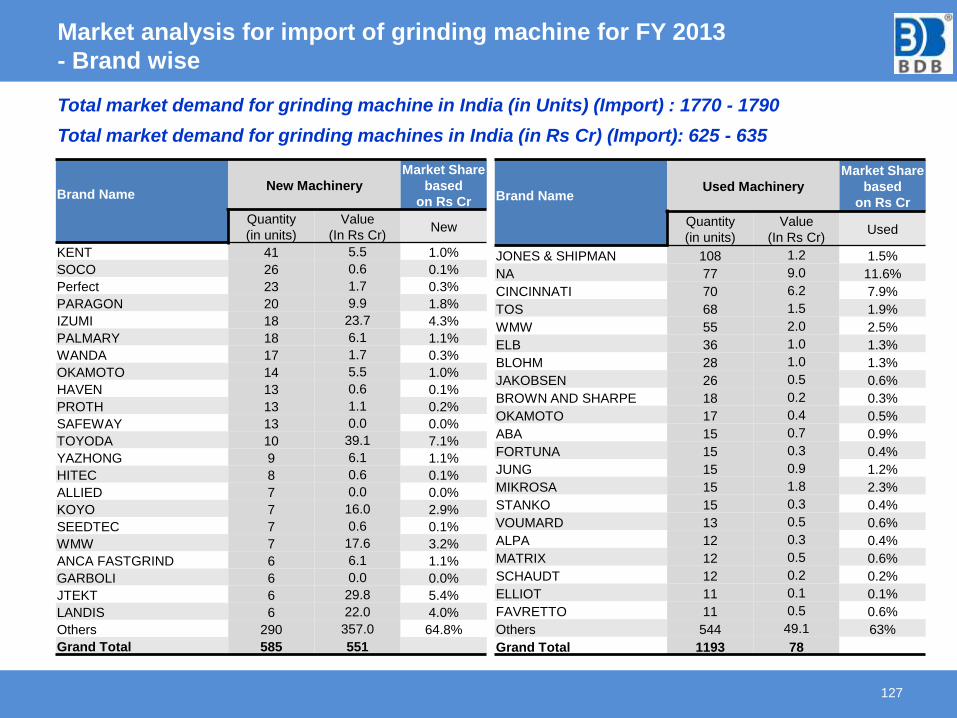
Market analysis for import of grinding machine for FY 2013
- Brand wise
127
Brand Name New Machinery
Market Share
based
on Rs Cr
Quantity
(in units)
Value
(In Rs Cr)New
KENT 41 5.5 1.0%
SOCO 26 0.6 0.1%
Perfect 23 1.7 0.3%
PARAGON 20 9.9 1.8%
IZUMI 18 23.7 4.3%
PALMARY 18 6.1 1.1%
WANDA 17 1.7 0.3%
OKAMOTO 14 5.5 1.0%
HAVEN 13 0.6 0.1%
PROTH 13 1.1 0.2%
SAFEWAY 13 0.0 0.0%
TOYODA 10 39.1 7.1%
YAZHONG 9 6.1 1.1%
HITEC 8 0.6 0.1%
ALLIED 7 0.0 0.0%
KOYO 7 16.0 2.9%
SEEDTEC 7 0.6 0.1%
WMW 7 17.6 3.2%
ANCA FASTGRIND 6 6.1 1.1%
GARBOLI 6 0.0 0.0%
JTEKT 6 29.8 5.4%
LANDIS 6 22.0 4.0%
Others 290 357.0 64.8%
Grand Total 585 551
Brand Name Used Machinery
Market Share
based
on Rs Cr
Quantity
(in units)
Value
(In Rs Cr)Used
JONES & SHIPMAN 108 1.2 1.5%
NA 77 9.0 11.6%
CINCINNATI 70 6.2 7.9%
TOS 68 1.5 1.9%
WMW 55 2.0 2.5%
ELB 36 1.0 1.3%
BLOHM 28 1.0 1.3%
JAKOBSEN 26 0.5 0.6%
BROWN AND SHARPE 18 0.2 0.3%
OKAMOTO 17 0.4 0.5%
ABA 15 0.7 0.9%
FORTUNA 15 0.3 0.4%
JUNG 15 0.9 1.2%
MIKROSA 15 1.8 2.3%
STANKO 15 0.3 0.4%
VOUMARD 13 0.5 0.6%
ALPA 12 0.3 0.4%
MATRIX 12 0.5 0.6%
SCHAUDT 12 0.2 0.2%
ELLIOT 11 0.1 0.1%
FAVRETTO 11 0.5 0.6%
Others 544 49.1 63%
Grand Total 1193 78
Total market demand for grinding machine in India (in Units) (Import) : 1770 - 1790
Total market demand for grinding machines in India (in Rs Cr) (Import): 625 - 635
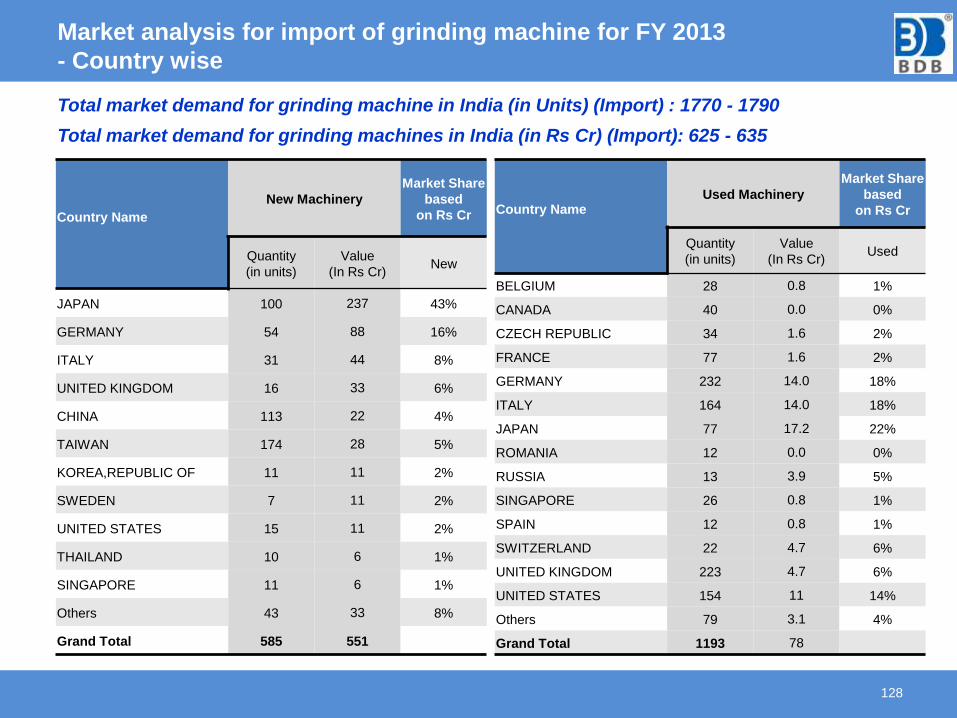
Market analysis for import of grinding machine for FY 2013
- Country wise
128
Country Name
New Machinery
Market Share
based
on Rs Cr
Quantity
(in units)
Value
(In Rs Cr)New
JAPAN 100 237 43%
GERMANY 54 88 16%
ITALY 31 44 8%
UNITED KINGDOM 16 33 6%
CHINA 113 22 4%
TAIWAN 174 28 5%
KOREA,REPUBLIC OF 11 11 2%
SWEDEN 7 11 2%
UNITED STATES 15 11 2%
THAILAND 10 6 1%
SINGAPORE 11 6 1%
Others 43 33 8%
Grand Total 585 551
Country Name Used Machinery
Market Share
based
on Rs Cr
Quantity
(in units)
Value
(In Rs Cr)Used
BELGIUM 28 0.8 1%
CANADA 40 0.0 0%
CZECH REPUBLIC 34 1.6 2%
FRANCE 77 1.6 2%
GERMANY 232 14.0 18%
ITALY 164 14.0 18%
JAPAN 77 17.2 22%
ROMANIA 12 0.0 0%
RUSSIA 13 3.9 5%
SINGAPORE 26 0.8 1%
SPAIN 12 0.8 1%
SWITZERLAND 22 4.7 6%
UNITED KINGDOM 223 4.7 6%
UNITED STATES 154 11 14%
Others 79 3.1 4%
Grand Total 1193 78
Total market demand for grinding machine in India (in Units) (Import) : 1770 - 1790
Total market demand for grinding machines in India (in Rs Cr) (Import): 625 - 635
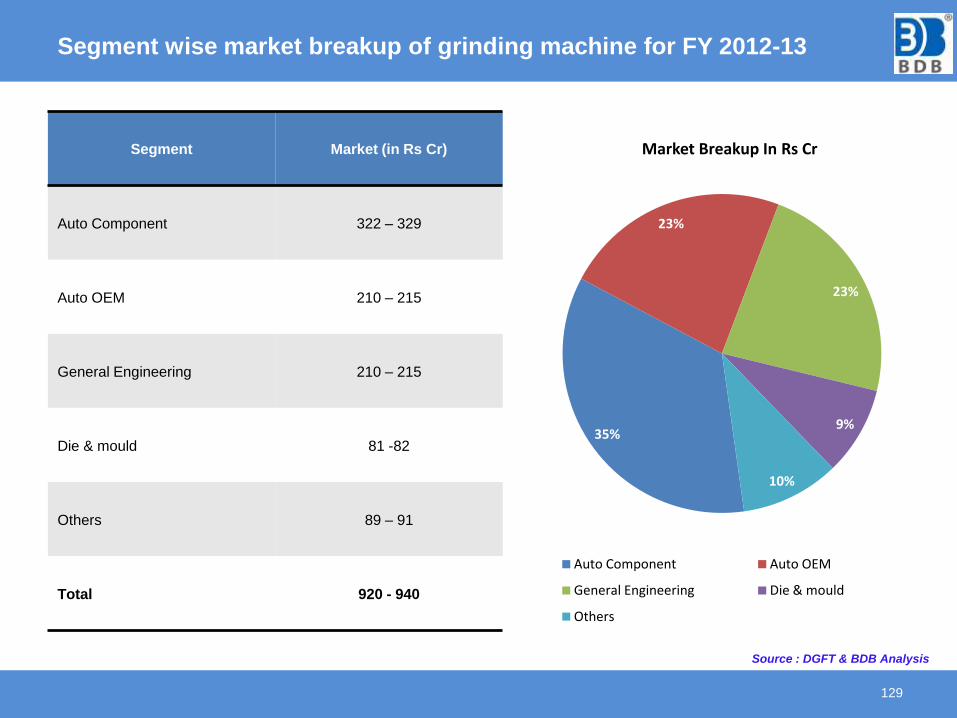
Segment wise market breakup of grinding machine for FY 2012-13
129
Segment Market (in Rs Cr)
Auto Component 322 – 329
Auto OEM 210 – 215
General Engineering 210 – 215
Die & mould 81 -82
Others 89 – 91
Total 920 - 940
35%
23%
23%
9%
10%
Market Breakup In Rs Cr
Auto Component Auto OEM
General Engineering Die & mould
Others
Source : DGFT & BDB Analysis
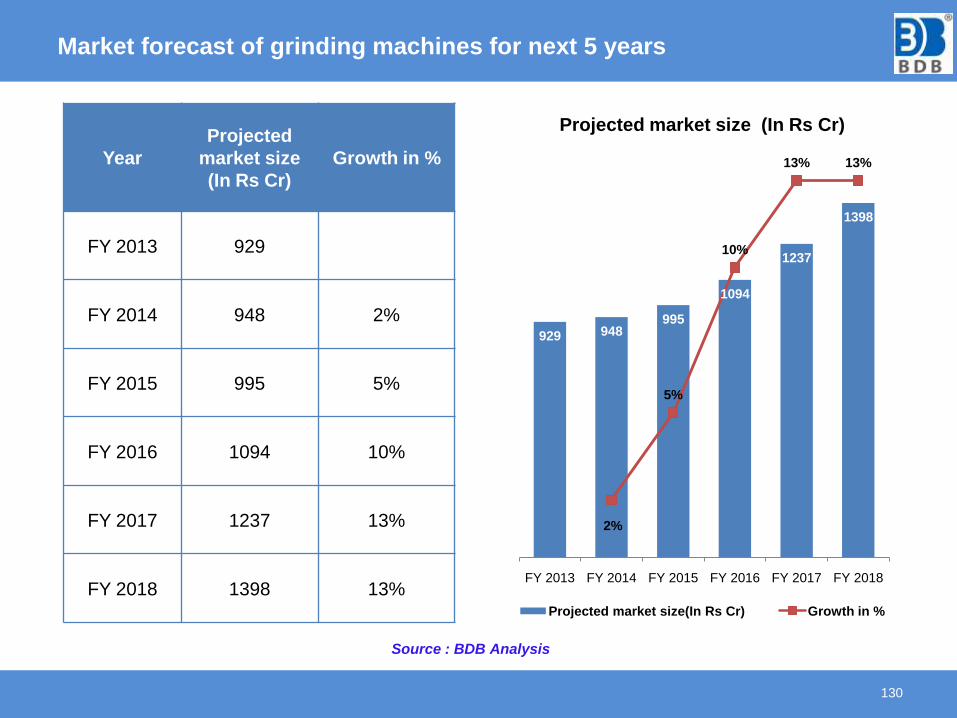
Market forecast of grinding machines for next 5 years
130
Year
Projected
market size
(In Rs Cr)
Growth in %
FY 2013 929
FY 2014 948 2%
FY 2015 995 5%
FY 2016 1094 10%
FY 2017 1237 13%
FY 2018 1398 13%
Source : BDB Analysis
929 948995
1094
1237
1398
2%
5%
10%
13% 13%
0
0.02
0.04
0.06
0.08
0.1
0.12
0.14
0
200
400
600
800
1000
1200
1400
1600
FY 2013 FY 2014 FY 2015 FY 2016 FY 2017 FY 2018
Projected market size (In Rs Cr)
Projected market size(In Rs Cr) Growth in %
MARKET SIZE ANALYSIS OF
TOOL GRINDING MACHINES
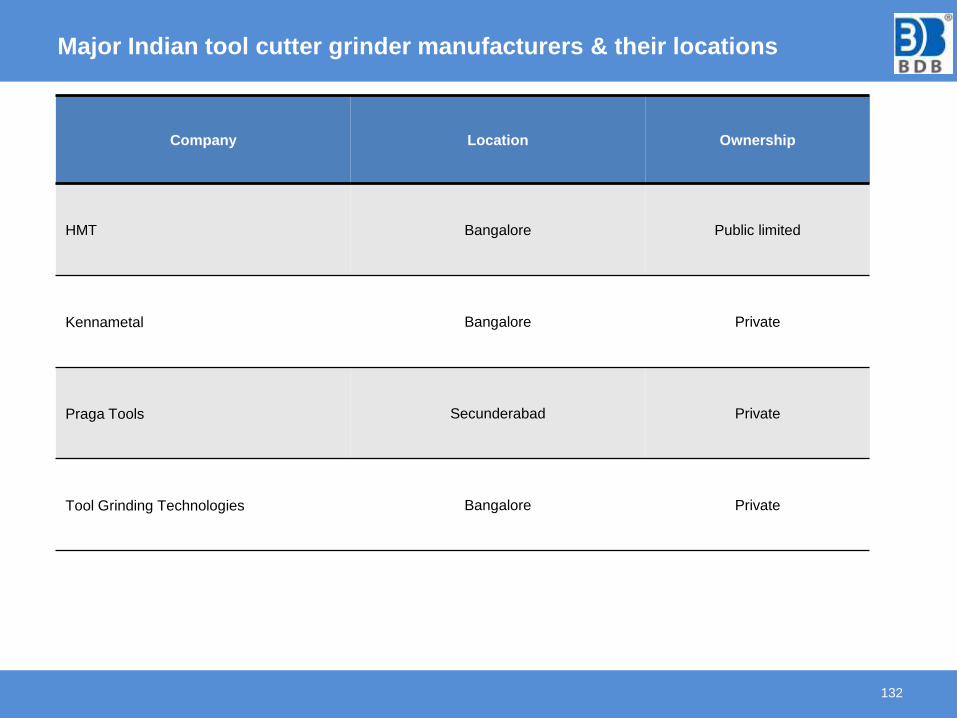
Major Indian tool cutter grinder manufacturers & their locations
132
Company Location Ownership
HMT Bangalore Public limited
Kennametal Bangalore Private
Praga Tools Secunderabad Private
Tool Grinding Technologies Bangalore Private
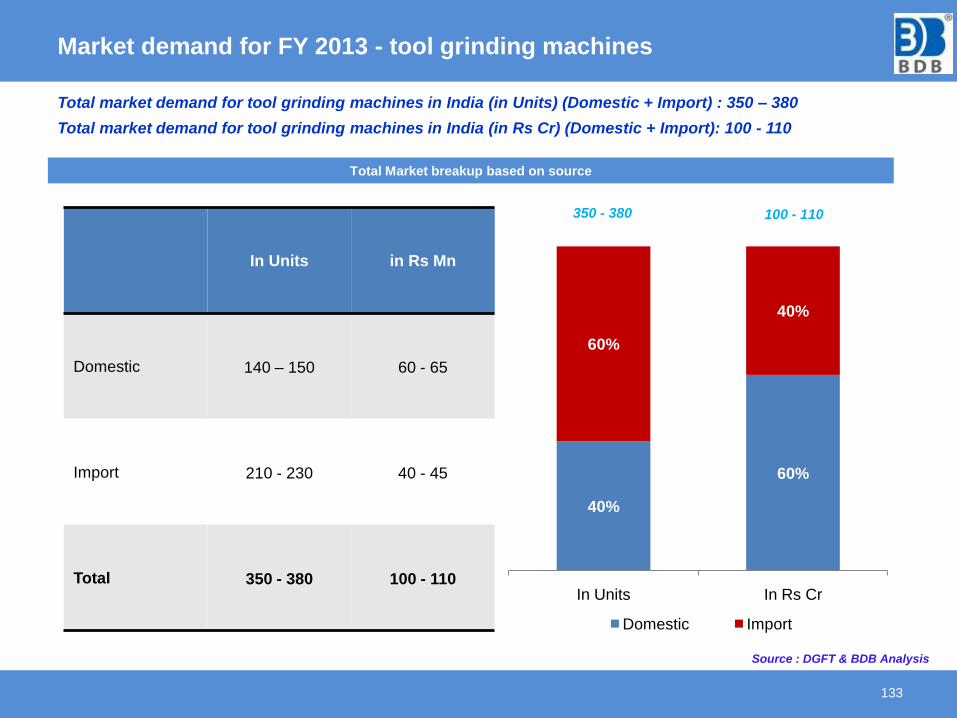
Market demand for FY 2013 - tool grinding machines
133
40%
60%
60%
40%
In Units In Rs Cr
Domestic Import
Total market demand for tool grinding machines in India (in Units) (Domestic + Import) : 350 – 380
Total market demand for tool grinding machines in India (in Rs Cr) (Domestic + Import): 100 - 110
350 - 380 100 - 110
Total Market breakup based on source
In Units in Rs Mn
Domestic 140 – 150 60 - 65
Import 210 - 230 40 - 45
Total 350 - 380 100 - 110
Source : DGFT & BDB Analysis
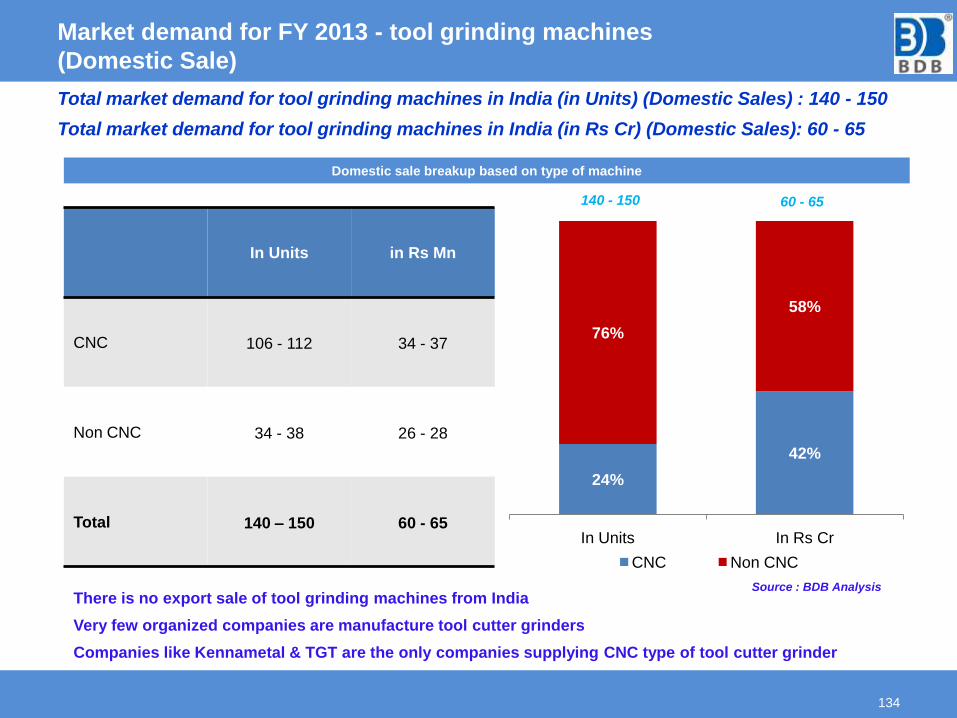
Market demand for FY 2013 - tool grinding machines
(Domestic Sale)
134
Total market demand for tool grinding machines in India (in Units) (Domestic Sales) : 140 - 150
Total market demand for tool grinding machines in India (in Rs Cr) (Domestic Sales): 60 - 65
There is no export sale of tool grinding machines from India
Very few organized companies are manufacture tool cutter grinders
Companies like Kennametal & TGT are the only companies supplying CNC type of tool cutter grinder
24%
42%
76%
58%
In Units In Rs Cr
CNC Non CNC
Domestic sale breakup based on type of machine
140 - 150 60 - 65
Source : BDB Analysis
In Units in Rs Mn
CNC 106 - 112 34 - 37
Non CNC 34 - 38 26 - 28
Total 140 – 150 60 - 65
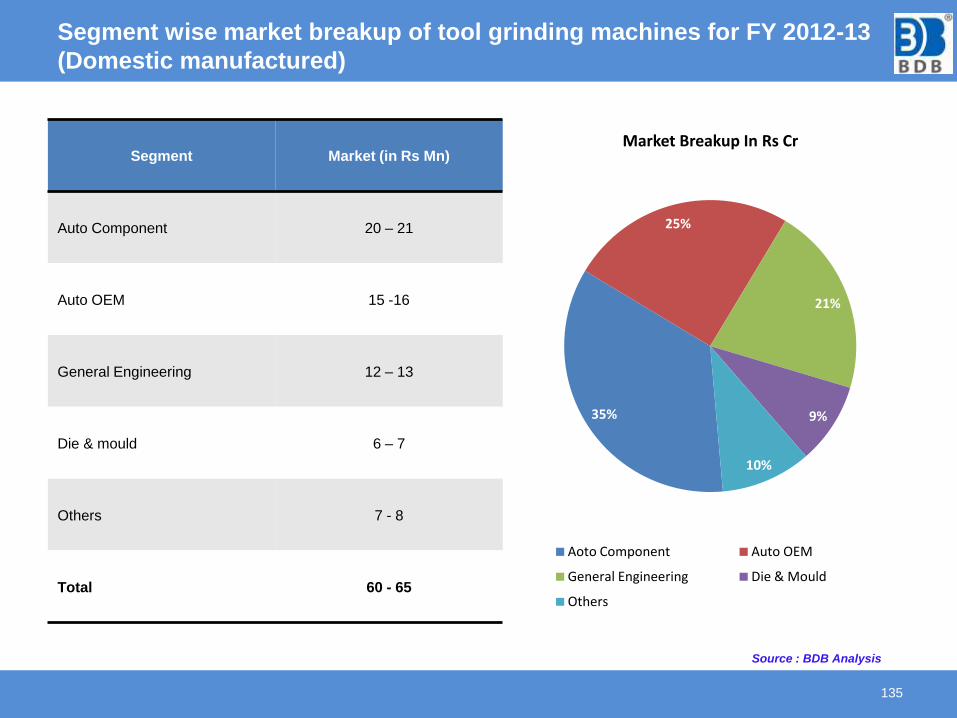
Segment wise market breakup of tool grinding machines for FY 2012-13
(Domestic manufactured)
135
Segment Market (in Rs Mn)
Auto Component 20 – 21
Auto OEM 15 -16
General Engineering 12 – 13
Die & mould 6 – 7
Others 7 - 8
Total 60 - 65
35%
25%
21%
9%
10%
Market Breakup In Rs Cr
Aoto Component Auto OEM
General Engineering Die & Mould
Others
Source : BDB Analysis
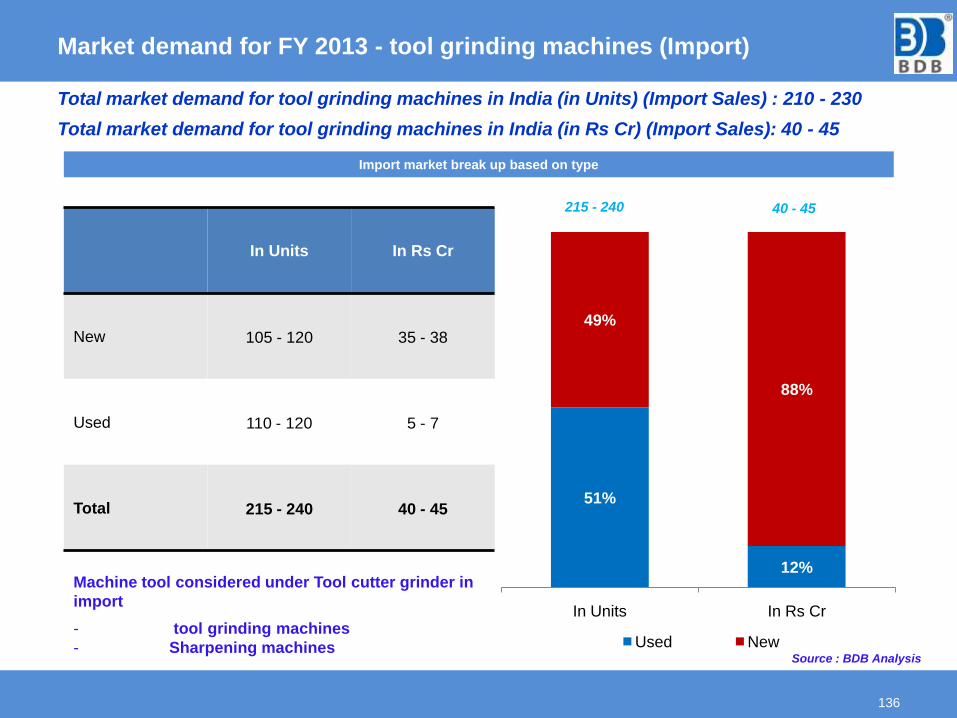
Market demand for FY 2013 - tool grinding machines (Import)
136
Total market demand for tool grinding machines in India (in Units) (Import Sales) : 210 - 230
Total market demand for tool grinding machines in India (in Rs Cr) (Import Sales): 40 - 45
215 - 240 40 - 45
51%
12%
49%
88%
In Units In Rs Cr
Used New
Import market break up based on type
Machine tool considered under Tool cutter grinder in
import
- tool grinding machines
- Sharpening machines
In Units In Rs Cr
New 105 - 120 35 - 38
Used 110 - 120 5 - 7
Total 215 - 240 40 - 45
Source : BDB Analysis
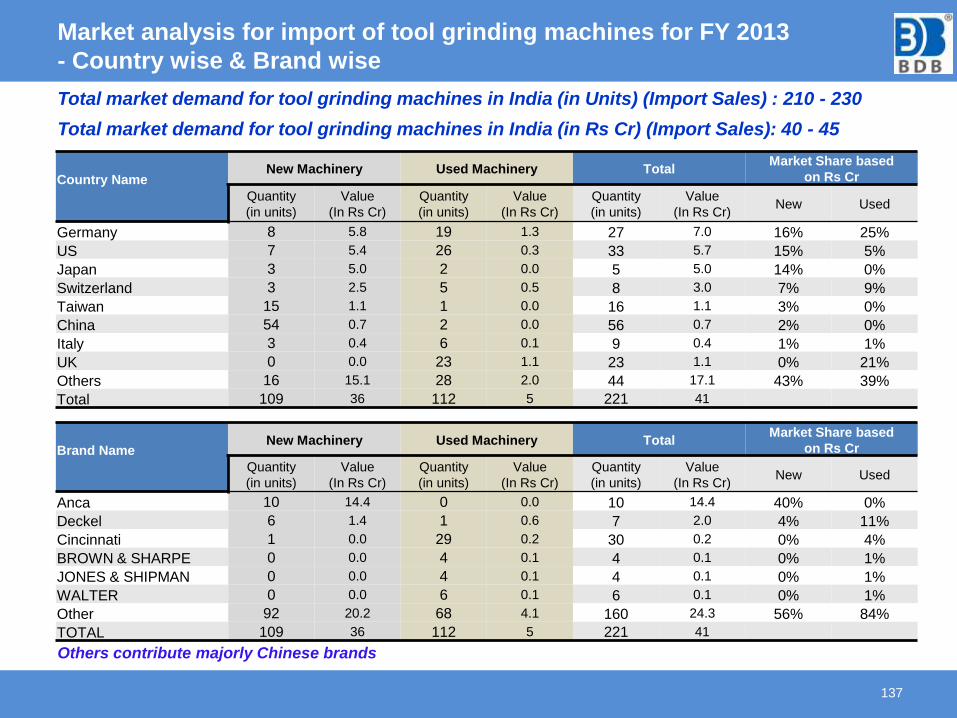
Market analysis for import of tool grinding machines for FY 2013
- Country wise & Brand wise
137
Country Name New Machinery Used Machinery Total
Market Share based
on Rs Cr
Quantity
(in units)
Value
(In Rs Cr)
Quantity
(in units)
Value
(In Rs Cr)
Quantity
(in units)
Value
(In Rs Cr)New Used
Germany 8 5.8 19 1.3 27 7.0 16% 25%
US 7 5.4 26 0.3 33 5.7 15% 5%
Japan 3 5.0 2 0.0 5 5.0 14% 0%
Switzerland 3 2.5 5 0.5 8 3.0 7% 9%
Taiwan 15 1.1 1 0.0 16 1.1 3% 0%
China 54 0.7 2 0.0 56 0.7 2% 0%
Italy 3 0.4 6 0.1 9 0.4 1% 1%
UK 0 0.0 23 1.1 23 1.1 0% 21%
Others 16 15.1 28 2.0 44 17.1 43% 39%
Total 109 36 112 5 221 41
Brand Name New Machinery Used Machinery Total
Market Share based
on Rs Cr
Quantity
(in units)
Value
(In Rs Cr)
Quantity
(in units)
Value
(In Rs Cr)
Quantity
(in units)
Value
(In Rs Cr)New Used
Anca 10 14.4 0 0.0 10 14.4 40% 0%
Deckel 6 1.4 1 0.6 7 2.0 4% 11%
Cincinnati 1 0.0 29 0.2 30 0.2 0% 4%
BROWN & SHARPE 0 0.0 4 0.1 4 0.1 0% 1%
JONES & SHIPMAN 0 0.0 4 0.1 4 0.1 0% 1%
WALTER 0 0.0 6 0.1 6 0.1 0% 1%
Other 92 20.2 68 4.1 160 24.3 56% 84%
TOTAL 109 36 112 5 221 41
Others contribute majorly Chinese brands
Total market demand for tool grinding machines in India (in Units) (Import Sales) : 210 - 230
Total market demand for tool grinding machines in India (in Rs Cr) (Import Sales): 40 - 45
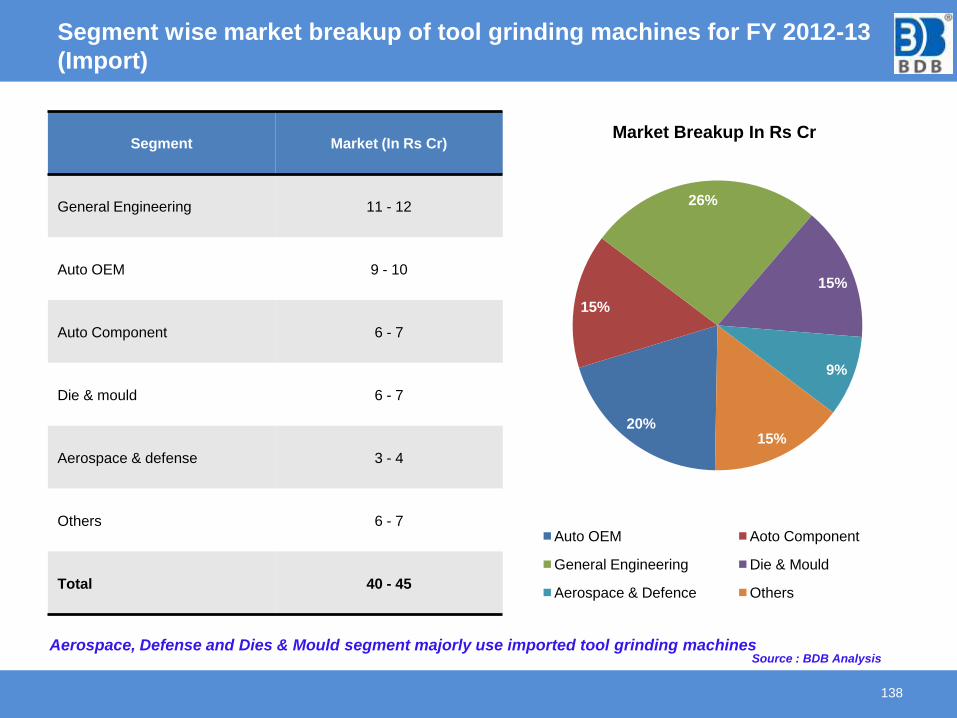
Segment wise market breakup of tool grinding machines for FY 2012-13
(Import)
138
Segment Market (In Rs Cr)
General Engineering 11 - 12
Auto OEM 9 - 10
Auto Component 6 - 7
Die & mould 6 - 7
Aerospace & defense 3 - 4
Others 6 - 7
Total 40 - 45
20%
15%
26%
15%
9%
15%
Market Breakup In Rs Cr
Auto OEM Aoto Component
General Engineering Die & Mould
Aerospace & Defence Others
Aerospace, Defense and Dies & Mould segment majorly use imported tool grinding machinesSource : BDB Analysis
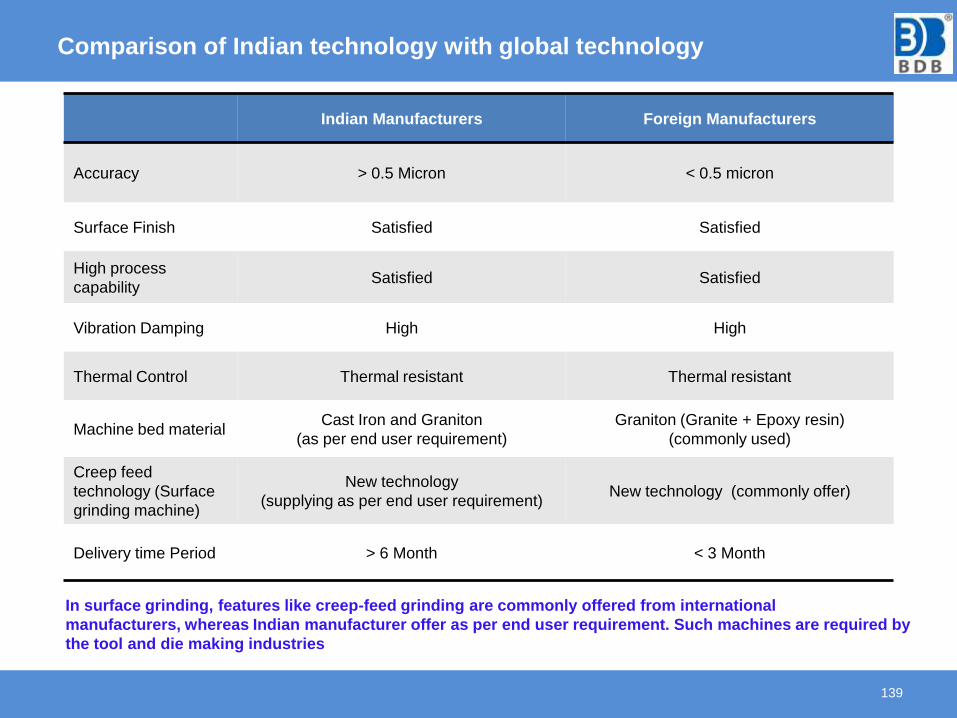
Comparison of Indian technology with global technology
139
Indian Manufacturers Foreign Manufacturers
Accuracy > 0.5 Micron < 0.5 micron
Surface Finish Satisfied Satisfied
High process
capabilitySatisfied Satisfied
Vibration Damping High High
Thermal Control Thermal resistant Thermal resistant
Machine bed materialCast Iron and Graniton
(as per end user requirement)
Graniton (Granite + Epoxy resin)
(commonly used)
Creep feed
technology (Surface
grinding machine)
New technology
(supplying as per end user requirement)New technology (commonly offer)
Delivery time Period > 6 Month < 3 Month
In surface grinding, features like creep-feed grinding are commonly offered from international
manufacturers, whereas Indian manufacturer offer as per end user requirement. Such machines are required by
the tool and die making industries
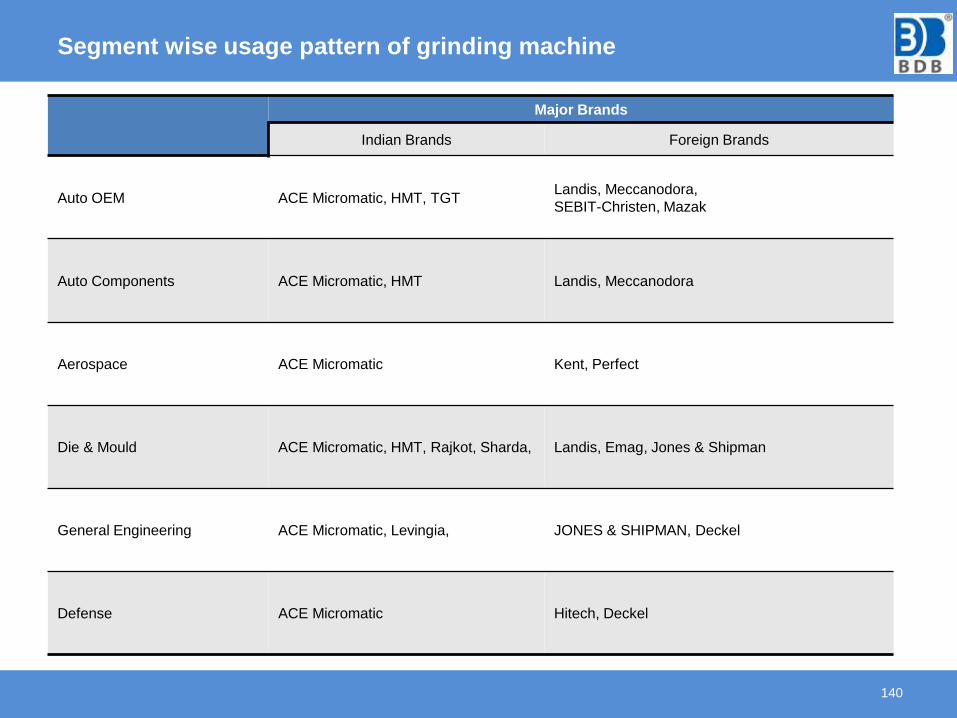
Segment wise usage pattern of grinding machine
140
Major Brands
Indian Brands Foreign Brands
Auto OEM ACE Micromatic, HMT, TGTLandis, Meccanodora,
SEBIT-Christen, Mazak
Auto Components ACE Micromatic, HMT Landis, Meccanodora
Aerospace ACE Micromatic Kent, Perfect
Die & Mould ACE Micromatic, HMT, Rajkot, Sharda, Landis, Emag, Jones & Shipman
General Engineering ACE Micromatic, Levingia, JONES & SHIPMAN, Deckel
Defense ACE Micromatic Hitech, Deckel
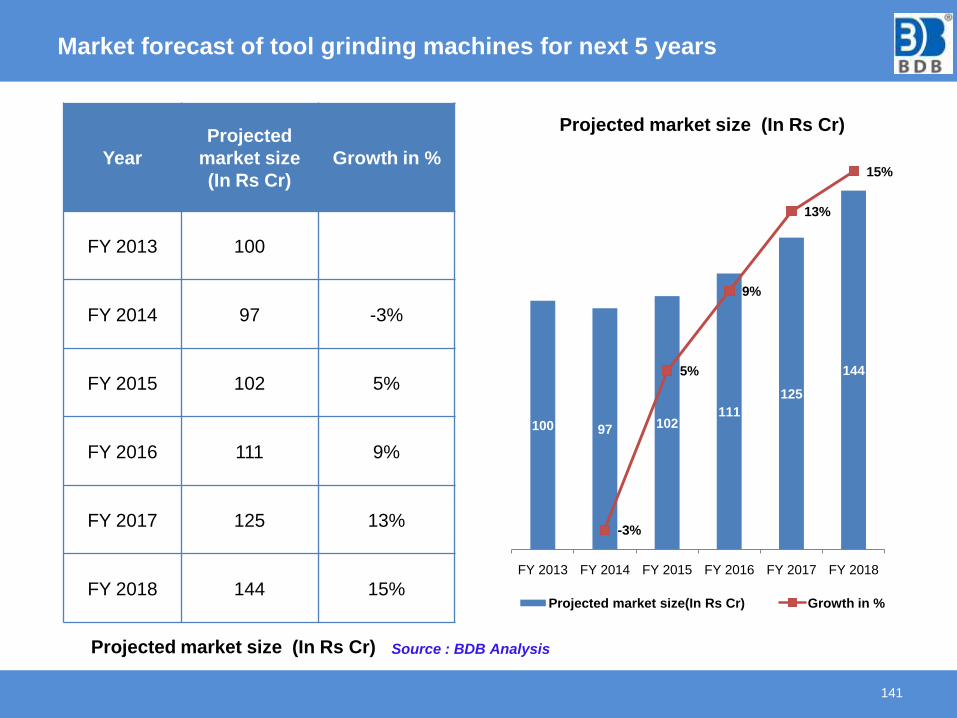
Market forecast of tool grinding machines for next 5 years
141
Year
Projected
market size
(In Rs Cr)
Growth in %
FY 2013 100
FY 2014 97 -3%
FY 2015 102 5%
FY 2016 111 9%
FY 2017 125 13%
FY 2018 144 15%
Source : BDB AnalysisProjected market size (In Rs Cr)
100 97 102111
125
144
-3%
5%
9%
13%
15%
-0.04
-0.02
0
0.02
0.04
0.06
0.08
0.1
0.12
0.14
0.16
0
20
40
60
80
100
120
140
160
FY 2013 FY 2014 FY 2015 FY 2016 FY 2017 FY 2018
Projected market size (In Rs Cr)
Projected market size(In Rs Cr) Growth in %
MARKET SIZE ANALYSIS OF
SPECIAL PURPOSE MACHINES
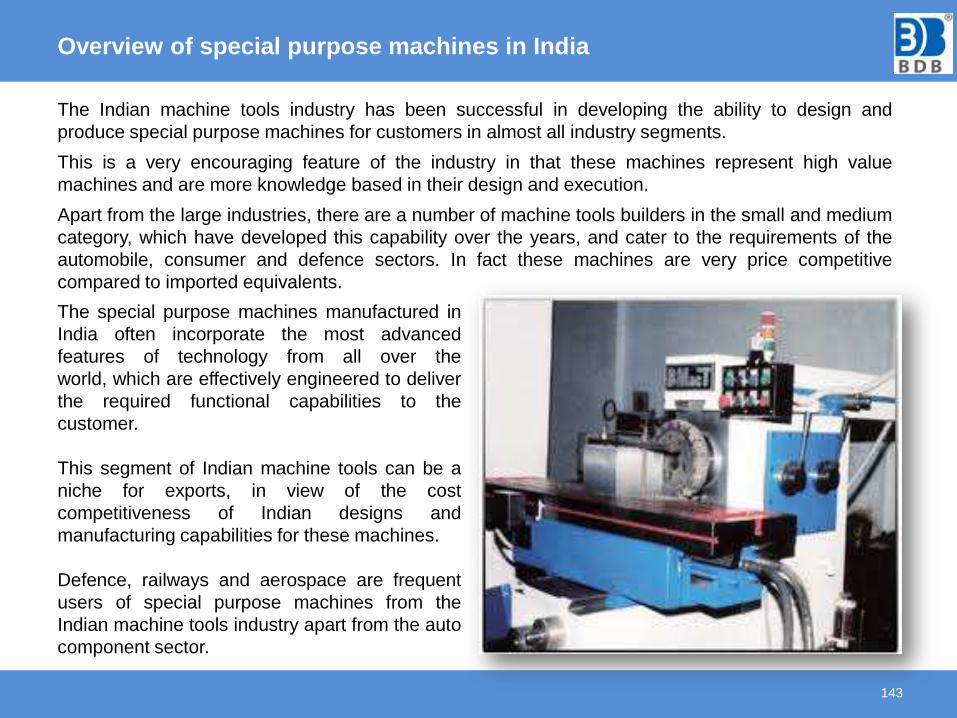
Overview of special purpose machines in India
143
The Indian machine tools industry has been successful in developing the ability to design and
produce special purpose machines for customers in almost all industry segments.
This is a very encouraging feature of the industry in that these machines represent high value
machines and are more knowledge based in their design and execution.
Apart from the large industries, there are a number of machine tools builders in the small and medium
category, which have developed this capability over the years, and cater to the requirements of the
automobile, consumer and defence sectors. In fact these machines are very price competitive
compared to imported equivalents.
The special purpose machines manufactured in
India often incorporate the most advanced
features of technology from all over the
world, which are effectively engineered to deliver
the required functional capabilities to the
customer.
This segment of Indian machine tools can be a
niche for exports, in view of the cost
competitiveness of Indian designs and
manufacturing capabilities for these machines.
Defence, railways and aerospace are frequent
users of special purpose machines from the
Indian machine tools industry apart from the auto
component sector.
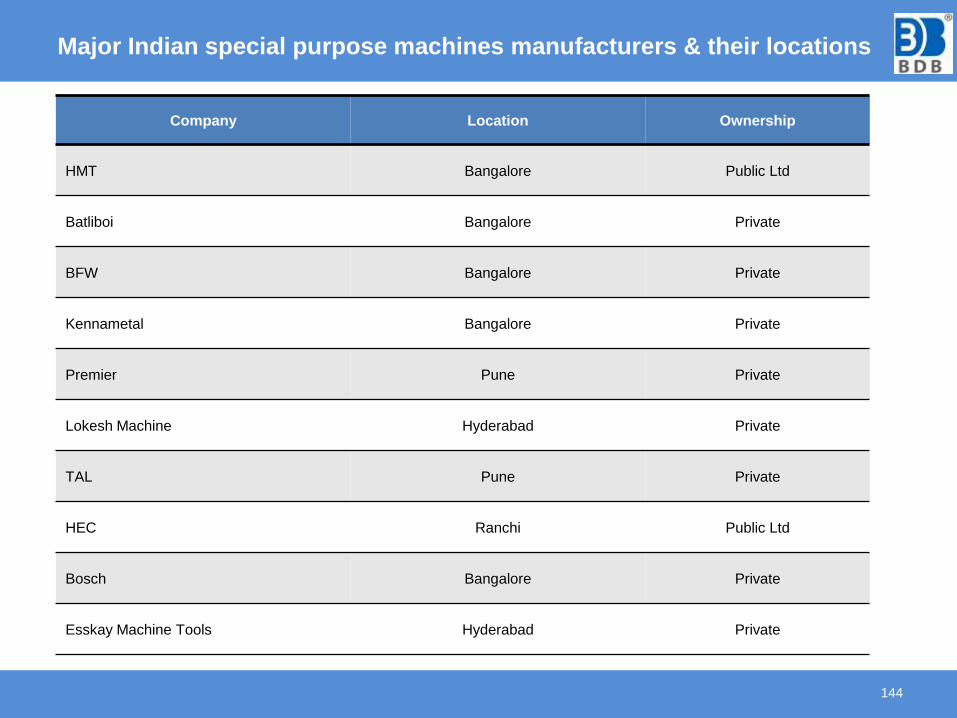
Major Indian special purpose machines manufacturers & their locations
144
Company Location Ownership
HMT Bangalore Public Ltd
Batliboi Bangalore Private
BFW Bangalore Private
Kennametal Bangalore Private
Premier Pune Private
Lokesh Machine Hyderabad Private
TAL Pune Private
HEC Ranchi Public Ltd
Bosch Bangalore Private
Esskay Machine Tools Hyderabad Private
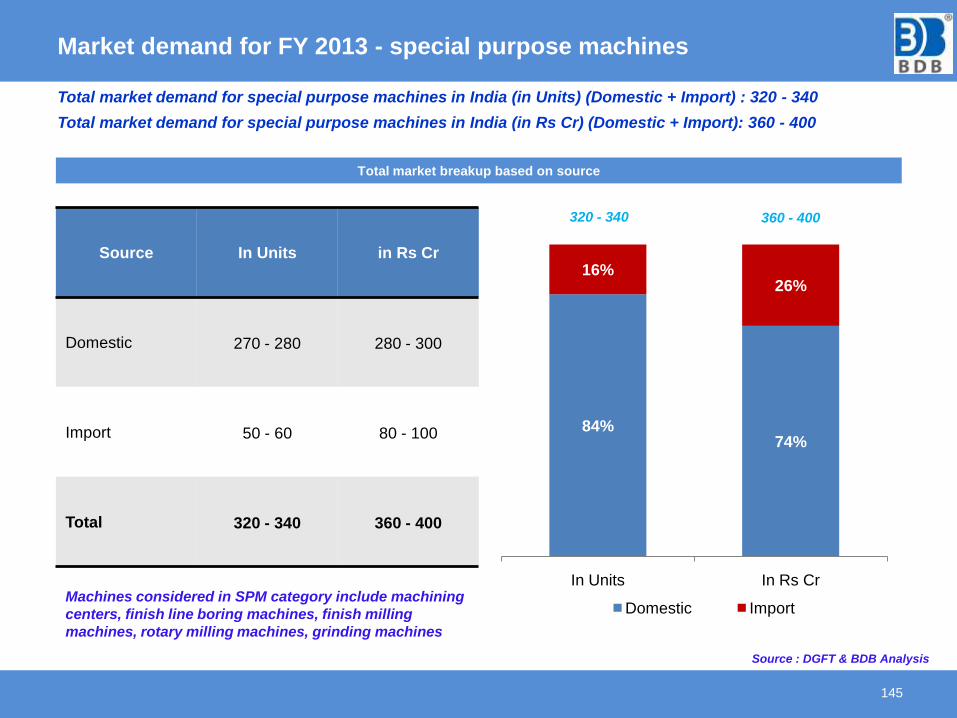
Market demand for FY 2013 - special purpose machines
145
Total market demand for special purpose machines in India (in Units) (Domestic + Import) : 320 - 340
Total market demand for special purpose machines in India (in Rs Cr) (Domestic + Import): 360 - 400
84%74%
16%26%
In Units In Rs Cr
Domestic Import
320 - 340
Total market breakup based on source
360 - 400
Source In Units in Rs Cr
Domestic 270 - 280 280 - 300
Import 50 - 60 80 - 100
Total 320 - 340 360 - 400
Source : DGFT & BDB Analysis
Machines considered in SPM category include machining
centers, finish line boring machines, finish milling
machines, rotary milling machines, grinding machines
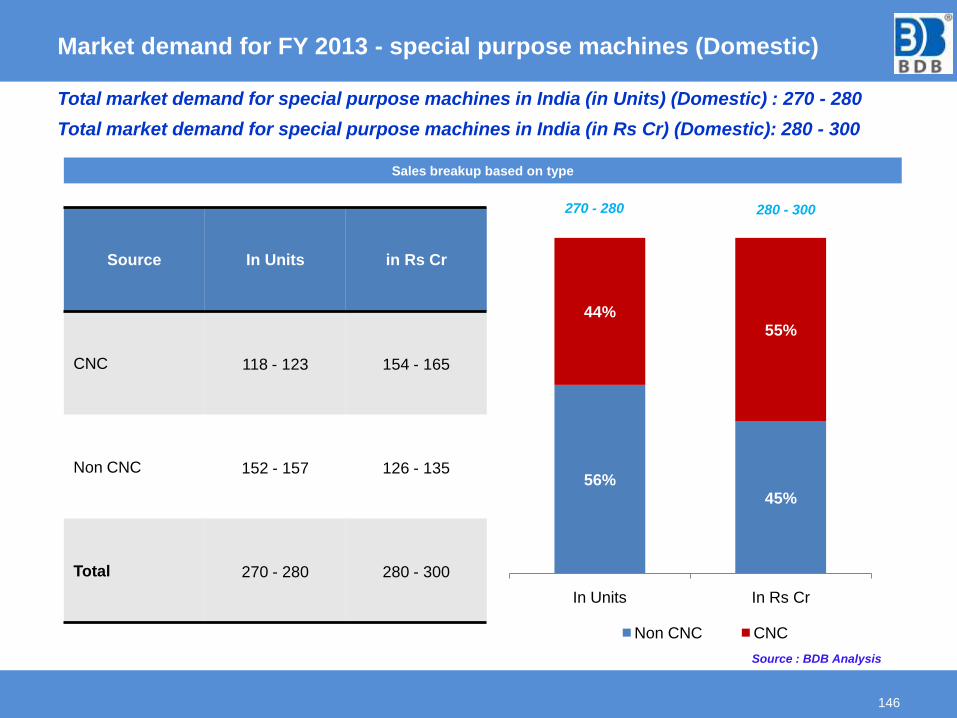
Market demand for FY 2013 - special purpose machines (Domestic)
146
Total market demand for special purpose machines in India (in Units) (Domestic) : 270 - 280
Total market demand for special purpose machines in India (in Rs Cr) (Domestic): 280 - 300
56%45%
44%55%
In Units In Rs Cr
Non CNC CNC
Sales breakup based on type
270 - 280 280 - 300
Source : BDB Analysis
Source In Units in Rs Cr
CNC 118 - 123 154 - 165
Non CNC 152 - 157 126 - 135
Total 270 - 280 280 - 300
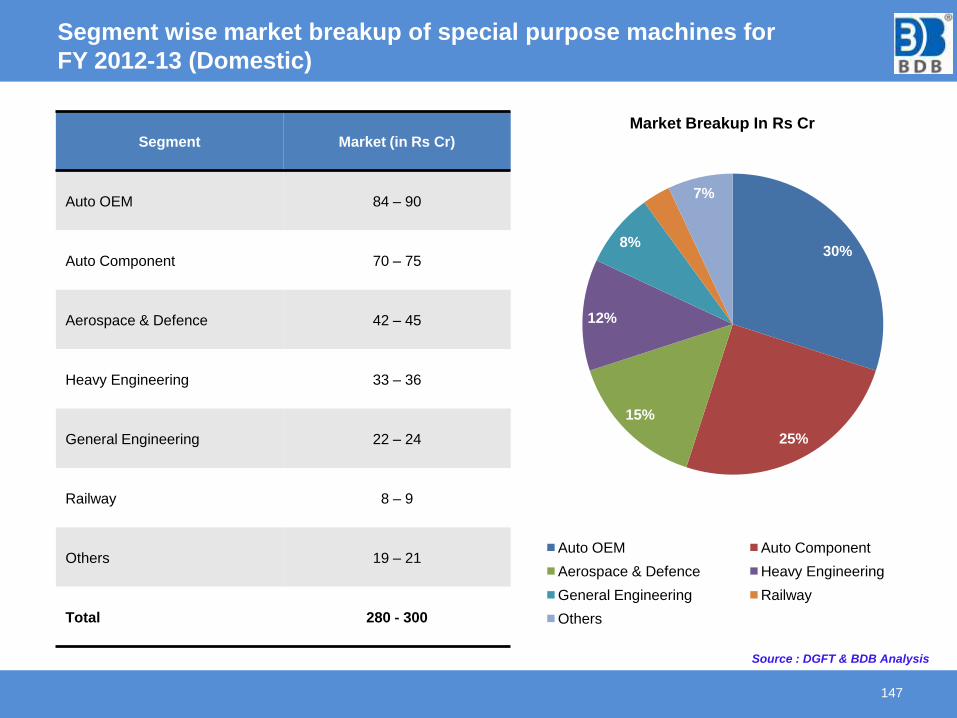
Segment wise market breakup of special purpose machines for
FY 2012-13 (Domestic)
147
Segment Market (in Rs Cr)
Auto OEM 84 – 90
Auto Component 70 – 75
Aerospace & Defence 42 – 45
Heavy Engineering 33 – 36
General Engineering 22 – 24
Railway 8 – 9
Others 19 – 21
Total 280 - 300
30%
25%
15%
12%
8%
3%7%
Market Breakup In Rs Cr
Auto OEM Auto Component
Aerospace & Defence Heavy Engineering
General Engineering Railway
Others
Source : DGFT & BDB Analysis
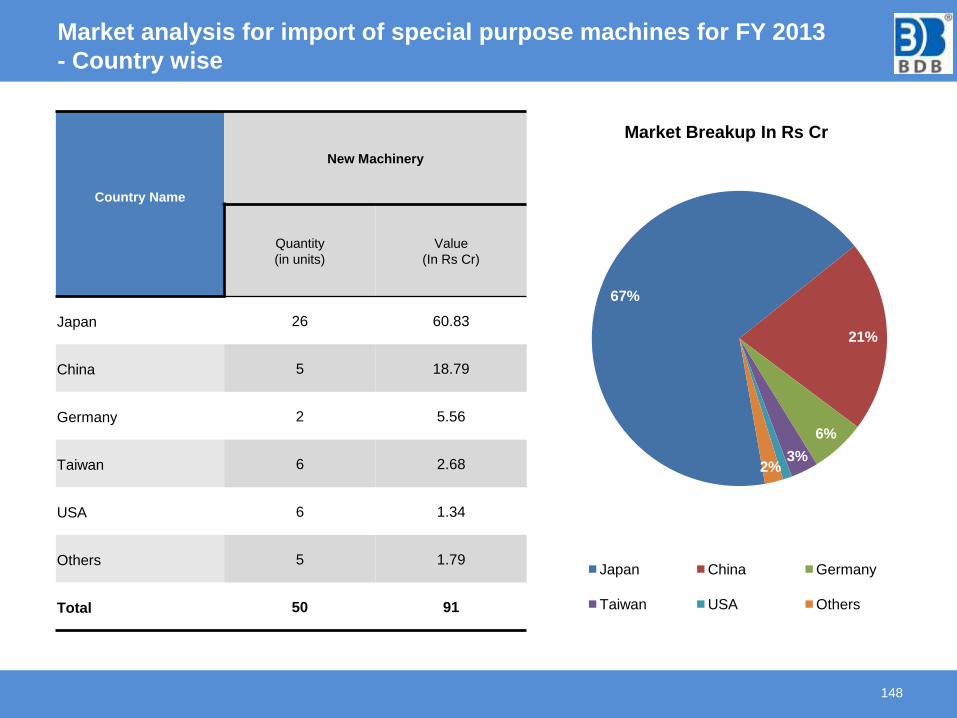
Market analysis for import of special purpose machines for FY 2013
- Country wise
148
Country Name
New Machinery
Quantity
(in units)
Value
(In Rs Cr)
Japan 26 60.83
China 5 18.79
Germany 2 5.56
Taiwan 6 2.68
USA 6 1.34
Others 5 1.79
Total 50 91
67%
21%
6%
3%
1%
2%
Market Breakup In Rs Cr
Japan China Germany
Taiwan USA Others
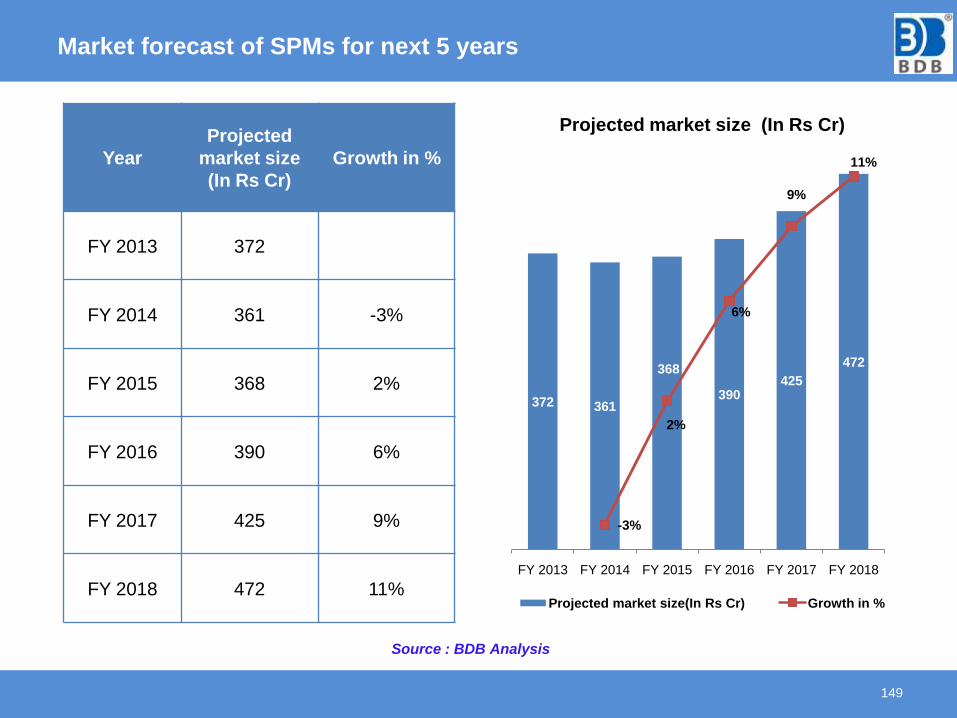
Market forecast of SPMs for next 5 years
149
Year
Projected
market size
(In Rs Cr)
Growth in %
FY 2013 372
FY 2014 361 -3%
FY 2015 368 2%
FY 2016 390 6%
FY 2017 425 9%
FY 2018 472 11%
Source : BDB Analysis
372 361
368
390425
472
-3%
2%
6%
9%
11%
-0.04
-0.02
0
0.02
0.04
0.06
0.08
0.1
0.12
0
50
100
150
200
250
300
350
400
450
500
FY 2013 FY 2014 FY 2015 FY 2016 FY 2017 FY 2018
Projected market size (In Rs Cr)
Projected market size(In Rs Cr) Growth in %
5. TRENDS IN THE END USER SECTORS
AUTOMOTIVE INDUSTRY
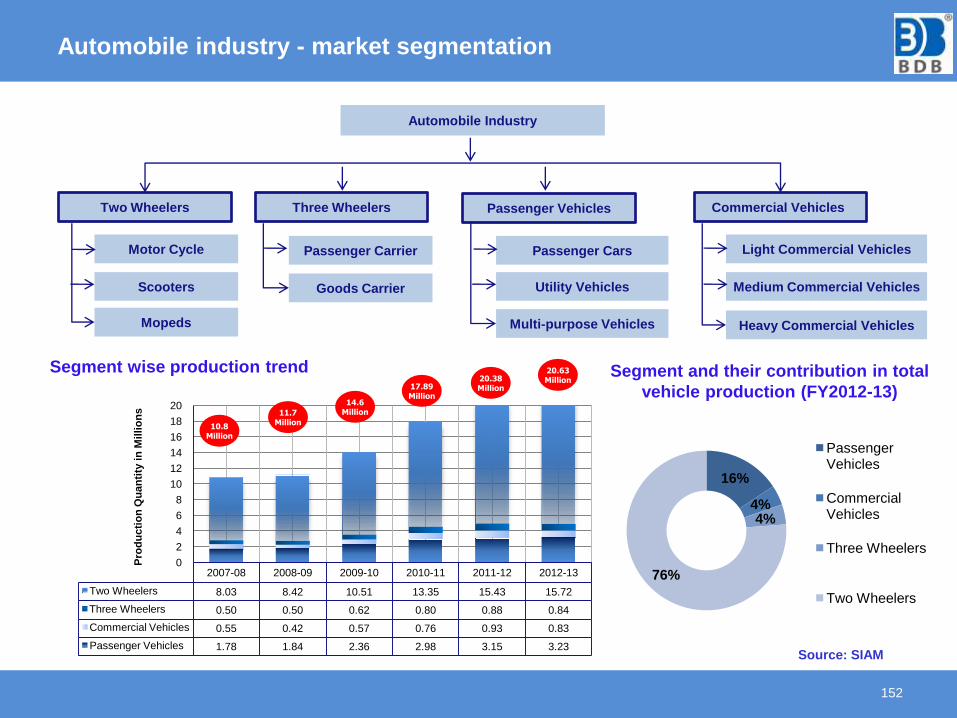
Automobile industry - market segmentation
152
Automobile Industry
Two Wheelers Three Wheelers Passenger Vehicles Commercial Vehicles
Motor Cycle
Scooters
Mopeds
Passenger Carrier
Goods Carrier
Passenger Cars
Utility Vehicles
Multi-purpose Vehicles
Light Commercial Vehicles
Medium Commercial Vehicles
Heavy Commercial Vehicles
Segment wise production trend Segment and their contribution in total
vehicle production (FY2012-13)
2007-08 2008-09 2009-10 2010-11 2011-12 2012-13
Two Wheelers 8.03 8.42 10.51 13.35 15.43 15.72
Three Wheelers 0.50 0.50 0.62 0.80 0.88 0.84
Commercial Vehicles 0.55 0.42 0.57 0.76 0.93 0.83
Passenger Vehicles 1.78 1.84 2.36 2.98 3.15 3.23
0
2
4
6
8
10
12
14
16
18
20
Pro
du
cti
on
Qu
an
tity
in
Mil
lio
ns
10.8Million
11.7Million
14.6Million
17.89Million
20.38Million
20.63Million
16%
4%4%
76%
Passenger Vehicles
Commercial Vehicles
Three Wheelers
Two Wheelers
Source: SIAM
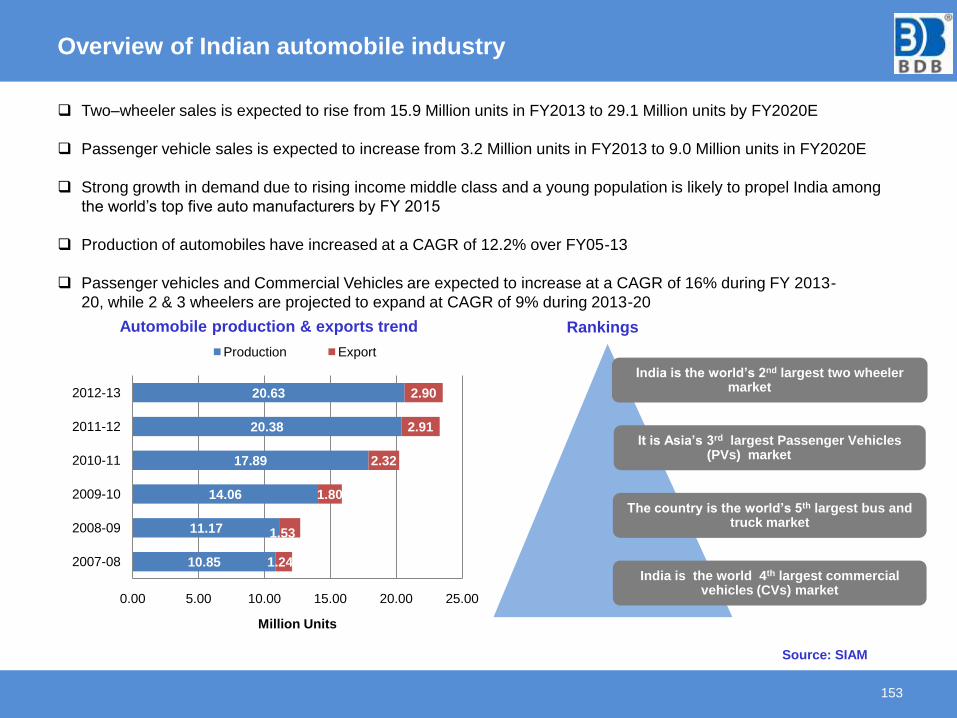
Overview of Indian automobile industry
153
India is the world’s 2nd largest two wheeler market
It is Asia’s 3rd largest Passenger Vehicles (PVs) market
The country is the world’s 5th largest bus and truck market
India is the world 4th largest commercial vehicles (CVs) market
RankingsAutomobile production & exports trend
10.85
11.17
14.06
17.89
20.38
20.63
1.24
1.53
1.80
2.32
2.91
2.90
0.00 5.00 10.00 15.00 20.00 25.00
2007-08
2008-09
2009-10
2010-11
2011-12
2012-13
Million Units
Production Export
Source: SIAM
Two–wheeler sales is expected to rise from 15.9 Million units in FY2013 to 29.1 Million units by FY2020E
Passenger vehicle sales is expected to increase from 3.2 Million units in FY2013 to 9.0 Million units in FY2020E
Strong growth in demand due to rising income middle class and a young population is likely to propel India among
the world’s top five auto manufacturers by FY 2015
Production of automobiles have increased at a CAGR of 12.2% over FY05-13
Passenger vehicles and Commercial Vehicles are expected to increase at a CAGR of 16% during FY 2013-
20, while 2 & 3 wheelers are projected to expand at CAGR of 9% during 2013-20
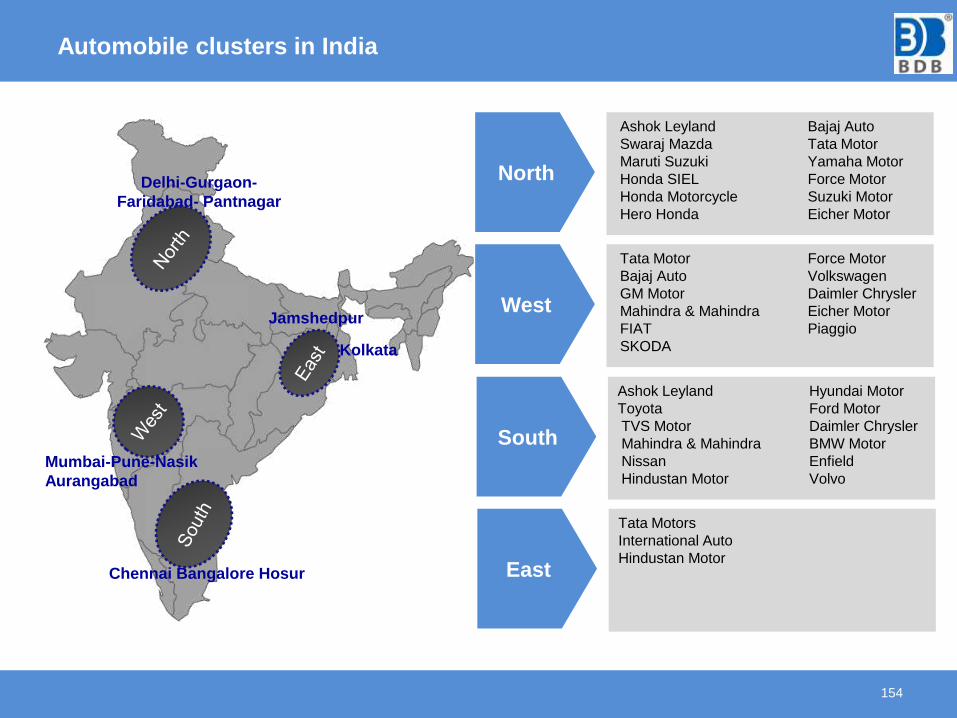
Automobile clusters in India
154
Delhi-Gurgaon-
Faridabad- Pantnagar
Kolkata
Mumbai-Pune-Nasik
Aurangabad
Jamshedpur
Chennai Bangalore Hosur
North
Ashok Leyland Bajaj Auto
Swaraj Mazda Tata Motor
Maruti Suzuki Yamaha Motor
Honda SIEL Force Motor
Honda Motorcycle Suzuki Motor
Hero Honda Eicher Motor
West
Tata Motor Force Motor
Bajaj Auto Volkswagen
GM Motor Daimler Chrysler
Mahindra & Mahindra Eicher Motor
FIAT Piaggio
SKODA
South
Ashok Leyland Hyundai Motor
Toyota Ford Motor
TVS Motor Daimler Chrysler
Mahindra & Mahindra BMW Motor
Nissan Enfield
Hindustan Motor Volvo
East
Tata Motors
International Auto
Hindustan Motor
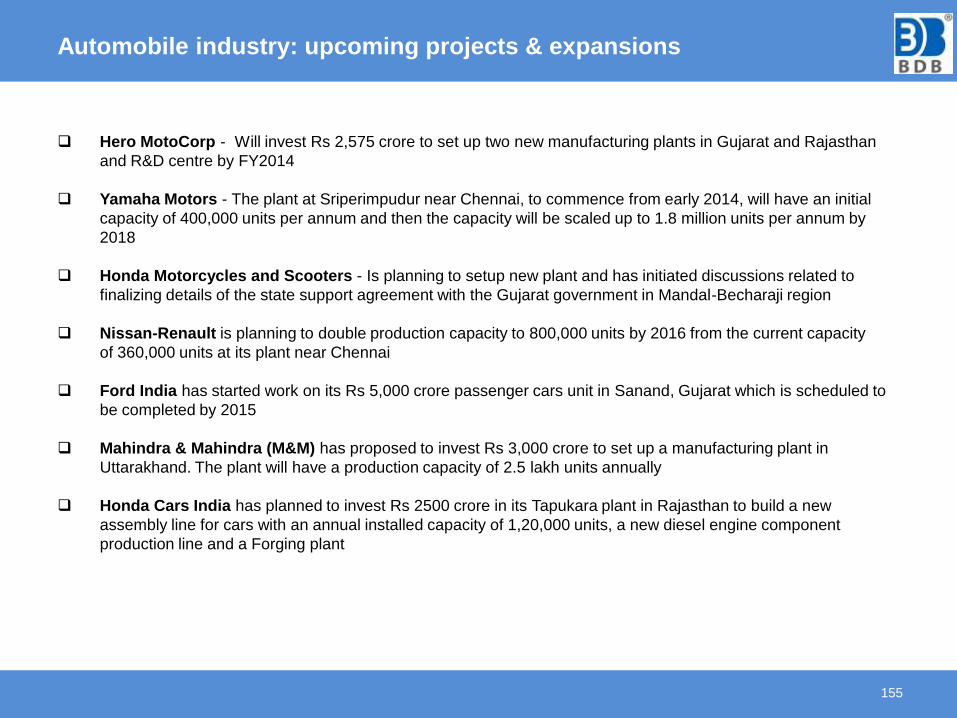
Automobile industry: upcoming projects & expansions
155
Hero MotoCorp - Will invest Rs 2,575 crore to set up two new manufacturing plants in Gujarat and Rajasthan
and R&D centre by FY2014
Yamaha Motors - The plant at Sriperimpudur near Chennai, to commence from early 2014, will have an initial
capacity of 400,000 units per annum and then the capacity will be scaled up to 1.8 million units per annum by
2018
Honda Motorcycles and Scooters - Is planning to setup new plant and has initiated discussions related to
finalizing details of the state support agreement with the Gujarat government in Mandal-Becharaji region
Nissan-Renault is planning to double production capacity to 800,000 units by 2016 from the current capacity
of 360,000 units at its plant near Chennai
Ford India has started work on its Rs 5,000 crore passenger cars unit in Sanand, Gujarat which is scheduled to
be completed by 2015
Mahindra & Mahindra (M&M) has proposed to invest Rs 3,000 crore to set up a manufacturing plant in
Uttarakhand. The plant will have a production capacity of 2.5 lakh units annually
Honda Cars India has planned to invest Rs 2500 crore in its Tapukara plant in Rajasthan to build a new
assembly line for cars with an annual installed capacity of 1,20,000 units, a new diesel engine component
production line and a Forging plant
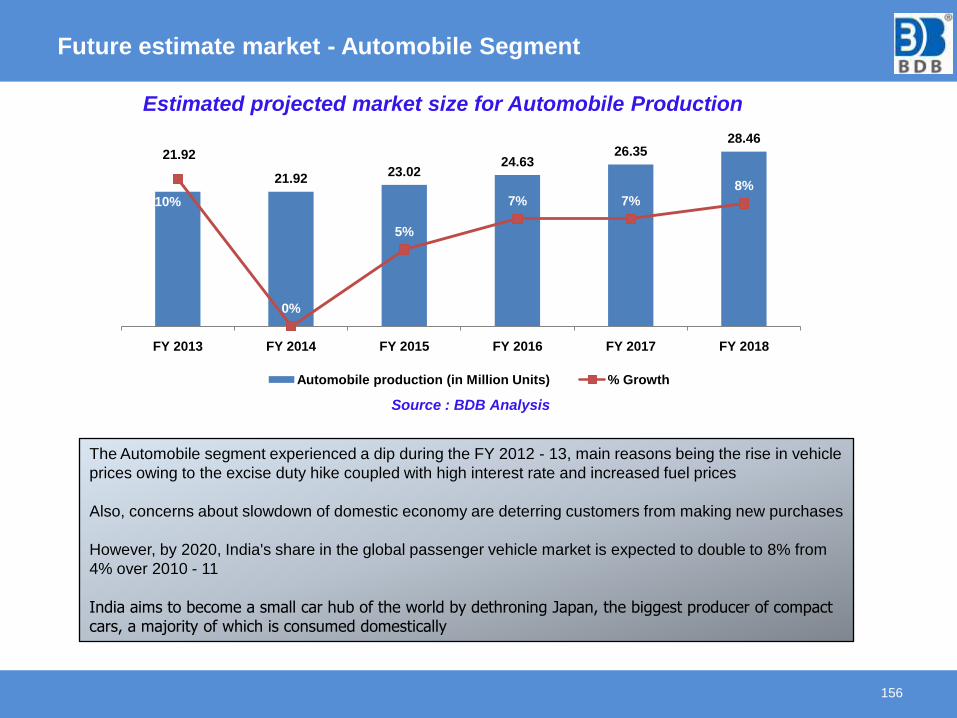
Future estimate market - Automobile Segment
156
Estimated projected market size for Automobile Production
The Automobile segment experienced a dip during the FY 2012 - 13, main reasons being the rise in vehicle
prices owing to the excise duty hike coupled with high interest rate and increased fuel prices
Also, concerns about slowdown of domestic economy are deterring customers from making new purchases
However, by 2020, India's share in the global passenger vehicle market is expected to double to 8% from
4% over 2010 - 11
India aims to become a small car hub of the world by dethroning Japan, the biggest producer of compact cars, a majority of which is consumed domestically
21.92
21.9223.02
24.6326.35
28.46
10%
0%
5%
7% 7%8%
0%
2%
4%
6%
8%
10%
12%
0
5
10
15
20
25
30
FY 2013 FY 2014 FY 2015 FY 2016 FY 2017 FY 2018
Automobile production (in Million Units) % Growth
Source : BDB Analysis
AUTO COMPONENTS INDUSTRY
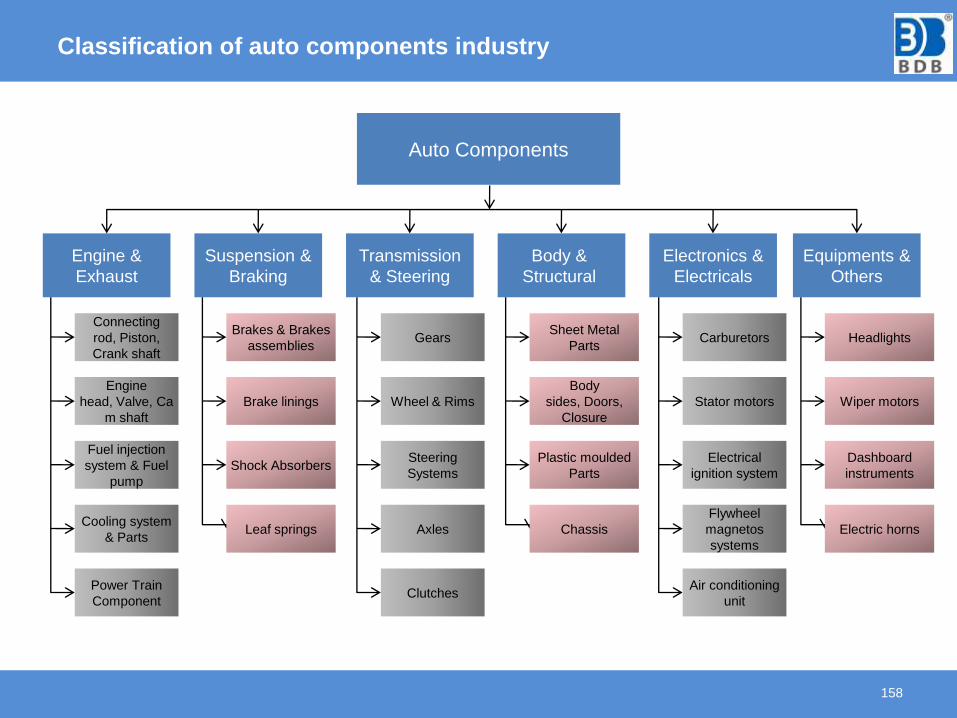
Classification of auto components industry
158
Auto Components
Engine &
Exhaust
Suspension &
Braking
Transmission
& Steering
Body &
Structural
Electronics &
Electricals
Equipments &
Others
Power Train
Component
Cooling system
& Parts
Fuel injection
system & Fuel
pump
Engine
head, Valve, Ca
m shaft
Connecting
rod, Piston,
Crank shaft
Leaf springs
Shock Absorbers
Brake linings
Brakes & Brakes
assemblies
Clutches
Axles
Steering
Systems
Wheel & Rims
Gears
Chassis
Plastic moulded
Parts
Body
sides, Doors,
Closure
Sheet Metal
Parts
Air conditioning
unit
Flywheel
magnetos
systems
Electrical
ignition system
Stator motors
Carburetors
Electric horns
Dashboard
instruments
Wiper motors
Headlights
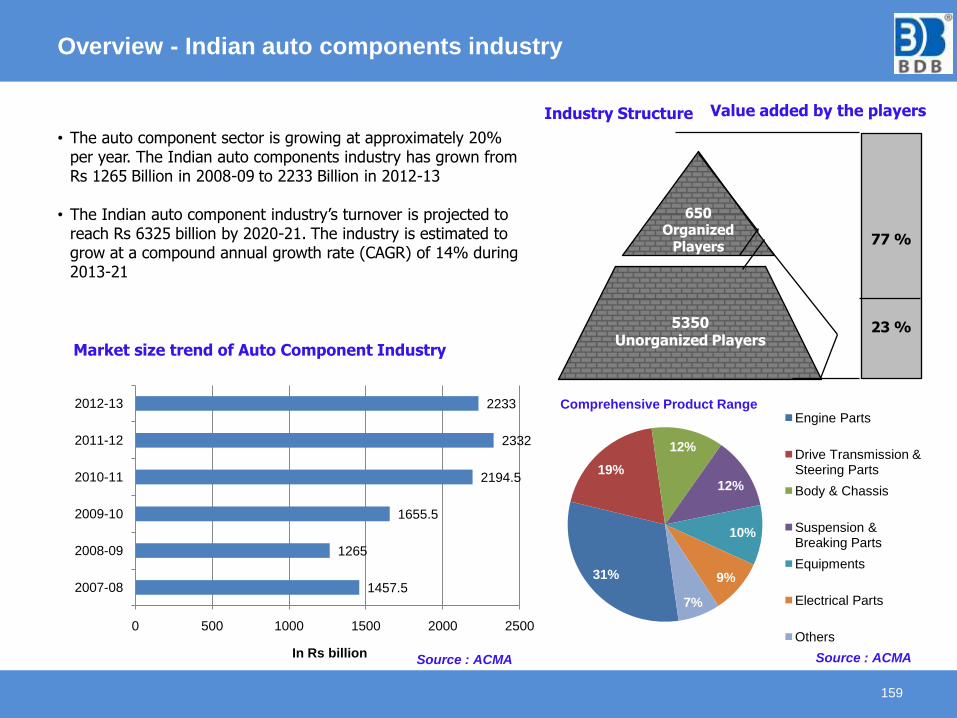
Overview - Indian auto components industry
159
650Organized
Players
5350 Unorganized Players
77 %
23 %
Industry Structure Value added by the players
Market size trend of Auto Component Industry
1457.5
1265
1655.5
2194.5
2332
2233
0 500 1000 1500 2000 2500
2007-08
2008-09
2009-10
2010-11
2011-12
2012-13
In Rs billion
• The auto component sector is growing at approximately 20% per year. The Indian auto components industry has grown from Rs 1265 Billion in 2008-09 to 2233 Billion in 2012-13
• The Indian auto component industry’s turnover is projected to reach Rs 6325 billion by 2020-21. The industry is estimated to grow at a compound annual growth rate (CAGR) of 14% during 2013-21
31%
19%
12%
12%
10%
9%
7%
Engine Parts
Drive Transmission & Steering Parts
Body & Chassis
Suspension & Breaking Parts
Equipments
Electrical Parts
Others
Comprehensive Product Range
Source : ACMA Source : ACMA
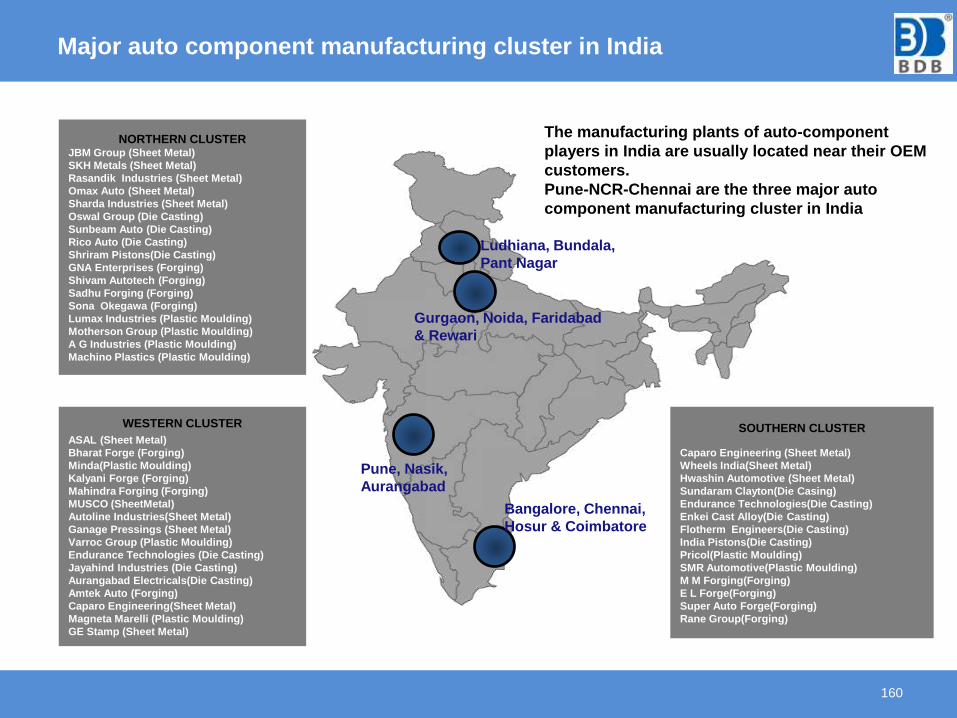
Major auto component manufacturing cluster in India
160
Ludhiana, Bundala,
Pant Nagar
WESTERN CLUSTER
ASAL (Sheet Metal)
Bharat Forge (Forging)
Minda(Plastic Moulding)
Kalyani Forge (Forging)
Mahindra Forging (Forging)
MUSCO (SheetMetal)
Autoline Industries(Sheet Metal)
Ganage Pressings (Sheet Metal)
Varroc Group (Plastic Moulding)
Endurance Technologies (Die Casting)
Jayahind Industries (Die Casting)
Aurangabad Electricals(Die Casting)
Amtek Auto (Forging)
Caparo Engineering(Sheet Metal)
Magneta Marelli (Plastic Moulding)
GE Stamp (Sheet Metal)
NORTHERN CLUSTERJBM Group (Sheet Metal)
SKH Metals (Sheet Metal)
Rasandik Industries (Sheet Metal)
Omax Auto (Sheet Metal)
Sharda Industries (Sheet Metal)
Oswal Group (Die Casting)
Sunbeam Auto (Die Casting)
Rico Auto (Die Casting)
Shriram Pistons(Die Casting)
GNA Enterprises (Forging)
Shivam Autotech (Forging)
Sadhu Forging (Forging)
Sona Okegawa (Forging)
Lumax Industries (Plastic Moulding)
Motherson Group (Plastic Moulding)
A G Industries (Plastic Moulding)
Machino Plastics (Plastic Moulding)
SOUTHERN CLUSTER
Caparo Engineering (Sheet Metal)
Wheels India(Sheet Metal)
Hwashin Automotive (Sheet Metal)
Sundaram Clayton(Die Casing)
Endurance Technologies(Die Casting)
Enkei Cast Alloy(Die Casting)
Flotherm Engineers(Die Casting)
India Pistons(Die Casting)
Pricol(Plastic Moulding)
SMR Automotive(Plastic Moulding)
M M Forging(Forging)
E L Forge(Forging)
Super Auto Forge(Forging)
Rane Group(Forging)
Gurgaon, Noida, Faridabad
& Rewari
Bangalore, Chennai,
Hosur & Coimbatore
Pune, Nasik,
Aurangabad
The manufacturing plants of auto-component
players in India are usually located near their OEM
customers.
Pune-NCR-Chennai are the three major auto
component manufacturing cluster in India
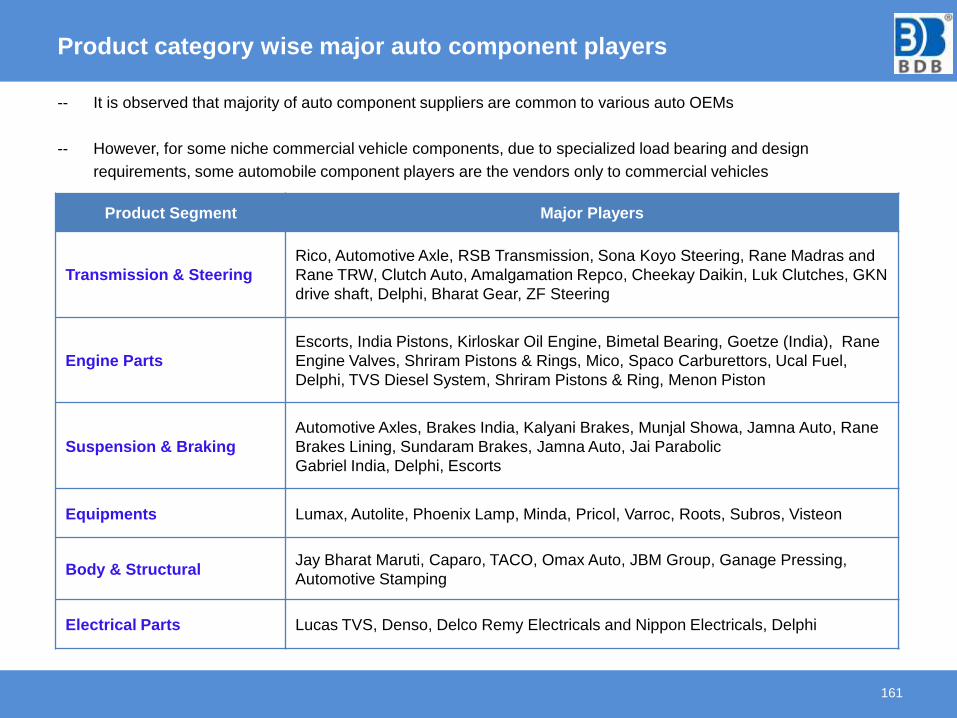
Product category wise major auto component players
161
-- It is observed that majority of auto component suppliers are common to various auto OEMs
-- However, for some niche commercial vehicle components, due to specialized load bearing and design
requirements, some automobile component players are the vendors only to commercial vehicles
Product Segment Major Players
Transmission & Steering
Rico, Automotive Axle, RSB Transmission, Sona Koyo Steering, Rane Madras and
Rane TRW, Clutch Auto, Amalgamation Repco, Cheekay Daikin, Luk Clutches, GKN
drive shaft, Delphi, Bharat Gear, ZF Steering
Engine Parts
Escorts, India Pistons, Kirloskar Oil Engine, Bimetal Bearing, Goetze (India), Rane
Engine Valves, Shriram Pistons & Rings, Mico, Spaco Carburettors, Ucal Fuel,
Delphi, TVS Diesel System, Shriram Pistons & Ring, Menon Piston
Suspension & Braking
Automotive Axles, Brakes India, Kalyani Brakes, Munjal Showa, Jamna Auto, Rane
Brakes Lining, Sundaram Brakes, Jamna Auto, Jai Parabolic
Gabriel India, Delphi, Escorts
Equipments Lumax, Autolite, Phoenix Lamp, Minda, Pricol, Varroc, Roots, Subros, Visteon
Body & StructuralJay Bharat Maruti, Caparo, TACO, Omax Auto, JBM Group, Ganage Pressing,
Automotive Stamping
Electrical Parts Lucas TVS, Denso, Delco Remy Electricals and Nippon Electricals, Delphi
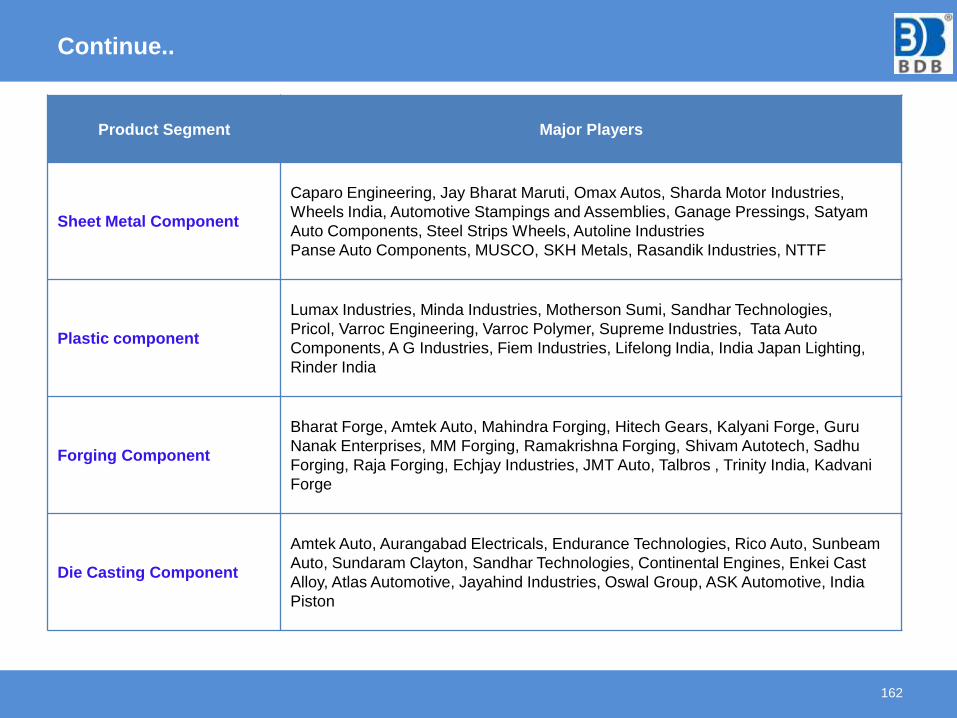
Continue..
162
Product Segment Major Players
Sheet Metal Component
Caparo Engineering, Jay Bharat Maruti, Omax Autos, Sharda Motor Industries,
Wheels India, Automotive Stampings and Assemblies, Ganage Pressings, Satyam
Auto Components, Steel Strips Wheels, Autoline Industries
Panse Auto Components, MUSCO, SKH Metals, Rasandik Industries, NTTF
Plastic component
Lumax Industries, Minda Industries, Motherson Sumi, Sandhar Technologies,
Pricol, Varroc Engineering, Varroc Polymer, Supreme Industries, Tata Auto
Components, A G Industries, Fiem Industries, Lifelong India, India Japan Lighting,
Rinder India
Forging Component
Bharat Forge, Amtek Auto, Mahindra Forging, Hitech Gears, Kalyani Forge, Guru
Nanak Enterprises, MM Forging, Ramakrishna Forging, Shivam Autotech, Sadhu
Forging, Raja Forging, Echjay Industries, JMT Auto, Talbros , Trinity India, Kadvani
Forge
Die Casting Component
Amtek Auto, Aurangabad Electricals, Endurance Technologies, Rico Auto, Sunbeam
Auto, Sundaram Clayton, Sandhar Technologies, Continental Engines, Enkei Cast
Alloy, Atlas Automotive, Jayahind Industries, Oswal Group, ASK Automotive, India
Piston
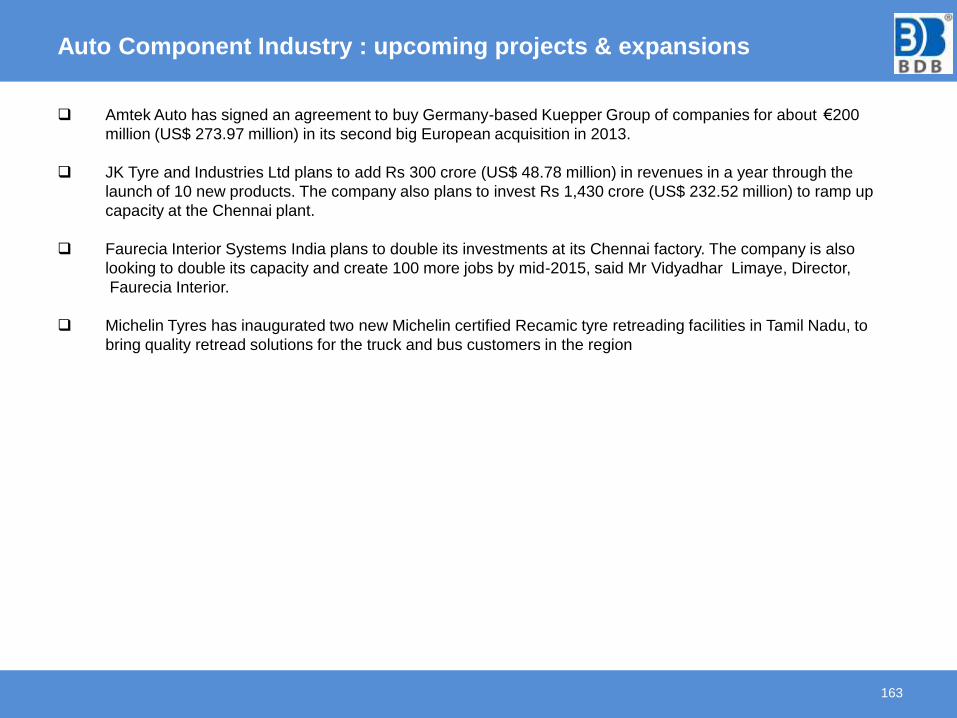
Auto Component Industry : upcoming projects & expansions
163
Amtek Auto has signed an agreement to buy Germany-based Kuepper Group of companies for about €200
million (US$ 273.97 million) in its second big European acquisition in 2013.
JK Tyre and Industries Ltd plans to add Rs 300 crore (US$ 48.78 million) in revenues in a year through the
launch of 10 new products. The company also plans to invest Rs 1,430 crore (US$ 232.52 million) to ramp up
capacity at the Chennai plant.
Faurecia Interior Systems India plans to double its investments at its Chennai factory. The company is also
looking to double its capacity and create 100 more jobs by mid-2015, said Mr Vidyadhar Limaye, Director,
Faurecia Interior.
Michelin Tyres has inaugurated two new Michelin certified Recamic tyre retreading facilities in Tamil Nadu, to
bring quality retread solutions for the truck and bus customers in the region
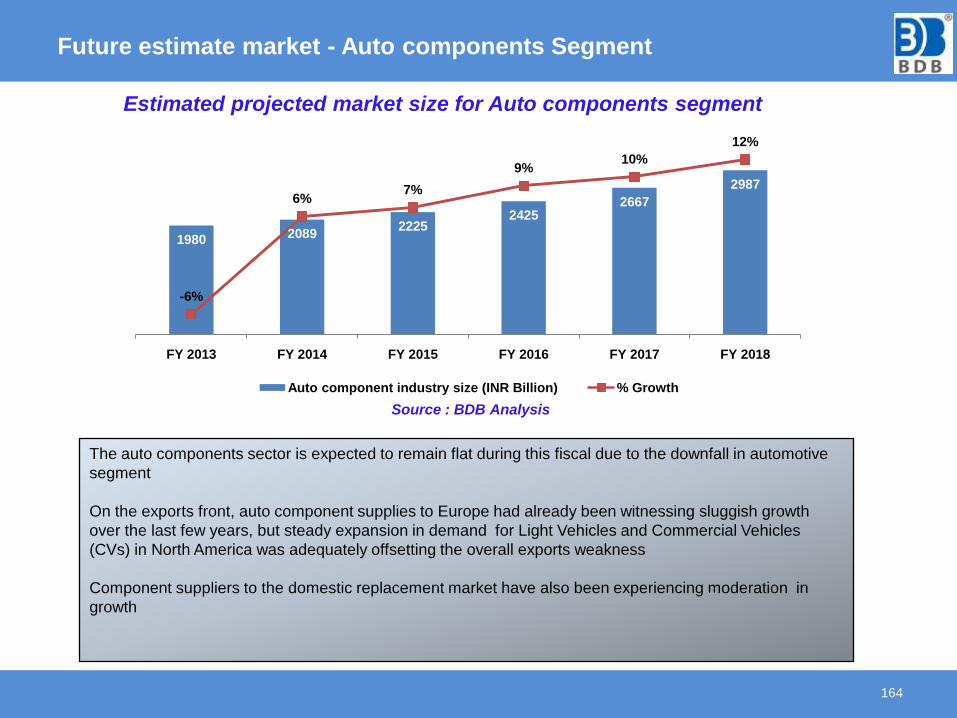
Future estimate market - Auto components Segment
164
Estimated projected market size for Auto components segment
The auto components sector is expected to remain flat during this fiscal due to the downfall in automotive
segment
On the exports front, auto component supplies to Europe had already been witnessing sluggish growth
over the last few years, but steady expansion in demand for Light Vehicles and Commercial Vehicles
(CVs) in North America was adequately offsetting the overall exports weakness
Component suppliers to the domestic replacement market have also been experiencing moderation in
growth
1980 20892225
24252667
2987
-6%
6%7%
9%10%
12%
-8%
-6%
-4%
-2%
0%
2%
4%
6%
8%
10%
12%
14%
0
500
1000
1500
2000
2500
3000
3500
FY 2013 FY 2014 FY 2015 FY 2016 FY 2017 FY 2018
Auto component industry size (INR Billion) % Growth
Source : BDB Analysis
GENERAL ENGINEERING (EXAMPLE -
PUMPS & COMPRESSOR, VALVES,
MOTORS,ETC)
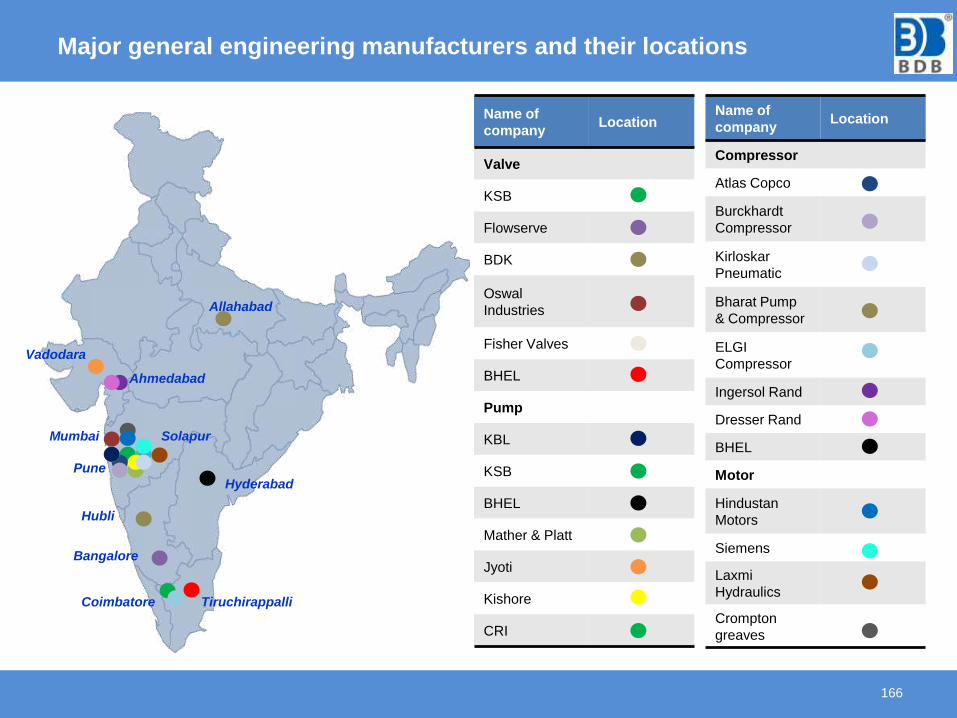
Major general engineering manufacturers and their locations
166
Name of
companyLocation
Valve
KSB
Flowserve
BDK
Oswal
Industries
Fisher Valves
BHEL
Pump
KBL
KSB
BHEL
Mather & Platt
Jyoti
Kishore
CRI
Name of
companyLocation
Compressor
Atlas Copco
Burckhardt
Compressor
Kirloskar
Pneumatic
Bharat Pump
& Compressor
ELGI
Compressor
Ingersol Rand
Dresser Rand
BHEL
Motor
Hindustan
Motors
Siemens
Laxmi
Hydraulics
Crompton
greaves
Allahabad
Pune
Bangalore
Tiruchirappalli
Hubli
Vadodara
Mumbai
Hyderabad
Coimbatore
Ahmedabad
Solapur
Overview
India has a strong engineering and capital goods base. The engineering sector is the largest
segment of Indian Industry
The General Engineering sector constitute the sector such as Turbines, Boilers, Pumps, Valves, Gear
Box, Compressors and Machine Tools
The engineering sector in India has been growing on the back of growth in the user industries
Capacity creation in end user sectors such as Power, Mining, Automobiles, Auto
components, Steel, Cement, Oil & Gas, Infrastructure etc, is driving growth of the engineering
industry
As the sector demands a high level of capability and investment, it is mainly dominated by large
organised players
167
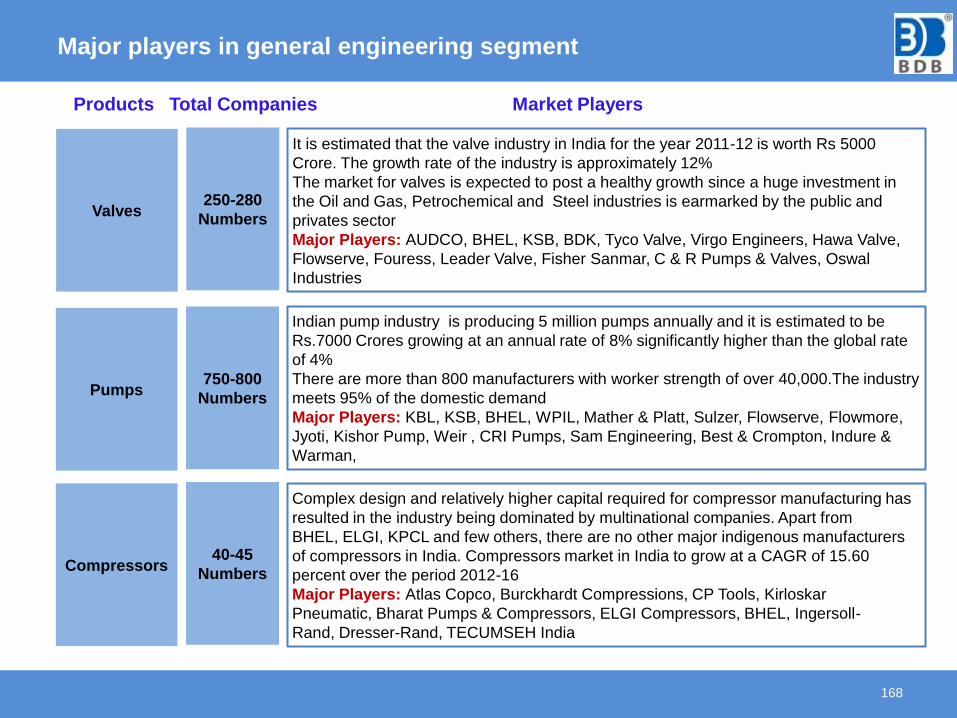
Major players in general engineering segment
168
Products Total Companies Market Players
It is estimated that the valve industry in India for the year 2011-12 is worth Rs 5000
Crore. The growth rate of the industry is approximately 12%
The market for valves is expected to post a healthy growth since a huge investment in
the Oil and Gas, Petrochemical and Steel industries is earmarked by the public and
privates sector
Major Players: AUDCO, BHEL, KSB, BDK, Tyco Valve, Virgo Engineers, Hawa Valve,
Flowserve, Fouress, Leader Valve, Fisher Sanmar, C & R Pumps & Valves, Oswal
Industries
Valves250-280
Numbers
Indian pump industry is producing 5 million pumps annually and it is estimated to be
Rs.7000 Crores growing at an annual rate of 8% significantly higher than the global rate
of 4%
There are more than 800 manufacturers with worker strength of over 40,000.The industry
meets 95% of the domestic demand
Major Players: KBL, KSB, BHEL, WPIL, Mather & Platt, Sulzer, Flowserve, Flowmore,
Jyoti, Kishor Pump, Weir , CRI Pumps, Sam Engineering, Best & Crompton, Indure &
Warman,
Pumps750-800
Numbers
Complex design and relatively higher capital required for compressor manufacturing has
resulted in the industry being dominated by multinational companies. Apart from
BHEL, ELGI, KPCL and few others, there are no other major indigenous manufacturers
of compressors in India. Compressors market in India to grow at a CAGR of 15.60
percent over the period 2012-16
Major Players: Atlas Copco, Burckhardt Compressions, CP Tools, Kirloskar
Pneumatic, Bharat Pumps & Compressors, ELGI Compressors, BHEL, Ingersoll-
Rand, Dresser-Rand, TECUMSEH India
Compressors40-45
Numbers
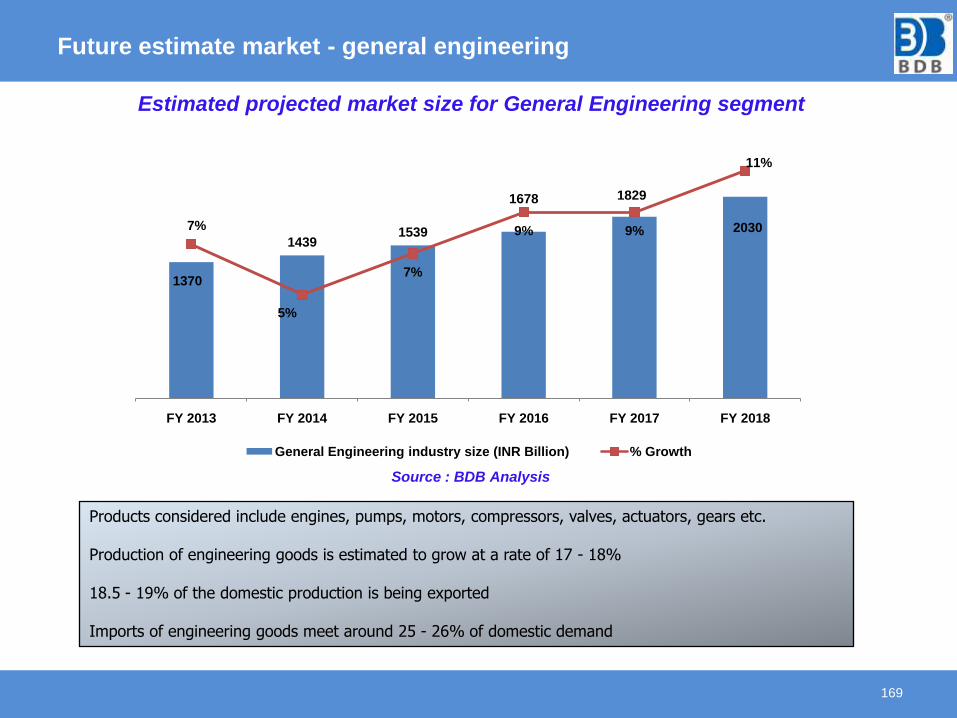
Future estimate market - general engineering
169
Products considered include engines, pumps, motors, compressors, valves, actuators, gears etc.
Production of engineering goods is estimated to grow at a rate of 17 - 18%
18.5 - 19% of the domestic production is being exported
Imports of engineering goods meet around 25 - 26% of domestic demand
Estimated projected market size for General Engineering segment
1370
14391539
1678 1829
20307%
5%
7%
9% 9%
11%
0%
2%
4%
6%
8%
10%
12%
0
500
1000
1500
2000
2500
FY 2013 FY 2014 FY 2015 FY 2016 FY 2017 FY 2018
General Engineering industry size (INR Billion) % Growth
Source : BDB Analysis
HEAVY ENGINEERING
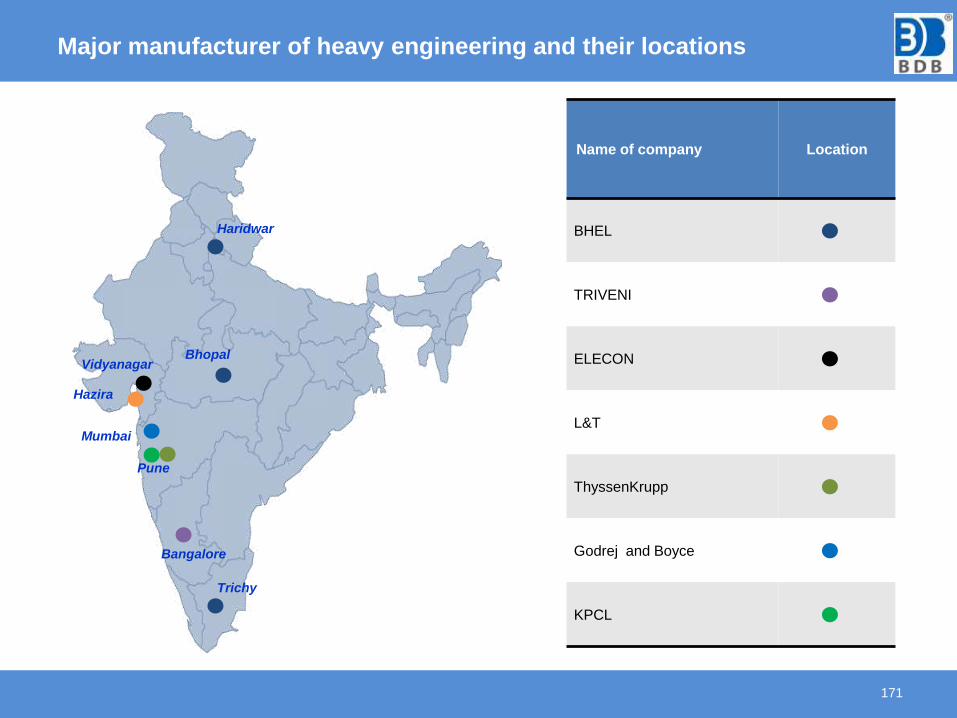
Name of company Location
BHEL
TRIVENI
ELECON
L&T
ThyssenKrupp
Godrej and Boyce
KPCL
Major manufacturer of heavy engineering and their locations
171
Pune
Bhopal
Mumbai
Bangalore
Haridwar
Trichy
Hazira
Vidyanagar
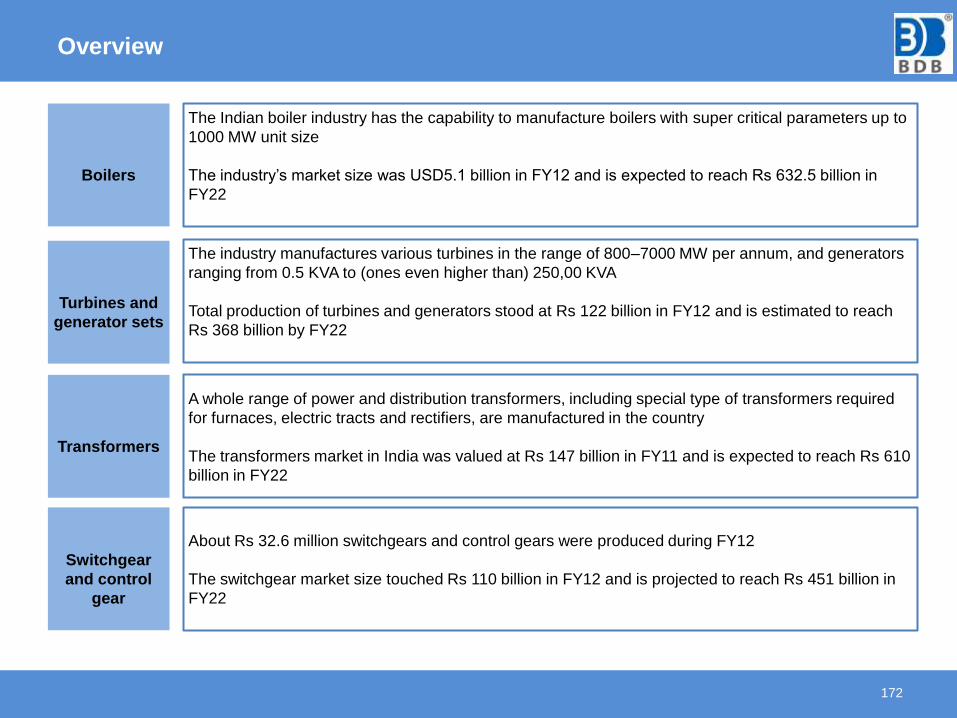
Overview
172
The Indian boiler industry has the capability to manufacture boilers with super critical parameters up to
1000 MW unit size
The industry’s market size was USD5.1 billion in FY12 and is expected to reach Rs 632.5 billion in
FY22
Boilers
The industry manufactures various turbines in the range of 800–7000 MW per annum, and generators
ranging from 0.5 KVA to (ones even higher than) 250,00 KVA
Total production of turbines and generators stood at Rs 122 billion in FY12 and is estimated to reach
Rs 368 billion by FY22
Turbines and
generator sets
A whole range of power and distribution transformers, including special type of transformers required
for furnaces, electric tracts and rectifiers, are manufactured in the country
The transformers market in India was valued at Rs 147 billion in FY11 and is expected to reach Rs 610
billion in FY22
Transformers
About Rs 32.6 million switchgears and control gears were produced during FY12
The switchgear market size touched Rs 110 billion in FY12 and is projected to reach Rs 451 billion in
FY22
Switchgear
and control
gear
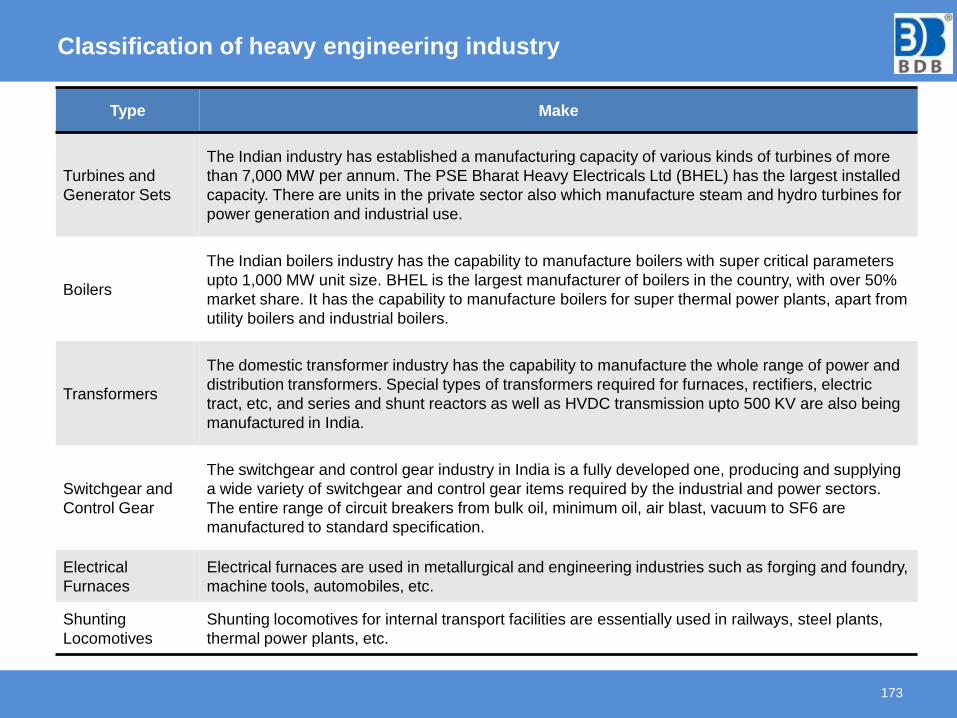
Classification of heavy engineering industry
173
Type Make
Turbines and
Generator Sets
The Indian industry has established a manufacturing capacity of various kinds of turbines of more
than 7,000 MW per annum. The PSE Bharat Heavy Electricals Ltd (BHEL) has the largest installed
capacity. There are units in the private sector also which manufacture steam and hydro turbines for
power generation and industrial use.
Boilers
The Indian boilers industry has the capability to manufacture boilers with super critical parameters
upto 1,000 MW unit size. BHEL is the largest manufacturer of boilers in the country, with over 50%
market share. It has the capability to manufacture boilers for super thermal power plants, apart from
utility boilers and industrial boilers.
Transformers
The domestic transformer industry has the capability to manufacture the whole range of power and
distribution transformers. Special types of transformers required for furnaces, rectifiers, electric
tract, etc, and series and shunt reactors as well as HVDC transmission upto 500 KV are also being
manufactured in India.
Switchgear and
Control Gear
The switchgear and control gear industry in India is a fully developed one, producing and supplying
a wide variety of switchgear and control gear items required by the industrial and power sectors.
The entire range of circuit breakers from bulk oil, minimum oil, air blast, vacuum to SF6 are
manufactured to standard specification.
Electrical
Furnaces
Electrical furnaces are used in metallurgical and engineering industries such as forging and foundry,
machine tools, automobiles, etc.
Shunting
Locomotives
Shunting locomotives for internal transport facilities are essentially used in railways, steel plants,
thermal power plants, etc.
Upcoming investment in heavy engineering industry
174
Tata Power has signed an exclusive partnership agreement with SN Power, Norway, to set up joint ventures for
developing hydropower projects in India and Nepal. Tata Power and SN Power are developing Dugar hydro
project and are pursuing project opportunities in the vast hydro potential available in the Himalayan region. The
partners aim to have 2000 MW under construction or in operation by 2015, and a total of 4000 MW by 2020
Welspun Energy Ltd (WEL) has commissioned its first solar power project in Karnataka of 8 megawatt (MW)
capacity.
Suzlon Group subsidiary REpower Systems SE has concluded two contracts with France-based GDF- SUEZ
Futures Energies for supply of 20 wind turbines MM92 and MM82 types with a nominal output of 2.05 MW
totaling 40 MW.
France-based energy company GDF Suez SA has consolidated its India presence with the acquisition of a 74
per cent stake in Meenakshi Energy and Infrastructure Holdings Pvt Ltd. The company is executing a 1,000
MW thermal power plant at Krishnapatnam in Nellore district of Andhra Pradesh.
Dubai-based Coal & Oil (C&O) Group, plans to build a 1,200 MW thermal plant in Tuticorin district of Tamil
Nadu for Rs 6,800 crore (US$ 1.11 billion ). The company also plans to invest another Rs 10,000 crore (US$
1.63 billion) to increase the capacity by 1,600 MW to 2,800 MW.
BHEL has renovated and modernized a 200 MW thermal power unit at Obra in Uttar Pradesh. This is a Russian
machine and being used by Uttar Pradesh Rajya Vidyut Utpaadan Nigam Ltd.
A roof top, solar photovoltaic power plant has been commissioned at the Sri Vishnu Educational Society,
Bhimavaram Campus in West Godavari district. The plant has an installed capacity to generate around 300,000
units per year
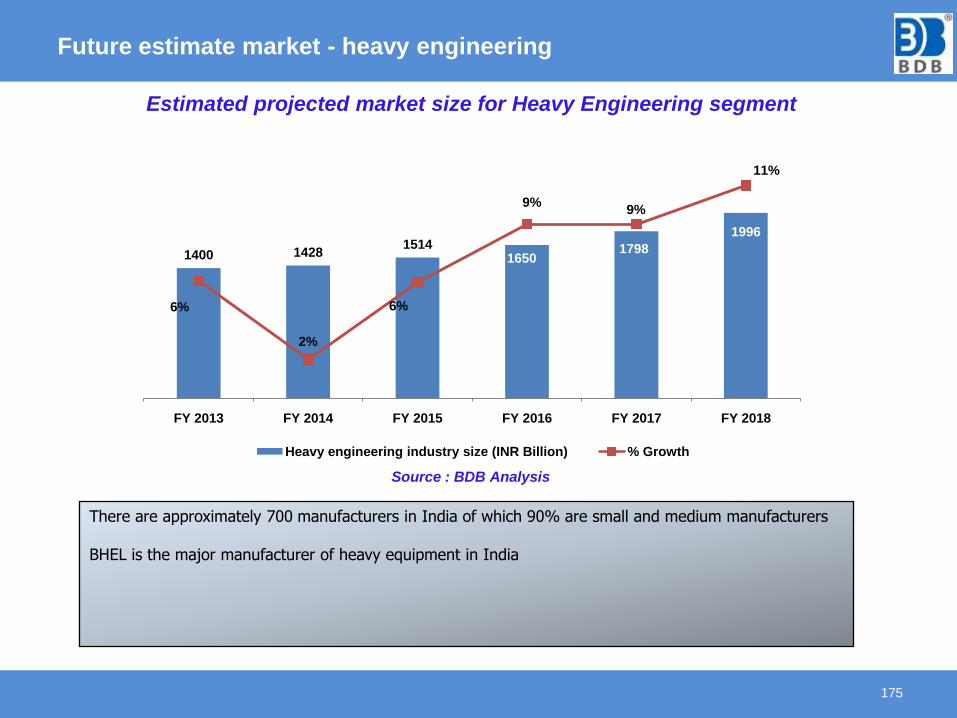
Future estimate market - heavy engineering
175
There are approximately 700 manufacturers in India of which 90% are small and medium manufacturers
BHEL is the major manufacturer of heavy equipment in India
Estimated projected market size for Heavy Engineering segment
1400 14281514
16501798
1996
6%
2%
6%
9%9%
11%
0%
2%
4%
6%
8%
10%
12%
0
500
1000
1500
2000
2500
FY 2013 FY 2014 FY 2015 FY 2016 FY 2017 FY 2018
Heavy engineering industry size (INR Billion) % Growth
Source : BDB Analysis
AEROSPACE & DEFENCE INDUSTRY
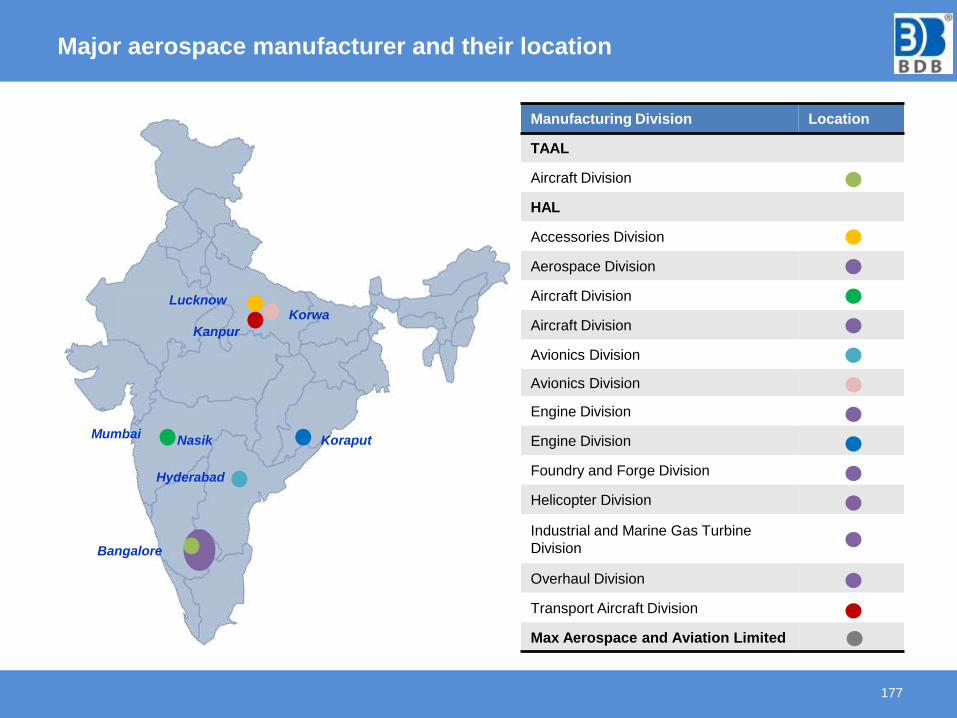
Major aerospace manufacturer and their location
177
Manufacturing Division Location
TAAL
Aircraft Division
HAL
Accessories Division
Aerospace Division
Aircraft Division
Aircraft Division
Avionics Division
Avionics Division
Engine Division
Engine Division
Foundry and Forge Division
Helicopter Division
Industrial and Marine Gas Turbine
Division
Overhaul Division
Transport Aircraft Division
Max Aerospace and Aviation Limited
Bangalore
Hyderabad
Koraput
KorwaLucknow
Kanpur
NasikMumbai
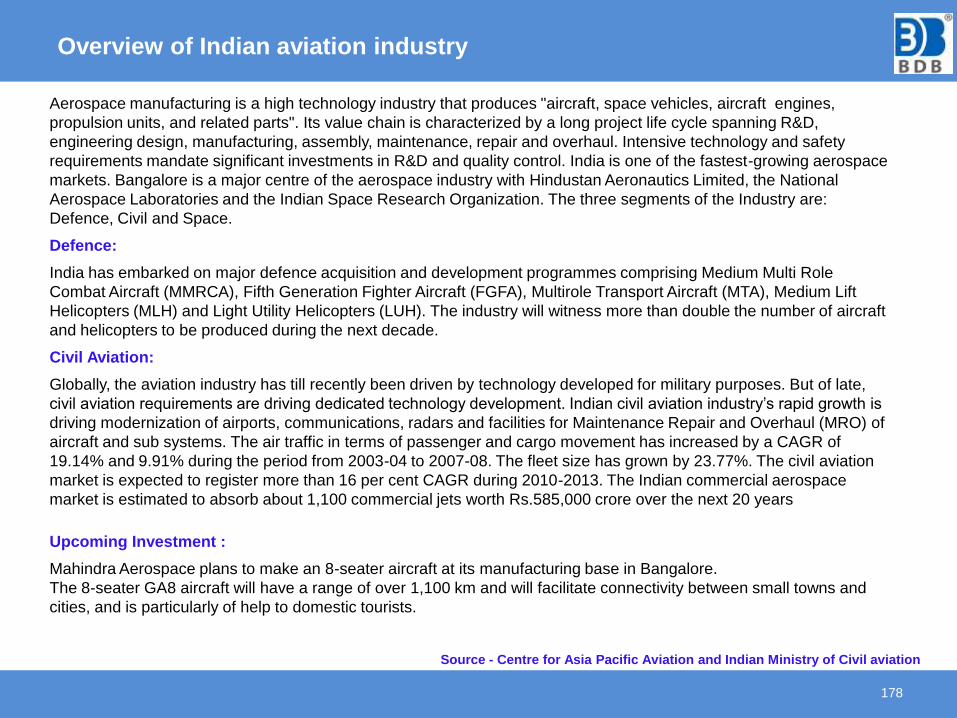
Overview of Indian aviation industry
178
Aerospace manufacturing is a high technology industry that produces "aircraft, space vehicles, aircraft engines,
propulsion units, and related parts". Its value chain is characterized by a long project life cycle spanning R&D,
engineering design, manufacturing, assembly, maintenance, repair and overhaul. Intensive technology and safety
requirements mandate significant investments in R&D and quality control. India is one of the fastest-growing aerospace
markets. Bangalore is a major centre of the aerospace industry with Hindustan Aeronautics Limited, the National
Aerospace Laboratories and the Indian Space Research Organization. The three segments of the Industry are:
Defence, Civil and Space.
Defence:
India has embarked on major defence acquisition and development programmes comprising Medium Multi Role
Combat Aircraft (MMRCA), Fifth Generation Fighter Aircraft (FGFA), Multirole Transport Aircraft (MTA), Medium Lift
Helicopters (MLH) and Light Utility Helicopters (LUH). The industry will witness more than double the number of aircraft
and helicopters to be produced during the next decade.
Civil Aviation:
Globally, the aviation industry has till recently been driven by technology developed for military purposes. But of late,
civil aviation requirements are driving dedicated technology development. Indian civil aviation industry’s rapid growth is
driving modernization of airports, communications, radars and facilities for Maintenance Repair and Overhaul (MRO) of
aircraft and sub systems. The air traffic in terms of passenger and cargo movement has increased by a CAGR of
19.14% and 9.91% during the period from 2003-04 to 2007-08. The fleet size has grown by 23.77%. The civil aviation
market is expected to register more than 16 per cent CAGR during 2010-2013. The Indian commercial aerospace
market is estimated to absorb about 1,100 commercial jets worth Rs.585,000 crore over the next 20 years
Source - Centre for Asia Pacific Aviation and Indian Ministry of Civil aviation
Upcoming Investment :
Mahindra Aerospace plans to make an 8-seater aircraft at its manufacturing base in Bangalore.
The 8-seater GA8 aircraft will have a range of over 1,100 km and will facilitate connectivity between small towns and
cities, and is particularly of help to domestic tourists.
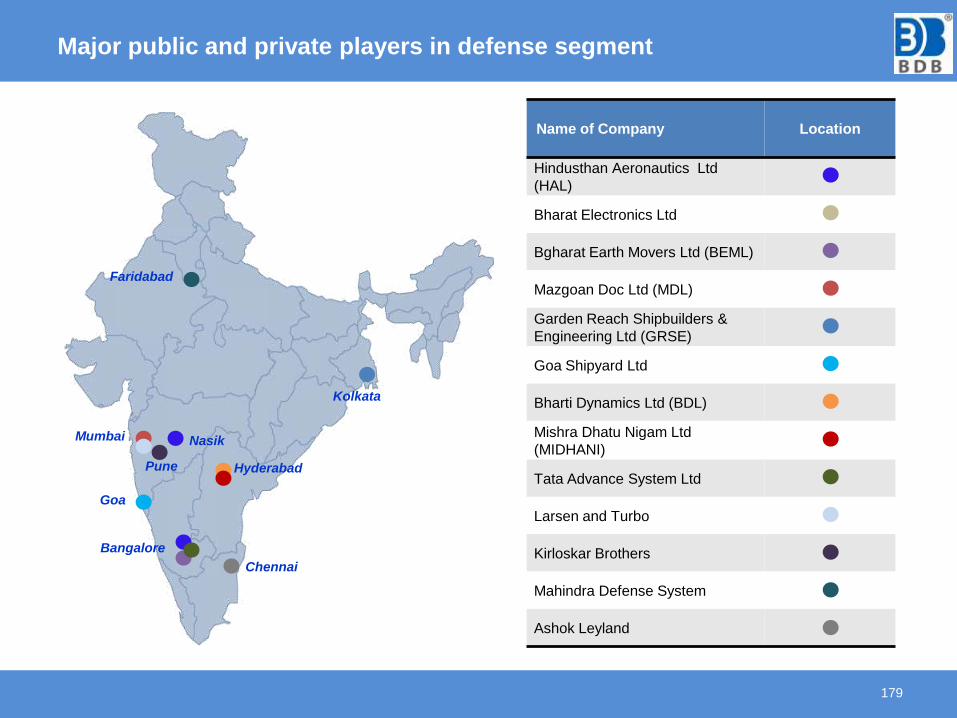
Major public and private players in defense segment
179
Name of Company Location
Hindusthan Aeronautics Ltd
(HAL)
Bharat Electronics Ltd
Bgharat Earth Movers Ltd (BEML)
Mazgoan Doc Ltd (MDL)
Garden Reach Shipbuilders &
Engineering Ltd (GRSE)
Goa Shipyard Ltd
Bharti Dynamics Ltd (BDL)
Mishra Dhatu Nigam Ltd
(MIDHANI)
Tata Advance System Ltd
Larsen and Turbo
Kirloskar Brothers
Mahindra Defense System
Ashok Leyland
Kolkata
NasikMumbai
Goa
Bangalore
HyderabadPune
Faridabad
Chennai
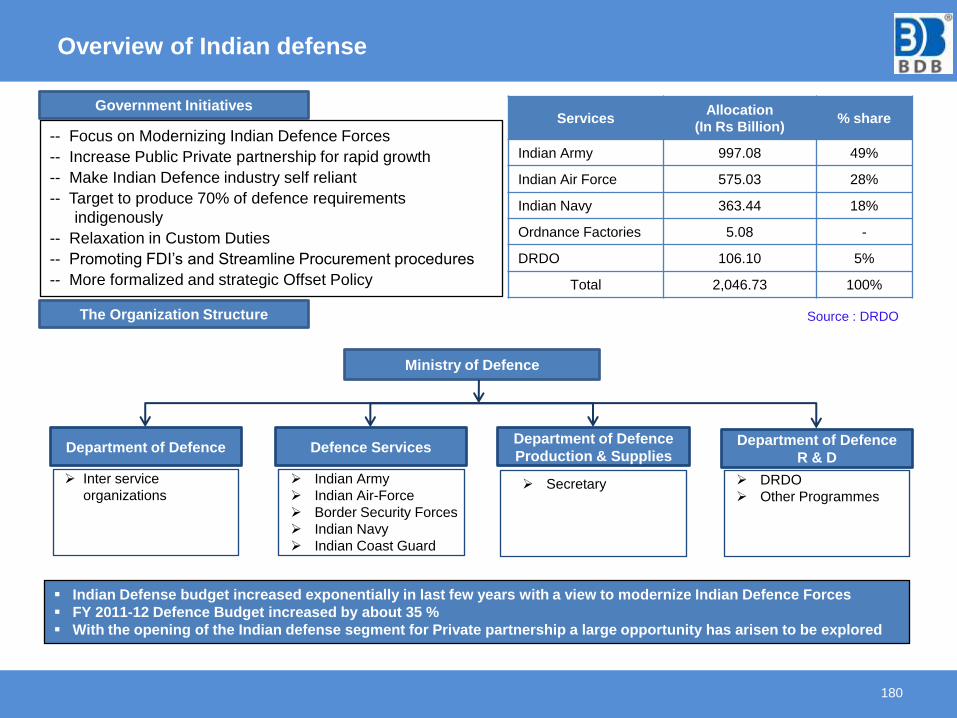
Overview of Indian defense
180
ServicesAllocation
(In Rs Billion)% share
Indian Army 997.08 49%
Indian Air Force 575.03 28%
Indian Navy 363.44 18%
Ordnance Factories 5.08 -
DRDO 106.10 5%
Total 2,046.73 100%
-- Focus on Modernizing Indian Defence Forces
-- Increase Public Private partnership for rapid growth
-- Make Indian Defence industry self reliant
-- Target to produce 70% of defence requirements
indigenously
-- Relaxation in Custom Duties
-- Promoting FDI’s and Streamline Procurement procedures
-- More formalized and strategic Offset Policy
Government Initiatives
The Organization Structure
Indian Defense budget increased exponentially in last few years with a view to modernize Indian Defence Forces
FY 2011-12 Defence Budget increased by about 35 %
With the opening of the Indian defense segment for Private partnership a large opportunity has arisen to be explored
Ministry of Defence
Department of Defence Defence ServicesDepartment of Defence
Production & SuppliesDepartment of Defence
R & D
Inter service
organizations
Indian Army
Indian Air-Force
Border Security Forces
Indian Navy
Indian Coast Guard
Secretary DRDO
Other Programmes
Source : DRDO
Continue...
181
The Defense Research and Development Organisation (DRDO) were establish in 1958 with only 10 laboratories, DRDO
has grown multi-dimensionally and evolved to be core research organisation with vast network of 52 laboratories and
establishment spread across the country.
Defense Ordinance Factories
Indian Ordinance Factories comes under the department of defense production of ministry of defense. It is conglomerate
of 39 factories, 9 training institutes, 3 regional marketing center, 4 regional controller of safety. Ordinance factor board
(OFD) provides abroad and versatile production base with multi-technology capabilities, state of art manufacturing
facilities.
Private sector in Indian Defense Industry
Private sector has been mainly involved in supply of raw materials, semi-finished products, parts and component to
defense PSUs and ordinance factories to a great extent and also base workshop of army and base repair depots of air
force and the Dockyard of navy. Defense PSUs and Ordinance factories are outsourcing their requirement from private
sector mainly (mainly SMEs) in the range of 20-25%. Out of this outsourcing 25% requirement met through the small
scale industries
DIE & MOULD
Introduction
183
The Indian tool room industry today is principally composed of captive units and commercial units.
The rapid growth of industries like automobiles and auto components, domestic appliances, consumer
electronics and consumer durables in the wake of rising economic growth and the consumer tendency
towards spending, would ensure expanding need for dies, tools and gauges.
The growth in engineering industry has led to the need for a variety of tooling and related products.
Commercial Tool Rooms (CTRs) are more than 35 years old and supply tooling on a commercial basis
to a variety of industries and operate as independent companies.
There are around 115 CTRs in the country. These exclude over 500+ small units.
The current estimated value of tool making (press tools, plastic moulds, die casting tools, jigs and
fixtures and gauges) in India is in the region of US $ 50 million with scope to grow at double digits
growth rate every year.
Most Indian tool rooms are capable of taking on global business. They have invested and maintained
their infrastructure equivalent to the best in the world.
The same class of quality machines, raw materials and manufacturing processes are imported from
world leaders. These combined with the intellect and class of indigenous manufacturing practices
makes Indian tooling industry at par with the best in the world.
The dies & moulds industry in India has always responded positively to the challenges thrown by its
parent industries through constantly innovating and upgrading the processes and manufacturing
techniques.
The technological developments seen in recent products are the outcome of the innovations done by the
dies & moulds industry in the background.
Continue…
184
All possible engineering innovations find their application in dies & moulds industries, which is
unparalleled compared to any other developmental industries. The application of technologies such as
simple slider mechanisms to Archimedean screws for converting movements in different directions and
forms are very common in dies & moulds.
Although the industry is rapidly upgrading itself in terms of quality it is struggling to acquire a reputation
in the local market for honoring delivery commitments.
Overall, the industry lags behind competitive countries like China, Singapore, Thailand, Malaysia and
Taiwan. It is yet to receive the distinction of being the most preferred destination for mould shopping
industries.
Big players in the Indian tooling industries are mainly separate business units diversified from the
captive businesses of large groups having a huge infrastructure but not competitive in terms of delivery
and cost.
The Indian dies & moulds industry is largely unorganized and has local and smaller players, however
major OEMs like TATA Motors, Mahindra & Mahindra have their own dies & moulds manufacturing
plants.
Large forging companies also have their in house dies & moulds manufacturing unit. However, a
certain amount of outsourcing also happens.
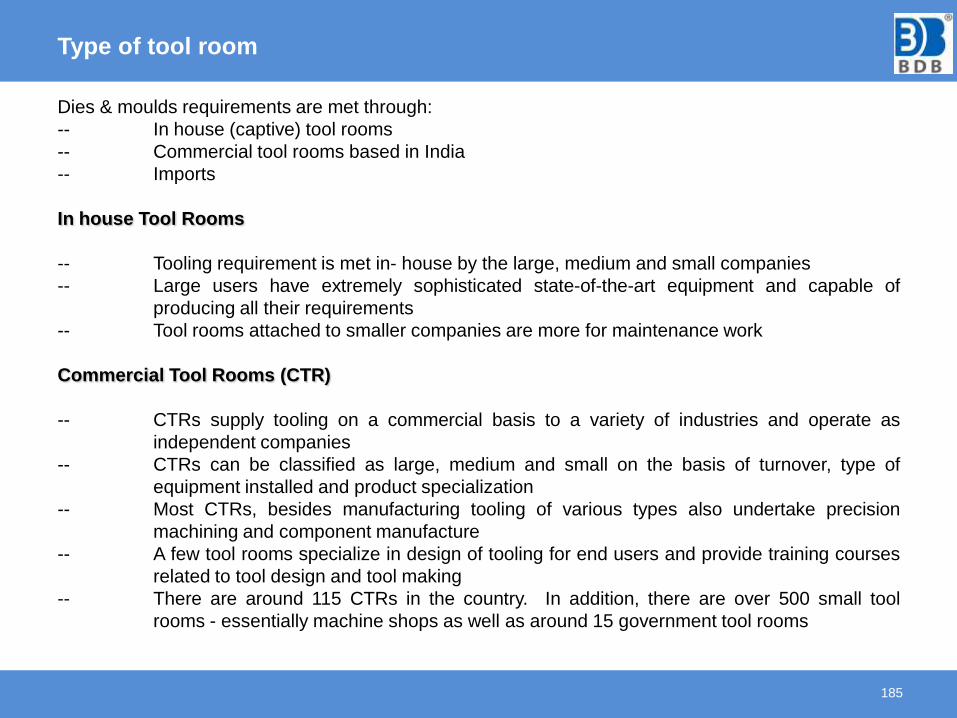
Type of tool room
185
Dies & moulds requirements are met through:
-- In house (captive) tool rooms
-- Commercial tool rooms based in India
-- Imports
In house Tool Rooms
-- Tooling requirement is met in- house by the large, medium and small companies
-- Large users have extremely sophisticated state-of-the-art equipment and capable of
producing all their requirements
-- Tool rooms attached to smaller companies are more for maintenance work
Commercial Tool Rooms (CTR)
-- CTRs supply tooling on a commercial basis to a variety of industries and operate as
independent companies
-- CTRs can be classified as large, medium and small on the basis of turnover, type of
equipment installed and product specialization
-- Most CTRs, besides manufacturing tooling of various types also undertake precision
machining and component manufacture
-- A few tool rooms specialize in design of tooling for end users and provide training courses
related to tool design and tool making
-- There are around 115 CTRs in the country. In addition, there are over 500 small tool
rooms - essentially machine shops as well as around 15 government tool rooms
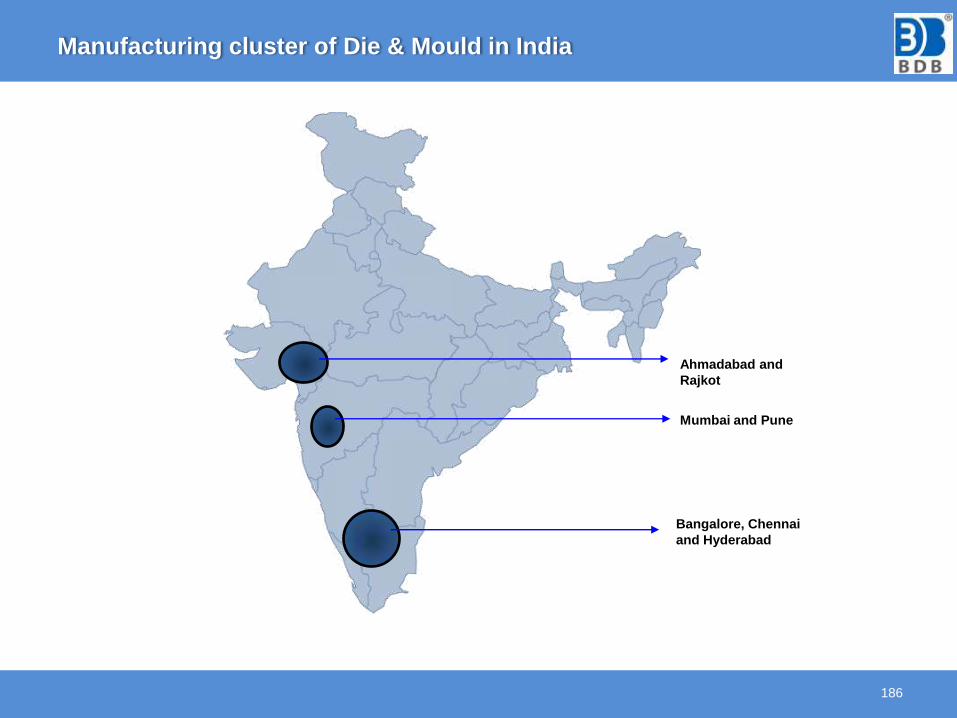
Manufacturing cluster of Die & Mould in India
186
Mumbai and Pune
Ahmadabad and
Rajkot
Bangalore, Chennai
and Hyderabad
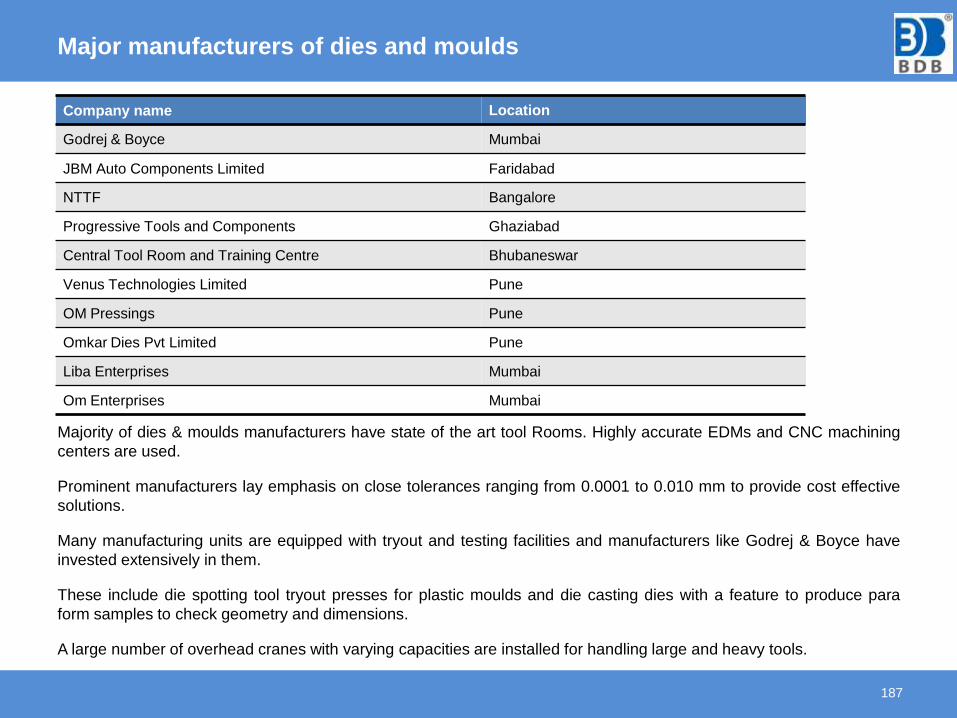
Major manufacturers of dies and moulds
187
Company name Location
Godrej & Boyce Mumbai
JBM Auto Components Limited Faridabad
NTTF Bangalore
Progressive Tools and Components Ghaziabad
Central Tool Room and Training Centre Bhubaneswar
Venus Technologies Limited Pune
OM Pressings Pune
Omkar Dies Pvt Limited Pune
Liba Enterprises Mumbai
Om Enterprises Mumbai
Majority of dies & moulds manufacturers have state of the art tool Rooms. Highly accurate EDMs and CNC machining
centers are used.
Prominent manufacturers lay emphasis on close tolerances ranging from 0.0001 to 0.010 mm to provide cost effective
solutions.
Many manufacturing units are equipped with tryout and testing facilities and manufacturers like Godrej & Boyce have
invested extensively in them.
These include die spotting tool tryout presses for plastic moulds and die casting dies with a feature to produce para
form samples to check geometry and dimensions.
A large number of overhead cranes with varying capacities are installed for handling large and heavy tools.
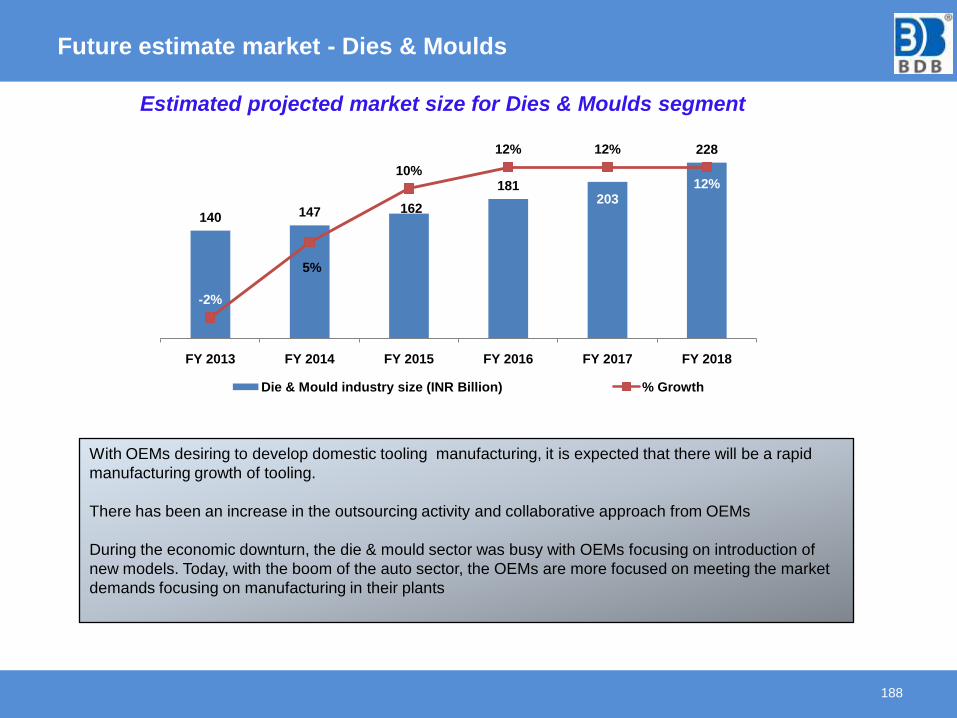
Future estimate market - Dies & Moulds
188
With OEMs desiring to develop domestic tooling manufacturing, it is expected that there will be a rapid
manufacturing growth of tooling.
There has been an increase in the outsourcing activity and collaborative approach from OEMs
During the economic downturn, the die & mould sector was busy with OEMs focusing on introduction of
new models. Today, with the boom of the auto sector, the OEMs are more focused on meeting the market
demands focusing on manufacturing in their plants
Estimated projected market size for Dies & Moulds segment
140 147 162
181203
228
-2%
5%
10%
12% 12%
12%
-4%
-2%
0%
2%
4%
6%
8%
10%
12%
14%
0
50
100
150
200
250
FY 2013 FY 2014 FY 2015 FY 2016 FY 2017 FY 2018
Die & Mould industry size (INR Billion) % Growth
APPENDIX I
Market Forecasting : Methodology
Multiple linear regression is a quantitative method of forecasting
involving the use of multiple independent variables to predict or forecast
the dependent variable
Multiple linear regression should be considered in any situation where
several factors acting simultaneously are likely to have an effect on the
aspect under consideration.
Selecting the proper factors to use as independent variables is an
essential part of regression analysis.
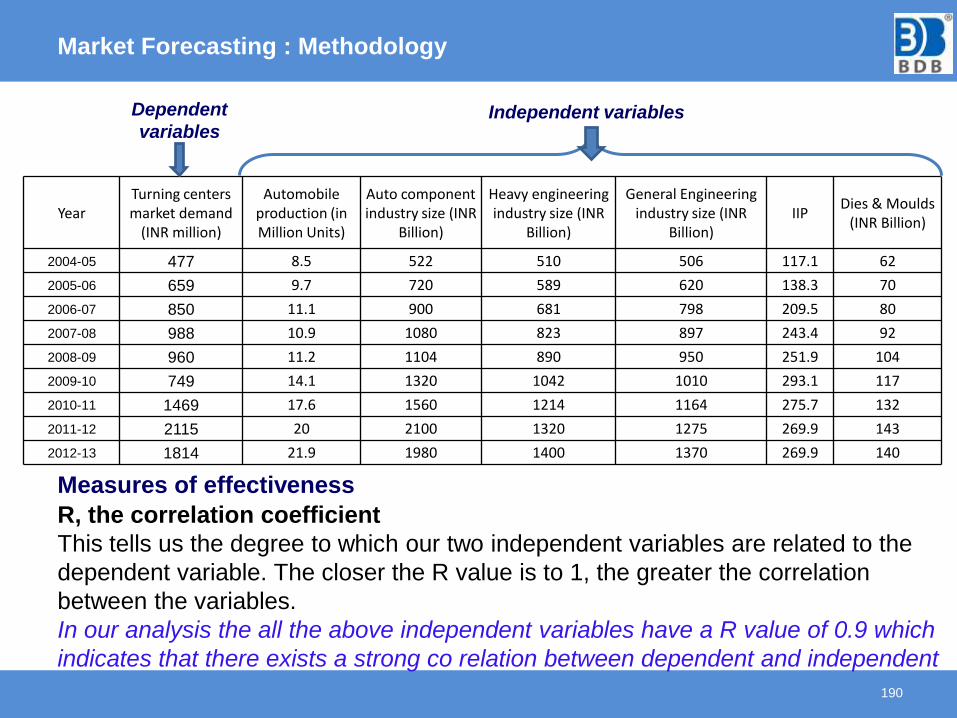
Market Forecasting : Methodology
190
Dependent
variables
Measures of effectiveness
R, the correlation coefficient
This tells us the degree to which our two independent variables are related to the
dependent variable. The closer the R value is to 1, the greater the correlation
between the variables.
In our analysis the all the above independent variables have a R value of 0.9 which
indicates that there exists a strong co relation between dependent and independent
YearTurning centers market demand
(INR million)
Automobile production (in Million Units)
Auto component industry size (INR
Billion)
Heavy engineering industry size (INR
Billion)
General Engineering industry size (INR
Billion)IIP
Dies & Moulds (INR Billion)
2004-05 477 8.5 522 510 506 117.1 62
2005-06 659 9.7 720 589 620 138.3 70
2006-07 850 11.1 900 681 798 209.5 80
2007-08 988 10.9 1080 823 897 243.4 92
2008-09 960 11.2 1104 890 950 251.9 104
2009-10 749 14.1 1320 1042 1010 293.1 117
2010-11 1469 17.6 1560 1214 1164 275.7 132
2011-12 2115 20 2100 1320 1275 269.9 143
2012-13 1814 21.9 1980 1400 1370 269.9 140
Independent variables
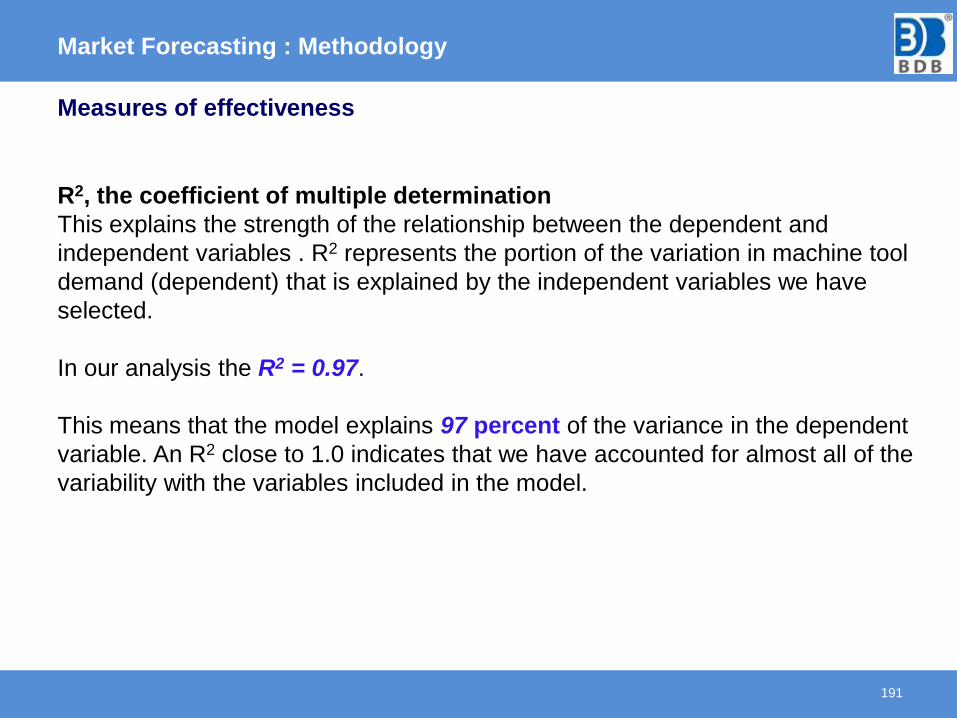
Market Forecasting : Methodology
191
Measures of effectiveness
R2, the coefficient of multiple determination
This explains the strength of the relationship between the dependent and
independent variables . R2 represents the portion of the variation in machine tool
demand (dependent) that is explained by the independent variables we have
selected.
In our analysis the R2 = 0.97.
This means that the model explains 97 percent of the variance in the dependent
variable. An R2 close to 1.0 indicates that we have accounted for almost all of the
variability with the variables included in the model.
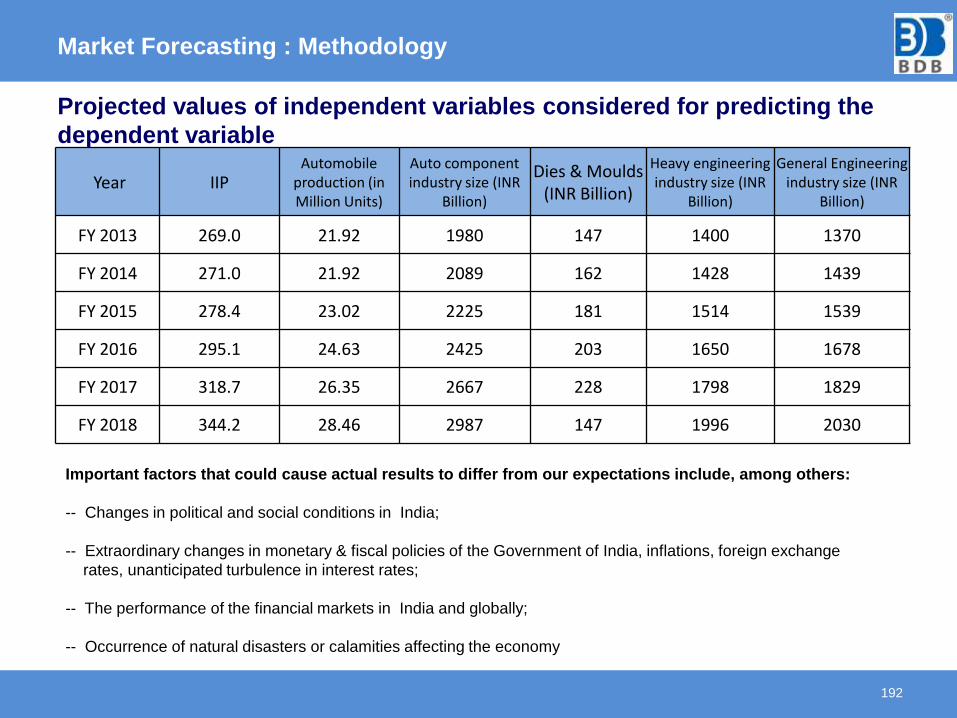
Market Forecasting : Methodology
192
Year IIP Automobile
production (in Million Units)
Auto component industry size (INR
Billion)
Dies & Moulds (INR Billion)
Heavy engineering industry size (INR
Billion)
General Engineering industry size (INR
Billion)
FY 2013 269.0 21.92 1980 147 1400 1370
FY 2014 271.0 21.92 2089 162 1428 1439
FY 2015 278.4 23.02 2225 181 1514 1539
FY 2016 295.1 24.63 2425 203 1650 1678
FY 2017 318.7 26.35 2667 228 1798 1829
FY 2018 344.2 28.46 2987 147 1996 2030
Important factors that could cause actual results to differ from our expectations include, among others:
-- Changes in political and social conditions in India;
-- Extraordinary changes in monetary & fiscal policies of the Government of India, inflations, foreign exchange
rates, unanticipated turbulence in interest rates;
-- The performance of the financial markets in India and globally;
-- Occurrence of natural disasters or calamities affecting the economy
Projected values of independent variables considered for predicting the
dependent variable

APPENDIX II
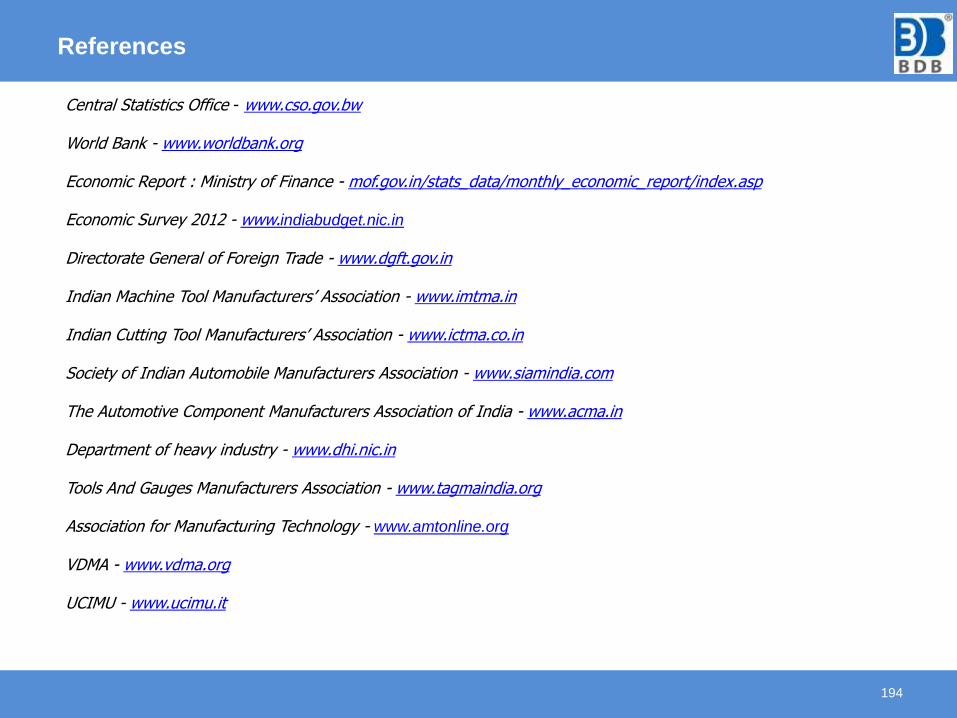
References
194
Central Statistics Office - www.cso.gov.bw
World Bank - www.worldbank.org
Economic Report : Ministry of Finance - mof.gov.in/stats_data/monthly_economic_report/index.asp
Economic Survey 2012 - www.indiabudget.nic.in
Directorate General of Foreign Trade - www.dgft.gov.in
Indian Machine Tool Manufacturers’ Association - www.imtma.in
Indian Cutting Tool Manufacturers’ Association - www.ictma.co.in
Society of Indian Automobile Manufacturers Association - www.siamindia.com
The Automotive Component Manufacturers Association of India - www.acma.in
Department of heavy industry - www.dhi.nic.in
Tools And Gauges Manufacturers Association - www.tagmaindia.org
Association for Manufacturing Technology - www.amtonline.org
VDMA - www.vdma.org
UCIMU - www.ucimu.it
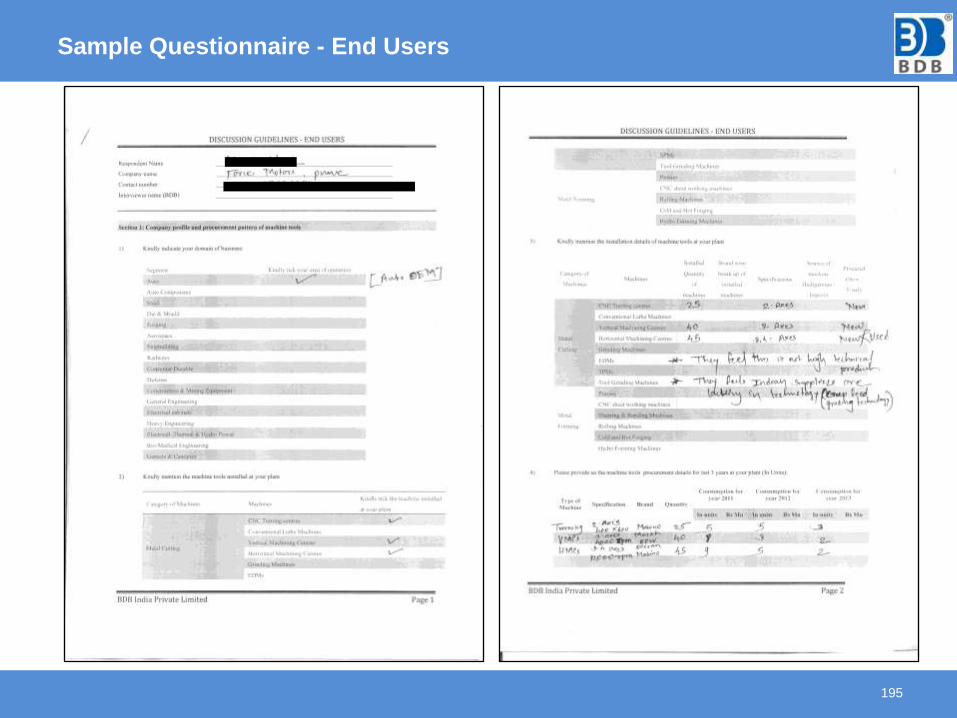
Sample Questionnaire - End Users
195
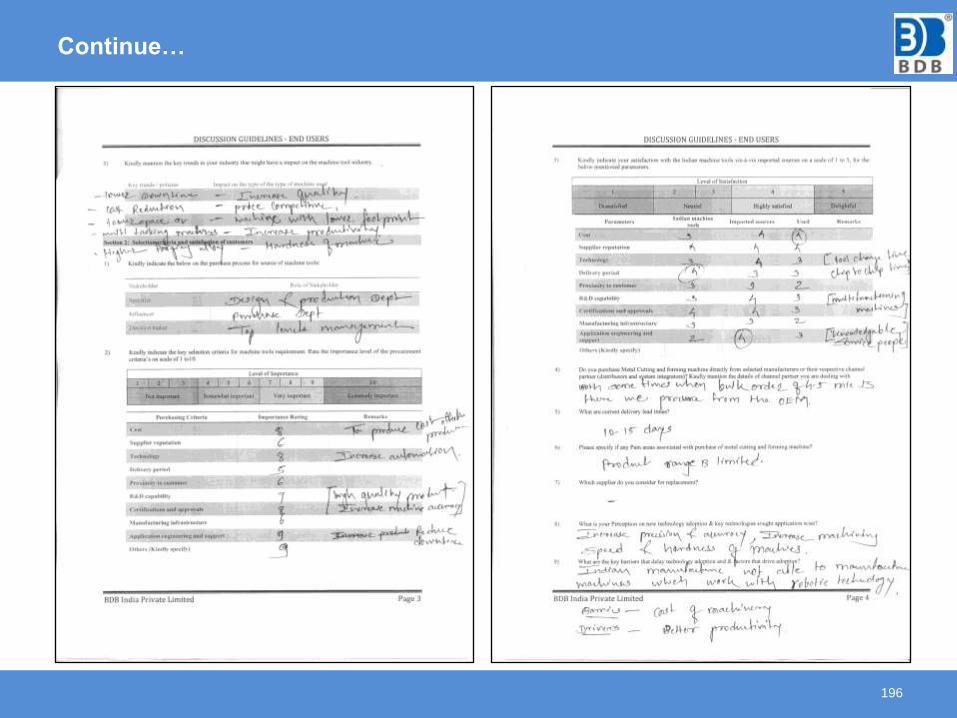
Continue…
196
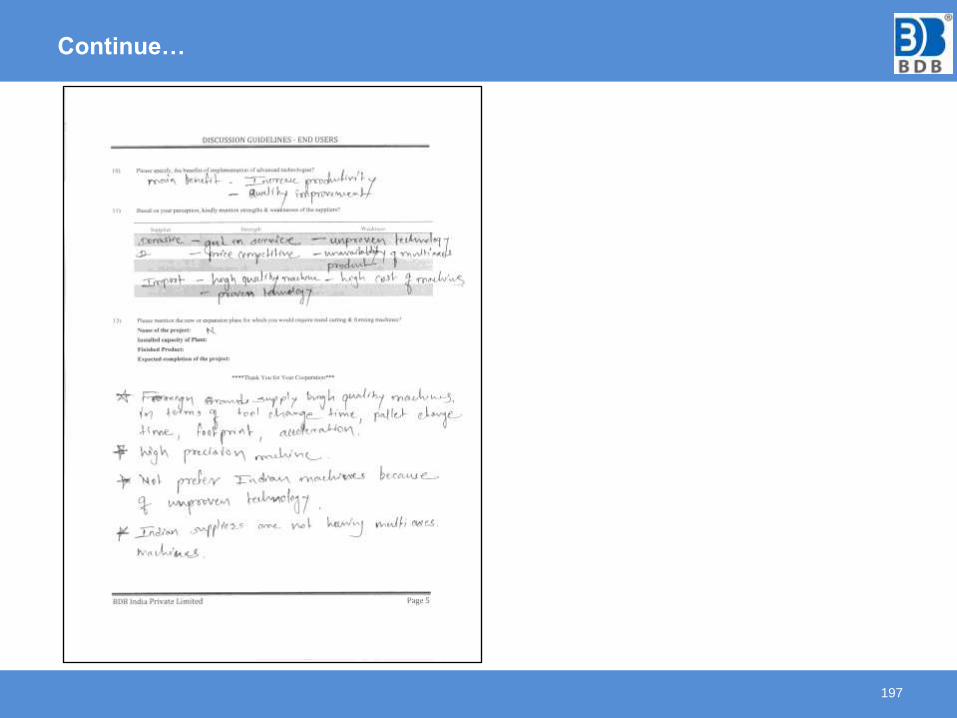
Continue…
197
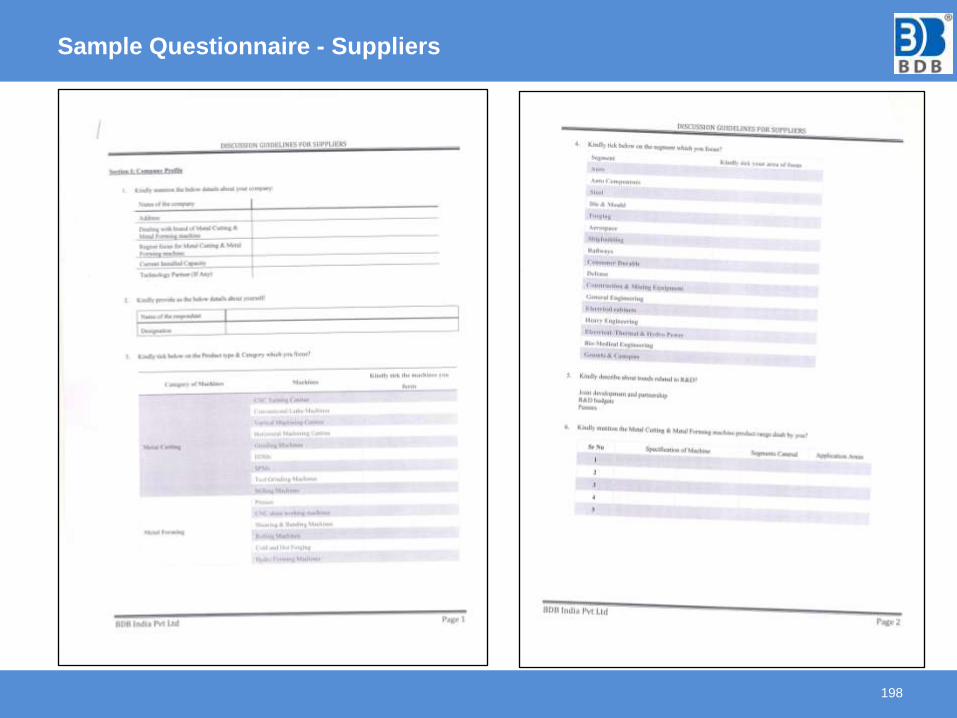
Sample Questionnaire - Suppliers
198
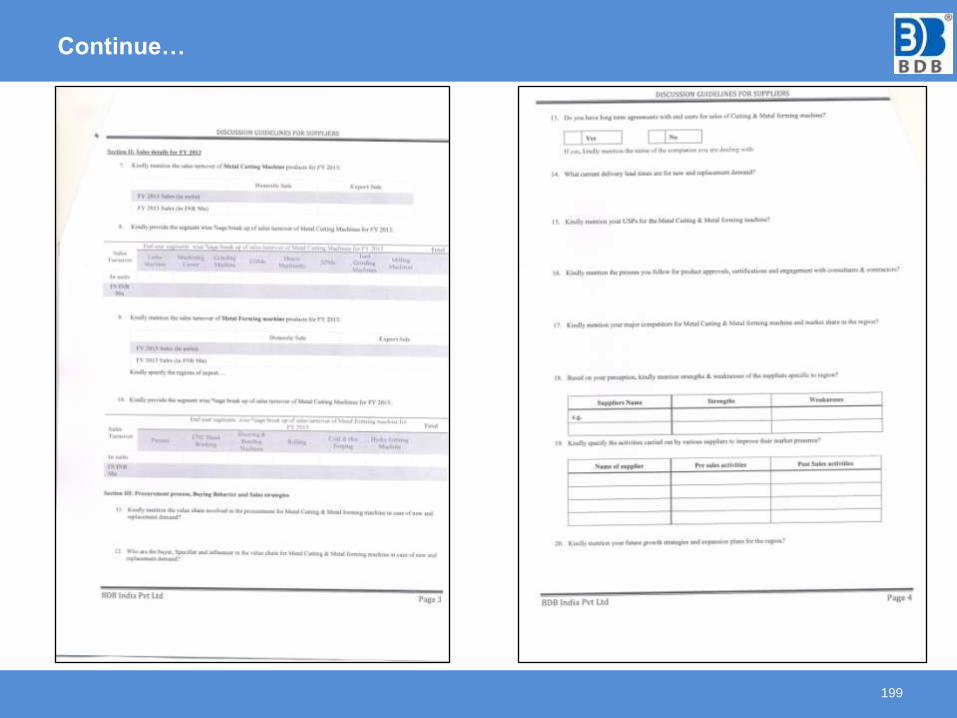
Continue…
199
Continue…
200
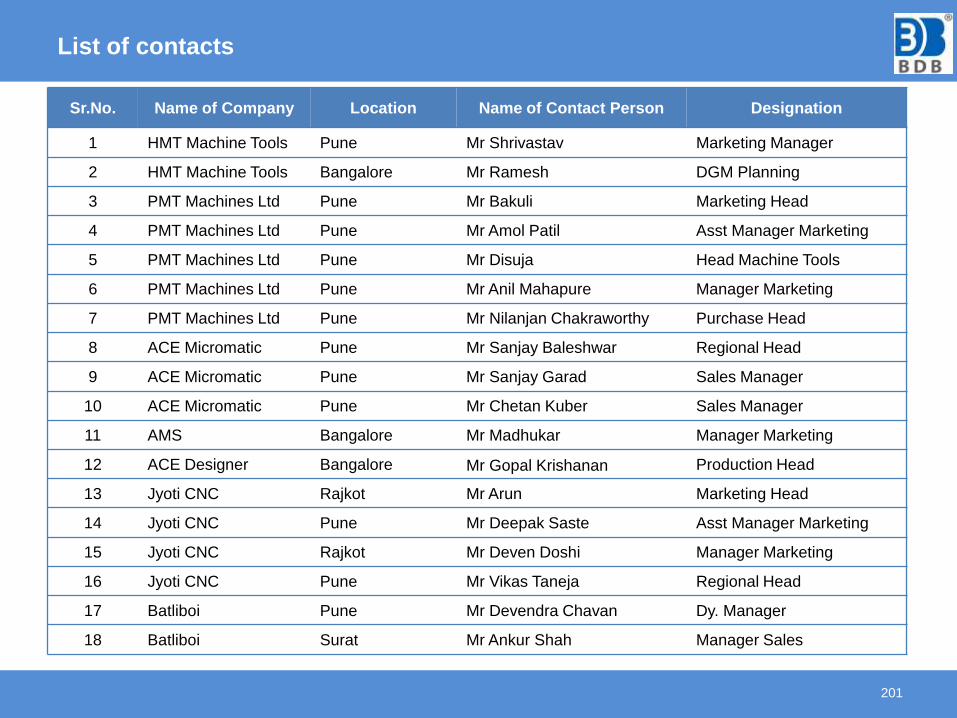
List of contacts
201
Sr.No. Name of Company Location Name of Contact Person Designation
1 HMT Machine Tools Pune Mr Shrivastav Marketing Manager
2 HMT Machine Tools Bangalore Mr Ramesh DGM Planning
3 PMT Machines Ltd Pune Mr Bakuli Marketing Head
4 PMT Machines Ltd Pune Mr Amol Patil Asst Manager Marketing
5 PMT Machines Ltd Pune Mr Disuja Head Machine Tools
6 PMT Machines Ltd Pune Mr Anil Mahapure Manager Marketing
7 PMT Machines Ltd Pune Mr Nilanjan Chakraworthy Purchase Head
8 ACE Micromatic Pune Mr Sanjay Baleshwar Regional Head
9 ACE Micromatic Pune Mr Sanjay Garad Sales Manager
10 ACE Micromatic Pune Mr Chetan Kuber Sales Manager
11 AMS Bangalore Mr Madhukar Manager Marketing
12 ACE Designer Bangalore Mr Gopal Krishanan Production Head
13 Jyoti CNC Rajkot Mr Arun Marketing Head
14 Jyoti CNC Pune Mr Deepak Saste Asst Manager Marketing
15 Jyoti CNC Rajkot Mr Deven Doshi Manager Marketing
16 Jyoti CNC Pune Mr Vikas Taneja Regional Head
17 Batliboi Pune Mr Devendra Chavan Dy. Manager
18 Batliboi Surat Mr Ankur Shah Manager Sales
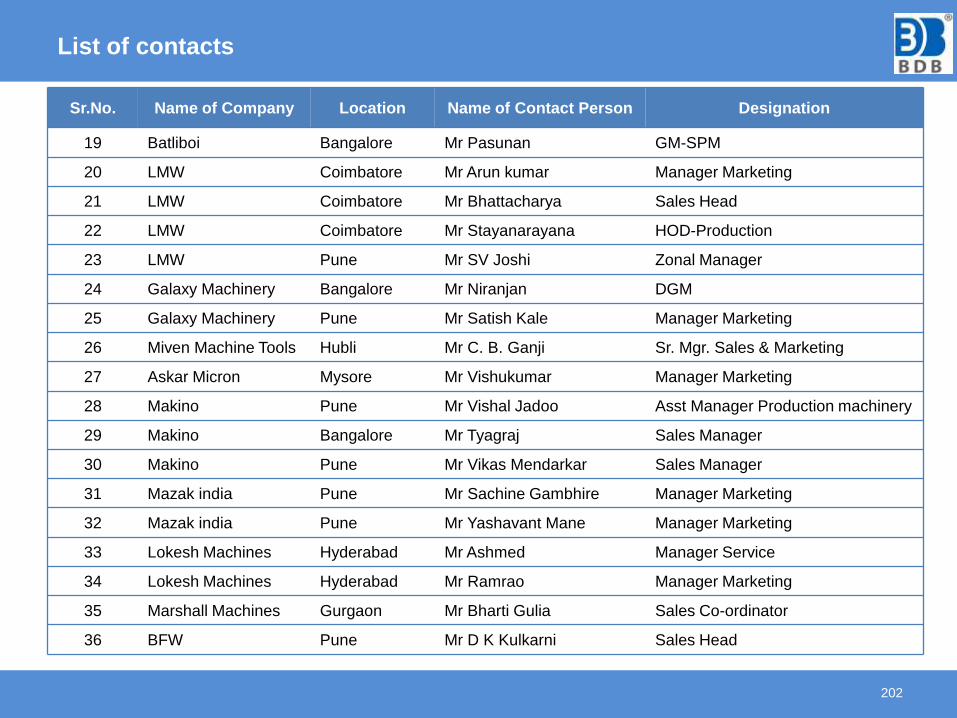
List of contacts
202
Sr.No. Name of Company Location Name of Contact Person Designation
19 Batliboi Bangalore Mr Pasunan GM-SPM
20 LMW Coimbatore Mr Arun kumar Manager Marketing
21 LMW Coimbatore Mr Bhattacharya Sales Head
22 LMW Coimbatore Mr Stayanarayana HOD-Production
23 LMW Pune Mr SV Joshi Zonal Manager
24 Galaxy Machinery Bangalore Mr Niranjan DGM
25 Galaxy Machinery Pune Mr Satish Kale Manager Marketing
26 Miven Machine Tools Hubli Mr C. B. Ganji Sr. Mgr. Sales & Marketing
27 Askar Micron Mysore Mr Vishukumar Manager Marketing
28 Makino Pune Mr Vishal Jadoo Asst Manager Production machinery
29 Makino Bangalore Mr Tyagraj Sales Manager
30 Makino Pune Mr Vikas Mendarkar Sales Manager
31 Mazak india Pune Mr Sachine Gambhire Manager Marketing
32 Mazak india Pune Mr Yashavant Mane Manager Marketing
33 Lokesh Machines Hyderabad Mr Ashmed Manager Service
34 Lokesh Machines Hyderabad Mr Ramrao Manager Marketing
35 Marshall Machines Gurgaon Mr Bharti Gulia Sales Co-ordinator
36 BFW Pune Mr D K Kulkarni Sales Head
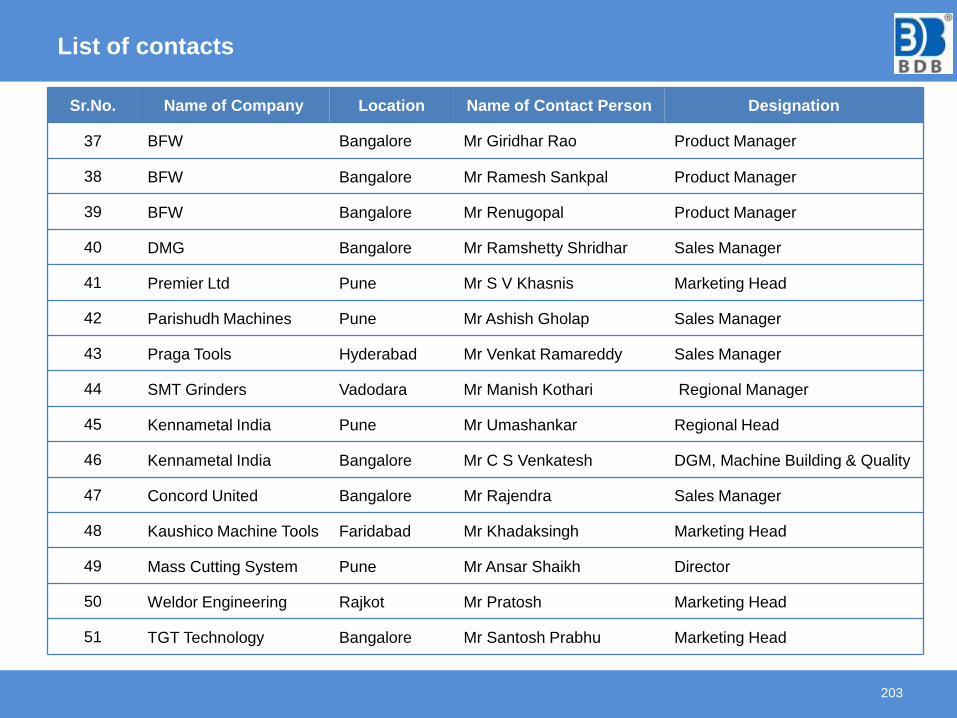
List of contacts
203
Sr.No. Name of Company Location Name of Contact Person Designation
37 BFW Bangalore Mr Giridhar Rao Product Manager
38 BFW Bangalore Mr Ramesh Sankpal Product Manager
39 BFW Bangalore Mr Renugopal Product Manager
40 DMG Bangalore Mr Ramshetty Shridhar Sales Manager
41 Premier Ltd Pune Mr S V Khasnis Marketing Head
42 Parishudh Machines Pune Mr Ashish Gholap Sales Manager
43 Praga Tools Hyderabad Mr Venkat Ramareddy Sales Manager
44 SMT Grinders Vadodara Mr Manish Kothari Regional Manager
45 Kennametal India Pune Mr Umashankar Regional Head
46 Kennametal India Bangalore Mr C S Venkatesh DGM, Machine Building & Quality
47 Concord United Bangalore Mr Rajendra Sales Manager
48 Kaushico Machine Tools Faridabad Mr Khadaksingh Marketing Head
49 Mass Cutting System Pune Mr Ansar Shaikh Director
50 Weldor Engineering Rajkot Mr Pratosh Marketing Head
51 TGT Technology Bangalore Mr Santosh Prabhu Marketing Head

THANK YOU