Embed Size (px)
Citation preview

1
The Individual’s Choice of Facility for Maternal Health and Family Planning Services in a Dense Urban Environment: The Case of Senegal
Christopher J. Cronin*, Department of Economics, University of Notre Dame
David K. Guilkey, Department of Economics and Carolina Population Center, University of North Carolina at Chapel Hill
Ilene S. Speizer, Gillings School of Global Public Health, Department of Maternal and Child Health and Carolina Population Center, University of North Carolina at Chapel Hill
Abstract: A number of authors have utilized health facility choice models to determine how individuals in developing countries evaluate the tradeoff between the price, quality, and indirect costs of obtaining medical care. A common problem in this literature is that researchers only observe the type of facility that individuals report visiting (e.g., public or private hospital, health center or dispensary; or traditional healer) and, therefore, must assume individuals visit the nearest facility of the type they report. This matching procedure creates measurement error in the choice variable, which may introduce bias in parameter estimates. In this research, we use a data set from urban Senegal that allows for a precise individual-health facility match to estimate consumer preferences for health facility characteristics related to maternal health and family planning services. Using actual rather than imputed choices, we find that consumers prefer high quality health facilities that are nearby. Given the preference for quality, our findings indicate that in contrast to the typical assumption in the literature, individuals frequently bypass the facility nearest their home. When we estimate models using the mismeasured choice variable, the results show a significant bias in preference estimates; most notably, these models systematically overestimate distaste for travel. To highlight a potential consequence of biased preference estimates in this setting, we conclude by simulating the impact of an actual policy that took place in 2014; namely, the opening of a new facility in a previously underserved area of Dakar, Senegal. Keywords: Measurement Error, Discrete Choice, Health Facility Choice, Maternal Health, Family Planning, Senegal JEL Classification: I12, I15, I18, J13, C35
* Corresponding Author: University of Notre Dame, Department of Economics, 914 Flanner Hall, Notre Dame, IN 46556; 574-631-0427; [email protected]. Funding for this work comes from the Bill & Melinda Gates Foundation. This research was also supported by a Population Research Infrastructure Program (P2C HD050924) awarded to the Carolina Population Center at the University of North Carolina at Chapel Hill by the Eunice Kennedy Shriver National Institute of Child Health and Human Development. The contents of this paper are solely the responsibility of the authors and do not necessarily represent the official views of the funders. The authors would also like to thank Jennifer Winston and Jeehoon Han for their assistance in the preparation of this manuscript.

2
I. Introduction
Many developing countries have attempted to improve the health of their populations
through government policies that enhance the quality and/or accessibility of healthcare
(Dzakpasu et al., 2012; Yates, 2009). Given resource constraints, politicians and public health
officials regularly evaluate competing policies by comparing projected costs and benefits. These
projections require an understanding of how individuals evaluate the tradeoffs between the price,
quality, and indirect costs (e.g., travel costs, wait times, etc.) faced in obtaining care. For
example, consider a government that wishes to extend services to an underserved population and
must decide between constructing a new health facility and improving an existing one(s). In
evaluating these alternatives, policy makers would benefit from information on patient
preferences for travel costs relative to preferences for facility quality, wait times, and price
sensitivity.
The choice models frequently employed in the economics literature are particularly well
suited to extract such preference information from individual-level choice data (Train, 2009).
However, the facility choice models that have been estimated in developing country settings
have suffered from a common data limitation; namely, researchers have been unable to match
individuals to the actual health facility that they visit. Most commonly, researchers observe only
the type of facility that an individual reports visiting (e.g., public or private hospital, health
center or dispensary; or traditional healer) and, therefore, estimate choice models that define the
alternative set by the nearest facility of each type (Akin et al., 1986; Dor et al., 1987; Mwabu et
al., 1993; Leonard et al., 2003; Mariko, 2003; Habtom, 2007; Erlyana et al., 2011) or average
facility of each type (Akin et al., 1995).1 This strategy may not be a major issue in rural areas
with very limited choice sets but could be more important in urban areas. Regardless of the
setting, estimates produced by these models vary considerably, offering no clear conclusions as
to how individuals evaluate the tradeoffs faced in obtaining medical care. For example, most
researchers have found that individuals are more likely to select nearby facilities with lower
prices and higher quality (Gertler et al., 1987; Akin and Hutchinson, 1999; Leonard et al, 2003;
Borah, 2006; Habtom, 2007), yet numerous papers find that individual choice is not affected by 1 Average facility of each type implies that a facility characteristic (e.g., number of doctors) for a particular facility type (e.g., public hospitals) is calculated as the average of that characteristic across all facilities of that type within some distance band. Several other papers use patient-reported facility characteristics from the visited facility to fit hedonic price and quality models, which are then used to assign facility characteristics to particular facility types (Gertler et al., 1987; Bolduc et al., 1996; Borah, 2006).

3
the distance they must travel for care (Akin et al., 1986; Mwabu et al., 1993; Mariko, 2003;
Erlyana et al., 2011) or that in some cases, individuals actually prefer longer distances (Akin et
al., 1995; Bolduc et al., 1996). There is also wide variation in the magnitude of estimated
effects.2
In conflict with the existing literature are several studies which show that individuals,
particularly those in urban environments, frequently bypass nearby health facilities to obtain
higher quality care (Akin and Hutchinson, 1999; Leonard et al, 2003). We confirm this finding in
our own data as well. As such, both the choices and alternative sets assigned to individuals in
much of the existing research do not represent the true choices made and alternative sets faced by
the individuals being studied. These data deficiencies represent a form of measurement error that
may bias existing estimates of consumer preferences for health facility characteristics.
Ultimately, correcting this bias is important for health officials who utilize these estimates to
design policies that alter the price, quality, and/or indirect costs of both private and public health
facilities.
In this paper we utilize a novel data set of over 9,600 urban dwelling women in Senegal
linked to a census of health facilities in these urban areas that they could potentially visit for
maternal health and family planning services. We use survey data to measure quality of care at
each of the 231 available health facilities and 533 pharmacies, as well as GPS coordinates to
measure the distance each woman must travel to each facility. Together, this information allows
us to estimate a choice model that (i) matches women to the specific facility they visit and (ii)
allows choices from the full set of alternatives. To our knowledge, no other work in the
economics literature estimates consumer preferences for health facility attributes in a developing
country by matching individuals to the actual health facilities that they visit. Thus, the primary
contribution of this paper is that it provides facility preference estimates in a developing country
setting that are free of bias due to measurement error in the choice variable.
In our empirical analysis, we utilize a random utility framework to estimate a series of
health-facility choice models, employing a selection-on-observables approach to control for the
possible non-random self-selection of individuals into care. Our preferred parameter estimates
2 For example, Erlyana et al. (2011) find that for a rural population of uninsured adults in Indonesia, the price elasticity of demand for both community health centers and private doctors is insignificantly different from zero; however, a similarly rural population of adults in Benin studied by Bolduc et al. (1996) has an estimated price elasticity of demand of -2.48 for community health centers and -4.27 for private doctors.

4
are derived from a mixed logit model, which relaxes the independence of irrelevant alternatives
(IIA) assumption that is characteristic of the standard conditional logit model by allowing
variation in the weight individuals place on facility characteristics when making facility choice
decisions. Because we observe a complete census of facilities that offer sexual and reproductive
health services, we are able to mimic the literature by estimating an additional model that (i)
restricts the individual’s health facility alternative set to those nearest them that are of a
particular type and (ii) matches the individual to a facility according to the type we observe them
select. By comparing the two sets of estimates, we are able to document that the typical
measurement error in the existing literature leads to a bias in preference parameter estimates.
Our main findings indicate that patients have a preference for facilities that are nearby
and facilities that are of high quality such as facilities that are public, offer a greater number of
services, offer educational materials and conduct community outreach, and have modern
amenities (e.g., electricity, piped water, telephones, and modern rooms). The preference for
quality does mean that in many circumstances, patients are willing to bypass the closest facility
for one of higher quality. We also find evidence to suggest that measurement error is a
significant source of bias in the existing literature. Among the health facility characteristics that
are under/over valued by the models estimated using data that is measured with error, the bias in
preferences for distance is notable. Our findings suggest that, for urban settings, the matching
procedure commonly used by researchers significantly limits the possibility that women travel
long distances to obtain care, which leads to a systematic overestimate of distaste for travel. We
highlight a potential consequence of this bias in preference parameter estimates by comparing
how our preferred model and the measurement error model predict individual responses to two
policies; the first of which was actually implemented in 2014, after our data were collected – a
new public facility was added in an underserved area of Dakar, Senegal – and the second of
which is hypothetical, but can be viewed as having been a viable alternative to the implemented
policy – providing electricity to facilities in Dakar without it. We find that the differences in the
predictions produced by the two models are statistically significant and economically
meaningful, suggesting that the bias in preference parameter estimates caused by measurement
error could have significant effects on public policy.
Our paper also contributes to a large literature on how individuals in developed countries
evaluate the tradeoff between the price, quality, and indirect costs of obtaining medical care.

5
While this literature does not struggle with the measurement error challenges discussed above,
frequent use of administrative facility choice data creates the potential for endogenous sample
selection – typically, a researcher only observes individuals who choose to visit a facility (e.g.,
Luft et al., 1990; Burns and Wholey, 1992; Hodgkin, 1996; Chernew et al., 1998; Mukamel et
al., 2004; Dranove and Sfekas, 2008). In our survey data, we observe women that both visit and
choose not to visit a facility, allowing us to model and ultimately test for endogenous selection of
women into visiting a facility. We do not find evidence of endogenous selection into visiting a
facility, providing some support for the exogenous sample selection assumption made frequently
in the developed country health facility choice literature.
The rest of the paper is organized as follows. In the next section, we detail the random
utility model that guides our empirical specification and provide information on the statistical
specification of the model. In Section III, we provide information and descriptive statistics on
the individual and facility level data sets from urban Senegal that we use to estimate our model.
These statistics show that for both maternal health and family planning services, an
overwhelming majority of respondents bypass the closest facility for one of higher quality. We
present estimation results, robustness checks, and policy simulations in Section IV. In Section V
we summarize our findings and contributions to both the developed and developing country
health facility choice literature.
II. Model and Methods
We model the choice of health facility for maternal health and family planning services.
The following random utility model, originally developed by McFadden (1974), serves as a
baseline:
!!" = !!"! + !!!! + !!" (1) where !!" is the utility that individual ! = 1, 2,… ,! receives from facility ! = 1, 2,… , !. The !!" represents a 1×! vector of choice specific attributes such as the distance individual !’s place of
residence is from facility !. The !! represents a 1×! vector of individual specific variables such
as age and education. The baseline model assumes that the !!"’s follow a Type 1 Extreme Value
(T1EV) distribution, are independent across alternatives, and have the same variance.
There are three problems with the baseline model. First, in order to allow individual-
specific variables, !!, to impact choice probabilities directly in this specification we must
6
estimate ! − 1 × ! parameters, !!. In our model, ! = 231 for the maternal health model and
! = 764 for the family planning model (the latter includes pharmacies, as well as health
facilities), so the number of parameters that we would need to estimate to include even one main
effect of an individual-specific variable is unfeasibly large. As such, we do not allow for !! to
impact facility choices directly in our preferred model, though we do include interaction effects
(between !!" and !!) in some specifications (discussed below).
Second, a nice feature of random utility models with T1EV errors is that they yield
choice probabilities that have a closed form. However, a well-known critique of this
distributional assumption is that the resulting probabilities display Independence of Irrelevant
Alternatives (IIA), which imposes on the model strict substitution patterns between alternatives
(Chipman, 1960; Debreu, 1960). In general, if there is any correlation between the unobserved
preferences for alternatives (i.e., !"# !!" , !!" ≠ 0), then these substitution patterns will be
inappropriate. Our preferred model adopts an extension of the random utility model that is
sometimes referred to as the mixed logit model (see Train 2009, Ch. 6). Specifically, we assume
that preferences for facility attributes vary across the population, such that !!~!(!,!) where !
is an !×1 vector of means and ! is an !×! unrestricted covariance matrix. By allowing for
random taste variation we implicitly allow for correlation between the model’s error terms,
which relaxes the IIA property and the strict substitution patterns characterizing the baseline
model. The mixed logit specification also gives us a straightforward way to allow individual-
level characteristics to impact choices in our model, while still allowing for preference
heterogeneity. In one specification, we allow the mean of the parameter distribution, !, to vary
by an individual’s level of education (e.g., more educated individuals may prefer facilities with
more doctors and fewer midwives) and only requires the estimation of ! additional parameters.
The third potential problem with the baseline model stems from the fact that we only
observe facility choices for a non-randomly selected sub-sample of the population. For both
family planning and maternal health services, women in the survey data can choose not to visit a
health facility, !! = 1; visit a health facility that we do not observe, !! = 2; or visit a health
facility that we do observe, !! = 3. We are only able to model the choice of a health facility if
!! = 3. Let’s assume that this selection is influenced by an individual’s characteristics, !!; the
characteristics of health facilities that she is likely to visit conditional on visiting any facility, !!" (where ! ∈ !! and !! is a set of such facilities); and some random component !!. In such a setting,

7
Wooldridge (1999) shows that the parameters of the baseline model (i.e., Equation 1) can be
consistently estimated via maximum likelihood using only the selected sample as long as !! and
!!" are uncorrelated (i.e., there are no unexplained determinants of selection that would lead an
individual who visits a facility to choose a different facility from an observationally equivalent
individual who does not visit a facility). This condition may not hold true in our setting,
particularly because we cannot estimate the baseline model (Equation 1) due to the size of the
alternative set. Instead, we estimate
!!" = !!"!! + !!" (2) where our error term is !!" = !!!! + !!!. Therefore, by excluding the main effects, !!!!, we
increase the likelihood that selection into the sample, !!, and the unobserved determinants of
facility choice, !!", are correlated (i.e., ! !!" !!" ≠ ! !!"|!!" , !! = 3 ), which could cause bias
in the estimation of the parameters of Equation (2).
We address this problem using a selection-on-observables approach described by
Wooldridge (2002, 2007) and Imbens (2014). Specifically, assume !! is also determined by a
random utility model with T1EV error. The probability of selecting into any of the three groups
is then
! !! = ! = exp (!!,!! !!" + !!,!!!)∑!!!!! exp (!!,!!! !!" + !!,!!!!)
(3)
where !(!!") is a summary statistic of the characteristics of facilities in !! (e.g., the average
characteristics of facilities within a 1 km radius of individual !’s home). The parameters of
Equation 3 can be consistently estimated using maximum likelihood. We then weight the choice
probabilities in the likelihood function by the inverse of the predicted probability (IPW) that the
individual visits a facility that we observe.
!"# = 1!(!! = 3) (4)
Wooldridge (2002) compares and contrasts the weighted and unweighted estimators.
Under a set of regularity conditions, the unweighted estimator is consistent and asymptotically
more efficient than the weighted estimator, if selection is ignorable conditional on control
variables (i.e., ! !! = 3 !!" ,!!" = ! !! = 3 !!" where !!" is and indicator variable that
equals 1 if individual ! selects facility ! and 0 otherwise). Given our exclusion of individual level
controls, !!, from the facility choice model, we view this assumption to be too strong.

8
Consistency of the weighted estimator requires that the same set of regularity conditions hold,
but the ignorability assumption is weaker – selection must be ignorable conditional on control
variables, !!", and additional observables, !! i. e., ! !! = 3 !!" ,!!" = ! !! = 3 !!" ,!! .
We define !! using individual-level controls, !!, and interactions between individual and
facility-specific controls.
This estimator is intuitive. One way to describe the sample selection problem is that,
without correction, our estimates will not capture the preferences of individuals not visiting a
facility. By weighting choice probabilities by the inverse of the probability of inclusion, we give
the choices/preferences of included individuals who look like (i.e., have similar observable
characteristics as) excluded individuals greater weight in the estimation of the models
parameters. The estimated parameters then capture the preferences of the entire population,
which is comprised of individuals both visiting and not visiting health facilities.
The existing developing country facility choice literature, which generally utilizes survey
data featuring a subsample of people not visiting a facility, addresses sample selection using a
different strategy. Researchers typically design choice models that (i) designate “no facility” as a
choice alternative and (ii) allow individual-level characteristics (i.e., !! from our model) to have
a separate impact on the indirect utility received from every choice alternative (Akin et al., 1986;
Dor et al., 1987; Gertler et al., 1987; Mwabu et al., 1993; Akin et al., 1995; Bolduc et al., 1996;
Mariko, 2003; Borah et al., 2006; Habtom and Ruys, 2007; Erlyana et al., 2011). This method
controls for endogenous sample selection only if unobserved preferences for facilities, !!", are
independent across the sample conditional on the individual-level characteristics – a strong
assumption. We prefer our weighting method to this alternative strategy for two reasons. First,
the alternative strategy requires the estimation of ! − 1 ∗ ! additional parameters, where ! is
the number of alternatives and ! is the number of individual-level controls. Thus, the method
cannot be implemented with a large choice set, nor can the method accommodate a large number
of controls. Second, the alternative strategy does not allow the conditioning individual-level
characteristics to include variables that are endogenous to selection. Both Wooldridge (2010, Ch.
19) and Moffitt et al. (1999) note that consistency of the weighted estimator does not require that
!! and !!! are uncorrelated. In other words, control variables that are endogenous to the facility
choice model can be included in the selection equation to help satisfy the ignorability

9
assumption. We include such variables (e.g., pregnant, gave birth recently, frequency of sex,
fertility desires, etc.) in !!.
Given our assumptions, it is straight forward to construct the likelihood function for this
problem (see, for example, Train, 2009, Ch.6 and Hole, 2007). We use Stata’s mixlogit package
to estimate the model, which uses simulated maximum likelihood. We initially set the number of
draws in the simulations to 400, but found this specification to be computationally prohibitive.
Therefore, the results that we present are based on 50 draws.3
III. Data and Descriptive Statistics
Our empirical analysis focuses on urban areas in the West African country Senegal.
Senegal is characterized by high fertility rates (5.1 children per woman in 2013; World Bank),
high infant mortality rates (45 per 1,000 live births in 2012; Unicef), high maternal mortality
rates (370 per 100,000 live births in 2008-2012; Unicef), and low rates of family planning use
(21.2% of women in union ages 15-49 were using a modern method in 2015; DHS). Use of
modern family planning in urban areas is double what it is in rural areas (30% vs. 15%,
respectively), however, in both urban and rural areas, there is still a high need for family
planning with about 21%-23% of women in unions reporting a desire to space or stop
childbearing and not using any method of family planning (DHS).
Women in Senegal access health care predominately through the public sector; this is true
for both family planning services as well as maternal and child health services. Market and
government forces determine prices for healthcare services. In urban areas, a “ticket” fee that
averages (roughly) $0.80 must be paid prior to seeing a provider. Most contraceptive prices are
fixed by the government and do not vary across facilities. For most methods, these prices do not
serve as a barrier to use (e.g., condoms are free, pills are $0.2 per month, etc.); however, longer
acting methods can be more expensive and vary by facility (e.g., implant or IUD can range from
$4.80 to $8.00). Unfortunately, we do not observe healthcare prices in our data. That said,
consultation prices, for example, are highly correlated with facility service volume and
ownership type (i.e., high-volume and private facilities are more expensive); therefore,
3 As is described in Section IV.b, we estimate an additional mixed logit model that does not allow for correlation between random taste parameters (i.e., ! is restricted to be a diagonal matrix). We were able to estimate this model using both 50 and 400 simulation draws; estimates were very similar across specifications.

10
preferences for these facility characteristics should be interpreted as capturing information about
consumer price sensitivity.
We use baseline household and facility data from the Measurement, Learning &
Evaluation (MLE) project collected as part of the evaluation of the Initiative Sénégalaise de
Santé Urbaine (ISSU) in Senegal. The study includes six urban sites: Dakar, Guédiawaye,
Pikine, Mbao, Mbour, and Kaolack. At baseline, in 2011, a multi-stage sampling design was
used to select a representative sample of women ages 15-49 from each site. In the first stage,
between 32-64 primary sampling units (PSUs) were selected with different numbers based on the
size of the urban site. PSUs were created based on the 2002 census sampling frame that was
updated in 2009; details of the sampling frame can be found in the MLE baseline report (MLE
and Initiative Sénégalaise de Santé Urbaine, ISSU, 2011). In the second stage, using a
comprehensive listing of all households in a selected PSU, a random sample of 21 households
were selected for the women’s interview; men were also surveyed in half of the selected
households. Household heads were asked to provide written consent prior to the household
interview; for any eligible woman under age 18, the household head also provided consent to
interview the young woman. All eligible women provided written consent (assent if under age
18) to participate in the survey. In total, 9,614 women from 4950 households were surveyed;
this represents women from 263 primary sampling units across the six cities. The final response
rate among women was 88.9%.
At baseline, data were collected from all public and private health facilities that offer
maternal, newborn, child, and family planning services in each of the six cities. This included
high volume public and private hospitals as well as health centers and dispensaries. Across the
six cities, of a total of 269 health facilities on the master list, 231 were identified and survey data
were collected from 205. Sixty-four facilities were not included due to reasons such as striking
providers, being merged with another facility, not offering the relevant services, refusal, no
longer in existence, and unavailable provider for interview. Likewise, of a total of 576
pharmacies on the master list, 533 were identified and 518 completed surveys; similar scenarios
were found for those pharmacies where an interview did not take place.4 At each health facility
and pharmacy, an audit was performed to obtain information on services offered, family
4 For facilities that we are able to identify, but that did not participate (participating=0) in the survey, we observe distance and facility type (i.e., public/private, high/low volume, and pharmacy). Other variables are coded as 0.

11
planning methods available, and stockouts. At all health facilities, a provider interview was
undertaken with up to four providers depending on the size of the facility. (For details, see the
ISSU Final Report, 2012.)
III.a Choice Data
Women were asked in the individual interview to provide the name and address of the
health facility that they visit for a number of health services, which were then matched to the
facility survey. In our analysis, we focus on the choice of a facility for maternal health services,
which includes prenatal and postpartum care, and a facility to acquire family planning methods
and services. This choice data is summarized in Table 1. Of the 9,325 women in our sample,
7,034 report not visiting any facility for maternal health services in the past 12 months and 7,941
report not visiting for family planning services.5 Among those visiting facilities, 1,830 report
visiting a surveyed facility for maternal health services and 1,073 report visiting a surveyed
facility for family planning services.
As mentioned above, these data are unique in that women can be matched to the specific
facility that they visit for care, rather than the closest facility of a particular type (e.g., public or
private hospital, health center or dispensary; or traditional healer).6 Table 1 shows how the
“closest facility” strategy can lead to measurement error in facility matches, particularly in dense
urban settings. Among the women who visit a health facility for maternal health services, only
25.7% visit the facility nearest their home and 35.4% visit the nearest facility of a particular type,
where types are defined as high-volume public, low-volume public, high-volume private, or low-
volume private. Furthermore, the median (mean) individual bypasses 4 (17) facilities to get to the
facility that she visits. Similar statistics are reported for family planning services, though bypass
counts are higher as the inclusion of pharmacies greatly increases the size of the alternative set.
[Insert Table 1 Here]
5 289 of the original 9,614 women were dropped due to missing individual-level information. 6 The distance between each facility and a woman’s home is measured, using ArcGIS software, as the straight-line distance between the centroid of the PSU where the woman lives and the facility location. PSUs, on average, include about 100-150 urban households, making this a fairly accurate representation of the location of a woman’s home. The fact that we measure straight-line distance, which does not consider the status of roads or transportation networks between the two points, makes our metric an imperfect measure of the “travel costs” associated with obtaining care from a particular facility. This problem is common in the literature; however, our focus on urban environments, where roads exist and public transportation is widely available, likely makes straight-line distance a reasonable measure of travel cost.

12
One reason that some women bypass nearby facilities could be heterogeneity in
preferences for distance, for example, a woman may actually prefer to go to a facility farther
away from her place of residence for the sake of anonymity. Our preferred model allows for this
type of variation in preferences. Another potential explanation is that women bypass nearby,
low-quality facilities for higher-quality facilities, and facilities that offer more services, but are
further away; we present evidence of this below.
III.b Facility Quality
Table 2 summarizes the characteristics of the 231 health facilities that women may visit
for maternal health services.7 In columns 2 and 3, we compare the average characteristics of both
chosen and nearest facilities for maternal health choices. The differences are stark; virtually
every characteristic associated with quality is higher for the selected facility than the nearest
facility. Most notably the average selected facility is open more days and hours, has a larger
staff, offers more services, is more likely to conduct community outreach programs, and is more
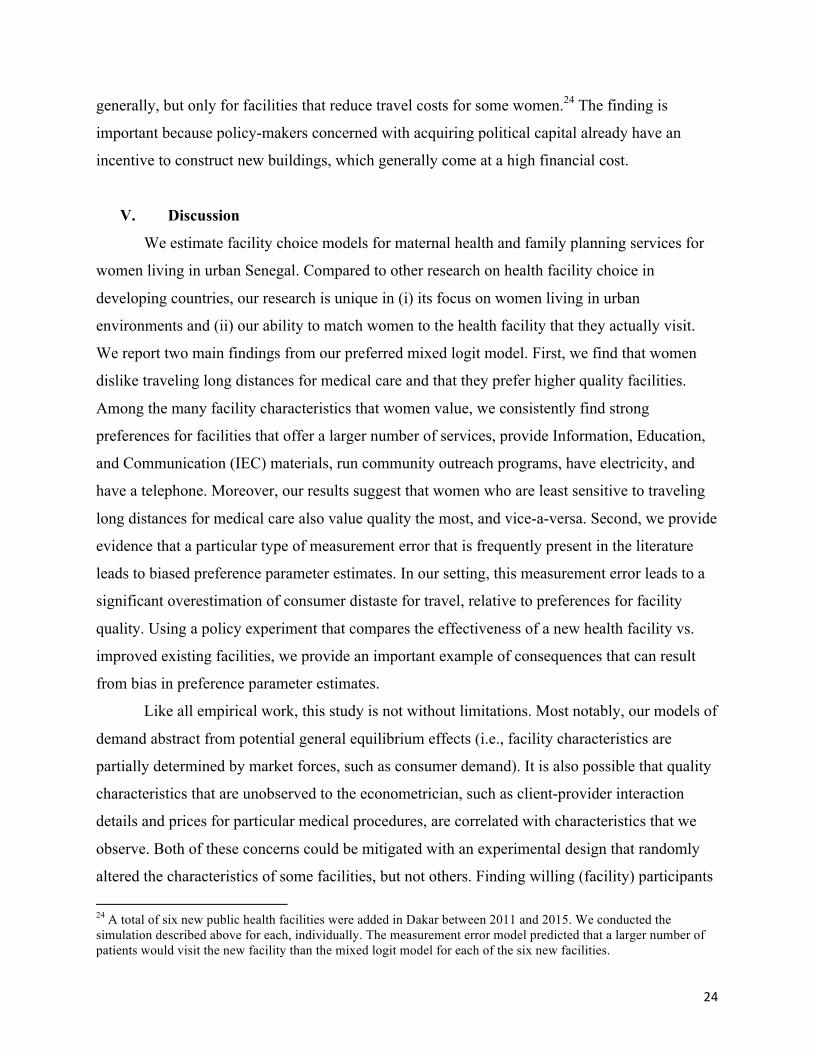
likely to be equipped with modern amenities than the nearest facility. Table 3 summarizes the
characteristics of the 231 health facilities and 533 pharmacies women may visit for family
planning (FP) services. The results are largely the same – the average selected facility tends to be
of greater quality than the average nearest facility. An exception can be found in the likelihood
of a 24-hour stockout in the past month, which is higher in the average selected facility than in
the nearest facility. This correlation can be explained by the fact that stockouts are most likely to
occur at the most popular facilities, which is precisely why the multivariate analysis that is
conducted in the following section is necessary.
[Insert Tables 2 & 3 Here]
7 Several facility characteristics require explanation. A high volume facility (i) covers a catchment area with a large population, (ii) has a large number of daily clients, (iii) provides a full range of family planning (FP) methods, and (iv) employs trained personnel for FP and reproductive health services (MLE, ISSU, 2012b) – all other facilities are low volume. Any IEC materials indicates the presence of any of eight Information, Education, and Communication family planning (FP) tools (e.g., posters, brochures, demonstration models, etc.), which are visually verified by the survey administrator. In the facility survey, facility-level interviewees select all services that their facility provides from a list of 22 possible reproductive health services as well as FP methods offered from a list of 10 methods - # services offered and # FP methods available is simply the sum of these offered services and methods, respectively. Facilities are said to provide community outreach if they report having ever hosted health talks for the benefit of the community. Finally, a facility is said to have a FP protocol if providers from the facility report having facility wide “standards or protocols for FP services” in the provider interview.

13
IV. Results
In this section, we present preference parameter estimates from a series of econometric
models. We begin by estimating both weighted and unweighted conditional logit models (i.e., no
random coefficients), which clarifies how weighting impacts the preference parameters. We then
estimate our preferred model, the mixed logit, which relaxes the IIA assumption implicit in the
conditional logit model, both with and without interactions. We then compare the preference
parameter estimates produced by data measured with and without error. The section closes with a
discussion of the distance-quality preference tradeoff implied by the various estimated models
and two policy experiments.
IV.a Unweighted vs. Weighted Conditional Logit Model.
In Table 4, we present estimates from both unweighted (columns 1 and 4) and weighted
(columns 2 and 5) versions of a conditional logit model, which includes only facility
characteristics as preference shifters. Recall that the weighted model requires the estimation of a
(first-stage) selection equation. Selection is modeled as a function of demographic characteristics
(e.g., age, income, education, religion, etc.), survey responses thought to explain the likelihood
that a woman would seek maternal health (e.g., currently pregnant, gave birth within past 2.5
years, number of children, etc.) or family planning (e.g., is capable of getting pregnant, want’s
more children, partner wants more children, etc.) services, average facility characteristics within
a one kilometer radius of the woman’s home, and a large set of interactions. The results of this
first-stage, and a list of specific controls used, are in Table A1 in the appendix.8 As explained in
Section III, estimates from the unweighted model are consistent only if selection is ignorable
conditional on facility attributes, while consistency of the weighted model requires a weaker
condition – that selection is ignorable conditional on facility attributes and other controls. A test
8 Two comments on the weighted estimator: First, the asymptotic variance of the weighted estimator is decreasing in the number of control variables in the selection equation. Thus, Wooldridge (2000) recommends a “kitchen sink” approach, where the selection equation (Equation 3) is saturated with any controls thought potentially relevant to selection, along with interactions and polynomials of the control variables. We have taken this approach, which explains our large set of control variables in Table A1. Second, Wooldridge (2002) proves that the asymptotic variance of the weighted estimator is smaller when inverse probability weights are formed using estimated selection probabilities (i.e., using estimated ! from Equation 3) than when using known selection probabilities (i.e., using the true ! from Equation 3). As a result, when one corrects the standard errors of the second stage estimates of the weighted model to account for the error introduced by estimation in the first stage, the standard errors actually get smaller. Therefore, we chose not to correct the standard errors of weighted estimates in order to provide the most conservative (largest) standard errors possible.
14
of the null hypothesis that the weighted and unweighted coefficient estimates are the same is
complicated by the fact that the estimated coefficients are only identified to scale.9 Therefore,
our testing strategy used 5,000 bootstrap samples to construct an estimate for the joint covariance
matrix of a set of ratios formed by dividing each of the estimated coefficients by the estimated
coefficient for distance – a highly significant variable in both models. For the family planning
model, the resulting test statistic is 17.23 which, under the null hypothesis is chi squared with 19
degrees of freedom (p=0.57). For maternal health, the test statistic is 10.92 which is chi squared
with 16 degrees of freedom (p=0.81).10
[Insert Table 4 Here]
These results fail to uncover a significant difference in the estimates produced by the
weighted and unweighted models, suggesting that selection into the set of individuals who
actually visit a facility is not endogenous. As a result, our remaining results focus on unweighted
estimators for both maternal health and family planning models.11
9 The preference parameters discussed throughout the results section are estimated using several classes of multinomial choice models. In general, identifying these models required that the variance of the error term, !!" , be normalized by the econometrician. Throughout, we will assume that !!" is distributed Type 1 Extreme Value, which naturally imposes the assumption that ! !!" = !! 6. Given this assumption, estimated preference parameters should be interpreted as ! = (!/!) ∗ √(!!/6), where !, the true variance of !!", is unknown. For this reason, it is often said that these models are identified up to scale. See Train (2009, Section 2.5.2) for more details. 10 One variable, participate, had to be dropped from the maternal health model. Only 3% of selected facilities failed to participate in the survey; thus, a lack of variation in caused instability in some of the bootstrap samples. 11 In our main specification, facilities from the regions of Dakar (which contains the cities of Dakar, Guédiawaye, Pikine, and Mbao), Mbour, and Kaolack are included in every individual’s choice set, regardless of which region the individual resides in. This methodology assumes implicitly that individuals know of all facilities within the three regions and select a facility optimally based on the facility’s characteristics and distance from the individual’s home. This assumption may be questionable, as Dakar is roughly 69 km from Mbour and 178 km from Kaolack, while Mbour is 109 km from Kaolack. If our assumption is incorrect, then parameters, particularly those on distance, will reflect some likelihood that individuals know about the facility, as well as their preference for the facility characteristic. We test the validity of this assumption by estimating two additional conditional logit models. In the first, we leave the choice sets intact, but drop the 29 individuals in the maternal care model and 13 individuals in the family planning model that are observed to leave their home region for care. Shown in columns 2 and 5 of Appendix Table A2, these models reflect a greater distaste for travel than the preferred model, which makes sense, given that long-distance travelers have been dropped; however, using a chi-squared test for a difference in the ratio of parameters in this model and our preferred model, we are unable to reject the null hypothesis that the two sets of parameter estimates are the same. In the second additional model, we again limit the sample to individuals staying within their own region, but also restrict each individual’s choice set to the facilities of the region they reside in. Results from this specification are presented in columns 3 and 6 of Appendix Table A2 and are indistinguishable from the results of the first additional model. Therefore, these tests show that the inclusion of very distant alternatives in an individual’s choice set have no bearing on the estimated parameters; however, including individuals in the analysis that travel very long distances for care has a small, statistically insignificant impact on estimated preference parameters. Given these results, the rest of our analysis includes all individuals and allows choices from the full set of observable facilities.

15
IV.b Preferred Mixed Logit Model
In our preferred model, the mixed logit (ML) model (Equation 2 above), we assume that
the distribution of taste parameters in the population can be represented as !!~!(!,!), where !
is a vector containing the mean of each parameter and ! is a covariance matrix that captures the
population variance in these parameters (i.e., on-diagonal elements) as well as correlation
between preferences for particular facility characteristics (i.e., off-diagonal elements). We
estimate !, which is displayed in Panel A of Table 5, and !, the main diagonal of which can be
found in Panel B of Table 5.12 In addition to the standard conditional logit (CL) model displayed
in Table 4, which restricts ! = 0, we also estimated a version of the mixed logit model that
restricts ! to be a diagonal matrix, which allows the preference parameters to be random but
uncorrelated. Both versions of the mixed logit model (Ʃ unrestricted and Ʃ restricted to being a
diagonal matrix) relax the independence of irrelevant alternatives feature of standard conditional
logit. Since the three models are nested, we performed likelihood ratio tests of the null
hypotheses to determine if Ʃ could be restricted to zero or to a diagonal matrix. For both
maternal health and family planning models, both null hypotheses were strongly rejected with p-
values of essentially zero; thus, the unrestricted model is preferred.13
One issue with the likelihood ratio specification test described above is that the
asymptotic distribution of the test statistic is dependent on the distributional assumption of !!. In
other words, the validity of the tests hinges on our assumption that !! ~ !(!,!) is correct, which
is not desirable as we are unable to test this distributional assumption. McFadden and Train
(2000) propose another test of whether mixing is necessary that relies only on the estimation of
the CL model. The test is conducted using the following steps: First, we estimate the CL model
to obtain preference parameters (i.e., the parameters found in columns 1 and 4 of Table 4).
Second, we construct the following artificial variables,
!!" =12 !!" − !!"
! with !!" = !!"!!"!∈!
where !!" is the predicted probability that individual ! selects alternative ! using the preference
parameters from the first step. Third, we re-estimate the CL model with the artificial variables,
!!", included and conduct a likelihood ratio test for the null hypothesis that the two models are 12 The full covariance matrix is estimated and available upon request, but is not included because of its size (18 x 18 in the maternal health model and 20 x 20 in the family planning model). 13Estimates from the restricted mixed logit models are not reported, but are available upon request.
16
the same. For both maternal health and family planning models, we reject the null at the 0.001
level of significance, again confirming the superiority of the mixed logit model.
Results from the unrestricted mixed logit models are found in Table 5. In both the
maternal health and family planning models, the (Panel A) estimates support the notion that
women prefer high quality health facilities. For maternal health, preferences for the following
facility characteristics are positive and significantly different from zero at the population mean:
open every day of the week, any health social worker, number of services offered, any IEC
materials, any programs that share health information with the community, electricity, piped
water, a telephone, and private rooms. Women have negative preferences for private facilities
and low volume facilities in both models. For the family planning model, preferences for the
following facility characteristics are positive and significantly different than zero at the
population mean: facility age, hours a day that the facility is open, total number of FP methods
available, any FP protocol, number of midwives, number of services offered, any IEC materials,
any programs that share health information with the community, electricity, and a telephone. We
also find negative (and significant in the family planning model) preferences for the number of
doctors at a facility in both models, which seems counter-intuitive as doctors are generally
thought to provide a higher quality of service than nurses and midwives. There are several
possible explanations; this finding could reflect a negative preference for male practitioners
(doctors are more likely to be men) by women seeking family planning care or could reflect
positive correlation between the doctors, prices, and waiting times, the latter two of which are
unobserved.
Mean preferences for distance are significant and negative in both the maternal health
and family planning models. Because the preference parameters from Panel A are identified only
up to scale, we calculate an elasticity of demand for distance for both models, which is
independent of scale. For the maternal health model, we find that a 10% increase (decrease) in
the distance one must travel to reach a particular facility decreases (increases) the probability of
selecting that facility by about 20% (26%). These estimates are near, though slightly larger than,
the distance elasticities reported by Luft et al. (1990) – a 12-14% increase in hospital admissions
given a 10% decrease in distance.14 That said, Luft et al.’s estimates reflect the preferences of
14 Our method for calculating these elasticities is similar to Luft et al. (1990), who also estimate a mixed logit model. First, we randomly select a facility for each individual. Second, we predict the probability of selecting this facility

17
hospital patients in San Francisco, meaning (among other possibilities) the difference in
transportation networks between San Francisco and urban Senegal could explain our larger
distance elasticities. From the developing country literature, our distance elasticity estimates are
similar in magnitude to those reported by Dor et al. (1987) for low-income Cote d’Ivorians
traveling over an hour for care; elasticities between -0.87 and -2.26. Interestingly, we find for the
family planning model that a 10% increase (decrease) in the distance one must travel to reach a
particular facility decreases (increases) the probability of selecting that facility by only 1%
(1.2%). The smaller elasticity is somewhat surprising, given that the number of facilities offering
family planning services is more than three times the number offering maternal health services.
That said, the finding is consistent with fact that we observe a much higher bypass rate for family
planning services than maternal health services. Moreover, these elasticities are close in
magnitude to the distance elasticities reported by Mwabu et al. (1993) and by Erylana et al.
(2011), the latter of which provides estimates from both urban and rural areas of Indonesia. As
noted above, the estimates from these papers are biased by measurement error, which may
partially explain the differences across the studies.
Panel B of Table 5 reveals wide variance in preferences for distance and a number of
facility features in both the maternal health and family planning models. This heterogeneity
could explain why the CL and ML models estimate seemingly opposite preference parameters
for some facility features. For example, the family planning model reveals wide variance in the
preferences for pharmacies, any stockouts, and participating facilities. The CL model estimated
preferences for these facility features are significant and of the opposite sign of the mean
preference estimates from the mixed logit model.
[Insert Table 5 Here]
Recall that the off-diagonal elements of the covariance matrix, !, describe how
preferences for one facility feature relate to preferences for another. Appendix Table A3 contains
the parameters from the first row of !, which describe the relationship between preferences for
distance, our only explicit measure of the cost of visiting a facility, and other facility features.
Note that for both maternal health and family planning models, of the covariance parameters
assuming that the distance that one must travel is equal to the average travel distance observed in the data (i.e., 0.41 km). For this prediction, we integrate over the estimated parameter covariance matrix using the stata package mixlpred with 400 draws. Third, we predict the probability of selecting this facility assuming that the distance traveled is 10% longer (shorter) and calculate the elasticity.

18
describing the relationship between distance and quality (i.e., in Table A3, characteristics
between open 7 days a week and has private room) preferences, only positive parameters are
significant at the 5% level.15 Because preferences for distance are negative and preferences for
quality are generally positive, the consistently positive relationship between distance and quality
preferences suggests that individuals with below mean preferences for distance (i.e., distance is
less important for them) have strong preferences for quality.16 The reverse is also true –
individuals that care a lot about distance worry less about quality.
IV.c Preferred Model with Interactions
We expand our preferred mixed logit model to include interactions between facility
characteristics and a woman’s education, measured in years completed. The objective of this
analysis is to determine which characteristics of a health facility are most attractive to the least
educated women, as uneducated women are significantly less likely to visit a health facility for
each type of service. Our findings are presented in Table 6.17 For maternal health services,
preferences for travel, private facilities, low volume facilities, longer hours, electricity, and
telephone services are significantly lower for women with less education. Preferences for being
open every day of the week and number of services offered are significantly higher for women
with less education. Similar results are found for family planning services, though fewer of the
education interaction effects are significantly different from zero.
Taken together, these results suggest that travel distance in an urban environment is a
greater barrier to health facility access (for maternal care) for less educated women than for more
educated women. Moreover, less educated women are most attracted to public, high volume
facilities that are open every day of the week and offer a large number of services.
[Insert Table 6 Here]
IV.d Facility Choices with Measurement Error
15 For the maternal health model, this includes open 7 days a week, number of doctors, has telephone, and has private room. For the family planning model, this includes open 7 days a week, any stockouts, any family planning protocol, number of services offered, and has telephone. 16 This interpretation is not appropriate for number of doctors in the maternal health model and any stockouts in the family planning model, as mean preferences for these facility features are negative, though statistically insignificant. 17 We only present estimates of means of the parameter distribution here. The new covariance matrix estimates are available upon request.
19
Existing research on the determinants of health facility choice in developing countries is
hampered by data limitations. Many researchers analyze Demographic and Health Survey (DHS)
data, which rarely report the exact facilities that a woman visits for care; rather, these data report
the type of facilities that she visits (e.g., public or private hospital, health center or dispensary; or
traditional healer). A popular solution to this problem is to (1) define a woman’s facility
alternative set by the facilities of each type that are nearest her home and (2) match her to the
nearest reported type (Akin et al. 1986; Dor et al. 1987; Mwabu et al., 1993; Leonard et al.,
2003; Mariko, 2003; Habtom, 2007; Erlyana et al. 2011). This strategy creates measurement
error in both the alternative set and choice outcome, potentially biasing preference parameters in
a direction that is ex-ante unknown. The strategy essentially eliminates the possibility that a
woman travels a long distance to receive care, which may lead to an overestimation of
preferences against travel; however, the strategy also removes many far off unselected facilities
from the alternative set, which could lead to an underestimation of preferences against travel.
Moreover, the strategy reduces variability in the distance variable, which (by analogy to the
linear model) leads to larger standard errors on the distance preference parameter, all else equal,
making it more difficult to obtain significant effects.
Not only are our individual-facility matched data free of this measurement error, but our
data can be manipulated to reflect the measurement error that other researchers face in order to
determine the resulting bias in preference parameter estimates. To create the measurement error
typically observed in the literature, we limit our sample in several ways. First, we define four
facility types: high-volume public, low-volume public, high-volume private, and low-volume
private. We include a fifth type, pharmacy, for the family planning choice model. Second, we
limit every woman’s alternative set to the 4 (or 5) facilities of each type that is nearest her home.
Third, we match each woman to the nearest facility matching the type of facility that she actually
visits, rather than the actual facility, which is generally no longer in her alternative set. Finally,
we estimate a conditional logit model for both maternal health and family planning decisions and
compare the results to the model without measurement error. Note that we chose to compare
conditional logit, rather than mixed logit, results both for simplicity and because only one paper
in the existing literature estimates a mixed logit model (Borah, 2006).
The maternal health results (unweighted, with measurement error) can be found in
column 3 of Table 4; the family planning results can be found in column 6 of the same table.

20
These results should be compared to the original unweighted, conditional logit results (measured
without error), which can be found in columns 1 and 4, respectively. Note that since the
competing models may be scaled differently (see footnote 9), the magnitudes of the parameters
from these models cannot be compared without a formal statistical test. That said, we can
compare the signs of preference parameters in the competing models, as well as whether or not
the parameters differ significantly from zero. These comparisons reveal a number of differences.
For example, the maternal health model estimated on data measured without error (column 1)
reveals negative preferences for low volume facilities, while the model estimated on data
measured with error (column 3) incorrectly suggests that women have positive preferences for
low volume facilities. Moreover, there are several other instances of parameter sign differences
between these two models (e.g., health social worker, community outreach, piped water, private
rooms, and facility participation) but the preference parameters are not significantly different
from zero in one or both models. For the family planning models estimated with and without
error, the signs on low volume facilities are again opposite and each is significantly different
from zero; moreover, a total of eight other parameters differ in sign, but one or both are not
significantly different from zero.
To formally test the competing models for significant differences in the estimated
preference parameters we follow the same strategy that we used to test for differences in the
conditional logit models with and without selection corrections. We simultaneously estimate the
models with and without measurement error in order to generate a joint covariance matrix based
on 5,000 bootstrap replications. We then form the ratios of all coefficients to the distance
coefficients in the two models and conduct a Wald test that compares the ratios of parameters
across models. For the maternal health model the test statistic is 32.4 with 16 degrees of freedom
and for family planning the test statistic is 74.8 with 19 degrees of freedom. Thus, in both cases,
we strongly reject the null hypothesis that the vector of ratios is the same, making it is clear that
the model with measurement error yields misleading results.
IV.e Willingness to Trade Distance for Quality
We have established above that (i) the ML model generates significantly different results
than the CL model and (ii) the CL model without measurement error generates significantly
different results than the CL model with measurement error. In our analysis of both (i) and (ii)

21
we identified parameters that changed sign and significance as we moved from the less preferred
to the preferred model. We did not discuss how the magnitude of preference parameters changed
from one model to the next because each model is only identified up to scale, so parameter
magnitudes cannot be directly compared across models. However, by forming ratios of
preference parameters one can eliminate the unobserved scaling factor, allowing for differences
in (relative) parameter magnitudes to be analyzed. We conduct this analysis here.
Given that distance is our only facility characteristic that measures an explicit cost of
visiting a facility, it makes sense to form ratios with the (absolute value of the) distance
parameter as the base. Table 7 contains these ratios for each model and a select set of quality
measures.18 Table elements can be interpreted as the additional distance (in kilometers) that the
average individual would be willing to travel to gain one additional unit of quality.19 Note that
the last three columns of the table calculate the distance-quality tradeoff for the ML model at
different points in the distance taste distribution.
Five overarching conclusions can be drawn from these results. First, across all models,
electricity is found to be a facility feature that women place great value on. Second, among the
first three columns, the CL model (column 1) generally suggests that individuals are most willing
to trade distance in favor of greater quality.20 Maintaining our view that the ML model is most
preferred, this suggests that the CL model underestimates individuals’ distaste for travel. Third,
among the first three columns, the CL model with measurement error (column 2) generally
suggests that individuals are least willing to trade distance in favor of greater quality.21 This
suggests that the CL model with measurement error, which is widely used in the literature,
overestimates an individual’s distaste for travel, a finding that is consistent with the narrative
provided in Section IV.d. Compared to the ML model (column 3), the CL model with
measurement error overestimates distaste for travel, relative to quality, by a minimum factor of
roughly 1.5 (any IEC materials in the maternal health model) and a maximum factor of roughly
10 (has electricity in both maternal health and family planning models). Fourth, by comparing
18 The quality metrics included in Table 7 had to meet two criteria. First, the respective quality preference parameters must be significantly different from zero in at least two of the three models that were estimated. Second, quality preference parameters must be of the same sign in the three models. 19 For binary quality variables, such as open 7 days a week, the interpretation is the additional distance that the average individual would be willing to travel for a facility with the particular feature. 20 There are three exceptions to this claim, all found in the family planning model: any IEC materials, has electricity, and has telephone. 21 Any IEC materials in the family planning model is the lone exception to this claim.

22
columns 4 and 5, we get a sense of how much variation there is in the willingness to trade
between distance and quality due to the wide variation in preferences for travel. According to our
results, individuals in the 75th percentile of preferences for travel (i.e., those who like travel least)
are willing to trade distance for quality at roughly half the rate as those in the 25th percentile of
preference for travel. Fifth, comparing columns 5 and 2 highlights just how much the CL model
with measurement error overestimates distaste for travel – the average individual in the CL
model with measurement error is found to dislike travel even more than an individual at the 75th
percentile of preferences for travel in the ML model.
[Insert Table 7 here]
IV.f Policy Experiment
We conduct two policy experiments using the parameter estimates from our preferred
mixed logit model and the measurement error model. For simplicity, we focus only on the choice
of a provider for maternal health care. The first policy that we examine was enacted in 2014 in
Dakar, Senegal after our data was collected – a new public facility was added along the eastern
coastline of the city. The new facility, which is marked by a star in Figure 1, is located in an area
that was previously underserved. Data on this facility was collected in the third round of our
survey data, which was conducted in 2015; thus, facility characteristics are perfectly observable.
The facility is public, low volume, is open 24/7, and has all modern amenities. We use both our
preferred mixed logit model and the conditional logit (with measurement error) model estimates
to simulate how many women will visit this new facility. Given that (i) our results from Section
IV.e suggest that the measurement error model over-emphasizes patient distaste for distance
relative to preferences for quality and (ii) the new facility reduces the distance that some women
must travel for care, we hypothesize than the measurement error model will predict that more
women will visit the new facility than the preferred model.22
The second policy is hypothetical – we consider providing electricity to the 6 participating
health facilities in Dakar (5 public and 1 private) that report not having electricity at the time of
the survey. As public health officials are generally resource constrained, this hypothetical policy
22 Whether the measurement error model or preferred model predicts that more women visit the new facility is an empirical question that cannot be answered by simply studying at the estimated preference parameters of the two models. The relative quality of nearby facilities, as well as the distance between the new facility and nearby facilities, impacts our findings. A similar statement can be made regarding our second policy experiment.
23
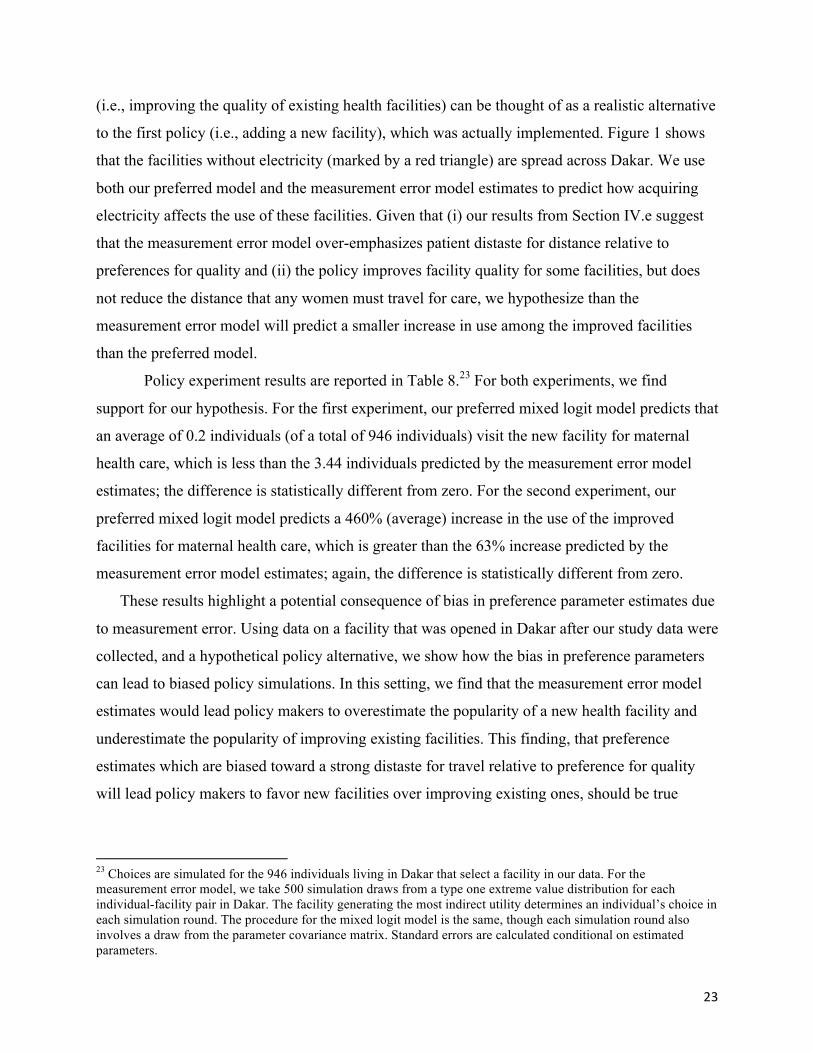
(i.e., improving the quality of existing health facilities) can be thought of as a realistic alternative
to the first policy (i.e., adding a new facility), which was actually implemented. Figure 1 shows
that the facilities without electricity (marked by a red triangle) are spread across Dakar. We use
both our preferred model and the measurement error model estimates to predict how acquiring
electricity affects the use of these facilities. Given that (i) our results from Section IV.e suggest
that the measurement error model over-emphasizes patient distaste for distance relative to
preferences for quality and (ii) the policy improves facility quality for some facilities, but does
not reduce the distance that any women must travel for care, we hypothesize than the
measurement error model will predict a smaller increase in use among the improved facilities
than the preferred model.
Policy experiment results are reported in Table 8.23 For both experiments, we find
support for our hypothesis. For the first experiment, our preferred mixed logit model predicts that
an average of 0.2 individuals (of a total of 946 individuals) visit the new facility for maternal
health care, which is less than the 3.44 individuals predicted by the measurement error model
estimates; the difference is statistically different from zero. For the second experiment, our
preferred mixed logit model predicts a 460% (average) increase in the use of the improved
facilities for maternal health care, which is greater than the 63% increase predicted by the
measurement error model estimates; again, the difference is statistically different from zero.
These results highlight a potential consequence of bias in preference parameter estimates due
to measurement error. Using data on a facility that was opened in Dakar after our study data were
collected, and a hypothetical policy alternative, we show how the bias in preference parameters
can lead to biased policy simulations. In this setting, we find that the measurement error model
estimates would lead policy makers to overestimate the popularity of a new health facility and
underestimate the popularity of improving existing facilities. This finding, that preference
estimates which are biased toward a strong distaste for travel relative to preference for quality
will lead policy makers to favor new facilities over improving existing ones, should be true
23 Choices are simulated for the 946 individuals living in Dakar that select a facility in our data. For the measurement error model, we take 500 simulation draws from a type one extreme value distribution for each individual-facility pair in Dakar. The facility generating the most indirect utility determines an individual’s choice in each simulation round. The procedure for the mixed logit model is the same, though each simulation round also involves a draw from the parameter covariance matrix. Standard errors are calculated conditional on estimated parameters.
24
generally, but only for facilities that reduce travel costs for some women.24 The finding is
important because policy-makers concerned with acquiring political capital already have an
incentive to construct new buildings, which generally come at a high financial cost.
V. Discussion
We estimate facility choice models for maternal health and family planning services for
women living in urban Senegal. Compared to other research on health facility choice in
developing countries, our research is unique in (i) its focus on women living in urban
environments and (ii) our ability to match women to the health facility that they actually visit.
We report two main findings from our preferred mixed logit model. First, we find that women
dislike traveling long distances for medical care and that they prefer higher quality facilities.
Among the many facility characteristics that women value, we consistently find strong
preferences for facilities that offer a larger number of services, provide Information, Education,
and Communication (IEC) materials, run community outreach programs, have electricity, and
have a telephone. Moreover, our results suggest that women who are least sensitive to traveling
long distances for medical care also value quality the most, and vice-a-versa. Second, we provide
evidence that a particular type of measurement error that is frequently present in the literature
leads to biased preference parameter estimates. In our setting, this measurement error leads to a
significant overestimation of consumer distaste for travel, relative to preferences for facility
quality. Using a policy experiment that compares the effectiveness of a new health facility vs.
improved existing facilities, we provide an important example of consequences that can result
from bias in preference parameter estimates.
Like all empirical work, this study is not without limitations. Most notably, our models of
demand abstract from potential general equilibrium effects (i.e., facility characteristics are
partially determined by market forces, such as consumer demand). It is also possible that quality
characteristics that are unobserved to the econometrician, such as client-provider interaction
details and prices for particular medical procedures, are correlated with characteristics that we
observe. Both of these concerns could be mitigated with an experimental design that randomly
altered the characteristics of some facilities, but not others. Finding willing (facility) participants 24 A total of six new public health facilities were added in Dakar between 2011 and 2015. We conducted the simulation described above for each, individually. The measurement error model predicted that a larger number of patients would visit the new facility than the mixed logit model for each of the six new facilities.

25
for such an experiment would be incredibly difficult, which likely explains why such random
variation is rarely used for identification in this literature. That said, both our work and existing
work could be improved by such a research design.
This paper contributes to a large literature on facility choice in developing countries,
most notably, by quantifying the bias in preference parameter estimates due to measurement
error. The paper also contributes to a large literature on facility choice in developed countries,
despite the fact that our population of study resides elsewhere. Compared to the developing
country research referenced above, the developed country literature features quality metrics that
are objective and well defined, such as facility-procedure specific mortality rates (Luft et al.,
1990; Burns and Wholey, 1992; Hodgkin, 1996; Mukamel et al., 2004; Dranove and Sfekas,
2008), birth rates (Bundorf et al., 2009); remission rates (Varkevisser et al., 2012); and overall
quality indexes (Santos et al., 2015). Moreover, much of the literature focuses not only on
whether people respond to quality, but whether publicized report cards have an additional
marginal impact on patient choice (Mukamel et al., 2004; Dranove and Sfekas, 2008; Bundorf et
al., 2009; Werner et al., 2012). This literature finds, quite consistently, that patients respond to
facility quality, with or without report cards (Kolstad and Chernew, 2009); however, in nearly all
instances studied, primary care physicians are likely to play a role in referring patients to
facilities.25 Given the medical expertise and professional network of referring physicians, it is not
terribly surprising that these choice models reveal a preference for quality, even in the absence of
publicly available report cards.
While there are many economic and cultural differences between the choice environments
studied in this paper and those studied in developed countries, this paper contributes to the larger
facility choice literature in two important ways. First, given our focus on maternal health and
family planning services, it is likely that the preferences revealed by our choice model reflect
those of patients and not referring physicians. Second, because we measure preferences for
facility characteristics that proxy for quality, rather than developing an index of quality, our
findings shed light on which characteristics patients value most and, therefore, should be useful
in the future construction of quality indexes.
Facility choice research focused in developed countries also tends to extract choice
information from a different type of data - namely, administrative discharge data (e.g., Luft et al.,
25 Santos et al. (2015) is an exception, as these authors model the choice of family doctors in England.

26
1990; Burns and Wholey, 1992; Hodgkin, 1996; Chernew et al., 1998; Mukamel et al., 2004;
Dranove and Sfekas, 2008) - than research focused in developing countries - namely, survey
data. A clear advantage of discharge data is that the issue of patient-facility mismatch discussed
above is avoided; however, a disadvantage is that researchers only observe individuals who
choose to visit a facility. Thus, the estimation sample is non-randomly selected and could
produce biased parameter estimates if individuals not visiting a facility have preferences that
differ from individuals visiting a facility. Our use of survey data, which contains information on
women who choose not to visit a facility, enables us to control for this sample selection problem.
Moreover, we believe that our selection-on-observables strategy is particularly appropriate in our
setting, which features selection into a large alternative set, and should be employed more often
in similar situations. Unfortunately, absent additional information on the composition of the
population that chooses not to visit a facility, researchers that choose to use discharge data to
estimate choice models cannot use this technique. That said, our results reveal minimal
endogenous selection into the sample in our particular setting, providing some evidence that
sample selection issues in similar settings are of minor concern.
Bibliography
Agence Nationale de la Statistique et de la Démographie (ANSD) [Sénégal] et ICF International. 2015. Enquête Démographique et de Santé Continue (EDS-Continue 2015) : Rapport sur les Indicateurs Clés 3èmeannée. ICF International Rockville, Maryland, USA Akin, John and Paul Hutchinson. “Health-care facility choice and the phenomenon of bypassing.” Health Policy and Planning 14, no. 2 (1999): 135-151. Akin, John, Charles Griffin, David Guilkey, and Barry Popkin. “The Demand for Primary Health Care Services in the Bicol region of the Philippines.” Economic Development and Cultural Change 34, no. 4 (1986): 755-782. Akin, John, David Guilkey, and E. Hazel Denton. “Quality of Services and Demand for Health Care in Nigeria: A Multinomial Probit Estimation.” Social Science and Medicine 40, no. 11 (1995): 1527-1537. Bolduc, Denis, Guy Lacroix, and Christophe Muller. “The choice of medical providers in rural Benin: a comparison of discrete choice models.” Journal of Health Economics 15 (1996): 477-498.

27
Borah, Bijan. “A mixed logit model of health care provider choice: analysis of NSS data for rural India.” Health Economics 15 (2006): 915-932. Bundorf, Kate, Natalie Chun, Gopi Goda, and Daniel Kessler. “Do markets respond to quality information? The case of fertility clinics.” Journal of Health Economics 28 (2009): 918-727. Burns, Lawton R. and Douglas R. Wholey. “The impact of physician characteristics in conditional choice models for hospital care.” Journal of Health Economics 11 (1992): 43-62. Cameron, Cameron and Pravin Trivedi. Microeconometrics: Methods and Applications. Cambridge: Cambridge University Press, 2005. Chernew, Michael, Dennis Scanlon, and Rod Hayward. “Patient Treatment and Procedure Use.” Health Services Research 33, no. 3 (1998): 447-466. Chipman, John. "The foundations of utility." Econometrica (1960): 193-224. Cronin, Christopher, David Guilkey, and Ilene Speizer. "The effects of health facility access and quality on family planning decisions in urban Senegal." Available at SSRN 2574073 (2015). Debreu, Gerard. "Topological methods in cardinal utility theory." Mathematical Methods in the Social Sciences (1960): 16-26. Dor, Avi, Paul Gertler, and Jacques van der Gaag. “Non-Pricing and the Choice of Medical Care Providers in Rural Cote D’Ivoire.” Journal of Health Economics 6 (1987): 291-304. Dranove, David and Andrew Sfekas. “Start spreading the news: a structural estimate of the effects of new york hospital report cards.” Journal of Health Economics 27 (2008): 1201-1207. Dzakpasu, Susie, Seyi Soremekun, Alexander Manu, Guus ten Asbroek, Charlotte Tawiah, Lisa Hurt, Justin Fenty, Seth Owusu-Agyei, Zelee Hill, Oona Campbell, and Betty Kirkwood. “Impact of Free Delivery Care on Health Facility Delivery and Insurance Coverage in Ghana’s Brong Ahafo Region.” PLoS ONE 7, no. 11 (2012): e49430. Erlyana, Erlyana, Kannika Damrongplasit, and Glenn Melnick. “Expanding health insurance to increase health care utilization: Will it have different effects in rural vs. urban areas?” Health Policy 100 (2011): 273-281. Gertler, Paul, Luis Locay, and Warren Sanderson. “Are User Fees Regressive? The Welfare Implications of Health Care Financing Proposals in Peru.” Journal of Econometrics 36 (1987): 67-88. Habtom, GebreMichael and Pieter Ruys. “The choice of a health care provider in Eritrea.” Health Policy 80 (2007): 202-217.

28
Hole, Arne. "A comparison of approaches to estimating confidence intervals for willingness to pay measures." Health Economics 16, no. 8 (2007): 827-840. Hodgkin, Dominic. “Specialized service offerings and patients' choice of hospital: The case of cardiac catheterization.” Journal of Health Economics 15, no.3 (1996): 305-332. Imbens, Guido. “Matching Methods in Practice: Three Examples.” The Journal of Human Resources 50, no. 2 (2014): 373-419. Kolstad, Jonathan T. and Michael E. Chernew. “Quality and consumer decision making in the market for health insurance and health care services.” Medical Care Research and Review 66 (2009): 28S-52S. Leonard, Kenneth, Gilbert Mliga, and Damen Mariam. “Bypassing Health Centres in Tanzania: Revealed Preferences for Quality.” Journal of African Economies 11, no. 4 (2003): 441-471. Luft, Harold, Deborah Garnick, David Mark, Deborah Peltzman, Ciaran Phibbs, Erik Lichtenberg, and Stephen McPhee. “Does Quality Influence Choice of Hospital?” Journal of the American Medical Association 263, no. 21 (1990): 2899-2906. Mariko, Mamadou. “Quality of care and the demand for health services in Bamako, Mali: the specific roles of structural, process, and outcomes components.” Social Science and Medicine 56 (2003): 1183-1196. McFadden, Daniel. "The measurement of urban travel demand." Journal of Public Economics 3, no. 4 (1974): 303-328. McFadden, Daniel and Kenneth Train. "Mixed MNL models for discrete response." Journal of Applied Econometrics 15, no. 5 (2000): 447-470. Measurement, Learning & Evaluation (MLE) Project and Initiative Sénégalese de Santé Urbaine (ISSU). 2011 Baseline Survey for the Senegal Urban Health Initiative (ISSU) Household Survey: Final Report. Chapel Hill, NC: IntraHealth. 2012a. Measurement, Learning & Evaluation (MLE) Project and Initiative Sénégalese de Santé Urbaine (ISSU). 2011 Baseline Survey for the Senegal Urban Health Initiative (ISSU) Service Delivery Site Survey: Final Report. Chapel Hill, NC: IntraHealth. 2012b. Moffit, Robert, John Fitzgerald, and Peter Gottschalk. "Sample attrition in panel data: The role of selection on observables." Annales d'Economie et de Statistique (1999): 129-152. Mukamel, Dana, David Weimer, Jack Zwanziger, Shis-Fang Gorthy, and Alvin Mushin. “Quality Report Cards, Selection of Cardiac Surgeons, and Racial Disparities: A Study of the Publication of New York State Cardiac Surgery Reports.” Inquiry 41, no. 4 (2004): 435-446.

29
Mwabu, Germano, Martha Ainsworth, and Andrew Nyamete. “Quality of Medical Care and Choice of Medical Treatment in Kenya: An Empirical Analysis.” The Journal of Human Resources 28, no. 4 (1993): 838-862. Pope, Devin. “Reacting to rankings: Evidence from `America’s Best Hospitals’.” Journal of Health Economics 28 (2009): 1154-1165. Santos, Rita, Hugh Gravelle, and Carol Popper. “Does quality affect patients' choice of doctor? Evidence from the England.” The Economic Journal (2016): 1-50. The World Bank, World Development Indicators (2014), Fertility Rate and Contraceptive Prevalence. Retrieved from: http://databank.worldbank.org/data/reports.aspx?source=2&country=SEN&series=&period= Train, Kenneth. Discrete Choice Methods with Simulation. Cambridge: Cambridge University Press, 2009. Unicef, State of the World’s Children 2013 Country Statistical Tables, Infant and Maternal Mortality Rates. Retrieved from: http://www.unicef.org/infobycountry/senegal_statistics.html Varkevisser, Marco, Stephanie van der Geest, and Frederik Schut. “Do patients choose hospitals with high quality ratings? Empirical evidence from the market for angioplasty in the Netherlands.” Journal of Health Economics 31 (2012): 371-378. Wang, Justin, Jason Hockenberry, Shin-Yi Chou, and Muzhe Yang. “Do bad report cards have consequences? Impacts of publicly reported provide quality information on the CABG market in Pennsylvania.” Journal of Health Economics 30 (2011): 392-407. Werner, Rachel, Edward Norton, R. Tamara Konetzka, and Daniel Polsky. “Do consumers respond to publicly reported quality information? Evidence from nursing homes.” Journal of Health Economics 31 (2012): 50-61. Wooldridge, Jeffrey M. "Asymptotic Properties of Weighted M‐estimators for variable probability samples." Econometrica 67, no. 6 (1999): 1385-1406. Wooldridge, Jeffery. “Inverse probability weighted M-estimators for sample selection, attrition, and stratification.” Portuguese Economic Journal, 1 (2002): 117-139. Wooldridge, Jeffrey M. "Inverse probability weighted estimation for general missing data problems." Journal of Econometrics 141, no. 2 (2007): 1281-1301. Wooldridge, Jeffery. Econometric Analysis of Cross Section and Panel Data. Cambridge: The MIT Press, 2010. Yates, Rob. "Universal health care and the removal of user fees." The Lancet 373, no. 9680 (2009): 2078-2081.
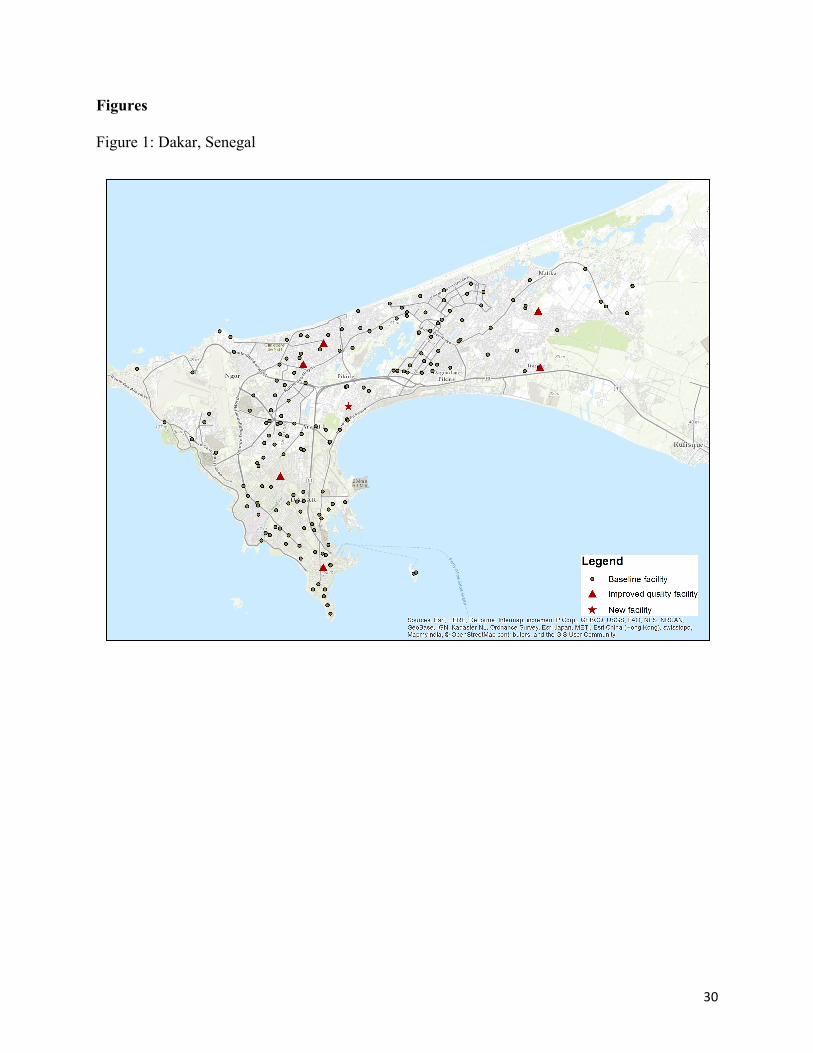
30
Figures
Figure 1: Dakar, Senegal

31
Tables
Maternal Care Family PlanningObservations 9,325 9,325 no visit 7,034 7,941 visit unobserved facility 461 311 visit observed facility 1,830 1,073Among women visiting an observed facility % visiting facility nearest home 25.7 11.6 % visiting nearest facility of a particular type 35.4 36.5 Mean # facilities bypassed 17.0 52.5 Median # facilities bypassed 4.0 13.0
Table 1: Facility choices by service type

32
Table 2: Facility Characteristics, Maternal Health Choice
All Facilities
Chosen Facility
Nearest Facility
distance 62.92
4.10
0.46 private 0.26
0.10
0.15
low volume 0.75
0.57
0.63 age 22.70
26.87
21.26
open 7 days a week 0.51
0.71
0.55 hours a day 14.77
18.29
14.92
any IEC materials 0.61
0.81
0.75 # doctors 1.98
3.60
0.74
# nurses 3.29
5.30
2.36 # midwives 2.53
4.63
2.04
any health social worker 0.19
0.32
0.14 # services offered 14.21
17.66
15.77
provides community outreach 0.52
0.75
0.67 has electricity 0.85
0.95
0.92
has piped water 0.88
0.97
0.96 has telephone 0.72
0.78
0.70
has private rooms 0.77
0.93
0.85 participating 0.89
0.97
0.96
observations 231 1,830 1,830 *Notes: Distance to any particular facility varies by individual, so the average distance is calculated using all 9325*231 observations. Moreover, while distance and facility type are observable for all 231 health facilities, the remaining variables are only observable for facilities participating in the survey – 205 health facilities.
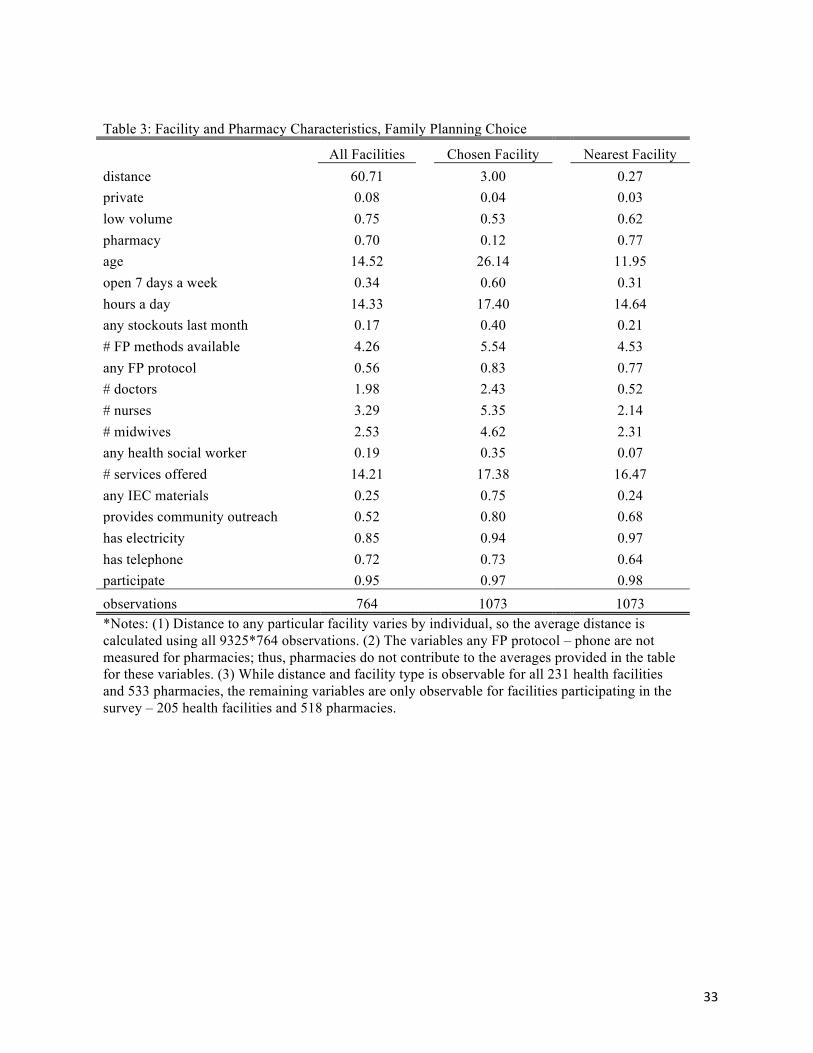
33
Table 3: Facility and Pharmacy Characteristics, Family Planning Choice
All Facilities
Chosen Facility
Nearest Facility
distance 60.71
3.00
0.27 private 0.08
0.04
0.03
low volume 0.75
0.53
0.62 pharmacy 0.70
0.12
0.77
age 14.52
26.14
11.95 open 7 days a week 0.34
0.60
0.31
hours a day 14.33
17.40
14.64 any stockouts last month 0.17
0.40
0.21
# FP methods available 4.26
5.54
4.53 any FP protocol 0.56
0.83
0.77
# doctors 1.98
2.43
0.52 # nurses 3.29
5.35
2.14
# midwives 2.53
4.62
2.31 any health social worker 0.19
0.35
0.07
# services offered 14.21
17.38
16.47 any IEC materials 0.25
0.75
0.24
provides community outreach 0.52
0.80
0.68 has electricity 0.85
0.94
0.97
has telephone 0.72
0.73
0.64 participate 0.95
0.97
0.98
observations 764 1073 1073 *Notes: (1) Distance to any particular facility varies by individual, so the average distance is calculated using all 9325*764 observations. (2) The variables any FP protocol – phone are not measured for pharmacies; thus, pharmacies do not contribute to the averages provided in the table for these variables. (3) While distance and facility type is observable for all 231 health facilities and 533 pharmacies, the remaining variables are only observable for facilities participating in the survey – 205 health facilities and 518 pharmacies.
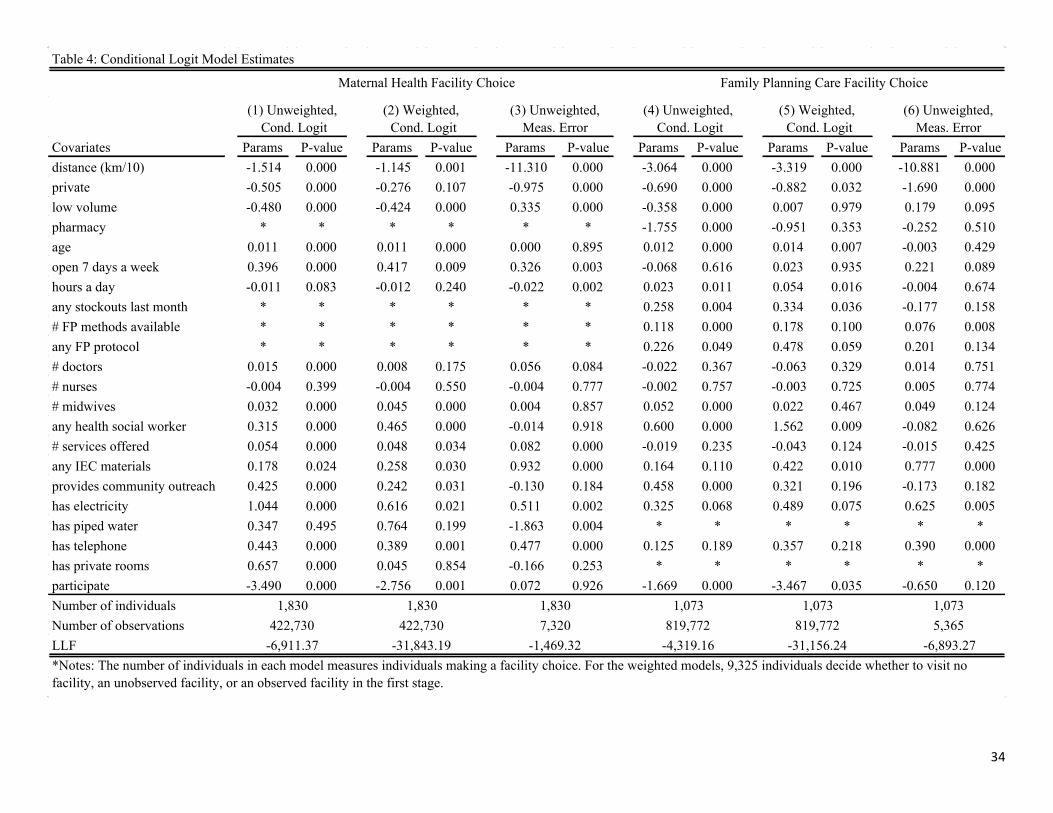
34
Covariates Params P-value Params P-value Params P-value Params P-value Params P-value Params P-valuedistance (km/10) -1.514 0.000 -1.145 0.001 -11.310 0.000 -3.064 0.000 -3.319 0.000 -10.881 0.000private -0.505 0.000 -0.276 0.107 -0.975 0.000 -0.690 0.000 -0.882 0.032 -1.690 0.000low volume -0.480 0.000 -0.424 0.000 0.335 0.000 -0.358 0.000 0.007 0.979 0.179 0.095pharmacy * * * * * * -1.755 0.000 -0.951 0.353 -0.252 0.510age 0.011 0.000 0.011 0.000 0.000 0.895 0.012 0.000 0.014 0.007 -0.003 0.429open 7 days a week 0.396 0.000 0.417 0.009 0.326 0.003 -0.068 0.616 0.023 0.935 0.221 0.089hours a day -0.011 0.083 -0.012 0.240 -0.022 0.002 0.023 0.011 0.054 0.016 -0.004 0.674any stockouts last month * * * * * * 0.258 0.004 0.334 0.036 -0.177 0.158# FP methods available * * * * * * 0.118 0.000 0.178 0.100 0.076 0.008any FP protocol * * * * * * 0.226 0.049 0.478 0.059 0.201 0.134# doctors 0.015 0.000 0.008 0.175 0.056 0.084 -0.022 0.367 -0.063 0.329 0.014 0.751# nurses -0.004 0.399 -0.004 0.550 -0.004 0.777 -0.002 0.757 -0.003 0.725 0.005 0.774# midwives 0.032 0.000 0.045 0.000 0.004 0.857 0.052 0.000 0.022 0.467 0.049 0.124any health social worker 0.315 0.000 0.465 0.000 -0.014 0.918 0.600 0.000 1.562 0.009 -0.082 0.626# services offered 0.054 0.000 0.048 0.034 0.082 0.000 -0.019 0.235 -0.043 0.124 -0.015 0.425any IEC materials 0.178 0.024 0.258 0.030 0.932 0.000 0.164 0.110 0.422 0.010 0.777 0.000provides community outreach 0.425 0.000 0.242 0.031 -0.130 0.184 0.458 0.000 0.321 0.196 -0.173 0.182has electricity 1.044 0.000 0.616 0.021 0.511 0.002 0.325 0.068 0.489 0.075 0.625 0.005has piped water 0.347 0.495 0.764 0.199 -1.863 0.004 * * * * * *has telephone 0.443 0.000 0.389 0.001 0.477 0.000 0.125 0.189 0.357 0.218 0.390 0.000has private rooms 0.657 0.000 0.045 0.854 -0.166 0.253 * * * * * *participate -3.490 0.000 -2.756 0.001 0.072 0.926 -1.669 0.000 -3.467 0.035 -0.650 0.120Number of individualsNumber of observationsLLF*Notes: The number of individuals in each model measures individuals making a facility choice. For the weighted models, 9,325 individuals decide whether to visit no facility, an unobserved facility, or an observed facility in the first stage.
422,730 422,730 7,320 819,772 819,772-6,911.37 -31,843.19 -4,319.16 -31,156.24-1,469.32 -6,893.27
5,365
Family Planning Care Facility Choice
Table 4: Conditional Logit Model Estimates
Maternal Health Facility Choice
1,830 1,830 1,073 1,073
(1) Unweighted, Cond. Logit
(2) Weighted, Cond. Logit
(4) Unweighted, Cond. Logit
(5) Weighted, Cond. Logit
(3) Unweighted, Meas. Error
(6) Unweighted, Meas. Error
1,830 1,073
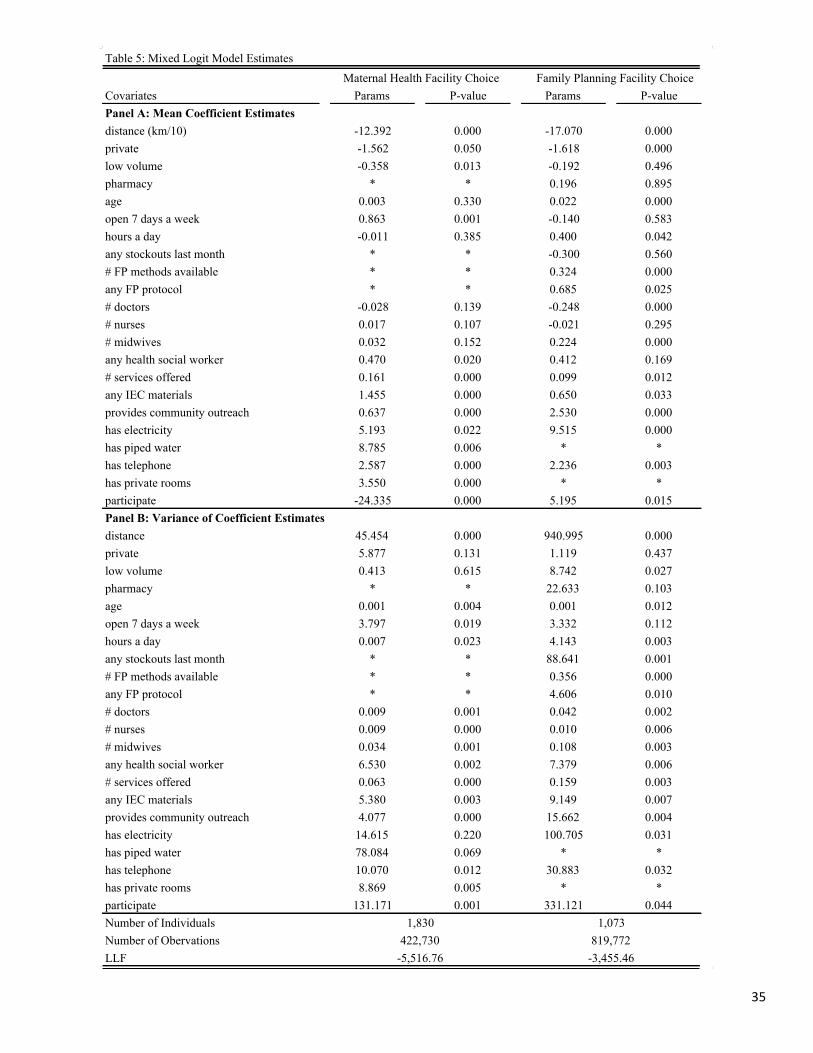
35
Covariates Params P-value Params P-valuePanel A: Mean Coefficient Estimatesdistance (km/10) -12.392 0.000 -17.070 0.000private -1.562 0.050 -1.618 0.000low volume -0.358 0.013 -0.192 0.496pharmacy * * 0.196 0.895age 0.003 0.330 0.022 0.000open 7 days a week 0.863 0.001 -0.140 0.583hours a day -0.011 0.385 0.400 0.042any stockouts last month * * -0.300 0.560# FP methods available * * 0.324 0.000any FP protocol * * 0.685 0.025# doctors -0.028 0.139 -0.248 0.000# nurses 0.017 0.107 -0.021 0.295# midwives 0.032 0.152 0.224 0.000any health social worker 0.470 0.020 0.412 0.169# services offered 0.161 0.000 0.099 0.012any IEC materials 1.455 0.000 0.650 0.033provides community outreach 0.637 0.000 2.530 0.000has electricity 5.193 0.022 9.515 0.000has piped water 8.785 0.006 * *has telephone 2.587 0.000 2.236 0.003has private rooms 3.550 0.000 * *participate -24.335 0.000 5.195 0.015Panel B: Variance of Coefficient Estimatesdistance 45.454 0.000 940.995 0.000private 5.877 0.131 1.119 0.437low volume 0.413 0.615 8.742 0.027pharmacy * * 22.633 0.103age 0.001 0.004 0.001 0.012open 7 days a week 3.797 0.019 3.332 0.112hours a day 0.007 0.023 4.143 0.003any stockouts last month * * 88.641 0.001# FP methods available * * 0.356 0.000any FP protocol * * 4.606 0.010# doctors 0.009 0.001 0.042 0.002# nurses 0.009 0.000 0.010 0.006# midwives 0.034 0.001 0.108 0.003any health social worker 6.530 0.002 7.379 0.006# services offered 0.063 0.000 0.159 0.003any IEC materials 5.380 0.003 9.149 0.007provides community outreach 4.077 0.000 15.662 0.004has electricity 14.615 0.220 100.705 0.031has piped water 78.084 0.069 * *has telephone 10.070 0.012 30.883 0.032has private rooms 8.869 0.005 * *participate 131.171 0.001 331.121 0.044Number of IndividualsNumber of ObervationsLLF -5,516.76 -3,455.46
Table 5: Mixed Logit Model EstimatesMaternal Health Facility Choice Family Planning Facility Choice
1,830 1,073422,730 819,772

36
Covariates Params P-value Params P-valuedistance (km/10) -13.309 0.000 -17.387 0.000private -2.358 0.000 -3.298 0.000low volume -0.676 0.000 -0.227 0.498pharmacy * * -0.297 0.927age 0.003 0.434 0.023 0.001open 7 days a week 0.847 0.027 -0.005 0.990hours a day -0.019 0.338 0.516 0.111any stockouts last month * * 0.715 0.362# FP methods available * * 0.224 0.035any FP protocol * * 1.023 0.032# doctors -0.041 0.028 -0.244 0.001# nurses 0.018 0.125 -0.015 0.581# midwives 0.014 0.608 0.182 0.006any health social worker 0.396 0.152 -0.050 0.939# services offered 0.211 0.000 0.155 0.011any IEC materials 1.329 0.000 0.681 0.311provides community outreach 0.893 0.000 2.852 0.000has electricity 11.938 0.000 10.071 0.007has piped water 31.997 0.000 * *has telephone 2.291 0.000 2.311 0.000has private rooms 4.131 0.000 * *participate -54.833 0.000 4.032 0.142distance*edu 0.070 0.000 -0.028 0.392private*edu 0.184 0.000 0.255 0.000low volume*edu 0.044 0.067 0.013 0.830pharmacy*edu * * 0.046 0.786age*edu 0.000 0.354 0.000 0.767open 7 days a week*edu -0.058 0.066 -0.025 0.573hours a day*edu 0.005 0.009 -0.046 0.230any stockouts last month*edu * * -0.183 0.125# FP methods available*edu * * 0.023 0.109any FP protocol*edu * * -0.074 0.240# doctors*edu 0.002 0.196 0.003 0.537# nurses*edu -0.001 0.520 0.009 0.150# midwives*edu 0.003 0.385 -0.002 0.453any health social worker*edu 0.030 0.370 0.082 0.110# services offered*edu -0.012 0.015 -0.011 0.194any IEC materials*edu -0.017 0.559 -0.050 0.413provides community outreach*edu -0.035 0.194 -0.064 0.468has electricity*edu 0.276 0.063 -0.142 0.517has piped water*edu -0.349 0.494 * *has telephone*edu 0.067 0.055 -0.025 0.694has private rooms*edu 0.001 0.986 * *participate*edu 0.160 0.779 0.096 0.705Number of IndividualsNumber of ObservationsLLF*Notes: The education interaction is coded as a continuous variable 0-21, which reflects the total years of education completed.
-5,445.68 -27,922.96
Table 6: Mixed Logit Models with InteractionsMaternal Health Family Planning
1,830 1,073422,730 819,772

37
(3) Mean of Distance Coef.
(4) 25th Percentile of Distance Coef.
(5) 75th Percentile of Distance Coef.
Maternal Health open 7 days a week 2.62 0.29 0.70 1.09 0.51 # services offered 0.36 0.07 0.13 0.20 0.10 any IEC materials 1.18 0.82 1.17 1.84 0.86 has electricity 6.89 0.45 4.19 6.57 3.07 has telephone 2.93 0.42 2.09 3.27 1.53Family Planning # FP methods available 0.38 0.07 0.19 0.31 0.14 any FP protocol 0.74 0.19 0.40 0.65 0.29 any IEC materials 0.53 0.71 0.38 0.62 0.28 has electricity 1.06 0.57 5.57 9.06 4.05 has telephone 0.41 0.36 1.31 2.13 0.95
(1) Conditional Logit
(2) Measurement Error
Mixed LogitTable 7: Willingness to Travel for One Additional Unit of Quality
*Notes: Table elements were formed by dividing the corresponding quality parameter by the distance parameter from the specified model. Table elements are interpreted as the additional distance that the average individual is willing to travel for a one unit increase in quality; thus, the top left entry suggests that, according to the CL model, the average individual is willing to travel an additional 2.62 kilometers to visit a facility that is open 7 days a week, compared to a facility that is not open 7 days a week. The last 3 columns evaluate this trade-off for individuals at different points in the distance preference distribution; thus, the denominator of the ratio is taken from the mean, 25th percentile, and 75th percentile of the distribution.
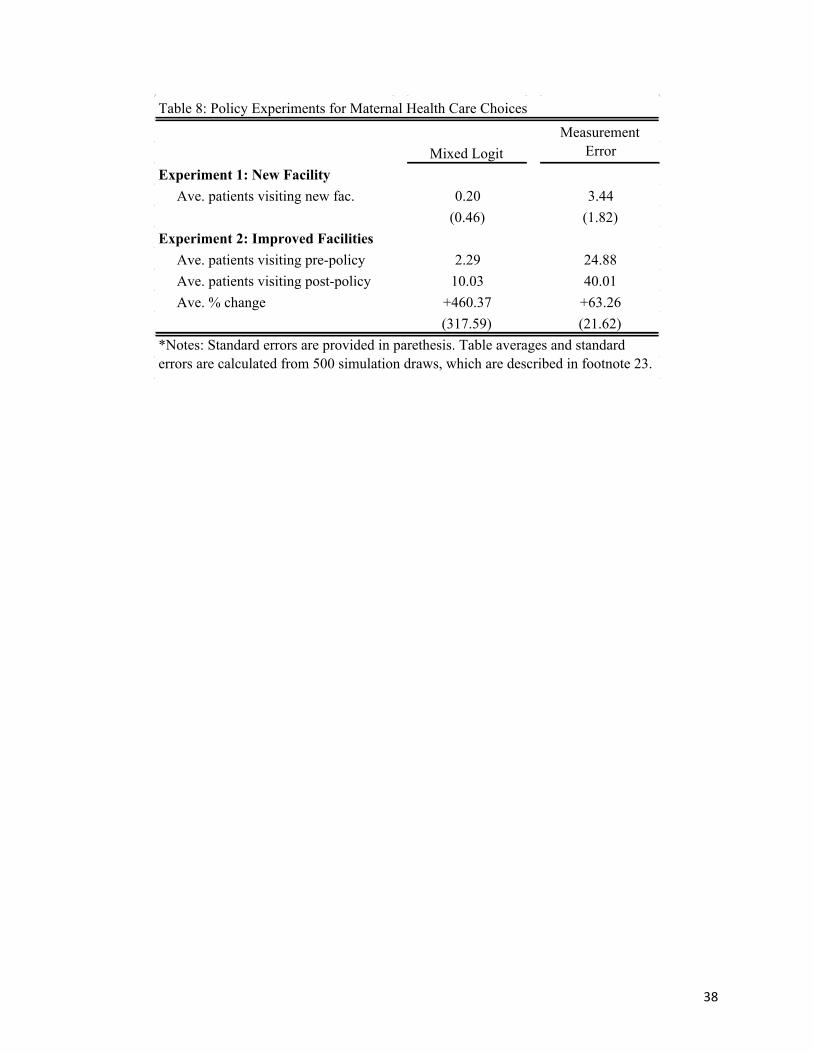
38
Experiment 1: New Facility Ave. patients visiting new fac. 0.20 3.44
(0.46) (1.82)Experiment 2: Improved Facilities Ave. patients visiting pre-policy 2.29 24.88 Ave. patients visiting post-policy 10.03 40.01 Ave. % change +460.37 +63.26
(317.59) (21.62)
Table 8: Policy Experiments for Maternal Health Care Choices
Mixed LogitMeasurement
Error
*Notes: Standard errors are provided in parethesis. Table averages and standard errors are calculated from 500 simulation draws, which are described in footnote 23.