Embed Size (px)
Citation preview

The Indonesian banking industry: unfolding the opportunityMarch 2017

Indonesian banking industryUnfolding the opportunity
Contents
Executive summary
Banking performance• Recent updates• Industry growth• Penetration• Loan distribution by industry• Comparison with Southeast Asian
(SEA) banking industry• Key players
Regulation• Limitation on banking ownership• Single Presence Policy (SPP)• Permitted activities and networking
Banking M&A transactions in Indonesia• Mergers, share acquisition and
capital market transactions
Opportunities to invest in Indonesian banks• Smaller banks with potential M&A
needs• Banks with core capital less than
IDR1 trillion
1 22
2 24
16ii The Indonesian banking industry: unfolding the opportunity

Executive summary
The Indonesian banking industry experienced a challenging period in 2015 and 2016. This was primarily due to a downturn in the macroeconomic conditions (including lower commodity and oil and gas prices). These factors resulted in an overall increase in nonperforming loan (NPL) rates and restructured loans across multiple sectors in banks’ portfolios. Despite these challenges, the banking sector grew in 2016, although Indonesian banks have been more cautious in disbursing new loans; therefore overall loan growth in 2016 slowed down in comparison with previous years.
The Jokowi Administration initiated 13 new stimulus packages between 2015 and March 2017 to stimulate economic growth and stabilize the banking sector. In addition to these stimulus, a tax amnesty program has also been initiated recently. The key objectives of the tax amnesty program are to increase tax income, improve taxpayers’ compliance rate and pull more offshore assets back into Indonesia. There are three phases in the program. The tax authorities managed to collect IDR107 trillion in penalty payments by the end of the second phase in December 2016.
Bank Indonesia (BI) has played an important role in supporting economic growth by reducing its rate gradually from 7.5% to 6.5% year on year (YOY) in June 2016. BI has also changed its benchmark rate to the BI seven-day repo rate to reduce disparity between the BI rate and the interbank rate. Loan and deposit rates have decreased since then; however, the overall net interest margin (NIM) of commercial banks has remained stable. BUKU1 3 and BUKU 4 banks (i.e., those with capital of more than US$385 million) have benefited from the decrease in the BI rate, as they have been able to gain more loans and third-party deposit market share, whereas the decreasing market share of BUKU 1 and BUKU 2 banks has created a need for consolidation.
A number of M&A transactions were successfully closed in 2016, as the challenging environment led to lower business valuations that brought more opportunities to investors. The acquisition of Bank Windu Kentjana International by China Construction Bank Corporation, and the merger of Bank Metro Express and Centratama National Bank to become Shinhan Bank Indonesia, were two of the transactions that were closed in the last two years. In addition to these deals, Cathay Financial Holding Co Ltd acquired a 15% stake of Mayapada Bank, with a total value of IDR1.7 trillion (see page 23 for further details).
1 There are four categories in the Indonesian banking sector (BUKU) based on the size of their core capital (see page 20).
2015 and 2016 were challenging years. In 2017, banks in Indonesia anticipate improvements intheirfinancialperformance, and consider M&A strategies and digital innovation to findnewwaystogrowprofitablyinresponsetomarket pressures and external threats.
1The Indonesian banking industry: unfolding the opportunity

Banking performance
2 The Indonesian banking industry: unfolding the opportunity

Recent updates
The banking sector has been adversely affected by global economic conditions and coal prices falling from US$95 per ton in 2012 to US$62 per ton in 2016. This is reflected in the slow growth of loan portfolios and increasing rate of NPLs. BI and the Government have implemented stimulus actions aimed at maintaining continued growth and stability in the sector.
BI has revisited some of its monetary policies by cutting the benchmark rate by 100 basis points (bps) to 6.5% in June 2016. New regulations have also been issued to support the economy. For example, 13 stimulus packages and revision to trade policies.
The Indonesian economy is forecast to improve due to the acceleration of government spending, with the realization of IDR26.5 trillion out of a total budget of IDR38.2 trillion during 3Q2016. There were signs of improvement in 1H2016. For example, national car and cement sales increased by approximately 5% and 2% respectively.
The overall banks’ loan portfolio grew at 3% YOY in 2016. The top three sectors that contributed to this growth were the construction, utilities and financial intermediaries sectors. These sectors have increased by IDR41.8 trillion, IDR36 trillion and IDR29.3 trillion respectively YOY in 2016. But there were some that recorded negative growth in the same period, such as mining and quarrying that shrank by IDR8.9 trillion.
In large banks, by assets, 6 out of 10 successfully managed to increase their total assets in 2016 compared with 2015. However, Bank Danamon, Bank Permata, Bank Maybank Indonesia and CIMB Niaga total assets decreased by 20%, 10%, 2% and 1% respectively, due to loan repayment, NPL portfolio sales and slow loan growth following the economic downturn in 2015 and 2016.
BI remains confident that loan growth by the end of 2017 could reach above 10%.
3The Indonesian banking industry: unfolding the opportunity

Industry growth
Between 2011 and 2016, the banking industry enjoyed asset growth at a compound annual growth rate (CAGR) of 13%. The key drivers of this growth are the underpenetrated banking market, large consumer base and rising middle-class population. We believe these economic fundamentals will drive continued growth.
Figure 1. Asset performance - commercial banking
3,653 4,263 4,954 5,615 6,133 6,730
3.0% 3.1% 3.1%2.9%
2.3% 2.2%
0.5%
0.0%
1.0%
2.0%
1.5%
2.5%
3.0%8,000
7,000
6,000
5,000
4,000
3,000
2,000
1,000
02011 2012 2013 2014
Total assets, IDRt2015 2016
Return on assets (ROA), %
Source: OJK.
Source: OJK.
Figure 2. NIM and NPL - commercial banking
2.2% 1.9% 1.9% 2.2% 2.5%2.9%
5.9%5.5%
4.9%4.2%
5.4% 5.6%7.0%
6.0%
5.0%
4.0%
3.0%
2.0%
1.0%
0.0%2011 2012 2013
NPL
2014
NIM
2015 2016
4 The Indonesian banking industry: unfolding the opportunity

Since February 2016, OJK has mandated the Indonesian banks to lower their lending rates to single digit rates; however, no deadline has been set against this initiative yet. On the assumption that the funding costs remain the same, the impact of this initiative has not been reflected in the reported NIM in 2016. Provided that BUKU 3 and BUKU 4 have established better infrastructure and networks, these banks are likely to increase their market shares in 2017, compared with BUKU 1 and BUKU 2 banks.
The outlook in 2017 is predicted to be positive due to higher loan growth, recovery of commodity prices and better economic conditions.
Figure 3. BI Rate
Source: BI.
8.00%7.00%6.00%5.00%4.00%3.00%2.00%1.00%0.00%
Sep
14
Nov
14
Jan
15
Mar
15
May
15
Jul1
5 Se
p15
N
ov15
Ja
n16
M
ar16
M
ay16
Ju
l16
Sep
16
Nov
16
BI repo rate
Figure 4. Loan market share for BUKU 3 and BUKU 4
Source: OJK.
86.0%
84.0%
82.0%
80.0%
78.0%
76.0%
74.0%
Figure 5. Deposit market share for BUKU 3 and BUKU 4
88.0%
86.0%
84.0%
82.0%
80.0%
78.0%
76.0%
Dec
14
Mar
15
Jun
15
Sep
15
Dec
15
Mar
16
Jun
16
Sep
16
Dec
16
Source: OJK.
Dec
14
Mar
15
Jun
15
Sep
15
Dec
15
Mar
16
Jun
16
Sep
16
Dec
16
5The Indonesian banking industry: unfolding the opportunity

Industry growth
BI has projected the banking industry’s deposit and loan growth in 2017 to be 11% and 12% respectively. The liquidity position expressed as a loan-to-deposit ratio in the banking sector decreased to 90.7% in 2016 compared with 92.11% in 2015. We expect that there will be sustainable growth going forward, although the expected growth rate is forecast to be lower compared with previous years.
In August 2016, BI changed its benchmark from the BI rate to the seven-day repo rate to reduce disparity between the BI rate and interbank rate, as the transactions between the central bank and other banks take place on a daily basis. OJK also believe that loan growth will be 13.2% in 2017. We believe the stimulus packages, tax amnesty and benchmark rate change will support ongoing growth in view of the macroeconomic environment.
The main objective of the 13 stimulus packages is to stimulate the existing markets as well as easing the business environment. These 13 stimulus packages are designed to:
• Enhance business competitiveness and certainty in the law
• Ease the investment process in Indonesia
• Stimulate investment growth• Provide provisions on provincial
minimum wages• Eliminate double taxation in the real
estate market• Grant additional facilities for special
economic zones• Maximize benefit of tax allowance
facilities to revise Ministry of Finance facilities
• Accelerate the development of electricity infrastructure
• Revise the negative investment list• Protect SMEs’ business• Improve the business environment in
Indonesia, especially in the logistics sector
• Provide clear guidance for business activity
• Improve the attractiveness of building low-income homes
The tax amnesty program consists of three phases, each lasting three months. It ran from 1 July 2016 to 31 March 2017. As of December 2016, the tax office has recorded 612,000 taxpayers with IDR4,293 trillion of total declared assets and IDR140.5 trillion from repatriation. Tax authorities have also realized IDR107 trillion from penalty payments as revenue.
6 The Indonesian banking industry: unfolding the opportunity

Figure 6. Loan1 and third-party deposits growth
Source: OJK.1Loan includes interbank loan.
2,200 2,726 3,320 3,707 4,092 4,200
25% 24%22%
12% 10%
2011 2012 2013
Total loan, IDRt
2014 2015 2016
Loan growth, %
5%
3%
2,785 3,225 3,664 4,114 4,413 4,630
19%
16%14%
12%
7%
2011 2012 2013 2014 2015
Total third-party deposits, IDRt
Third-party deposits growth, %
2016
7The Indonesian banking industry: unfolding the opportunity

(mainland)
Penetration
The fact that, in the Indonesian banking sector, there is currently a low penetration rate and a relatively high NIM rate compared with other APAC countries represents opportunities for investors. The highest penetration is still in Java, as it represents 58% of Indonesia’s GDP and the majority of banks in Indonesia focus their business in Java.
Indonesian topography and limited access to financial providers in certain areas are some of the key determining factors for the low level of penetration relative to the other countries in APAC. Therefore, the OJK is urging Indonesian banks to open more branches in the eastern part of the country by providing additional incentives, as the current level of penetration in this part of Indonesia is very low. The regulation related to branch opening is included under OJK Circular Letter No.14/SEOJK.03/2016.
The introduction of FinTech companies is expected to help the banking sector to overcome the topography limitation in reaching out to the remote areas in Indonesia. “FinTech” refers to a company that uses technology to offer financial services, such as HaloMoney, Doku, Veritrans and Kartuku. These companies have started their operations in Indonesia; however, they have not yet had significant impact on the current low penetration level.
In 2017, innovation is anticipated to play an important role in addressing environmental challenges, resolving geographical barriers and meeting customer expectations.
In 2015, Indonesia’s banking penetration (loan-to-GDP ratio) was still the lowest among APAC countries.
Source: BMI.
Domestic credit provided by financial sector (% of GDP)
376.6
Figure 7. Indonesian banking penetration rate
Source: World Bank; OJK.
211.5 196.9 173.9 173.4 166.5 144.8 121.176.8 59.2
33.6
Japan Hong Kong China Australia Thailand South Korea
Malaysia Singapore India Philippines Indonesia
27.4% 29.6% 33.1% 36.5% 36.8% 33.6%
36.3% 37.5% 39.1% 40.3% 39.2% 36.6%
2010 2011 2012
Loan-to-GDP ratio, %
2013 2014
Third-party deposits-to-GDP ratio, %
2015
8 The Indonesian banking industry: unfolding the opportunity

Commercial banking is defined as a banking business that mostly deals with deposits and loans from corporations or large businesses.
The distribution of branches. Third-party deposits and loans in Indonesia are mainly concentrated in Java and Sumatera.
Source: OJK.
Figure 8. Indonesian commercial banking branch distribution
Sumatera22.1%
Java51.2%
Kalimantan8.3%
Sulawesi8.5%
Bali, East Nusa Tenggara (NTT),West Nusa Tenggara (NTB)
5.6%
Maluku, Papua, others4.3%
Figure 9. Indonesia’s GDP as of 2015 and third-party deposits and loan allocation per island as of December 2016
Source: OJK; BI.
GDP allocation Third-party depositallocation Loan allocation
Sumatera 22% 11% 12%
Java 58% 78% 74%
Bali, NTT and NTB 3% 3% 3%
Kalimantan 8% 4% 4%
Sulawesi 6% 3% 4%
Maluku, Papua and others 2% 2% 2%
9The Indonesian banking industry: unfolding the opportunity

Figures describe the loan distribution and NPL by sector in December 2016 compared with December 2015.
The three largest contributors (by percentage) to the growth of loan distribution are the construction, utilities and financial intermediaries sectors. The overall growth of these sectors is mainly related to government projects and business associated with state-owned enterprises. The construction loans increase is a result of the government initiative to spur growth through
infrastructure spending. The retail and construction sectors are projected to recover gradually, as BI has lowered the level of down payments required for mortgage loans by 5% depending on the first, second and third purchase. The current down payment required after the 5% reduction is 15%, 20% and 25% for the first, second, and third purchase respectively.
Loan distribution by industry
Figure 10. Indonesian bank loan distribution and NPL by sector
Source: OJK.
6.3% 4.6% 4.8% 3.3%
18.7%
2.5% 3.1% 4.3% 4.9%
19.5%19.2%
2.1% 2.1%4.4% 4.1% 4.4%
27.5%27.2%
6.5%2.9%
17.9%
3.9%
Agriculture, hunting and
forestry
Real estate, business
ownership,and business
services
Mining and quarrying
Processing industry
Electricity,gas and water
Construction Wholesale and retail trade
Hospitality and catering
Transportation, warehousing
and communications
Financial intermediaries
Nonindustrial
Loan distribution (%)
December 2015December 2016
10 The Indonesian banking industry: unfolding the opportunity
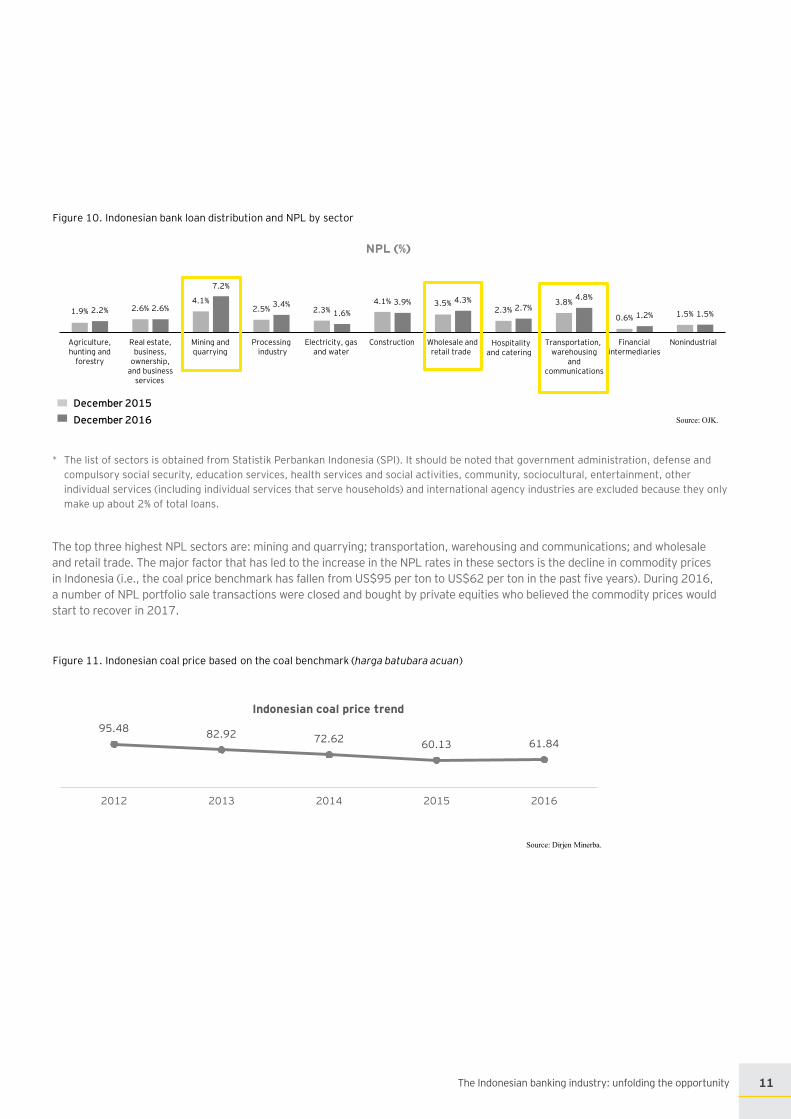
* The list of sectors is obtained from Statistik Perbankan Indonesia (SPI). It should be noted that government administration, defense and compulsory social security, education services, health services and social activities, community, sociocultural, entertainment, other individual services (including individual services that serve households) and international agency industries are excluded because they only make up about 2% of total loans.
The top three highest NPL sectors are: mining and quarrying; transportation, warehousing and communications; and wholesale and retail trade. The major factor that has led to the increase in the NPL rates in these sectors is the decline in commodity prices in Indonesia (i.e., the coal price benchmark has fallen from US$95 per ton to US$62 per ton in the past five years). During 2016, a number of NPL portfolio sale transactions were closed and bought by private equities who believed the commodity prices would start to recover in 2017.
1.9% 2.2% 2.6% 2.6%4.1%
2.5% 2.3%4.1% 3.9% 3.5% 4.3%
2.3%3.8%
0.6% 1.2% 1.5% 1.5%
services
Wholesale and retail trade
Financial Nonindustrialintermediaries
Source: OJK.
December 2015December 2016
Figure 10. Indonesian bank loan distribution and NPL by sector
NPL (%)
7.2%
3.4%1.6%
2.7%4.8%
Agriculture, hunting and
forestry
Real estate, business,
ownership, and business
Mining and quarrying
Processingindustry
Electricity, gas and water
Construction Hospitality and catering
Transportation, warehousing
and communications
95.48 82.92 72.62 60.13 61.84
2012 2013 2014 2015 2016
Indonesian coal price trend
Source: Dirjen Minerba.
Figure 11. Indonesian coal price based on the coal benchmark (harga batubara acuan)
11The Indonesian banking industry: unfolding the opportunity
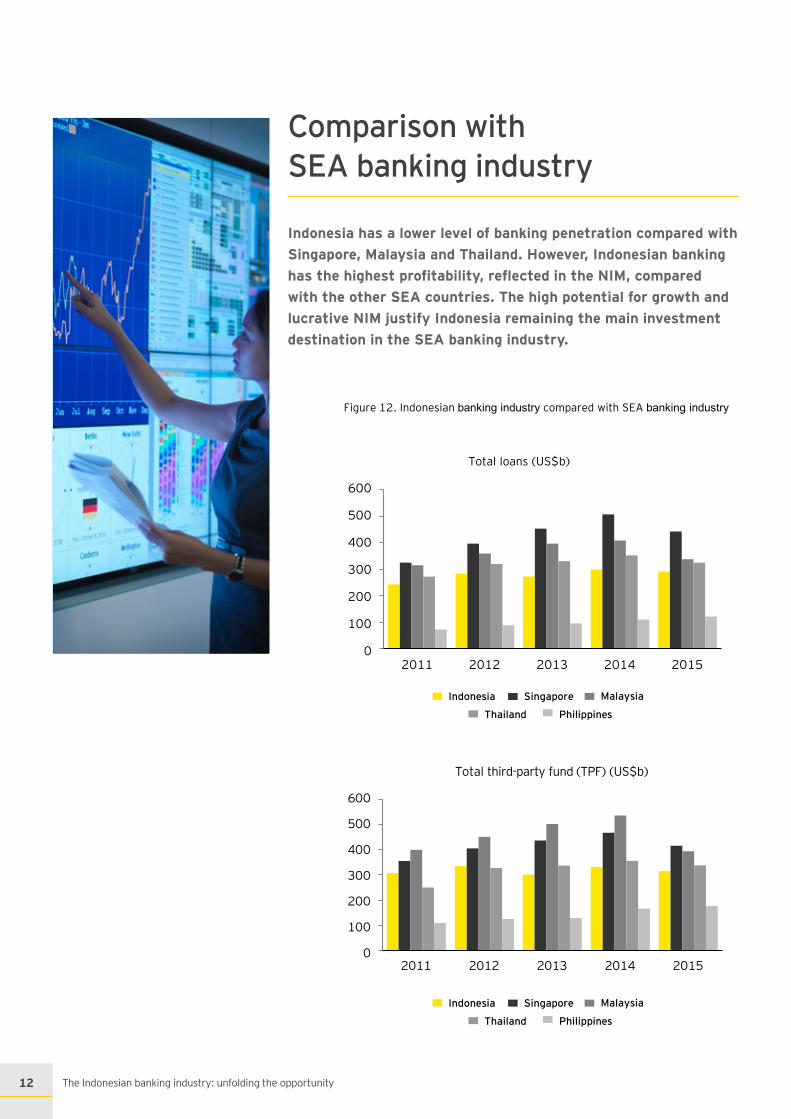
Comparison with SEA banking industry
Indonesia has a lower level of banking penetration compared with Singapore, Malaysia and Thailand. However, Indonesian banking has the highest profitability, reflected in the NIM, compared with the other SEA countries. The high potential for growth and lucrative NIM justify Indonesia remaining the main investment destination in the SEA banking industry.
Figure 12. Indonesian banking industry compared with SEA banking industry
2012 2013 2014 2015
Indonesia Singapore Malaysia
Thailand Philippines
2011
Total loans (US$b)
600
500
400
300
200
100
0
2011 2012 2013 2014 2015
Indonesia Singapore Malaysia
Thailand Philippines
600
500
400
300
200
100
0
Total third-party fund (TPF) (US$b)
12 The Indonesian banking industry: unfolding the opportunity

Indonesia Singapore Malaysia Thailand Philippines
Indonesia Singapore Malaysia Thailand Philippines
Indonesia Singapore Malaysia Thailand Philippines
1,000
800
600
0
200
400
2011 2012 2013 2014 2015
NIM (%)
7.00%6.00%5.00%4.00%3.00%2.00%1.00%0.00%
2011 2012 2013 2014 2015
3.5%
3.0%
2.5%
2.0%
1.5%
1.0%
0.5%
0.0%2011 2012 2013 2014 2015
NPL (%)
Source: BMI; Moody’s research; DBS research and Philippines banking system report.
Total assets (US$b)
13The Indonesian banking industry: unfolding the opportunity

Key players
The Indonesian banking sector is dominated by state-owned banks, with Bank Mandiri as the leading player, followed by Bank Rakyat Indonesia. Both have the largest amount of assets, loans and revenue, and the greatest TPF. The top 10 banks have 67% of total assets in the national banking sector.
Figure 13. Indonesian banking key players as of December 2016 (IDRb)
Source: annual reports.
Assets Loans TPF EquityNet
income
Bank Mandiri 1,038,706 667,619 687,949 144,182 13,806
Bank Rakyat Indonesia 1,003,644 675,647 723,845 145,457 26,195
Bank Central Asia (BCA) 660,144 406,152 527,843 109,068 19,777
Bank Negara Indonesia 603,031 401,874 412,147 83,549 11,338
Bank CIMB Niaga 241,571 182,097 170,031 33,629 2,081
Bank Tabungan Negara 214,168 164,446 147,991 18,969 2,618
Panin Bank 199,175 138,748 136,371 29,831 2,405
Bank Danamon Indonesia 174,086 134,444 101,567 36,221 2,669
Bank Maybank Indonesia 166,678 116,839 108,415 17,729 1,948
Bank Permata 165,527 107,966 118,486 19,021 (6,483)
14 The Indonesian banking industry: unfolding the opportunity

15The Indonesian banking industry: unfolding the opportunity

Regulation
16 The Indonesian banking industry: unfolding the opportunity
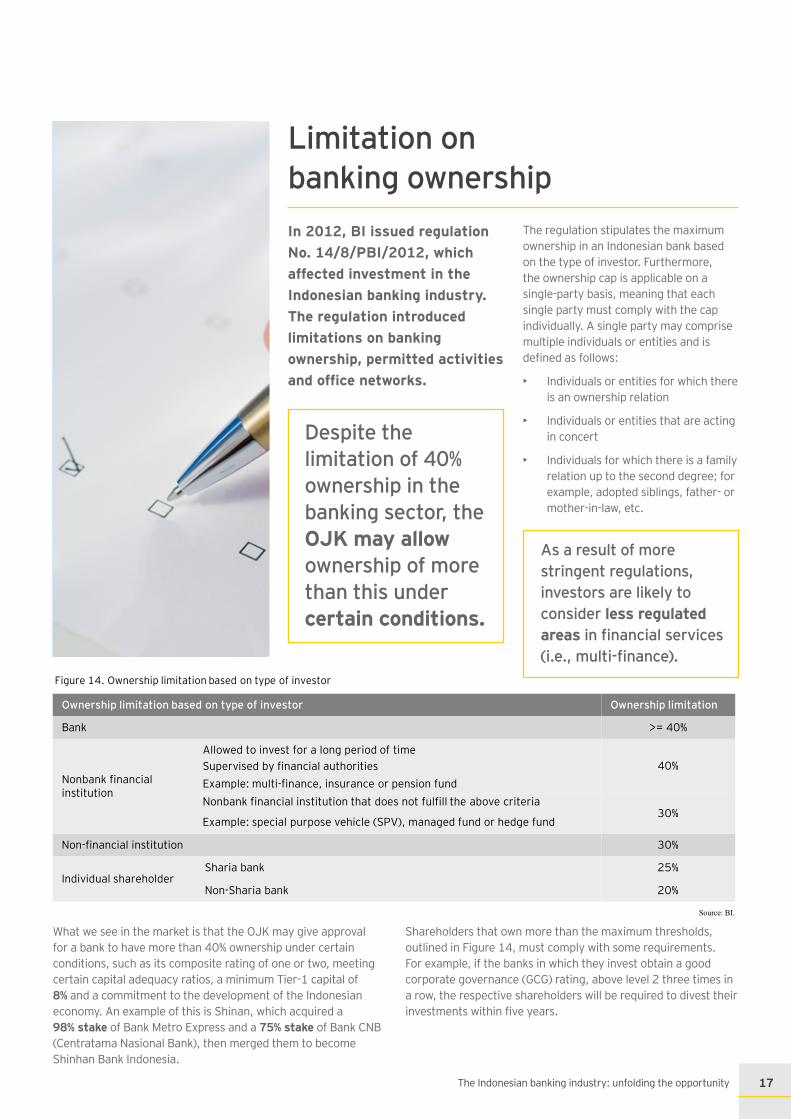
Limitation on banking ownershipIn 2012, BI issued regulation No. 14/8/PBI/2012, which affected investment in the Indonesian banking industry. The regulation introduced limitations on banking ownership, permitted activities and office networks.
The regulation stipulates the maximum ownership in an Indonesian bank based on the type of investor. Furthermore, the ownership cap is applicable on a single-party basis, meaning that each single party must comply with the cap individually. A single party may comprise multiple individuals or entities and is defined as follows:
• Individuals or entities for which there is an ownership relation
• Individuals or entities that are acting in concert
• Individuals for which there is a family relation up to the second degree; for example, adopted siblings, father- or mother-in-law, etc.
What we see in the market is that the OJK may give approval for a bank to have more than 40% ownership under certain conditions, such as its composite rating of one or two, meeting certain capital adequacy ratios, a minimum Tier-1 capital of 8% and a commitment to the development of the Indonesian economy. An example of this is Shinan, which acquired a 98% stake of Bank Metro Express and a 75% stake of Bank CNB (Centratama Nasional Bank), then merged them to become Shinhan Bank Indonesia.
Shareholders that own more than the maximum thresholds, outlined in Figure 14, must comply with some requirements. For example, if the banks in which they invest obtain a good corporate governance (GCG) rating, above level 2 three times in a row, the respective shareholders will be required to divest their investments within five years.
Despite the limitation of 40% ownership in the banking sector, the OJK may allow ownership of more than this under certain conditions.
As a result of more stringent regulations, investors are likely to consider less regulated areasinfinancialservices(i.e.,multi-finance).
Figure 14. Ownership limitation based on type of investor
Source: BI.
Ownership limitation based on type of investor Ownership limitation
Bank >= 40%
Nonbank financial institution
Allowed to invest for a long period of timeSupervised by financial authoritiesExample: multi-finance, insurance or pension fundNonbank financial institution that does not fulfill the above criteria
Example: special purpose vehicle (SPV), managed fund or hedge fund
40%
30%
Non-financial institution 30%
Individual shareholderSharia bank
Non-Sharia bank
25%
20%
17The Indonesian banking industry: unfolding the opportunity

Single Presence Policy (SPP)
In December 2012, BI published BI Regulation No.14/24/PBI/2012 (2012), which amended certain aspects of BI Regulation No.8/16/PBI/2006 (2006) and combined the existing BI Regulation No. 8/17/PBI/2006 on incentives for banking consolidation. The 2006 regulation is, therefore, no longer in place.
The key principles in the 2012 regulation are as follows:
A. Single presence
Each party can only be the controlling shareholder of one bank. A controlling shareholder is defined as either or both a legal entity, an individual or a group of businesses that:
• Owns 25% or more of the total issued voting shares in a bank
• Owns less than 25% of the total issued voting shares in a bank, but is proven to have control of the bank, whether directly or indirectly
B. Exemptions
This requirement does not apply to:
• The controlling shareholder of two banks, where one of the banks is a conventional bank and the other bank is a Sharia bank
• The controlling shareholder of two banks, where one of the banks is a joint venture bank
C. Merger, bank holding company or holding function
A party that already controls more than one bank, or that acquires a bank that will result in that party controlling more than one bank, must comply with the SPP by following one of these conditions:
• Undertake a merger or consolidation of the banks controlled by that party
• Form a bank holding company (for this purpose, a bank holding company is defined as a legal entity incorporated in Indonesia that is formed, owned or both by the controlling shareholder for the purpose of consolidating and directly controlling all the activities of the banks that are its subsidiaries)
• Form a holding function (for this purpose, a holding function is defined as the function of a controlling shareholder, where the controlling shareholder is an Indonesian bank or the Government of Indonesia, and is consolidating and directly controlling all the activities of the bank that are its subsidiaries)
Under the 2006 regulation, the option of forming a bank holding company only applies to a party that already controls more than one bank on the effective date of the 2006 regulation. The 2012 regulation has widened the scope of the bank holding company exemption to cover the new acquisition of a bank that results in a party controlling more than one bank.
18 The Indonesian banking industry: unfolding the opportunity

D. Merger incentives
To encourage banking sector consolidation, BI is offering certain incentives for bank mergers. A bank that undertakes a merger or consolidation will be provided with various incentives in the form of:
• Greater flexibility on the minimum statutory reserve (Giro Wajib Minimum) requirements
• Time extension for the legal lending limit (LLL) requirements
• Ease of opening branches
• Flexibility on the application of GCG principles
E. Bank holding company
• The bank holding company must be in the form of a limited liability company (LLC) incorporated in Indonesia and must comply with its applicable laws.
• The bank holding company can only carry out the activity of equity participation, which includes providing management services in order to increase the effectiveness of consolidation, business strategy and optimizing the finances of the group that is being controlled.
• The bank holding company must operate at a level above its subsidiaries.
• The bank holding company can exist alone as a legal entity or be a financial holding company that consolidates the financial institutions owned by the controlling shareholder.
19The Indonesian banking industry: unfolding the opportunity
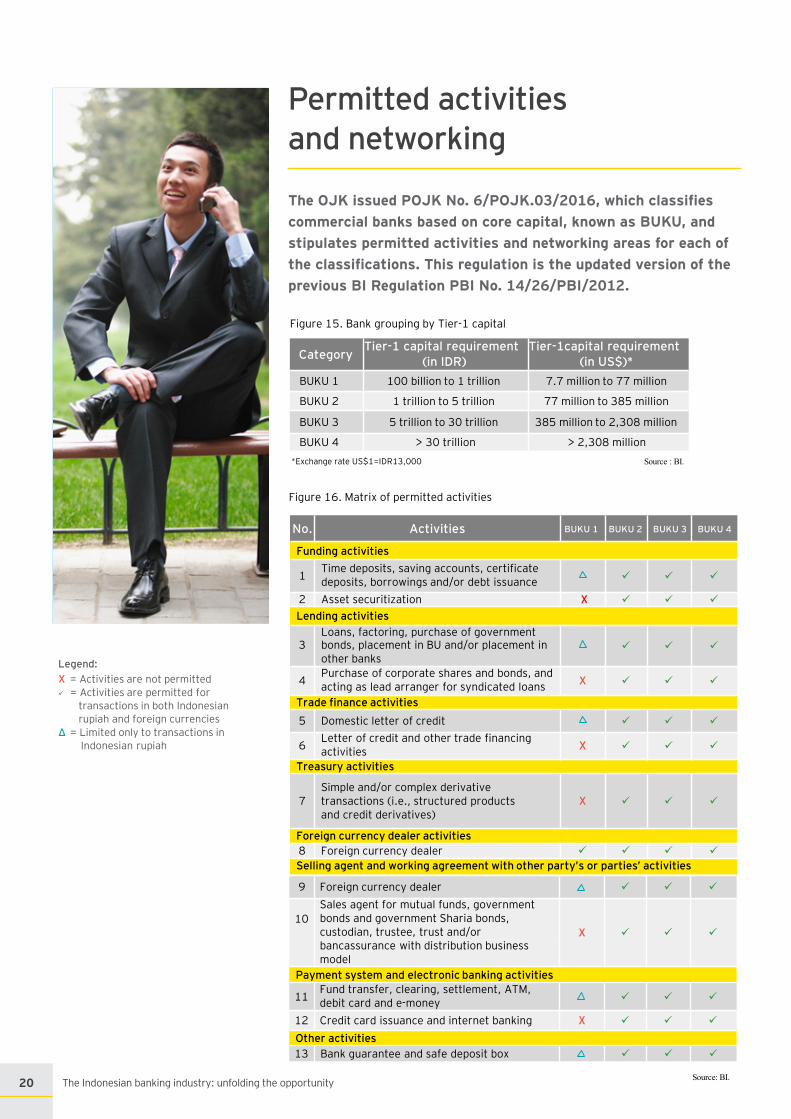
Permitted activities and networking
The OJK issued POJK No. 6/POJK.03/2016, which classifies commercial banks based on core capital, known as BUKU, and stipulates permitted activities and networking areas for each of the classifications. This regulation is the updated version of the previous BI Regulation PBI No. 14/26/PBI/2012.
Legend:X = Activities are not permitted = Activities are permitted for
transactions in both Indonesian rupiah and foreign currencies
Δ = Limited only to transactions inIndonesian rupiah
Figure 15. Bank grouping by Tier-1 capital
Source : BI.*Exchange rate US$1=IDR13,000
CategoryTier-1 capital requirement
(in IDR)Tier-1capital requirement
(in US$)*BUKU 1 100 billion to 1 trillion 7.7 million to 77 million
BUKU 2 1 trillion to 5 trillion 77 million to 385 million
BUKU 3 5 trillion to 30 trillion 385 million to 2,308 million
BUKU 4 > 30 trillion > 2,308 million
BUKU 1 BUKU 2 BUKU 3 BUKU 4
1Time deposits, saving accounts, certificate deposits, borrowings and/or debt issuance
2 Asset securitization X
Lending activitiesLoans, factoring, purchase of government
3 bonds, placement in BU and/or placement in other banks
4Purchase of corporate shares and bonds, and acting as lead arranger for syndicated loans X
Trade finance activities5 Domestic letter of credit
6Letter of credit and other trade financingactivities X
Treasury activities
7Simple and/or complex derivative transactions (i.e., structured productsand credit derivatives)
X
Foreign currency dealer activities8 Foreign currency dealer Selling agent and working agreement with other party’s or parties’ activities
Source: BI.
Figure 16. Matrix of permitted activities
No. Activities
Funding activities
9 Foreign currency dealer
10Sales agent for mutual funds, government bonds and government Sharia bonds, custodian, trustee, trust and/or X bancassurance with distribution business model
Payment system and electronic banking activities
11Fund transfer, clearing, settlement, ATM, debit card and e-money
12 Credit card issuance and internet banking X
Other activities13 Bank guarantee and safe deposit box
20 The Indonesian banking industry: unfolding the opportunity

Figure 17. Matrix of permitted maximum equity participation in financial institutions
Legend:X = Not permitted = Permitted
Source: BI.
Figure 18. Permitted location for office network expansion
Source: BI.Legend:X = Not permitted = Permitted
Figure 19. Minimum loan to productive sector requirement
Source: BI.
No. Activities BUKU 1
BUKU 2
BUKU 3
BUKU 4
Maximum equity participation in financial institutions
1 As a percentage of total capital (core and supplementary capital) – 15% 25% 35%
Locations for equity participation in financial institutions
2 Located within Indonesia
3 Located within Asia X X
4 Located worldwide X X X
No. Activities BUKU 1
BUKU 2
BUKU 3
BUKU 4
Location for office network expansion
1 Expansion within Indonesia
2 Expansion within Asia X X
3 Expansion worldwide X X X
No. Activities BUKU 1
BUKU 2
BUKU 3
BUKU 4
Minimum loan to productive sector
1 Minimum loan amount (as a percentage of total loan) 55% 60% 65% 70%
21The Indonesian banking industry: unfolding the opportunity

Banking M&A transactions in Indonesia
22 The Indonesian banking industry: unfolding the opportunity

Mergers, share acquisition and capital market transactionsThere have been successful M&A transactions in the banking market over the last few years. The relatively high NIM and incentives provided by the regulators have encouraged investors to enter into the banking sector in Indonesia. One of the key drivers of M&A opportunities is the OJK’s plan to reduce the number of banks in Indonesia.
Figure 20. Recent banking transactions in Indonesia
Source: BI; BMI and Mergermarket.
No. Year Bank Acquirer Stake
1 2016 Bank Windu Kentjana International
China Construction BankCorporation >40%
2 2016 Bank Pundi Indonesia Banten Province Government >50%
3 2016 Bank Mayapada Internasional Tbk Cathay Financial Holding Co. Ltd. 15%
4 2016 Bank Antardaerah Bank Windu Kentjana International 100%
5 2016 Bank Andara APRO Financial Co. Ltd. 40%
6 2015 Bank CNB (Centratama Nasional Bank) Shinhan Bank 75%
7 2015 Bank Bukopin Bosowa Corporindo 30%
8 2015 Bank Metro Express Shinhan Bank 98%
9 2015 Bank Tabungan Pensiunan Nasional (BTPN) Sumitomo Mitsui Financial Group 17.5%
10 2013 Bank Tabungan Pensiunan Nasional (BTPN)
Sumitomo MitsuiBanking Corporation 40%
11 2014 Bank Mutiara J Trust 100%
12 2014 Bank Index Selindo Creador Capital 20%
13 2013 Bank Himpunan Saudara Woori Bank 33%
14 2011 Bank Kesawan Qatar National Bank 69.6%
15 2010 Bank Dipo Internasional Sampoerna Strategic 85%
16 2009 Bank Akita Barclays 99%
17 2009 Bank Utama International Bank (UIB) BCA 100%
18 2008 Bank Ekonomi Raharja HSBC N/A
19 2007 Bank Halim Indonesia Industrial and Commercial Bankof China (ICBC) 90%
20 2007 Bank Sri Partha Mercy Corps IFC, Hivos -Triodos Fund, and CORDAID 68%
21 2007 Bank Swadesi State Bank of India 76%
22 2007 Bank Finconesia Commerzbank 51%
23 2007 Bank NusantaraParahyangan Acom Co. Ltd. and BoTM - UFJ 66.2%
24 2006 Bank Haga & Hagakita Rabobank N/A
25 2002 Bank Niaga Commerce Berhad Malaysia N/A
23The Indonesian banking industry: unfolding the opportunity
Opportunities to invest in Indonesian banks
24 The Indonesian banking industry: unfolding the opportunity

Smaller banks with potential M&A needs
Pursuant to the central 2012 regulation, banks in Indonesia are grouped into four categories, determined by the level of core capital they own. Currently, there are 118 banks in Indonesia. There are no changes in the number of banks in Indonesia compared with the previous year. These banks are grouped into the following categories:
According to Indonesian Banking Architecture, BI and the OJK plan to create a stronger and more efficient banking system, and consolidate the sector through M&A transactions. The plan aims to consolidate the industry and lower the current number of banks to 59 to 60 banks in the next 10 years. It is expected that the industry will be more competitive in the local and regional markets, as the top 15 banks currently account for approximately 70% of the market.
The OJK has encouraged the BUKU 1 banks to increase their current level of capital, either through capital injection or M&A.
As evidenced by the involvement of financial institutions from Japan, Korea and China in the recent acquisitions of local banks, consolidation in the Indonesian banking sector presents opportunities for foreign investors. International investors currently have the opportunity to buy and participate in the consolidation process by obtaining stakes in local banks, with the ultimate goal of preparing it to merge with another bank.
Figure 21. Number of banks by category as at September 2016
Source: Biro Riset InfoBank.
Category Number of banks
BUKU 1 32
BUKU 2 53
BUKU 3 18
BUKU 4 5
Foreign banks 10
Total 118
25The Indonesian banking industry: unfolding the opportunity

Banks with core capital less than IDR1 trillion
In order to grow and become strong players in the business, banks in the BUKU 1 category have two choices: increasing retained earnings (organic growth) or acquiring and merging with other banks to expand their existing businesses. Recently, BUKU 1 banks, such as Bank Ina Perdana and Bank Mandiri Taspen Pos (Bank MANTAP), have considered rights issues as a way of growing inorganically.
Figure 22. List of BUKU 1 banks with the potential for M&A transactions as of September 2016
Source: Infobank.
No NameTotal
assets, IDRb
Loans, IDRb
Third-party
deposits, IDRb
CAR, % NPL, % LDR, %
Assets greater than IDR5t
1 Bank Maspion 5,444 4,032 4,372 20.25 0.80 92.24
Assets between IDR2.5t and IDR5t
2 Bank Agris 3,831 2,583 3,208 20.28 2.82 80.52
3 Bank Yudha Bhakti 3,767 2,987 3,108 23.25 3.29 96.11
4 Bank KesejahteraanEkonomi 2,809 2,139 2,302 15.49 2.22 92.92
Assets less than IDR2.5t
5 Bank Prima 2,353 1,713 1,819 16.79 3.07 94.17
6 Bank INA Perdana 2,371 1,434 1,853 30.74 3.49 77.39
7 Bank Mitraniaga 2,103 995 1,846 18.23 2.02 54.10
8 Bank Dinar Indonesia 2,073 1,240 1,505 27.85 1.89 82.40
9 Bank HardaInternasional 1,922 1,395 1,448 21.70 3.04 96.34
10 Bank MaybankSyariah Indonesia 1,418 1,073 675 46.07 30.30 158.96
11 Bank Victoria Syariah 1,248 935 955 14.20 11.61 97.79
12 Bank FAMAInternational 1,116 853 844 26.03 3.67 101.07
13 Royal Bank 759 551 552 30.80 3.51 99.8
14 Bank Artos Indonesia 730 465 546 23.40 5.91 85.16
15 Bank Bisnis 716 399 360 56.75 3.00 110.83
16 Bank Amar Indonesia 568 366 77 118.64 8.31 475.32
26 The Indonesian banking industry: unfolding the opportunity

27The Indonesian banking industry: unfolding the opportunity

Appendices
28 The Indonesian banking industry: unfolding the opportunity

Contactsin regions
Contactsin Indonesia
David RimboManaging Partner
Transaction Advisory Services
EY Indonesia
Tel: +62 21 5289 [email protected]
Sahala SitumorangPartner
Transaction Advisory Services
EY Indonesia
Tel: +62 21 5289 [email protected]
Teh Seng Leong Partner
Transaction Advisory Services
EY Indonesia
Tel: +62 62 21 5289 [email protected]
Oki StefanusDirector
Transaction Advisory Services
EY Indonesia
Tel: +62 21 5289 [email protected]
Stuart LastPartner
Transaction Advisory Services
EY Singapore
Tel: +65 6309 [email protected]
Reuben TirtawidjajaAssociate Director
Transaction Advisory Services
EY Indonesia
Tel: +62 21 5289 [email protected]
Yoga PrawitaAssociate Director
Transaction Advisory Services
EY Indonesia
Tel: +62 21 5298 [email protected]
Charlie AlexanderManaging Partner
Transaction Advisory Services
EY Hong Kong
Tel: +852 9666 [email protected]
Michael McGauranPartner
Transaction Advisory Services
EY Singapore
Tel: +65 6309 [email protected]
Patrick HannaPartner
Transaction Advisory Services
EY Singapore
Tel: +65 6309 [email protected]
29The Indonesian banking industry: unfolding the opportunity

EY | Assurance | Tax | Transactions | Advisory
About EY
EY is a global leader in assurance, tax, transaction and advisory services. The insights and quality services we deliver help build trust and confidence in the capital markets and in economies the world over. We develop outstanding leaders who team to deliver on our promises to all of our stakeholders. In so doing, we play a critical role in building a better working world for our people, for our clients and for our communities.
EY refers to the global organization, and may refer to one or more, of the member firms of Ernst & Young Global Limited, each of which is a separate legal entity. Ernst & Young Global Limited, a UK company limited by guarantee, does not provide services to clients. For more information about our organization, please visit ey.com.
© 2017 EYGM Limited.All Rights Reserved.
EYG no. 03244-174Gbl
ED None
In line with EY’s commitment to minimize its impact on the environment, this document has been printed on paper with a high recycled content. This material has been prepared for general informational purposes only and is not intended to be relied upon as accounting, tax or other professional advice. Please refer to your advisors for specific advice.
ey.com/id