Embed Size (px)
Citation preview
RESEARCH Open Access
The inequality of health-income effect inemployed workers in China: a longitudinalstudy from China Family Panel StudiesMengxue Xie, Zhiyong Huang and Wenbin Zang*
Abstract
Background: The relationship between health and income is an essential part of human capital research. Themajority of current analyses using classical regression models show that health has a significant impact on incomeafter controlling for the endogeneity of health due to the measurement error and reverse causality. Currently, theChinese government implements various policies including health related policies to fiercely fight for the domesticpoverty issues, and thus only estimating the average effect of health on income could underestimate the impactfor low income population and will make policy makers neglect or not pay enough attention to the significant roleof health in poverty alleviation. To study the effect of health on income for workers at different income quantiles,we apply the quantile regression method to a panel data from a Chinese household survey. Furthermore, we testthe heterogeneity of this health-income effect for different subgroups of workers characterized by sex, registeredresidence, and residential area. Lastly, we provide an explanation on the possible mechanism of the health-incomeeffect.
Methods: This study uses data from four waves of the China Family Panel Studies (CPFS)- a biennial longitudinalstudy spanning from 2012 to 2018. The final data used in the regression analysis includes a balanced sample of 19,540 person-year observations aged between 18 to 70 years, with complete information of demographic and socialeconomic status characteristics, job information, and health status of individuals. We use lagged self-reported healthto control the potential endogeneity problem caused by reverse causality between health and income. Ouridentification on heterogenous treatment effects relies on panel quantile regressions, which generate moreinformation than the commonly used mean regression method, and hopefully could reveal the effects of health onincome for workers with income distributed at a wide range of quantiles. In addition, we compare the resultsderived from panel quantile regressions and mean regressions. Finally, we added interaction terms between healthand other independent variables to recover the influence channel of health on income.
Results: The regression estimates show that the effects of health on income are more pronounced for workersdistributed on the lower ends of income spectrum, and the health-income effect decreases monotonically with theincrease of income. The treatment effect is robust to alternative measures of health and seems to be morepronounced for females than males, for rural workers than their urban counterparts. Finally, we find that health notonly directly affects worker’s income but also has different effects on income for different occupation cohorts.
(Continued on next page)
© The Author(s). 2020 Open Access This article is licensed under a Creative Commons Attribution 4.0 International License,which permits use, sharing, adaptation, distribution and reproduction in any medium or format, as long as you giveappropriate credit to the original author(s) and the source, provide a link to the Creative Commons licence, and indicate ifchanges were made. The images or other third party material in this article are included in the article's Creative Commonslicence, unless indicated otherwise in a credit line to the material. If material is not included in the article's Creative Commonslicence and your intended use is not permitted by statutory regulation or exceeds the permitted use, you will need to obtainpermission directly from the copyright holder. To view a copy of this licence, visit http://creativecommons.org/licenses/by/4.0/.The Creative Commons Public Domain Dedication waiver (http://creativecommons.org/publicdomain/zero/1.0/) applies to thedata made available in this article, unless otherwise stated in a credit line to the data.
* Correspondence: [email protected] of Public Administration, Southwestern University of Finance andEconomics, 555 Liutai Avenue, Chengdu 611130, Sichuan, China
Xie et al. International Journal for Equity in Health (2020) 19:96 https://doi.org/10.1186/s12939-020-01211-6
(Continued from previous page)
Conclusions: This study provides a different perspective on the impact of individual health status on income,uncovering the heterogeneous effects of health deterioration on income reduction for workers with differentincomes by using panel data and rather advanced statistical techniques- panel quantile regressions. At present, theChinese government is making every effort to solve the problem of poverty and our findings suggest publicpolicies on health and income protections should emphasize different needs of workers with different incomes andspecial attention should be paid to low-income workers who are much more financially fragile to healthdeterioration than other income groups.
Keywords: Health-income effect, Income distribution, Panel quantile regression, Inequality
BackgroundHealth is one of essential components of human capitaland a great deal of current research focus on health-related topics. Studies on the relationship betweenhealth and income have a long history in social scienceand nowadays most researchers agreed that workers withbetter health in general are paid higher, and the im-provement of health status can also effectively improvewages [1–4]. Good health has a significant favourable in-fluence on the income of workers both in developed anddeveloping countries [5–8].However, the early research on the health-income ef-
fect was criticized for the endogeneity caused by theinteraction between health and income [9–11]. Thus,some researchers expand econometric techniques fromOrdinary Least Square (OLS) to instrumental variable,linear fixed/random effect, matching methods and quan-tile regressions to solve the problems ([12–14]]. For in-stance, lagged health indicators from the previous periodwere used as valid proxies of current health status.Due to the heterogeneity of workers’ income, the
impact of health on income for workers at different in-come distribution might not be the same. Some re-searchers apply panel quantile regression to explore thisheterogenous relationship between workers’ health andincome. Kniesner et al. [15] used this method to test therelationship between the statistical value of life and dif-ferent wage levels in the United States, finding thathigher health risk would lead to a significant reductionof income, and this effect is consistent for different sub-samples. Hsieh et al. [16] using the data of family dy-namic panel study (PSFD) in Taiwan and find asignificant positive correlation between workers’ healthstatus and wage rate. The healthier workers are, themore substantial contribution to their wages. Kedir [17]using panel data of Ethiopian households from 1994 to2000 and find that both height and body mass index hada significant positive correlation with wages.There were also abundant research focusing on devel-
oping economies, including Brazil [18], Ghana [19],India [20], Indonesia [21] and South Korea [22]. InChina, the relationship between health and income is
widely explored, suggesting that health human capitalhas a positive and significant effect on the wages ofworkers [23–25]. Health capital is an essential factor af-fecting the income of workers in China; workers withbetter health status have higher income.Researchers using data from China have also made ef-
forts to address endogenous problems of health, byadopting instrument variable method, simultaneousequation, and lagged indices [26–28]. Using lagged self-rated health as basic health indicator, Zhang [29] founda significant positive correlation between health andcurrent labour supply, as well as income for both urbanand rural residents. Qin et al. [30] used the Heckmanmodel to study the impact of health on migrant workers’income, which showed that health significantly affectedthe working probability of working for migrant workers,resulting in significant increase in income.Being the second largest economy in the world, a
labour force of high-quality is indispensable in ensuringthe sustainable development for China. Thereby studieson health in the labour market won its growing interestsamong researchers and policymakers, especially in thecontext of the increasing income gap among workers.What’ s more, the Chinese government implements vari-ous policies including health related policies andpropose the Health Poverty Alleviation project to fiercelyfight for the domestic poverty issues, which makes itmore crucial to study and understand the influence ofhealth on income for low-income workers. This studyaims to address the following questions: (1) What is theimpact of health on different income workers, especiallyon lower- and middle-income workers? (2) What are theadvantages of panel quantile regression compared withclassical regressions? Thus, we use lagged self-reportedhealth to solve the endogeneity problem caused by re-verse causality of health and income, and compare theestimates of the fixed-effect model and panel quantileregression model.Our study is not only limited to the estimation of the
average effect, but also able to reveal the health-incomeinfluence for workers at different income quantiles, espe-cially for those who are distributed at the lower tail of
Xie et al. International Journal for Equity in Health (2020) 19:96 Page 2 of 15
income distribution. The study of the relationship be-tween health and income of workers in different incomecohort groups will help us understand the role of health,and the highlight of the income inequality due to healthwill support the government when issuing targeted pol-icies for low-income workers.
MethodIn this study, we use data from four waves of the ChinaFamily Panel Studies (CPFS)- a biennial longitudinalstudy spanning from 2012 to 2018. Our working sampleincludes 19,540 person-year observations aged between18 to 70 years, with complete information of demo-graphic and social economic status characteristics, jobinformation, and health status of individuals. We uselagged self-reported health to control the potential endo-geneity problem caused by reverse causality betweenhealth and income. Our identification on heterogenoustreatment effects relies on panel quantile regressions,which generate more information than the commonlyused mean regression method, and hopefully could re-veal the effects of health on income for workers with in-come distributed at a wide range of quantiles.
DataThe data are from the China Family Panel Studies(CFPS). The CFPS is a high-quality biennial householdlongitudinal survey, which is collected by the China So-cial Sciences Research Centre (ISSS) at Peking Univer-sity. The survey focuses on the individual economic andnon-economic welfare of Chinese residents, includingindividual’s employment status, educational achieve-ment, health-related behaviours, family relationships,migration status and etc. Considering the great regionaldifferences in Chinese society, CFPS adopts theproportional probability sampling (PPS) with implicitstratification, multi-stage, multi-level and populationproportionality. The cross-sectional response rates ofsurveys in 2012 and 2014 were 74.1 and 72.8% respect-ively, and the cross-survey tracking rates were 80.6 and83.8% respectively. As for the missing data, CFPS teamhas adopted a variety of processing methods to reducethe missing rate. For example, if personal income ismissing, replace it with the average of the income range.If it is still missing or less than 100 yuan, it shall be re-placed by the summation of the sub items related toincome(see [31], for more details about CFPS). CFPS hasso far conducted six surveys from 2010 to 2018, andeach survey covers 25 provinces and cities with a totalsample of 16,000 households and approximately 30,000family members in these households.In this study, we use data from waves of 2012, 2014,
2016, and 2018. After dropping observations with miss-ing information on health indicators and other
covariates, the final sample of our study includes 19,540person-year observations aged between 18 and 70 years.
VariablesThe key independent variable in our analysis is self-re-ported health. Compared with other health indicatorssuch as healthcare use, disability, illness history and bio-markers [6, 32–34], self-reported health is less costlyand easy to administer in large social surveys such asCFPS. In addition, self-reported health has been shown agood predictor of both mortality and morbidity andlarge use in literature [35, 36]. Besides, we use laggedself-reported health as a proxy of current health to dealwith the endogeneity problem caused by the reversecausality between health and income.Self-reported health are extracted from the survey
questionnaire and measured on a Likert scale with levelsof excellent, very good, good, average and poor. Wemerge excellent, very good and good into one categorydue to the rather limited sample size of individualswhose reported health are excellent and very goodhealth.1
Table 1 provides the distribution of self-reportedhealth in each wave. First, we observe that most peoplereported their health as good or above, accounting for71% of observations. 24.4% reported their health as aver-age and 4.6% as poor. Second, we can also detect a timechange. In the year of 2010, only 2.6% of workers re-ported poor health, against 7.6% reporting poor in theyear of 2016. In contrast, 78.1% of workers reportedgood health in 2010, but the proportion decreased to64.6% in 2016. Table 1 suggests that the health status ofworkers was getting worse over the period of 2010 and2016.The outcome variable is the self-reported annual in-
come from the individual’s current jobs, calculated asthe sum of salary, various bonuses and allowances ofworkers. We choose annual income instead of monthlywages as the dependent variable because the formermeasure is less subject to monthly variation which mightbe common for certain type of jobs. It is worth mention-ing that we exclude farmers or self-employed workerssince they do not get paid by employers. The annual in-come is calculated in RMB Yuan in 2018 value. Table 2below shows the average annual income of individualswith different self-reported health status in each waveand in all four waves.The overall average annual income for workers who
reported good, average, and poor health are 33,283
1The percentage of workers who reported their health as “excellent”and “very good” is 5.3 and 8.8%, respectively. The effect of aggregatedsample is 2.4% understated compared to the separated results. Webelieve it is acceptable and will not bias the results.
Xie et al. International Journal for Equity in Health (2020) 19:96 Page 3 of 15
Yuan, 28,018 Yuan, and 23,308 Yuan, respectively. Itsuggests that workers with better self-reported healthhave higher earnings. Table 2 also shows that workers’annual income increased continuously over the yearsfrom 2012 to 2018, but the income gap between differ-ent health cohorts became larger overtime. This tells usbetter health not only brings a higher earing for workersin China but also causes the income gap to widen over-time. Though the descriptive analysis in Table 2 stronglysuggests a correlation between health and income, thiscorrelation can be a spurious relationship without fur-ther control on other potential confounding factors.Another main independent variable is worker’s occu-
pation type. We divide workers into two groups, for-mally and informally employed workers. The formerincludes workers employed by the government, publicand private enterprises, and large-scale organizationswith labour contract. The latter includes workers whodo not have a formal labour contract or a long-termcontractual relationship with their employers. This dis-tinction is important since workers of unstable employ-ment were more vulnerable to shocks such as healthdeterioration. A dummy indicator is used to representan individual’s occupation, with one for workers whowere formally employed and zero otherwise.In regressions, we control a rich set of characteristics
of workers including educational attainment, age and itssquared term, sex, nationality, registered residence asurban and rural, marital status as well as residentialarea2 as East China, Central China, Northeast China andWest China.
Estimation modelsWe apply a Mincer [37] equation in which the log of an-nual income is modelled as a function of education andexperiment in human capital. The general form of theMincer Equation as follows:
ln yð Þ ¼ f Sch; Exper;X; εð Þ ð1Þ
Where ln(y) denotes the log of income, Sch and Experdenote the schooling and working years. X representsthe other independent variables than education and ex-perience, including sex, marital, living areas. Other un-observable factors are contained in the error term ε,which satisfied E(ε| X) = 0.Also, the effect of health on productive time and
thereby income is hypothesized in Grossman model [3],which add new a perspective of the human capital re-search that health is a component that affects income.Following the expansion of Mincer Equation in previousliterature, we model the log of annual income as a func-tion of health status, age, sex, education, marital status,and other of covariates. Endogeneity may arise if unob-served individual characteristics are correlated withhealth variable. In panel data, by assuming that these un-observed individual characteristics as time-constant, wecan use fixed effect models. The model presents as inEq. (2):
lnincomeit ¼ αi þ H0itβþ X
0itγ þ εit ð2Þ
Where the subscripts i and t denote individual andsurvey year, respectively. β and γ are estimated parame-ters. lnincomeit denotes the log of the annual income ofindividual i measured in RMB Yuan in time t, Hit de-notes health status of individual i in time t. Xit is a seriesof dummy indicators of an individual’s characteristics ascovariates. αi represents the individual specific effect,which is assumed time-irrelevant in models of fixedeffects. εit is a random error term and is often assumedto be iid normally distributed.The majority of current analyses using classical regres-
sion models show that, on average, health has a signifi-cant impact on income. However, in the case of thewidening income gap, estimating the average effect ofhealth on income would underestimate the impact forpoor workers and underrate the inequality of the health-income effect. To better understand the heterogeneoustreatment effects of health on income for individualswith varying income levels, we resort to quantileregression.Quantile regression was first introduced by Koenker
and Bassett in 1978 [38], as an extension of the classicalregression model and the panel quantile regression is
Table 2 The Average Annual Income of Workers in Each Wavein RMB Yuan
Wage 2012 2014 2016 2018 Overall
Health
Good 27,441 33,732 33,289 39,828 33,283
Average 24,886 25,417 26,994 33,335 28,018
Poor 21,428 21,781 23,943 24,163 23,308
Table 1 Distribution of Self-Reported Health in Each SurveyWave
Self-reported health In total 2010 2012 2014 2016
Good 0.710 0.781 0.741 0.671 0.646
Average 0.244 0.193 0.228 0.278 0.278
Poor 0.046 0.026 0.032 0.051 0.076
2Beijing, Tianjin, Hebei, Shanghai, Jiangsu, Zhejiang, Fujian, Shandong,Guangdong are East China.Shanxi, Anhui, Jiangxi, Henan, Hubei,Hunan, are Central China.Liaoning, Jilin, Heilongjiang are NortheastChina,Guangxi, Chongqing, Sichuan, Guizhou, Yunnan, Shanxi, Gansuare West China.
Xie et al. International Journal for Equity in Health (2020) 19:96 Page 4 of 15
quantile regression using panel data. Considered a linearmodel of the τ th quantile.yi ¼ xTi βτ þ ei; i ¼ 1;…;n;,Where the τ th quantile of ei is zero. The estimator of
βτ can be derived from solving:
bβτ ¼ argminXn
i¼1
ρτ yi−xTi β
� �
The quantile regressions are modelled as the condi-tional quantiles of the dependent variable and solved byminimizing the sum of weighted residual absolute valuesof residuals instead of minimizes the sum of squared re-siduals in OLS estimates. Compared with linear models,the quantile models are often less biased to skewed dataand could capture varying effects. Therefore, quantile re-gressions fit non-normal distributed data and result inmore robust estimates.In addition, quantile regressions are well-known to be
more robust to the outliers and require much weakerassumptions for the distribution of the error termcompared with classical linear regressions.The panel data quantile regression is the extension of
quantile regression in panel data by Koenker [39].Considered Eq. (2) where the τ th quantile of the condi-tional distribution of lnincomeit given explanatory vari-able vector X is specified as:
Qτ lnwageit j X� � ¼ αi þ XTβ τð Þ; τ∈ 0; 1ð Þ: ð3Þ
Where Qτ(lnwageit | X) denotes the quantile τ of logmonthly wage conditional on the vector of regressors.The panel quantile model combines the advantages of
panel data and quantile regression, in the sense that iteffectively controls unobserved individual heterogeneitywhile being more robust to functional misspecification.Using panel quantile regression, we are able to recoverthe relationship between the dependent variable andother covariant based on the distribution of dependentvariable at different quantiles [40]. The results of panelquantile regression show the different effects for specificquantile with robustness, which is suitable for ourresearch.In addition, we are also interested in the heterogeneity
of the health-income effect among different demo-graphic and socio-economic groups measured as sex,register residence and residential area. As male and fe-male workers are endowed with different physical andmental capacity, they are expected to have differentlevels of health and income [41, 42]. According to theexisting literature, there are vast differences betweenrural and urban residents in China, with the effect ofhealth on wages is more pronounced for rural residents[43, 44]. Moreover, we test the health impact based onresidential area.
Finally, we analyse the influence mechanism of health-income effect, and discuss the influence path of healthon income by adding the interaction terms betweenhealth and other variables.Finally, we analyse the influence mechanism of health-
income effect, and discuss the influence path of healthon income by adding the interaction terms betweenhealth and other variables.Concerned with the problem of multicollinearity in re-
gressions, we report bootstrap errors (bootstrap of 1000times) rather than the asymptotic standard error toguarantee the efficiency of the regression model. Allstatistical and regression analysis is performed using R3.5.1.
ResultsDescriptive analysesThe descriptive statistics for both the dependent variableand independent variables are presented in Table 3.The overall average annual income is 31,538 Yuan,
with 34,226 Yuan for males and 27,607 Yuan for females.69.7% males reported good health, and the proportionfor female is 72.8%. On average, female workers are 2years younger than male workers. More than two thirdsof males (70.3%) and females (73.7%) have completededucation lower than senior high school, while 29.7% ofmales and 26.3% females have completed higher educa-tion. Approximately 68.8% of males and 70.4% of fe-males live in rural areas and about 45.1% males and39.5% females have formally employed works.
Regression estimatesThe first column of Table 4 shows the regression resultusing the fixed-effect model, (2) to (5) columns show thepanel quantile regression results at 25th, 50th, 75th, and90th quantile of the income distribution.The fixed-effect model suggests that, the workers with
average and good health have an average annual income15.8 and 11.3% higher than ones of poor health, aftercontrolling for age, marital status, registered residence,and occupation. Due to the specification of the fixed-effect model, time-irrelevant variables such as sex, edu-cation, residential areas are dropped.Apart from this mean effect recovered by linear fixed
effect models, panel quantile regressions indicate thatworkers reporting their health as good and averageearned 21.9 and 17.1% higher than those who reportpoor health at lower income levels (e.g. the 25th quan-tile). The gaps narrow down to 16.9 and 12.3% for themedian income group and further to 16.4 and 8.2% athigher income levels (e.g. the 75th quantile). These esti-mates suggest that workers distributed at the 25th and50th percentile of income are affected more by healthand health status may have an insignificant effect on
Xie et al. International Journal for Equity in Health (2020) 19:96 Page 5 of 15
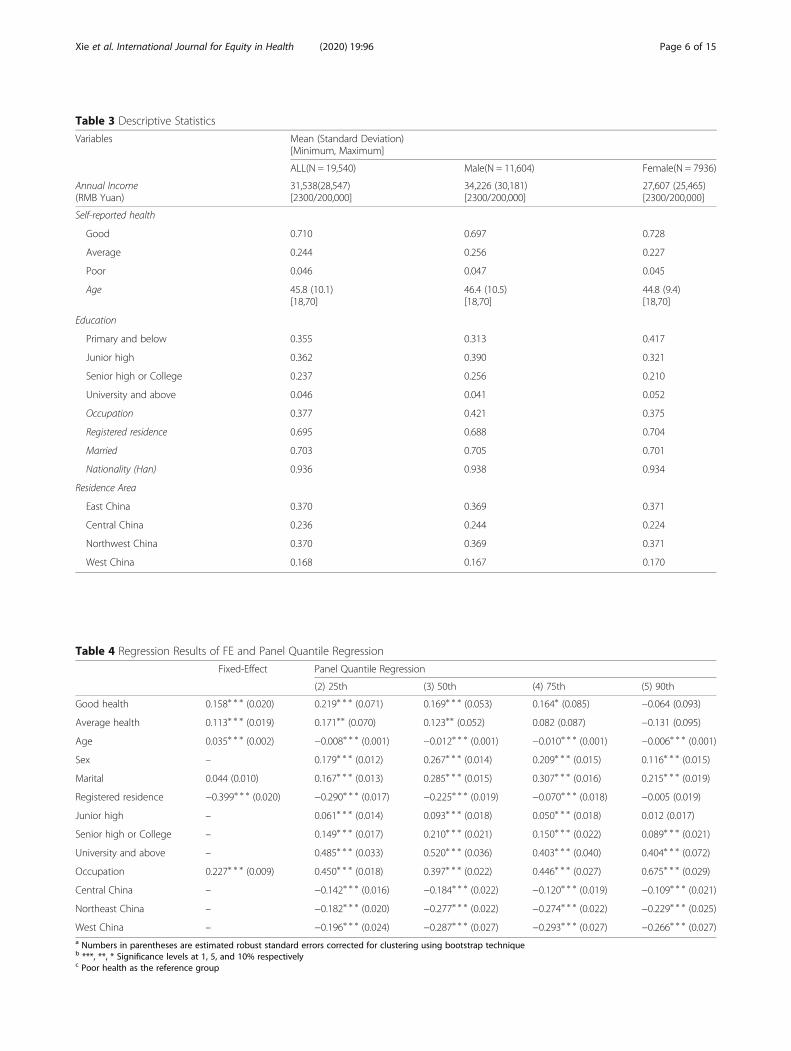
Table 3 Descriptive Statistics
Variables Mean (Standard Deviation)[Minimum, Maximum]
ALL(N = 19,540) Male(N = 11,604) Female(N = 7936)
Annual Income(RMB Yuan)
31,538(28,547)[2300/200,000]
34,226 (30,181)[2300/200,000]
27,607 (25,465)[2300/200,000]
Self-reported health
Good 0.710 0.697 0.728
Average 0.244 0.256 0.227
Poor 0.046 0.047 0.045
Age 45.8 (10.1)[18,70]
46.4 (10.5)[18,70]
44.8 (9.4)[18,70]
Education
Primary and below 0.355 0.313 0.417
Junior high 0.362 0.390 0.321
Senior high or College 0.237 0.256 0.210
University and above 0.046 0.041 0.052
Occupation 0.377 0.421 0.375
Registered residence 0.695 0.688 0.704
Married 0.703 0.705 0.701
Nationality (Han) 0.936 0.938 0.934
Residence Area
East China 0.370 0.369 0.371
Central China 0.236 0.244 0.224
Northwest China 0.370 0.369 0.371
West China 0.168 0.167 0.170
Table 4 Regression Results of FE and Panel Quantile Regression
Fixed-Effect Panel Quantile Regression
(2) 25th (3) 50th (4) 75th (5) 90th
Good health 0.158∗ ∗ ∗ (0.020) 0.219∗ ∗ ∗ (0.071) 0.169∗ ∗ ∗ (0.053) 0.164∗ (0.085) −0.064 (0.093)
Average health 0.113∗ ∗ ∗ (0.019) 0.171∗∗ (0.070) 0.123∗∗ (0.052) 0.082 (0.087) −0.131 (0.095)
Age 0.035∗ ∗ ∗ (0.002) −0.008∗ ∗ ∗ (0.001) −0.012∗ ∗ ∗ (0.001) −0.010∗ ∗ ∗ (0.001) −0.006∗ ∗ ∗ (0.001)
Sex – 0.179∗ ∗ ∗ (0.012) 0.267∗ ∗ ∗ (0.014) 0.209∗ ∗ ∗ (0.015) 0.116∗ ∗ ∗ (0.015)
Marital 0.044 (0.010) 0.167∗ ∗ ∗ (0.013) 0.285∗ ∗ ∗ (0.015) 0.307∗ ∗ ∗ (0.016) 0.215∗ ∗ ∗ (0.019)
Registered residence −0.399∗ ∗ ∗ (0.020) −0.290∗ ∗ ∗ (0.017) −0.225∗ ∗ ∗ (0.019) −0.070∗ ∗ ∗ (0.018) −0.005 (0.019)
Junior high – 0.061∗ ∗ ∗ (0.014) 0.093∗ ∗ ∗ (0.018) 0.050∗ ∗ ∗ (0.018) 0.012 (0.017)
Senior high or College – 0.149∗ ∗ ∗ (0.017) 0.210∗ ∗ ∗ (0.021) 0.150∗ ∗ ∗ (0.022) 0.089∗ ∗ ∗ (0.021)
University and above – 0.485∗ ∗ ∗ (0.033) 0.520∗ ∗ ∗ (0.036) 0.403∗ ∗ ∗ (0.040) 0.404∗ ∗ ∗ (0.072)
Occupation 0.227∗ ∗ ∗ (0.009) 0.450∗ ∗ ∗ (0.018) 0.397∗ ∗ ∗ (0.022) 0.446∗ ∗ ∗ (0.027) 0.675∗ ∗ ∗ (0.029)
Central China – −0.142∗ ∗ ∗ (0.016) −0.184∗ ∗ ∗ (0.022) −0.120∗ ∗ ∗ (0.019) −0.109∗ ∗ ∗ (0.021)
Northeast China – −0.182∗ ∗ ∗ (0.020) −0.277∗ ∗ ∗ (0.022) −0.274∗ ∗ ∗ (0.022) −0.229∗ ∗ ∗ (0.025)
West China – −0.196∗ ∗ ∗ (0.024) −0.287∗ ∗ ∗ (0.027) −0.293∗ ∗ ∗ (0.027) −0.266∗ ∗ ∗ (0.027)a Numbers in parentheses are estimated robust standard errors corrected for clustering using bootstrap techniqueb ***, **, * Significance levels at 1, 5, and 10% respectivelyc Poor health as the reference group
Xie et al. International Journal for Equity in Health (2020) 19:96 Page 6 of 15
workers at the upper tail of the income distribution.Other variables have signs as expected. For example,education is statistically significant at conventional levelsat all quantiles, which is consistent with existing empir-ical evidence on the return of schooling.Furthermore, we have conducted the falsification test
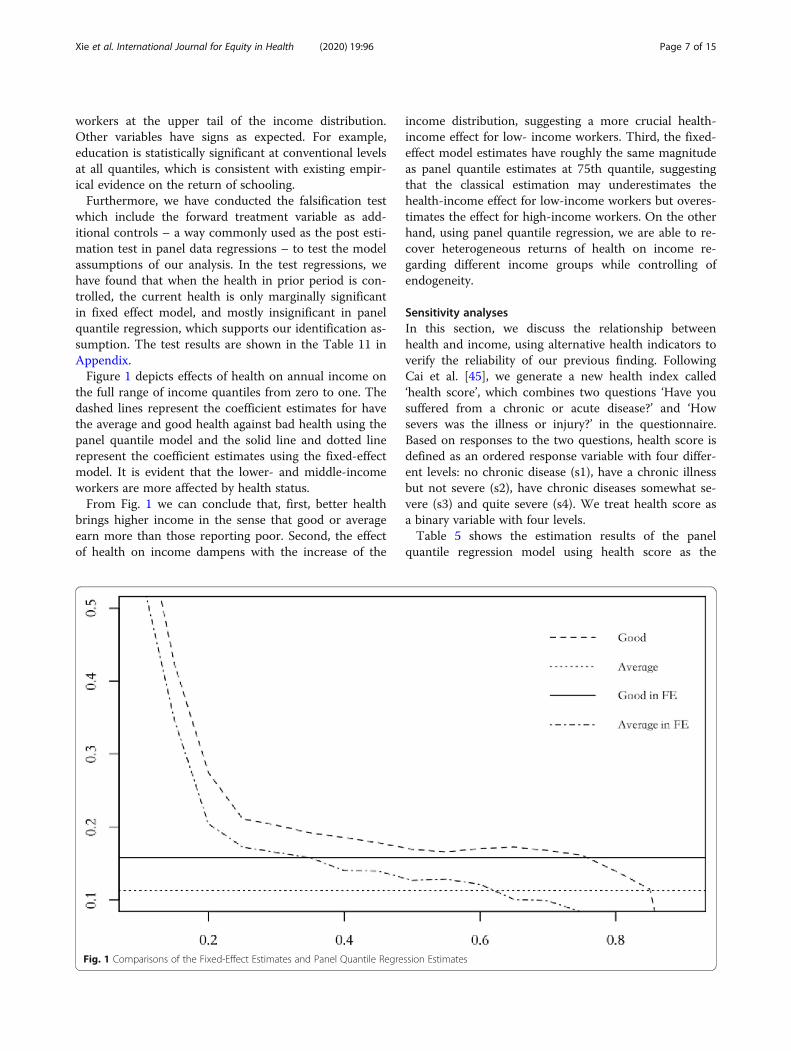
which include the forward treatment variable as add-itional controls – a way commonly used as the post esti-mation test in panel data regressions – to test the modelassumptions of our analysis. In the test regressions, wehave found that when the health in prior period is con-trolled, the current health is only marginally significantin fixed effect model, and mostly insignificant in panelquantile regression, which supports our identification as-sumption. The test results are shown in the Table 11 inAppendix.Figure 1 depicts effects of health on annual income on
the full range of income quantiles from zero to one. Thedashed lines represent the coefficient estimates for havethe average and good health against bad health using thepanel quantile model and the solid line and dotted linerepresent the coefficient estimates using the fixed-effectmodel. It is evident that the lower- and middle-incomeworkers are more affected by health status.From Fig. 1 we can conclude that, first, better health
brings higher income in the sense that good or averageearn more than those reporting poor. Second, the effectof health on income dampens with the increase of the
income distribution, suggesting a more crucial health-income effect for low- income workers. Third, the fixed-effect model estimates have roughly the same magnitudeas panel quantile estimates at 75th quantile, suggestingthat the classical estimation may underestimates thehealth-income effect for low-income workers but overes-timates the effect for high-income workers. On the otherhand, using panel quantile regression, we are able to re-cover heterogeneous returns of health on income re-garding different income groups while controlling ofendogeneity.
Sensitivity analysesIn this section, we discuss the relationship betweenhealth and income, using alternative health indicators toverify the reliability of our previous finding. FollowingCai et al. [45], we generate a new health index called‘health score’, which combines two questions ‘Have yousuffered from a chronic or acute disease?’ and ‘Howsevers was the illness or injury?’ in the questionnaire.Based on responses to the two questions, health score isdefined as an ordered response variable with four differ-ent levels: no chronic disease (s1), have a chronic illnessbut not severe (s2), have chronic diseases somewhat se-vere (s3) and quite severe (s4). We treat health score asa binary variable with four levels.Table 5 shows the estimation results of the panel
quantile regression model using health score as the
Fig. 1 Comparisons of the Fixed-Effect Estimates and Panel Quantile Regression Estimates
Xie et al. International Journal for Equity in Health (2020) 19:96 Page 7 of 15
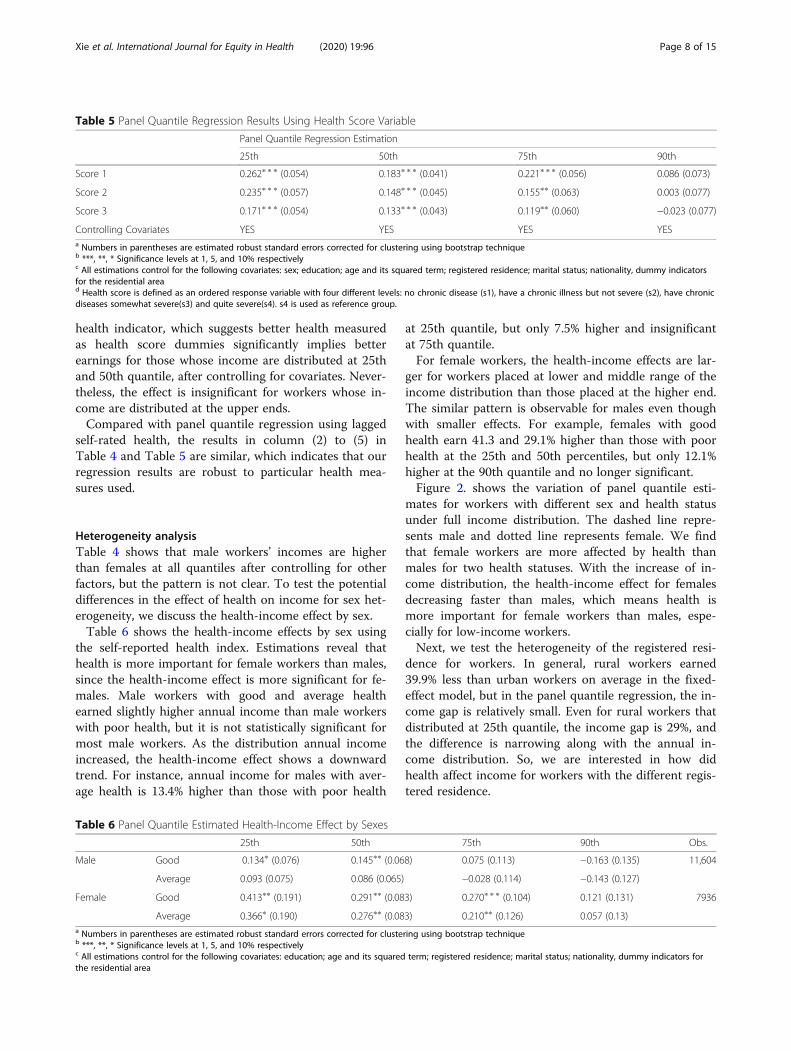
health indicator, which suggests better health measuredas health score dummies significantly implies betterearnings for those whose income are distributed at 25thand 50th quantile, after controlling for covariates. Never-theless, the effect is insignificant for workers whose in-come are distributed at the upper ends.Compared with panel quantile regression using lagged
self-rated health, the results in column (2) to (5) inTable 4 and Table 5 are similar, which indicates that ourregression results are robust to particular health mea-sures used.
Heterogeneity analysisTable 4 shows that male workers’ incomes are higherthan females at all quantiles after controlling for otherfactors, but the pattern is not clear. To test the potentialdifferences in the effect of health on income for sex het-erogeneity, we discuss the health-income effect by sex.Table 6 shows the health-income effects by sex using
the self-reported health index. Estimations reveal thathealth is more important for female workers than males,since the health-income effect is more significant for fe-males. Male workers with good and average healthearned slightly higher annual income than male workerswith poor health, but it is not statistically significant formost male workers. As the distribution annual incomeincreased, the health-income effect shows a downwardtrend. For instance, annual income for males with aver-age health is 13.4% higher than those with poor health
at 25th quantile, but only 7.5% higher and insignificantat 75th quantile.For female workers, the health-income effects are lar-
ger for workers placed at lower and middle range of theincome distribution than those placed at the higher end.The similar pattern is observable for males even thoughwith smaller effects. For example, females with goodhealth earn 41.3 and 29.1% higher than those with poorhealth at the 25th and 50th percentiles, but only 12.1%higher at the 90th quantile and no longer significant.Figure 2. shows the variation of panel quantile esti-
mates for workers with different sex and health statusunder full income distribution. The dashed line repre-sents male and dotted line represents female. We findthat female workers are more affected by health thanmales for two health statuses. With the increase of in-come distribution, the health-income effect for femalesdecreasing faster than males, which means health ismore important for female workers than males, espe-cially for low-income workers.Next, we test the heterogeneity of the registered resi-
dence for workers. In general, rural workers earned39.9% less than urban workers on average in the fixed-effect model, but in the panel quantile regression, the in-come gap is relatively small. Even for rural workers thatdistributed at 25th quantile, the income gap is 29%, andthe difference is narrowing along with the annual in-come distribution. So, we are interested in how didhealth affect income for workers with the different regis-tered residence.
Table 5 Panel Quantile Regression Results Using Health Score Variable
Panel Quantile Regression Estimation
25th 50th 75th 90th
Score 1 0.262∗ ∗ ∗ (0.054) 0.183∗ ∗ ∗ (0.041) 0.221∗ ∗ ∗ (0.056) 0.086 (0.073)
Score 2 0.235∗ ∗ ∗ (0.057) 0.148∗ ∗ ∗ (0.045) 0.155∗∗ (0.063) 0.003 (0.077)
Score 3 0.171∗ ∗ ∗ (0.054) 0.133∗ ∗ ∗ (0.043) 0.119∗∗ (0.060) −0.023 (0.077)
Controlling Covariates YES YES YES YESa Numbers in parentheses are estimated robust standard errors corrected for clustering using bootstrap techniqueb ***, **, * Significance levels at 1, 5, and 10% respectivelyc All estimations control for the following covariates: sex; education; age and its squared term; registered residence; marital status; nationality, dummy indicatorsfor the residential aread Health score is defined as an ordered response variable with four different levels: no chronic disease (s1), have a chronic illness but not severe (s2), have chronicdiseases somewhat severe(s3) and quite severe(s4). s4 is used as reference group.
Table 6 Panel Quantile Estimated Health-Income Effect by Sexes
25th 50th 75th 90th Obs.
Male Good 0.134∗ (0.076) 0.145∗∗ (0.068) 0.075 (0.113) −0.163 (0.135) 11,604
Average 0.093 (0.075) 0.086 (0.065) −0.028 (0.114) −0.143 (0.127)
Female Good 0.413∗∗ (0.191) 0.291∗∗ (0.083) 0.270∗ ∗ ∗ (0.104) 0.121 (0.131) 7936
Average 0.366∗ (0.190) 0.276∗∗ (0.083) 0.210∗∗ (0.126) 0.057 (0.13)a Numbers in parentheses are estimated robust standard errors corrected for clustering using bootstrap techniqueb ***, **, * Significance levels at 1, 5, and 10% respectivelyc All estimations control for the following covariates: education; age and its squared term; registered residence; marital status; nationality, dummy indicators forthe residential area
Xie et al. International Journal for Equity in Health (2020) 19:96 Page 8 of 15
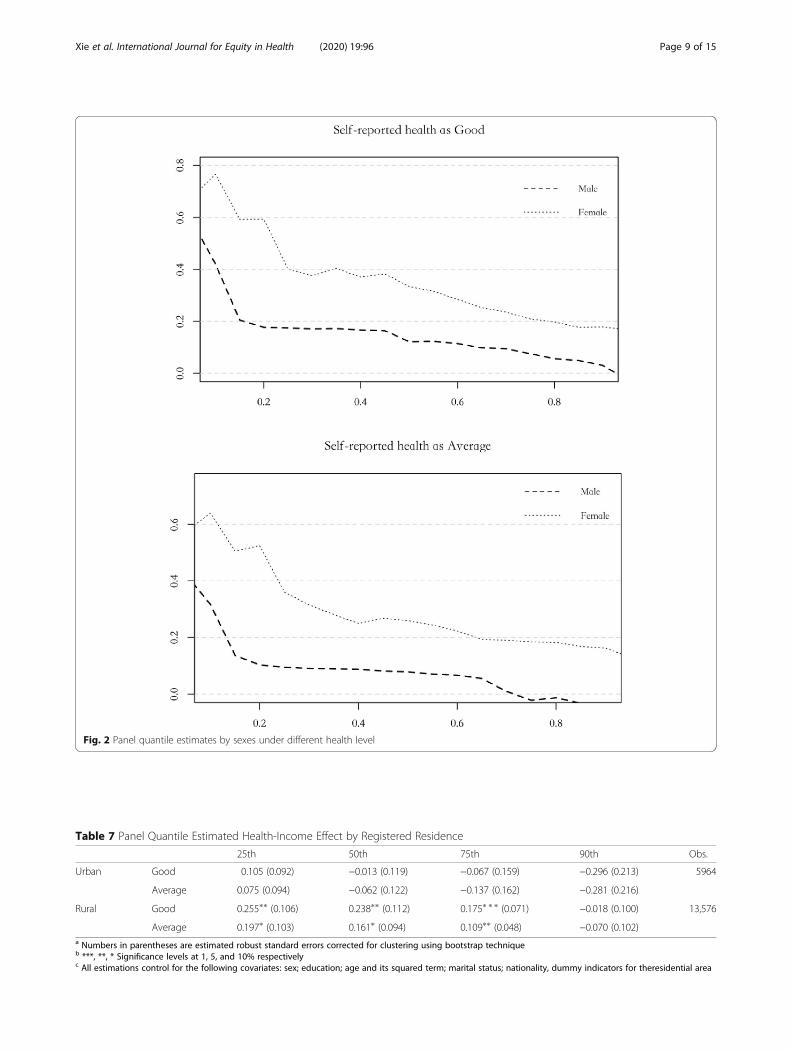
Fig. 2 Panel quantile estimates by sexes under different health level
Table 7 Panel Quantile Estimated Health-Income Effect by Registered Residence
25th 50th 75th 90th Obs.
Urban Good 0.105 (0.092) −0.013 (0.119) −0.067 (0.159) −0.296 (0.213) 5964
Average 0.075 (0.094) −0.062 (0.122) −0.137 (0.162) −0.281 (0.216)
Rural Good 0.255∗∗ (0.106) 0.238∗∗ (0.112) 0.175∗ ∗ ∗ (0.071) −0.018 (0.100) 13,576
Average 0.197∗ (0.103) 0.161∗ (0.094) 0.109∗∗ (0.048) −0.070 (0.102)a Numbers in parentheses are estimated robust standard errors corrected for clustering using bootstrap techniqueb ***, **, * Significance levels at 1, 5, and 10% respectivelyc All estimations control for the following covariates: sex; education; age and its squared term; marital status; nationality, dummy indicators for theresidential area
Xie et al. International Journal for Equity in Health (2020) 19:96 Page 9 of 15
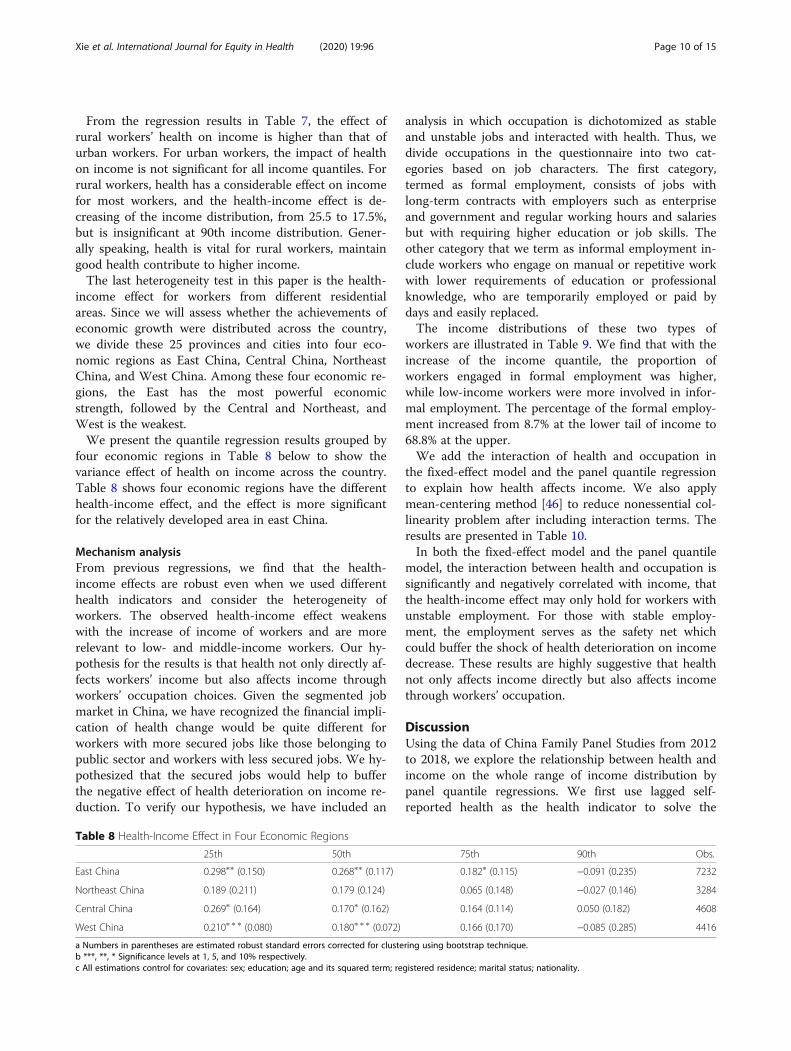
From the regression results in Table 7, the effect ofrural workers’ health on income is higher than that ofurban workers. For urban workers, the impact of healthon income is not significant for all income quantiles. Forrural workers, health has a considerable effect on incomefor most workers, and the health-income effect is de-creasing of the income distribution, from 25.5 to 17.5%,but is insignificant at 90th income distribution. Gener-ally speaking, health is vital for rural workers, maintaingood health contribute to higher income.The last heterogeneity test in this paper is the health-
income effect for workers from different residentialareas. Since we will assess whether the achievements ofeconomic growth were distributed across the country,we divide these 25 provinces and cities into four eco-nomic regions as East China, Central China, NortheastChina, and West China. Among these four economic re-gions, the East has the most powerful economicstrength, followed by the Central and Northeast, andWest is the weakest.We present the quantile regression results grouped by
four economic regions in Table 8 below to show thevariance effect of health on income across the country.Table 8 shows four economic regions have the differenthealth-income effect, and the effect is more significantfor the relatively developed area in east China.
Mechanism analysisFrom previous regressions, we find that the health-income effects are robust even when we used differenthealth indicators and consider the heterogeneity ofworkers. The observed health-income effect weakenswith the increase of income of workers and are morerelevant to low- and middle-income workers. Our hy-pothesis for the results is that health not only directly af-fects workers’ income but also affects income throughworkers’ occupation choices. Given the segmented jobmarket in China, we have recognized the financial impli-cation of health change would be quite different forworkers with more secured jobs like those belonging topublic sector and workers with less secured jobs. We hy-pothesized that the secured jobs would help to bufferthe negative effect of health deterioration on income re-duction. To verify our hypothesis, we have included an
analysis in which occupation is dichotomized as stableand unstable jobs and interacted with health. Thus, wedivide occupations in the questionnaire into two cat-egories based on job characters. The first category,termed as formal employment, consists of jobs withlong-term contracts with employers such as enterpriseand government and regular working hours and salariesbut with requiring higher education or job skills. Theother category that we term as informal employment in-clude workers who engage on manual or repetitive workwith lower requirements of education or professionalknowledge, who are temporarily employed or paid bydays and easily replaced.The income distributions of these two types of
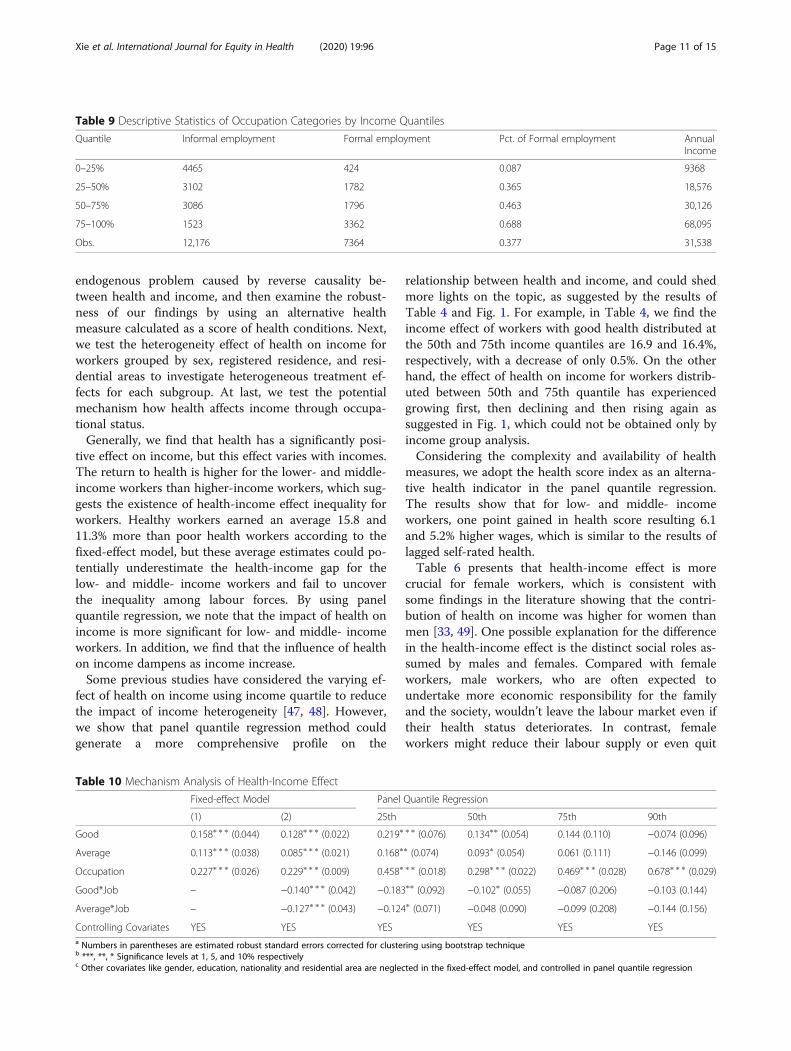
workers are illustrated in Table 9. We find that with theincrease of the income quantile, the proportion ofworkers engaged in formal employment was higher,while low-income workers were more involved in infor-mal employment. The percentage of the formal employ-ment increased from 8.7% at the lower tail of income to68.8% at the upper.We add the interaction of health and occupation in
the fixed-effect model and the panel quantile regressionto explain how health affects income. We also applymean-centering method [46] to reduce nonessential col-linearity problem after including interaction terms. Theresults are presented in Table 10.In both the fixed-effect model and the panel quantile
model, the interaction between health and occupation issignificantly and negatively correlated with income, thatthe health-income effect may only hold for workers withunstable employment. For those with stable employ-ment, the employment serves as the safety net whichcould buffer the shock of health deterioration on incomedecrease. These results are highly suggestive that healthnot only affects income directly but also affects incomethrough workers’ occupation.
DiscussionUsing the data of China Family Panel Studies from 2012to 2018, we explore the relationship between health andincome on the whole range of income distribution bypanel quantile regressions. We first use lagged self-reported health as the health indicator to solve the
Table 8 Health-Income Effect in Four Economic Regions
25th 50th 75th 90th Obs.
East China 0.298∗∗ (0.150) 0.268∗∗ (0.117) 0.182∗ (0.115) −0.091 (0.235) 7232
Northeast China 0.189 (0.211) 0.179 (0.124) 0.065 (0.148) −0.027 (0.146) 3284
Central China 0.269∗ (0.164) 0.170∗ (0.162) 0.164 (0.114) 0.050 (0.182) 4608
West China 0.210∗ ∗ ∗ (0.080) 0.180∗ ∗ ∗ (0.072) 0.166 (0.170) −0.085 (0.285) 4416
a Numbers in parentheses are estimated robust standard errors corrected for clustering using bootstrap technique.b ***, **, * Significance levels at 1, 5, and 10% respectively.c All estimations control for covariates: sex; education; age and its squared term; registered residence; marital status; nationality.
Xie et al. International Journal for Equity in Health (2020) 19:96 Page 10 of 15
endogenous problem caused by reverse causality be-tween health and income, and then examine the robust-ness of our findings by using an alternative healthmeasure calculated as a score of health conditions. Next,we test the heterogeneity effect of health on income forworkers grouped by sex, registered residence, and resi-dential areas to investigate heterogeneous treatment ef-fects for each subgroup. At last, we test the potentialmechanism how health affects income through occupa-tional status.Generally, we find that health has a significantly posi-
tive effect on income, but this effect varies with incomes.The return to health is higher for the lower- and middle-income workers than higher-income workers, which sug-gests the existence of health-income effect inequality forworkers. Healthy workers earned an average 15.8 and11.3% more than poor health workers according to thefixed-effect model, but these average estimates could po-tentially underestimate the health-income gap for thelow- and middle- income workers and fail to uncoverthe inequality among labour forces. By using panelquantile regression, we note that the impact of health onincome is more significant for low- and middle- incomeworkers. In addition, we find that the influence of healthon income dampens as income increase.Some previous studies have considered the varying ef-
fect of health on income using income quartile to reducethe impact of income heterogeneity [47, 48]. However,we show that panel quantile regression method couldgenerate a more comprehensive profile on the
relationship between health and income, and could shedmore lights on the topic, as suggested by the results ofTable 4 and Fig. 1. For example, in Table 4, we find theincome effect of workers with good health distributed atthe 50th and 75th income quantiles are 16.9 and 16.4%,respectively, with a decrease of only 0.5%. On the otherhand, the effect of health on income for workers distrib-uted between 50th and 75th quantile has experiencedgrowing first, then declining and then rising again assuggested in Fig. 1, which could not be obtained only byincome group analysis.Considering the complexity and availability of health
measures, we adopt the health score index as an alterna-tive health indicator in the panel quantile regression.The results show that for low- and middle- incomeworkers, one point gained in health score resulting 6.1and 5.2% higher wages, which is similar to the results oflagged self-rated health.Table 6 presents that health-income effect is more
crucial for female workers, which is consistent withsome findings in the literature showing that the contri-bution of health on income was higher for women thanmen [33, 49]. One possible explanation for the differencein the health-income effect is the distinct social roles as-sumed by males and females. Compared with femaleworkers, male workers, who are often expected toundertake more economic responsibility for the familyand the society, wouldn’t leave the labour market even iftheir health status deteriorates. In contrast, femaleworkers might reduce their labour supply or even quit
Table 9 Descriptive Statistics of Occupation Categories by Income Quantiles
Quantile Informal employment Formal employment Pct. of Formal employment AnnualIncome
0–25% 4465 424 0.087 9368
25–50% 3102 1782 0.365 18,576
50–75% 3086 1796 0.463 30,126
75–100% 1523 3362 0.688 68,095
Obs. 12,176 7364 0.377 31,538
Table 10 Mechanism Analysis of Health-Income Effect
Fixed-effect Model Panel Quantile Regression
(1) (2) 25th 50th 75th 90th
Good 0.158∗ ∗ ∗ (0.044) 0.128∗ ∗ ∗ (0.022) 0.219∗ ∗ ∗ (0.076) 0.134∗∗ (0.054) 0.144 (0.110) −0.074 (0.096)
Average 0.113∗ ∗ ∗ (0.038) 0.085∗ ∗ ∗ (0.021) 0.168∗∗ (0.074) 0.093∗ (0.054) 0.061 (0.111) −0.146 (0.099)
Occupation 0.227∗ ∗ ∗ (0.026) 0.229∗ ∗ ∗ (0.009) 0.458∗ ∗ ∗ (0.018) 0.298∗ ∗ ∗ (0.022) 0.469∗ ∗ ∗ (0.028) 0.678∗ ∗ ∗ (0.029)
Good*Job – −0.140∗ ∗ ∗ (0.042) −0.183∗∗ (0.092) −0.102∗ (0.055) −0.087 (0.206) −0.103 (0.144)
Average*Job – −0.127∗ ∗ ∗ (0.043) −0.124∗ (0.071) −0.048 (0.090) −0.099 (0.208) −0.144 (0.156)
Controlling Covariates YES YES YES YES YES YESa Numbers in parentheses are estimated robust standard errors corrected for clustering using bootstrap techniqueb ***, **, * Significance levels at 1, 5, and 10% respectivelyc Other covariates like gender, education, nationality and residential area are neglected in the fixed-effect model, and controlled in panel quantile regression
Xie et al. International Journal for Equity in Health (2020) 19:96 Page 11 of 15
the job and return to family in the case of health deteri-oration. Therefore, given equal levels of health, femaleworkers are more motivated to join the labour marketfor higher income. Besides, female workers are moresensitive to the impact of diseases and medical insur-ance, which makes them more valuable in family healthproduction [24].The results present in Table 7 saying that rural
workers have a higher health-income effect support thefindings in previous literature that health status is moreimportant for rural workers in China [50, 51]. Due tothe restrictions of living regions, educational back-ground, job skills, among other factors, most of the ruralworkers can only be engaged in manual jobs that reliesheavily on health conditions.Health status not only directly affects the income of
the workers but also affects the income through thetypes of occupations. We find that workers who partici-pated in manual labour were more dependent on theirhealth than those involved in non-manual works. There-fore, the workers engaged in the unstable income occu-pation are more sensitive to the change of health status.As the workers involved in the unstable income occupa-tion gradually decrease with the distribution of income,resulting in a reduced health-income effect.Our findings have substantial policy implications. First
of all, the government should increase public investmenton maintaining and improving workers’ health, which is acost-effective way to build sustainable development on hu-man capital of the working population. Secondly, the gov-ernment should focus on improving the health securitylevel of low-income workers to reduce inequality,especially for female and rural workers. Low-incomeworkers were characterized by worse health condition andlower disposable income, making them vulnerable tohealth risks such as illnesses and injuries. Two types ofpolicies targeting on lower- and middle-income workerscan be considered by the government: the first to increasehealth capital investments for workers with lower income,for example, by providing health care access and healthcare knowledge. The second is to increase the medical in-surance benefits for the lower- and middle-incomeworkers, thereby improving their health risk resistance.
Strengths and limitationsTo the best of our knowledge, no previous study has ex-plored inequality of health-income effect for workersdistributed on a wide income spectrum in China usingpanel quantile regression. In addition to the discussionof the health-income effect, we have investigated itsheterogeneity for different demographic and socio-economic groups and possible mechanism to explain theeffect. Our main finding that deterioration of health
most affect workers located at the lower tail of incomedistribution, suggests that public policies should be tai-lored particularly to alleviate the negative impact ofhealth deterioration on income for lower and middle-income groups.This study has some limitations. First, the lagged self-
reported health, which is used as the primary health meas-ure in our study to deal with the endogeneity problem,may suffer from the measurement error in the sense thatit is self-reported and lagged. To reduce the self-reportbias, we have examined an alternative measure which isbased on chronic illness history and hopefully less subjectto self-report bias. Using lagged measure of health mightbe problematic given that health is a continuous andchangeable indicator. Generally speaking, lagged health isoften better than current health. When we use laggedhealth as an exposure variable to analyse the impact ofhealth on income, the effect can be overestimated. Never-theless, in our analysis, we have found that the incomegap exists not only between workers who are placed at thetwo ends of health spectrum – the ones with good healthand with bad health, but also exists between the ones withpoor health and with average health. This speaks that des-pite the possible overestimation, the true effect of health-income gradient is unlikely to be neglectable. Second, toavoid the temporal variation we measure income ofworkers by their annual income, which, however, may besubject to year-to-year variation. Nevertheless, it is well-known that measurement errors for the outcome variablecan only result in less efficiency of parameter estimates,but not bias. Finally, we have only examined occupationas the possible mediator accounting for the health-incomeeffect. Even that we have found that occupation is indeedone important channel, there might be other importantchannels, which we have to leave for future research.
ConclusionsThis study provides new knowledge on the impact ofhealth change on income reduction. First, this study re-veals the heterogeneous effects of health deteriorationon income reduction for workers with different incomesby using unique panel data and rather advanced statis-tical techniques – panel quantile regressions. The mainfinding is that workers with lower incomes are morelikely to be affected by worsening health. Second, howthis health-income effect differs among subgroups de-fined by urban/rural residence and geographic residencehas been examined. Finally, mechanism of health affect-ing income through mediators such as occupation hasbeen investigated. Findings of the current study confirmsthe necessity of social safety net on hedging the risk ofincome reduction due to health shocks. In particular,public policies on health and income protections shouldemphasize different needs of workers with different
Xie et al. International Journal for Equity in Health (2020) 19:96 Page 12 of 15
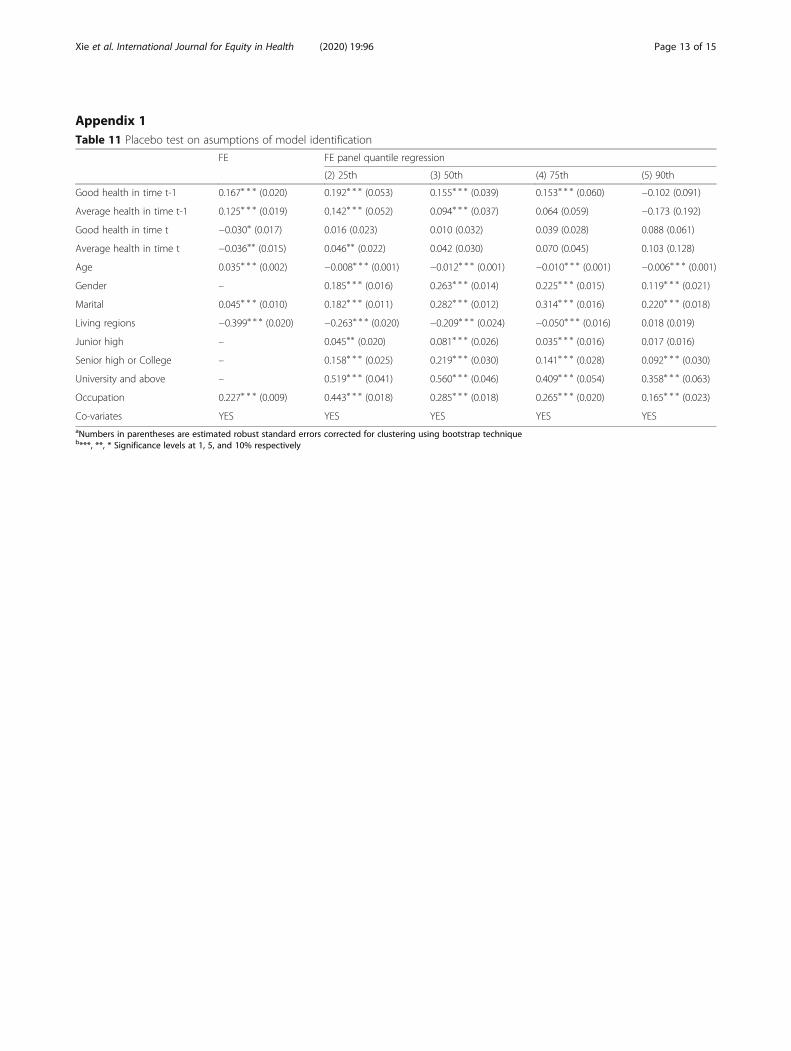
Appendix 1Table 11 Placebo test on asumptions of model identification
FE FE panel quantile regression
(2) 25th (3) 50th (4) 75th (5) 90th
Good health in time t-1 0.167∗ ∗ ∗ (0.020) 0.192∗ ∗ ∗ (0.053) 0.155∗ ∗ ∗ (0.039) 0.153∗ ∗ ∗ (0.060) −0.102 (0.091)
Average health in time t-1 0.125∗ ∗ ∗ (0.019) 0.142∗ ∗ ∗ (0.052) 0.094∗ ∗ ∗ (0.037) 0.064 (0.059) −0.173 (0.192)
Good health in time t −0.030∗ (0.017) 0.016 (0.023) 0.010 (0.032) 0.039 (0.028) 0.088 (0.061)
Average health in time t −0.036∗∗ (0.015) 0.046∗∗ (0.022) 0.042 (0.030) 0.070 (0.045) 0.103 (0.128)
Age 0.035∗ ∗ ∗ (0.002) −0.008∗ ∗ ∗ (0.001) −0.012∗ ∗ ∗ (0.001) −0.010∗ ∗ ∗ (0.001) −0.006∗ ∗ ∗ (0.001)
Gender – 0.185∗ ∗ ∗ (0.016) 0.263∗ ∗ ∗ (0.014) 0.225∗ ∗ ∗ (0.015) 0.119∗ ∗ ∗ (0.021)
Marital 0.045∗ ∗ ∗ (0.010) 0.182∗ ∗ ∗ (0.011) 0.282∗ ∗ ∗ (0.012) 0.314∗ ∗ ∗ (0.016) 0.220∗ ∗ ∗ (0.018)
Living regions −0.399∗ ∗ ∗ (0.020) −0.263∗ ∗ ∗ (0.020) −0.209∗ ∗ ∗ (0.024) −0.050∗ ∗ ∗ (0.016) 0.018 (0.019)
Junior high – 0.045∗∗ (0.020) 0.081∗ ∗ ∗ (0.026) 0.035∗ ∗ ∗ (0.016) 0.017 (0.016)
Senior high or College – 0.158∗ ∗ ∗ (0.025) 0.219∗ ∗ ∗ (0.030) 0.141∗ ∗ ∗ (0.028) 0.092∗ ∗ ∗ (0.030)
University and above – 0.519∗ ∗ ∗ (0.041) 0.560∗ ∗ ∗ (0.046) 0.409∗ ∗ ∗ (0.054) 0.358∗ ∗ ∗ (0.063)
Occupation 0.227∗ ∗ ∗ (0.009) 0.443∗ ∗ ∗ (0.018) 0.285∗ ∗ ∗ (0.018) 0.265∗ ∗ ∗ (0.020) 0.165∗ ∗ ∗ (0.023)
Co-variates YES YES YES YES YESaNumbers in parentheses are estimated robust standard errors corrected for clustering using bootstrap techniqueb***, **, * Significance levels at 1, 5, and 10% respectively
Xie et al. International Journal for Equity in Health (2020) 19:96 Page 13 of 15
incomes and special focus should be given to low-income workers who are much more financially fragileto health deterioration than other income groups.
AcknowledgementsThe authors are grateful to the officers and data management staff of CFPS.In addition, we are grateful to the professors and experts who have madevaluable comments on our research in various conferences and seminars.
Authors’ contributionsWZ conducted and guided the research. MX collected and analysed data.MX and WZ interpreted results and wrote the manuscript. ZH revised themanuscript. The authors read and approved the final manuscript.Corresponding author.Correspondence to Wenbin Zang.
FundingNone.
Availability of data and materialsAll data came from public domain and could be accessed from the linkbelow:1) China Family Panel Survey: http://isss.pku.edu.cn/cfps/download/login[Original data, register and login to download both English and Chineseversion].2) Mendeley Data repository: https://doi.org/10.17632/p8ddwcyhnv.1 [Thedatasets generated and analysed during the study].
Ethics approval and consent to participateAll data came from public domain. Ethics approval and consent toparticipate was not applicable.
Consent for publicationAll authors have contributed to this work and have consented for itspublication.
Competing interestsWe declare no competing interests.
Received: 19 February 2020 Accepted: 2 June 2020
References1. Ana RA, César RG. The impact of health on wages: evidence for Europe. Eur
J Health Econ. 2018;19(8):1173–87.2. Cai L, Kalb G. Health status and labour force participation: evidence from
Australia. Health Econ. 2006;15(3):241–61.3. Grossman M. On the concept of health capital and the demand for health.
J Polit Econ. 1972;80(2):223–55.4. Haveman R, Wolfe B, Kreider B, Stone M. Market work, wages, and Men’s
health. J Health Econ. 1994;13(2):163–82.5. Chinara M. Gender discrimination in wage earnings: a study of Indian wage
market. Indian J Labour Econ. 2018;61(1):157–69.6. Jones AM, Wildman J. Health, income and relative deprivation: evidence
from the BHPS. J Health Econ. 2008;27:308–24.7. Karlsdotter K, Martín J. Multilevel analysis of income, income inequalities
and health in Spain. Soc Sci Med. 2012;74(11):1099–106.8. Landefeld JC, Burmaster KB, Rehkopf DH, Syme SL, Lahiff M, Adler-Milstein S,
et al. The association between a living wage and subjective social statusand self-rated health: a quasi-experimental study in the DominicanRepublic. Soc Sci Med. 2014;121:91–7.
9. Halima A, Rococo E. Wage differences according to health status in France.Soc Sci Med. 2014;120:260–8.
10. Jackle R, Himmler O. Health and wages: panel data estimates consideringselection and endogeneity. J Hum Resour. 2010;45(2):364–406.
11. Johar M, Katayama H. Quantile regression analysis of body mass and wages.Health Econ. 2012;21(5):597–611.
12. Cai L. Effects of health on wages of Australian men. Econ Rec. 2009;85(270):290–306.
13. Feng Z, Wang W, Jones K, Li Y. An exploratory multilevel analysis of income,income inequality and self-rated health of the elderly in China. Soc Sci Med.2012;75(12):2481–92.
14. Sabia JJ, Rees DI. Body weight and wages: evidence from add health. EconHum Biol. 2012;10(1):14–9.
15. Kniesner TJ, Viscusi WK, Ziliak JP. Policy relevant heterogeneity in the valueof statistical life: new evidence from panel data quantile regressionsIZADiscussion Paper NO.4508; 2009. p. 1–30.
16. Hsieh W, Hsiao P, Lee J. The impact of health status on wages-evidencefrom the quantile regression. J Int Global Econ Stud. 2012;5(1):35–56.
17. Kedir AM. Health and productivity: panel data evidence from Ethiopia. AfrDev Rev. 2009;21(1):59–73.
18. Thomas D, Strauss J. Health and wages: evidence on men and women inurban Brazil. J Econ. 1997;77:159–85.
19. Schultz TP. Wage rentals for reproducible human capital: evidence fromGhana and the Ivory Coast. Econ Hum Biol. 2003;1:331–66.
20. Dinda S, Gangopadhyay PK, Chattopadhyay BP, Saiyed HN, Pal M, Bharati P.Height, weight and earnings among coalminers in India. Econ Hum Biol.2006;4:342–50.
21. Sohn K. The height premium in Indonesia. Econ Hum Biol. 2015;16:1–15.22. Kim TH, Han E. Height premium for job performance. Econ Hum Biol. 2018;
26:13–20.23. Gao WS, Smyth R. Health human capital, height and wages in China. J Dev
Stud. 2010;46(3):466–84.24. Liu GG, Dow WH, Fu AZ, Akin J, Lance P. Income productivity in China: on
the role of health. J Health Econ. 2008;27:27–44.25. Wang P, Liu GG. Health human capital and gender wage gap. South China
J Econ. 2010;27:27–44.26. Tian YF. Research on the correlation between health and wage by
simultaneous equations. South China J Econ. 2013;1:19–27.27. Wang Q, Ye JY. Health status, income and overtime work of migrant
workers. Chinese Rural Economy. 2016;2:2–12.28. Yin ZC, Wei Z, Wang Y. The impact of nutrition and health on the income
of urban residents. Financ Econ. 2014;6:85–96.29. Zhang CC. Empirical analysis on impact of health change on labor supply
and income. Econ Rev. 2011;4:79–88.30. Qin LJ, Chen B, Qin XZ. The influence of health on migrant workers’ income.
World Economic Papers. 2013;6:110–20.31. Xie Y, Hu JW. An introduction to the China family panel studies (CFPS).
Chinese Sociol Rev. 2014;47(1):3–29.32. Carrieri V, Wuebker A. Quasi-experimental evidence on the effects of health
information on preventive behaviour in Europe. Oxf Bull Econ Stat. 2016;78(6):765–91.
33. Gannon B, Munley M. Age and disability: explaining the wage differential.Soc Sci Med. 2011;69(1):47–55.
34. Szende A, Janassen B, Ramos JM, Cabases JM. PHP87-measuring income-related inequity in self-assessed health using the EQ-5D in 7 countries.Value Health. 2017;19(7):A454.
35. Borisova LV. Objective and subjective determinants of self-rated health incentral and Eastern Europe: a multilevel approach. Cent Eur J Public Health.2019;27(2):145–52.
36. Jylh M. What is self-rated health and why does it predict mortality? Towardsa unified conceptual model. Soc Sci Med. 2009;69(3):307–16.
37. Mincer J. Schooling, experience and earning. Columbia: Columbia UniversityPress; 1974. p. 83–96.
38. Koenker R, Bassett G. Regression quantiles. Econometrica. 1978;46(1):33–50.39. Koenker R. Quantile regression for longitudinal data. J Multivar Anal. 2004;
91:74–89.40. Gu JY, Volgushev S. Panel data quantile regression with grouped fixed
effects. J Econ. 2019;213(1):68–91.41. Hare D. Decomposing growth in the gender wage gap in urban China:
1989–2011. Econ Transition Institutional Change. 2019;27(4):915–41.42. Zhang H, Uva TB, Doorslaer E. The gender health gap in China: a
decomposition analysis. Econ Hum Biol. 2015;18:13–26.43. Liu SL, Li J. Health, labour participation and rural poverty in China. Chinese
Rural Econ. 2008;1:56–68.44. Wei Z. The role of health on off-farm employment and wage decision. Econ
Res. 2004;2:64–74.45. Cai JL, Coyte P, Zhao HZ. Decomposing the causes of socioeconomic-
related health inequality among urban and rural populations in China: anew decomposition approach. Int J Equity Health. 2017;16:1–14.
Xie et al. International Journal for Equity in Health (2020) 19:96 Page 14 of 15
46. Hayes AF. Truths and myths about mean centering. In: Introduction tomediation, moderation, and conditional process analysis: a regression-basedapproach. New York: The Guiford Press; 2013. p. 282–8.
47. Xie E. Contribution rate of poverty and income inequality in China: 1989-2011. Chinese Population Sci. 2013;5:10–20.
48. Zheng YJ, Chen H. Does China's urban residents basic medical insurancelessen the impact of health shock. Financial Econ Res. 2017;4:118–28.
49. Zhou CF, Su Q. The study of gender wage differential in Chinese urbanlabour market. South China J Econ. 2018;7:96–112.
50. Wang XZ, Yi T. Income effect of healthy human capital. J Capital Univ EconBusiness. 2017;4:20–6.
51. Yang YP. Income effect of health: research based on quantile regression.Financ Econ. 2014;4:108–18.
Publisher’s NoteSpringer Nature remains neutral with regard to jurisdictional claims inpublished maps and institutional affiliations.
Xie et al. International Journal for Equity in Health (2020) 19:96 Page 15 of 15