Embed Size (px)
Citation preview
The influence of employees’ and line
managers’ attributions on job performance A quantitative study on employee HR attributions, HRM co-production and
line manager implementation attributions at
Benchmark Electronics
Student Name: Caitlin Vermeul Student number: S1070002 Study: MSc in Business Administration Specialization: Human Resource Management Exam Committee First Supervisor: Dr. A.C. Bos-Nehles University of Twente Second Supervisor: Dr. J. Meijerink University of Twente External Supervisor: D. Molenaar Benchmark Electronics 11-09-2014

2
3
Acknowledgements
First of all I would like to thank my supervisor Dr. Anna Bos-Nehles for guidance and feedback on writing
my thesis. With her help I wrote the thesis that lies in front of you. I learnt a lot on how to perform a
descent research. Furthermore the questionnaires used in this research were developed by my
supervisors, which were of course very helpful in my research. I would to thank my second supervisor
Dr. Jeroen Meijerink for his part in this. Furthermore I would also like to thank him for additional
feedback and mostly for his help in my statistical analysis.
Secondly I would like to thank David Molenaar for the opportunity to perform this research at
Benchmark Electronics. He gave me support and a place to work on my thesis. I would also like to thank
the other employees of Benchmark Electronics for the participation in my research.
I would also like to thank my family, family-in-law and friends for support. Firstly my family and family-
in-law for a listening ear and moral support during this process. My friends I would like to thank for the
many activities we do to ensure I have fun during this period. Especially the tradition of weekly special
beers on Sundays was the highlight of my week.
A special thanks goes out to my boyfriend, who helped me through the ups and downs during this
research and who was always there to support me and motivate me. I image it might not always have
been easy to hear me complain but it was the outlet I needed to go on. So thank you for that:)
Caitlin Vermeul
September 2014
4
Abstract
This thesis uses attribution theory to investigate how the perceived motivation behind HR practices
influences employee behavior. By looking at what employees perceived as the reason why certain HR
practices are implemented, the influence on HRM co-production will be studied. HRM co-production is
defined as the active involvement of employees in HR practices. When employees perceive that an HR
practice is executed for reasons not beneficial for employees, but because of reasons of cost cutting,
exploiting employees or because the organization is ordered to do so by its foreign headquarters, the
level of active involvement in these HR practices will be low for employees. Using social exchange theory
it is argued that the level of HRM co-production further determines the perceived HR intensity and
eventually job performance. Such that when employees are actively involved in the delivery of HR
practices, their perceived HRM intensity will be higher. And when employees perceive a strong HRM
intensity, they will feel obligated to reciprocate to the organization by increasing their job performance.
Next to these individual measures, a line manager perspective will be used with internal and external HR
implementation attributions as moderator between employee HR attributions and HRM co-production.
The research question to be answered with the help of these hypothesized relations is:
“To what extent do employees’ and line managers’ HR attributions influence co-production and job
performance?”
The research methods that are used are mostly quantitative and for small part qualitative. The analyses
are performed on an individual and line manager level. Employees and line managers were asked to fill
in questionnaires. Line managers of each department were also asked to take part in focus group
sessions which had HR implementation attributions as topic. The data analysis showed support for the
hypothesized relation between HRM co-production, perceived HR intensity and job performance, such
that a high level of HRM co-production leads to a high level of perceived HR intensity. In turn a high level
of perceived HR intensity leads to a higher job performance. Unfortunately there was no support found
for the relation between employee HR attributions and HRM co-production. There was also no support
for HR implementation attributions as moderator between this relationship.
The main implication of this thesis is the significant relation of HRM co-production with perceived HR
intensity. This construct proved to be a viable concept for further research. Research on other
predecessors and antecedents is strongly recommended. Other theoretical and practical implications,
limitations and future research possibilities are discussed the final section of this thesis.
5
Table of Contents
Acknowledgements ....................................................................................................................................... 3
Abstract ......................................................................................................................................................... 4
Introduction .................................................................................................................................................. 7
Problem statement ................................................................................................................................... 7
Research goal and research question ....................................................................................................... 9
Relevance of this study ............................................................................................................................. 9
Thesis outline .......................................................................................................................................... 10
Theoretical Framework ............................................................................................................................... 11
Employee attributions ............................................................................................................................ 11
HRM co-production ................................................................................................................................. 13
HRM implementation attributions ......................................................................................................... 15
Perceived HRM intensity ......................................................................................................................... 18
Job performance ..................................................................................................................................... 19
Research model ...................................................................................................................................... 20
Methodology ............................................................................................................................................... 22
Benchmark Electronics ............................................................................................................................ 22
Research design ...................................................................................................................................... 22
Sample..................................................................................................................................................... 23
Conceptualization and operationalization .............................................................................................. 24
Procedure ................................................................................................................................................ 31
Data analysis ........................................................................................................................................... 31
Results ......................................................................................................................................................... 33
Validation of research design ................................................................................................................. 33
Descriptive statistics ............................................................................................................................... 34
Sample ................................................................................................................................................. 34
6
Mean, standard deviation and correlations ....................................................................................... 35
Model testing .......................................................................................................................................... 37
Focus group sessions .............................................................................................................................. 42
Internal implementation attributions ................................................................................................. 42
External implementation attributions ................................................................................................ 43
Discussion.................................................................................................................................................... 48
Theoretical and practical implications .................................................................................................... 48
Limitations .............................................................................................................................................. 50
Future research ....................................................................................................................................... 52
Conclusion ................................................................................................................................................... 53
Appendix A: Questionnaire items in Dutch ................................................................................................. 56
Questionnaire 1: Employee HR Attributions ....................................................................................... 56
Questionnaire 2: Employee HRM Co-production ............................................................................... 58
Questionnaire 3: Perceived HR intensity and Job Performance ......................................................... 59
Questionnaire Line Managers: HRM Implementations Attributions .................................................. 61
Appendix B: Questionnaire items in English ............................................................................................... 63
Questionnaire 1: Employee HR Attributions ....................................................................................... 63
Questionnaire 2: Employee HRM Co-production ............................................................................... 65
Questionnaire 3: Perceived HR intensity and Job Performance ......................................................... 66
Questionnaire Line Managers: HRM Implementations Attributions .................................................. 68
Appendix C: Coded interview results in Dutch ........................................................................................... 70
References .................................................................................................................................................. 76
7
Introduction
Globalization, profitability through growth, technology, intellectual capital and continuous change are
well known critical challenges that modern organizations face (Ulrich, 1998, pp. 126-127). Next to these
five challenges the global crisis has had a major impact on organizations as well. Especially this last
challenge can make it difficult for organizations to remain profitable. Various studies have already
shown how the HR department can have a positive influence on performance (Klein & Kozlowski, 2000;
Meyer & Smith, 2000; Purcell & Hutchinson, 2007). This can be achieved through the effective execution
of HR activities. The goal of this thesis is not to contradict these findings, but rather to elaborate on
them. We argue that the relationship between HRM and performance has been depicted too simplistic
in earlier research. Therefore this thesis will try to further elaborate on what happens between HR
practices and performance, by looking at employee attributions. It is argued that the attributions
employees have on HR practices, will determine the level of participation in these practices. This last
concept has been defined as HRM co-production. To study these concepts an individual perspective has
been used.
Problem statement
Research on HR practices and performance has shown that the relationship between these constructs is
not always straightforward (Paauwe & Boselie, 2005). However the perceptions employees have of why
certain HR practices are offered by the organization has not been fully studied yet. Even though it is
likely this will have an effect on the performance measures. Attribution theory is used to understand
what employees see as the motivation for several HR practices. Heider (1958) is one of the main
founders of attribution theory. According to Heider (1958) people can perceive the causes of each
other’s behavior, which tends to have an influence on their own behavior. In the case of HR practices,
employees can perceive the motivation to use a certain HR practices.
Following the theory of planned behavior (Ajzen, 1991) we hypothesize that the perceptions employees
have of HR practices can have an influence on the level of HRM co-production. HRM co-production is
about the active involvement employees themselves have in the delivery of HR practices. It is often
assumed that when the right HR practices are offered in organizations, employees will simply make use
of them and some type of performance will increase. This thesis argues that the level of active
involvement employees have in HR practices will be a strong determinant of the level of performance. In
other words, when employees perceive that an HR practice is executed for reasons not beneficial for

8
employees, but because of reasons of cost cutting, exploiting employees or because the organization is
ordered to do so by its foreign headquarters, the level of active involvement in these HR practices will
be low for employees. Therefore these HR practices will not have the expected effect on performance,
as former research has argued.
Attribution theory focuses not only on causal explanations for others’ behavior, but also for one’s own
behavior or episodic events (Nishii, Lepak, & Schneider, 2008, p. 7). Following this line of thought line
managers’ implementation constraints are translated into internal and external implementation
attributions. Line managers HR attributions are used as moderator between employee HR attributions
and HRM co-production because both employees and line managers are involved in this relationship, in
such a way that employee HR attributions look at the ‘why’ behind HR practices, while line managers’
HR attributions are on the implementation of HR practices. In the last few years it has become generally
accepted that line managers play a crucial part in the HRM performance relationship, because they have
gained responsibilities in the execution of HR activities. The degree to which line managers can do this
effectively, can have a large influence on firm performance (Alfes, Truss, Soane, Rees, & Gatenby, 2013;
Farndale & Kelliher, 2013; Kulik & Perry, 2008). McGovern, Gratton, Hope‐Hailey, Stiles, and Truss (1997,
p. 16) summarize two important findings in their research on HRM at the line management level. The
first is that the devolvement of HR practices to line managers does not mean that this is done
consistently by all managers in the same organization. The second finding is that the quality of these
practices is not always as intended by HR professionals. We expect that especially the internal
implementation attributions will have a moderating effect on the relationship between employee HR
attributions and the level of HRM co-production.
In order to get a clear picture of the influence of these constructs have on job performance, the
perceived HRM intensity will also be taken into account using social exchange theory. Social exchange
theory states that when employees feel valued by their organization, they are willing to put more effort
into their work and have a more positive attitude and behavior. For this research this means that when
employees have a high level of HRM co-production, the perceived level of HRM intensity will be higher
as well. Finally it is expected that this higher level of perceived HRM intensity will lead to a better job
performance. This means that simply executing several HR practices, of which it was found that they
increase performance, might not be enough for organizations. Organizations can provide all tools and
time necessary for a certain HR practice, but without some co-production from the employees, the HR
practice will unlikely be effective.
9
Research goal and research question
The goal of this research is to further investigate the relationship between HRM and performance by
focusing on three aspects; taking a mainly individual perspective, taking the employee perceptions into
account and investigating the influence of HRM co-production of employees. This relationship will be
investigated by studying how employees’ attributions of HR practices influence the results on HRM co-
production. Once this is established the level of line managers’ HRM implementation attributions will
also be taken into account. By looking at what employees perceive is the motivation behind HR practices
and what attributions line managers have of HR practices, the influence on HRM co-production will
become clear. Finally the effect of HRM co-production of perceived HR intensity and job performance
will also be investigated.
After the data analysis an advice will be written for the organization under study, in which will be
explained what this organization can do to improve its job performance. It is expected that the
difference between internal and external HR attribution will lead to a respectively higher and lower level
of HRM co-production by employees. A higher level of HRM co-production will lead to a higher
perceived HR intensity and consequently a higher job performance. Existing research has mainly focused
on a direct link between some HR performance measure and an organizational outcome measure. This
research attempts to explain this relationship further by looking at different concepts. A research
question has been formulated that acts as a guide for this thesis:
“To what extent do employees’ and line managers’ HR attributions influence co-production and job
performance?”
Relevance of this study
The theoretical relevance of this study lies in the new concept of HRM co-production. The hope is that
measurements of this concept can provide new insights which can make a valuable contribution to
existing research. The main focus of this thesis will be on HRM implementation. This research attempts
to develop insights on how to improve HRM implementation by studying employees’ and line managers’
HR attributions and their effect on HRM co-production, because we believe these factors are essential
for a successful HRM implementation and job performance, because employees perceive HR practices
that help them to perform well in their job.
There has been a call to use different levels of analysis to describe the relationship between HRM and
performance (Bowen & Ostroff, 2004; Gerhart, 2005). Therefore this research will look at an individual

10
and line manager level by asking employees and line managers about their HR attributions and HRM co-
production level. Former research has mainly focused on HR professionals in executing HR practices
which has resulted in evidence on the ‘intended’ HRM instead of the actually ‘implemented’ HRM (Khilji
& Wang, 2006). Due to the increased responsibilities of line managers in executing HR activities, such as
performance appraisal, recruitment and absenteeism (Renwick, 2003), it has become highly relevant to
study their influence on this relationship as well.
The practical relevance of this study is that by understanding how employee attributions can influence
job performance, and by finding evidence on HRM co-production, organizations can better understand
why certain HR practices do or do not work for their organization. When they understand this, they will
be able to improve the HRM implementation by solving problems in these areas. The qualitative data
will also serve as an important input for advice towards the organization under study.
Thesis outline
In the next section a theoretical framework is given. For this section an literature study has been done to
find out what is already known on employee HR attributions, HRM co-production and line manager
constraints. Attention will also be paid towards perceived HRM intensity and job performance using
social exchange theory. Hypotheses are formulated which will further guide this thesis. This section is
concluded with a research model and an explanation of this model. In the third section the methodology
is described, in which the research design is explained. Following this the sample and procedures of the
research are given. This section will be concluded with the operationalization of the main concepts and
an explanation of the data analysis. In the analyses and results section the research design will be
validated, after which the descriptive statistics are given. Finally the model will be tested through a
series of hierarchical multiple regression analyses and linear mixed model analyses. The qualitative data
will be analyzed with a theory-driven content analysis. The final chapters of this thesis contain the
conclusion and discussion of these results. Here the implications, limitations and further research
options are discussed.

11
Theoretical Framework
In order to perform a proper research, it is important to study theory and findings that are already
discovered on relevant concepts. For this reason attribution theory is first explored. This theory will be
explained and findings on this theory in organizations are summarized. Secondly co-production is
explained and adapted for its use in the field of HRM. Thirdly HRM implementation attributions are
elaborated on. These attributions determine how effective line managers can implement HR practices.
Finally perceived HRM intensity and job performance are described following social exchange theory.
Employee attributions
Attribution theory has been pointed out as a possible theory to further explain the effect of HR practices
(Martinko, Harvey, & Dasborough, 2011; Nishii et al., 2008). In the introduction it was already explained
that according to attribution theory states people can perceive the causes of each other’s behavior
(Heider, 1958). It is expected that if people can perceive reality differently, employees can interprete HR
practices differently as well (Nishii et al., 2008). In this thesis attribution theory is used to explain
employees’ interpretations of HR activities.
The number of studies on attribution theory in organizations is still very limited. Martinko, Harvey, and
Dasborough (2011) acknowledge this when they say that although attribution theory can explain a
significant proportion of goal and reward oriented behavior of employees (17 to 36 per cent), there is
still an inadequate amount of attention paid to it by organizational sciences (Martinko et al., 2011, p.
146). Some examples of HRM research which used attribution theory are given. Bowen and Ostroff
(2004) used attribution theory when they tried to determine the ‘HRM system strength’. They state that
the HRM system is perceived as strong by the employee when it is high in distinctiveness, consistency
and consensus. When there is a strong HRM system it can enhance organizational performance by
creating “shared meanings in promotion of collective responses that are consistent with organizational
strategic goals” (Bowen & Ostroff, 2004, p. 213). Another research on this topic is done by Sanders et al
(2012), in their study they found that employees’ intention to innovative behavior and their effective
commitment will increase when the high commitment HRM is considered distinctive, consistent and
consensual (Sanders et al., 2012, p. 22). Attribution theory is also used to explain the relationship
between organizational citizenship behavior (OCB) and job satisfaction (Tepper, Duffy, Hoobler, &
Ensley, 2004). OCB is positively related to employees’ job satisfaction and affective commitment when
abusive supervision was low. In this case non abused employees perceived coworkers’ OCB to be well
intentioned actions. However when abusive supervision was high, OCB is negatively related to
12
employees’ job satisfaction. In this case the abused employees perceived coworkers’ OCB as being self-
serving (Tepper et al., 2004, p. 462). This research will use attribution theory to explain its effect on the
level of co-production employees exert in the execution of HR practices.
In a study on the diagnosis of employee performance by supervisors, it was found that when
performance was effective, internal attributions (ability and effort) are significantly higher for members
of the same group than members outside the group. However when the performance was ineffective,
internal attributions were significantly higher for member outside the group than for members in the
same group (Heneman, Greenberger, & Anonyuo, 1989, p. 471). These findings show that the
relationship between a leader and its subordinate has a significant impact on the attributions these
leaders make concerning diagnosis of employee performance (Heneman et al., 1989). There was no
significant relationship found for the external attributions. Heneman et al. (1989, p. 473) explain this
finding by noting that luck, an external factor, is difficult to observe and perhaps not directly linked to an
individuals’ performance.
As it can be seen, the use theory of attribution is very broad and sometimes explained in different ways.
This thesis follows the example by Nishii et al. (2008), who differentiate between internal and external
HR attributions to measure what employees perceive is the motivation to use certain HR practices. They
argue that the attributions employees make about the motivation of HR practices that are applied, can
have an effect on the employee behavior and attitudes, and following this employee performance. HR
attributions is defined here as “causal explanations that employees make regarding management’s
motivations for using particular HR practices”, and argue that “employees’ HR attributions have
important consequences for their commitment and satisfaction” (Nishii et al., 2008, p. 9). In this
reasoning they differentiate between two internal HR attributions with a positive result on employee
attitudes, namely HR practices designed to enhance service quality and employee well-being. They also
differentiate between two internal HR attributions with a negative result on employee attitudes, namely
HR practices designed to enhance cost reduction and exploiting employees (Nishii et al., 2008, p. 6).
There is also an external HR attribution recognized, namely compliance with union requirements.
External attributions however appeared to be less suited to predict in future behavior, because they
tend to change more often. The interpretations employees have of a certain HR practice and the
following HR attribution they have, can be different for each employee (Nishii et al., 2008).
A key tension for companies with a foreign headquarter, like Benchmark Electronics, is “how to balance
the pressures for globally standardized policies across their operations with the need to be responsive to
13
local (national) conditions” (Edwards & Kuruvilla, 2005, p. 2). Reasons for MNCs to strive for consistency
in HR practices between its subsidiaries are to create a common corporate culture, to enhance the
equity and procedural justice and to manage the external legitimacy of the MNC as a whole (Björkman &
Lervik, 2007, p. 320). Another reason for MNC to pursue uniformity in HR practices amongst subsidiaries
is to ensure these practices are contributing to the global business strategy (Edwards & Kuruvilla, 2005).
An important reason to choose for a local approach is that MNCs have to be sensitive to the values and
attitudes of the subsidiary country; this is also referred to as ‘multi-culturalism’ (Edwards & Kuruvilla,
2005, p. 7). A downside of enforcing HR practices towards its subsidiaries is that the implementation is
not always successful (Björkman & Lervik, 2007). The concept of the internal and external HR attribution
by Nishii et al. (2008) will form the basis of the employee attribution construct in this thesis. However
the measures for the external attribution measures will be adapted to make it suitable for measurement
at Benchmark Electronics. Therefore instead of looking at union influence as an external attribution,
implementation enforced by headquarters will be the focus for external attribution. The thought behind
this is that when employees perceive that HR practices are enforced by headquarters, employees are
less willing to co-produce this practice.
HRM co-production
According to the concept of co-production customers have a task in the production of a service, namely
that as a worker. The customer can be required to give information and put in some effort before a
service can take place (Kelley, Donnelly, & Skinner, 1990, p. 315). According to the service dominant
logic, a customer is always embedded in the service offering and is therefore responsible for the value
added to the process (Ordanini & Pasini, 2008, p. 289). The more customers are co-producers of a
product/service, the larger their influence can be on the quality of this product/service (Lengnick-Hall,
1996). A customer can participate on several parts of the production process, which can be a direct or
indirect contribution. Product design, production scheduling, quality assurance and delivery are
contributions that have a direct impact on the production and are most commonly used (Lengnick-Hall,
1996, p. 802). An example of a service in which the customer is a co-producer is a restaurant where you
prepare your own meal. In some Chinese restaurants the customer can choose which ingredients they
want, place them on a plate and give them to a cook to prepare it. Without the customer the meal will
not be made, therefore the customer is a co-producer in this process. Benefits of customer co-
production are said to be twofold. On the one side costs can be lower for organizations where
customers partially help in the production of services; therefore the price for customers can be lowered

14
as well. On the other side services can be customized because customers are helping in the production
of the services and goods (Auh, Bell, McLeod, & Shih, 2007, p. 360; Kelley et al., 1990). The Chinese
restaurant is a great example of this.
In the same way customers are co-producers of a service, it is expected that employees are co-
producers in the service that is HRM. Take for example training as an HR practice. The HR department
can provide employees with all the tools and time necessary for training and development of their
employees. But at the end of the day it is the employees themselves who have to actively participate
and pay attention during the training. Therefore employees are a co-producer in this HR practice. This
concept is still new and therefore literature on HRM co-production does not exist yet. However some
literature on the concept of job crafting is available. Job crafting entails the proportion of work
employees can modify “to add meaning, meet personal needs, or impact others the worker cares about”
(Hornung, Rousseau, Glaser, Angerer, & Weigl, 2010, p. 190). It can also be seen as “the changes that
employees make to balance their job demands and job resources with their personal abilities and
needs” (Tims, Bakker, & Derks, 2012, p. 174). Job crafting can be done by employees why try to make
sense of their work roles, for example by trying a different way to perform a task, by adding a new
activity or dropping a duty (Hornung et al., 2010, p. 190). Hornung et al. (2010) found that when there
was a high leader-member exchange (LMX) workers can make their jobs more challenging, self-
determined and less stressful. It is argued that every employee may be able to craft their job (Tims et al.,
2012, p. 175). Similar to crafting a job, we argue that employees can also partially craft the way HR
practices are implemented by becoming actively involved in the delivery of these practices.
The theory of planned behavior explains that the intention to perform behavior is largely determined by
the attitude towards certain behaviors. In this thesis it is argued that the attitude towards HR practices
is determined by the employees’ HR attributions. HR practices can be offered by organizations for
several reasons, either to enhance service quality and employee well-being, to reduce costs and exploit
employees or because the organization is required to by corporate headquarters. According to
attribution theory, employees perceive a motivation behind HR practices and it is therefore likely that
these attributions will determine their attitude towards these HR practices. Following the theory of
planned behavior it is expected that when HR practices that are offered to employees for beneficial
reasons such as enhancing service quality and employee well-being, the attitude towards these HR
practices will be positive and therefore employees will implement these HR practices better. The other
way around it is expected that when HR practices that are offered to employees for negative reasons
15
such as reducing costs and exploiting employees, the attitude towards these HR practices will be
negative and therefore employees will not implement these HR practices as effectively as in the former
situation. Finally it is expected that when HR practices are offered because they are required to by
headquarters, the attitude towards these HR practices will be negative as well. As was mentioned in the
previous section, the implementation of HR practices enforced by headquarters towards its subsidiaries
is not always successful (Björkman & Lervik, 2007). Björkman and Lervik (2007, pp. 321-322) propose
three criteria for a successful transfer of HR practices from headquarters to subsidiaries, namely
implementation, internalization and integration. In order for an HR practice to be successfully
transferred from HQ to its subsidiary, an organization has to overcome these three obstacles. Because
this is something that does not come naturally for every organization, it is expected that HR practices
offered for an external reason will lead to a negative attitude in employees. In short it is expected that
employee HR attributions will determine their behavior. Behavior is seen here as the level in which
employees actively participate in the delivery of HR practices. The following hypotheses are formulated:
Hypothesis 1: When employees perceive that HR practices are offered to enhance service quality
and employee well-being the level of HRM co-production will be higher.
Hypothesis 2: When employees perceive that HR practices are offered in management interest to
reduce costs and exploit employees the level of HRM co-production will be lower.
Hypothesis 3: When employees perceive that HR practices are offered because they are required
to by corporate headquarters the level of HRM co-production will be lower.
HRM implementation attributions
Over the last few decades the role of the line manager has changed from an operational supervision role
towards a more strategic business management role. This is also called ‘devolvement’, a term that has
been around since the early 90’s (Brewster, HoltLarsen, & Trompenaars, 1992). For this role line
managers have become increasingly performance orientated (Hales, 2005, p. 472) and tend to perform
more human resource activities. Examples of tasks being devolved to line managers are performance
appraisal, redundancy selection, recruitment, communication and counseling of employees and sickness
absence (Renwick, 2003, p. 266). The reason for this change is given by Renwick (2003) who explains
that HR work is shared with line managers “to reduce costs, to provide a more comprehensive approach
to HRM, to place responsibility for HRM with managers most responsible for it, to speed up decision
making, and as an alternative to outsourcing the HR function” (Renwick, 2003, p. 262). Another benefit
of devolving activities to the line is that HR specialists are now free to focus on large-scale organizational
16
change efforts and developing policies (Kulik & Perry, 2008, p. 544). A research by Valverde, Ryan, and
Soler (2006) show the increase of HR function towards line managers. In over one-third the line
managers had a prominent role in the execution of certain HR activities. The main HR activities they
performed are operational decisions and daily people management and service delivery (Valverde et al.,
2006, p. 627).
Kulik and Perry (2008) found that devolution has had a positive effect on the image of line managers in
HR units. Devolution also provided an opportunity to “increase the HR units’ overall responsibility,
integration with other organizational units and involvement in strategic planning” (Kulik & Perry, 2008,
p. 550). However, it has been argued that the role of line manager does not come naturally for
everyone. It was often seen that the way HR polices are implemented differ from manager to manager.
The quality delivered also tends to differ strongly between line managers and between organizations
(McGovern, Gratton, Hope‐Hailey, Stiles, & Truss, 1997). It is also said that devolvement has a positive
and a negative side to it. On the one hand line managers are able to respond quickly to ‘local’ problems
while the HR specialists are free to focus on strategic issues. On the other hand line managers may
undermine organizational effectiveness because they are not able to execute HR issues as effectively as
the HR specialists (Ryu & Kim, 2013, p. 948). Another negative side effect of devolvement of HR activities
to line managers is that the position of the HR department itself becomes less strategic (Reichel &
Lazarova, 2013, p. 937).
Bos-Nehles (2010) did research on the factors that can be seen as the main constraints on effective HR
implementation at a line management level. There are five constraints researchers reported that line
managers frequently experience, namely (the lack of) desire, capacity, competencies, support and policy
and procedures (Bos-Nehles, 2010, p. 16). It has been claimed that the line managers have a lack of
desire to execute HR activities, this lack of desire can come forth from a lack of personal or
institutionalized incentives (Bos-Nehles, 2010, p. 17). Line managers can also experience a lack of
capacity, in this case line managers do not have enough time to successfully implement HRM (Bos-
Nehles, 2010, p. 17). A lack of competencies means that line managers experience a lack of specialist
knowledge and skills for HR activities (Bos-Nehles, 2010, p. 17). Some line managers feel that there is a
lack of support. In this case there is no support from HR specialist to provide advice and coaching for line
managers (Bos-Nehles, 2010, p. 18). Finally there can be a lack of policy and procedures. To coordinate
HR practices a clear overall HR policy and procedures should be in place (Bos-Nehles, 2010, p. 18). She
found that from these five constraints, three are significant for HRM effectiveness. The more capacity,
17
competencies, support from HR professionals line managers have, the more effectively they can
implement HR practices (Bos-Nehles, 2010, p. 118). So support from HR professionals is important in the
effective execution of HR practices. Another interesting finding is that in contradiction to former
research, line managers actually appeared to be effective in implementing HR practices on the work
floor and are less constrained in their work than previous literature has suggested. In other words, line
managers have learned to accept their role and indeed have the desire to execute HR practices (Bos-
Nehles, 2010). A similar effect was found in Whittaker and Marchington (2003, p. 245), they found that
“line managers are satisfied with the HR responsibilities that have been devolved to them and are keen
to take on activities that relate explicitly to the development of their team”. They also report that a lack
of support from HR professionals forms a constraint on line managers effectiveness (Whittaker &
Marchington, 2003, p. 245). Attribution theory can be used to study the “causal explanations for one’s
own behavior, others’ behavior, or episodic events” (Nishii et al., 2008, p. 7). Therefore the five
constraints line managers frequently experience in the execution of the HR activities will be used in this
thesis to measure line managers’ HRM implementation attributions. The five constraints are measured
in relation to the attributions employees make about the implementation of these HR practices. The five
constraints desire, capacity, competence, support and policy and procedures will be studied as a
moderator between employee attributions of HR practices and the level of HRM co-production of
employees. In order to explain why someone behaved in a specific way is whether the “locus of causality
is internal or external to the person. When the behavior is thought to have been caused by dispositional
(internal) factors, the behavior is more informative, and is believed by perceivers to be a more reliable
predictor of future behavior “ (Nishii et al., 2008, p. 8). We argue that for the constraints as perceived by
the line managers, the same distinction can be made. For desire and competence the ‘locus of causality’
lays within the person, therefore these implementation constraints are translated into the internal
implementation attributions. For capacity, support and policy & procedures the ‘locus of causality’ lies
outside the person, and are therefore translated into the external implementation attributions.
It is expected that when employees have positive HR attributions and line managers attribute HR
implementation internally, employees will co-produce more. But when employees have negative HR
attributions and line managers attribute HR implementation internally, employees will co-produce less.
This relationship is expected because when line managers have a lack in competencies or desire,
implementation of HR practices will be less efficient. The consequence of this is that employees will be
less inclined to further implement these practices themselves. It is expected that this moderating effect
18
will only be present with internal HRM implementation attributions and not with external HRM
implementation attributions.
Hypothesis 4: HRM implementation attributions will have a positive effect on the relationship
between employee HR attributions and co-production, such that it will be higher for internal
attributions than for external attributions.
Perceived HRM intensity
According to social exchange theory a person will feel obligated to reciprocate when they are treated
well by another person. For HRM this means that employees’ attitudes and behavior can be positively
influenced by giving them the feeling that the organization values their contributions (Gilbert, De Winne,
& Sels, 2011, p. 1618). Several studies have found prove for this theory (Alfes, Truss, Soane, Rees, &
Gatenby, 2013; Gilbert, De Winne, & Sels, 2011; Paré & Tremblay, 2007; Settoon, Bennett, & Liden,
1996; Whitener, 2001). Social exchange theory can be conceptualized as perceived organizational
support, which is described as how “employees form a global belief concerning the extent to which the
organization values their contributions and cares about their well-being” (Settoon et al., 1996, p. 220). A
high level of organizational support will lead to individuals feeling obligated to repay the organization.
This current study will follow this conceptualization of social exchange theory to explain how a high level
of HRM co-production will lead to a strong perceived HRM intensity and a higher job performance. The
logic behind this is that when employee are acting as co-producer of HR activities, it is likely that the
perceived HRM intensity will be higher than for those employees who are not co-producers of HR
activities. Following social exchange theory a strong perceived HRM intensity will give employees the
feeling that the organization values their contributions. A strong perceived HRM intensity will therefore
lead to a higher job performance. First the concept of perceived HRM intensity will be further explained
in this section. In the following section the concept of job performance will be elaborated on.
The intensity of HR practices as perceived by the employees is likely to have a stronger effect on job
performance than when one would only measure the presence or absence of HR practices. The intensity
of HR practices looks at how thoroughly HR practices as a whole are perceived in the organization (Sels
et al., 2006, p. 90). To understand why it is not enough to simply measure the presence of HR practices
the difference between intended HR practices and implemented HR practices (Purcell & Hutchinson,
2007) is explained. The formally stated HR practices as intended by the HR professionals can differ
significantly from the actually implemented HR practices as perceived by the employees (Gerhart, 2005).
19
The influence of employees’ perceptions of HR practices is tested on several variables. Den Hartog,
Boon, Verburg, and Croon (2013) did research on the link between perceived HRM by managers and
employees and several HR related outcomes. They found that the perceived HRM by employees
mediates the relationship between both manager-rated HRM and job satifcation, and manager-rated
HRM and perceived unit performance. Therefore this thesis will look at how HR practices are perceived
by the employees.
It becomes clear that employee perceptions of HR practices are more useful for studying the effect they
have on job performance. HR professionals can have certain intentions with HR practices, but whether
or not these intentions are realized depends heavily on the perceptions employees have. Following this
line of thought this research also looks at intensity of the HR practices. This means that not only the
perceived presence of HR practices is measured, but also how thoroughly HR practices as a whole are
perceived in the organization (Sels et al., 2006, p. 90). It is argued that when employees are actively
involved in the delivery of HR practices, their perceived HRM intensity will be higher. However when
employees are not actively involved with the delivery of HR practices, their perceived HRM intensity will
likely be lower. In a similar fashion that an employee wants to reciprocate to the organization when they
feel valued by the organization (Gilbert et al., 2011), the opposite relation might be expected as well.
When the organizations feels like an employee is contributing to the organization by being actively
involved in the implementation of HR practices, the organization may want to reciprocate by offering
him more HR practices. It can also be argued that the active participation in implementing HR practices
will lead to more attention and recognition towards HR practices. Some employees might not recognize
the HR practices that are offered to them, because they never used them. But when employees co-
produce these HR practices, the recognition will likely be higher. In both cases the perceived HR
intensity will increase. This leads to the following hypothesis;
Hypothesis 5: A high level of HRM co-production leads to a strong perceived HRM intensity and a
low level of HRM co-production leads to a weak perceived HRM intensity.
Job performance
There has been a significant amount of research on the influence of employee perceptions of HR
practices on several different concepts like satisfaction, intention to leave the organization (Boselie &
Van der Wiele, 2002, p. 11), patient satisfaction (Piening, 2012), financial performance (Choi & Lee,
2013) and employee commitment (Meyer & Smith, 2000; Wright, Gardner, & Moynihan, 2003).

20
However Liao, Toya, Lepak, and Hong (2009) found evidence that individuals can experience HR
practices differently from person to person. This means that an HR practice can be effective for some
employees and less effective for others. Therefore the outcome measure in this thesis will be measured
on an individual level, rather than from a managerial perspective. A difference can be made between in-
role behaviors and extra-role behaviors, this last one is also known as Organizational Citizenship
Behavior (Williams & Anderson, 1991). OCB is the behavior of employees that is not specifically required
by their job, but improves the efficient and effective function of the organization (Williams & Anderson,
1991, p. 601). By looking at the individual task performance and Organizational Citizenship Behavior
(OCB) that is directed at the individual (Kluemper, DeGroot, & Choi, 2013), multiple levels of job
performance can be investigated.
As was explained in the previous chapter, social exchange theory states that a person will feel obligated
to reciprocate when they are treated well by another person. For this research it would mean that when
an organization gives them the feeling that their contributions are valued, they will feel obligated to do
something in return for the organization (Gilbert et al., 2011). Therefore it is argued that when
employees perceive a strong HRM intensity, employees will feel obligated to reciprocate to the
organization by increasing their job performance. When employees perceive a weak HRM intensity,
employees will not feel obligated to reciprocate to the organization and will therefore not increase their
job performance. With social exchange theory in mind the following hypothesis is formulated:
Hypothesis 6: A strong perceived HRM intensity leads to a higher job performance and a weak
perceived HRM intensity leads to a lower job performance.
Research model
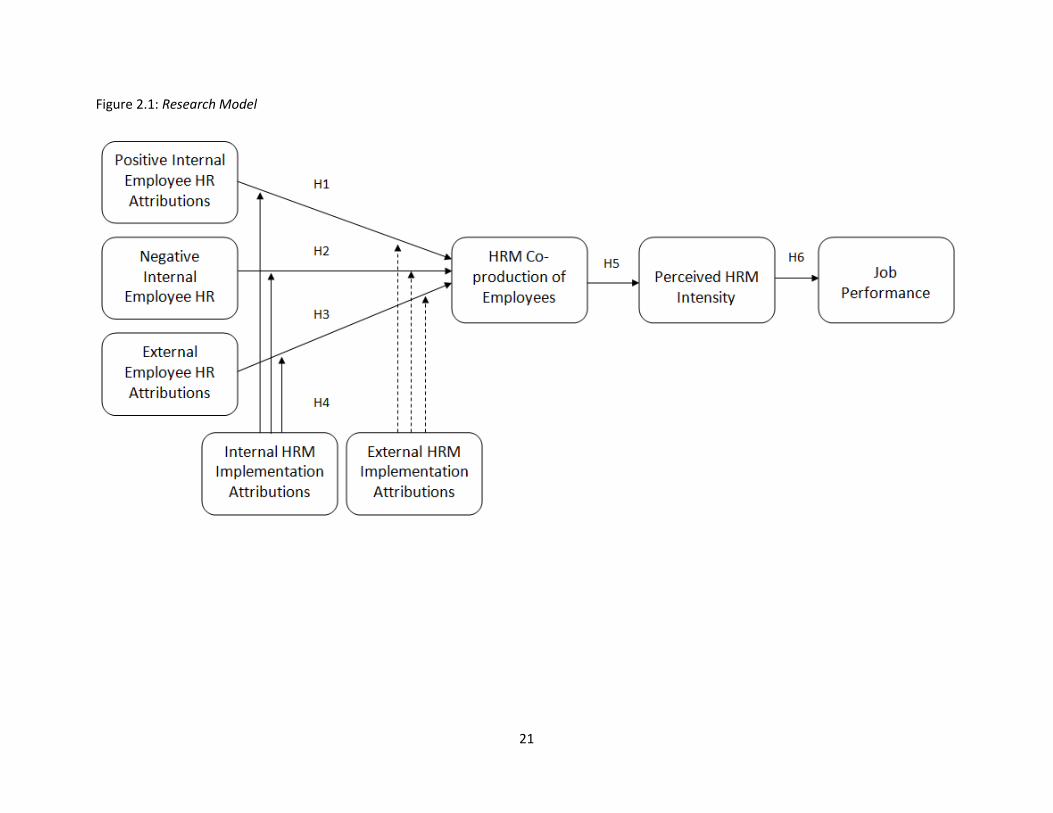
In order to answer the main research question and to test the proposed hypotheses, a research model is
necessary. A research model is a convenient method to explain the relations between concepts and
allows one to see the place of the hypotheses in these relations. The hypotheses will form a guide to set
up the methodology and to test the results. This will form input for the main research question which
will be answered in the conclusion. In figure 3.1 the hypotheses are put together in one model to show
the relations between concepts. This way it can be seen what the places are of the hypotheses in these
relations.
21
Figure 2.1: Research Model
22
Methodology
A well-structured research design ensures that well defined choices are made in the execution of the
actual research and it will allow other researchers to understand and possibly recreate this method. A
non-probability sample is used in one organization to test the hypotheses, namely a purposive sampling
in one organization. In this section the concepts which are measured are defined and operationalized.
Finally the procedure of data gathering is discussed along with the steps in the analysis of the data.
Benchmark Electronics
This study is performed at Benchmark Electronics, a producer of products for OEMs which originates
from Texas, USA. It has 23 locations worldwide and approximately 12.000 employees. The data is
gathered in the Dutch location of this company, which has about 300 employees. This location produces
products for companies in the electronics industry. They complete the whole production process
themselves, from designing, developing and testing through producing and delivering the final products.
In this process they cooperate with other locations of the company as well (Benchmark-Electronics,
n.d.). The company is broadly divided into a production and an engineering side. Both sides consist out
of several teams which are led by a supervisor or line manager respectively.
Not unlike many other organizations, Benchmark Electronics faces several challenges; from the
acquisition of a department from another electronics company, to the demand of line managers and
employees to get job descriptions and a competence model. The main challenge however is how the
two HR advisors can achieve an effective HR implementation, with a limited amount of time. Reviewing
how effective the HR department is can be a useful tool for this organization to see where and how they
can improve their overall HR effectiveness. However when it comes to the implementation of HR
activities, not only the HR advisors but the line managers and even employees themselves can have an
essential role to play. Under the guidance of the HR advisors, all members of the organization together
determine the HRM effectiveness.
Research design
The research proposed in this thesis is mainly an explanatory research. It tries to further explain a
phenomenon that is not entirely clear yet, in this case the role of employees’ HR attributions, HRM co-
production and line managers’ implementation attributions in the HRM-performance link, by using pre-
existing theories. In this case we try to find out how job performance is influenced by perceptions
23
employees have about the motivation for HR practices. In the case of HRM co-production it can also be
said that this research is an exploratory research, because no further theory on this concept has been
published yet.
The main source of data will be from questionnaires. The benefit of a quantitative analyses is that
quantification can make it easier to aggregate, compare and summarize data and of course there is the
possibility of statistical analysis (Babbie, 2010, p. 24). Another benefit is that an answer can be given not
only if there is a relationship between constructs, but also to what extent this relationship exists.
However some of the richness can be lost due to the numerical expressions, therefore qualitative
analyses will be a valuable addition to the data. For qualitative data focus groups sessions will be held
with line managers which will serve as an input to explain results of the line managers’ implementation
attributions. This qualitative data can provide useful insights into the relationship between employee HR
attributions and HRM co-production, by giving line managers the opportunity to discuss the
implementation of HR practices in depth.
The data will be gathered in one organization on several different concepts, therefore this study is a
cross sectional study (Babbie, 2010). There will be a couple of weeks between the different rounds of
questionnaires. These time intervals are included to say something about the direction of the model.
Due to time constraints it was not possible to have a longer period of time between the different
rounds, which would have been better to increase validity of the model.
Sample
In order to test the influence of employees’ HR attributions on job performance the organization is
divided into pre-existing teams. The first direct leader of each team is either called a supervisor or line
manager in this organization, depending whether they work on the production or engineering part of
Benchmark Electronics. The main focus of this research will be on the individual level, therefore the
questionnaires will be sent out mainly to the employees and all measures will be measured from an
individual level. The questionnaires will be sent out in three rounds, with a period of two weeks in
between, so causality can be assumed when explaining the results. The subjects will be on employee HR
attributions (T1), HRM co-production (T2), perceived HR practices and job performance (T3). Next to
these questionnaires the line managers and supervisors of the respective teams will be asked to fill in a
questionnaire on the HRM implementation attributions (T1) and the HRM co-production of employees
(T2).
24
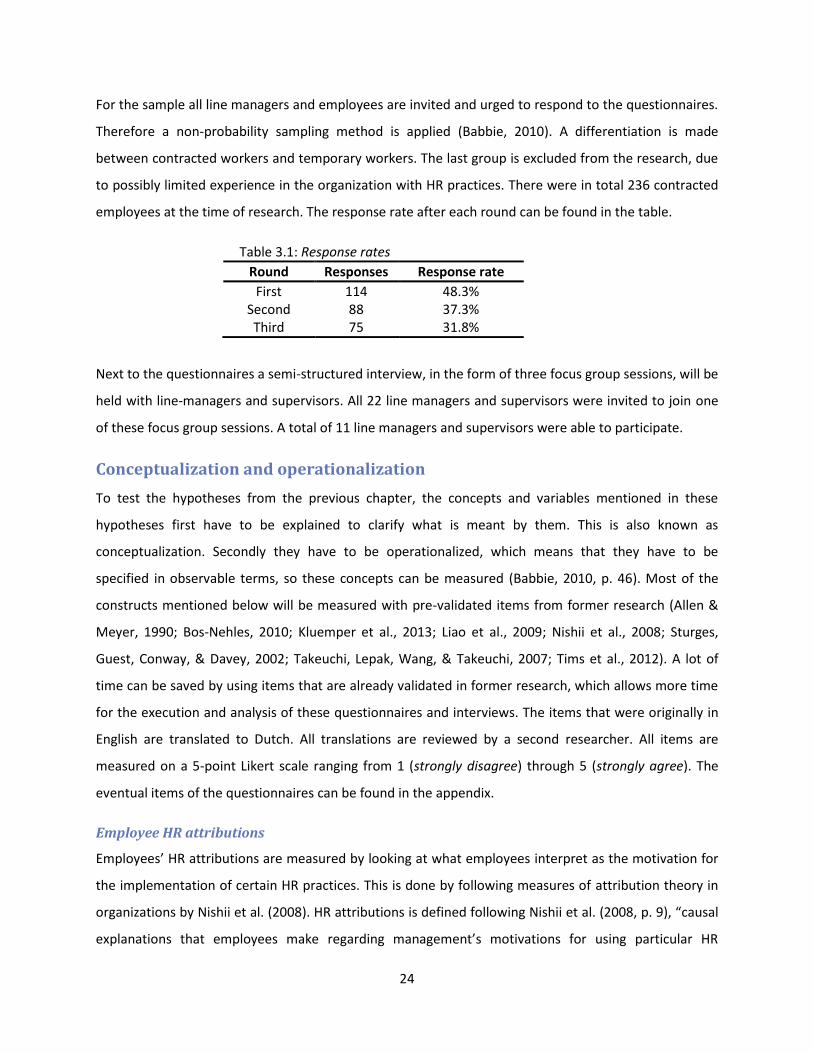
For the sample all line managers and employees are invited and urged to respond to the questionnaires.
Therefore a non-probability sampling method is applied (Babbie, 2010). A differentiation is made
between contracted workers and temporary workers. The last group is excluded from the research, due
to possibly limited experience in the organization with HR practices. There were in total 236 contracted
employees at the time of research. The response rate after each round can be found in the table.
Table 3.1: Response rates
Round Responses Response rate
First 114 48.3% Second 88 37.3% Third 75 31.8%
Next to the questionnaires a semi-structured interview, in the form of three focus group sessions, will be
held with line-managers and supervisors. All 22 line managers and supervisors were invited to join one
of these focus group sessions. A total of 11 line managers and supervisors were able to participate.
Conceptualization and operationalization
To test the hypotheses from the previous chapter, the concepts and variables mentioned in these
hypotheses first have to be explained to clarify what is meant by them. This is also known as
conceptualization. Secondly they have to be operationalized, which means that they have to be
specified in observable terms, so these concepts can be measured (Babbie, 2010, p. 46). Most of the
constructs mentioned below will be measured with pre-validated items from former research (Allen &
Meyer, 1990; Bos-Nehles, 2010; Kluemper et al., 2013; Liao et al., 2009; Nishii et al., 2008; Sturges,
Guest, Conway, & Davey, 2002; Takeuchi, Lepak, Wang, & Takeuchi, 2007; Tims et al., 2012). A lot of
time can be saved by using items that are already validated in former research, which allows more time
for the execution and analysis of these questionnaires and interviews. The items that were originally in
English are translated to Dutch. All translations are reviewed by a second researcher. All items are
measured on a 5-point Likert scale ranging from 1 (strongly disagree) through 5 (strongly agree). The
eventual items of the questionnaires can be found in the appendix.
Employee HR attributions
Employees’ HR attributions are measured by looking at what employees interpret as the motivation for
the implementation of certain HR practices. This is done by following measures of attribution theory in
organizations by Nishii et al. (2008). HR attributions is defined following Nishii et al. (2008, p. 9), “causal
explanations that employees make regarding management’s motivations for using particular HR

25
practices”. HR attributions are divided into internal HR attributions and external HR attributions, as is
customary in attribution theory (Heider, 1958). The items for the internal HR attributions are based on
Nishii et al. (2008), because these proved to accurately measure the individually perceived motivation
behind HR practices. Union compliance was measured by Nishii et al. (2008) as an external HR
attribution, however looking at a MNC external HR attribution is changed to measure HR practices that
come from headquarters because this is believed to be a stronger external force for a MNC. The
operationalization for the questionnaire can be found in table 3.2. This research added a couple of HR
practices to those of the research by Nishii et al. (2008) for a more complete picture. These are several
commonly performed HR practices, of which the HR advisor at Benchmark Electronics agreed were
relevant for his organization as well. These practices are performing administrative tasks, personnel
planning, recruitment and selection, appraisal, compensation and guidance (Bos-Nehles, 2010). Often
stated high performance work practices are used as well, namely training, information sharing and
employee participation. These items are measured at the individual level, and are therefore asked
directly to the employees themselves.
Line managers and HRM implementation attributions
Line managers HRM implementation attributions are constraints that form the motivation for the
behavior of line managers in the implementation of HR practices. Line managers’ HRM implementation
attributions will be measured with a pre validated questionnaire by Bos-Nehles (2010), because the
constraints measured with these items are frequently experienced by line managers in the
implementation of HR practices (Bos-Nehles, 2010). This questionnaire consists out of the factors desire,
capacity, competencies, support and policies & procedures. Desire and competencies are considered
internal HRM implementation attributions. Capacity, support and policies & procedures are considered
external HRM implementation attributions. The operationalization for the questionnaire can be found in
table 3.3.
HRM co-production
HRM co-production is defined as the active involvement of employees in the delivery of HR practices. It
will be measured with a questionnaire which looks at the extent to which employees make an effort to
deliver HR practices. To measure this three out of four dimensions of Tims et al. (2012) job crafting scale
will be used, namely increasing structural job resources, increasing social job resources and increasing
challenging job demands. The fourth dimension of decreasing hindering job demands was left out
because it does not fully capture the HRM co-production construct as defined in this research. These
26
dimensions are supplemented with two items on self-management teams and participation from the
scale of employee-experienced high-performance work system scale by Liao et al. (2009). The items of
Tims et al. (2012) and (Liao et al., 2009) are used because they look at several aspects of the active
involvement employees can have in the implementation of HR practices. Furthermore six items on co-
production are added to the questionnaire, which were developed for this research. The HR practices
that have to be judged are training and development, recruitment and selection, performance appraisal,
participation and job design. These items are measured at the individual level, and are therefore asked
directly to the employees themselves. The operationalization for the questionnaire can be found in table
3.4.
Perceived HRM intensity
It is possible that there are differences between the intended HR practices as proposed by the HR
professionals and the implemented HR practices as executed by the line managers (Gerhart, 2005; Khilji
& Wang, 2006). Therefore the employee perceptions are measured to see how the implemented HR
practices are perceived, instead of the intended HR practices as formulated by the HR professionals.
Perceived HRM intensity is defined as how thoroughly HR practices as a whole are perceived in the
organization (Sels et al., 2006, p. 90). To measure the perceived HRM intensity items of Liao et al. (2009)
employee-experienced high-performance work system scale are used. Four dimensions deemed
relevant for the perceived HRM intensity construct, namely extensive service training, compensation
contingent on service performance, job design for quality work and self-management teams and
participation. These dimensions are supplemented with two dimensions of Takeuchi et al. (2007)
employee-rated high-performance works systems scale, those on recruitment and selection and on
performance appraisal. Together these items form a complete picture of HR practices that are
implemented in the organization. When they can observe all (or al lot) aspects there will be a strong
perceived HRM intensity. The HR practices that have to be judged for the final questionnaire are training
and development, recruitment and selection, performance appraisal, participation, job design and
compensation. These items are measured at the individual level, and are therefore asked directly to the
employees themselves. The operationalization for the questionnaire can be found in table 3.5.
Job performance
Job performance is defined as how well an employee can execute the tasks assigned to him. This will be
measured by looking at the individual task performance and Organizational Citizenship Behavior (OCB)
that is directed at the individual (Kluemper et al., 2013). Individual task performance can also be seen as

27
In-role behavior, which are the tasks that employees are expected to perform for their job. OCB directed
at the individual can also be seen as Extra-role behaviors, which are tasks that an employee performs
even though they are not expected of them. To measure job performance items of the task performance
scale by Kluemper et al. (2013) are used, because they do not only measure tasks assigned to employees
but also measure the extent to which employees ‘go the extra mile’. The dimensions supervisor-rated
task performance and organizational citizenship behavior directed at the individual deemed relevant for
this research. These items are measured at the individual level, and are therefore asked directly to the
employees themselves. The operationalization for the questionnaire can be found in table 3.6.

28
Table 3.2: Operationalization HR attributions
Constructs Dimensions Item measured Factors Cronbach’s Alpha*
Number of items
Example item(s)
Internal HR attributions
Positive Internal HR attributions (Nishii et al., 2008)
Positive motivation that comes from within the subsidiary
Quality and employee enhancement HR attribution
α = .91 16 In order to help employees deliver quality service to customers.
Negative Internal HR attributions (Nishii et al., 2008)
Negative motivation that comes from within the subsidiary
Cost and employee exploitation HR attribution
α = .82 16 To try to keep costs down.
External HR attributions
External HR attributions
Motivation for an HR practice comes from headquarters
Headquarters HR attribution
- 8 Because they are required to by headquarters.
Table 3.3: Operationalization HRM implementation constraints
Constructs Dimensions Item measured Factors Cronbach’s Alpha*
Number of items
Example item(s)
Internal HRM implementation attributions
Desire (Bos-Nehles, 2010)
Personal unwillingness to perform HR activities
Intrinsic motivation α = .84 3 Because I think that this activity is interesting.
Identified regulation α = .73 3 Because I am doing it for my own good.
A-motivation α = .80 3 (r) I do this activity but I am not sure if it is worth it.
Value added α = .93 4 Because it helps the people in my team to grow, improve and develop themselves.
Competencies (Bos-Nehles, 2010)
Insufficient HR knowledge/skills
Occupational self-efficacy
α = .85 5 When I am confronted with a problem in performing my HR responsibilities. I can usually find several solutions.
Training α = .77 2 The courses I followed were relevant for performing my HR responsibilities.
External HRM implementation attributions
Capacity (Bos-Nehles, 2010)
Insufficient time for performing HR activities
Role overload α = .88 5 (r) I can’t ever seem to get caught up with performing my HR responsibilities.
Support (Bos-Nehles, 2010)
Insufficient support from the HR department
HR support services α = .85 3 When the HR department promises to do something in a certain time frame, then it does happen.
HR support behavior α = .89 4 The HR managers are always willing to help.
Policy & procedures (Bos-Nehles, 2010)
Unclear policies and procedures
Role conflict α = .86 5 (r) I work under incompatible HR policies and HR guidelines.
Role ambiguity α = .84 4 (r) I have concrete, planned goals for my HR responsibilities.
User friendliness of HR forms
α = .89 3 The HR instruments I am provided with are clear and understandable.
29
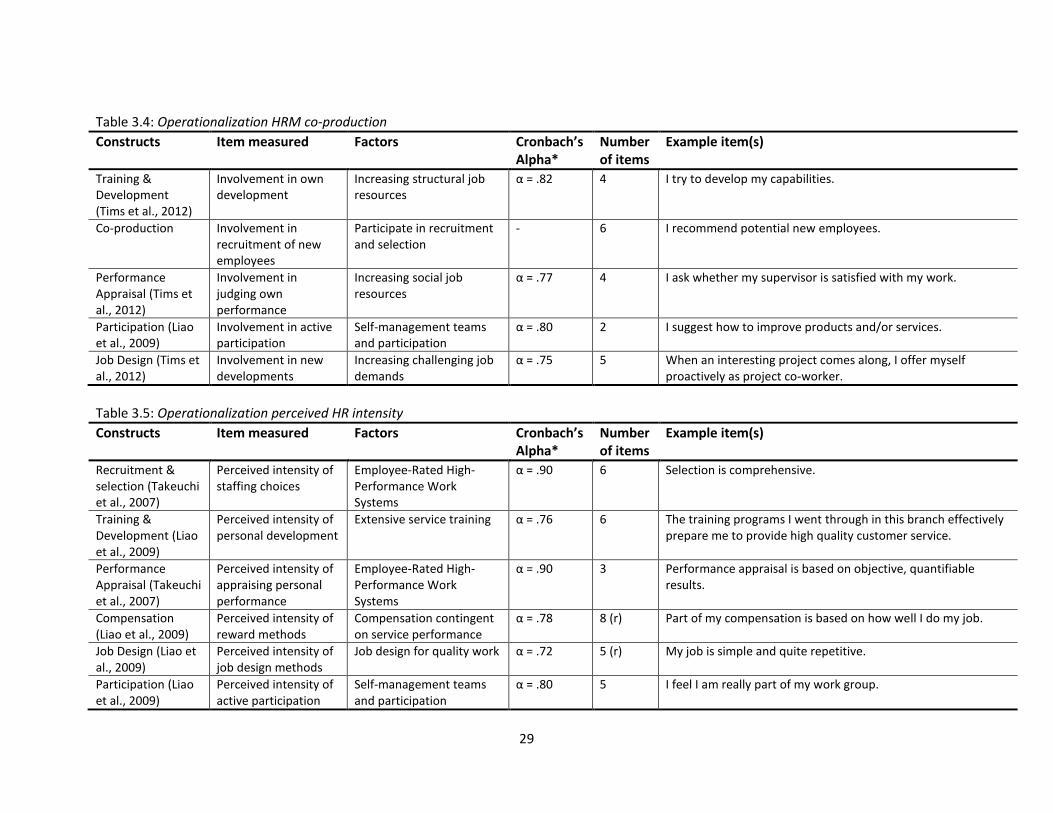
Table 3.4: Operationalization HRM co-production
Constructs Item measured Factors Cronbach’s Alpha*
Number of items
Example item(s)
Training & Development (Tims et al., 2012)
Involvement in own development
Increasing structural job resources
α = .82 4 I try to develop my capabilities.
Co-production Involvement in recruitment of new employees
Participate in recruitment and selection
- 6 I recommend potential new employees.
Performance Appraisal (Tims et al., 2012)
Involvement in judging own performance
Increasing social job resources
α = .77 4 I ask whether my supervisor is satisfied with my work.
Participation (Liao et al., 2009)
Involvement in active participation
Self-management teams and participation
α = .80 2 I suggest how to improve products and/or services.
Job Design (Tims et al., 2012)
Involvement in new developments
Increasing challenging job demands
α = .75 5 When an interesting project comes along, I offer myself proactively as project co-worker.
Table 3.5: Operationalization perceived HR intensity
Constructs Item measured Factors Cronbach’s Alpha*
Number of items
Example item(s)
Recruitment & selection (Takeuchi et al., 2007)
Perceived intensity of staffing choices
Employee-Rated High-Performance Work Systems
α = .90 6 Selection is comprehensive.
Training & Development (Liao et al., 2009)
Perceived intensity of personal development
Extensive service training α = .76 6 The training programs I went through in this branch effectively prepare me to provide high quality customer service.
Performance Appraisal (Takeuchi et al., 2007)
Perceived intensity of appraising personal performance
Employee-Rated High-Performance Work Systems
α = .90 3 Performance appraisal is based on objective, quantifiable results.
Compensation (Liao et al., 2009)
Perceived intensity of reward methods
Compensation contingent on service performance
α = .78 8 (r) Part of my compensation is based on how well I do my job.
Job Design (Liao et al., 2009)
Perceived intensity of job design methods
Job design for quality work α = .72 5 (r) My job is simple and quite repetitive.
Participation (Liao et al., 2009)
Perceived intensity of active participation
Self-management teams and participation
α = .80 5 I feel I am really part of my work group.

30
Table 3.6: Operationalization job performance
Constructs Item measured Factors Cronbach’s Alpha*
Number of items
Example item(s)
Task performance (Kluemper et al., 2013)
Performance on tasks within job description
Supervisor-rated task performance
α = .86 5 Adequately completes assigned duties.
Organizational citizenship behavior (Kluemper et al., 2013)
Performance on tasks on top of job description
Organizational Citizenship Behavior directed at Individuals
α = .81 5 Helps other who have been absent.
* Cronbach’s Alphas that are reported are the original values.
31
Procedure
A challenging aspect of social research is that participants have to give personal information about
themselves in a questionnaire or interview (Babbie, 2010). Thus most respondents tend to think twice
about the answers they provide in a research. In order to prevent receiving only socially desirable
answers, confidentiality will be assured in the execution of the interviews and questionnaires. Full
anonymity is not possible for this research, because this requires that neither the researchers nor the
readers can identify the respondents (Babbie, 2010). Because our sample is divided into several teams
and the respective line managers of these teams are assessed, the distinct teams have to remain
identifiable for the data-analysis. However names or the teams will not be shown in the results, so full
confidentiality can be provided along with partial anonymity.
Data will be gathered in three rounds, as already mentioned above. A notification of this research will be
sent out to all line managers a couple of weeks in advance, to alert respondents of the coming research.
This notification will be sent by the HR advisor of Benchmark Electronics to ensure attention will be paid
to this notification. After few days line manages are invited for a focus group session in which they are
asked to fill in the questionnaire at the start, as this will form the input for the session. This way control
can be exerted so every line managers will indeed fill out this questionnaire. In this session a semi-
structured group interview will take place to discuss answers given in the questionnaire. After these
focus group sessions the first questionnaire will be spread amongst employees. For the engineering
department an online survey method is used, because most employees have regular access to a
computer with internet. For the production department printed copies of the survey will be handed out,
because these employees do not have access to a computer at work. After a week a reminder will be
sent to all employees to achieve a high response rate in each round.
Data analysis
For the quantitative data analysis the questionnaires are entered in SPSS. With SPSS the necessary
validity checks are performed to ensure validity of the items measured. Age and tenure will serve as
control variables. Other control variables measured in this research are LMX, career encouragement and
affective commitment. These control variables are used to control for factors that can influence the
relationship between the independent and dependent variables in this thesis. By incorporating these
variables in the analysis the true relationship between the independent and dependent variable can be
calculated. These specific control variables are used in this research because these can be expected to
32
influence the relationship between employee HR attributions, line manager implementation
attributions, HRM co-production, perceived HR intensity and job performance.
The first step in the data analysis is to calculate the descriptive statistics along with a correlation
analysis. This will provide a foundation for testing the hypotheses. After this the actual hypotheses are
tested by performing a hierarchical multiple regression analysis. For the moderation effect of hypothesis
4 a mixed model analysis is done. The relevant data on employee HR attributions, employee HRM co-
production and line manager HR implementation attributions will be aggregated into one database. This
way the line manager implementation attributions can be linked to the employee HR attributions.
For the qualitative data analysis, focus group sessions interviews are recorded and later transcribed. All
relevant qualitative data will go through a process of theory-driven content analysis. This means that all
answers will be described into one of the five line managers implementation attributions constructs,
namely desire, competencies, capacity, support and policy & procedures. After this the results will be
discussed for the internal HR implementation attributions and the external HR implementation
attributions. All this data together will show if the stated hypotheses are supported and give a further
explanation why they are (not) supported.

33
Results
In this section the research model and its related hypotheses are tested. First the research design has to
be validated to ensure results are reliable and valid. Only then can significant results be generalized to
similar cases outside this study. The second step is to describe the sample of this research. Here the
average characteristics of the sample are presented. Descriptive statistics are analyzed after this section.
For this part the means, standard deviations and correlations of all items on an individual level and
aggregated level are given. Finally the model is tested through a series of hierarchical multiple
regression analyses and a mixed model analysis. Results are presented in several tables.
Validation of research design
To ensure measurement error is kept to a minimum, the first step after data has been gathered is to
check for validity and reliability of the research design (Field, 2009, p. 11). For each construct in the
model the Cronbach’s alpha was calculated. Almost all Cronbach’s alphas were above the threshold of
.70, which means that the reliability of the measurement scales is strong enough (Field, 2009, p. 675). A
few items were below the lower threshold of .65. From external HRM implementation attributions both
training (from competencies) and support services (from support) had an alpha below .65, namely .59
and .63 respectively. From employees HRM co-production participation had an alpha of .56.
To see if these items loaded correctly or turned out to be unsuitable for the construct, an exploratory
factor analyses was performed. The items causing a low Cronbach’s alpha also loaded on to different
factors. After careful consideration these specific items were dropped from the measurements, to
achieve a strong enough Cronbach’s alpha. Training and participation consisted of only 2 items and were
therefore dropped entirely. Support services had one specific item causing the low alpha; therefore this
item was dropped from the measurements. The final number of items and the Cronbach’s alpha for
each construct are presented in table 4.1. The questionnaires in the appendix also show which items are
dropped from the final data analysis.
Because most of the items are from pre-validated research, further confirmatory factor analysis was not
believed to be necessary. The items that were developed for this research design showed a very high
Cronbach’s alpha, so again confirmatory factor analysis was not performed.
The initial plan was to measure HRM co-production by asking line managers about the level of co-
production of the employees in their department. Due to some objections this data is only known for 10
employees. Therefore the measurement of this concept was changed to the individual level, so
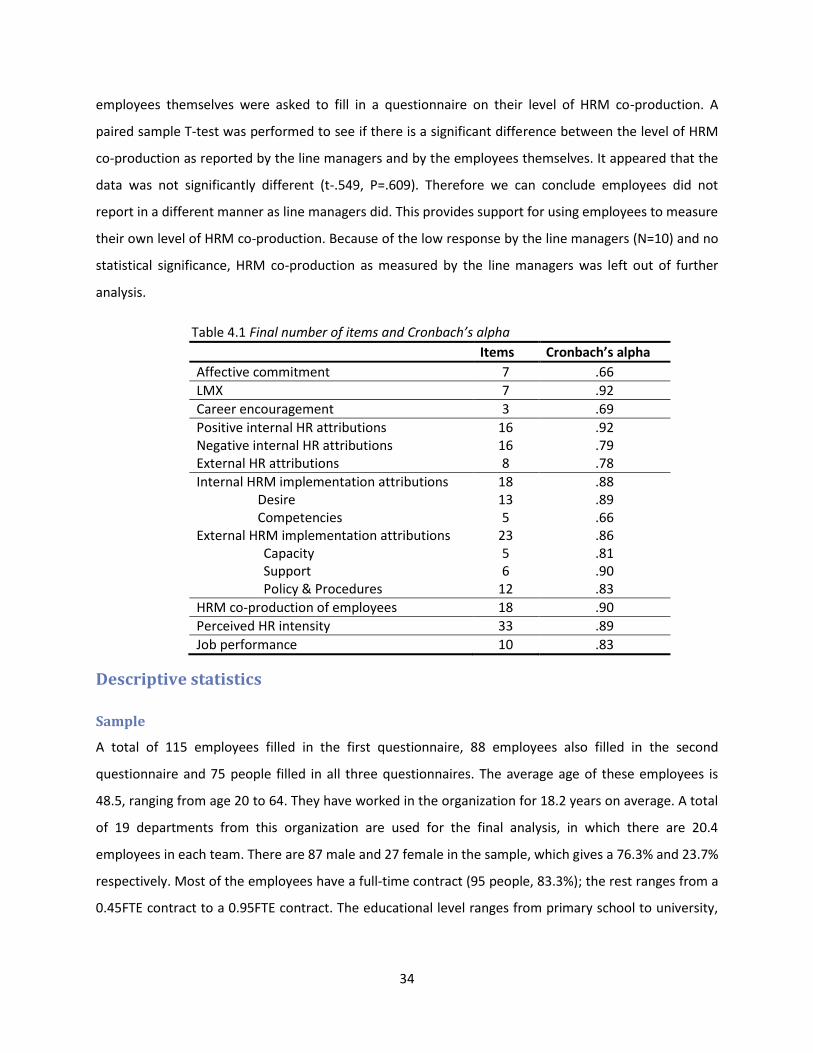
34
employees themselves were asked to fill in a questionnaire on their level of HRM co-production. A
paired sample T-test was performed to see if there is a significant difference between the level of HRM
co-production as reported by the line managers and by the employees themselves. It appeared that the
data was not significantly different (t-.549, P=.609). Therefore we can conclude employees did not
report in a different manner as line managers did. This provides support for using employees to measure
their own level of HRM co-production. Because of the low response by the line managers (N=10) and no
statistical significance, HRM co-production as measured by the line managers was left out of further
analysis.
Table 4.1 Final number of items and Cronbach’s alpha
Items Cronbach’s alpha
Affective commitment 7 .66
LMX 7 .92
Career encouragement 3 .69
Positive internal HR attributions 16 .92 Negative internal HR attributions 16 .79 External HR attributions 8 .78
Internal HRM implementation attributions 18 .88 Desire 13 .89 Competencies 5 .66 External HRM implementation attributions 23 .86 Capacity 5 .81 Support 6 .90 Policy & Procedures 12 .83
HRM co-production of employees 18 .90
Perceived HR intensity 33 .89
Job performance 10 .83
Descriptive statistics
Sample
A total of 115 employees filled in the first questionnaire, 88 employees also filled in the second
questionnaire and 75 people filled in all three questionnaires. The average age of these employees is
48.5, ranging from age 20 to 64. They have worked in the organization for 18.2 years on average. A total
of 19 departments from this organization are used for the final analysis, in which there are 20.4
employees in each team. There are 87 male and 27 female in the sample, which gives a 76.3% and 23.7%
respectively. Most of the employees have a full-time contract (95 people, 83.3%); the rest ranges from a
0.45FTE contract to a 0.95FTE contract. The educational level ranges from primary school to university,
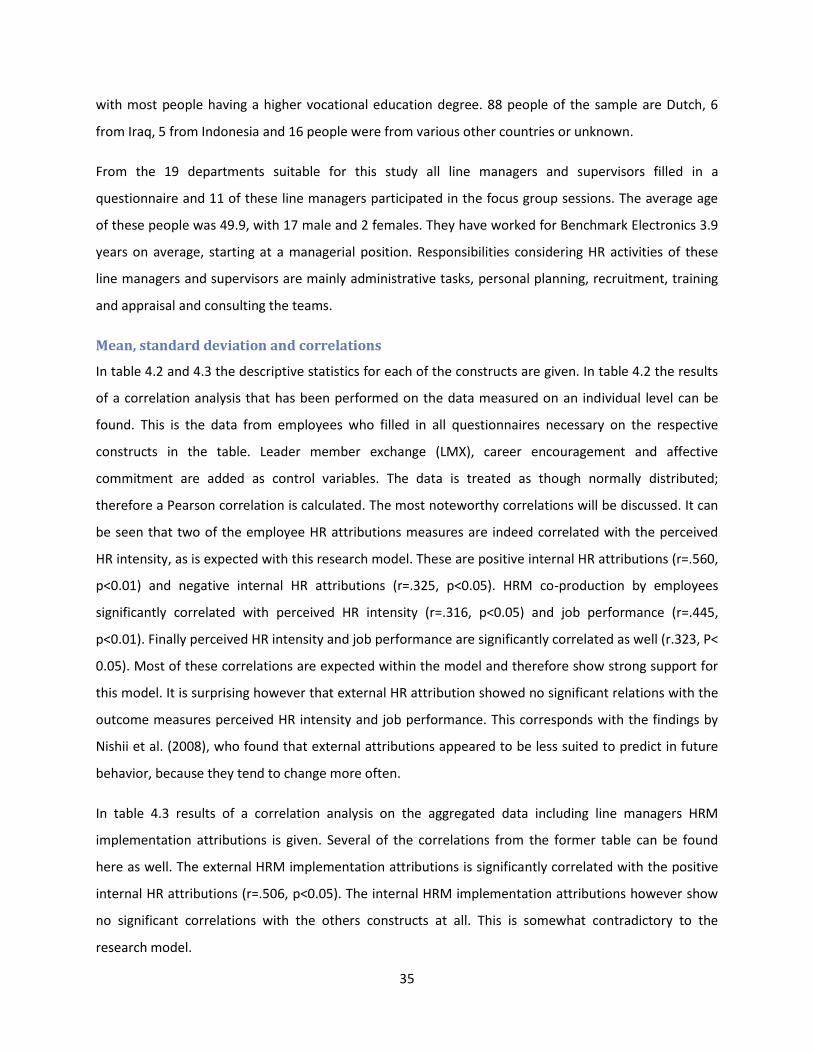
35
with most people having a higher vocational education degree. 88 people of the sample are Dutch, 6
from Iraq, 5 from Indonesia and 16 people were from various other countries or unknown.
From the 19 departments suitable for this study all line managers and supervisors filled in a
questionnaire and 11 of these line managers participated in the focus group sessions. The average age
of these people was 49.9, with 17 male and 2 females. They have worked for Benchmark Electronics 3.9
years on average, starting at a managerial position. Responsibilities considering HR activities of these
line managers and supervisors are mainly administrative tasks, personal planning, recruitment, training
and appraisal and consulting the teams.
Mean, standard deviation and correlations
In table 4.2 and 4.3 the descriptive statistics for each of the constructs are given. In table 4.2 the results
of a correlation analysis that has been performed on the data measured on an individual level can be
found. This is the data from employees who filled in all questionnaires necessary on the respective
constructs in the table. Leader member exchange (LMX), career encouragement and affective
commitment are added as control variables. The data is treated as though normally distributed;
therefore a Pearson correlation is calculated. The most noteworthy correlations will be discussed. It can
be seen that two of the employee HR attributions measures are indeed correlated with the perceived
HR intensity, as is expected with this research model. These are positive internal HR attributions (r=.560,
p<0.01) and negative internal HR attributions (r=.325, p<0.05). HRM co-production by employees
significantly correlated with perceived HR intensity (r=.316, p<0.05) and job performance (r=.445,
p<0.01). Finally perceived HR intensity and job performance are significantly correlated as well (r.323, P<
0.05). Most of these correlations are expected within the model and therefore show strong support for
this model. It is surprising however that external HR attribution showed no significant relations with the
outcome measures perceived HR intensity and job performance. This corresponds with the findings by
Nishii et al. (2008), who found that external attributions appeared to be less suited to predict in future
behavior, because they tend to change more often.
In table 4.3 results of a correlation analysis on the aggregated data including line managers HRM
implementation attributions is given. Several of the correlations from the former table can be found
here as well. The external HRM implementation attributions is significantly correlated with the positive
internal HR attributions (r=.506, p<0.05). The internal HRM implementation attributions however show
no significant correlations with the others constructs at all. This is somewhat contradictory to the
research model.
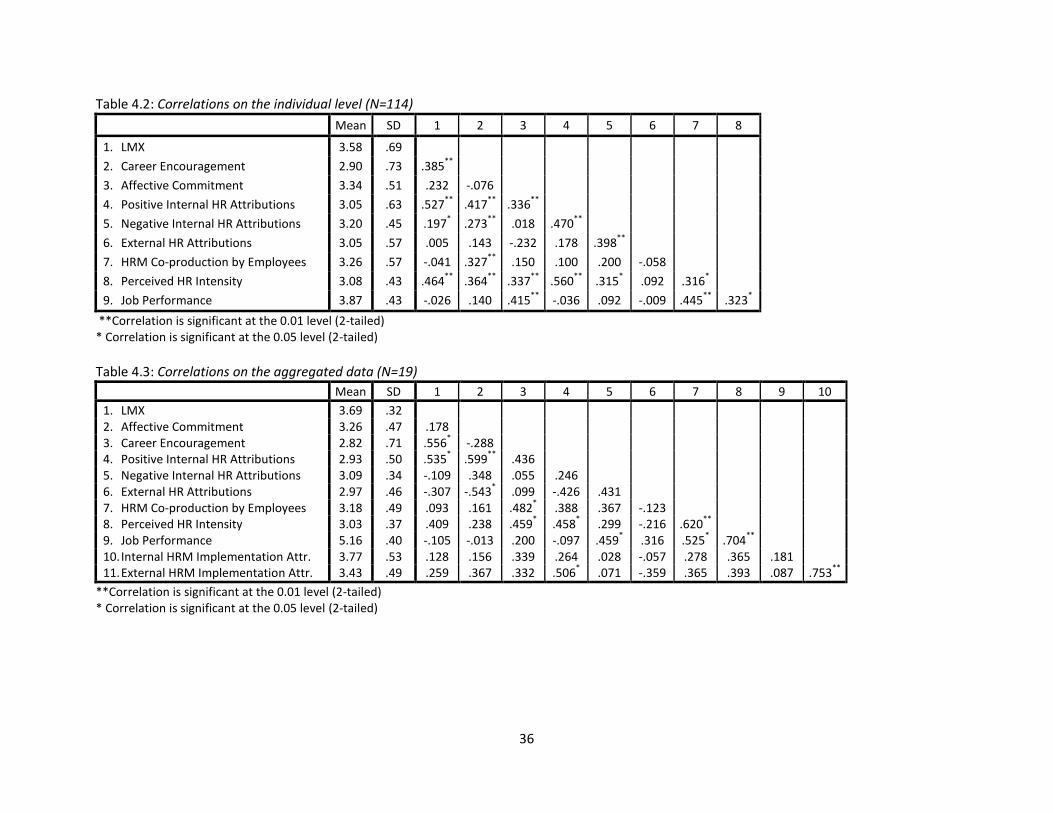
36
Table 4.2: Correlations on the individual level (N=114)
Mean SD 1 2 3 4 5 6 7 8
1. LMX 3.58 .69
2. Career Encouragement 2.90 .73 .385**
3. Affective Commitment 3.34 .51 .232 -.076
4. Positive Internal HR Attributions 3.05 .63 .527**
.417**
.336**
5. Negative Internal HR Attributions 3.20 .45 .197* .273
** .018 .470
**
6. External HR Attributions 3.05 .57 .005 .143 -.232 .178 .398**
7. HRM Co-production by Employees 3.26 .57 -.041 .327**
.150 .100 .200 -.058
8. Perceived HR Intensity 3.08 .43 .464**
.364**
.337**
.560**
.315* .092 .316
*
9. Job Performance 3.87 .43 -.026 .140 .415**
-.036 .092 -.009 .445**
.323*
**Correlation is significant at the 0.01 level (2-tailed) * Correlation is significant at the 0.05 level (2-tailed)
Table 4.3: Correlations on the aggregated data (N=19)
Mean SD 1 2 3 4 5 6 7 8 9 10
1. LMX 3.69 .32 2. Affective Commitment 3.26 .47 .178 3. Career Encouragement 2.82 .71 .556
* -.288
4. Positive Internal HR Attributions 2.93 .50 .535* .599
** .436
5. Negative Internal HR Attributions 3.09 .34 -.109 .348 .055 .246 6. External HR Attributions 2.97 .46 -.307 -.543
* .099 -.426 .431
7. HRM Co-production by Employees 3.18 .49 .093 .161 .482* .388 .367 -.123
8. Perceived HR Intensity 3.03 .37 .409 .238 .459* .458
* .299 -.216 .620
**
9. Job Performance 5.16 .40 -.105 -.013 .200 -.097 .459* .316 .525
* .704
**
10. Internal HRM Implementation Attr. 3.77 .53 .128 .156 .339 .264 .028 -.057 .278 .365 .181 11. External HRM Implementation Attr. 3.43 .49 .259 .367 .332 .506
* .071 -.359 .365 .393 .087 .753
**
**Correlation is significant at the 0.01 level (2-tailed) * Correlation is significant at the 0.05 level (2-tailed)
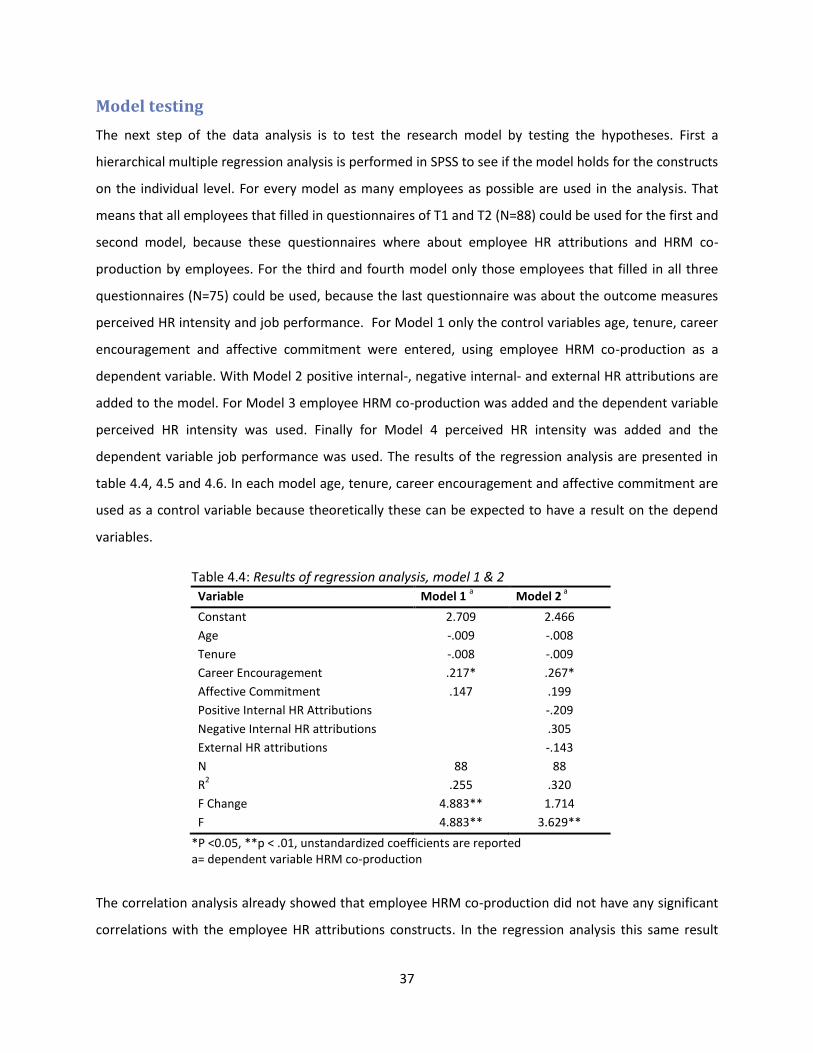
37
Model testing
The next step of the data analysis is to test the research model by testing the hypotheses. First a
hierarchical multiple regression analysis is performed in SPSS to see if the model holds for the constructs
on the individual level. For every model as many employees as possible are used in the analysis. That
means that all employees that filled in questionnaires of T1 and T2 (N=88) could be used for the first and
second model, because these questionnaires where about employee HR attributions and HRM co-
production by employees. For the third and fourth model only those employees that filled in all three
questionnaires (N=75) could be used, because the last questionnaire was about the outcome measures
perceived HR intensity and job performance. For Model 1 only the control variables age, tenure, career
encouragement and affective commitment were entered, using employee HRM co-production as a
dependent variable. With Model 2 positive internal-, negative internal- and external HR attributions are
added to the model. For Model 3 employee HRM co-production was added and the dependent variable
perceived HR intensity was used. Finally for Model 4 perceived HR intensity was added and the
dependent variable job performance was used. The results of the regression analysis are presented in
table 4.4, 4.5 and 4.6. In each model age, tenure, career encouragement and affective commitment are
used as a control variable because theoretically these can be expected to have a result on the depend
variables.
Table 4.4: Results of regression analysis, model 1 & 2
Variable Model 1 a
Model 2 a
Constant 2.709 2.466
Age -.009 -.008
Tenure -.008 -.009
Career Encouragement .217* .267*
Affective Commitment .147 .199
Positive Internal HR Attributions -.209
Negative Internal HR attributions .305
External HR attributions -.143
N 88 88
R2 .255 .320
F Change
4.883** 1.714
F 4.883** 3.629**
*P <0.05, **p < .01, unstandardized coefficients are reported a= dependent variable HRM co-production
The correlation analysis already showed that employee HRM co-production did not have any significant
correlations with the employee HR attributions constructs. In the regression analysis this same result

38
can be found as well. Model 2 shows that employee HR attributions are not significant in explaining
employee HRM co-production. Therefore hypotheses 1, 2 and 3 are not supported. A possible
explanation for this result comes from commentary received on the questionnaire on HRM co-
production (T2). Several employees from the production departments felt like they are not responsible
for HR practices at all, but their supervisors are. In this case it would not matter which attributions they
have of HR practices, the level of active participation will remain low for any of them, because they
simply do not see it as their responsibility. Unfortunately it is not possible to check how many
employees felt this way; therefore no further analysis towards this problem can be done.
Table 4.5: Results of regression analysis, model 1, 2 & 3
Variable Model 1 b
Model 2 b
Model 3 b
Constant 1.593 1.424 1.084
Age -.005 -.006 -.006
Tenure .004 .005 .007
Career Encouragement .203** .085 .041
Affective Commitment .305** .181 .138
Positive Internal HR Attributions .270** .295**
Negative Internal HR attributions .043 -.026
External HR attributions .006 .022
Employee HRM Co-production .198*
N 75 75 75
R2 .262 .386 .435
F Change
4.879** 3.497* 4.398*
F 4.879** 4.667*** 4.900***
*P <0.05, **p < .01, ***p<0.001, unstandardized coefficients are reported b= dependent variable Perceived HR Intensity
Model 3 of the multiple regressions analyses shows that the level of HRM co-production can indeed
determine the perceived HRM intensity (R2 =.435, F (8.51) = 4.9, p<0.001). It was found that employee
positive internal HR attributions and employee HRM co-production together explain 43.5% of variation
in perceived HR intensity. Positive internal HR attributions significantly predicted perceived HR intensity
(β=.295, p<0.01), as did employee HRM co-production (β=.198, p<0.05). Therefore hypothesis 5 is
supported. This means that when employees actively participate in the implementation of HR practices
they tend to perceive the HR intensity as stronger then when employees who do not actively participate.
The perceived HR intensity can become stronger in this case because of the active participation in
implementing HR practices, which can lead to more attention and recognition paid towards HR
practices.
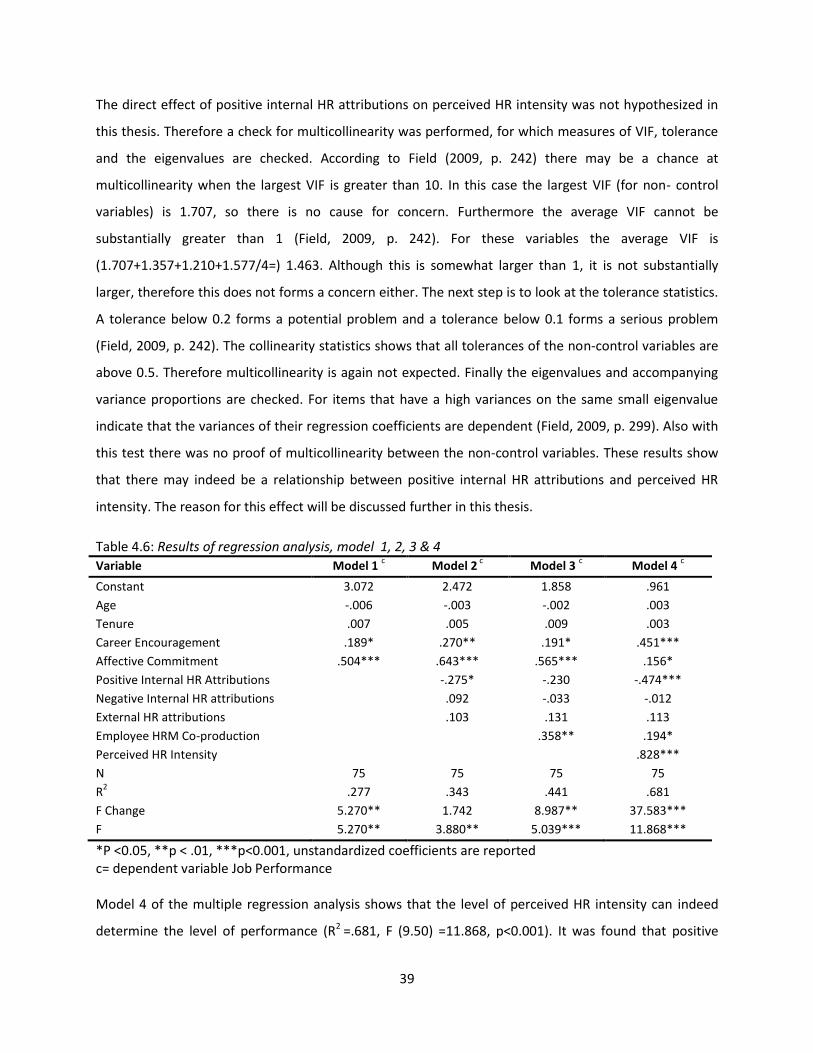
39
The direct effect of positive internal HR attributions on perceived HR intensity was not hypothesized in
this thesis. Therefore a check for multicollinearity was performed, for which measures of VIF, tolerance
and the eigenvalues are checked. According to Field (2009, p. 242) there may be a chance at
multicollinearity when the largest VIF is greater than 10. In this case the largest VIF (for non- control
variables) is 1.707, so there is no cause for concern. Furthermore the average VIF cannot be
substantially greater than 1 (Field, 2009, p. 242). For these variables the average VIF is
(1.707+1.357+1.210+1.577/4=) 1.463. Although this is somewhat larger than 1, it is not substantially
larger, therefore this does not forms a concern either. The next step is to look at the tolerance statistics.
A tolerance below 0.2 forms a potential problem and a tolerance below 0.1 forms a serious problem
(Field, 2009, p. 242). The collinearity statistics shows that all tolerances of the non-control variables are
above 0.5. Therefore multicollinearity is again not expected. Finally the eigenvalues and accompanying
variance proportions are checked. For items that have a high variances on the same small eigenvalue
indicate that the variances of their regression coefficients are dependent (Field, 2009, p. 299). Also with
this test there was no proof of multicollinearity between the non-control variables. These results show
that there may indeed be a relationship between positive internal HR attributions and perceived HR
intensity. The reason for this effect will be discussed further in this thesis.
Table 4.6: Results of regression analysis, model 1, 2, 3 & 4
Variable Model 1 c
Model 2 c Model 3
c Model 4
c
Constant 3.072 2.472 1.858 .961
Age -.006 -.003 -.002 .003
Tenure .007 .005 .009 .003
Career Encouragement .189* .270** .191* .451***
Affective Commitment .504*** .643*** .565*** .156*
Positive Internal HR Attributions -.275* -.230 -.474***
Negative Internal HR attributions .092 -.033 -.012
External HR attributions .103 .131 .113
Employee HRM Co-production .358** .194*
Perceived HR Intensity .828***
N 75 75 75 75
R2 .277 .343 .441 .681
F Change
5.270** 1.742 8.987** 37.583***
F 5.270** 3.880** 5.039*** 11.868***
*P <0.05, **p < .01, ***p<0.001, unstandardized coefficients are reported c= dependent variable Job Performance Model 4 of the multiple regression analysis shows that the level of perceived HR intensity can indeed
determine the level of performance (R2 =.681, F (9.50) =11.868, p<0.001). It was found that positive
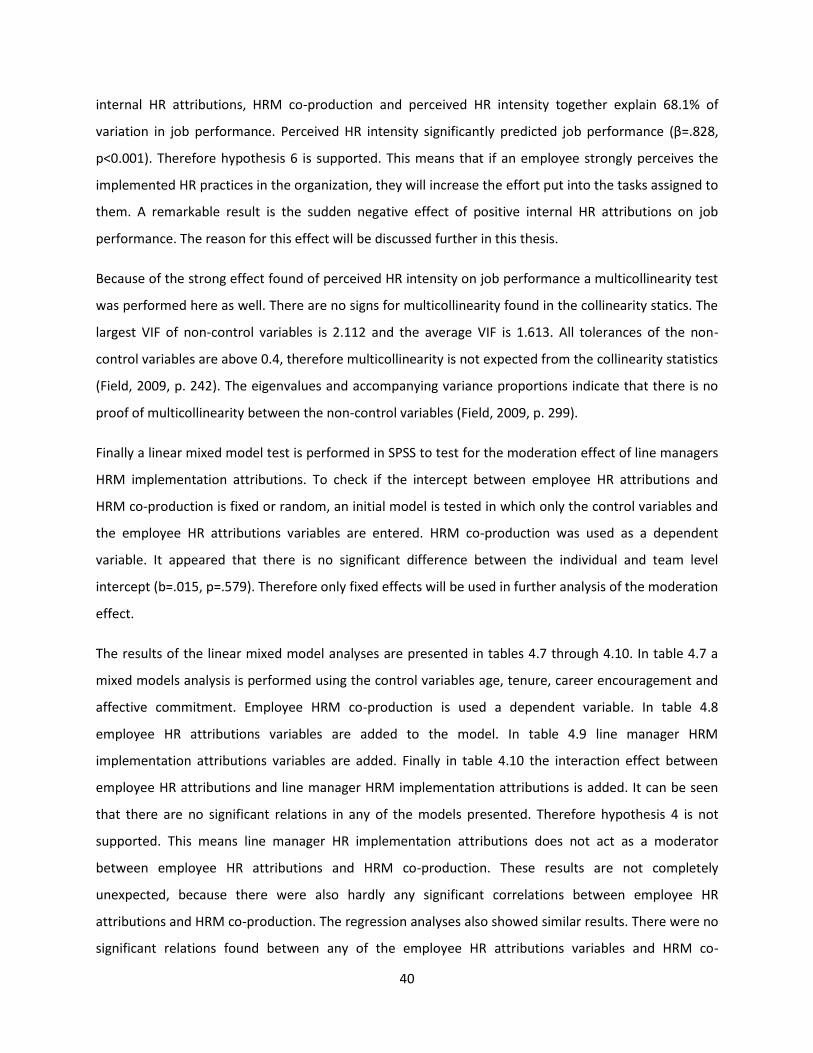
40
internal HR attributions, HRM co-production and perceived HR intensity together explain 68.1% of
variation in job performance. Perceived HR intensity significantly predicted job performance (β=.828,
p<0.001). Therefore hypothesis 6 is supported. This means that if an employee strongly perceives the
implemented HR practices in the organization, they will increase the effort put into the tasks assigned to
them. A remarkable result is the sudden negative effect of positive internal HR attributions on job
performance. The reason for this effect will be discussed further in this thesis.
Because of the strong effect found of perceived HR intensity on job performance a multicollinearity test
was performed here as well. There are no signs for multicollinearity found in the collinearity statics. The
largest VIF of non-control variables is 2.112 and the average VIF is 1.613. All tolerances of the non-
control variables are above 0.4, therefore multicollinearity is not expected from the collinearity statistics
(Field, 2009, p. 242). The eigenvalues and accompanying variance proportions indicate that there is no
proof of multicollinearity between the non-control variables (Field, 2009, p. 299).
Finally a linear mixed model test is performed in SPSS to test for the moderation effect of line managers
HRM implementation attributions. To check if the intercept between employee HR attributions and
HRM co-production is fixed or random, an initial model is tested in which only the control variables and
the employee HR attributions variables are entered. HRM co-production was used as a dependent
variable. It appeared that there is no significant difference between the individual and team level
intercept (b=.015, p=.579). Therefore only fixed effects will be used in further analysis of the moderation
effect.
The results of the linear mixed model analyses are presented in tables 4.7 through 4.10. In table 4.7 a
mixed models analysis is performed using the control variables age, tenure, career encouragement and
affective commitment. Employee HRM co-production is used a dependent variable. In table 4.8
employee HR attributions variables are added to the model. In table 4.9 line manager HRM
implementation attributions variables are added. Finally in table 4.10 the interaction effect between
employee HR attributions and line manager HRM implementation attributions is added. It can be seen
that there are no significant relations in any of the models presented. Therefore hypothesis 4 is not
supported. This means line manager HR implementation attributions does not act as a moderator
between employee HR attributions and HRM co-production. These results are not completely
unexpected, because there were also hardly any significant correlations between employee HR
attributions and HRM co-production. The regression analyses also showed similar results. There were no
significant relations found between any of the employee HR attributions variables and HRM co-
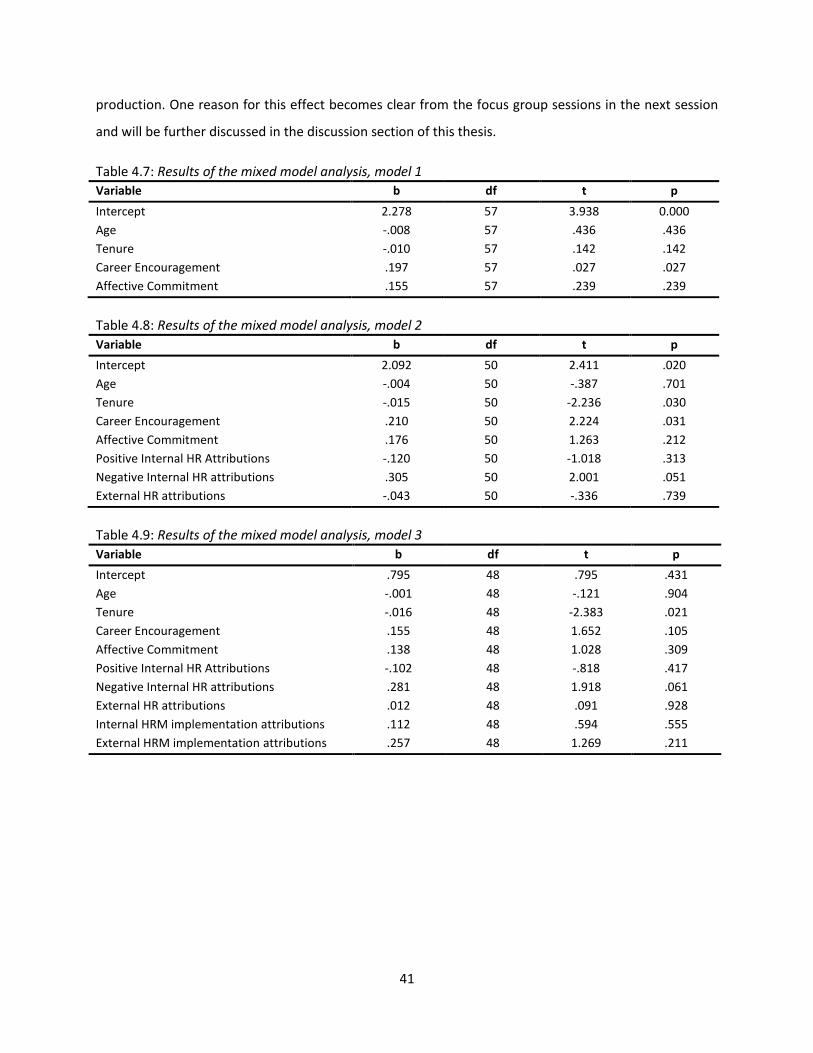
41
production. One reason for this effect becomes clear from the focus group sessions in the next session
and will be further discussed in the discussion section of this thesis.
Table 4.7: Results of the mixed model analysis, model 1
Variable b
df t p
Intercept 2.278 57 3.938 0.000
Age -.008 57 .436 .436
Tenure -.010 57 .142 .142
Career Encouragement .197 57 .027 .027
Affective Commitment .155 57 .239 .239
Table 4.8: Results of the mixed model analysis, model 2
Variable b
df t p
Intercept 2.092 50 2.411 .020
Age -.004 50 -.387 .701
Tenure -.015 50 -2.236 .030
Career Encouragement .210 50 2.224 .031
Affective Commitment .176 50 1.263 .212
Positive Internal HR Attributions -.120 50 -1.018 .313
Negative Internal HR attributions .305 50 2.001 .051
External HR attributions -.043 50 -.336 .739
Table 4.9: Results of the mixed model analysis, model 3
Variable b
df t p
Intercept .795 48 .795 .431
Age -.001 48 -.121 .904
Tenure -.016 48 -2.383 .021
Career Encouragement .155 48 1.652 .105
Affective Commitment .138 48 1.028 .309
Positive Internal HR Attributions -.102 48 -.818 .417
Negative Internal HR attributions .281 48 1.918 .061
External HR attributions .012 48 .091 .928
Internal HRM implementation attributions .112 48 .594 .555
External HRM implementation attributions .257 48 1.269 .211
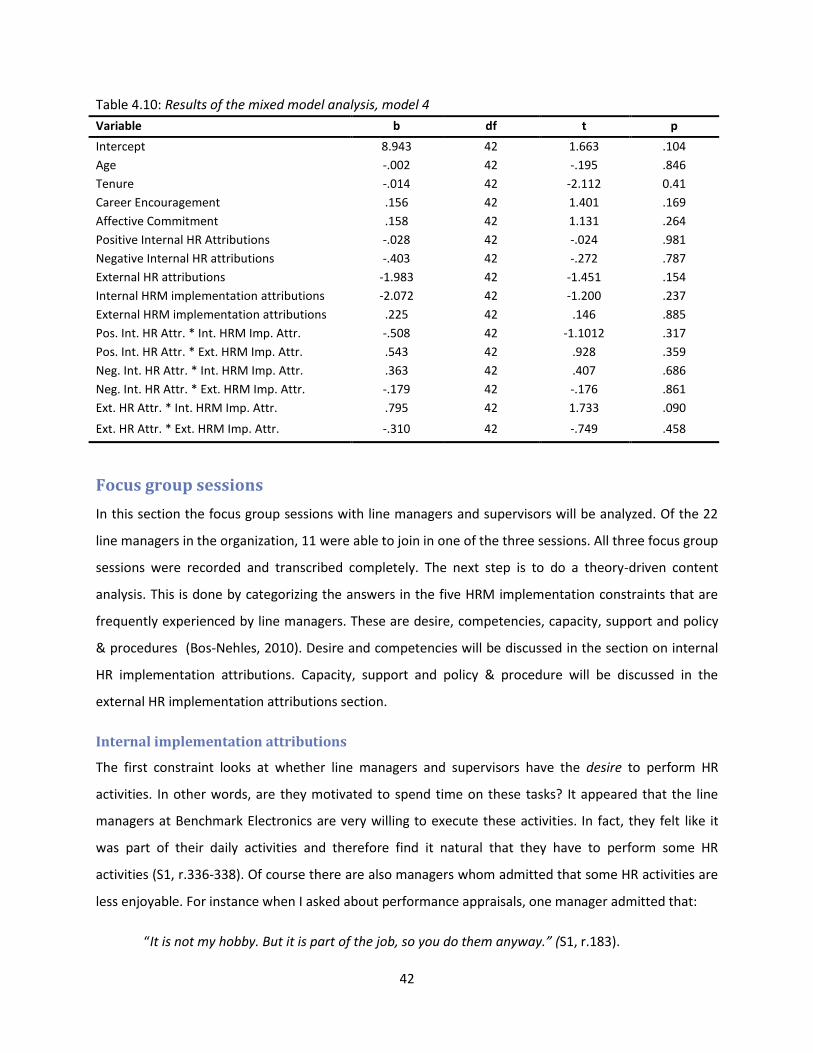
42
Table 4.10: Results of the mixed model analysis, model 4
Focus group sessions
In this section the focus group sessions with line managers and supervisors will be analyzed. Of the 22
line managers in the organization, 11 were able to join in one of the three sessions. All three focus group
sessions were recorded and transcribed completely. The next step is to do a theory-driven content
analysis. This is done by categorizing the answers in the five HRM implementation constraints that are
frequently experienced by line managers. These are desire, competencies, capacity, support and policy
& procedures (Bos-Nehles, 2010). Desire and competencies will be discussed in the section on internal
HR implementation attributions. Capacity, support and policy & procedure will be discussed in the
external HR implementation attributions section.
Internal implementation attributions
The first constraint looks at whether line managers and supervisors have the desire to perform HR
activities. In other words, are they motivated to spend time on these tasks? It appeared that the line
managers at Benchmark Electronics are very willing to execute these activities. In fact, they felt like it
was part of their daily activities and therefore find it natural that they have to perform some HR
activities (S1, r.336-338). Of course there are also managers whom admitted that some HR activities are
less enjoyable. For instance when I asked about performance appraisals, one manager admitted that:
“It is not my hobby. But it is part of the job, so you do them anyway.” (S1, r.183).
Variable b
df t p
Intercept 8.943 42 1.663 .104
Age -.002 42 -.195 .846
Tenure -.014 42 -2.112 0.41
Career Encouragement .156 42 1.401 .169
Affective Commitment .158 42 1.131 .264
Positive Internal HR Attributions -.028 42 -.024 .981
Negative Internal HR attributions -.403 42 -.272 .787
External HR attributions -1.983 42 -1.451 .154
Internal HRM implementation attributions -2.072 42 -1.200 .237
External HRM implementation attributions .225 42 .146 .885
Pos. Int. HR Attr. * Int. HRM Imp. Attr. -.508 42 -1.1012 .317
Pos. Int. HR Attr. * Ext. HRM Imp. Attr. .543 42 .928 .359
Neg. Int. HR Attr. * Int. HRM Imp. Attr. .363 42 .407 .686
Neg. Int. HR Attr. * Ext. HRM Imp. Attr. -.179 42 -.176 .861
Ext. HR Attr. * Int. HRM Imp. Attr. .795 42 1.733 .090
Ext. HR Attr. * Ext. HRM Imp. Attr. -.310 42 -.749 .458
43
One of the biggest constraints in performing HR activities is the lists line managers have to make with
regards to the holidays and days off. Over the years there has been a built up on remaining days off
employees can withdraw. This caused headquarters to enforce a new rule, which states that a list has to
be handed in every week on the amount of days left to be withdrawn by every employee. Several
managers have found this to be a terrible task and very demotivating (S1, r.146-150).
Next to these minor objections, the line managers and supervisors do not mind to perform HR activities.
When it comes to recruitment and selection for example, managers find it interesting to find new
people to work for Benchmark Electronics (S2, r.108). Therefore it can be concluded that desire is not a
line manager implementation constraint that is present at this organization.
The second internal implementation attribution is competencies. This look at whether the line managers
and supervisors have the right skills to perform HR activities. Again for this implementation attribution
managers feel like they know what they are supposed to do (S2, r.58). One of the bigger difficulties the
manager’s experience lies with the recruitment and selection of new employees. One manager believes
that they have to learn to ‘sell themselves’ better. What he means to say is that they need to learn how
to position themselves better towards headquarters so it will take less time and trouble to gain
permission to hire new people. Some managers cope with this problem by focusing on a short-term
period when it comes to recruitment and selection. There is no real long term plan present for these
situations S3, r.231-232).
When asked how well the managers share information within their departments, a certain amount of
confidence arises. However one manager questions if the employees themselves feel like enough
information is shared with the organization or if they have a greater need for information (S3, r.387-
389).
Like the first implementation attribution, the line managers and supervisors are reasonably confident
about their own competencies. The biggest implementation constraints lie within the external
implementation attributions.
External implementation attributions
Capacity is the first external implementation attributions. Line managers need enough time and
resources to execute HR activities. For Benchmark Electronics capacity forms one of the bigger
constraints. As is true for many organizations; “time is money” (S1, r.16). The HR activity training and
selection definitely suffers because of this constraint:

44
“We can’t spend that much time on it. As you can see with us, our income is what we sell to the
customer. So every hour we cannot sell to the customer, is at the expense of our turnover.” (S1,
r.12-14).
Most of the employees are part of a project, and taking them out of the project for even one week
would be very difficult (S1, r.8-9).
One of the managers really experiences a time constraint on almost every HR activity he tries to do.
Because of the large amount of responsibilities he has, spending time on HR activities really becomes
troublesome (S1, r.173-176). However not all line managers feel this way. One of them sees no problem
at all to find the time to do these activities (S3, r.20-22). A couple of line managers have found some
timesaving methods to cope with this constraint. For instance one manager keeps a weekly log on
employee performance. When it is time for performance appraisals, a lot of time can be saved writing
these by looking back at his log (S3, r.257-260). Other line managers have monthly talks with employee
in preparation for the performance appraisal talks (S3, r.255-256), or have employees first fill out their
own appraisal form before given them the final performance appraisal (S3, r.264-267).
This way it becomes clear that although most of the line managers and supervisors experience capacity
as a real HR implementation constraint, several managers have found smart solutions to deal with this
problem.
The second external implementation attribution is support. The HR professionals in the organization
have to give a certain amount of support to line managers and supervisors. It became clear that the line
managers and supervisors feel like they can depend on the expertise of the HR professionals when it
comes to subjects like collective employment agreements (S1, r.160-162) and other HR business (S1,
r.123-137; S1, r.163-164). The biggest lack of support line manager’s experience is that the HR
professionals spent too little time on the actual work floor. They would like to see that the HR
professionals spent some time talking to the employees, so they know what is going on in the
organization (S1, r.310-315; S2, r.334-335). One of the managers stated that:
“The HR department is not just there for the company, but also for the people.” (S2, r.339-341).
The HR department does provide a reasonable amount of support regarding recruitment and selection.
When there is a job opening, a form can be handed to the HR department and they will take care of the
rest (S3, r.179-183). A downside to this process is that some line managers feel like they get a too small
45
amount of choice between candidates for a job opening (s2, r.96-98). Some managers also feel like the
HR department could put more effort into the announcements of job openings within the organization.
When there is a new job opening, the HR department does not always make an internal announcement
about it (S3, r.203-204). A problem that arises from this is that:
“There are people who already work internal who do not have the possibility to apply for a job
opening, simply because they do not know they exist.” (S3, r.207-209).
This lack in sharing information also forms a problem with general announcements. These
announcements can come as a surprise to the line managers and supervisors (S1, r.260), which leaves
them unprepared for questions of employees that tend to follow. They have requested that the line
managers are informed before the announcement come out, so they can prepare for the questions that
will follow (S1, r.258-259).
There is also a limited budget for training and development, which can form a support constraint (S1,
r.5). Basically there are only two types of training that can be offered to employee, the rest is “not
done” (S2, r.9-10). One of the managers replied somewhat frustrated that these are merely offered
because they are required for quality demands. He added that:
“When it comes to training for personal development within the company, they will not respond
to it nor will they acknowledge a budget for it”. (S2, r.13-15).
Finally the employee administration can be improved. There are 20 different systems in which the
employees are registered, and the information is different in every one of them. This is caused by
changes that are made in one of the systems but not in the others. (S1, r.316-322).
The last external implementation constraint is policy & procedures. This looks at policy & procedures
that coordinate and gives advice on the use of HR practices. From the focus groups sessions it became
clear that this is experienced as the biggest constraint at Benchmark Electronics. The most important
issue here is the lack of an objective appraisal system on how to appraise employees (S1, r. 196-200).
“[…] the assessment is very personal. You can make a kind of ranking when it comes to yourself.
But what you really want is a standard policy within the company at which you can measure
everyone, to make it less subjective.” (S1, r.196-200)
46
There is an appraisal form present in the organization which has examples and a short explanation on
what is meant by the descriptions in the forms (S3, r.347-348). But most line managers find the appraisal
form is unsuitable (S2, r.196) and outdated (S2, r.198; S2, r.198). It contains items which are not relevant
anymore and all items have a description that is unclear (S2, r.206-208). In a similar fashion, some line
managers would like a system on how to asses job applicants (S1, r.323-327).
Information sharing happens somewhat unstructured at Benchmark Electronics. After a meeting with
management, line managers and supervisors have to think for themselves which information to share
with their department, and when to share this information. This sometimes leads to criticism towards
the line managers from the employees (S1, r.240-244). Most of the time line managers gathers their
team and shares information when it is convenient. This leads to some information being left out (S1,
r.246-247). For most line managers and supervisors the so called BAM boards offer a solution. These are
the Benchmark Accountability Management boards and gives them the opportunity to share important
information with employees in a structured fashion (S2, r.272-273; S2, r.321; S3, r.357-358). However
these boards are not available for every line manager and supervisor yet. Some of the other
departments have a monthly Group Work Meeting, but only if there is important information that needs
to be shared (S3, r.267; S3, r.369-371). Announcements will be shared here but this is still not a
structured approach to sharing information. This same lack of policy & procedures can be found with
participation of employees. The line managers challenge their employees to come up with new ideas
(S1, r.276) and keep an eye on further developments based on these ideas (S1, r.271-273) but there is
no standard procedure on how to deal with innovative ideas coming from employees.
On the contrary there are also several policies & procedures which are actually too elaborate or strict.
The policy & procedures regarding recruitment and selection tends to be constraining for this reason.
For every employee that a line manager wants to add to their team, a corresponding rise in revenue has
to occur. If the line managers cannot justify this, it becomes very difficult to hire new people (S1, r.75-
77). For the production side this is somewhat easier, because a new employee is usually connected to
more output. However for the engineering side at Benchmark Electronics, a new employee can almost
only be hired when they have a Purchase Order (S1, r.104-105; S1, r.107-111). As was mentioned in the
previous section on support, the policy & procedure on planning is also very strict. Supervisors from the
production side have to make a planning for the entire year of when employees will take their holidays
and other days off. This is very difficult to do, but is demanded by headquarters (S2, r.159-161).
47
A positive movement can be found concerning the training and development of employees. A new
program called Who 3.0 gives rise to more training opportunities. With the Personal Development Plans
(PDP) employees have the possibility to tell about their need for training and let the line managers know
where they want to be in a few years (S3, r.22-26). There is a certain amount of freedom at Benchmark
Electronics concerning training and development programs (S3, r.56-57) but in order to make use of this,
a strong foundation has to made for it in the form of the PDPs (S3, r.62-65). Unfortunately this program
is still a work in progress (S3, r.37-43) and appears to be established only within a few of the engineering
departments.
48
Discussion
In the final section of this thesis the theoretical and practical implications of the results are discussed.
Although not every hypothesis proved to be significant, new insights can be gathered from this research
which could benefit future research on this topic. This is explained in the theoretical implications
sections, by discussing the results step by step following the research model. The practical implications
will give advice for organizations and Benchmark Electronics in specific on how to deal with this
information. Furthermore some limitations of this research are presented and finally advice for future
research is given.
Theoretical and practical implications
The theoretical implications will be presented by discussing the complete research model step by step.
The first part of the model looked at the employee HR attributions and HRM co-production. Employee
HR attributions did not appear to have any significant relations with HRM co-production. This means
that the perceived motivation of why HR practices are implemented in the organization, does not
determine the level of active participation of employees in these HR practices. Positive internal
employee HR attributions did have significant effects on other concepts (Nishii et al., 2008) and might
still be relevant for studies investigating similar concepts. However when it comes to HRM co-
production it might not be very fruitful to investigate this relationship any further.
The same goes for line managers’ HR implementation attributions. Even though line managers
implementation constraints have proved to be significant in determining HR implementation
effectiveness (Bos-Nehles, 2010), it was unsuccessful in explaining the relation between employee HR
attributions and HRM co-production as a moderator. It was hypothesized that a moderation effect of
external HR implementation attributions would not be found, but it would be the case for internal HR
implementation attributions. The fact that there were hardly any internal HR implementation
attributions might be the reason why this moderation effect between employee HR attributions and
HRM co-production could not be found. The strong correlation between the internal and external HRM
implementation attributions (r=.753, p<0.01) might form a second reason why no prove for a
moderation effect could be found. This strong correlation could mean that the constructs are not
different, but in fact measure the same concept.
49
The third part of the model looked at the relationship between HRM co-production and perceived HR
intensity. There appeared to be a significant relation between these constructs, such that a high level of
HRM co-production leads to a strong perceived HRM intensity, and a low level of HRM co-production
leads to a weak perceived HRM intensity. The significant relations found concerning HRM co-production
provides support for this new concept. Its impact on perceived HR intensity shows that the active
involvement of employees in the delivery of HR practices is important for an effective execution of HR
practices.
The last part of the model looked at the relation between perceived HR intensity and job performance.
The significant relation between these constructs found in this thesis provides further support for the
established link between these concepts. This thesis adds to current research by taking an individual
perspective on perceived HR intensity and job performance, rather than a managerial viewpoint.
Because it is the employees themselves that determine the job performance, it is useful to look at how
they perceive the HR practices. Research on the link between HR practices and performance remains
relevant, also when it is viewed from an individual level.
There were also some remarkable results that were not hypothesized. The first is the positive relation
between positive internal HR attributions and perceived HR intensity (β=.295, p<0.01). This relation may
have been found because when employees are positive about the attributions of HR practices, they
might also be more positive about how they perceive implemented HR practices. The fact that a direct
relationship between these variables was found and not with HRM co-production in between, might be
because of the same reason there are no relationships found between the employee HR attributions
constructs and HRM co-production. Namely that several employees have commented on the HRM co-
production questionnaire that they feel not responsible for HR practices, but that their supervisors are
responsible for it. This would explain why HR attributions are not related to HRM co-production, but the
perceived HR intensity variable do show several significant regressions. The second remarkable result is
the negative relation between positive internal HR attributions and job performance. It is possible this
result is found due the formulation of the positive internal HR attribution items. This concept was
divided into factors that measure if HR practices are offered to enhance employee well-being or if HR
practices are offered to increase service quality towards customers. One can imagine that a skeptical
employee would see the motivation to increase service quality as a method for the organization to
increase its revenue, instead of a method that is meant to be beneficial for the employee itself.

50
Therefore this item might not be interpreted as a positive motivation for every employee and leads to
the negative relation found between positive internal HR attributions and job performance.
Perhaps the most important practical implications for Benchmark Electronics and similar organizations is
that viewpoint of employees have to be taken into consideration. Especially because HRM co-production
appeared to be significant in explaining perceived HR intensity and job performance. Organizations
could monitor the active involvement of employees in HR activities once in a while. In this study this is
done by asking the employees themselves about their level of involvement. Another option is to ask the
line managers about the active involvement of employees in his/her department.
Implications for Benchmark Electronics in specific are mostly derived from the qualitative analysis. In
general most line manager’s experience limited internal HR implementation attributions and more
external HR implementation attributions. For these constraints there are several simple solutions and a
couple solutions that might take some more resources. To increase the support from HR professionals as
experienced by the line managers, HR professionals could enforce a weekly stroll on the work floor. This
gives line managers an opportunity to ask non-urgent questions and a casual way for employees to get
to know the HR department. Solutions that are perhaps more extensive include the introduction of an
HR platform. There is an indirect need amongst line managers and supervisors to share information with
each other about HR activities. This HR platform could serve as a place where line managers can share
useful tips on how to deal with time consuming HR activities such as performance appraisal and
scheduling. It would also give the opportunity to promote the Who 3.0 program, which gives guidance
on the training and development of employees in the form of a Personal Development Plan. This
solution would require an investment into e-HRM.
Limitations As is the case for many social studies, this research has limitations that have to be considered. There are
several limitations concerning the research design, which will be discussed first. For HRM co-production
the initial plan was to measure this by letting line managers and supervisors judge the level of HRM co-
production as executed by employees. However there were several objections and concerns about
judging employees in this manner. Therefore we decided to ask the employees themselves to judge
their own level of HRM co-production. This could lead to a common method bias, due to the
independent and dependent variables that are measured from the same source. Another source of
common method bias can come from the constructs perceived HR intensity and job performance, which

51
are both measured at T3. Due to the number of questionnaires set out in a relatively short time span, it
was not possible to measure these construct separately as well.
A limitation for the internal HR implementation attributions may be that the line managers and
supervisors are inclined to give socially desirable answers. Because the interviews were held in groups,
the line managers might not have been completely honest on subjects concerning their desire and
competencies. This limitation might have been overcome by interviewing the line managers personally.
However this was not possible for this study due to time constraints.
There are also some limitations concerning the sample. Initially there were 21 departments at
Benchmark Electronics that could be used for data analysis; however 2 departments became unsuitable
for further analysis. The first department had to be left out of the study due to a line manager who quit
his job during the process of data gathering. The second department had to be left out because it was
not possible to determine which employee filled in each questionnaire. This was necessary for adding
further information to the cases and the aggregation process for data analysis. Another limitation was
that the response rate ended up quite low. The initial response rate (T1) was a bit lower than expected
because questionnaires could not be filled in anonymously. Naturally confidentially was assured to
respondents; however it is likely that this was not enough assurance for every employee. After T2 and
T3 there was another drop in response rates. This is likely because employees felt like filling in all three
questionnaires would take up too much time. Due to the somewhat moderate response rate to the
questionnaires, the validity of these findings is not as strong as it could have been. Generalization to
similar organizations is possible, but generalization to organizations in different sectors has to be done
with a certain amount of caution. Another limitation of the sample is that they are on average slightly
older (48.5) and have been working for this organization for quite some time (18.2 years). Different
results may have been found in an organization with younger employees, who have not worked in the
same organization for a long time.
The difference between employees of the production and employees of the engineering side of
Benchmark Electronics might also be a source of limitations. First of all because of the difference in
educational levels that exists between the two sides of the organization. There were several employees
of the production side complaining some of the items were too difficult to understand. There were also
remarks given in some questionnaires that, especially for the production side, employees had very little
to do with the HR activities. Therefore a lot of neutral answers were given on questions concerning HR

52
activities they felt like they had no control over. Because there was not always a possibility to check a
‘not appropriate’ box, this is difficult to check.
Future research
Options for future research are multiple. Firstly research on these topics could be elaborated to other
sectors and perhaps even other countries. This would strongly improve validity and with it
generalizability of the results. Especially the new concept of HRM co-production asks for further
research. The active involvement of employees in HR activities is a significant predictor for perceived HR
intensity and job performance. Research on other predecessors and antecedents in this relation is
necessary. An example of possible predecessors are the five constraints by Bos-Nehles (2010) used in
this thesis as line managers HR implementation attributions. Perhaps the desire, competencies, capacity,
support from HR professionals and policy & procedures as experienced by the employees can form an
explanation why some employees have a higher level of HRM co-production as others. Other options for
future research can be found in the significant results that were not hypothesized. The found relations
between positive internal HR attributions and perceived HR intensity, and between positive internal HR
attributions and job performance ask for a further literature study and perhaps even data analysis
focused on these constructs specifically.
To improve results of this research it would have been better if the line managers determined the level
of HRM co-production instead of the employees themselves. Due to objections in this organization it
was not possible for this research. Even though there was no significant difference between the
questionnaires filled in by employees and line managers, there could be a common method bias.
Another improvement for this research would have been to interview the line managers separately
instead in a group session. Especially for the internal HR implementation constraints social desirable
answers might have been given. Future research could prevent this from happening by interviewing the
line managers one by one, if the time limit does not form a constraint. Finally it might have been better
to take the different educational levels into account when developing the questionnaires. This way it can
be assured that all employees correctly understand the questions.
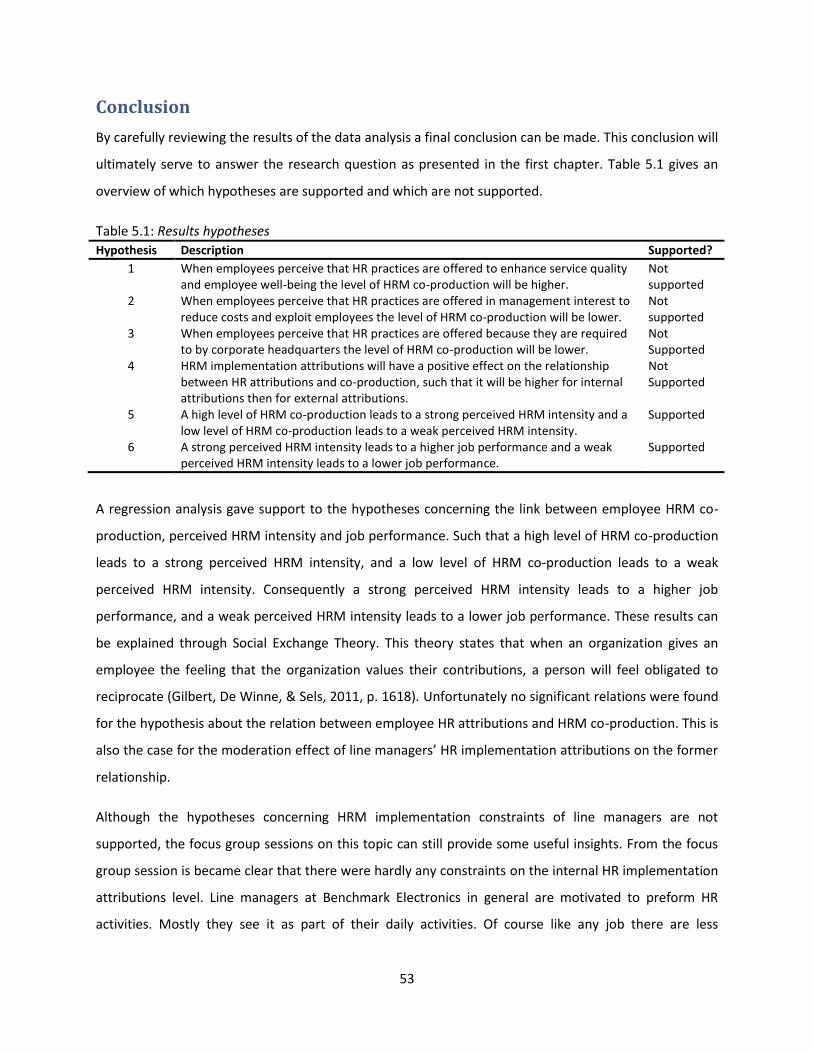
53
Conclusion
By carefully reviewing the results of the data analysis a final conclusion can be made. This conclusion will
ultimately serve to answer the research question as presented in the first chapter. Table 5.1 gives an
overview of which hypotheses are supported and which are not supported.
Table 5.1: Results hypotheses
Hypothesis Description Supported?
1 When employees perceive that HR practices are offered to enhance service quality and employee well-being the level of HRM co-production will be higher.
Not supported
2 When employees perceive that HR practices are offered in management interest to reduce costs and exploit employees the level of HRM co-production will be lower.
Not supported
3 When employees perceive that HR practices are offered because they are required to by corporate headquarters the level of HRM co-production will be lower.
Not Supported
4 HRM implementation attributions will have a positive effect on the relationship between HR attributions and co-production, such that it will be higher for internal attributions then for external attributions.
Not Supported
5 A high level of HRM co-production leads to a strong perceived HRM intensity and a low level of HRM co-production leads to a weak perceived HRM intensity.
Supported
6 A strong perceived HRM intensity leads to a higher job performance and a weak perceived HRM intensity leads to a lower job performance.
Supported
A regression analysis gave support to the hypotheses concerning the link between employee HRM co-
production, perceived HRM intensity and job performance. Such that a high level of HRM co-production
leads to a strong perceived HRM intensity, and a low level of HRM co-production leads to a weak
perceived HRM intensity. Consequently a strong perceived HRM intensity leads to a higher job
performance, and a weak perceived HRM intensity leads to a lower job performance. These results can
be explained through Social Exchange Theory. This theory states that when an organization gives an
employee the feeling that the organization values their contributions, a person will feel obligated to
reciprocate (Gilbert, De Winne, & Sels, 2011, p. 1618). Unfortunately no significant relations were found
for the hypothesis about the relation between employee HR attributions and HRM co-production. This is
also the case for the moderation effect of line managers’ HR implementation attributions on the former
relationship.
Although the hypotheses concerning HRM implementation constraints of line managers are not
supported, the focus group sessions on this topic can still provide some useful insights. From the focus
group session is became clear that there were hardly any constraints on the internal HR implementation
attributions level. Line managers at Benchmark Electronics in general are motivated to preform HR
activities. Mostly they see it as part of their daily activities. Of course like any job there are less
54
enjoyable parts, in this case the procedure around holidays and days off is considered as less enjoyable.
Despite this the line managers and supervisors see it as their duty to perform this task, and put in
required the effort. The line managers also feel like they have the right competencies to perform HR
activities. The only weak point to be found here is that they have to present themselves stronger when
it comes to hiring new employees. They find it sometimes difficult to prove the necessity to hire new
people for their departments. Even though there were only a few constraints on the internal
implementation attributions level, there were more constraints found on the external implementation
attributions level. Due to a limited capacity the line managers cannot put a lot of time in the training and
development of their employees. Because most of them work on a project basis, ‘time is money’ and
employees cannot be missed for a longer period. For the other HR activities there is a difference
between the line managers in how much time they have. Some managers have no problem executing
HR activities, for others it can be troublesome to do these next to their regular job description. The
workload for line managers does not seem to be equally distributed in this organization. Several line
managers have found clever solutions to deal with their capacity constraint. This might explain why
some managers experience this constraint whilst others appear to have no problem with it. When it
comes to support from the HR professionals, most line managers and supervisors feel like they can
count on the HR professionals when it comes to HR specific knowledge. However they feel like they do
not get enough support from the HR department on the work floor. The HR department does not have a
face in at Benchmark Electronics, which causes a lot of employees not knowing who the HR
professionals are. There is also lack of support due to the limited amount of information that gets
shared; this can be preliminary information before an announcement is made or sharing job openings
with the entire organization. Finally for policy & procedures the biggest constraint lies in forms for
performance appraisal. Almost every line managers and supervisors thinks that this form can be
improved on multiple aspects. For other HR activities it appears that there are in fact policy &
procedures present, but these are not clear for every manager. For example most managers find it
difficult to gain support for training and development of their employees. One manager explained that it
certainly is possible with the new program Who 3.0, which says that employees have to show they want
further training in their Personal Development Plan. This program is not yet known with every line
manager and supervisor, therefore not every line managers knows how to offer these HR activities to
their employees in an efficient manner.
55
After this summary of the findings, the final answer to research question can be given. As a reminder the
research question is stated again: “To what extent do employees’ and line managers’ HR attributions
influence co-production and job performance?”
Employee HR attributions and line managers’ HR implementation attribution do not significantly
influence HRM co-production, perceived HR intensity and job performance. However significant
relations can be found in the second part of the model, such that HRM co-production significantly
predicts perceived HR intensity (R2 =.435, F (8.51) = 4.9, p<0.001), and that perceived HR intensity
significantly predicts job performance (R2 =.681, F (9.50) =11.868, p<0.001). It must be noted that
especially for external HR implementation attributions several constraints are found, which should not
be ignored because they do not have a significant relation with the outcome variables.

56
Appendix A: Questionnaire items in Dutch
Questionnaire 1: Employee HR Attributions
All items are asked on a 5-point Likert scale, ranging from strongly disagree to strongly agree. Benchmark Electronics biedt medewerkers zijn trainingen / opleidingen aan…(Nishii et al., 2008)
om medewerkers te helpen een goede service/product aan klanten te leveren.
om het welzijn van medewerkers te bevorderen (bijv. zich gewaardeerd en gerespecteerd voelen).
om kosten laag proberen te houden.
omdat ze vereist zijn van het hoofdkantoor in de Verenigde Staten.
om medewerkers de grootst mogelijke opbrengst te laten produceren. Benchmark Electronics biedt medewerkers zijn secundaire arbeidsvoorwaarden (bijv. dertiende maand, levensloop-regeling, fietsplan en reiskostenvergoeding) aan…(Nishii et al., 2008)
om medewerkers te helpen een goede service/product aan klanten te leveren.
om het welzijn van medewerkers te bevorderen (bijv. zich gewaardeerd en gerespecteerd voelen).
om kosten laag proberen te houden.
omdat ze vereist zijn van het hoofdkantoor in de Verenigde Staten.
om medewerkers de grootst mogelijke opbrengst te laten produceren. Benchmark Electronics maakt zijn keuzes rondom het aannemen van personeel (bijv. over de hoeveelheid en kwaliteiten van nieuw personeel)…(Nishii et al., 2008)
om medewerkers te helpen een goede service/product aan klanten te leveren.
om het welzijn van medewerkers te bevorderen (bijv. zich gewaardeerd en gerespecteerd voelen).
om kosten laag proberen te houden.
omdat ze vereist zijn van het hoofdkantoor in de Verenigde Staten.
om medewerkers de grootst mogelijke opbrengst te laten produceren. Datgene wat Benchmark Electronics betaalt aan zijn medewerkers doen ze…(Nishii et al., 2008)
om medewerkers te helpen een goede service/product aan klanten te leveren.
om het welzijn van medewerkers te bevorderen (bijv. zich gewaardeerd en gerespecteerd voelen).
om kosten laag proberen te houden.
omdat het vereist is van het hoofdkantoor in de Verenigde Staten.
om medewerkers de grootst mogelijke opbrengst te laten produceren. De manier waarop Benchmark Electronics medewerkers inroostert (bijv. aantal te werken uren, flexibiliteit en toekennen van verlof) doen ze…(Nishii et al., 2008)
om medewerkers te helpen een goede service/product aan klanten te leveren.
om het welzijn van medewerkers te bevorderen (bijv. zich gewaardeerd en gerespecteerd voelen).
om kosten laag proberen te houden.
omdat het zo vereist is van het hoofdkantoor in de Verenigde Staten.
om medewerkers de grootst mogelijke opbrengst te laten produceren. De manier waarop Benchmark Electronics medewerkers beoordeeld doen ze…(Nishii et al., 2008)
om medewerkers te helpen een goede service/product aan klanten te leveren.
om het welzijn van medewerkers te bevorderen (bijv. zich gewaardeerd en gerespecteerd voelen).
om kosten laag proberen te houden.
omdat het zo vereist is van het hoofdkantoor in de Verenigde Staten.
om medewerkers de grootst mogelijke opbrengst te laten produceren.
57
De manier waarop Benchmark Electronics informatie met medewerkers deelt doen ze…(Nishii et al., 2008)
om medewerkers te helpen een goede service/product aan klanten te leveren.
om het welzijn van medewerkers te bevorderen (bijv. zich gewaardeerd en gerespecteerd voelen).
om kosten laag proberen te houden.
omdat het zo vereist is van het hoofdkantoor in de Verenigde Staten.
om medewerkers de grootst mogelijke opbrengst te laten produceren. De manier waarop Benchmark Electronics informatie met medewerkers deelt doen ze…(Nishii et al., 2008)
(Nishii et al., 2008)om medewerkers te helpen een goede service/product aan klanten te leveren.
om het welzijn van medewerkers te bevorderen (bijv. zich gewaardeerd en gerespecteerd voelen).
om kosten laag proberen te houden.
omdat het zo vereist is van het hoofdkantoor in de Verenigde Staten.
om medewerkers de grootst mogelijke opbrengst te laten produceren. De manier waarop Benchmark Electronics medewerkers aan besluitvorming laat deelnemen doen ze…(Nishii et al., 2008)
om medewerkers te helpen een goede service/product aan klanten te leveren.
om het welzijn van medewerkers te bevorderen (bijv. zich gewaardeerd en gerespecteerd voelen).
om kosten laag proberen te houden.
omdat het zo vereist is van het hoofdkantoor in de Verenigde Staten.
om medewerkers de grootst mogelijke opbrengst te laten produceren. Leader Member Exchange (LMX) (Graen & Uhl-Bien, 1995)
Mijn leidinggevende is bereid om de invloed/bevoegdheid die hij/zij als leidinggevende heeft in te zetten om mij te helpen problemen in mijn werk op te lossen.
Ik kan erop rekenen dat mijn leidinggevende mij zal steunen als dat nodig is, ook al levert dit misschien problemen voor hem/haar op.
Mijn leidinggevende begrijpt mijn behoeften en problemen op het werk.
Mijn leidinggevende erkent mijn capaciteiten.
Mijn leidinggevende heeft vertrouwen in mij, zodat hij/zij mijn beslissingen zal verdedigen als ik afwezig ben.
Doorgaans weet ik hoe tevreden mijn leidinggevende is met mijn prestaties op het werk.
Mijn werkrelatie met mijn leidinggevende is effectief. Career Encouragement (Tharenou, 2001)
De mate waarin mijn leidinggevende mij heeft aangemoedigd om mijn carrière verder te ontwikkelen (bijv. nastreven van een promotie binnen of buiten Benchmark Electronics) is hoog.
De mate waarin mijn directe collega’s mij hebben aangemoedigd om mijn carrière verder te ontwikkelen is hoog.
De mate waarin een persoon buiten Benchmark Electronics mij heeft aangemoedigd om mijn carrière
verder te is hoog.
58
Questionnaire 2: Employee HRM Co-production
All items are asked on a 5-point Likert scale, ranging from strongly disagree to strongly agree. Trainingen, opleidingen en persoonlijke ontwikkeling (Tims et al., 2012)
Ik probeer mijn vaardigheden te ontwikkelen.
Ik probeer me verder te professionaliseren in mijn werk.
Ik probeer nieuwe dingen te leren op het werk.
Ik vraag mijn leidinggevende om mij te coachen. Werving en selectie
Ik help bij het opstellen van functie- en/of vacatureomschrijvingen.
Ik draag potentiële nieuwe medewerkers aan.
Ik promoot Benchmark Electronics als een attractieve werkgever (bijv. bij opleidingsinstituten, (banen)beurzen of professionele verenigingen).
Ik ben betrokken bij het selecteren van nieuwe medewerkers.
Ik neem deel aan sollicitatiegesprekken.
Ik help bij het screenen/doorlichten van sollicitatiebrieven en/of C.V.’s. Beoordeling (Tims et al., 2012)
Ik vraag mijn leidinggevende of hij/zij tevreden is met mijn werk.
Ik bespreek ideeën met mijn leidinggevende over hoe mijn werkprestatie verbeterd kan worden.
Ik vraag anderen om feedback over mijn werkprestatie.
Ik vraag collega’s om advies over hoe mijn prestatie verbeterd kan worden. Participatie (Liao et al., 2009) [DROPPED]
Ik stel verbeteringen voor producten en/of diensten voor.
Ik neem binnen Benchmark Electronics deel aan het maken van beslissingen. Taak ontwerp (Tims et al., 2012)
Als zich een interessant project voordoet, bied ik mezelf proactief als projectmedewerker aan.
Als zich nieuwe ontwikkelingen voordoen, ben ik één van de eerste die zich hierin verdiept en ze toepast.
Als het op het werk rustig is, zie ik dit als een kans om
nieuwe / andere taken op me te nemen.
Ik neem regelmatig nieuwe taken op me, zelfs als ik hier geen extra vergoeding voor krijgt.
Ik probeer te onderzoeken hoe taken gecombineerd kunnen worden, om zo mijn werk uitdagender te maken.

59
Questionnaire 3: Perceived HR intensity and Job Performance
All items are asked on a 5-point Likert scale, ranging from strongly disagree to strongly agree. Werving en selectie (Takeuchi et al., 2007) De selectie van nieuw personeel…
is uitgebreid/uitvoerig.
legt de nadruk op het talent om samen te werken in een team.
houdt in dat veel sollicitanten gescreend worden.
richt zich op het selecteren van de beste all-round sollicitant.
legt de nadruk op de bevordering van huidige medewerkers (interne promotie).
geeft prioriteit aan het leervermogen van de sollicitant. Training (Liao et al., 2009)
De training die ik bij Benchmark Electronics heb doorlopen, hebben mij goed voorbereid om kwaliteit te leveren.
Benchmark Electronics biedt mij voldoende opleiding om goed met de introductie van nieuwe producten of diensten om te kunnen gaan.
Ik neem normaal gesproken om de paar jaar deel aan een training programma om mijn vaardigheden te verbeteren.
Benchmark Electronics ondersteunt mij om trainingen bij te wonen.
Ik heb inspraak in hoeveel scholing ik krijg.
Als ik in mijn eigen tijd extra scholing volg, dan betaalt Benchmark Electronics dit. Beoordeling (Takeuchi et al., 2007)
Mijn beoordeling is gebaseerd op objectieve en meetbare resultaten.
Mijn leidinggevende stelt samen met mij prestatiedoelstellingen op waarop ik wordt beoordeeld.
Ik krijg feedback om mijn werkprestaties te verbeteren. Werkprestaties (Liao et al., 2009)
Alle aan mij toegewezen taken voer ik adequaat uit.
Ik voldoe aan alle verantwoordelijkheden die in mijn taakomschrijving staan.
Ik voer alle taken uit die van mij verwacht worden.
Ik voldoe aan alle prestatie-eisen die bij mijn werk horen.
Ik voer activiteiten uit die mijn prestatiebeoordeling direct beïnvloeden.
Ik help anderen die (lang) met verlof zijn geweest.
Ik besteed graag tijd aan het helpen van anderen die werk-gerelateerde problemen hebben.
Ik doe mijn best zodat nieuwe(re) medewerkers zich in mijn team welkom voelen.
Ik maak tijd om anderen te helpen die werk- of privé-gerelateerde problemen hebben.
Ik help anderen met het uitvoeren van hun taken. Beloning (Liao et al., 2009)
Een deel van mijn salaris/beloning is gebaseerd op hoe goed ik mijn werk doe.
Mijn salaris is volledig gebaseerd op hoe lang ik in dienst ben bij Benchmark Electronics.
Een deel van mijn salaris/beloning is gebaseerd op hoe Benchmark Electronics Almelo financieel gezien presteert.
Mijn salaris is hoger dan wat de concurrenten van Benchmark Electronics bieden.
Een deel van mij salaris/beloning is gebaseerd op de totale bedrijfsprestatie van Benchmark Electronics.
Ik geloof dat ik eerlijker betaald zou krijgen als ik bij een andere organisatie werkte. [R]
Mijn salaris hangt af van de kwaliteit van producten/diensten die ik lever.
De hoogte van mijn salaris hangt af van mijn werkprestaties.
60
Taakontwerp (Liao et al., 2009)
Mijn werk is simpel en behoorlijk herhalend. [R]
Ik heb veel kansen om zelf te bepalen hoe ik mijn werk doe.
Als er een probleem ontstaat in mijn werk, dan kan ik er zelf voor zorgen dat het wordt opgelost.
Ik heb weinig kansen om in mijn werk mijn eigen inzichten te gebruiken. [R]
Ik voel me vaak verveeld op het werk. [R] Participatie (Liao et al., 2009)
Ik heb het gevoel dat ik echt onderdeel ben van mijn team.
Als er een beslissing genomen moet worden, dan is iedereen daarbij betrokken.
Als ik op het werk ben, heb ik het gevoel controle te hebben over zaken die om mijn heen gebeuren.
Mijn leidinggevende vraagt mijn mening over hoe de kwaliteit van onze producten/diensten verbeterd kan worden.
Mijn ideeën over hoe de kwaliteit van producten/diensten verbeterd kan worden, worden normaal gesproken volledig of gedeeltelijk uitgevoerd binnen Benchmark Electronics.
Betrokkenheid (Allen & Meyer, 1990)
Ik zou heel blij zijn als ik de rest van mijn loopbaan bij Benchmark Electronics kan doorbrengen.
Ik geniet ervan om over Benchmark Electronics te praten met mensen die er niet werken.
Ik voel echt dat Benchmark’s problemen ook de mijne zijn.
Ik denk dat ik gemakkelijk gehecht kan raken aan een andere organisatie, zoals ik nu aan Benchmark Electronics gehecht ben. [R] [DROPPED]
Ik voel me niet als een ‘deel van de familie’ bij Benchmark Electronics. [R]
Ik voel me niet ‘emotioneel gehecht’ aan Benchmark Electronics. [R]
Benchmark Electronics betekent veel voor mij.
Ik voel me niet thuis bij Benchmark Electronics. [R]
61
Questionnaire Line Managers: HRM Implementations Attributions
All items are asked on a 5-point Likert scale, ranging from strongly disagree to strongly agree. Tijdbesteding aan HR verantwoordelijkheden (Bos-Nehles, 2010)
Het lijkt of het uitvoeren van mijn HR verantwoordelijkheden nooit afkomt. [R]
Soms heb ik het gevoel dat mijn werkdag te kort is. [R]
Vaak moet ik mijn verplichtingen voor mijn HR verantwoordelijkheden afzeggen. [R]
Het is nodig dat ik een prioriteitenlijstje maak om alle activiteiten die tot mijn leidinggevende taak behoren, te kunnen uitvoeren. [R]
Ik heb het gevoel dat ik HR verantwoordelijkheden gehaast en misschien minder zorgvuldig uitvoer om alles af te kunnen krijgen. [R]
Motivatie voor HR verantwoordelijkheden (Bos-Nehles, 2010) Waarom houdt u zich bezig met het uitvoeren van HR verantwoordelijkheden en taken?
Omdat ik vind dat het uitvoeren van deze activiteiten interessant is.
Omdat ik dit doe voor mijn eigen bestwil.
Omdat ik vind dat het goed voor me is om deze activiteiten uit te voeren.
Ik voer deze activiteiten uit maar ik ben er niet van overtuigd dat ze de moeite waard zijn. [R]
Omdat het leuk is deze activiteiten te verrichten.
Ik weet het niet, ik zie niet in wat deze activiteiten me opleveren. [R]
Omdat ik me prettig voel bij het uitvoeren van deze activiteiten.
Omdat ik geloof dat het verrichten van deze activiteiten belangrijk voor me is.
Ik verricht deze activiteiten, maar ik ben er niet zeker van dat het verstandig is hiermee door te gaan. [R]
Omdat het de mensen in mijn team helpt te groeien zichzelf te verbeteren en te ontwikkelen.
Omdat deze activiteiten me helpen mijn team aan te sturen.
Omdat het me helpt bij het bereiken van mijn productieafspraken.
Omdat het me helpt mijn medewerkers op een eerlijke en gelijke manier te behandelen. Competenties voor het uitvoeren van HR verantwoordelijkheden (Bos-Nehles, 2010)
Ik kan kalm blijven wanneer ik geconfronteerd word met moeilijkheden in het uitoefenen van mijn HR verantwoordelijkheden, omdat ik kan terugvallen op mijn vaardigheden.
Wanneer ik geconfronteerd word met een probleem bij het uitoefenen van mijn HR verantwoordelijkheden, dan vind ik meestal passende oplossingen.
Wat er ook gebeurt in het uitvoeren van mijn HR verantwoordelijkheden, ik kan het gewoonlijk wel aan.
De ervaringen die ik in het verleden in mijn HR verantwoordelijkheden heb opgedaan, helpen me om later goed om te gaan met mijn HR verantwoordelijkheden.
Ik bereik de doelstellingen die ik aan mezelf stel in het uitoefenen van mijn HR verantwoordelijkheden.
De verschillende trainingen die ik gevolgd heb, zijn belangrijk om mijn HR verantwoordelijkheden goed te kunnen uitvoeren. [DROPPED]
Het aanbod van de verschillende trainingen was voldoende om de HR verantwoordelijkheden goed te kunnen uitvoeren. [DROPPED]
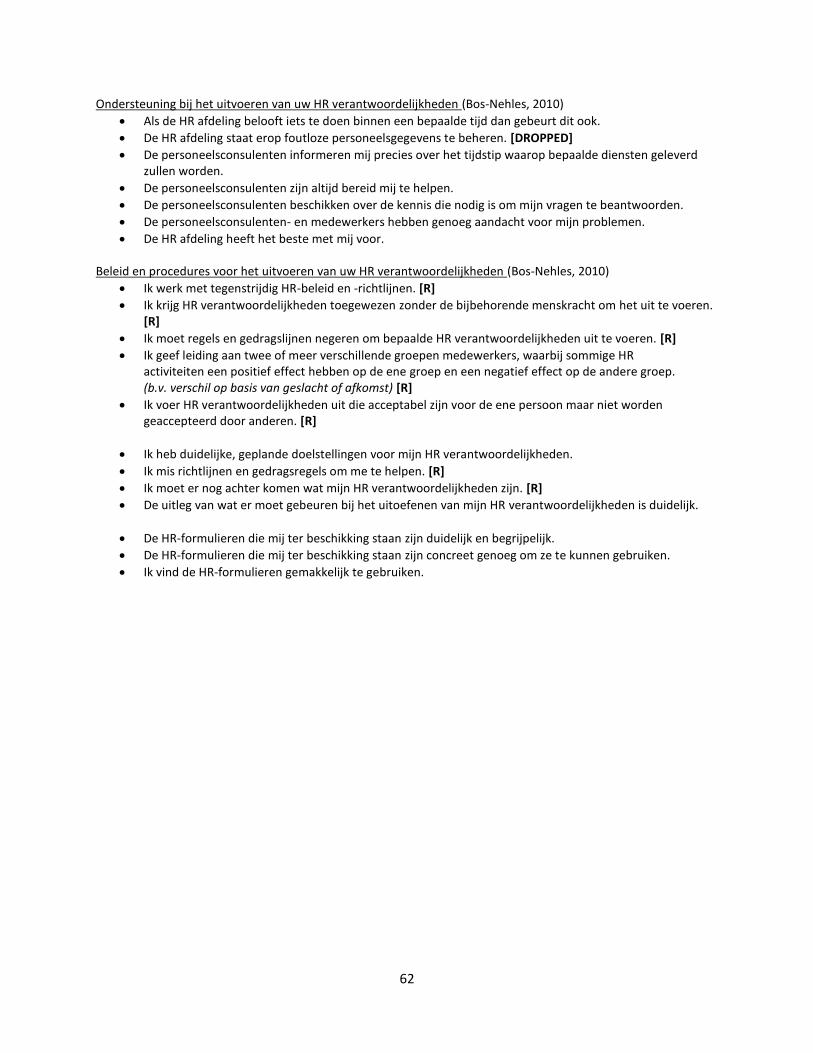
62
Ondersteuning bij het uitvoeren van uw HR verantwoordelijkheden (Bos-Nehles, 2010)
Als de HR afdeling belooft iets te doen binnen een bepaalde tijd dan gebeurt dit ook.
De HR afdeling staat erop foutloze personeelsgegevens te beheren. [DROPPED]
De personeelsconsulenten informeren mij precies over het tijdstip waarop bepaalde diensten geleverd zullen worden.
De personeelsconsulenten zijn altijd bereid mij te helpen.
De personeelsconsulenten beschikken over de kennis die nodig is om mijn vragen te beantwoorden.
De personeelsconsulenten- en medewerkers hebben genoeg aandacht voor mijn problemen.
De HR afdeling heeft het beste met mij voor. Beleid en procedures voor het uitvoeren van uw HR verantwoordelijkheden (Bos-Nehles, 2010)
Ik werk met tegenstrijdig HR-beleid en -richtlijnen. [R]
Ik krijg HR verantwoordelijkheden toegewezen zonder de bijbehorende menskracht om het uit te voeren. [R]
Ik moet regels en gedragslijnen negeren om bepaalde HR verantwoordelijkheden uit te voeren. [R]
Ik geef leiding aan twee of meer verschillende groepen medewerkers, waarbij sommige HR activiteiten een positief effect hebben op de ene groep en een negatief effect op de andere groep. (b.v. verschil op basis van geslacht of afkomst) [R]
Ik voer HR verantwoordelijkheden uit die acceptabel zijn voor de ene persoon maar niet worden geaccepteerd door anderen. [R]
Ik heb duidelijke, geplande doelstellingen voor mijn HR verantwoordelijkheden.
Ik mis richtlijnen en gedragsregels om me te helpen. [R]
Ik moet er nog achter komen wat mijn HR verantwoordelijkheden zijn. [R]
De uitleg van wat er moet gebeuren bij het uitoefenen van mijn HR verantwoordelijkheden is duidelijk.
De HR-formulieren die mij ter beschikking staan zijn duidelijk en begrijpelijk.
De HR-formulieren die mij ter beschikking staan zijn concreet genoeg om ze te kunnen gebruiken.
Ik vind de HR-formulieren gemakkelijk te gebruiken.
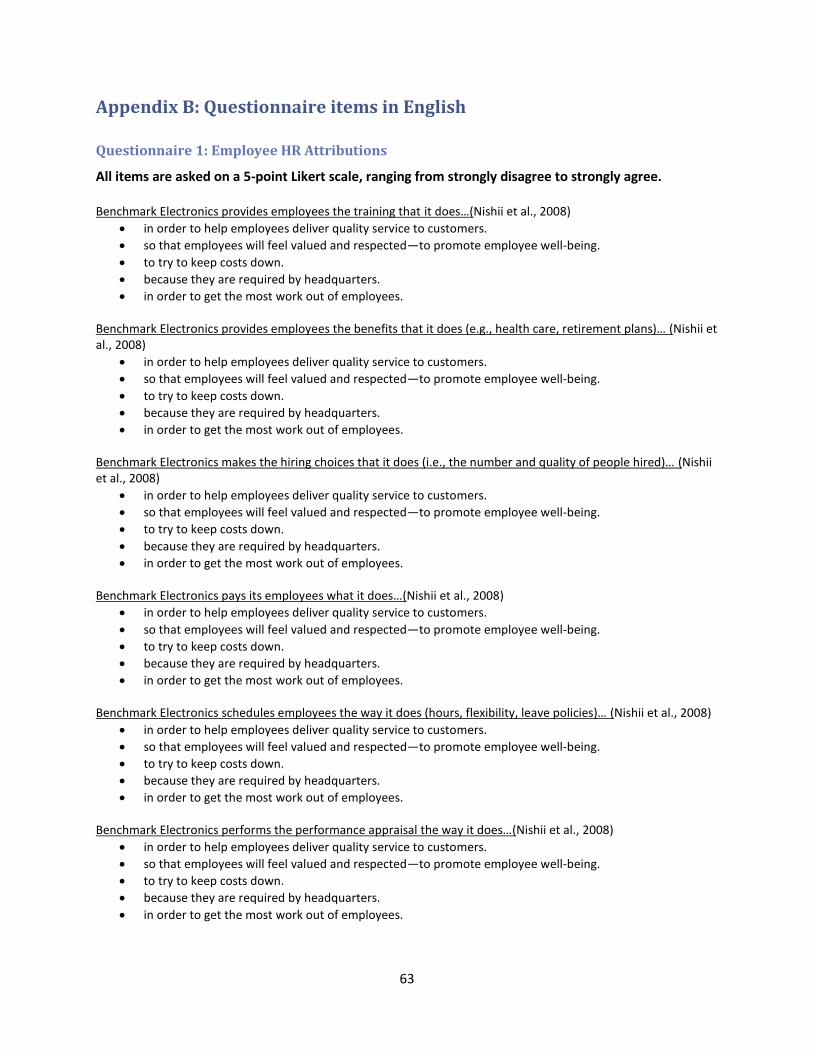
63
Appendix B: Questionnaire items in English
Questionnaire 1: Employee HR Attributions
All items are asked on a 5-point Likert scale, ranging from strongly disagree to strongly agree. Benchmark Electronics provides employees the training that it does…(Nishii et al., 2008)
in order to help employees deliver quality service to customers.
so that employees will feel valued and respected—to promote employee well-being.
to try to keep costs down.
because they are required by headquarters.
in order to get the most work out of employees. Benchmark Electronics provides employees the benefits that it does (e.g., health care, retirement plans)… (Nishii et al., 2008)
in order to help employees deliver quality service to customers.
so that employees will feel valued and respected—to promote employee well-being.
to try to keep costs down.
because they are required by headquarters.
in order to get the most work out of employees. Benchmark Electronics makes the hiring choices that it does (i.e., the number and quality of people hired)… (Nishii et al., 2008)
in order to help employees deliver quality service to customers.
so that employees will feel valued and respected—to promote employee well-being.
to try to keep costs down.
because they are required by headquarters.
in order to get the most work out of employees. Benchmark Electronics pays its employees what it does…(Nishii et al., 2008)
in order to help employees deliver quality service to customers.
so that employees will feel valued and respected—to promote employee well-being.
to try to keep costs down.
because they are required by headquarters.
in order to get the most work out of employees. Benchmark Electronics schedules employees the way it does (hours, flexibility, leave policies)… (Nishii et al., 2008)
in order to help employees deliver quality service to customers.
so that employees will feel valued and respected—to promote employee well-being.
to try to keep costs down.
because they are required by headquarters.
in order to get the most work out of employees. Benchmark Electronics performs the performance appraisal the way it does…(Nishii et al., 2008)
in order to help employees deliver quality service to customers.
so that employees will feel valued and respected—to promote employee well-being.
to try to keep costs down.
because they are required by headquarters.
in order to get the most work out of employees.
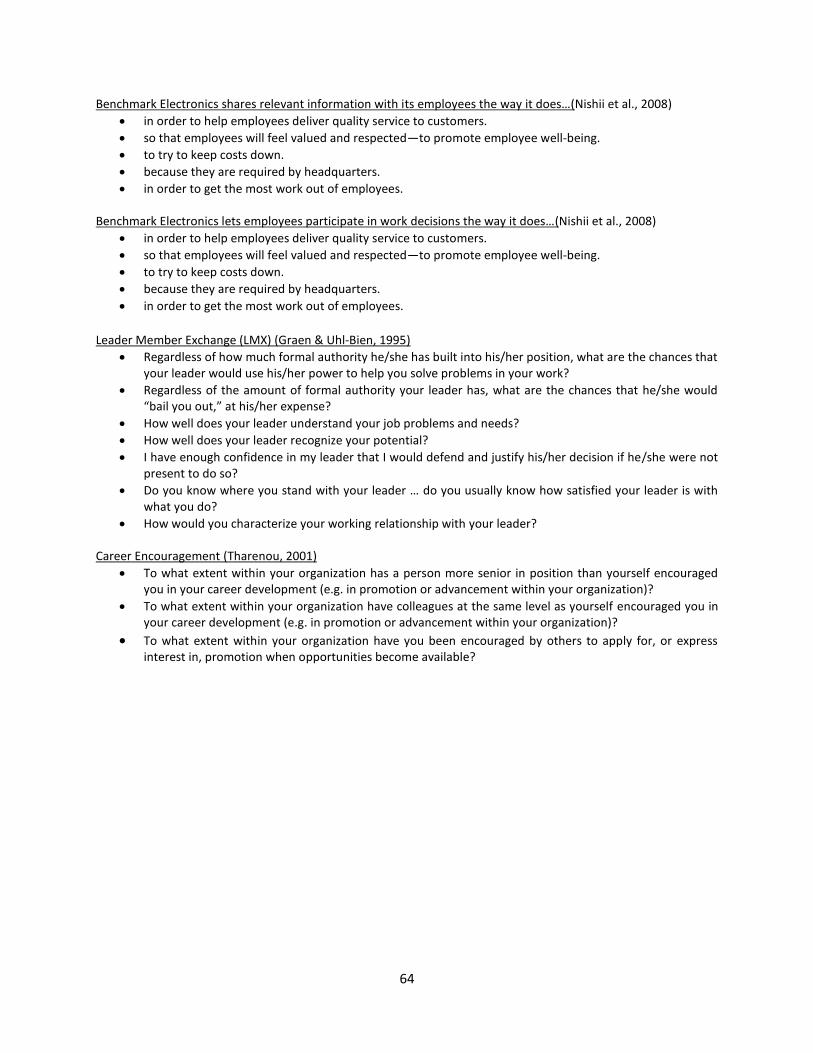
64
Benchmark Electronics shares relevant information with its employees the way it does…(Nishii et al., 2008)
in order to help employees deliver quality service to customers.
so that employees will feel valued and respected—to promote employee well-being.
to try to keep costs down.
because they are required by headquarters.
in order to get the most work out of employees. Benchmark Electronics lets employees participate in work decisions the way it does…(Nishii et al., 2008)
in order to help employees deliver quality service to customers.
so that employees will feel valued and respected—to promote employee well-being.
to try to keep costs down.
because they are required by headquarters.
in order to get the most work out of employees.
Leader Member Exchange (LMX) (Graen & Uhl-Bien, 1995)
Regardless of how much formal authority he/she has built into his/her position, what are the chances that your leader would use his/her power to help you solve problems in your work?
Regardless of the amount of formal authority your leader has, what are the chances that he/she would “bail you out,” at his/her expense?
How well does your leader understand your job problems and needs?
How well does your leader recognize your potential?
I have enough confidence in my leader that I would defend and justify his/her decision if he/she were not present to do so?
Do you know where you stand with your leader … do you usually know how satisfied your leader is with what you do?
How would you characterize your working relationship with your leader? Career Encouragement (Tharenou, 2001)
To what extent within your organization has a person more senior in position than yourself encouraged you in your career development (e.g. in promotion or advancement within your organization)?
To what extent within your organization have colleagues at the same level as yourself encouraged you in your career development (e.g. in promotion or advancement within your organization)?
To what extent within your organization have you been encouraged by others to apply for, or express interest in, promotion when opportunities become available?
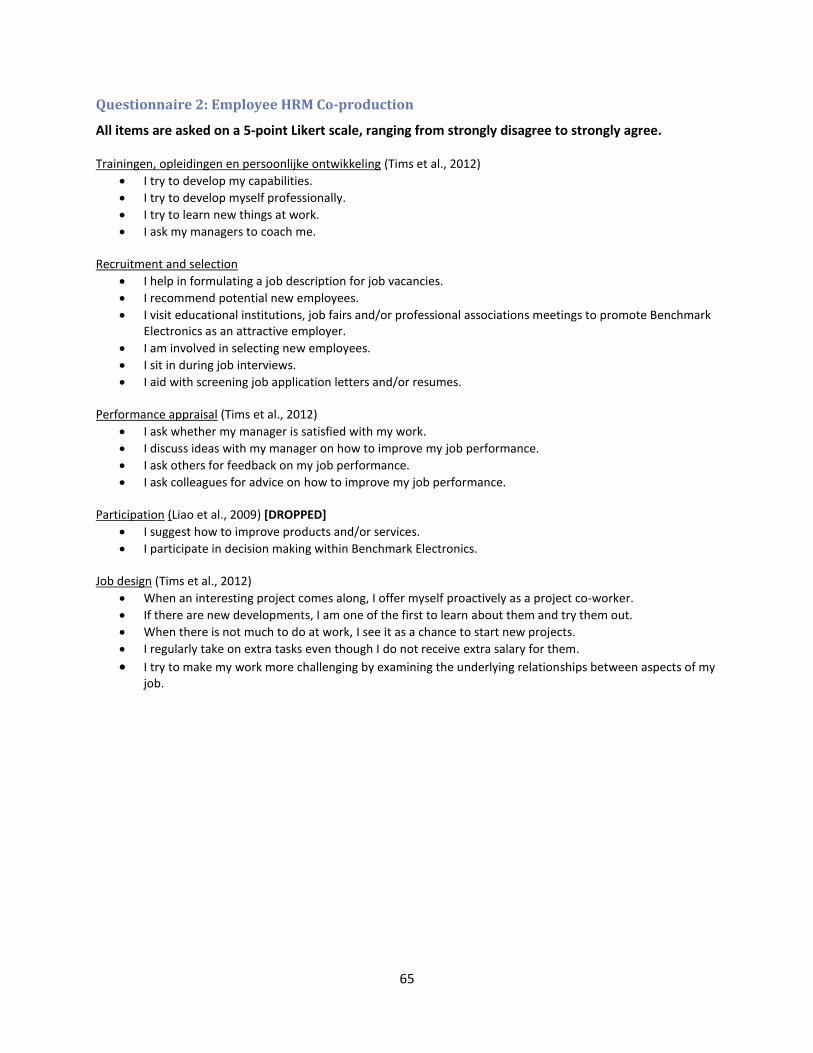
65
Questionnaire 2: Employee HRM Co-production
All items are asked on a 5-point Likert scale, ranging from strongly disagree to strongly agree. Trainingen, opleidingen en persoonlijke ontwikkeling (Tims et al., 2012)
I try to develop my capabilities.
I try to develop myself professionally.
I try to learn new things at work.
I ask my managers to coach me. Recruitment and selection
I help in formulating a job description for job vacancies.
I recommend potential new employees.
I visit educational institutions, job fairs and/or professional associations meetings to promote Benchmark Electronics as an attractive employer.
I am involved in selecting new employees.
I sit in during job interviews.
I aid with screening job application letters and/or resumes. Performance appraisal (Tims et al., 2012)
I ask whether my manager is satisfied with my work.
I discuss ideas with my manager on how to improve my job performance.
I ask others for feedback on my job performance.
I ask colleagues for advice on how to improve my job performance. Participation (Liao et al., 2009) [DROPPED]
I suggest how to improve products and/or services.
I participate in decision making within Benchmark Electronics. Job design (Tims et al., 2012)
When an interesting project comes along, I offer myself proactively as a project co-worker.
If there are new developments, I am one of the first to learn about them and try them out.
When there is not much to do at work, I see it as a chance to start new projects.
I regularly take on extra tasks even though I do not receive extra salary for them.
I try to make my work more challenging by examining the underlying relationships between aspects of my job.
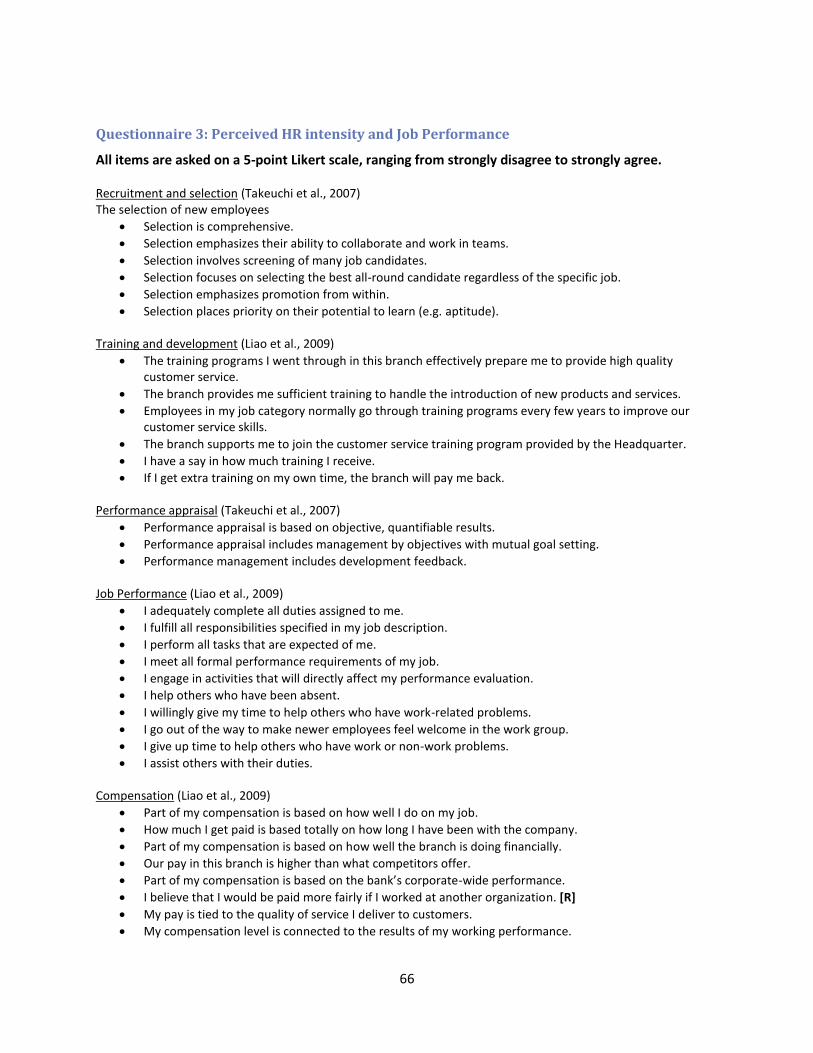
66
Questionnaire 3: Perceived HR intensity and Job Performance
All items are asked on a 5-point Likert scale, ranging from strongly disagree to strongly agree. Recruitment and selection (Takeuchi et al., 2007) The selection of new employees
Selection is comprehensive.
Selection emphasizes their ability to collaborate and work in teams.
Selection involves screening of many job candidates.
Selection focuses on selecting the best all-round candidate regardless of the specific job.
Selection emphasizes promotion from within.
Selection places priority on their potential to learn (e.g. aptitude). Training and development (Liao et al., 2009)
The training programs I went through in this branch effectively prepare me to provide high quality customer service.
The branch provides me sufficient training to handle the introduction of new products and services.
Employees in my job category normally go through training programs every few years to improve our customer service skills.
The branch supports me to join the customer service training program provided by the Headquarter.
I have a say in how much training I receive.
If I get extra training on my own time, the branch will pay me back. Performance appraisal (Takeuchi et al., 2007)
Performance appraisal is based on objective, quantifiable results.
Performance appraisal includes management by objectives with mutual goal setting.
Performance management includes development feedback. Job Performance (Liao et al., 2009)
I adequately complete all duties assigned to me.
I fulfill all responsibilities specified in my job description.
I perform all tasks that are expected of me.
I meet all formal performance requirements of my job.
I engage in activities that will directly affect my performance evaluation.
I help others who have been absent.
I willingly give my time to help others who have work-related problems.
I go out of the way to make newer employees feel welcome in the work group.
I give up time to help others who have work or non-work problems.
I assist others with their duties. Compensation (Liao et al., 2009)
Part of my compensation is based on how well I do on my job.
How much I get paid is based totally on how long I have been with the company.
Part of my compensation is based on how well the branch is doing financially.
Our pay in this branch is higher than what competitors offer.
Part of my compensation is based on the bank’s corporate-wide performance.
I believe that I would be paid more fairly if I worked at another organization. [R]
My pay is tied to the quality of service I deliver to customers.
My compensation level is connected to the results of my working performance.
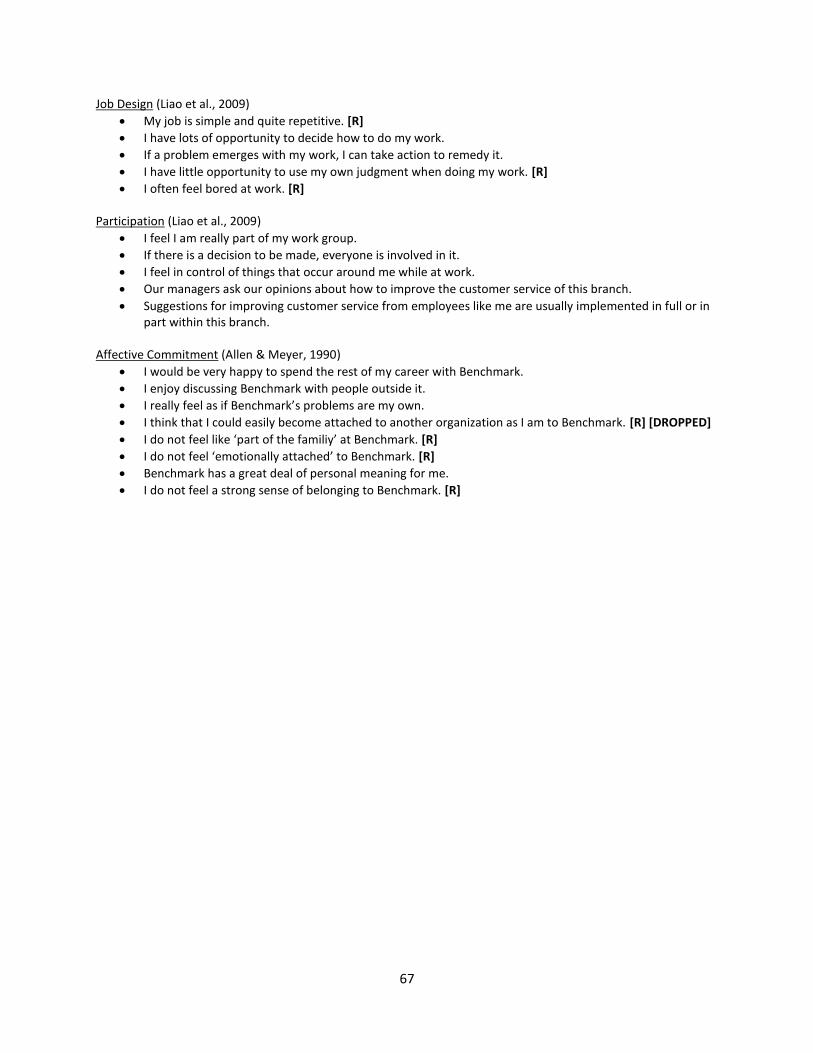
67
Job Design (Liao et al., 2009)
My job is simple and quite repetitive. [R]
I have lots of opportunity to decide how to do my work.
If a problem emerges with my work, I can take action to remedy it.
I have little opportunity to use my own judgment when doing my work. [R]
I often feel bored at work. [R] Participation (Liao et al., 2009)
I feel I am really part of my work group.
If there is a decision to be made, everyone is involved in it.
I feel in control of things that occur around me while at work.
Our managers ask our opinions about how to improve the customer service of this branch.
Suggestions for improving customer service from employees like me are usually implemented in full or in part within this branch.
Affective Commitment (Allen & Meyer, 1990)
I would be very happy to spend the rest of my career with Benchmark.
I enjoy discussing Benchmark with people outside it.
I really feel as if Benchmark’s problems are my own.
I think that I could easily become attached to another organization as I am to Benchmark. [R] [DROPPED]
I do not feel like ‘part of the familiy’ at Benchmark. [R]
I do not feel ‘emotionally attached’ to Benchmark. [R]
Benchmark has a great deal of personal meaning for me.
I do not feel a strong sense of belonging to Benchmark. [R]
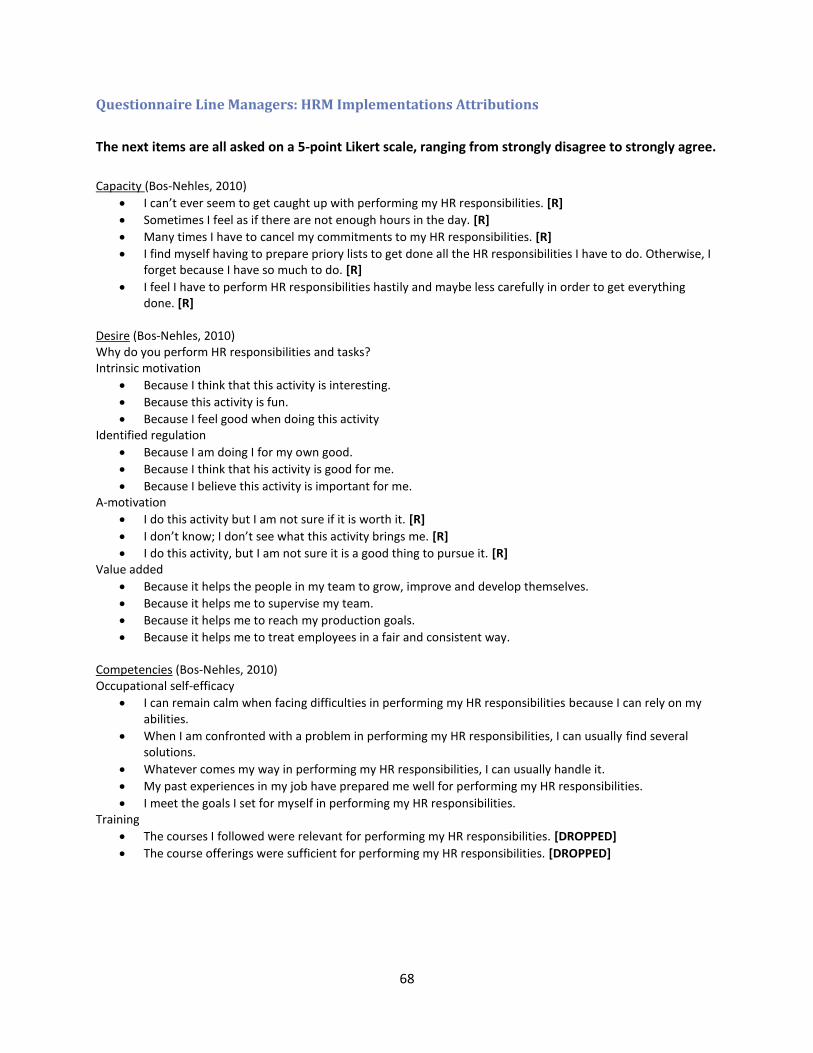
68
Questionnaire Line Managers: HRM Implementations Attributions
The next items are all asked on a 5-point Likert scale, ranging from strongly disagree to strongly agree.
Capacity (Bos-Nehles, 2010)
I can’t ever seem to get caught up with performing my HR responsibilities. [R]
Sometimes I feel as if there are not enough hours in the day. [R]
Many times I have to cancel my commitments to my HR responsibilities. [R]
I find myself having to prepare priory lists to get done all the HR responsibilities I have to do. Otherwise, I forget because I have so much to do. [R]
I feel I have to perform HR responsibilities hastily and maybe less carefully in order to get everything done. [R]
Desire (Bos-Nehles, 2010) Why do you perform HR responsibilities and tasks? Intrinsic motivation
Because I think that this activity is interesting.
Because this activity is fun.
Because I feel good when doing this activity Identified regulation
Because I am doing I for my own good.
Because I think that his activity is good for me.
Because I believe this activity is important for me. A-motivation
I do this activity but I am not sure if it is worth it. [R]
I don’t know; I don’t see what this activity brings me. [R]
I do this activity, but I am not sure it is a good thing to pursue it. [R] Value added
Because it helps the people in my team to grow, improve and develop themselves.
Because it helps me to supervise my team.
Because it helps me to reach my production goals.
Because it helps me to treat employees in a fair and consistent way. Competencies (Bos-Nehles, 2010) Occupational self-efficacy
I can remain calm when facing difficulties in performing my HR responsibilities because I can rely on my abilities.
When I am confronted with a problem in performing my HR responsibilities, I can usually find several solutions.
Whatever comes my way in performing my HR responsibilities, I can usually handle it.
My past experiences in my job have prepared me well for performing my HR responsibilities.
I meet the goals I set for myself in performing my HR responsibilities. Training
The courses I followed were relevant for performing my HR responsibilities. [DROPPED]
The course offerings were sufficient for performing my HR responsibilities. [DROPPED]
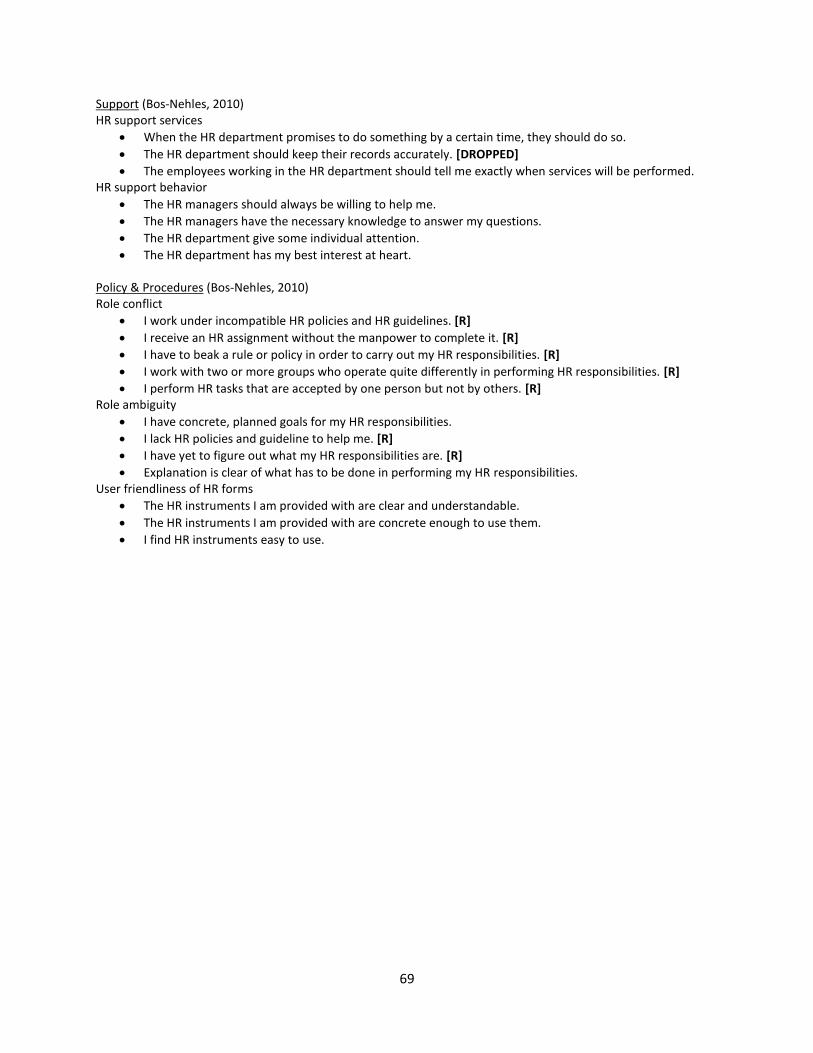
69
Support (Bos-Nehles, 2010) HR support services
When the HR department promises to do something by a certain time, they should do so.
The HR department should keep their records accurately. [DROPPED]
The employees working in the HR department should tell me exactly when services will be performed. HR support behavior
The HR managers should always be willing to help me.
The HR managers have the necessary knowledge to answer my questions.
The HR department give some individual attention.
The HR department has my best interest at heart. Policy & Procedures (Bos-Nehles, 2010) Role conflict
I work under incompatible HR policies and HR guidelines. [R]
I receive an HR assignment without the manpower to complete it. [R]
I have to beak a rule or policy in order to carry out my HR responsibilities. [R]
I work with two or more groups who operate quite differently in performing HR responsibilities. [R]
I perform HR tasks that are accepted by one person but not by others. [R] Role ambiguity
I have concrete, planned goals for my HR responsibilities.
I lack HR policies and guideline to help me. [R]
I have yet to figure out what my HR responsibilities are. [R]
Explanation is clear of what has to be done in performing my HR responsibilities. User friendliness of HR forms
The HR instruments I am provided with are clear and understandable.
The HR instruments I am provided with are concrete enough to use them.
I find HR instruments easy to use.
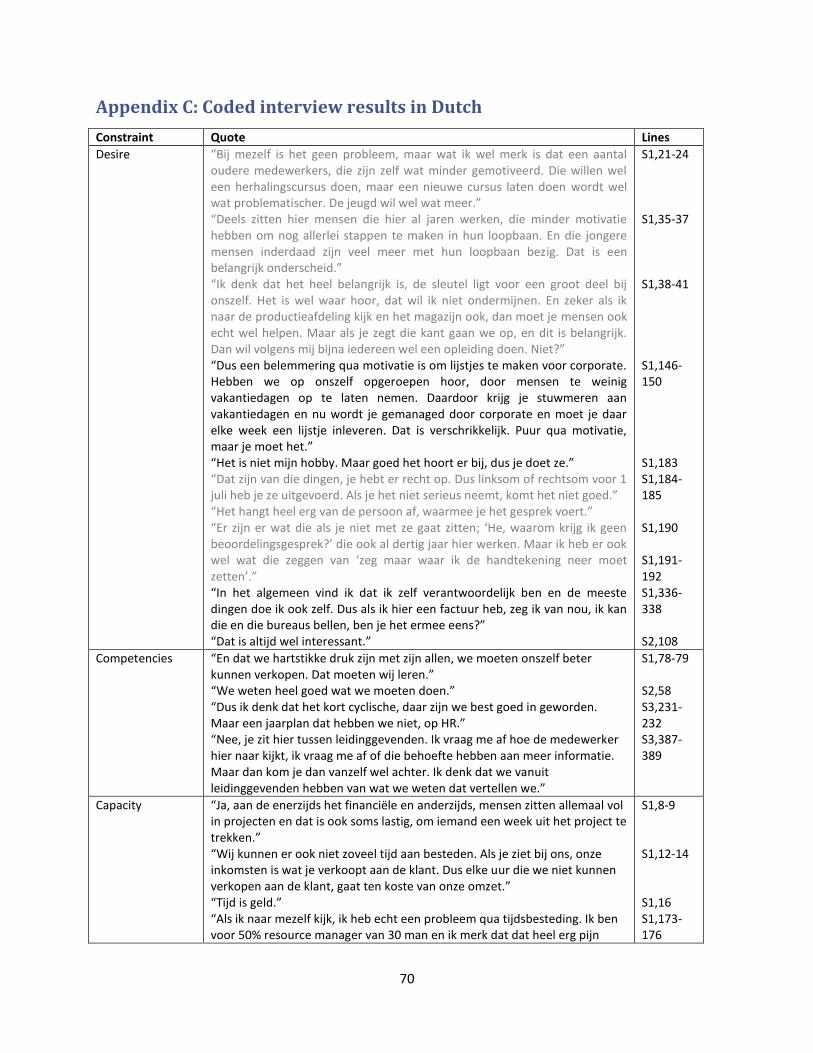
70
Appendix C: Coded interview results in Dutch
Constraint Quote Lines
Desire “Bij mezelf is het geen probleem, maar wat ik wel merk is dat een aantal oudere medewerkers, die zijn zelf wat minder gemotiveerd. Die willen wel een herhalingscursus doen, maar een nieuwe cursus laten doen wordt wel wat problematischer. De jeugd wil wel wat meer.” “Deels zitten hier mensen die hier al jaren werken, die minder motivatie hebben om nog allerlei stappen te maken in hun loopbaan. En die jongere mensen inderdaad zijn veel meer met hun loopbaan bezig. Dat is een belangrijk onderscheid.” “Ik denk dat het heel belangrijk is, de sleutel ligt voor een groot deel bij onszelf. Het is wel waar hoor, dat wil ik niet ondermijnen. En zeker als ik naar de productieafdeling kijk en het magazijn ook, dan moet je mensen ook echt wel helpen. Maar als je zegt die kant gaan we op, en dit is belangrijk. Dan wil volgens mij bijna iedereen wel een opleiding doen. Niet?” “Dus een belemmering qua motivatie is om lijstjes te maken voor corporate. Hebben we op onszelf opgeroepen hoor, door mensen te weinig vakantiedagen op te laten nemen. Daardoor krijg je stuwmeren aan vakantiedagen en nu wordt je gemanaged door corporate en moet je daar elke week een lijstje inleveren. Dat is verschrikkelijk. Puur qua motivatie, maar je moet het.” “Het is niet mijn hobby. Maar goed het hoort er bij, dus je doet ze.” “Dat zijn van die dingen, je hebt er recht op. Dus linksom of rechtsom voor 1 juli heb je ze uitgevoerd. Als je het niet serieus neemt, komt het niet goed.” “Het hangt heel erg van de persoon af, waarmee je het gesprek voert.” “Er zijn er wat die als je niet met ze gaat zitten; ‘He, waarom krijg ik geen beoordelingsgesprek?’ die ook al dertig jaar hier werken. Maar ik heb er ook wel wat die zeggen van ‘zeg maar waar ik de handtekening neer moet zetten’.” “In het algemeen vind ik dat ik zelf verantwoordelijk ben en de meeste dingen doe ik ook zelf. Dus als ik hier een factuur heb, zeg ik van nou, ik kan die en die bureaus bellen, ben je het ermee eens?” “Dat is altijd wel interessant.”
S1,21-24 S1,35-37 S1,38-41 S1,146-150 S1,183 S1,184-185 S1,190 S1,191-192 S1,336-338 S2,108
Competencies “En dat we hartstikke druk zijn met zijn allen, we moeten onszelf beter kunnen verkopen. Dat moeten wij leren.” “We weten heel goed wat we moeten doen.” “Dus ik denk dat het kort cyclische, daar zijn we best goed in geworden. Maar een jaarplan dat hebben we niet, op HR.” “Nee, je zit hier tussen leidinggevenden. Ik vraag me af hoe de medewerker hier naar kijkt, ik vraag me af of die behoefte hebben aan meer informatie. Maar dan kom je dan vanzelf wel achter. Ik denk dat we vanuit leidinggevenden hebben van wat we weten dat vertellen we.”
S1,78-79 S2,58 S3,231-232 S3,387-389
Capacity “Ja, aan de enerzijds het financiële en anderzijds, mensen zitten allemaal vol in projecten en dat is ook soms lastig, om iemand een week uit het project te trekken.” “Wij kunnen er ook niet zoveel tijd aan besteden. Als je ziet bij ons, onze inkomsten is wat je verkoopt aan de klant. Dus elke uur die we niet kunnen verkopen aan de klant, gaat ten koste van onze omzet.” “Tijd is geld.” “Als ik naar mezelf kijk, ik heb echt een probleem qua tijdsbesteding. Ik ben voor 50% resource manager van 30 man en ik merk dat dat heel erg pijn
S1,8-9 S1,12-14 S1,16 S1,173-176
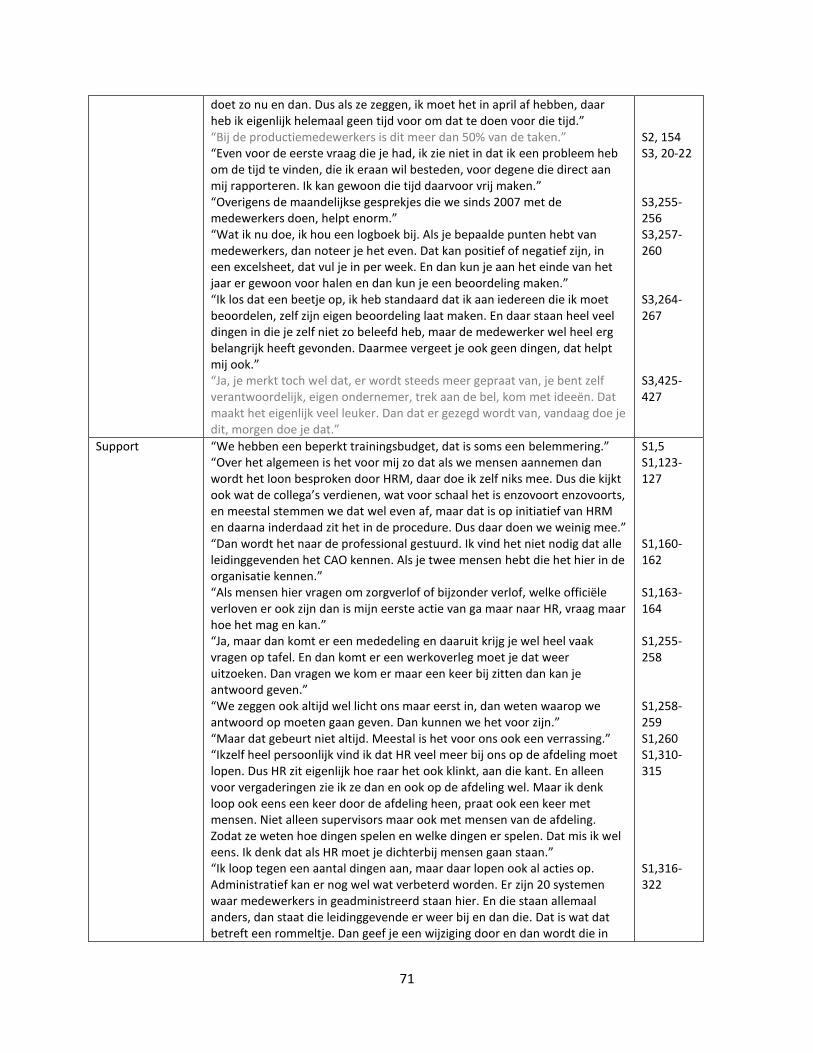
71
doet zo nu en dan. Dus als ze zeggen, ik moet het in april af hebben, daar heb ik eigenlijk helemaal geen tijd voor om dat te doen voor die tijd.” “Bij de productiemedewerkers is dit meer dan 50% van de taken.” “Even voor de eerste vraag die je had, ik zie niet in dat ik een probleem heb om de tijd te vinden, die ik eraan wil besteden, voor degene die direct aan mij rapporteren. Ik kan gewoon die tijd daarvoor vrij maken.” “Overigens de maandelijkse gesprekjes die we sinds 2007 met de medewerkers doen, helpt enorm.” “Wat ik nu doe, ik hou een logboek bij. Als je bepaalde punten hebt van medewerkers, dan noteer je het even. Dat kan positief of negatief zijn, in een excelsheet, dat vul je in per week. En dan kun je aan het einde van het jaar er gewoon voor halen en dan kun je een beoordeling maken.” “Ik los dat een beetje op, ik heb standaard dat ik aan iedereen die ik moet beoordelen, zelf zijn eigen beoordeling laat maken. En daar staan heel veel dingen in die je zelf niet zo beleefd heb, maar de medewerker wel heel erg belangrijk heeft gevonden. Daarmee vergeet je ook geen dingen, dat helpt mij ook.” “Ja, je merkt toch wel dat, er wordt steeds meer gepraat van, je bent zelf verantwoordelijk, eigen ondernemer, trek aan de bel, kom met ideeën. Dat maakt het eigenlijk veel leuker. Dan dat er gezegd wordt van, vandaag doe je dit, morgen doe je dat.”
S2, 154 S3, 20-22 S3,255-256 S3,257-260 S3,264-267 S3,425-427
Support “We hebben een beperkt trainingsbudget, dat is soms een belemmering.” “Over het algemeen is het voor mij zo dat als we mensen aannemen dan wordt het loon besproken door HRM, daar doe ik zelf niks mee. Dus die kijkt ook wat de collega’s verdienen, wat voor schaal het is enzovoort enzovoorts, en meestal stemmen we dat wel even af, maar dat is op initiatief van HRM en daarna inderdaad zit het in de procedure. Dus daar doen we weinig mee.” “Dan wordt het naar de professional gestuurd. Ik vind het niet nodig dat alle leidinggevenden het CAO kennen. Als je twee mensen hebt die het hier in de organisatie kennen.” “Als mensen hier vragen om zorgverlof of bijzonder verlof, welke officiële verloven er ook zijn dan is mijn eerste actie van ga maar naar HR, vraag maar hoe het mag en kan.” “Ja, maar dan komt er een mededeling en daaruit krijg je wel heel vaak vragen op tafel. En dan komt er een werkoverleg moet je dat weer uitzoeken. Dan vragen we kom er maar een keer bij zitten dan kan je antwoord geven.” “We zeggen ook altijd wel licht ons maar eerst in, dan weten waarop we antwoord op moeten gaan geven. Dan kunnen we het voor zijn.” “Maar dat gebeurt niet altijd. Meestal is het voor ons ook een verrassing.” “Ikzelf heel persoonlijk vind ik dat HR veel meer bij ons op de afdeling moet lopen. Dus HR zit eigenlijk hoe raar het ook klinkt, aan die kant. En alleen voor vergaderingen zie ik ze dan en ook op de afdeling wel. Maar ik denk loop ook eens een keer door de afdeling heen, praat ook een keer met mensen. Niet alleen supervisors maar ook met mensen van de afdeling. Zodat ze weten hoe dingen spelen en welke dingen er spelen. Dat mis ik wel eens. Ik denk dat als HR moet je dichterbij mensen gaan staan.” “Ik loop tegen een aantal dingen aan, maar daar lopen ook al acties op. Administratief kan er nog wel wat verbeterd worden. Er zijn 20 systemen waar medewerkers in geadministreerd staan hier. En die staan allemaal anders, dan staat die leidinggevende er weer bij en dan die. Dat is wat dat betreft een rommeltje. Dan geef je een wijziging door en dan wordt die in
S1,5 S1,123-127 S1,160-162 S1,163-164 S1,255-258 S1,258-259 S1,260 S1,310-315 S1,316-322

72
het ene systeem wel doorgevoerd en in het andere systeem dan weer niet. Daar kan zeker wat verbeteren nog. Dat geldt eigenlijk ook voor het bijhouden wie welke trainingen heeft gehad en dat soort zaken.” “Er zijn eigenlijk maar een tweetal trainingen die voor personeel aangeboden worden. En de rest die is eigenlijk bijna not done.” “Dat zijn trainingen die beslist noodzakelijk zijn om een product te maken dat aan de kwaliteit zoals die gesteld wordt voldoet. En als je praat over trainingen die te maken hebben met persoonlijke ontwikkeling binnen het bedrijf […] Daar wil men niet op reageren en men wil er ook geen budget voor erkennen.” “Ik zeg altijd tegen HRM, een keuze uit 1 is geen keuze. En als ik drie mensen langs krijg en die zijn niet goed, dan wil ik de volgende drie. Met andere woorden, wat je wel eens ziet, is dat men wat gemakzuchtig is en zegt van dat is het, zoek het daar maar uit. En nee dat wil ik niet, want de kwaliteit is, om wat voor reden dan ook, niet voldoende. Maar dat doen we zelf.” “Wat je me hoort zeggen is dat de HRM afdeling een betere ondersteuning zou kunnen leveren bij het aanleveren van de kandidaten. Potentiële kandidaten, voor bepaalde functies, daar is de keuze voor ons soms weinig.” “Ik zou wel een graag wat meer een functionaris van de HR afdeling op de afdeling zien lopen. Je ziet zo nooit hoor.” “Als ze wat hebben dan komen ze bij ons ook wel, maar dan komen ze meestal alleen met groepsleider overleg. Verder zie je ze niet. En ik vind dat een HR afdeling is er niet alleen voor het bedrijf maar ook voor de mensen.” “Waar ik vooral last van heb is dat in mijn werkzaamheden veel vertraging op treed door een taak van HR.” “Ik ben daar zelf niet mee bezig, dat laat ik allemaal aan HR over. Alleen ik merk wel dat er heel veel schreefgroei is.” “Sommige komen binnen in een vakgroep en andere zitten in een functie, en sommige doen hetzelfde werk. Dat bedoel ik eigenlijk, dat zou niet moeten. En zo krijg je schreefgroei. En nu zijn ze weer met dat functiewaarderingssysteem bezig. En dan zou het allemaal opnieuw ingegroepeerd moeten worden.” “Maar ook voor die extra dingen, dat zeg ik dat is HR activiteiten die ze werkelijk moeten doen. Ik ga daar niet tussen zitten, ik ga niet bepalen in welke functieschaal of kan je ze wel of geen reiskostenvergoeding of zorgverzekering krijgen.” “Werving meld je aan bij HR wat je nodig bent, en daar stuur je dan een profiel naartoe. En die schakelen dan verschillende bureaus in en dan krijg je CVs, en daar selecteer je er wat uit. En je nodigt ze uit voor een gesprek, dan vaak nog met de afdelingsmanagers ook nog en dan daarna nog een keer een gesprek met de HR medewerkers. Vaak 2 of 3 gesprekken heb je.” “Wat ik wel mis is dat op het moment dat een resource request aangevraagd is en goedgekeurd is dat er geen bordmededelingen zijn voor die functies.” “Er zijn mensen die hier intern al werken, hebben geen mogelijkheid om op die functies te solliciteren, omdat ze niet weten dat ze bestaan. En er is meerdere malen ook al bij HR gezegd, op het moment dat je een resource request approved, hang ze dan ook aan het bord.” “Ik denk dat HR ook weer het administratieve doet, zoals het statistieken bijhouden over hoe ziet de beoordelen er qua statistieken uit. Ziet dat er normaal uit. Of zitten daar rare dingen.”
S2,9-10 S2,13-15 S2,89-93 S2,96-98 S2,334-335 S2,339-341 S2,345-346 S3,103-104 S3,111-114 S3,127-130 S3,179-183 S3,203-204 S3,207-209 S3, 279-280
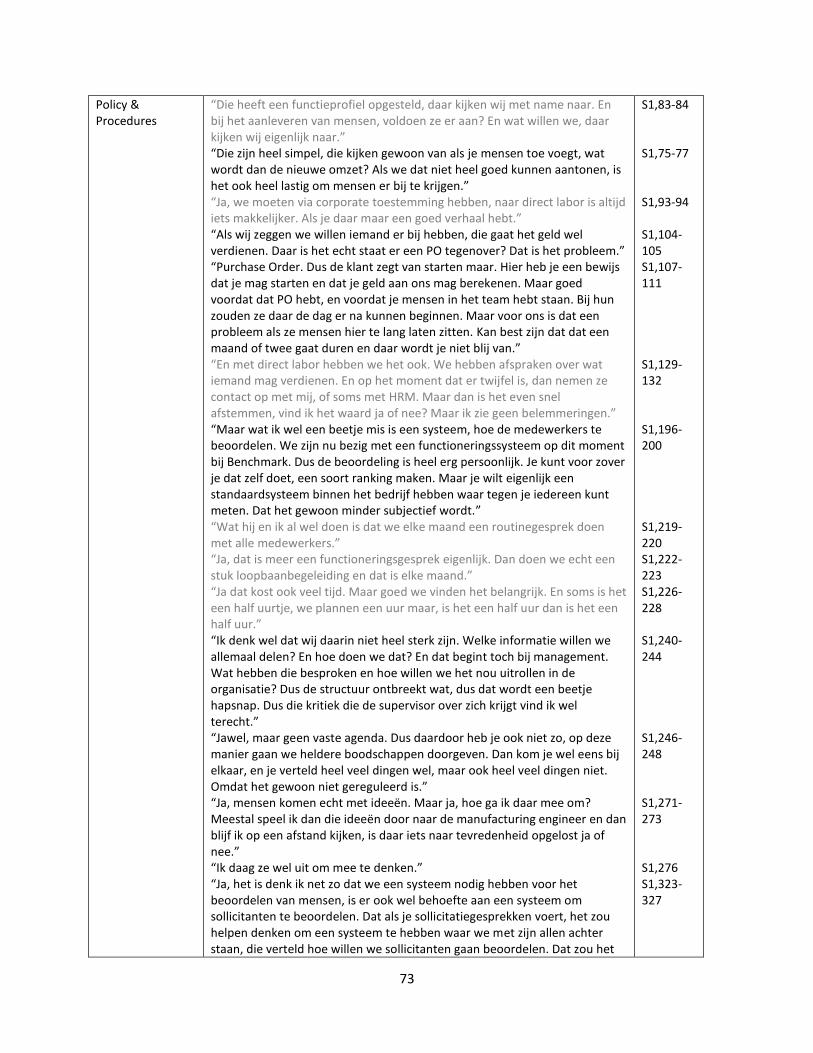
73
Policy & Procedures
“Die heeft een functieprofiel opgesteld, daar kijken wij met name naar. En bij het aanleveren van mensen, voldoen ze er aan? En wat willen we, daar kijken wij eigenlijk naar.” “Die zijn heel simpel, die kijken gewoon van als je mensen toe voegt, wat wordt dan de nieuwe omzet? Als we dat niet heel goed kunnen aantonen, is het ook heel lastig om mensen er bij te krijgen.” “Ja, we moeten via corporate toestemming hebben, naar direct labor is altijd iets makkelijker. Als je daar maar een goed verhaal hebt.” “Als wij zeggen we willen iemand er bij hebben, die gaat het geld wel verdienen. Daar is het echt staat er een PO tegenover? Dat is het probleem.” “Purchase Order. Dus de klant zegt van starten maar. Hier heb je een bewijs dat je mag starten en dat je geld aan ons mag berekenen. Maar goed voordat dat PO hebt, en voordat je mensen in het team hebt staan. Bij hun zouden ze daar de dag er na kunnen beginnen. Maar voor ons is dat een probleem als ze mensen hier te lang laten zitten. Kan best zijn dat dat een maand of twee gaat duren en daar wordt je niet blij van.” “En met direct labor hebben we het ook. We hebben afspraken over wat iemand mag verdienen. En op het moment dat er twijfel is, dan nemen ze contact op met mij, of soms met HRM. Maar dan is het even snel afstemmen, vind ik het waard ja of nee? Maar ik zie geen belemmeringen.” “Maar wat ik wel een beetje mis is een systeem, hoe de medewerkers te beoordelen. We zijn nu bezig met een functioneringssysteem op dit moment bij Benchmark. Dus de beoordeling is heel erg persoonlijk. Je kunt voor zover je dat zelf doet, een soort ranking maken. Maar je wilt eigenlijk een standaardsysteem binnen het bedrijf hebben waar tegen je iedereen kunt meten. Dat het gewoon minder subjectief wordt.” “Wat hij en ik al wel doen is dat we elke maand een routinegesprek doen met alle medewerkers.” “Ja, dat is meer een functioneringsgesprek eigenlijk. Dan doen we echt een stuk loopbaanbegeleiding en dat is elke maand.” “Ja dat kost ook veel tijd. Maar goed we vinden het belangrijk. En soms is het een half uurtje, we plannen een uur maar, is het een half uur dan is het een half uur.” “Ik denk wel dat wij daarin niet heel sterk zijn. Welke informatie willen we allemaal delen? En hoe doen we dat? En dat begint toch bij management. Wat hebben die besproken en hoe willen we het nou uitrollen in de organisatie? Dus de structuur ontbreekt wat, dus dat wordt een beetje hapsnap. Dus die kritiek die de supervisor over zich krijgt vind ik wel terecht.” “Jawel, maar geen vaste agenda. Dus daardoor heb je ook niet zo, op deze manier gaan we heldere boodschappen doorgeven. Dan kom je wel eens bij elkaar, en je verteld heel veel dingen wel, maar ook heel veel dingen niet. Omdat het gewoon niet gereguleerd is.” “Ja, mensen komen echt met ideeën. Maar ja, hoe ga ik daar mee om? Meestal speel ik dan die ideeën door naar de manufacturing engineer en dan blijf ik op een afstand kijken, is daar iets naar tevredenheid opgelost ja of nee.” “Ik daag ze wel uit om mee te denken.” “Ja, het is denk ik net zo dat we een systeem nodig hebben voor het beoordelen van mensen, is er ook wel behoefte aan een systeem om sollicitanten te beoordelen. Dat als je sollicitatiegesprekken voert, het zou helpen denken om een systeem te hebben waar we met zijn allen achter staan, die verteld hoe willen we sollicitanten gaan beoordelen. Dat zou het
S1,83-84 S1,75-77 S1,93-94 S1,104-105 S1,107-111 S1,129-132 S1,196-200 S1,219-220 S1,222-223 S1,226-228 S1,240-244 S1,246-248 S1,271-273 S1,276 S1,323-327
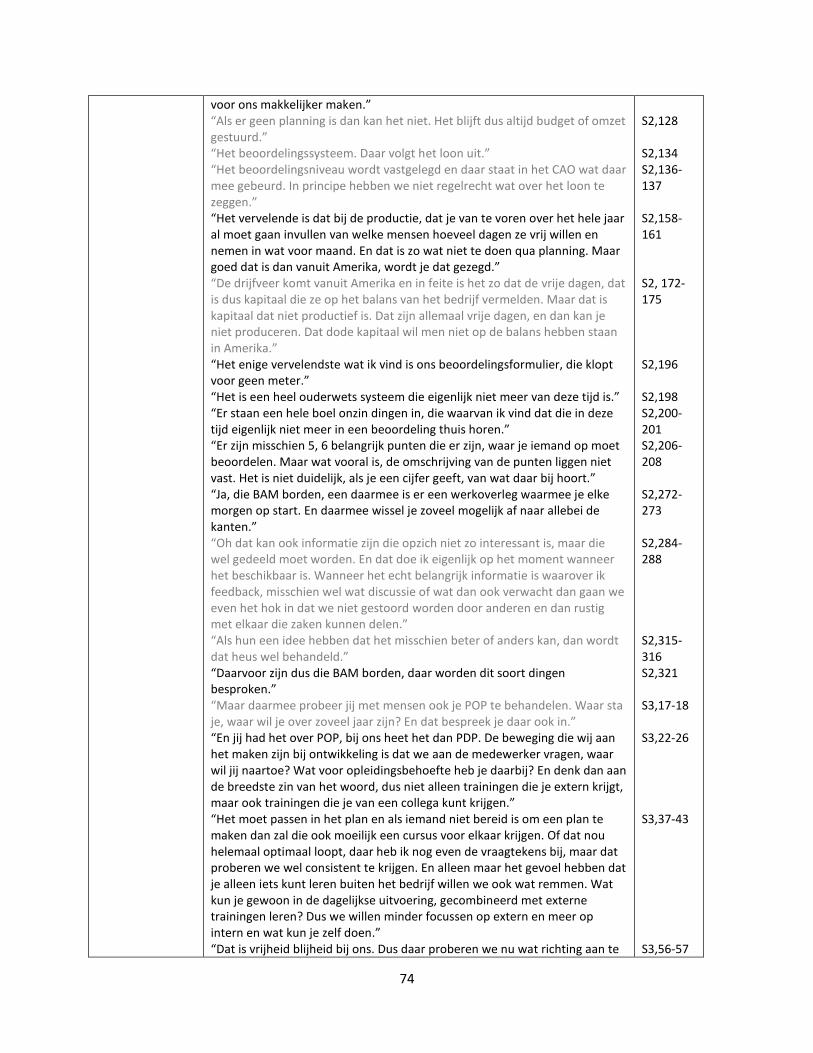
74
voor ons makkelijker maken.” “Als er geen planning is dan kan het niet. Het blijft dus altijd budget of omzet gestuurd.” “Het beoordelingssysteem. Daar volgt het loon uit.” “Het beoordelingsniveau wordt vastgelegd en daar staat in het CAO wat daar mee gebeurd. In principe hebben we niet regelrecht wat over het loon te zeggen.” “Het vervelende is dat bij de productie, dat je van te voren over het hele jaar al moet gaan invullen van welke mensen hoeveel dagen ze vrij willen en nemen in wat voor maand. En dat is zo wat niet te doen qua planning. Maar goed dat is dan vanuit Amerika, wordt je dat gezegd.” “De drijfveer komt vanuit Amerika en in feite is het zo dat de vrije dagen, dat is dus kapitaal die ze op het balans van het bedrijf vermelden. Maar dat is kapitaal dat niet productief is. Dat zijn allemaal vrije dagen, en dan kan je niet produceren. Dat dode kapitaal wil men niet op de balans hebben staan in Amerika.” “Het enige vervelendste wat ik vind is ons beoordelingsformulier, die klopt voor geen meter.” “Het is een heel ouderwets systeem die eigenlijk niet meer van deze tijd is.” “Er staan een hele boel onzin dingen in, die waarvan ik vind dat die in deze tijd eigenlijk niet meer in een beoordeling thuis horen.” “Er zijn misschien 5, 6 belangrijk punten die er zijn, waar je iemand op moet beoordelen. Maar wat vooral is, de omschrijving van de punten liggen niet vast. Het is niet duidelijk, als je een cijfer geeft, van wat daar bij hoort.” “Ja, die BAM borden, een daarmee is er een werkoverleg waarmee je elke morgen op start. En daarmee wissel je zoveel mogelijk af naar allebei de kanten.” “Oh dat kan ook informatie zijn die opzich niet zo interessant is, maar die wel gedeeld moet worden. En dat doe ik eigenlijk op het moment wanneer het beschikbaar is. Wanneer het echt belangrijk informatie is waarover ik feedback, misschien wel wat discussie of wat dan ook verwacht dan gaan we even het hok in dat we niet gestoord worden door anderen en dan rustig met elkaar die zaken kunnen delen.” “Als hun een idee hebben dat het misschien beter of anders kan, dan wordt dat heus wel behandeld.” “Daarvoor zijn dus die BAM borden, daar worden dit soort dingen besproken.” “Maar daarmee probeer jij met mensen ook je POP te behandelen. Waar sta je, waar wil je over zoveel jaar zijn? En dat bespreek je daar ook in.” “En jij had het over POP, bij ons heet het dan PDP. De beweging die wij aan het maken zijn bij ontwikkeling is dat we aan de medewerker vragen, waar wil jij naartoe? Wat voor opleidingsbehoefte heb je daarbij? En denk dan aan de breedste zin van het woord, dus niet alleen trainingen die je extern krijgt, maar ook trainingen die je van een collega kunt krijgen.” “Het moet passen in het plan en als iemand niet bereid is om een plan te maken dan zal die ook moeilijk een cursus voor elkaar krijgen. Of dat nou helemaal optimaal loopt, daar heb ik nog even de vraagtekens bij, maar dat proberen we wel consistent te krijgen. En alleen maar het gevoel hebben dat je alleen iets kunt leren buiten het bedrijf willen we ook wat remmen. Wat kun je gewoon in de dagelijkse uitvoering, gecombineerd met externe trainingen leren? Dus we willen minder focussen op extern en meer op intern en wat kun je zelf doen.” “Dat is vrijheid blijheid bij ons. Dus daar proberen we nu wat richting aan te
S2,128 S2,134 S2,136-137 S2,158-161 S2, 172-175 S2,196 S2,198 S2,200-201 S2,206-208 S2,272-273 S2,284-288 S2,315-316 S2,321 S3,17-18 S3,22-26 S3,37-43 S3,56-57
75
geven met het Personal Development Plan of POP.” “Dat is gewoon als je voor je werk morgen iets nodig hebt aan training, dan wordt het onmiddellijk geregeld, want je moet je werk wel kunnen uitvoeren. Maar dat is dan voor je taak die je nu hebt.” “Wat net even aan de orde kwam, van een cursus voor de cursus. De PDP dat is een hele goede onderbouwing om een training of cursus te gaan doen. Zonder dat krijg je dat gewoon niet voor elkaar. Dus medewerkers die daar ook bewust mee bezig zijn van ik wil daar naartoe, hoe kom ik daar. Dat gaat redelijk succesvol.” “Dat is ook wel het hele grote verschil met toen ik vroeger begon bij Philips. Je wist waar je naartoe ging en je wist wanneer je met pensioen ging. En afhankelijk van je inspanning kon je iets sneller of je kon in de luwte zelfs mee, dat viel helemaal niet op. Maar nu is alles eigenlijk veel meer gericht op eigen initiatief van de medewerker.” “We hebben natuurlijk een systeem, en dat ligt vast. En binnen dat systeem is natuurlijk een koppeling met de beoordeling. En die beoordeling daarvoor zijn wij verantwoordelijk.” “Ja, er is een beoordelingsformulier en er is een lijst met voorbeelden en punten wat je kan aanhalen. Wat ermee bedoeld wordt met de korte omschrijving die er staat.” “Ik denk dat we bij ontwikkeling daar nog wat zoekend zijn, van hoe hou je het objectief. En kijken of we met de nieuwe functieomschrijvingen wat meer hulp en houvast krijgen. Je kunt zeggen van oké je bent senior ontwerper, dat je daar wat meer houvast aan krijgt dan dat je het op gevoel moet doen. Maar beoordelen blijft altijd een stukje subjectiviteit.” “We hebben nu BAM borden bij productie, en we bespreken heel veel dingen bij het BAM bord.” “Ze kunnen daar, er zijn wat KPIs op het bord. Maar er zijn ook wat algemene dingen die gebeuren tijdens hun werkzaamheden, die ze daar aanmelden.” “Ja, je hebt ook nog Groeps Werk Overleg” “In principe 1 keer in de maand, mits er duidelijke dingen zijn waar je wat mee wilt gaan doen. Mededelingen ook, en bepaalde mededelingen komen wel aan het bord. Maar andere mededelingen deel je daar dan mede.” “Ja, dan noteren we dat, en meestal neem ik dat mee, als ze het zelf niet op kunnen lossen, neem ik dat naar het hogere BAM bord mee, en dan krijgen die anderen het voor zijn neus en dan moet hij daar weer actie mee ondernemen. En zo gaat het de organisatie steeds hoger in.” “Want niet alles ligt vast op papier, zo en zo moet je werken. Heel veel is een grijs gebied.”
S3,59-61 S3,62-65 S3,71-74 S3,238-239 S3,347-348 S3,349-352 S3,357-358 S3,360-361 S3,367 S3,369-371 S3,402-405 S3,463-464
76
References
Ajzen, I. (1991). The theory of planned behavior. Organizational behavior and human decision processes,
50(2), 179-211.
Alfes, K., Truss, C., Soane, E. C., Rees, C., & Gatenby, M. (2013). The Relationship Between Line Manager
Behavior, Perceived HRM Practices, and Individual Performance: Examining the Mediating Role
of Engagement. Human Resource Management, 52(6), 839-859.
Allen, N. J., & Meyer, J. P. (1990). The measurement and antecedents of affective, continuance and
normative commitment to the organization. Journal of occupational psychology, 63(1), 1-18.
Auh, S., Bell, S. J., McLeod, C. S., & Shih, E. (2007). Co-production and customer loyalty in financial
services. Journal of retailing, 83(3), 359-370.
Babbie, E. R. (2010). The practice of social research: Cengage Learning.
Benchmark-Electronics. (n.d.). Introductieboekje voor nieuwe medewerkers. 1-34.
Björkman, I., & Lervik, J. E. (2007). Transferring HR practices within multinational corporations. Human
Resource Management Journal, 17(4), 320-335.
Bos-Nehles, A. C. (2010). The line makes the difference: line managers as effective HRM partners:
University of Twente.
Boselie, P., & Van der Wiele, T. (2002). Employee perceptions of HRM and TQM, and the effects on
satisfaction and intention to leave. Managing Service Quality, 12(3), 165-172.
Bowen, D. E., & Ostroff, C. (2004). Understanding HRM–firm performance linkages: The role of the
“strength” of the HRM system. Academy of management review, 29(2), 203-221.
Brewster, C., HoltLarsen, & Trompenaars, F. (1992). Human resource management in Europe: evidence
from ten countries. International Journal of Human Resource Management, 3(3), 409-434.
Choi, J.-H., & Lee, K.-P. (2013). Effects of employees' perceptions on the relationship between HR
practices and firm performance for Korean firms. Personnel Review, 42(5), 573-594.
Den Hartog, D. N., Boon, C., Verburg, R. M., & Croon, M. A. (2013). HRM, Communication, Satisfaction,
and Perceived Performance A Cross-Level Test. Journal of Management, 39(6), 1637-1665.
Edwards, T., & Kuruvilla, S. (2005). International HRM: national business systems, organizational politics
and the international division of labour in MNCs. The International Journal of Human Resource
Management, 16(1), 1-21.
Field, A. (2009). Discovering statistics using SPSS: Sage publications.
Gerhart, B. (2005). Human resources and business performance: Findings, unanswered questions, and
an alternative approach. Management Revue, 174-185.
77
Gilbert, C., De Winne, S., & Sels, L. (2011). The influence of line managers and HR department on
employees' affective commitment. The International Journal of Human Resource Management,
22(8), 1618-1637.
Graen, G. B., & Uhl-Bien, M. (1995). Relationship-based approach to leadership: Development of leader-
member exchange (LMX) theory of leadership over 25 years: Applying a multi-level multi-
domain perspective. The leadership quarterly, 6(2), 219-247.
Hales, C. (2005). Rooted in supervision, branching into management: Continuity and change in the role
of first‐line manager. Journal of Management Studies, 42(3), 471-506.
Heider, F. (1958). The psychology of interpersonal relations: Psychology Press.
Heneman, R. L., Greenberger, D. B., & Anonyuo, C. (1989). Attributions and exchanges: The effects of
interpersonal factors on the diagnosis of employee performance. Academy of management
Journal, 32(2), 466-476.
Hornung, S., Rousseau, D. M., Glaser, J., Angerer, P., & Weigl, M. (2010). Beyond top‐down and bottom‐
up work redesign: Customizing job content through idiosyncratic deals. Journal of
Organizational Behavior, 31(2‐3), 187-215.
Kelley, S. W., Donnelly, J. H., & Skinner, S. J. (1990). Customer participation in service production and
delivery. Journal of retailing.
Khilji, S. E., & Wang, X. (2006). ‘Intended’and ‘implemented’HRM: the missing linchpin in strategic
human resource management research. The International Journal of Human Resource
Management, 17(7), 1171-1189.
Klein, K. J., & Kozlowski, S. W. (2000). Multilevel theory, research, and methods in organizations:
Foundations, extensions, and new directions: Jossey-Bass.
Kluemper, D. H., DeGroot, T., & Choi, S. (2013). Emotion Management Ability Predicting Task
Performance, Citizenship, and Deviance. Journal of Management, 39(4), 878-905.
Kulik, C. T., & Perry, E. L. (2008). When less is more: The effect of devolution on HR's strategic role and
construed image. Human Resource Management, 47(3), 541-558.
Lengnick-Hall, C. A. (1996). Customer contributions to quality: a different view of the customer-oriented
firm. academy of Management review, 21(3), 791-824.
Liao, H., Toya, K., Lepak, D. P., & Hong, Y. (2009). Do they see eye to eye? Management and employee
perspectives of high-performance work systems and influence processes on service quality.
Journal of applied psychology, 94(2), 371.

78
Martinko, M. J., Harvey, P., & Dasborough, M. T. (2011). Attribution theory in the organizational
sciences: A case of unrealized potential. Journal of Organizational Behavior, 32(1), 144-149.
McGovern, P., Gratton, L., Hope‐Hailey, V., Stiles, P., & Truss, C. (1997). Human resource management
on the line? Human Resource Management Journal, 7(4), 12-29.
Meyer, J. P., & Smith, C. A. (2000). HRM practices and organizational commitment: Test of a mediation
model. Canadian Journal of Administrative Sciences/Revue canadienne des sciences de
l'administration, 17(4), 319-331.
Nishii, L. H., Lepak, D. P., & Schneider, B. (2008). Employee attributions of the “why” of HR practices:
Their effects on employee attitudes and behaviors, and customer satisfaction. Personnel
psychology, 61(3), 503-545.
Ordanini, A., & Pasini, P. (2008). Service co-production and value co-creation: The case for a service-
oriented architecture (SOA). European Management Journal, 26(5), 289-297.
Paauwe, J., & Boselie, P. (2005). HRM and performance: what next? Human Resource Management
Journal, 15(4), 68-83.
Paré, G., & Tremblay, M. (2007). The influence of high-involvement human resources practices,
procedural justice, organizational commitment, and citizenship behaviors on information
technology professionals' turnover intentions. Group & Organization Management, 32(3), 326-
357.
Piening, E. P. (2012). Linking Employees’ HR System Perceptions, HR Outcomes and Performance: A
Longitudinal Study. Paper presented at the Academy of Management Proceedings.
Purcell, J., & Hutchinson, S. (2007). Front‐line managers as agents in the HRM‐performance causal chain:
theory, analysis and evidence. Human Resource Management Journal, 17(1), 3-20.
Reichel, A., & Lazarova, M. (2013). The Effects of Outsourcing and Devolvement on the Strategic Position
of HR Departments. Human Resource Management, 52(6), 923-946.
Renwick, D. (2003). Line manager involvement in HRM: an inside view. Employee Relations, 25(3), 262-
280.
Ryu, S., & Kim, S. (2013). First‐Line Managers' HR Involvement and HR Effectiveness: The Case of South
Korea. Human Resource Management, 52(6), 947-966.
Sanders, S., Yang, H. & Kim, S. (2012). The moderating effect of employees' HR attribution on HRM-
employee outcomes linkages. Academy of Management Annual Meeting, 1-38.
79
Sels, L., De Winne, S., Delmotte, J., Maes, J., Faems, D., & Forrier, A. (2006). Linking HRM and small
business performance: An examination of the impact of HRM intensity on the productivity and
financial performance of small businesses. Small Business Economics, 26(1), 83-101.
Settoon, R. P., Bennett, N., & Liden, R. C. (1996). Social exchange in organizations: Perceived
organizational support, leader–member exchange, and employee reciprocity. Journal of applied
psychology, 81(3), 219.
Sturges, J., Guest, D., Conway, N., & Davey, K. M. (2002). A longitudinal study of the relationship
between career management and organizational commitment among graduates in the first ten
years at work. Journal of Organizational Behavior, 23(6), 731-748.
Takeuchi, R., Lepak, D. P., Wang, H., & Takeuchi, K. (2007). An empirical examination of the mechanisms
mediating between high-performance work systems and the performance of Japanese
organizations. Journal of applied psychology, 92(4), 1069.
Tepper, B. J., Duffy, M. K., Hoobler, J., & Ensley, M. D. (2004). Moderators of the relationships between
coworkers' organizational citizenship behavior and fellow employees' attitudes. Journal of
Applied Psychology, 89(3), 455.
Tharenou, P. (2001). Going up? Do traits and informal social processes predict advancing in
management? Academy of Management Journal, 44(5), 1005-1017.
Tims, M., Bakker, A. B., & Derks, D. (2012). Development and validation of the job crafting scale. Journal
of Vocational Behavior, 80(1), 173-186.
Ulrich, D. (1998). A new mandate for human resources. Harvard business review, 76, 124-135.
Valverde, M., Ryan, & Soler, C. (2006). Distributing HRM responsibilities: a classification of organisations.
Personnel Review, 35(6), 618-636.
Whitener, E. M. (2001). Do “high commitment” human resource practices affect employee
commitment? A cross-level analysis using hierarchical linear modeling. Journal of Management,
27(5), 515-535.
Whittaker, S., & Marchington, M. (2003). Devolving HR responsibility to the line: threat, opportunity or
partnership? Employee Relations, 25(3), 245-261.
Williams, L. J., & Anderson, S. E. (1991). Job satisfaction and organizational commitment as predictors of
organizational citizenship and in-role behaviors. Journal of Management, 17(3), 601-617.
Wright, P. M., Gardner, T. M., & Moynihan, L. M. (2003). The impact of HR practices on the performance
of business units. Human Resource Management Journal, 13(3), 21-36.