Embed Size (px)
Citation preview
THE INFLUENCE OF EQUAL CHANNEL ANGULAR PRESSING ANGLES
ON THE MICROSTRUCTURE AND PROPERTIES OF Al-Si-Mg ALLOY
by
ALI ABADI ALTAYEF AL-JUBOURI
Thesis submitted in fulfillment of the requirements for the degree
of Doctor of Philosophy
July 2006
THE INFLUENCE OF EQUAL CHANNEL ANGULAR PRESSING ANGLES
ON THE MICROSTRUCTURE AND PROPERTIES OF Al-Si-Mg ALLOY
ALI ABADI ALTAYEF AL-JUBOURI
UNIVERSITI SAINS MALAYSIA
2006

ii

i
Dedicated to
The dear memory of my late Parents with boundless
gratitude
My darling wife Ibtisam, with my sincerest devotion
My loving brothers & sisters with my highest esteem
ii
ACKNOWLEDGEMENTS
In the name of Allah, the most gracious and the most merciful and may
his blessing be upon the prophet Mohamed (the blessings and peace of Allah
be upon him). The great thanks to the great Almighty “ALLAH S.W” who grant
me the health, knowledge, patience and the ability to complete this project.
I would like to sincerely express heartfelt gratitude to the invaluable
assistance, guidance, and fruitful discussion of my supervisor, Associate
professor Dr. Luay Bakir Hussain. I would like to express my deepest gratitude
to my co-supervisor, Dr. Nurulakmal Mohammed Sharif for her help, guidance
and support.
I’m grateful to Malaysian Government for offering me the honor of the
MTCP scholarship, which reflects the high interest of the Government in higher
education and scientific research. I would like to express my appreciation to the
School of Materials and Mineral Resources Engineering, University Sains
Malaysia for providing the necessary facilities for this project.
I would like to extend my grateful appreciation and thanks to Associate
Professor Dr. Zulkifly Abdullah from the School of Mechanical Engineering
(USM) for his assistance, helpful and providing his laboratory facilities for
thermal conductivity measurements. My sincere thanks to Professor Hj Zainal
Arifin Ahmad for providing the electrodes for corrosion experiments. I’m also
thankful to Dr Sunara Purwadaria for his advice and answering my endless
questions.
Special acknowledge is given to all academic, administrative and
technical staff of the School of Material and Mineral Resources Engineering ,
Mr. Sharul Ami, Mr. Abd Rashid, Mrs. Hasnah, Mr. Hasnor, Miss. Mahani, Mr.
iii
Helmi, Mr. Mokhtar, Mr. Suhaimi, Mr. Sayuti, Mr. Mohd Hasan, Mr. Azam, Mr.
Faisel, Mr. Halim, Mr. Shahid, Mr. Kemuridan and Mrs. Fong. As well as , Mr.
Abdul Latif , Mr. Amri and all technical staff of the School of Mechanical
Engineering (USM) for their cooperative and friendly attitude that this research
was carried out smoothly.
I would like to acknowledge the help provided by the Institute of
Postgraduate Studies. Thanks to all staff of the library of the University Sains
Malaysia.
My great thanks, compliments and regards to all my friends especially,
Dr. Basil Qahtan, Ahmed Abu-foul, Kheder Al-jubouri, Yeoh Cheow Keat and all
colleagues for help, kind accompaniment and support me in my effort.
Last, I would like to record a special word of thanks to my wife Ibtisam
Gazi, for her endless support, patience and encouragement. I also wish to
express my sincere thanks to my beloved brother and sisters along with my
parents, brothers and sisters in laws and relatives who have giving me their
unfailing support and encouragement.
iv
TABLE OF CONTENTS
Page
Dedication i
Acknowledgement ii
Table of Contents iv
List of Tables ix
List of Figures xi
List of Symbols xix
List of Abbreviations xxi
List of Publications xxii
Abstrak xxiii
Abstract xxv
CHAPTER ONE: INTRODUCTION
1
CHAPTER TWO : LITERATURE SURVEY
6
2.1 Aluminum and Aluminum Alloys 6
2.1.1 Aluminum and Aluminum Alloys Properties 6
2.1.2 Aluminum Series 8
2.2 Severe Plastic Deformation (SPD) Techniques 9
2.2.1 Multiple Forging (MF) 9
2.2.2 High Pressure Torsion (HPT) 10
2.3
2.2.3 Equal Channel Angular Pressing (ECAP) Principle of ECAP
13
14
v
2.4 Estimations of the Strain in ECAP 18
2.5 Microstructure Evolution 19
2.5.1 Mechanism of Microstructural Evolution During ECAP 20
2.5.1(a) Grains Subdivision 20
2.5.1(b) Shearing Planes 25
2.5.1(c) Deformation Texture 26
2.5.2 Strain effect on micrograin structure 28
2.6 Shearing Patterns 29
2.7 Microstructural developed by ECAP 31
2.7.1 The Effect of Die Channel 31
2.7.2 The Effect of Deformation Route 33
2.7.3 The Effect of Friction on the Deformation Homogeneity 35
2.8 Effect of ECAP on Materials Tensile 44
2.9 Submicrometer Grains and Hardness 46
2.10 ECAP in different materials 47
2.11 Thermal Conductivity 52
2.12 Corrosion Behavior 54
2.12.1 Corrosion of Ultra-fine Grained Materials 55
2.12.2 Corrosion Mechanism 58
2.12.3 Tafel`s Equation 60
2.12.4 The Corrosion Rate
61
CHAPTER THREE: MATERIALS AND METHODS
62
3.1 Material Composite 62
vi
3.2 Mold Casting Preparation 62
3.3 Workpieces Preparation 64
3.3.1 Melting Aluminum Alloy 64
3.3.2 Heat Treatment of Al- alloy Workpieces 64
3.3.3 Workpieces Machining 66
3.4 Pressing Through ECAP Dies. 67
3.5 Scanning Electron Microscopy (SEM) 68
3.5.1 SEM Workpieces Preparation 69
3.6 Hardness Measurement 70
3.7 Tensile Test 72
3.8 Thermal Conductivity Measurement 74
3.9 Corrosion Test 75
CHAPYER FOUR: RESULTS AND DISCUSIONS
77
4.1 Plastic Deformation Simulation 77
4.2 Al-Si-Mg Alloy ECAPed through a Die withΦ = 1200 and Ψ =00 84
4.2.1 Microstructural Characteristics 84
4.2.2 Microhardness Measurements 86
4.2.3 The thermal Conductivity Measurements 89
4.3 Al-Si-Mg Alloy ECAPed through a Die withΦ = 900 and Ψ =200 92
4.3.1 Microstructural Characteristics 92
4.3.2 Micro hardness Measurements 96
4.3.3 The Thermal Conductivity Measurements 98
4.4 Annealed Al-Si-Mg Workpieces at 500 0C ECAPed through a Die withΦ = 900 and Ψ =00
102
vii
4.4.1 Microstructural Characteristics 102
4.4.2 Microhardness Measurements 106
4.4.3 The Thermal Conductivity Measurements 109
4.5 Annealed Al-Si-Mg Workpieces at 600 0C ECAPed through a Die withΦ = 900 and Ψ =200
113
4.5.1 Microstructural Characteristics 113
4.5.2 Microhardness Measurements 118
4.5.3 The Thermal Conductivity Measurements 121
4.6 Tensile Test 125
4.7 Corrosion of Al-Si-Mg Alloy 134
4.7.1 The Influence of Microstructure on Corrosion 137
4.7.2 Corrosion Rate of ECAPed Al-Si-Mg Alloy Using a Die withΦ =1200and Ψ =00
138
4.7.3 Corrosion Rate of ECAPed Al-Si-Mg alloy Using a Die withΦ =900 and Ψ =200
142
4.7.4 Corrosion Rate of Annealed Al-Si-Mg Alloy at 5000C ECAPed Using a Die withΦ =900 and Ψ =00
145
4.7.5 Corrosion Rate of Annealed Al-Si-Mg Alloy at 600 0C ECAPed Using a Die withΦ =900 and Ψ =200
147
CHAPTER FIVE: CONCLUSIONS AND FUTURE SUGGESTIONS
154
5.1 Conclusions 154
5.2 Suggestion for Future Study 156
REFERENCES
157
APPENDICES
APPENDIX A Aluminum series and characteristics 171
viii
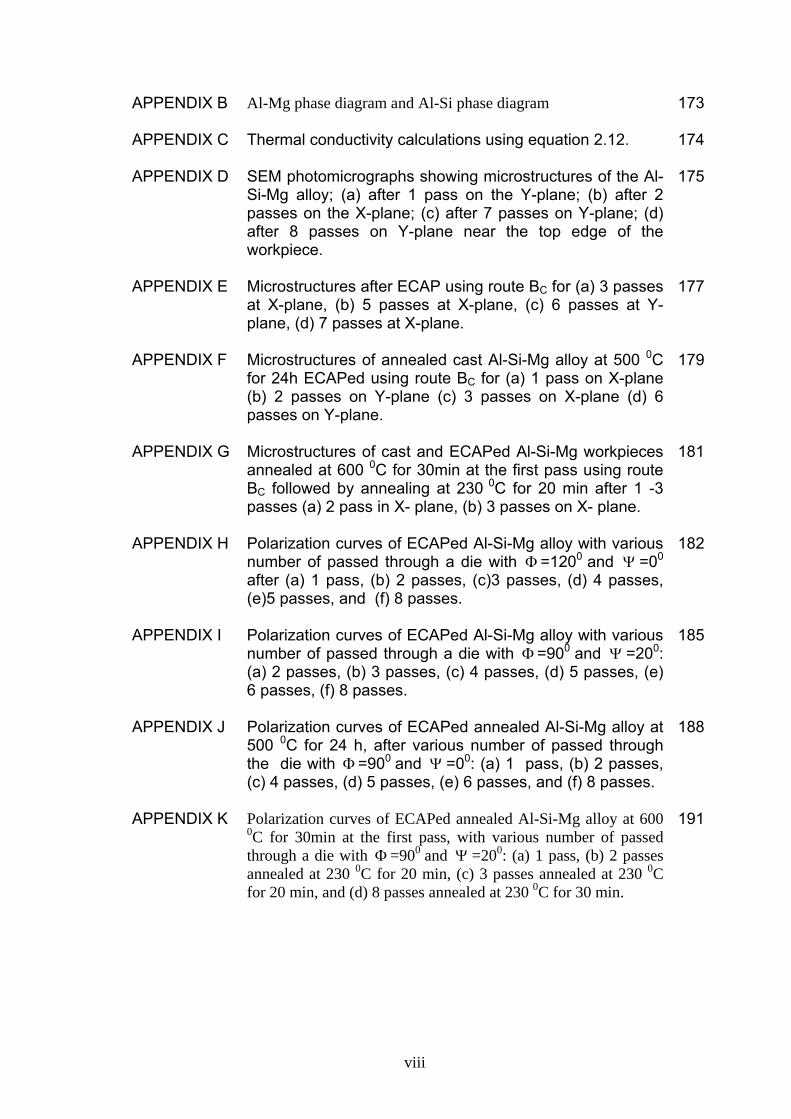
APPENDIX B Al-Mg phase diagram and Al-Si phase diagram 173
APPENDIX C Thermal conductivity calculations using equation 2.12. 174
APPENDIX D SEM photomicrographs showing microstructures of the Al-Si-Mg alloy; (a) after 1 pass on the Y-plane; (b) after 2 passes on the X-plane; (c) after 7 passes on Y-plane; (d) after 8 passes on Y-plane near the top edge of the workpiece.
175
APPENDIX E Microstructures after ECAP using route BC for (a) 3 passes at X-plane, (b) 5 passes at X-plane, (c) 6 passes at Y-plane, (d) 7 passes at X-plane.
177
APPENDIX F Microstructures of annealed cast Al-Si-Mg alloy at 500 0C for 24h ECAPed using route BC for (a) 1 pass on X-plane (b) 2 passes on Y-plane (c) 3 passes on X-plane (d) 6 passes on Y-plane.
179
APPENDIX G Microstructures of cast and ECAPed Al-Si-Mg workpieces annealed at 600 0C for 30min at the first pass using route BC followed by annealing at 230 0C for 20 min after 1 -3 passes (a) 2 pass in X- plane, (b) 3 passes on X- plane.
181
APPENDIX H Polarization curves of ECAPed Al-Si-Mg alloy with various number of passed through a die with Φ=1200 and Ψ =00 after (a) 1 pass, (b) 2 passes, (c)3 passes, (d) 4 passes, (e)5 passes, and (f) 8 passes.
182
APPENDIX I Polarization curves of ECAPed Al-Si-Mg alloy with various number of passed through a die with Φ=900 and Ψ =200: (a) 2 passes, (b) 3 passes, (c) 4 passes, (d) 5 passes, (e) 6 passes, (f) 8 passes.
185
APPENDIX J Polarization curves of ECAPed annealed Al-Si-Mg alloy at 500 0C for 24 h, after various number of passed through the die with Φ=900 and Ψ =00: (a) 1 pass, (b) 2 passes, (c) 4 passes, (d) 5 passes, (e) 6 passes, and (f) 8 passes.
188
APPENDIX K Polarization curves of ECAPed annealed Al-Si-Mg alloy at 600 0C for 30min at the first pass, with various number of passed through a die with Φ=900 and Ψ =200: (a) 1 pass, (b) 2 passes annealed at 230 0C for 20 min, (c) 3 passes annealed at 230 0C for 20 min, and (d) 8 passes annealed at 230 0C for 30 min.
191
ix
LIST OF TABLES
Page
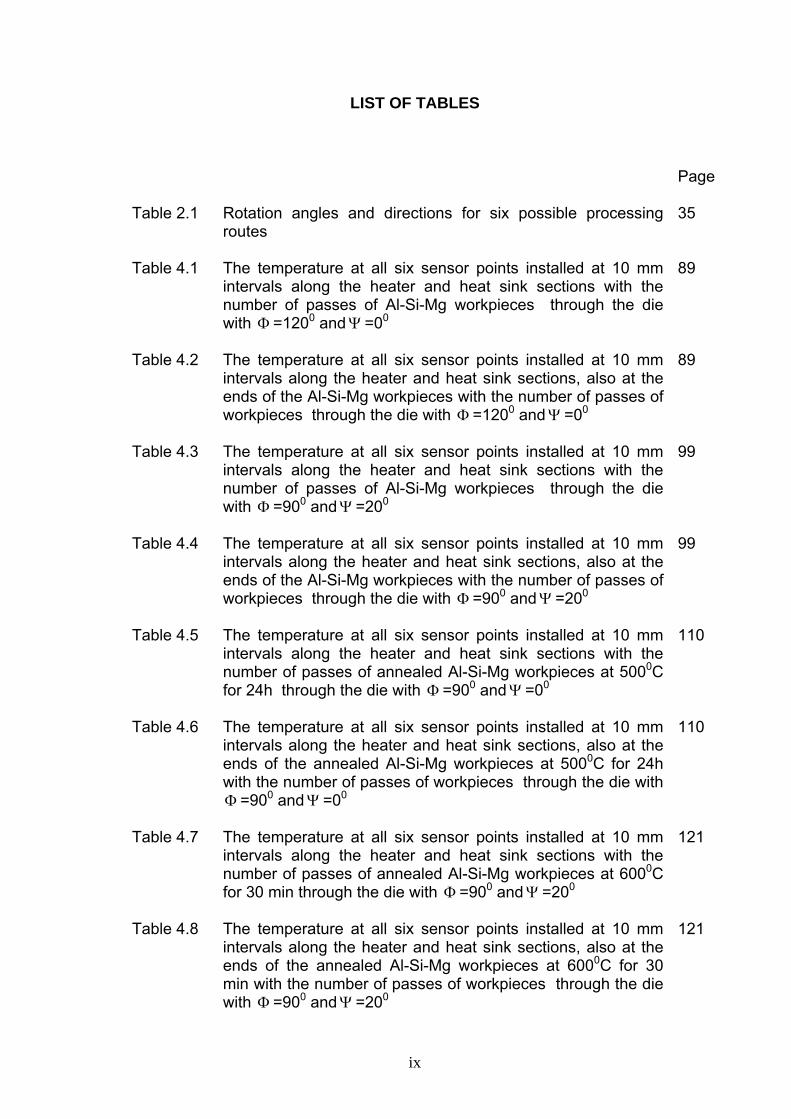
Table 2.1 Rotation angles and directions for six possible processing routes
35
Table 4.1 The temperature at all six sensor points installed at 10 mm intervals along the heater and heat sink sections with the number of passes of Al-Si-Mg workpieces through the die with Φ =1200 andΨ =00
89
Table 4.2 The temperature at all six sensor points installed at 10 mm intervals along the heater and heat sink sections, also at the ends of the Al-Si-Mg workpieces with the number of passes of workpieces through the die with Φ =1200 andΨ =00
89
Table 4.3 The temperature at all six sensor points installed at 10 mm intervals along the heater and heat sink sections with the number of passes of Al-Si-Mg workpieces through the die with Φ =900 andΨ =200
99
Table 4.4 The temperature at all six sensor points installed at 10 mm intervals along the heater and heat sink sections, also at the ends of the Al-Si-Mg workpieces with the number of passes of workpieces through the die with Φ =900 andΨ =200
99
Table 4.5 The temperature at all six sensor points installed at 10 mm intervals along the heater and heat sink sections with the number of passes of annealed Al-Si-Mg workpieces at 5000C for 24h through the die with Φ =900 andΨ =00
110
Table 4.6 The temperature at all six sensor points installed at 10 mm intervals along the heater and heat sink sections, also at the ends of the annealed Al-Si-Mg workpieces at 5000C for 24h with the number of passes of workpieces through the die with Φ =900 andΨ =00
110
Table 4.7 The temperature at all six sensor points installed at 10 mm intervals along the heater and heat sink sections with the number of passes of annealed Al-Si-Mg workpieces at 6000C for 30 min through the die with Φ =900 andΨ =200
121
Table 4.8 The temperature at all six sensor points installed at 10 mm intervals along the heater and heat sink sections, also at the ends of the annealed Al-Si-Mg workpieces at 6000C for 30 min with the number of passes of workpieces through the die with Φ =900 andΨ =200
121
x
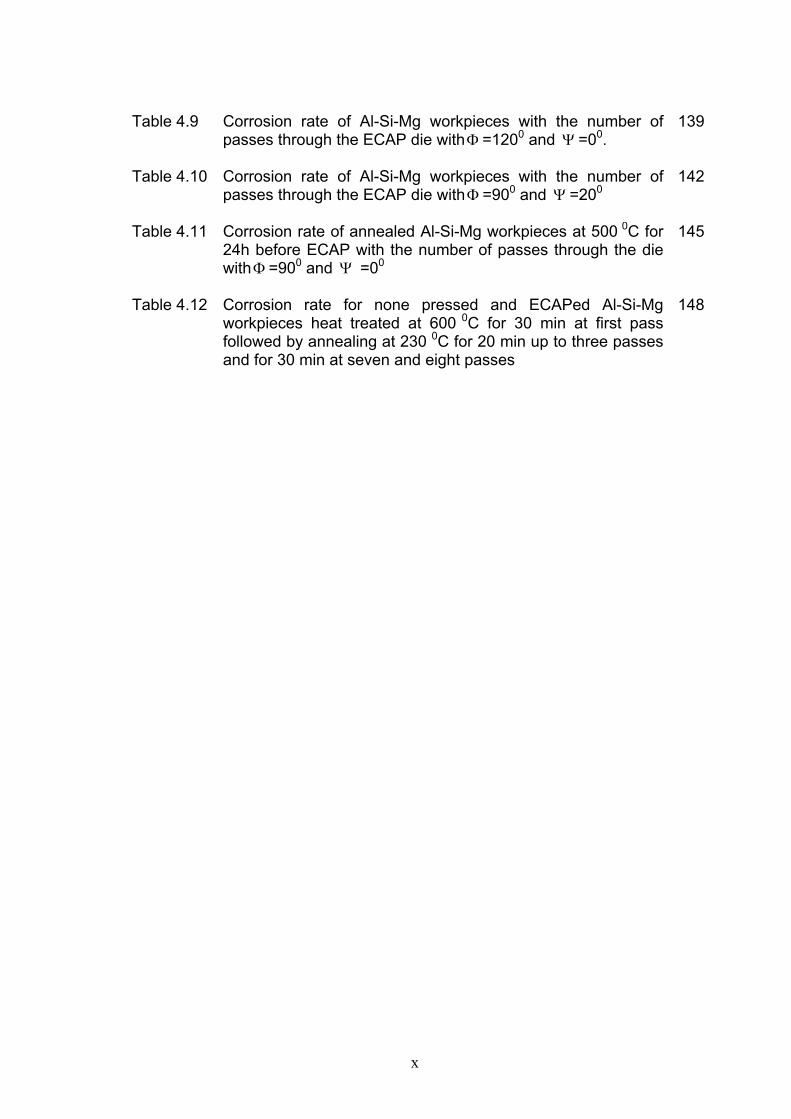
Table 4.9 Corrosion rate of Al-Si-Mg workpieces with the number of
passes through the ECAP die withΦ =1200 and Ψ =00.
139
Table 4.10 Corrosion rate of Al-Si-Mg workpieces with the number of passes through the ECAP die withΦ =900 and Ψ =200
142
Table 4.11 Corrosion rate of annealed Al-Si-Mg workpieces at 500 0C for 24h before ECAP with the number of passes through the die withΦ =900 and Ψ =00
145
Table 4.12 Corrosion rate for none pressed and ECAPed Al-Si-Mg workpieces heat treated at 600 0C for 30 min at first pass followed by annealing at 230 0C for 20 min up to three passes and for 30 min at seven and eight passes
148
xi
LIST OF FIGURES
Page
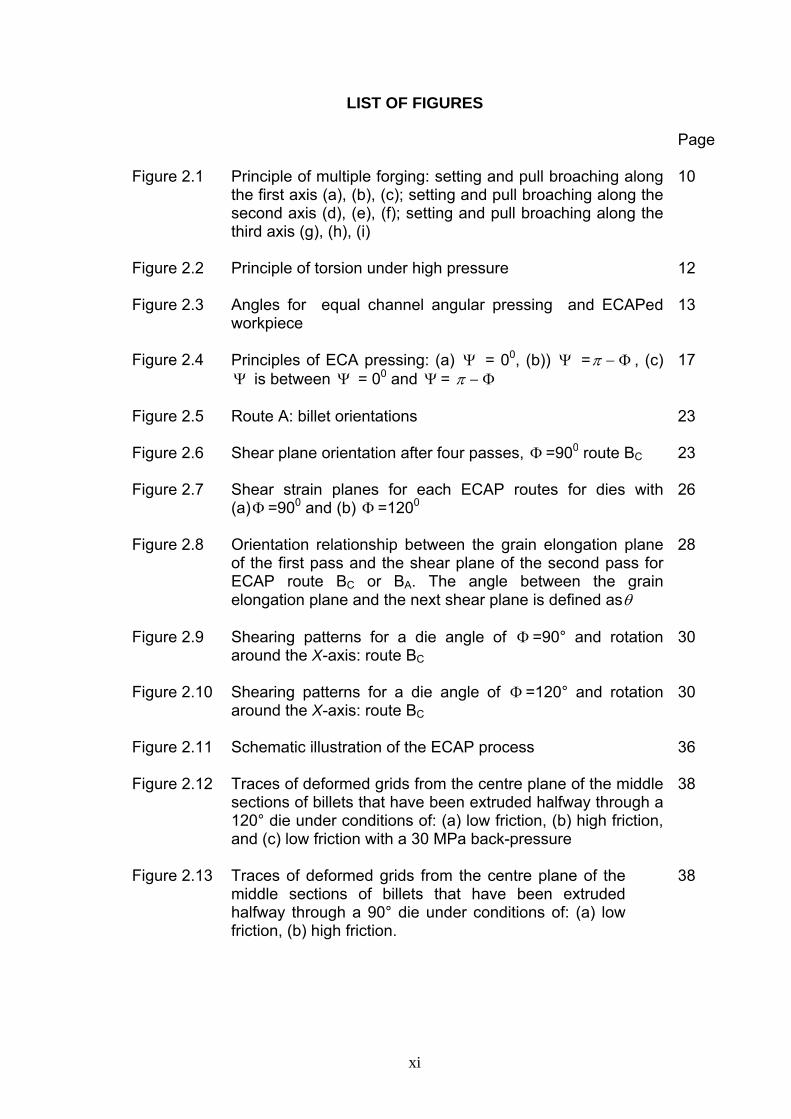
Figure 2.1 Principle of multiple forging: setting and pull broaching along the first axis (a), (b), (c); setting and pull broaching along the second axis (d), (e), (f); setting and pull broaching along the third axis (g), (h), (i)
10
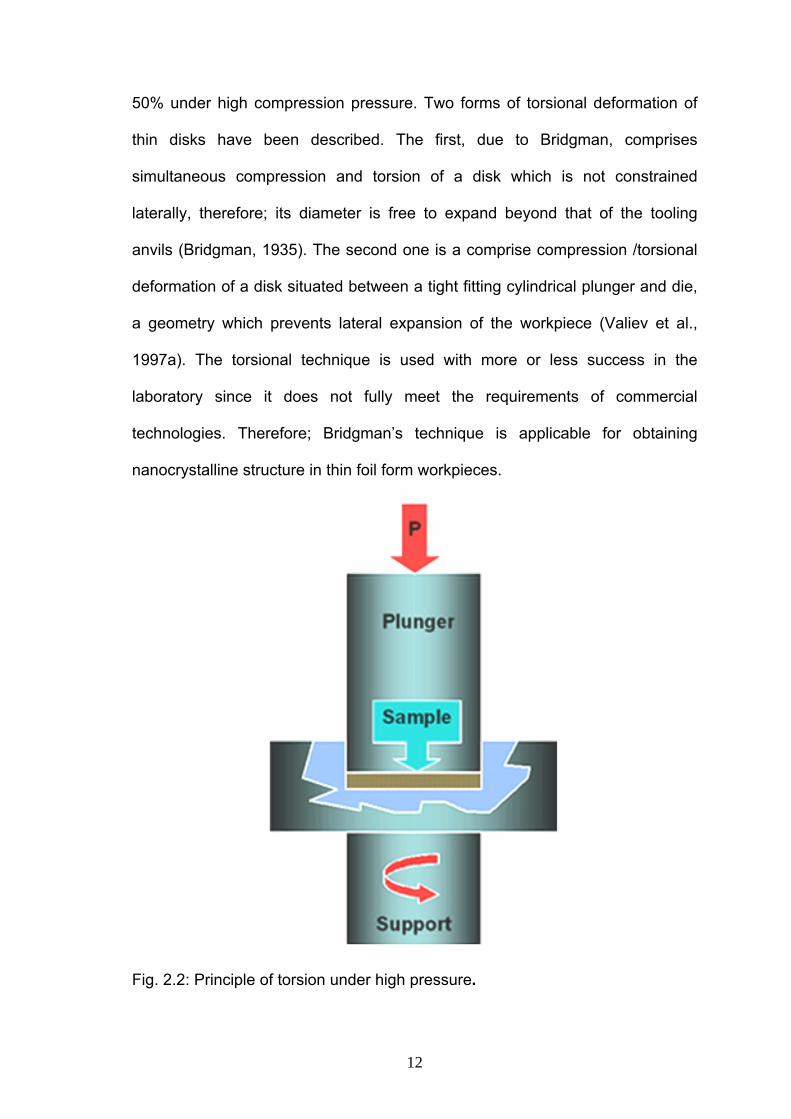
Figure 2.2 Principle of torsion under high pressure
12
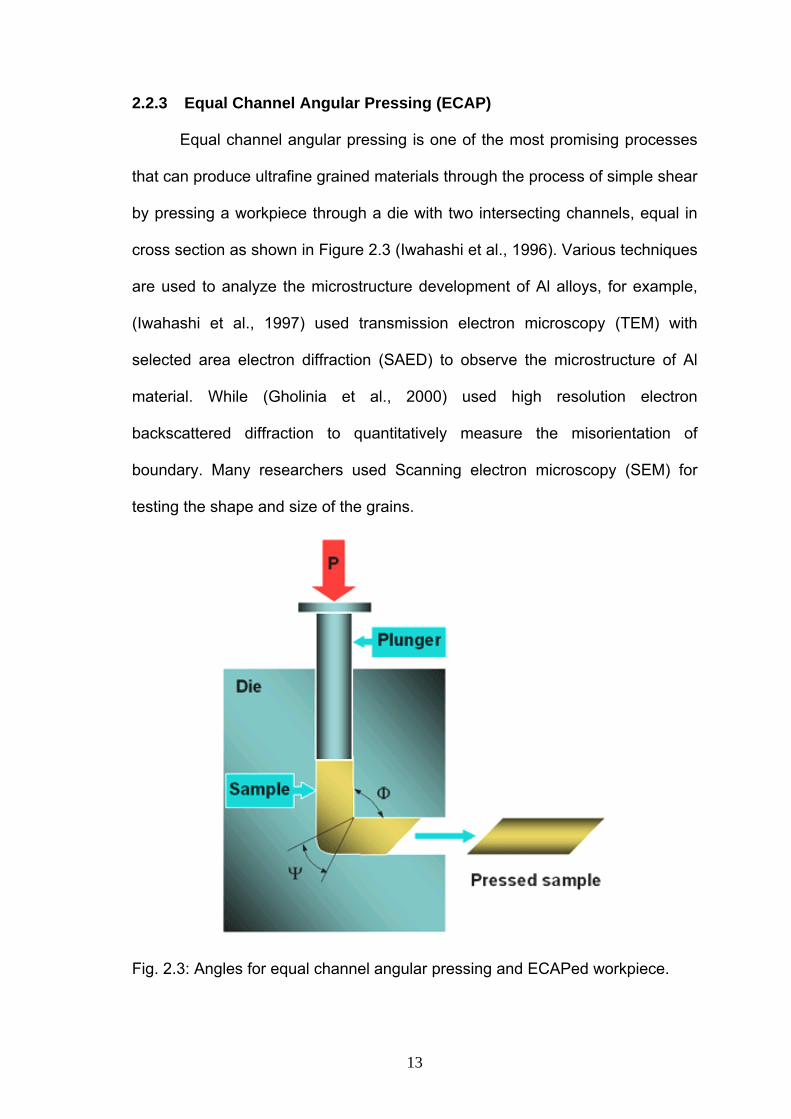
Figure 2.3 Angles for equal channel angular pressing and ECAPed workpiece
13
Figure 2.4 Principles of ECA pressing: (a) Ψ = 00, (b)) Ψ = −π Φ , (c) Ψ is between Ψ = 00 and Ψ = −π Φ
17
Figure 2.5 Route A: billet orientations 23
Figure 2.6 Shear plane orientation after four passes, Φ =900 route BC
23
Figure 2.7 Shear strain planes for each ECAP routes for dies with (a)Φ =900 and (b) Φ =1200
26
Figure 2.8 Orientation relationship between the grain elongation plane of the first pass and the shear plane of the second pass for ECAP route BC or BA. The angle between the grain elongation plane and the next shear plane is defined asθ
28
Figure 2.9 Shearing patterns for a die angle of Φ =90° and rotation around the X-axis: route BC
30
Figure 2.10 Shearing patterns for a die angle of Φ =120° and rotation around the X-axis: route BC
30
Figure 2.11 Schematic illustration of the ECAP process 36
Figure 2.12 Traces of deformed grids from the centre plane of the middle sections of billets that have been extruded halfway through a 120° die under conditions of: (a) low friction, (b) high friction, and (c) low friction with a 30 MPa back-pressure
38
Figure 2.13 Traces of deformed grids from the centre plane of the middle sections of billets that have been extruded halfway through a 90° die under conditions of: (a) low friction, (b) high friction.
38
xii
Figure 2.14 Schematic representation of the progressive shearing of a material element as it travels through the die’s deformation zone. ‘s’ and ‘n’ refer to the streamline coordinate system used in the texture model and are tangential and normal to the streamlines, respectively
39
Figure 2.15 FEM predictions of deformation geometry changes during ECMAP
42
Figure 2.16 Schematic diagram of local microgalvanic cells created by silicon-containing cathodic impurities: (a) a case of non-ECAPed state and (b) a case of ECAPed state.
57
Figure 3.1 Sand and sodium silicate mixing 62
Figure 3.2 Pressing of mixed sand
63
Figure 3.3 Injection of CO2 gas and removing the mild steel bars 63
Figure 3.4 Mold ready for casting Al alloy
64
Figure 3.5 Annealing process for Al-Si-Mg alloy before ECAP 65
Figure 3.6 Workpieces shape (a) Cast workpiece ready for ECAP, (b) after one partial pass through die with Φ =900 and Ψ =200, (c) after one pass through the die withΦ =900 and Ψ =200
66
Figure 3.7 Die shapes; (a) die withΦ =120 and Ψ =0, (b) die with Φ =90 and Ψ =0 and (c) die with Φ =90 and Ψ =20
68
Figure 3.8 The SEM system used in study 69
Figure 3.9 The reference directions in metallography examination and the planes designated X, Y and Z
70
Figure 3.10 The Future-Tech Vickers hardness tester FV 71
Figure 3.11 Sketch of pyramidal Vickers indentations on (a) X-plane, (b) Y-plane
72
Figure 3.12 Schematic representing the tension workpiece used in this study
73
Figure 3.13 The clamps of INSTRON machine, workpiece and its clamps
73
Figure 3.14 The Armfield Heat Conduction Apparatus
75
Figure 3.15 Corrosion test, (a) the Autolab system, (b) electrodes with polarization cell
76

xiii
Figure 4.1 Plasticine structure consists of four color balls as arranged 77
Figure 4.2 Microstructure of ECAPed plasticine through the die with Φ=1200 and Ψ=00 at: (a) 1 pass, (b) 3 passes, (c) 4 passes, (d) 8 passes, (e) 11 passes, and (f) 12 passes
79
Figure 4.3 The shear patterns of ECAPed plasticine through a die with Φ =1200 and Ψ =00 using route BC after: (a) as arranged, (b) 1 pass, (c) 2 passes, (d) 3 passes, (e) 4 passes, (f) 5 passes
81
Figure 4.4 The shear patterns of ECAPed plasticine through a die with Φ =900 and Ψ =200 using route BC after: (a) as arranged, (b) one pass, (c) two passes, (d) three passes, (e) four passes, (f) five passes
83
Figure 4.5 SEM micrographs showing microstructures of the Al-Si-Mg alloy: (a) as cast (b) after 6 passes on the Y-plane.
85
Figure 4.6 The average values of Vickers microhardness (Hv) for the as cast and ECAPed Al-Si-Mg workpieces on X and Y planes with the number of passes through the die with Φ =1200 andΨ =00
87
Figure 4.7 Vickers microhardness at X-plane for cast Al-Si-Mg alloy, 1, 3, 5 and 8 passes through the die with Φ =1200 andΨ =00 from the bottom to the top of the workpiece
87
Figure 4.8 Vickers microhardness at Y-plane for cast Al-Si-Mg alloy, 1, 3, 5 and 8 passes through the die with Φ =1200 andΨ =00 from the bottom to the top of the Workpiece
88
Figure 4.9 Vickers microhardness from the bottom to the top of the Al-Si-Mg workpiece at two locations for 8 passes through the die with Φ =1200 andΨ =00 on the X and Y planes. {E: end of the workpiece}
88
Figure 4.10 Shows the temperature profile in heater, Al-Si-Mg workpiece and heat sink (a) as cast, (b) as cast after extrapolation, (c) at one pass, (d) as cast, 1, 5 and 8 passes through the die with Φ =1200 andΨ =00
91
Figure 4.11 The thermal conductivity of the Al-Si-Mg alloy as a function of number of passes through the die with Φ =1200 andΨ =00
92
Figure 4.12
Microstructures after ECAP using route BC for (a) 2 passes at the top edge of the Al-Si-Mg workpiece for Y-plane, (b)3 passes at Y-plane, (c) 4 passes at X-plane, (d) 7 passes at Y-plane.
94
xiv
Figure 4.13 Shows the Vickers microhardness (Hv) profiles at X-plane along the transverse distance from the bottom to the top surfaces of the cast, 2- 8 ECAPed Al-Si-Mg alloy workpieces through the die withΦ =900 andΨ =200
97
Figure 4.14 Shows the Vickers microhardness (Hv) profiles at Y-plane along transverse distance from the bottom to the top surfaces of the cast, 2, 3, 5 and 8 ECAPed Al-Si-Mg alloy workpieces through the die withΦ =900 and Ψ =200
97
Figure 4.15 The average values of Vickers microhardness (Hv) for the As cast and ECAPed Al-Si-Mg workpieces at X & Y-planes with the number of passes through the die with Φ =900 and Ψ =200
98
Figure 4.16 Shows the temperature profile in heater, Al-Si-Mg workpiece and heat sink (a): as cast after extrapolation (b): as cast and one pass, (c): as cast, 1, 5 and 8 passes
101
Figure 4.17 The thermal conductivity of the Al-Si-Mg alloy as a function of number of passes through the die with Φ =900 and Ψ =200
102
Figure 4.18 Structure of annealed cast Al-Si-Mg alloy at 500 0C for 24h, magnification X 70 and the marker is 100µm
103
Figure 4.19 Microstructures of annealed cast Al-Si-Mg alloy at 500 0C for 24h ECAPed using route BC die with Φ= 900 and Ψ =00 for (a) 1 pass in Y-plane, (b) 2 passes in X-plane, (c) 3 passes on Y-plane (d) six passes on X-plane
105
Figure 4.20 Shows the Vickers microhardness (Hv) profiles at X-plane along the transverse distance from the bottom to the top surfaces of the annealed cast Al-Si-Mg alloy, annealed cast alloy at 500 0C for 24h ECAPed to 1, 3, 5 and 8 passes through the die withΦ =900 and Ψ =00
108
Figure 4.21 Shows the Vickers microhardness (Hv) profiles at Y-plane along the transverse distance from the bottom to the top surfaces of the annealed cast Al-Si-Mg alloy, annealed cast alloy at 500 0C for 24h ECAPed to 1, 3, 5 and 8 passes through the die withΦ =900 and Ψ =00
108
Figure 4.22 Shows the average values of Vickers microhardness versus the number of passes for annealed Al-Si-Mg alloy workpieces at 500 0C for 24h through the die with Φ =900 and Ψ =00 on X and Y-planes. (P:pass)
109
xv
Figure 4.23 Temperature profile in the heater, Al-Si-Mg workpiece and heat sink for (a): as cast Al-Si-Mg alloy annealed at 500 0C for 24h, (b): as cast annealed and 1 pass, (c): as cast annealed, 1, 5, and 8 passes of Al-alloy workpieces through the die with Φ =900 and =Ψ 00
111
Figure 4.24 Shows thermal conductivity of the annealed Al-Si-Mg alloy at 5000C for 24h as a function of the number of passes through the die with 90=Φ 0 and =Ψ 00
112
Figure 4.25 Structure of as annealed cast Al-Si-Mg alloy at 600 0C for 30 min, magnification X 70 and the marker is 100µm
113
Figure 4.26 Microstructures of cast and ECAPed Al-Si-Mg workpieces annealed at 600 0C for 30min at the first pass using route BC followed by annealing at 230 0C for 20 min after 1 -3 passes and at 230 0C for 30 min after 7-8 passes (a) 2 pass on Y-plane, (b) 3 pass on Y- plane, (c) 7 passes on X-plane, (d) 8passes on X- plane.
115
Figure 4.27 Method of measuring the boundary misorientation angle,ϕ from selected area electron diffraction patterns.
118
Figure 4.28 The Vickers microhardness (Hv) profiles at X-plane along the transverse distance from the bottom to the top surfaces of annealed Al-Si-Mg alloy at 600 0C for 30min at the first pass followed by annealing at 230 0C for 20 min after 1 -3 passes and at 230 0C for 30 min after 7-8 passes using route BC through the die withΦ =900 and Ψ =200
119
Figure 4.29 The Vickers microhardness (Hv) profiles at Y-plane along the transverse distance from the bottom to the top surfaces of annealed Al-Si-Mg alloy at 600 0C for 30min at the first pass followed by annealing at 230 0C for 20 min after 1-3 passes and at 230 0C for 30 min after 7-8 passes using route BC through the die withΦ =900 and Ψ =200
120
Figure 4.30 The average values of Vickers microhardness versus the number of passes for annealed Al-Si-Mg alloy at 600 0C for 30min at the first pass followed by annealing at 230 0C for 20 min after 1 -3 passes and at 230 0C for 30 min after 7-8 passes using route BC through the die withΦ =900 and Ψ =200 on X and Y planes
120
xvi
Figure 4.31 Temperature profile in the heater, Al-Si-Mg workpiece and heat sink for annealed Al-Si-Mg alloy at 600 0C for 30min at the first pass followed by annealing at 230 0C for 20 min after 1 -3 passes and at 230 0C for 30 min after 7-8 passes (a) as cast Al-alloy annealed at 600 0C for 30min, (b) as annealed cast, 1, 2, 3, 7 and 8 passes of Al-alloy workpieces through the die with Φ =900 and Ψ =200 using route BC
123
Figure 4.32 Shows thermal conductivity of the annealed Al-Si-Mg alloy at 6000C for 30min as a function of the number of passes through the die with 90=Φ 0 and =Ψ 00
124
Figure 4.33 Shows thermal conductivity of the Al-Si-Mg workpieces with the number of passes using the die withΦ =1200, 900 and Ψ =00, 200 at room temperature respectively, annealed workpieces at 500 0C for 24h before ECAP using the die withΦ =900 and Ψ =00 , and annealed workpieces at 600 C for 30 min using the die with Φ =900 and Ψ =200
124
Figure 4.34 Tensile Al-Si-Mg workpieces tested to failure at room temperature: (a) as cast, (b) two passes, (c) three passes, (d) four passes, (e) five passes and (f) six passes
126
Figure 4.35 Tensile test to failure at room temperature of annealed Al-Si-Mg workpieces at 500 0C for 24h: (a) as annealed cast, (b) one pass, (c) two passes, (d) three passes, (e) four passes and (f) five passes
127
Figure 4.36 True stress-strain curves of Al-Si-Mg alloy at different number of passes through the die withΦ =900 andΨ =00
128
Figure 4.37 True stress-strain curves of annealed Al-Si-Mg alloy at 500 0C for 24h at different number of passes through the die withΦ =900 andΨ =00
129
Figure 4.38 The effect of number of passes on the maximum load of ECAP process for Al-Si-Mg alloy
129
Figure 4.39 The effect of the number of passes on the stress at the maximum load of ECAP process for Al-Si-Mg alloy
130
Figure 4.40
Figure 4.41
The effect of the number of passes on the % strain to failure of ECAPed Al-Si-Mg alloy through the die with Φ =900 andΨ =00
Scanning electron micrographs of the fracture surfaces of the tested Al-Si-Mg workpieces: (a) cast alloy, (b) after 3 passes, (c & d) after 5 passes with different magnification, and (e & f) after 6 passes with different magnification.
130
131
xvii
Figure 4.42 Scanning electron micrographs of the fracture surfaces of the tested annealed Al-Si-Mg workpieces at 500 0C for 24 hour: (a) annealed cast alloy, (b) after 2 passes, (c & d) after 3 passes with different magnification, and (e & f) after 4 passes with different magnification.
133
Figure 4.43 Schematic diagram showing the influence of shift in cathodic polarization curve on corrosion potential and corrosion current density.
135
Figure 4.44 Schematic diagram showing the influence of shift in anodic polarization curve on corrosion potential and corrosion current density.
136
Figure 4.45 Schematic diagram showing the influence of shift in cathodic polarization curve on corrosion potential and limiting current density.
136
Figure 4.46 Schematic diagram showing the influence of shift in cathodic and anodic polarization curves on corrosion potential and limiting current density.
137
Figure 4.47 Polarization curves of (a) cast Al-Si-Mg alloy and (b) ECAP with 7 passes through the die with Φ=1200 and Ψ =00.
140
Figure 4.48 SEM images of surface morphology with various number of passes of the ECAPed Al-Si-Mg alloy through Φ=1200 andΨ =00 die after electrochemical test: (a) as cast alloy, (b) after 1 pass, (c) after 5 passes, and (d) after 8 passes
141
Figure 4.49 Polarization curves of (a) cast Al-Si-Mg alloy and (b) ECAPed with 7 passes through a die with Φ=900 and Ψ =200.
143
Figure 4.50 SEM images of surface morphology with various number of passes of the ECAPed Al-Si-Mg alloy through Φ=900 andΨ =200 die after electrochemical test: (a) as cast alloy, (b) after 2 passes, (c) after 5 passes, and (d) after 8 passes
144
Figure 4.51 Polarization curves of (a) cast annealed Al-Si-Mg alloy at 500 0C for 24 h, and (b) ECAPed annealed with 7 passes through a die with Φ =900 and Ψ =00.
146
Figure 4.52 SEM images of surface morphology with various number of passes of the ECAPed annealed Al-Si-Mg alloy at 5000C for 24 h through Φ=900 andΨ =00 die after electrochemical test: (a) as annealed cast alloy, (b) after 2 pass, (c) after 5 passes, and (d) after 8 passes
147
xviii
Figure 4.53 Polarization curves of (a) cast annealed Al-Si-Mg alloy at 600 0C for 30min, and (b) ECAPed with 7 passes through the die with Φ=900 and Ψ =200 annealed at 230 0C for 30 min
150
Figure 4.54 SEM images of surface morphology with various number of passes of the ECAPed annealed Al-Si-Mg alloy at 6000C for 30 min through Φ=900 andΨ =200 die after electrochemical test: (a) as annealed cast alloy at 600 0C for 30 min, (b) after 1 pass and (c) after 3 passes at 230 0C for 20 min, and (d) after 8 passes at 230 0C for 30 min.
151
Figure 4.55 EDS spectra and SEM morphology of impurities present at the surface of corroded ECAPed (after one pass) annealed Al-Si-Mg alloy at 500 0C for 24 h: (a and a#) at wide area, (b and b#) at small area
153
xix
LIST OF SYMBOLS
A Area
ϕ Boundary Misorientation Angle
σ Electrical conductivity
e- Electron
0σ friction stress
d Grain Size
N Number of passes
ky positive constant of yielding
γ Shear strain
SFEγ Stacking Fault Energy
ε N Strain accumulated after N passes
Q The amount of heat
β The angle between grain elongation direction and the extrusion axis
θ The angle between the grain elongation plane and the next shear plane is defined
Ψ The angle defining the outer arc of curvature at the point of intersection of the two channels
ek The electronic component of thermal conductivity
eqε The equivalent strain
Φ the internal angle between the two intersecting channels
lk The lattice component of thermal conductivity
TΔ The temperature gradient
k Thermal conductivity
xx
Hv Vickers microhardness
yσ Yield tress
mμ Micrometer
Tm The Melting Temperature
ba Anodic Tafel slop
bb Cathodic Tafel slop
i current density(A/m2)
P Load
T Temperature in Kelvin
t Time
Z Atomic mass
xxi
LIST OF ABBREVIATIONS
aq Aqueous
ECAP Equal Channel Angular Pressing
EDS Energy Dispersive X-ray
F.C.C. Face Centered Cubic
FEM Finite Element Method
HAGB High Angle Grains Boundary
HPT High Pressure Torsion
LAGB Low Angle Grain Boundary
MF Multiple Forging
PDZ Plastic Deformation Zone
PP Elastic-perfectly Plastic
Route A The sample is not rotate between consecutive pressings
Route BA The sample is rotate by 900 in alternate directions between consecutive pressings
Route BC The sample is rotate by 900 in the same direction between consecutive pressings
Route C The sample is rotate by 1800 between consecutive pressings
SAED Selected Area Electron Diffraction
SEM Scanning Electron Microscopy
SH Strain Hardening
SPD Severe Plastic Deformation
TEM Transmission Electron Microscopy
UFG Ultra Fine Grains
UTM Universal testing machine
xxii
LIST OF PUBLICATIONS
1. Ali A. Aljubouri, Luay B. Hussain, Nurulakmal Mod Sharif and M.Z. Abdullah, “The Influence of Plastic Deformation via ECAP on the Hardness of 6061 Al alloy”. Paper presented at International Conference on Recent Advances in Mechanical & Materials Engineering (ICRAMME 2005), session 15, No. 67, 30-31 May 2005, Ungku Aziz Hall, University of Malaya, Kuala Lumpur, Malaysia.
2. Ali A. Aljubouri, Luay B. Hussain, Nurulakmal Mod Sharif and M.Z.
Abdullah, “Enhancement of Al – 1.3 Si Alloy Properties by ECAP Method”. Paper presented at 14th Scientific Conference & 15th Annual General Meeting of Electron Microscopy Society of Malaysia, PP. 8-15, 5th – 7th December 2005, Vistana Hotel, Penang.
3. Ali A. Aljubouri, Luay B. Hussain, Nurulakmal Mod Sharif and M.Z.
Abdullah, “Effect Annealing on Some Mechanical and Physical Properties of Al Alloy Processed by ECAP” Poster presented at 14th Scientific Conference & 15th Annual General Meeting of Electron Microscopy Society of Malaysia, PP 131-139, 5th – 7th December 2005, Vistana Hotel, Penang.
4. Ali A. Aljubouri, Luay B. Hussain, Nurulakmal Mod Sharif, “ The Effect of
ECAP on the Hardness and Structure of Al alloy”. Poster presented at the 6th Field – Wise Seminar for Materials Engineering on Biomaterials, Nanomaterials, Advanced Materials & Composites, held at School of Materials and Mineral Resources Engineering, University Sains Malaysia, on 17th May 2005.
5. Luay B. Hussain, Ali A. Aljubouri, M.A.M. Jebril, Nurulakmal Mod Sharif,
“Spot Welding Copper 1%Cr Electrode Tips Produced via Equal Channel Angular Pressing”. Paper to be published in a Journal of the ASEAN Committee on Science & Technology. Sent for Referee.
xxiii
KESAN SUDUT PENEKANAN SALUR BERSUDUT SAMA TERHADAP MIKROSTRUKTUR DAN SIFAT-SIFAT ALOI Al-Si-Mg.
ABSTRAK
Penyelidikan ini bertujuan untuk meningkatkan sifat-sifat fizikal dan
mekanikal aloi Al-Si-Mg melalui penghalusan struktur ira yang dihasilkan oleh
kecacatan plastik lampau. Struktur ini diperolehi secara penekanan sudut salur
sama (equal channel angular pressing (ECAP)). Aloi ini mempunyai komposisi
(dalam % berat) 1.3 Si, 0.3 Mg, 0.18 Fe, 0.023 Cu, 0.019 Mn, 0.017 Zn, 0.014
Ga, 0.011 Ti dan selebihuya Al. Dalam proses ECAP sampel ditekan melalui
dai bersudut 900 dan 1200 menggunakan laluan BC. Sampel diputar 900 dalam
arah yang sama diantara setiap urutan penekanan melalui dai ECAP. Sampel
mengalami kecacatan plastic secara ricihan tulen semasa melalui sudut
persimpangan. Penilaian mikrostruktur, sifat fizikal dan sifat mekanikal sampel
Al-Si-Mg yang tersemperit melalui proses ECAP dianalisis menggunakan
microskop imbasan electron (SEM), ujian kekerasan mikro Vickers, ujian
tegangan, ujian konduksi terma serta ujian elektrokimia kakisan. Kesan-kesan
sudut penekanan, terhadap sifat-sifat mekanikal dan penghalusan mikrostruktur
pada suhu sepuh lindap, (230 0C dan 500 0C) dan suhu ubah bentuk (600 0C)
telah dinilai. Dari pada pemerhatian perkemangan mikrostruktur proses ECAP
menghasilkan pengurangan saiz butir daripada 70-100 μ m kepada sekitar 200
nm. Sampel selepas ECAP yang melalui proses sepuh lindap pada 500 0C
selama 24 jam sebelum ECAP juga mempamerkan butir-butir dengan saiz
serupa. Manapun walaubagai proses sepuh lindap pada 230 0C selama 20-30
minit selepas ECAP membawa kepada peningkatan saiz butir kepada 300
hingga 600 nm. Kekerasan mikro ditingkatkan sebanyak 250-300 % dan
terdapat sedikit penurunan di dalam nilai yang di perolehi apabila masa sepuh
xxiv
lindap ke atas sampel ECAP ditingkatkan. Kekonduksian terma bertambah
sebanyak 19-30%, bergantung kepada sudut salur dan suhu sepuh lindap. Nilai
yang lebih tinggi diperolehi untuk sudut yang lebih tirus dan suhu sepuh lindap
lebih tinggi.Kekuatan tegangan sampel tuangan Al-Si-Mg dikaji selepas melalui
ECAP dengan sudut salur 900. Kekuatan tegangan mutlak, beban maksimum
dan pemanjangan meningkat dengan bertambahnya bilangan ulangan proses
ECAP. Keputusan yang diperolehi dari ujian kakisan menunjukkan sampel Al-
Si-Mg yang telah melalui proses ECAP mempunyai rintangan kakisan yang
lebih baik dalam 3.5% NaCl berbanding sampel Al-Si-Mg yang dituang. Kadar
kakisan berkurang apabila proses ECAP diulang untuk sampel yang sama
tetapi kadar kakisan bertambah dengan peningkatan suhu sepuh lindap. Sifat-
sifat benda kerja yang dikaji menunjukkan perubahan yang jelas selepas
melalui laluan pertama proses ECAP. Adalah diketahui bahawa, proses ECAP
merupakan proses yang mudah, murah dan berkesan untuk menambahbaik
sifat-sifat fizikal dan mekanikal aloi Al-Si-Mg. Peningkatan sifat fizikal dan
mekanikal ini menawarkan potensi yang baik untuk di gunakan di dalam
pelbagai aplikasi industri.
xxv
THE INFLUENCE OF EQUAL CHANNEL ANGULAR PRESSING ANGLES ON THE MICROSTRUCTURE AND PROPERTIES OF Al-Si-Mg ALLOY
ABSTRACT
The aim of this research is to improve the physical and mechanical
properties of Al-Si-Mg alloy by grain structure refinement produced by severe
plastic deformation through equal channel angular pressing (ECAP). This alloy
has a composition (in wt. %) of 1.3 Si, 0.3 Mg, 0.18 Fe, 0.023 Cu, 0.019 Mn,
0.017 Zn, and 0.014 Ga, 0.011 Ti 1.3 Si, 0.3 Mg, 0.18 Fe, 0.023 Cu, 0.019 Mn,
0.017 Zn, 0.014 Ga, 0.011 Ti balance Al. In ECAP process, the workpieces are
pressed through a 1200 and 900 dies using route BC. Through this route the
sample is rotated by 900 in the same direction between each consecutive
pressing through the ECAP dies. Workpieces undergo plastic deformation by
pure shear through the intersecting corner. Microstructure evaluation, physical
and mechanical properties of the extruded Al-Si-Mg workpieces by equal
channel angular pressing were conducted using scanning electron microscopy
(SEM), micro-Vickers hardness tester, tensile test machine, heat conduction
apparatus and auto lab corrosion test system. The effect of die angles on the
microstructural refinement and mechanical properties at annealing temperature
(230 0C and 500 0C) and deformation temperature (600 0C) were investigated.
From the microstructure evolution, ECAPed resulted in reduction of grain size
from 70-100μ m to about 200nm. The ECAPed workpieces that underwent
annealing at 500 0C for 24h before ECAP also displayed grains with similar
sizes. However, annealing process at 230 0C for 20-30min after ECAP leads to
an increase of grain size to around 300 to 600nm. Microhardness was
improved by 250-300% and there was slight reduction in its value obtained with
xxvi
the increase in annealing time of ECAPed workpieces. The enhancement of
thermal conductivity is by 19-30%, depending on channel angle and annealing
conditions. It showed higher value for sharper channel angle (900), and higher
annealing temperature. From the tensile tests, the maximum load, maximum
stress and elongation to failure increases with the number of passes through
the ECAP die. Results from the corrosion experiments of deformed Al-Si-Mg
alloy in 3.5% NaCl solution showed better corrosion resistance compared to as-
cast Al-Si-Mg alloy. The corrosion rate was reduced with the number of passes
through the ECAP dies but its value increases with increasing annealing
temperature. In general, a drastic change in all investigated mechanical and
physical properties occurred after the first pass through the ECAP dies. It is well
known that the ECAP provides a simple, cheap and effective processing
technique for producing nanostructured Al-Si-Mg alloy. Consequently the
improvement in the mechanical and physical properties offers great potential to
be used in various industrial applications.
.
1
CHAPTER ONE
INTRODUCTION
It is well known that there are significant advantages to be gained from
deforming metallic alloys to very high plastic strains. These include
microstructural refinement (Segal, 1995) and enhanced mechanical properties
(Valiev et al., 1993 and Markushev et al., 1997).
In conventional processes, like gas condensation (Sanders et al., 1997;
Glieter, 1989), ball milling with subsequent consolidation (Koch and Cho, 1992;
Eckert et al., 1992; Kock, 1997) and rolling (Philippe, 1994) one or more of the
material dimensions are continuously being reduced with strain, can only be
achieved in foils or filaments, which have few structural applications. In other
words, it is possible to use these methods for producing ultrafine grain structure
even to the size of nanometer, but it is not easy to use these methods to
produce large bulk workpieces, which then limits the industrial applications.
The inert gas submicrocrystalline process is capable of producing small
crystallites with a narrow size distribution. Mean grain size is controlled by
operation temperature and the inert gas pressure. The powder produced is
compacted in vacuum to form samples. Besides, nanocrystalline materials can
also be synthesized by high energy ball milling of elemental, intermetallic
compound, or immiscible powders (Jang and Kock, 1990). However, it should
be pointed out that the residual porosity in compacted samples and impurities
from ball milling would not be easily eliminated, and the mechanical and
2
physical properties inherent to various nanostructured materials are influenced
by these imperfections (Valiev et al., 1992).
Recent investigations have shown that severe plastic deformation (SPD)
is an effective method for forming submicron grain material (Segal, 2002; Yu et
al., 2005). Three requirements should to be taken into account while developing
methods of severe plastic deformation (SPD) for production of nanostructures in
bulk workpieces. Firstly, it is essential to obtain submicrometer grain structures
with high angle grain boundaries. Secondly, to achieve stable properties of the
processed materials, the nanostructures must be uniform within the whole
volume of the workpiece. Thirdly, the workpiece should not have any
mechanical cracks or damage when it is exposed to large plastic deformation.
Traditional methods can not meet these requirements (Valiev et al., 2000).
Different techniques have been used to introduce large quantities of
plastic strain into metals. Rolling is the most conventional technique, but higher
strain levels (greater or equal to 10) have been achieved more recently for
example by torsion under high pressure (Valiev, 1993; Gertsman et al.,1994;
Alexandrov et al., 1998), by cycle’s extrusion (Korbel and Richert, 1985), or by a
specific method involving simple shear inside a localized zone called equal
channel angular pressing (ECAP) (Iwahashi et al., 1996; Segal, 1995).
ECAP, invented by Segal et al., (1981) in the beginning of the 1980s, has
been the subject of intensive study in recent years due to its capability of
producing large full density samples containing an ultrafine (or nanometer

3
scale) grain size by repeating the process while maintaining the original cross-
section of the workpiece.
Processing by ECAP involves pressing a sample through a die within a
channel that is bent into an L-shaped configuration. In general, the equivalent
strain is close to ~1 when the two parts of the channels intersect at 900
(Iwahashi et al., 1996). There are many parameters that affect the
microstructural evolution in materials. Among them are, the die angle, which
determines the strain introduced in the material for each deformation pass
(Iwahashi et al., 1996; Nakashima et al., 1998; Luis Perez, 2004), and the
number of passes through the die, which corresponds to the total accumulated
strain applied to the workpiece. The deformation route, which involves rotating
the workpiece between each successive passes, is another important
parameter in microstructure development (Furukawa et al., 1998; Iwahashi et
al., 1997 and 1998a). In addition, the content of impurities (Iwahashi et al.,
1998b), pressing speed (Berbon et al., 1999), the deformation temperature Cao
et al., 2003; Zheng et al., 2006), and the friction between the die walls and the
workpiece are also essential parameters (Semiatin et al., 2000; Oruganti et al.,
2005).
However, different microstructures can be developed in ECAP by rotating
the workpiece between extrusion cycles (Iwahashi et al., 1997, 1998a, 1998c).
It is possible to define four distinct processing routs A, BA, BC and C, which are
classified by how the workpiece is rotated with respect to the die for each
subsequent pass. When the workpiece is rotated after each pass around its
4
longitudinal axis through the angles: 00 (route A), 090± (route BA), + 900 (route
BC), and +1800 (route C).
The SPD techniques may form grains with sizes in the order of 100-200
nm and with high angle grain boundaries (Valiev et al., 2000). The SPD
materials should be described as nanocrystalline, since they often have a mean
grain size of about 20-100 nm. Several articles have reported that the
deformation structure of most alloys processed by ECAP at room temperature
exhibit homogeneous equiaxed grains with a high fraction of high angle grain
boundaries (65%) (Sun et al., 2002).
Many ultrafine-grain aluminum alloys have been produced by ECA
pressing and attractive mechanical properties such as high strength and
superplasticity have been reported from ECAPed aluminum alloys (Wang and
Prangnell, 2002; M-Morris et al., 2003; May et al., 2005). Several recent steps
have been taken to evaluate the overall potential of the ECAP process. First, it
was shown that ECAP processing may be scaled up relatively easily to produce
large bulk materials having properties similar to those achieved in small-scale
laboratory investigations (Horita et al., 2001). Second, various procedures were
developed to simplify the procedure for imposing high total strains including the
use of a multi-pass pressing facility (Nakashima et al., 2000) and by adopting
alternative devices such as a rotary die (Ma et al., 2005). Third, there have
been recent attempts to incorporate the ECAP process into conventional cold
rolling for the continuous production of metal strip (Han et al., 2004). In general,
5
the major advantage of an ECAP process is that it is relatively cheap and is
arguably less complex than the other SPD processes.
In the present study, ECAP with different die angles was used to deform
the material and obtain ultrafine grained structure. The present work has many
objectives. The first is to advance our understanding of the deformation
mechanism in ECAP, and investigate the effect of some parameters that affecte
the microstructure evolution such as die angles and thermal annealing for the
Al-Si-Mg alloy. Second, to estimate the mechanical properties such as the
refinement of grains, microhardness and tensile strength of the Al alloy
subjected to significant grain refinement and strengthened through ECAP.
Third, to study the possibility to enhance the thermal conductivity and corrosion
resistance through consecutive passes of Al alloy during the ECAP die. The
characterization of ultrafine grain structure mainly relies on scanning electron
microscopy (SEM).
6
CHAPTER TWO
LITERATURE SURVEY
2.1 Aluminum and Aluminum Alloys
Aluminum is the second most plentiful metal on earth, but until the late
1800s, was expensive and difficult to produce because Al2O3 can not be
reduced by heating it with coke. Development of electrical power and the Hall
(in the USA)-Heroult (in France) process for electrolytically reducing Al2O3 to
liquid metal allowed aluminum to become one of the most widely used and
inexpensive materials.
2.1.1 Aluminum and Aluminum Alloys Properties
The development of applications for Al and Al alloys can be attributed to
several of their properties which include:
• Lightness: Aluminum is one of light metals. Its density is 2700 kg.m-3, or one
third the density of steel. The strength of some Al alloys comparable to that
of mild carbon steel can approach 700MPa. This indicates that the strength
of these alloys is higher by 30 times than that of pure aluminum. This
combination of high strength and lightness makes aluminum well suited to
transportation vehicles such as ships, aircraft, rockets, trucks, automobiles,
along with portable structures such as ladders, scaffolding, and gangways.
(Donald, 2001).
• Corrosion resistance: Aluminum has an excellent resistance to corrosion , it
reacts with oxygen very rapidly even at room temperature to produce a thin
7
but very dense film of oxide (Al2O3) which forms on the metal surface to
protect the underlying metal from many corrosive environments and quickly
reform when damaged.
• Thermal conductivity: An excellent thermal conductivity for aluminum makes
it very suitable for heating and cooling applications such as for the
manufacture of domestic cooking utensils, automobile radiators, refrigerator
evaporator coils and heat exchangers. (Higgins, 1997)
• High electrical conductivity: The electrical conductivity is around two third of
copper but its conducts twice electricity as an equal weight of copper,
therefore aluminum is an ideal for use in electrical transmission cables.
Aluminum bars and tubes are widely used in connecting stations for high
and medium voltage outdoor networks.
• Reflectivity: Aluminum is an excellent reflector of radiant energy such as
heat and lamp reflectors.
• High toughness at cryogenic temperature: At low temperature has a higher
strength and toughness, making it useful for cryogenic vessels.
• Nontoxic: Because aluminum and any corrosion product which are formed
are nontoxic, aluminum is used in the packaging of food and sweets,
cooking utensils and vessels in food processing.
• The ease of fabrication: Aluminum is easy to form and fabricate by various
processes such as extruding, bending, drawing forging casting, rolling and
machining.
• The ease of use: Specific tools not necessary to process aluminum alloys
and they lend themselves to joining techniques such as welding, bolting,
riveting, clinching, adhesive bonding, and brazing (Martin, 2004).
8
• The diversity of aluminum alloys: There are eight or nine series of aluminum
alloys which give a very wide range of compositions, properties and uses
(James, 2004).
• Recyclability: Aluminum made from recycled material requires only 5% of
the energy needed to produce aluminum from bauxite which contains
aluminum oxide. The recycling rate of end of life aluminum is roughly;
(Martin, 2004).
• 85% in the building industry and public amenities
• 80% in the transport sector,
• 70% in mechanical and electrical engineering, and
• 65% in house hold application.
2.1.2 Aluminum Series
Aluminum alloys are classified into two categories, wrought alloys, those
that are worked to shape, and cast alloys, those that are poured in a molten
state into a mold that determines their shape. The diversity of alloys and the
wide range of certain properties explain the growth in applications from
aeronautics to packaging. All aluminum products belong to one of eight alloy
series listed in appendix A (James, 2004 and Martin, 2004).
9
2.2 Severe Plastic Deformation (SPD) Techniques
It is well established that three axis forging, high pressure torsion
straining(HPT) and equal channel angular pressing (ECAP) are known methods
of providing large plastic deformation. However, the last two methods are the
most well known processes used to reduce the grains in polycrystalline
materials to submicrometer or nanometer level (Valiev et al., 1991). These
procedures are capable of producing large samples without the presence of
residual porosity for a wide range of industrial application. This advantage gives
these techniques super priority over other methods for preparing materials with
submicrostructure grain sizes. The deformation imposed during both processes
introduces a high dislocation density into the deformed workpieces and this
leads to arrays of grains which are highly deformed and having grain
boundaries which tend to be poorly defined and tend to be curved or wavy
(Valiev et al., 1993 and Wang et al., 1993).
2.2.1 Multiple Forging (MF)
This method is one of the nanostructure creation methods in rather brittle
materials because processing starts at elevated temperatures and specific
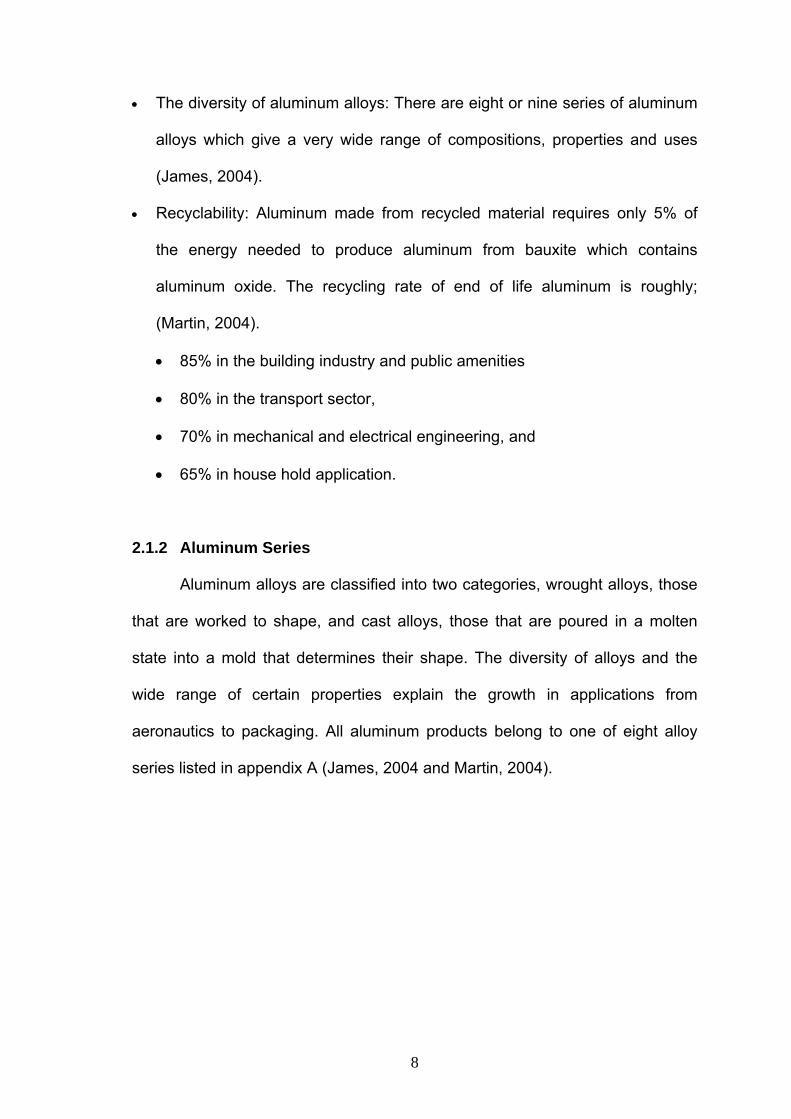
loads on tooling are low. The principle of this method is shown in Figure 2.1. It
assumes multiple repeats of free forging operations, setting drawing with a
change of the axis of the applied strain load. The efficiency of this technique to
provide homogeneous strain is less than that of the torsion straining and ECAP.
Multiple forging was used for microstructural refinement in many materials and
alloys, such as pure Ti, Ti alloys, Ni alloys (Salishchev et al., 1994), and others.
10
Fig. 2.1: Principle of multiple forging: setting and pull broaching along the first axis (a), (b), (c); setting and pull broaching along the second axis (d), (e), (f); setting and pull broaching along the third axis (g), (h), (i) (Valiev et al., 2000).
2.2.2 High Pressure Torsion (HPT)
The high pressure torsion process is capable of forming uniform
nanostructures having smaller grain sizes than other severe plastic deformation
methods; also it is able to introduce continuously variable magnitudes of
deformation, thus the microstructure evolution studies are attainable. An
important change in the microstructure is noticed after deformation by half
rotation, but to obtain homogenous nanostructure several rotations are required
(Valiev, 1997). HPT has two advantages: (i) it is capable to produce small grain
sizes, often in the nanometer range ~100nm (ii) providing a capability for
processing brittle materials such as intermetallic and semiconductors
11
(Languillaume et al., 1993 and Islamgaliev et al., 1994) and the disadvantage of
HPT is that the workpieces fabricated by this technique are usually of a disk
shape not exceeding 20 mm in diameter and 1 mm in thickness (Lowe and
Valiev, 2000). Also, the precise deformation conditions and constraints during
HPT may vary since they depend on friction between the rotating anvil and the
workpiece.
Submicrocrystalline and nanocrystalline structures may be obtained by
torsion using the Bridgman technique (Bridgman, 1952) where the deformation
occurs by torsion of the workpiece under high pressure. In this process the
workpiece is subjected to large plastic deformation by torsion where the
workpiece is held between anvils and strained in torsion under applied pressure
of several GPa as shown in Figure 2.2. A lower holder rotates and surface
friction forces deform the workpiece by shear. After several rotations the
deformation by the given mode often results in similar refinement of a
microstructure in the center of the workpieces as well the processed
nanostructure is usually homogeneous at the radius of samples. This
homogeneity has been confirmed by the uniform distribution of microhardness
values across the test workpieces section. The strain imposed in the workpiece
is given by: (Valiev, 1997)
lRNπγ 2
= ..……………………………………………………………………… 2.1
Where, N is the number of rotations, R is the distance from the axis of the disk
and l is the thickness of the workpiece. Two points can be concluded from the
above formula; (i) the strain value should change linearly from zero in the center
of the workpiece to the maximum value at the end of its diameter; (ii) during
deformation the initial thickness of the workpiece is reduced by approximately
12
50% under high compression pressure. Two forms of torsional deformation of
thin disks have been described. The first, due to Bridgman, comprises
simultaneous compression and torsion of a disk which is not constrained
laterally, therefore; its diameter is free to expand beyond that of the tooling
anvils (Bridgman, 1935). The second one is a comprise compression /torsional
deformation of a disk situated between a tight fitting cylindrical plunger and die,
a geometry which prevents lateral expansion of the workpiece (Valiev et al.,
1997a). The torsional technique is used with more or less success in the
laboratory since it does not fully meet the requirements of commercial
technologies. Therefore; Bridgman’s technique is applicable for obtaining
nanocrystalline structure in thin foil form workpieces.
Fig. 2.2: Principle of torsion under high pressure.
13
2.2.3 Equal Channel Angular Pressing (ECAP)
Equal channel angular pressing is one of the most promising processes
that can produce ultrafine grained materials through the process of simple shear
by pressing a workpiece through a die with two intersecting channels, equal in
cross section as shown in Figure 2.3 (Iwahashi et al., 1996). Various techniques
are used to analyze the microstructure development of Al alloys, for example,
(Iwahashi et al., 1997) used transmission electron microscopy (TEM) with
selected area electron diffraction (SAED) to observe the microstructure of Al
material. While (Gholinia et al., 2000) used high resolution electron
backscattered diffraction to quantitatively measure the misorientation of
boundary. Many researchers used Scanning electron microscopy (SEM) for
testing the shape and size of the grains.
Fig. 2.3: Angles for equal channel angular pressing and ECAPed workpiece.
14
ECAP has many advantages comparing with other severe plastic
deformation processes;
• ECAP may be used to attain a microstructure where it is possible to achieve
superplastic forming at very high strain rates.
• ECAP is being applicable producing a deformation with no change in the
cross sectional dimensions of the workpiece on passage through the die.
• ECAP may be readily scaled up for the production of relatively large bulk
workpieces that may be suitable for use in industrial applications.
• There have been new developments in utilizing the ECAP method including
using a rotary die or multipass facility in order to achieve high strains without
removing the workpiece from the ECAP die.
• Deformation in ECAP occurs at the shear plane, which is lying at the
intersection of the two channels. Therefore; the deformation in the ECAP
processed workpiece is very localized and homogenous in the localized
deformation zone.
• ECAP has been combined with other metal working process to provide a
more versatile procedure.
2.3 Principle of ECAP
The principle of ECAP is shown schematically in Figure 2.4, where two
equal cross section channels intersected at two angles, Φ is the internal angle
between the two intersecting channels and Ψ is the angle defining the outer arc
of curvature at the point of intersection of the two channels. Figures 2.4(a) and
(b) correspond to the limiting conditions of Ψ =0 and Ψ = −π Φ , respectively,
15
and Figure 2.4(c) corresponds to an intermediate situation where Ψ lies at an
arbitrary angle between Ψ =0 and Ψ = −π Φ .
In Figure 2.4(a) where Ψ =0, a small element in the workpiece, initially square in
cross section with dimensions given by abcd, becomes deformed by shear on
passage through the die into the configuration given by dcba ′′′′ ,,, . Using the
notation in Figure 2.4(a), it is follows that the shear strain,γ is given by:
qa′ / dq ′ , where
dq ′=ad, and ba ′= cd ′ = pa′ = pq = ad cot (Φ /2)
so that,
qa′ =2ad cot (Φ /2).
Therefore, for the condition where Ψ =0,
γ =2cot (Φ /2) ………………………. ………………………………… 2.2
In Figure 2.1(b) where Ψ = −π Φ , the shear strain is given by
γ = r c′ / br ′ , where
br ′ = da = (oa-od) and
ba ′= cd ′ =oaΨ =(r c′+odΨ ) so that,
r c′= (oa-od)Ψ .
Therefore, for this condition,
γ =Ψ …………………………………………………………………… 2.3
In Figure 2.4(c) where Ψ represents an intermediate situation, the shear strain
is:
γ = ua′ / ud ′ where
ud ′ =ad and ua′ may be obtained from the relationships
ua′ = ( ta′ + tu) = (r c′+as),
16
as = ad cot ⎟⎠⎞
⎜⎝⎛ Ψ
+Φ
22,
ba ′= cd ′ = (as+osΨ ) = r c′ +odΨ , then
r c′= (os-od) Ψ +as ,
∴ =′ua (os-od) Ψ +2as,
Q(os-od) = ad cosec ⎟⎠⎞
⎜⎝⎛ Ψ
+Φ
22, so that
=′ua 2ad cot ⎟⎠⎞
⎜⎝⎛ Ψ
+Φ
22+ adΨ cosec ⎟
⎠⎞
⎜⎝⎛ Ψ
+Φ
22.
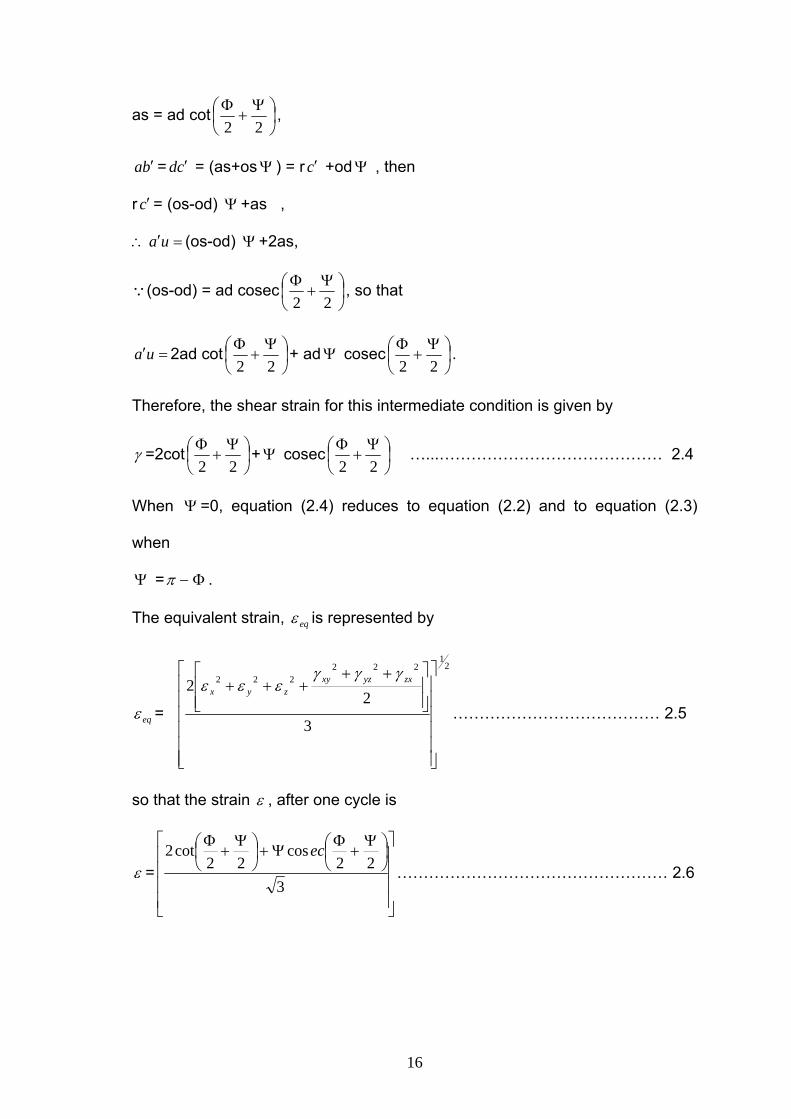
Therefore, the shear strain for this intermediate condition is given by
γ =2cot ⎟⎠⎞
⎜⎝⎛ Ψ
+Φ
22+Ψ cosec ⎟
⎠⎞
⎜⎝⎛ Ψ
+Φ
22 …...…………………………………… 2.4
When Ψ =0, equation (2.4) reduces to equation (2.2) and to equation (2.3)
when
Ψ = −π Φ .
The equivalent strain, eqε is represented by
eqε =
21
222222
3
22
⎥⎥⎥⎥⎥⎥
⎦
⎤
⎢⎢⎢⎢⎢⎢
⎣
⎡
⎥⎥⎦
⎤
⎢⎢⎣
⎡ +++++ zxyzxy
zyx
γγγεεε
………………………………… 2.5
so that the strain ε , after one cycle is
ε =
⎥⎥⎥⎥
⎦
⎤
⎢⎢⎢⎢
⎣
⎡⎟⎠⎞
⎜⎝⎛ Ψ
+Φ
Ψ+⎟⎠⎞
⎜⎝⎛ Ψ
+Φ
322
cos22
cot2 ec…………………………………………… 2.6
17
Since in each passage through the die the same strain is accumulated, the
following equation represent a more general relationship allowing one to
calculate the strain value of the workpiece during ECAP for N passes.
ε N= N
⎥⎥⎥⎥
⎦
⎤
⎢⎢⎢⎢
⎣
⎡⎟⎠⎞
⎜⎝⎛ Ψ
+Φ
Ψ+⎟⎠⎞
⎜⎝⎛ Ψ
+Φ
322
cos22
cot2 ec ……………………………………. 2.7
During ECAP the direction and the number of workpiece passes through die are
very important for microstructure refinement.
Fig. 2.4: Principles of ECA pressing: (a) Ψ = 00, (b)) Ψ = −π Φ , (c) Ψ is between Ψ = 00 and Ψ = −π Φ (Iwahashi et al., 1996).
18
2.4 Estimations of the Strain in ECAP
The strain imposed on the workpiece in ECAP depends upon the two
angles defined in Figure 2.4, Φ andΨ . Segal (1995) showed that the strain
accumulated after N cycles through the die is given by:
2cot
32 Φ
=N
Nε …..………………………………………………………… 2.8
The above equation was also derived by (Utyashev et al., 1996).
Iwahashi et al., (1996) obtained equation 2.7 which including the influence of
the geometric process parameters of the die such asΦ and Ψ angles.
It is apparent that equation 2.7 reduces to equation 2.8 when 0=Ψ 0. According
to equation 2.7, the magnitude of the equivalent strain depends upon the values
of Φ and Ψ angles, where it decreases with increasing of both angles. The
equivalent strain during ECAP can decrease from the maximum of 1.15 at
minimum value of Ψ =00 to the minimum of 0.907 at the maximum value of
Ψ =900, when channel angle is fixed as Φ =900. The channel angleΦ has more
influence on the strain generated during ECAP than the die corner angle
Ψ (Prangnell et al., 1997); (Delo and Semiatin, 1999); (Semiatin et al., 2000).
Wu and Baker (1997) reported good agreement with equation 2.7 in model
experiments where workpieces were extruded through Plexiglas die.
Measurements of the shear strain from single and multipass extrusions showed
that the center of the workpieces (away from the die wall) did indeed undergo
deformations which were well predicted by equation 2.7. However, the
workpiece regions near the die wall underwent substantially lower strains due to
sticking friction. In order to avoid a reduction in the cross-sectional dimensions
of the workpiece as it passes through the die, there is a maximum value of the

19
arc angle, Ψ max, given by ( Φ−π ) (Iwahashi et al., 1996). At the maximum
value, Ψ max,
( )33maxΨ
=Φ−
=NN
Nπε ……………………………………………….. 2.9
2.5 Microstructure Evolution
The microstructure develops as a natural consequence of the evolution
of the deformed state, therefore; the meaning of submicron or nanocrystalline
grain structure is not immediately apparent after using severe plastic
deformation processing. A severely deformed alloy with an average grain size
less than1 μ m may still contain many low angle grain boundaries and the
grains can be highly elongated in the deformation direction (Bowen et al.,
2000a).The definition proposed here is; the average grain size of high angle
grain boundaries (boundaries misorientated by > 150) must be less than 1μ m,
or 100 nm in all orientations and, the proportion of high angle grain boundary
(HAGB) area must be > 70% relative to the total boundary area in the material.
This proportion of HAGB is required to produce a stable grain structure and is
suggested on the basis that it has been shown, experimentally (Gholinia et al.,
2000) and theoretically (Humphreys et al., 1999).
20
2.5.1 Mechanism of Microstructural Evolution during ECAP
2.5.1(a) Grains Subdivision
A very numerous increase in the HAGB area within a material is required to
form a submicron grain structure. During ECAP at low temperature less than 0.5
Tm, where Tm is a material melting temperature, new HAGB area can be created
by two main mechanisms that operate simultaneously; (i) the extension of pre
existing boundaries in proportion to the applied strain (Gill Sevillano et al., 1980)
and (ii) the generation of new HAGBs formed by grains subdividing (Hughes
and Hansen, 1997). The general principals of new HAGBs formed by grain
subdivision using route BC are summarized bellow:
• The first pass through the die divides the large grains into arrays of
subgrains that are well delineated; these subgrains are elongated and lie
in bands structure. The selected area electron diffraction (SAED)
patterns consist of discrete diffraction spots showing that the grain
boundaries have low angles of misorientation.
• A second pass through the die, following a rotation by 900 in the same
sense between passes, leads to microstructure, where the subgrain
structure has broken into an array of ultrafine grains .This breaking up of
the subgrain bands is due primarily to the development of a second set
of bands. SAED shows some spreading of the diffraction spots, so that
the misorientations across the boundaries between neighboring grains
have increased with increasing strain.
21
• After three passes, there is no longer any evidence for the initial
formation of the subgrain bands, the microstructure consists of an
essentially equiaxed array of grains. The SAED patterns exhibit diffracted
beams scattered around rings, this indicating that some of the grain
boundaries have high angles of misorientation.
• After the forth passes, there is now an equiaxed array of grains on each
of the three orthogonal planes of sectioning. There is no evidence for the
earlier formation of subgrain bands, and the SAED patterns consist of
rings of diffraction spots showing that the grain boundaries have high
angle of misorientation on each plane of sectioning. (Nakashima et al.,
1998; Iwahashi et al., 1997; Iwahashi et al., 1998c).
Segal, (1999) explained the effectiveness of producing an ultrafine grained
structure by the intersection of shear bands. Two conditions to optimize the
ECAP were improvement; (i) ECAP should provide uniform and intensive simple
shear at each pass and (ii) develop of high angle grain boundaries during
multipass processing. Condition (i) is performed using a die with Φ =900 and
Ψ =00 under frictionless condition. During the first pass, coarse grains are
subdivided by shear bands with a large portion of high angle grain boundaries.
During the following passes new groups of shear bands are induced while the
first pass groups remain stable and change their orientations thus defining
various networks of high angle boundaries for different routes.
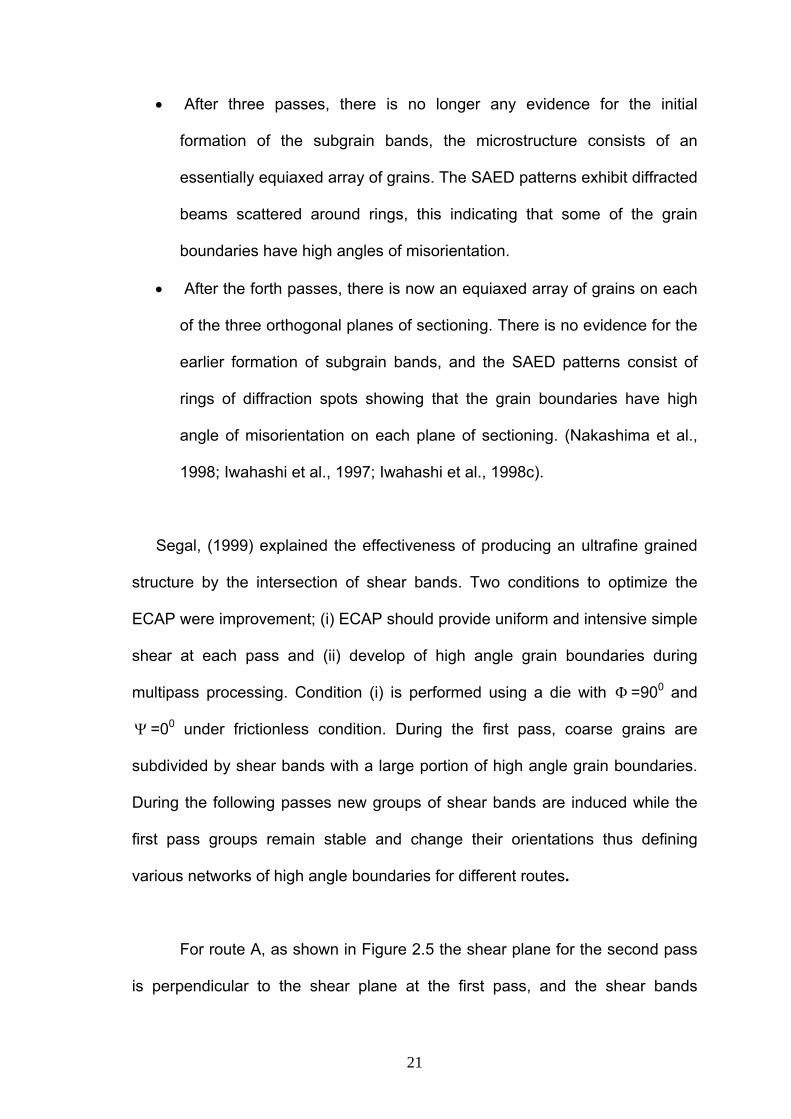
For route A, as shown in Figure 2.5 the shear plane for the second pass
is perpendicular to the shear plane at the first pass, and the shear bands
22
formed in the second pass intersects the workpiece axis at an angle of 450,
while the shear bands created in the first pass changes orientation on angle of
about 200 to the workpiece axis. Intersection of the first pass shear bands with
the following passes groups subdivide the structure for subgrains elongated
along the flow direction.
With route C, the shear plane is retained at any pass. Beyond the first pass the
shear bands boundaries are saturated by dislocations. During the following
passes, for further strain accommodation, another mechanism including
subdivision of shear bands for equiform subgrains and their progressive rotation
(Nesterenko et al., 1997).
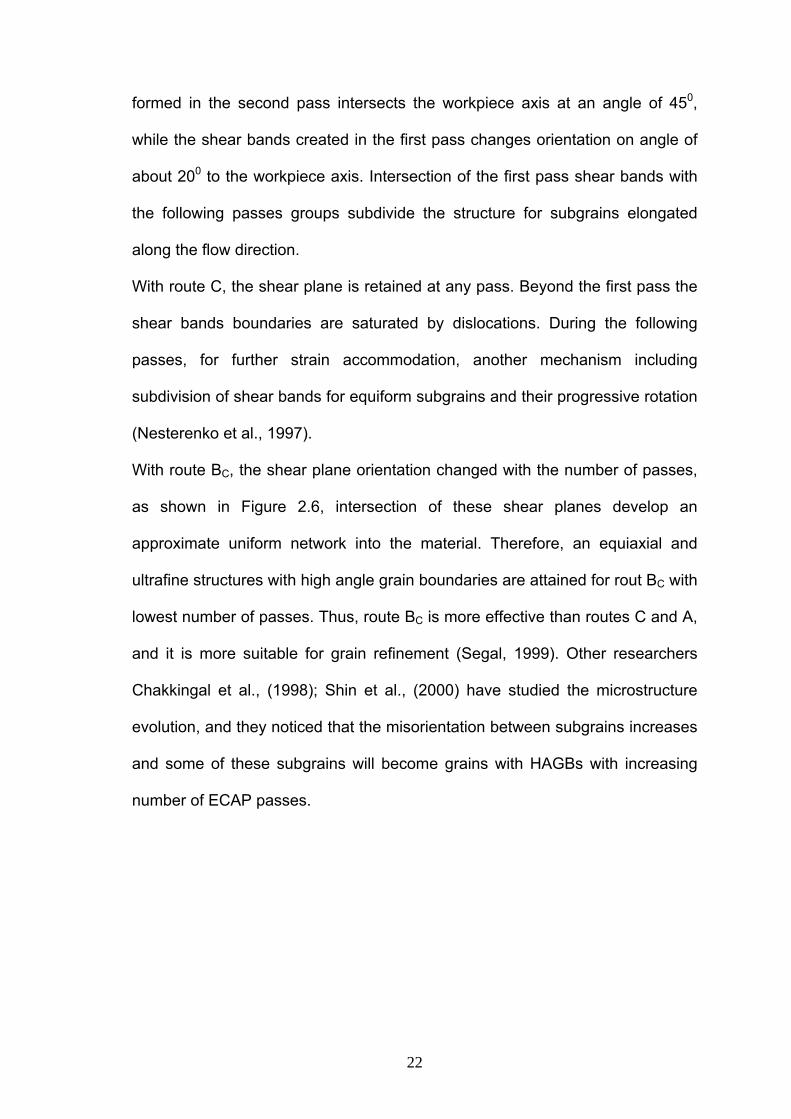
With route BC, the shear plane orientation changed with the number of passes,
as shown in Figure 2.6, intersection of these shear planes develop an
approximate uniform network into the material. Therefore, an equiaxial and
ultrafine structures with high angle grain boundaries are attained for rout BC with
lowest number of passes. Thus, route BC is more effective than routes C and A,
and it is more suitable for grain refinement (Segal, 1999). Other researchers
Chakkingal et al., (1998); Shin et al., (2000) have studied the microstructure
evolution, and they noticed that the misorientation between subgrains increases
and some of these subgrains will become grains with HAGBs with increasing
number of ECAP passes.
23
Fig. 2.5 Route A: billet orientations; (Segal, 1999).
Fig. 2.6 Shear plane orientation after four passes, Φ =900 route BC (Segal, 1999). .

24
According to Iwahashi et al. (1998a) investigation, in route BC with a 900
die angle, the shearing planes intersect at 1200. As a result of this duality in
shearing directions, subgrain bands are developed on repetitive pressing along
two separate and intersecting sets of planes, and this leads to a reasonably
equiaxed array of high angle grain boundaries HAGBs. In route A, the shear
planes intersect at an angle of 900 and route C keep the same orientation.
Therefore it was inferred that route BC is the preferable procedure for use in
ECAP experiments. Iwahashi et al. (1997) established that the effectiveness of
producing fine grained structure is in the order of C>A, because route C permits
the shear to build continuously on a single set of planes, whereas in route A the
extent of shearing is divided equally between two sets of orthogonal planes.
Prangnell et al. (2000) deformed an Al–3% Mg–0.2% Zr–0.2% Fe alloy
using a die with Φ angle 1200 with all four ECAP routes. They found that route
A is the most effective route in producing grain refinement and HAGBs,
because it does not produce redundant strain. In route BC, the next odd pass
reverse the strain from the previous odd pass and the next even pass reverse
the strain from the previous even pass, therefore route BC is less effective than
route A in refining the grain size. While in route C the shear strain from the even
pass reverse the strain from the previous odd pass, therefore creating
redundant strain making it least effective in refining grains. Oh-Ishi et al. (1998)
processed pure Al using a die with Φ =900 and they found that BC>BA.
Furukawa et al. (1998) explain these experimental observations through
studying the deformation of cubic workpieces processed with each ECAP
routes. They inferred that the effectiveness of the routes is BC>C>A≈ BA


![Microstructural Development of Fe-20mass%Cr Alloys and ...Microstructural Development of Fe-20mass%Cr Alloys and Pure Copper Processed by Equal-Channel Angular Pressing 251 [16-32],](https://img.pdfslide.net/doc/110x75/60af9a0c2a519a756d0b9648/microstructural-development-of-fe-20masscr-alloys-and-microstructural-development.jpg)