Embed Size (px)
Citation preview
The influence of Fama-French factors in equity and bond markets on
corporate bond spread
SU-SHENG WANG1, JIE-MIN HUANG
1, XI YANG
1, JIE-YONG HUANG
3
1Shenzhen Graduate School
Harbin Institute of Technology
Shenzhen University Town in Shenzhen City
People’s Republic of China, 086-518055 3Kaifeng city, Henan Province
[email protected]; [email protected];
[email protected]; [email protected]
Abstract: - We choose corporate weekly transaction data from the end of 2011 to the end of 2012 in Shenzhen
Exchange and Shanghai Exchange, and analyze the determinant factors of corporate bond spread, mainly
including company size factors in equity market and bond market, book to market ratio factors in equity market
and bond market, default risk, term factor and credit rating factors. We find that small companies tend to issue
bonds with high yield spreads, but big companies will issue low yield spread bonds. The companies with high
book to market ratios will have high yield spread bond, while low book to market ratio corporates will have low
yield spread bond. Default risk and term factor are important part in corporate bond spread. Also, the credit
ratings are significant in the model. We suggest the China Securities Regulatory Commission encourage small
companies to issue bonds and increase the low credit rating bonds.
Key-Words: -Bond spread company size equity market book to market ratio default risk credit rating
1 Introduction
To find the factors which influence corporate bond
spreads, many scholars research on the influence of
equity market factors on corporate bond spreads.
The findings are below. Fama(1993) identifies five
common risk factors in the returns on stocks and
bonds [1]. There are three equity market factors: the
whole market factor, company size factor and the
book-to-market ratio of equity, and two bond market
factors: maturity and default risk. Equity market
factors influence equity returns. Bond market factor
is included in bond returns except the low rating
bonds. The five factors explain bond returns.
King(2005) tests the importance of equity market
systemic factors on explaining corporate bond yield
spread variation. The data is 1771 corporate bonds
from January 1985 to March 1998, and he finds
once control variables correlate with default, the
explaining power of bond β or equity market risk
sensibility is limited. Also, he finds system factor The authors are grateful for research support from the
National Natural Science Foundation of China
(71103050); Research Planning Foundation on
Humanities and Social Sciences of the Ministry of
Education (11YJA790152) ; Planning Foundation on
Philosophy and Social Sciences in Shenzhen City
(125A002).
express limited explaining power, and it indicates
they don’t make full use of the unclaimed method
[2].
This is related with former study, namely once
bring in market friction, the bond β is correlated. In
all, the study indicates the empirical results support
the hypothesis, namely the structural model contains
determinant factors of bond yield spread and equity
market system factor. Bao(2008) tests Merton
model of corporate bond, equity and treasury on
random interest rate. Focus on the bond volatility,
equity volatility of the same company and treasury
volatility. Using corporate bond cross-section daily,
weekly and monthly returns from 2002 to 2006 do
empirical bond volatility study. On the contrast of
volatility in the model and empirical volatility, he
finds a large part of volatility can’t be explained by
default based model. The daily and weekly extra
volatility are larger, and it shows that short term
liquidity in corporate bond takes larger ratio. The
monthly extra volatility turns small but it still keeps
significant. Further, he finds liquidity is important
on explaining cross-sectional volatility, and this
affords further evidence for corporate bond liquidity,
and he finds the extra volatility which causes
residuals is an important part of system risk [3].
Avramov(2007) explains corporate credit risk
variation using structural model. He finds common
WSEAS TRANSACTIONS on BUSINESS and ECONOMICSSu-Sheng Wang, Jie-Min Huang, Xi Yang, Jie-Yong Huang
E-ISSN: 2224-2899 209 Issue 3, Volume 10, July 2013
factors and corporate basic factors could explain
54% credit spread variation in secondary bonds.
There aren’t significant potential factors in
unexplained variation, and the factors he finds
include most part of system variation of credit
spread [4]. Schaefer(2008) finds credit risk
structural model has poor forecast on bond price.
Although, he testifies the model is quite precise on
forecasting the sensitivity of corporate bond returns
on equity value variation [5]. The main conclusion
is although the simplest structural model could
produce irrecusable hedge ratio in time series tests.
However, he finds corporate bond rate sensitivity
isn’t included in Merton model. Also, the paper tests
corporate bond price is correlated with market
factors, such as SMB in FF, and this can’t be
forecast in structural model.
Some scholars study the impact of default on
corporate bond spread. Gemmill(2011) using panel
data finds large part of corporate bond spread is
caused by default loss, although he takes downsize
risk into the model, but system factor contributes
little [6]. He finds corporate bond spreads strongly
correlate with idiosyncratic risk: bond spread not
only correlates with equity idiosyncratic risk, but
also correlates with bond idiosyncratic risk and
bond idiosyncratic risk value. Bond idiosyncratic
risk could explain spread for the reason that it not
only represents corporate value, but also represents
liquidity. When bond idiosyncratic risk increases,
bond spread increases, because bond idiosyncratic
risk value includes corporate value left skewness
distribution factors.
Huang(2002) using structural model with default
factor investigates the credit risk ratio in corporate
bond spread, and he finds in short term bonds credit
spread takes small ratio, but big ratio in junk bonds
[7]. Gebhardt(2005) finds after controlling duration,
credit ratings and expiration date, bond cross-
section returns strongly relates with default
probability, and after controlling default risk and
term factors, only maturity correlates with bond
returns [8]. The important finding is system risk
strongly relates with corporate bond. Dionne(2010)
considers default risk causes corporate bond spread,
and it’s an important problem in credit risk
literatures [9]. He uses history default data to
calculate default probability. He finds default risk in
corporate bond returns is sensitive to former default
probability term structure. Giesecke(2011) using
data from 1866 to 2008 investigates corporate bond
default probability. He finds corporate bond market
faces more harm in repeated default events than in
the Great Depression. For example, in 1873-1875
railway crisis the overall defaults occupy 36% of the
corporate bond market. Using regime switching
model, he tests the probability of forecasting default
probability by economic variables [10]. He finds
equity returns, equity volatility and GDP variation
are the strong anticipators. However, credit spread
isn’t the anticipator. In the long term, credit spread
is twice of default loss, and it causes about 80 basis
point credit risk premium. He also finds credit
spread isn’t corresponding to the real default
probability. Longstaff(2005)using credit default
swap measures the magnitude of default factors and
other factors in corporate bond spread. He finds
most of the corporate bond spread is caused by
default risk. The results are significant to any credit
rating bond and risk-free yield curve. He also finds
that default part changes with time, and strongly
correlates with individual bond illiquidity factor and
macro-economic factors which measures bond
market liquidity [11]. Neri(2012) shows how L-
FABS can be applied in a partial knowledge
learning scenario or a full knowledge learning
scenario to approximate financial time series [12].
Chen(2009) predicts Taiwan 10-year government
bond yield [13]. Skander(2005) add a useful tool to
the systems modeling language[14]. Abdelaziz(2006)
proposes a new approach for the diagnosis of the
HDS based on the HPN model [15].
The foreign literatures focus on studying
corporate bond spread by investigating FF factors in
equity market, the default risk and credit risk. In
China, Chang Kai (2012) develops a general model
of the futures options valuation under the term
structure of stochastic multi factors [16]. Huang
Jiemin(2013) makes review on foreign study of
corporate bond spread [17]. Wang Susheng(2012)
investigates the differences between industrial pairs
trading in different classification levels [18]. Shi
Yuyou(2008) using 10 stocks in Shanghai Stock
Exchange analyzes the correlation among equity
debt-equity ratio, book to market ratio, company
size and equity investment risk [19]. He uses
clustering methodology to analyze and finds equity
investment risk is not only determined by β, also by
company size and other factors. Tu Xinshu(2008)
using FF three factors tests fund performance
evaluation, and finds FF three factors are significant,
and the model shows fund has extra returns [20].
There are few literatures using FF three factors
model with bond returns analyze the factors which
influences corporate bond spreads. In the paper,
using four FF factors in equity returns and bond
returns such as SMB and HML we investigate
corporate bond spread. Also, we add in default risk
factor, term factor into the model, meanwhile we
add in three credit ratings as dummy variables.
WSEAS TRANSACTIONS on BUSINESS and ECONOMICSSu-Sheng Wang, Jie-Min Huang, Xi Yang, Jie-Yong Huang
E-ISSN: 2224-2899 210 Issue 3, Volume 10, July 2013
2 Data and variables description 2.1 Data description AS Shanghai Stock Exchange has bond transaction
data since 2007, and Shenzhen Stock Exchange has
bond transaction data since 2008. In order to get
continuous data, we choose nearly 50 corporate
bonds weekly transaction data from December 2011
to December 2012. We get the data from Wind
database, and the bonds have simple interest, fixed
rate. According to Duffee(1998), we divide the
bonds into three categories, including short term
bonds with 2 to 7 years maturity [21]; median bonds
with 7 to 10 years maturity; long term bonds with
maturity more than 10 years. In the paper, most of
the bonds are short term and median term bonds,
also some are long term bonds. And the bonds can
be divided into AAA, AA+ and AA three ratings.
The sample contains Manufacturing industry, Power
industry, Building industry, Mining and Quarrying
industry, Transportation industry, Real Estate and
Service industry bonds. The sample covers almost
all the industries.
2.2 Variables description (1) Corporate bond spread series: we choose
corporate bonds and treasury bonds with similar
maturity, and bond spreads are estimated by the
difference of the two bond returns. We choose the
difference of returns between treasury bonds and
corporate bonds with similar value date and delivery
date. Here spread denotes corporate bond spreads.
(2) HMLe ,SMBe , we use HMLe to represent FF
three factors model in equity market, and HMLe
means Book to Market ratio factor in equity market,
from which the company size factor is excluded.
SMBe means company size factor in equity market,
from which the Book to Market ratio factor is
excluded. The factors are calculated as below:
We use SIZE to represent company size. From
July year t to June year t+1, the size value of stock i
is market value in June year t. So from January 1st
2012 to June 30th 2012, the weekly size value is the
circulation market value in June 30th 2011. From
July 1st 2012 to June 30th 2012, the size value of
stock i is the circulation market value in June 30th
2012.
From July year t to June year t+1, the weekly
BE/ME of Stock i equals equity interest divides
circulation market value in the end of year t-1. So
the weekly B/M of stock i from January 1st 2012 to
June 30th 2012 equals the equity interest divides
circulation market value in December 31st 2010.
The weekly B/M of stock i from July 1st 2012 to
December 31st 2012 equals the equity interest
divides circulation market value in December 31st
2011.
Then, companies are ordered by the size value,
and the top half is small companies, the bottom half
is big companies. We put the B/M value in low to
high order, and the top 30% is low B/M companies,
the bottom 30% is high B/M companies, and the
middle 40% is median B/M companies.
And then according to the value, we divide the
companies into S/L, S/M, S/H, B/L, B/M and B/H
companies, and there are six groups. The S/L group
means the company belongs to small company and
also belongs to low B/M company, and S/H means
the company belongs to small company and also
belongs to high B/M company, also the left four
groups is similar with them. Then we get the weekly
average returns of the six group stocks, and
according to the formulas below, we get the
variables SMBe and HMLe.
SMB=(S/L+S/M+S/H)/3-(B/L+B/M+B/H)/3 (1)
HML=( S/H+B/H)/2-(S/L+ B/L)/2 (2)
(3) HMLb, SMBb, we use HMLb to represent FF
three factors model in bond market, and HMLb
means Book to Market ratio factor which excludes
company size factor in bond market. SMBb means
company size factor which excludes Book to Market
ratio factor in bond market. The method to calculate
HMLb and SMBb is similar with HMLe and SMBe,
so we would not repeat it any more.
(4) DEF as default factor. DEF equals long term
investment grade bond returns minus long term
government treasury returns. We choose Chinese
railway company bond with 15 years maturity and
treasury with 50 years maturity.
(5) TERM as term factor. It equals long term
treasury returns minus one month treasury rates.
Because there isn’t one month treasury rate in China,
so we choose long term treasury with 50 years
maturity and one year deposit rates.
(6) Dummy variables. The sample can be divided
into three credit ratings, as AAA, AA+ and AA. We
take the bond ratings as three dummy variables.
3 Basic hypotheses Hypothesis1: SMBe correlates with corporate bond
spread positively.
SMBe is the company size factor which has
excluded BE/ME factor. It means the small
corporate stock returns minus big corporate stock
returns. Small corporate has higher returns than big
corporate, for the reason that small company will
face higher default risk than big one, so the credit
risk is large and investors ask more risk premium.
WSEAS TRANSACTIONS on BUSINESS and ECONOMICSSu-Sheng Wang, Jie-Min Huang, Xi Yang, Jie-Yong Huang
E-ISSN: 2224-2899 211 Issue 3, Volume 10, July 2013

Hypothesis 2: HMLe correlates with corporate
bond spread positively.
The size factor is excluded from HMLe. HMLe
means high B/M corporate stock returns minus low
B/M corporate stock returns. The growing company
with high B/M has high stock returns than grown
companies with low B/M. The growing company
with high B/M develops rapidly, but immaturely,
and it faces large risk, so it has high bond returns.
The grown company with low B/M develops
steadily and maturely, and it faces little risk, so it
has low bond returns.
Hypothesis 3: SMBb correlates with corporate
bond spread positively.
SMBb is the company size factor, from which the
BE/ME factor has been excluded. It means the small
corporate bond returns minus big corporate bond
returns. Small corporate has higher returns than big
corporate, for the reason that small company will
face higher default risk than big one, so the credit
risk is large and investors ask more risk premium.
Hypothesis 4: HMLb correlates with corporate
bond spread positively.
The size factor is excluded from HMLb. HMLb
means the high B/M corporate bond returns minus
low B/M corporate bond returns. The growing
company with high B/M has high bond returns than
grown companies with low B/M. The growing
company with high B/M develops rapidly, but
immaturely, and it faces large risk, so it has high
bond returns. The grown company with low B/M
develops steadily and maturely, and it faces little
risk, so it has low bond returns.
Hypothesis 5: DEF correlates with corporate
bond spread positively.
When default risk becomes larger, the bond
returns will be higher, because investors ask for
higher premium when risk increases. In foreign
countries as America or Europe, there are almost all
kinds of bonds, and default factor is very important
in bond spread. On contrast, In China, we have
many high credit rating bonds, few low credit rating
bonds. Until recently, only one corporate default,
but the guarantee company will pay the capital. In
China, there are few literatures on bond default.
Hypothesis 6: TERM correlates with corporate
bond spread positively.
The bonds with longer bond maturity will face
larger risk, and investors ask for higher risk
premium. The bonds with shorter bond maturity will
face less risk. So the long term bonds have high
yields but short term bonds have low yields.
Hypothesis 7: Bond ratings correlate with
corporate bond spread.
The bonds with higher ratings will have lower
credit risk and they have lower credit spread, but
bonds with lower ratings will have higher credit risk
and they have higher credit spread. In China, there
are many bonds with credit rating A, a few bonds
with credit rating B, but few bonds with credit
ratings C.
4 Empirical analysis 4.1 Descriptive statistics Table1 indicates descriptive statistics of corporate
bond spread, SMBe, HMLe, SMBb, HMLb, DEF and
TERM. Table 1 Panel data descriptive statistics
variables mean std min max
SPREAD 2.5377 1.2244 -7.0406 7.2756
SMBe 0.7316 0.3979 -0.3272 1.4990
HMLe -1.0592 0.2142 -1.3418 -0.2896
SMBb 0.1037 1.3899 -2.5720 3.6659
HMLb 0.3067 2.3865 -4.3355 7.2568
DEF -0.0019 0.0280 -0.0514 0.0500
TERM 1.0037 0.0557 0.8997 1.1023
4.2 Series correlation test and stationary test
4.2.1 Correlation coefficient matrix From table 2 we can see spread correlates with
SMBe positively, and the coefficient is 0.3608;
HMLe correlates with spread negatively, and the
coefficient is -0.1235; SMBe and HMLe has strong
negative relation, and the coefficient is -0.4415;
SMBb correlates with HMLb, DEF, TERM, and the
coefficients are -0.2034, -0.2406, 0.2383; DEF
correlates with TERM strongly, and the coefficient
is -0.9994.
Table 2 correlation coefficient matrix
SPREAD SMBe HMLe SMBb HMLb
SPREAD 1.0000 SMBe 0.3608 1.0000 HMLe -0.1235 -0.4415 1.0000 SMBb 0.0311 -0.0147 0.1268 1.0000 HMLb -0.0279 -0.0904 -0.0483 -0.2034 1.0000
DEF -0.0136 -0.0426 -0.1026 -0.2406 -0.0981
TERM 0.0144 0.0417 0.1117 0.2383 0.1095
DEF TERM
DEF 1.0000 TERM -0.9994 1.0000
WSEAS TRANSACTIONS on BUSINESS and ECONOMICSSu-Sheng Wang, Jie-Min Huang, Xi Yang, Jie-Yong Huang
E-ISSN: 2224-2899 212 Issue 3, Volume 10, July 2013

4.2.2 Stationary test In Graph1, the horizontal axis indicates 51 weeks,
and the vertical axis indicates the values of SMBe.
We can see the series has time trend.
-0.4
0.0
0.4
0.8
1.2
1.6
5 10 15 20 25 30 35 40 45 50
SMBE_CD SMBE_ZJ SMBE_CK SMBE_WYSMBE_JC SMBE_SD SMBE_ZJZ SMBE_LYSMBE_BB SMBE_CG SMBE_YG SMBE_SGSMBE_NG SMBE_YW SMBE_SL SMBE_KEBSMBE_DYG SMBE_KM SMBE_FZ SMBE_TWSMBE_ZT SMBE_HZ SMBE_HG SMBE_JKYSMBE_PLQ SMBE_BG SMBE_LG SMBE_HYSMBE_TX SMBE_AG SMBE_XT SMBE_ZHSMBE_YT SMBE_YD SMBE_DY SMBE_NBSMBE_JN SMBE_RK SMBE_LX SMBE_LGZSMBE_GM SMBE_SGZ SMBE_WF SMBE_XYSMBE_JD SMBE_DK SMBE_ZTZ SMBE_ZFSMBE_HD SMBE_KD SMBE_AT SMBE_BXSMBE_XJ SMBE_XZ
Graph 1 SMBe series
In Graph2, the horizontal axis indicates 51 weeks,
and the vertical axis indicates the values of HMLe,
the series is stable.
-1.4
-1.2
-1.0
-0.8
-0.6
-0.4
-0.2
5 10 15 20 25 30 35 40 45 50
HMLE_CD HMLE_ZJ HMLE_CK HMLE_WYHMLE_JC HMLE_SD HMLE_ZJZ HMLE_LYHMLE_BB HMLE_CG HMLE_YG HMLE_SGHMLE_NG HMLE_YW HMLE_SL HMLE_KEBHMLE_DYG HMLE_KM HMLE_FZ HMLE_TWHMLE_ZT HMLE_HZ HMLE_HG HMLE_JKYHMLE_PLQ HMLE_BG HMLE_LG HMLE_HYHMLE_TX HMLE_AG HMLE_XT HMLE_ZHHMLE_YT HMLE_YD HMLE_DY HMLE_NBHMLE_JN HMLE_RK HMLE_LX HMLE_LGZHMLE_GM HMLE_SGZ HMLE_WF HMLE_XYHMLE_JD HMLE_DK HMLE_ZTZ HMLE_ZFHMLE_HD HMLE_KD HMLE_AT HMLE_BXHMLE_XJ HMLE_XZ
Graph 2 HMLe series
In Graph3, the horizontal axis indicates 51 weeks,
and the vertical axis indicates the values of SMBb,
the series is stable.
-3
-2
-1
0
1
2
3
4
5 10 15 20 25 30 35 40 45 50
SMBB_CD SMBB_ZJ SMBB_CK SMBB_WYSMBB_JC SMBB_SD SMBB_ZJZ SMBB_LYSMBB_BB SMBB_CG SMBB_YG SMBB_SGSMBB_NG SMBB_YW SMBB_SL SMBB_KEBSMBB_DYG SMBB_KM SMBB_FZ SMBB_TWSMBB_ZT SMBB_HZ SMBB_HG SMBB_JKYSMBB_PLQ SMBB_BG SMBB_LG SMBB_HYSMBB_TX SMBB_AG SMBB_XT SMBB_ZHSMBB_YT SMBB_YD SMBB_DY SMBB_NBSMBB_JN SMBB_RK SMBB_LX SMBB_LGZSMBB_GM SMBB_SGZ SMBB_WF SMBB_XYSMBB_JD SMBB_DK SMBB_ZTZ SMBB_ZFSMBB_HD SMBB_KD SMBB_AT SMBB_BXSMBB_XJ SMBB_XZ
Graph 3 SMBb series
In Graph4, the horizontal axis indicates 51 weeks,
and the vertical axis indicates the values of HMLb,
the series is stable.
-6
-4
-2
0
2
4
6
8
5 10 15 20 25 30 35 40 45 50
HMLB_CD HMLB_ZJ HMLB_CK HMLB_WYHMLB_JC HMLB_SD HMLB_ZJZ HMLB_LYHMLB_BB HMLB_CG HMLB_YG HMLB_SGHMLB_NG HMLB_YW HMLB_SL HMLB_KEBHMLB_DYG HMLB_KM HMLB_FZ HMLB_TWHMLB_ZT HMLB_HZ HMLB_HG HMLB_JKYHMLB_PLQ HMLB_BG HMLB_LG HMLB_HYHMLB_TX HMLB_AG HMLB_XT HMLB_ZHHMLB_YT HMLB_YD HMLB_DY HMLB_NBHMLB_JN HMLB_RK HMLB_LX HMLB_LGZHMLB_GM HMLB_SGZ HMLB_WF HMLB_XYHMLB_JD HMLB_DK HMLB_ZTZ HMLB_ZFHMLB_HD HMLB_KD HMLB_AT HMLB_BXHMLB_XJ HMLB_XZ
Graph 4 HMLb series
In Graph5, the horizontal axis indicates 51 weeks,
and the vertical axis indicates the values of DEF, the
series is stable.
-.06
-.04
-.02
.00
.02
.04
.06
5 10 15 20 25 30 35 40 45 50
DEF_CD DEF_ZJ DEF_CK DEF_WYDEF_JC DEF_SD DEF_ZJZ DEF_LYDEF_BB DEF_CG DEF_YG DEF_SGDEF_NG DEF_YW DEF_SL DEF_KEBDEF_DYG DEF_KM DEF_FZ DEF_TWDEF_ZT DEF_HZ DEF_HG DEF_JKYDEF_PLQ DEF_BG DEF_LG DEF_HYDEF_TX DEF_AG DEF_XT DEF_ZHDEF_YT DEF_YD DEF_DY DEF_NBDEF_JN DEF_RK DEF_LX DEF_LGZDEF_GM DEF_SGZ DEF_WF DEF_XYDEF_JD DEF_DK DEF_ZTZ DEF_ZFDEF_HD DEF_KD DEF_AT DEF_BXDEF_XJ DEF_XZ
Graph 5 DEF series
In Graph6, the horizontal axis indicates 51 weeks,
and the vertical axis indicates the values of TERM,
the series is stable.
0.88
0.92
0.96
1.00
1.04
1.08
1.12
5 10 15 20 25 30 35 40 45 50
TERM_CD TERM_ZJ TERM_CK TERM_WYTERM_JC TERM_SD TERM_ZJZ TERM_LYTERM_BB TERM_CG TERM_YG TERM_SGTERM_NG TERM_YW TERM_SL TERM_KEBTERM_DYG TERM_KM TERM_FZ TERM_TWTERM_ZT TERM_HZ TERM_HG TERM_JKYTERM_PLQ TERM_BG TERM_LG TERM_HYTERM_TX TERM_AG TERM_XT TERM_ZHTERM_YT TERM_YD TERM_DY TERM_NBTERM_JN TERM_RK TERM_LX TERM_LGZTERM_GM TERM_SGZ TERM_WF TERM_XYTERM_JD TERM_DK TERM_ZTZ TERM_ZFTERM_HD TERM_KD TERM_AT TERM_BXTERM_XJ TERM_XZ
Graph 6 TERM series
Table 3 unit root test
SPREAD SMBb HMLb SMBe HMLe
LLC -7.041*** -77.67*** -5.07*** 10.69 -5.07***
IPS -5.359*** -73.13*** -12.3*** 13.9 -12.3***
ADF 224.47*** 2484.0*** 339.1*** 3.68 339.1***
PP 300.86*** 2518.1*** 322.6*** 1.86 322.6***
WSEAS TRANSACTIONS on BUSINESS and ECONOMICSSu-Sheng Wang, Jie-Min Huang, Xi Yang, Jie-Yong Huang
E-ISSN: 2224-2899 213 Issue 3, Volume 10, July 2013
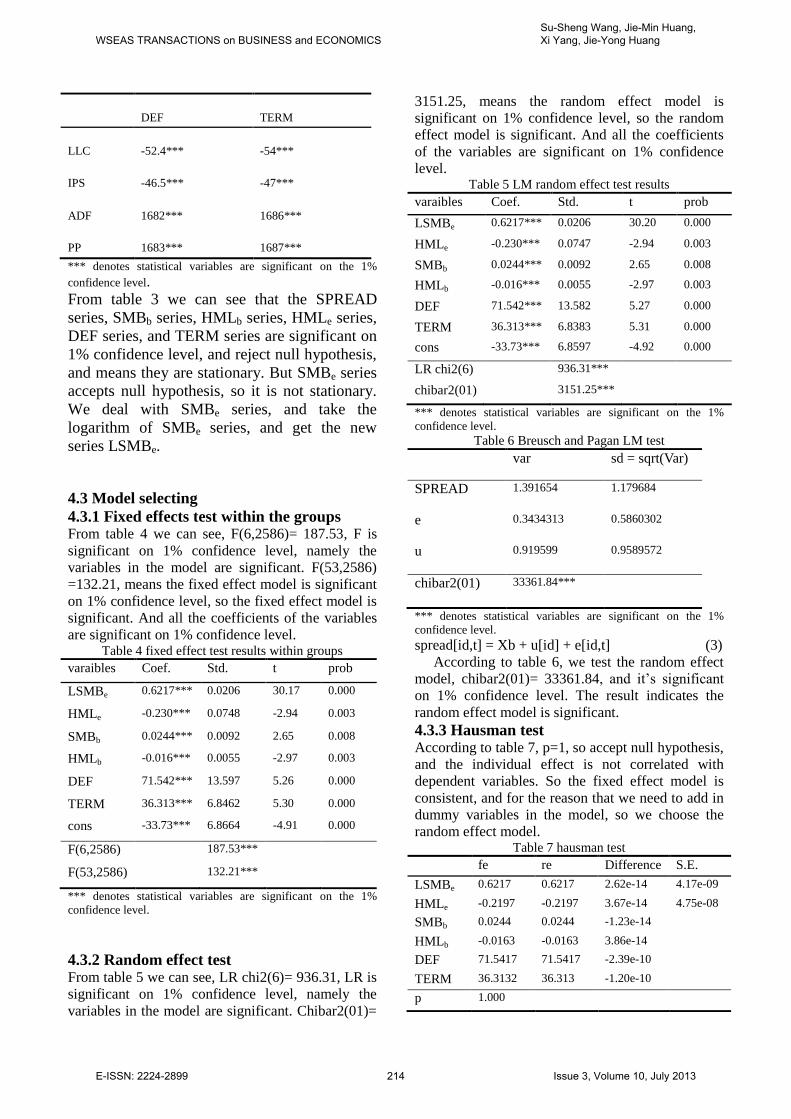
DEF TERM
LLC -52.4*** -54***
IPS -46.5*** -47***
ADF 1682*** 1686***
PP 1683*** 1687***
*** denotes statistical variables are significant on the 1%
confidence level.
From table 3 we can see that the SPREAD
series, SMBb series, HMLb series, HMLe series,
DEF series, and TERM series are significant on
1% confidence level, and reject null hypothesis,
and means they are stationary. But SMBe series
accepts null hypothesis, so it is not stationary.
We deal with SMBe series, and take the
logarithm of SMBe series, and get the new
series LSMBe.
4.3 Model selecting
4.3.1 Fixed effects test within the groups From table 4 we can see, F(6,2586)= 187.53, F is
significant on 1% confidence level, namely the
variables in the model are significant. F(53,2586)
=132.21, means the fixed effect model is significant
on 1% confidence level, so the fixed effect model is
significant. And all the coefficients of the variables
are significant on 1% confidence level. Table 4 fixed effect test results within groups
varaibles Coef. Std. t prob
LSMBe 0.6217*** 0.0206 30.17 0.000
HMLe -0.230*** 0.0748 -2.94 0.003
SMBb 0.0244*** 0.0092 2.65 0.008
HMLb -0.016*** 0.0055 -2.97 0.003
DEF 71.542*** 13.597 5.26 0.000
TERM 36.313*** 6.8462 5.30 0.000
cons -33.73*** 6.8664 -4.91 0.000
F(6,2586) 187.53***
F(53,2586) 132.21***
*** denotes statistical variables are significant on the 1%
confidence level.
4.3.2 Random effect test From table 5 we can see, LR chi2(6)= 936.31, LR is
significant on 1% confidence level, namely the
variables in the model are significant. Chibar2(01)=
3151.25, means the random effect model is
significant on 1% confidence level, so the random
effect model is significant. And all the coefficients
of the variables are significant on 1% confidence
level. Table 5 LM random effect test results
varaibles Coef. Std. t prob
LSMBe 0.6217*** 0.0206 30.20 0.000
HMLe -0.230*** 0.0747 -2.94 0.003
SMBb 0.0244*** 0.0092 2.65 0.008
HMLb -0.016*** 0.0055 -2.97 0.003
DEF 71.542*** 13.582 5.27 0.000
TERM 36.313*** 6.8383 5.31 0.000
cons -33.73*** 6.8597 -4.92 0.000
LR chi2(6) 936.31***
chibar2(01) 3151.25***
*** denotes statistical variables are significant on the 1%
confidence level. Table 6 Breusch and Pagan LM test
var sd = sqrt(Var)
SPREAD 1.391654 1.179684
e 0.3434313 0.5860302
u 0.919599 0.9589572
chibar2(01) 33361.84***
*** denotes statistical variables are significant on the 1%
confidence level.
spread[id,t] = Xb + u[id] + e[id,t] (3)
According to table 6, we test the random effect
model, chibar2(01)= 33361.84, and it’s significant
on 1% confidence level. The result indicates the
random effect model is significant.
4.3.3 Hausman test According to table 7, p=1, so accept null hypothesis,
and the individual effect is not correlated with
dependent variables. So the fixed effect model is
consistent, and for the reason that we need to add in
dummy variables in the model, so we choose the
random effect model. Table 7 hausman test
fe re Difference S.E.
LSMBe 0.6217 0.6217 2.62e-14 4.17e-09
HMLe -0.2197 -0.2197 3.67e-14 4.75e-08
SMBb 0.0244 0.0244 -1.23e-14
HMLb -0.0163 -0.0163 3.86e-14
DEF 71.5417 71.5417 -2.39e-10
TERM 36.3132 36.313 -1.20e-10
p 1.000
WSEAS TRANSACTIONS on BUSINESS and ECONOMICSSu-Sheng Wang, Jie-Min Huang, Xi Yang, Jie-Yong Huang
E-ISSN: 2224-2899 214 Issue 3, Volume 10, July 2013

4.4 Regression analysis
4.4.1 Regression model with corporate size,
B/M and term factors We choose the random effect model, and build the
model as follows:
=C+ + + + +
+ + + (4) We use Eviews to do regress, and get the results
below: Table 8 random effect test results
varaibles Coef. Std. t prob
cons -33.26*** 6.885 -4.8298 0.0000
LSMBe 0.622*** 0.021 30.1602 0.0000
HMLe -0.216*** 0.075 -2.8854 0.0039
SMBb 0.025*** 0.009 2.6580 0.0079
HMLb -0.016*** 0.006 -2.9355 0.0034
DEF 70.59*** 13.63 5.17928 0.0000
TERM 35.85*** 6.864 5.22193 0.0000
R2
0.2987 S.E. 0.5861 F 187.32*** DW 0.1751
*** denotes statistical variables are significant on the 1%
confidence level.
Table 9 the of the model
CD ZJ CK WY JC SD
-1.453 -1.066 -1.164 1.070 0.803 -0.182
ZJZ LY BB CG YG SG
-0.769 -2.337 0.136 0.386 2.210 -2.457
NG YW SL KEB DYG KM
0.093 0.066 -0.177 0.531 -0.168 -0.270
FZ TW ZT HZ HG JKY
0.545 -0.576 -0.166 0.359 0.015 0.196
PLQ BG LG HY TX AG
-0.253 -0.027 -0.952 0.709 -0.955 0.332
XT ZH YT YD DY NB
-0.869 1.092 0.298 -2.108 0.435 -0.578
JN RK LX LGZ GM SGZ
-1.398 0.430 -0.036 -0.630 1.355 0.753
WF XY JD DK ZTZ ZF
0.730 -0.055 -0.578 0.768 0.067 0.949
HD KD AT BX XJ XZ
0.236 1.387 -0.229 0.737 0.970 1.796
From table 8, we know constant is significant on
1% confidence level; LSMBe is significant on 1%
confidence level; HMLe is significant on 1%
confidence level; SMBb is significant on 1%
confidence level; HMLb is significant on 1%
confidence level; DEF is significant on 1%
confidence level; TERM is significant on 1%
confidence level. R2 is 29.87%, and also F=187.32,
it’s significant on 1% confidence level, namely the
model is good. Also, S.E.= 0.5861, and DW=0.1751,
the model is quite good.
According to the hypothesis, the coefficients of
LSMBe is 0.6217, and accept null hypothesis 1,
namely when LSMBe changes for 1 unit, corporate
spread changes 0.6217 in the same direction. Small
company faces larger risk than huge one, so the
spread of small company is lower, because investors
of small company corporate bond ask for more risk
premium. The coefficient of HMLe is -0.2155, and
it’s significant, and it’s negatively correlated with
corporate bond spread, so accept hypothesis 2. It’s
correspond with our expectation, namely the higher
B/M corporate has lower equity returns, and the
lower B/M company has higher equity returns,
because low /B/M company is mature and earns
more money and could provide stable equity interest
commonly. When HMLe changes 1 unit, corporate
spread changes 0.2155 in the opposite direction.
SMBb is positively related with corporate spread,
and accept hypothesis3 and when SMBb changes 1
unit, the corporate spread changes 0.0245 in the
same direction. HMLb is correlated with corporate
spread negatively, this is unusual, maybe because
the equity market factor affects the model, and gets
the unusual results, and it rejects null hypothesis 4.
DEF is related with corporate bond spread
positively, and accept hypothesis 5. The coefficient
is 70.587, when DEF changes 1 unit, the corporate
spread changes 70.587 units in the same direction.
The higher default risk leads to higher corporate
yield, because the investors ask for higher risk
premium. The result indicates the default risk is the
main reason of the spread between corporate spread
and treasury. As treasury doesn’t has default risk,
only if the country disappears. Otherwise, even if
the company has AAA credit rating, it also has
default risk in the future. TERM is correlated with
corporate spread positively. When term changes 1
unit, the corporate spread will changes 35.846 units
in the same direction, and accept hypothesis 6. This
is consistent with expectation, the bond with longer
maturity will face more default risk and credit risk,
so the risk premium is larger, but the shorter bond
faces lower risk and so has lower returns.
The regression model as below:
=-33.255 + +
+ +
+ + (5)
Table 9 shows the random effect intercepts, and
we can get the regression of company CD:
=-34.708+
WSEAS TRANSACTIONS on BUSINESS and ECONOMICSSu-Sheng Wang, Jie-Min Huang, Xi Yang, Jie-Yong Huang
E-ISSN: 2224-2899 215 Issue 3, Volume 10, July 2013

+ +
+ + (6)
The regression equations of other companies are
similar with company CD.
4.4.2 Add credit ratings factor into the
original model We choose 54 companies, and they can be divided
into three credit ratings, AAA, AA+ and AA. The
average spread of the three rating bonds as below:
0.5
1.0
1.5
2.0
2.5
3.0
3.5
4.0
4.5
5 10 15 20 25 30 35 40 45 50
AAAG AAG1 AAG01
Graph 7 average spread of three credit rating bonds
From graph 7, we can see average bond spreads
of three credit ratings become smaller as time moves
forward. The higher credit bonds have lower credit
spread. In the graph, AAA bond has the lowest
average spread, but AA bond has the highest
average spread. This is consistent with bond theories.
The low credit rating bond will face more default
risk and credit risk, and the companies will afford
higher returns to attract capitals. On contrast, the
high credit rating bond will afford low returns
because of low risk. In China, most of the
companies that issue bonds are big stated-owned
companies and large listed companies, and the
companies have high credit ratings. Compared with
foreign bonds, there are few low credit rating bonds.
And small companies can’t issue bonds, so it’s not
good for them to attract capitals.
From table 10, we can see the model with credit
rating variables is significant on 1% confidence
level. LSMBe is significant on 1% confidence level,
and when LSMBe changes 1 unit, spread will
changes 0.622 units in the same direction. HMLe is
significant on 1% confidence level, and when HMLe
changes 1 unit, spread will changes 0.215 units in
the opposite direction. SMBb is significant on 1%
confidence level, and when SMBb changes 1 unit,
spread will changes 0.025 units in the same
direction. HMLb is significant on 1% confidence
level, and when HMLb changes 1 unit, spread will
changes 0.016 units in the opposite direction. DEF
and SMBb are significant on 1% confidence level,
and when DEF changes 1 unit, SPREAD will
changes 70.59 units in the same direction. TERM is
significant on 1% confidence level, and when
TERM changes 1 unit, spread will changes 35.85
units in the same direction. Table 10 the model with credit ratings
varaibles Coef. Std. t prob
cons -33.59*** 6.886 -4.878 0.0000
LSMBe 0.622*** 0.021 30.160 0.0000
HMLe -0.215*** 0.075 -2.885 0.0039
SMBb 0.025*** 0.009 2.658 0.0079
HMLb -0.016*** 0.005 -2.936 0.0034
DEF 70.59*** 13.63 5.179 0.0000
TERM 35.85*** 6.864 5.222 0.0000
AAA -0.980*** 0.247 -3.962 0.0001
AA 0.962*** 0.193 4.994 0.0000
R2 0.3139 S.E. 0.5861
F 150.8398*** DW 0.6368
*** denotes statistical variables are significant on the 1%
confidence level.
Table 11 the of the model
CD ZJ CK WY JC SD -0.146 0.237 0.140 0.443 0.178 0.149
ZJZ LY BB CG YG SG -0.431 -1.981 -0.481 0.711 1.569 -1.138
NG YW SL KEB DYG KM -0.523 0.394 -0.790 -0.090 0.162 0.062
FZ TW ZT HZ HG JKY -0.076 -0.240 0.165 -0.260 -0.600 0.523
PLQ BG LG HY TX AG -0.865 0.302 0.349 0.086 0.346 -0.287
XT ZH YT YD DY NB 0.431 0.464 -0.321 -0.793 -0.185 -0.242
JN RK LX LGZ GM SGZ -0.092 -0.190 -0.651 0.667 0.725 0.129
WF XY JD DK ZTZ ZF 0.107 0.274 -0.243 0.144 0.396 0.323
HD KD AT BX XJ XZ -0.381 0.756 -0.842 0.114 0.344 1.160
The credit rating factors are significant. AAA is
significant on 1% confidence level, and when AAA
changes 1 unit, spread will changes -0.980 units.
AA is significant on 1% confidence level, and when
AA changes 1 unit, spread will changes -0.980 units
0.962. AA+ is significant on 1% confidence level,
and when AAA changes 1 unit, spread will changes
0.33 units. R2 is 31.39%, F=150.8398, and it is
significant on 1% confidence level. The model is fit.
The regression model as below:
=-33.59+
+ +
WSEAS TRANSACTIONS on BUSINESS and ECONOMICSSu-Sheng Wang, Jie-Min Huang, Xi Yang, Jie-Yong Huang
E-ISSN: 2224-2899 216 Issue 3, Volume 10, July 2013
+ -0.98aaa+0.962aa+ (7) Table 11 shows the random effect intercepts, and
we can get the regression of company CD:
=33.736
+ +
+ -0.98aaa+0.962aa+ (8) The regression equations of other companies are
similar with company CD.
5 Conclusion The results we find are almost consistent with the
literatures of US and European bond markets, such
as SMBe, DEF and TERM factors, but HMLe is
different from foreign study, and we have explained
the reasons. Only Gemmill(2011) study the SMBb
and HMLb factors in US bond market, and our
results of HMLb are different from his, and we have
explained the reasons before [6]. Bond market in
China is immature. We analyze corporate bond
spread influencing factors, mainly including
company size, book to market ratio in equity market
and bond market, default factor and term factor. We
find that firstly, corporate size factors which exclude
book to market ratio factors in both equity market
and bond market correlates with corporate bond
spread positively. Small company will tend to afford
high corporate bond spread, but big company will
tend to afford low corporate bond spread. Secondly,
book to market ratio factors in both equity market
and bond market which exclude company size factor
correlate with corporate bond spread positively.
Companies with high book to market ratio will issue
high yield spread bond, but companies with low
book to market ratio will issue low yield spread
bond. Thirdly, we find default factor has huge
impact on corporate bond spread, and this is
consistent with expectations. The main difference
between corporate bond and treasury is default risk,
and it determines default risk is the main factor of
corporate bond spread. Fourthly, term factor has
significant effect on corporate bond spread. The
bonds with longer maturity will face high risk,
including default risk, inflation risk and interest risk,
so they provide high yield spread, but short maturity
bond will afford low yield spread. Fifthly, we add
bond credit rating as dummy variables into the
model. We find they are significant, and they are the
important factors which influence corporate bond
spread. In all, these are important corporate bond
spread factors. But the model only explains nearly
30% of corporate bond spread. In all, Market
behavior causes corporate bond spread. The findings
could provide directions for bond investors. On the
other hand, according to literatures small companies
have a lot of difficulty in financing, and this hinders
the small companies’ development. In my opinion,
the China Securities Regulatory Commission could
allow small corporate with promising future issue
low credit rating bonds, and this could solve
financing problem, and promote small company
develop rapidly. According to the data we collect, in
China, we have fewer short term and long term
corporate bonds. The China Securities Regulatory
Commission could encourage corporates issue all
kinds of bonds. In the future, we will research on
corporate bond spread determinant factors with
dynamic method.
References:
[1] Fama E F, French K R, Common risk factors in
the returns on stocks and bonds, Journal of
Financial Economics, Vol.33, 1993, pp. 3-56.
[2] King T, Khang K, On the importance of
systematic risk factors in explaining the cross-
section of corporate bond yield spreads, Journal of
Banking & Finance, Vol.29, 2005, pp. 3141–3158.
[3] Bao J, Pan J, Excess Volatility of Corporate
Bonds, working paper, 2008.
[4] Avramov D, Jostova G, Philipov A, Understand-
ing Changes in Corporate Credit Spreads, Financial
Analysts Journal, Vol.63, 2007, pp. 90-105.
[5] Schaefer S M, Strebulaev I A, Structural models
of credit risk are useful: Evidence from hedge ratios
on corporate bonds, Journal of Financial Economics,
Vol.90, 2008, pp. 1-19.
[6] Gemmill G, Keswani A, Downside risk and the
size of credit spreads, Journal of Banking &
Finance, Vol.35, 2011, pp. 2021-2036.
[7] Huang J, Huang M. How much of the Corporate-
Treasury yield spread is due to credit risk. Working
paper, 2002.
[8] Gebhardt W R, Hvidkjaer S, The cross-section
of expected corporate bond returns: Betas or
characteristics, Journal of Financial Economics,
Vol.75, 2005, pp. 85-114.
[9] Dionne G, Gauthier G, Hammami K, Maurice M,
Simonato J, Default Risk in Corporate Yield
Spreads, Financial Management, 2010, pp.707 -731.
[10] Giesecke K, Longstaff F A, Schaefer S,
Strebulaev I, Corporate bond default risk: A 150-
year perspective, Journal of Financial Economics,
Vol.102, 2011, pp. 233-250.
[11] Longstaff F A, Mithal S, Neis E, Corporate
Yield Spreads: Default Risk or Liquidity? New
WSEAS TRANSACTIONS on BUSINESS and ECONOMICSSu-Sheng Wang, Jie-Min Huang, Xi Yang, Jie-Yong Huang
E-ISSN: 2224-2899 217 Issue 3, Volume 10, July 2013
Evidence from the Credit Default Swap Market.
Journal of Finance, Vol.5, 2005, pp. 2213-2253.
[12] F. Neri, Agent Based Modeling Under Partial
and Full Knowledge Learning Settings to Simulate
Financial Markets, AI Communications, Vol.25,
No.4, 2012, pp. 295-305.
[13] K. Chen; H. Lin; T. Huang, The Prediction of
Taiwan 10-Year Government Bond Yield, WSEAS
Transactions on Systems, Vol.8, No. 9, 2009, pp.
1051-60.
[14] Turki. Skander; Soriano. Thierry, Mechatronic
systems modeling with SysML: A bond graphs
addendum for energy analysis, WSEAS Transactions
on Systems, Vol. 4, No. 5, 2005, pp. 617-624.
[15] Zaidi. Abdelaziz; Zanzouri. Nadia, Graphical
approaches for modelling and diagnosis of hybrid
dynamic systems, WSEAS Transactions on Systems,
Vol.5, No. 10, 2006, pp. 2322-2327.
[16] K. Chang; Su-Sheng Wang; Peng Ke, The
Valuation of Futures Options for Emissions
Allowances under the Term Structure of Stochastic
Multi-factors, WSEAS Transactions on Systems,
Vol.11, No. 12, 2012, pp. 661-70.
[17] Jiemin. Huang, Susheng Wang, Review on
foreign study of corporate bond spread, Advanced
Materials Research, Vol.655-657, pp. 2258-2261.
[18] Susheng. Wang; Yongguan. Mai, Pure
statistical and multi-level industrial pairs trading:
bridged by statistical characters, 3rd International
Conference on Manufacturing Science and
Engineering, Vol.479-481, 2012, pp. 829-832.
[19] Shi YY, Zhong WZ, Ma J, Equity investment
with corporate size and equity interest ratio,
Financing Research, Vol. 336, No.6, 2008, pp. 122-
129.
[20] Tu XS, Zhu M, Fama-French with mutual fund
performance measurement test, Guangdong
University of Finance journal, Vol.25, No.1, 2010,
pp. 103-112.
[21] G. Duffee, The Relation between Treasury
Yields and Corporate Bond Yield Spreads, Journal
of Finance, Vol.6, No.53, 1998, pp. 2225-2242.
WSEAS TRANSACTIONS on BUSINESS and ECONOMICSSu-Sheng Wang, Jie-Min Huang, Xi Yang, Jie-Yong Huang
E-ISSN: 2224-2899 218 Issue 3, Volume 10, July 2013