Embed Size (px)
Citation preview
THE JOURNAL OF TRANSPORT AND LAND USE http://jtlu.org. 8 . 1 [2015] pp. 171–190
The influence of land use and mobility policy on travel behavior: A comparative case study of Flanders and the Netherlands
Jonas De Vos a Ghent University
Abstract: Numerous transportation studies have indicated that the local built environment can have an im-portant effect on travel behavior; people living in suburban neighborhoods travel more by car than people living in urban neighborhoods. In this paper, however, we will analyze whether the regional land use has an important influence on travel behavior by comparing two regions with a varying land-use pattern: Flanders (Belgium) and the Netherlands. The different land-use pattern seems to have influenced travel behavior in both regions. An active spatial planning policy in the Netherlands, clustering activities in urban surroundings, appears to have realized a sustainable travel behavior, as a substantial share of residents frequently walk, cycle or use public transportation. The rather passive spatial planning in Flanders, resulting in urban sprawl, seems to stimulate car use. The applied mobility policy also has an impact on the travel behavior and land use of the Flemings and the Dutch. Infrastructure is concentrated in Dutch urban environments, whereas Flanders has a more widespread network of infrastructure and cheap public transportation, resulting in a further increase of suburbanization.
Copyright 2015 Jonas De Voshttp://dx.doi.org/10.5198/jtlu.2015.709ISSN: 1938-7849 | Licensed under the Creative Commons Attribution – NonCommercial License 3.0.
The Journal of Transport and Land Use is the official journal of the World Society for Transport and Land Use (WSTLUR) and is published and sponsored by the University of Minnesota Center for Transportation Studies.
1 Introduction
Although recent studies suggest that car use is ceasing to grow in the developed economies (“peak car use”) (Metz 2013; Newman and Kenworthy 2011), most western countries have experienced a rapid increase in car use over the past decades. Both in Flanders and the Netherlands, for instance, total distance covered by car has almost doubled in the period 1980–2012 (www.mobilit.fgov.be; http://statline.cbs.nl). Previous research has shown that the local built environment (at the neighborhood level) has an important effect on travel mode choice. Walking, cycling, and public transportation use in suburban or rural neighborhoods is significantly lower than in urban neighborhoods, while car use is significantly higher (e.g., Cao et al. 2009; Cervero 1996; Cervero and Kockelman 1997; Ewing and Cervero 2010; Mokhtarian and Cao 2008). This can be partly explained by the built environment of these neighborhoods. Neighborhoods with low density and diversity (mostly suburban or rural neigh-borhoods) have longer average distances—discouraging walking and bicycling—as the availability of potential trip destinations in proximity of the dwelling is generally lower than in amenity-rich urban neighborhoods. In addition, these car-oriented neighborhoods have fewer public transportation travel opportunities, resulting in long average distances to public transportation stops (Dieleman et al. 2002; Næss 2006). Because of the negative consequences of car use such as congestion, air pollution, and urban sprawl, spatial planners have tried, from the 1990s onward, to solve this problem by adapting the built environment. Concepts such as New Urbanism (in the US), Compact City (in Europe), and transit-oriented development (in the US and later in Europe and Asia) try to reduce car use and travel distances by creating neighborhoods with high densities and diversities and a design oriented toward

172 JOURNAL OF TRANSPORT AND LAND USE 8.1
public transportation and nonmotorized travel (Cervero 1996; Friedman et al. 1994; Schwanen and Mokhtarian 2005). However, not all western countries have implemented measures to restrict urban sprawl and promote compact, mixed-use development as a means of reducing car use to the same extent (Schwanen et al. 2004). In this study we will compare the Netherlands, a country with a long history of intervention by spatial planners in the development of urban forms (e.g., van der Cammen et al. 2003; Van Der Burg and Dieleman 2004) with Flanders (the northern region of Belgium), a region where policymakers, until the end of the twentieth century, opted for limited spatial planning regulations in order to stimulate house ownership outside the city (e.g., De Decker 2011; Kesteloot and De Maess-chalk 2001; Mougenot 1988). In doing so, this paper aims to provide better insight into the influence of regional land use (in contrast to local neighborhood levels) and spatial planning policies on travel behavior, although mobility policies will also be taken into account.
In this paper, we will analyze whether the more active spatial planning regulations in the Nether-lands, and the accompanying clustered land-use pattern, resulted in more sustainable travel behavior (e.g., reduced car use and shorter daily travel distances) compared to Flanders (Belgium). Travel behav-ior of Flemings and the Dutch will be analyzed and linked with spatial planning policies over the last decades. We will examine how Flanders and the Netherlands try to optimize the travel behavior of their citizens based on their present mobility and spatial planning policies. The paper is organized as follows: Section 2 gives an overview of the history of spatial planning and mobility policy in Flanders and the Netherlands; Section 3 examines the travel behavior in both regions; the subsequent relation between spatial planning, mobility policy, and travel behavior are discussed in Section 4; and major conclusions are presented in Section 5.
2 Spatial planning and mobility policy in Flanders and the Netherlands
Although Flanders and the Netherlands are, at first sight, highly comparable regions1 — they’re neigh-boring regions with a partly shared history (as the Low Countries), the same language (Dutch), and similar population density—substantial differences in the spatial pattern of both regions are noticeable (Figure 1). The share of land occupied by buildings and infrastructure, compared to the total amount of available land, differs considerably; in Flanders, 26.4% of the available land is occupied, which is considerably higher than in the Netherlands (14.5%). This can be partly explained by the dispersed land-use pattern in Flanders, where the border between city and countryside is hard to draw. The Neth-erlands, on the other hand, has better managed to restrict the uncontrolled spread of urban development (urban sprawl), resulting in more people living in compact, urban areas. Differences in infrastructure are also present; the Flemish road network is widespread and, with 512 km of road per 1000 km2, more dispersed than the Dutch road network (at 317 km/1000 km2). The rail network in Flanders (116 km/1000 km2) also has a higher density than in the Netherlands (68 km/1000 km2) (http://www.statbel.fgov.be; http://statline.cbs.nl).
1 Flanders: surface area: 13,500 km2; inhabitants: 6,300,000; population density: 466 inhabitants/km2 (http://www.statbel.fgov.be/); The Netherlands: surface area: 41 500 km2; inhabitants: 16,700,000; population density: 404 inhabitants/km2
(http://statline.cbs.nl).

173The influence of land use and mobility policy of travel behavior: Flanders and the Netherlands
Figure 1: Built-up space (top) and infrastructure (middle) in the central area of Flanders and the Netherlands (i.e., “The Flemish Diamond” and “Randstad Holland”); locations of the areas are indicated by the red frames at the bottom.2 Source: de Geyter et al. (2002).
2.1 Spatial planning in Flanders
From the nineteenth century onward, the land-use pattern in Flanders starts to play an important role in influencing people’s travel behavior. At the beginning of the nineteenth century, Belgium was the first country of the European continent where the Industrial Revolution developed, stimulating employ-ment in cities. Since the overwhelming majority of these workers had neither the money nor the time to commute, many moved from the countryside to the city to live close to their work. To prevent further immigration of laborers to the overpopulated and unhygienic cities, Belgium constructed (starting in 2 Although surrounded by the Flemish region, Brussels is administratively seen not a part of the Flemish region but belongs to the Brussels capital region; Brussels is not included in this analysis.

174 JOURNAL OF TRANSPORT AND LAND USE 8.1
1835) the most densified network of trams and trains of all industrial countries. This network was not only constructed for the ease of the laborers but also to prevent riots and the development of labor unions (stimulated by Catholic parties who wanted to prevent the rise of socialistic parties). Together with cheap public transportation passes (starting from 1869) laborers were now able to commute easily between the city and the countryside. Furthermore, cheap government loans enabled many households to build or buy (mostly detached) dwellings in the countryside (De Block and Polasky 2011; De Decker 2011; Mougenot 1988). This was mainly stimulated by catholic ideas, where individual values, such as one’s own detached dwelling with garden, were considered highly desirable. Belgium clearly opted for an “anti-urban” policy, resulting in a cheap and spatially widespread public transportation network and limited spatial planning regulations. Hence, cities spread outward, generating sub-centers around transportation nodes such as train and tram stations, thus making it possible for employees to reside (far) away from the workplace (e.g., De Vos et al. 2012; De Vos and Witlox 2013; Kesteloot, De Maesschalk 2001; Verhetsel et al. 2010).
It is, however, only after the Second World War that urban sprawl really took off. The rise of car use—induced by an increase in prosperity and income and the mass production of the car—made it easier to reside almost anywhere on the countryside, including places that were difficult to access by train. Suburban, low-density neighborhoods with good car accessibility emerged, scattered around the Flemish region. The weak spatial planning policies conducted in Flanders did not hinder the geographi-cal distribution of facilities. In fact, spatial plans (zoning plans) in the 1970s (so-called Regional Plans—“Gewestplannen”) designated territories, spread around the region, as residential area or prospective residential area, based on expected population growth. Also, other zonal destinations (e.g., industrial areas) were not clustered, but scattered around over almost all municipalities (Albrechts 1999; Allaert 2008; Boussauw et al. 2013). Furthermore, the so-called “fill-up” rule, allowing construction of dwell-ings in non-residential areas between two buildings closer than 70 meters from each other, resulted in ribbon development (Bouckaert and De Waele 2000). This has resulted in a strongly urbanized region where open spaces have become scarce and split up from each other over the last decades. A large part of the available space has already been filled up by buildings, infrastructure, and all sorts of other activities. Flanders Region can therefore be considered a diffuse city (De Decker 2011; de Geyter et al. 2002). City and countryside fade into one another, and the border is hard to draw.
The Spatial Structure Plan of Flanders (MVG 1997—“Ruimtelijk Structuurplan Vlaanderen”), the most recent spatial planning instrument of Flanders (ratified in 1997 by the Flemish government), tries to counteract urban sprawl by introducing a more active-oriented form of planning (Figure 2). The most important spatial principle in this plan is called “deconcentrated clustering.” This concept suggests that residential areas, business areas, and other kinds of activities need to be clustered in cities and town centers (“clustering”), taking into account the existing dispersed land-use pattern (“deconcentrated”) (Albrechts et al. 2003; Scheers 2006). In order to realize this goal, this plan limits the number of ad-ditional dwellings permitted to be built in rural areas to a maximum of 40%. The Spatial Structure Plan for Flanders strives for at least 60% of additional dwellings in urban areas (MVG 1997, 2011). These principles are inspired by the “compact city” concept, for which high density and diversity not only can limit further urban sprawl but also can reduce long-distance travel and car use. However, this 60/40 relationship equals the distribution at the time the Spatial Structure Plan was developed (1997). This regulation would, if successfully implemented, consequently not result in a reduction of urban sprawl, but only in the status quo of the situation in 1997. However, the goal to realize 60% of the additional dwellings in urban areas has not been realized. For the period 1997–2007, more than half of the ad-ditional dwellings (56%) were realized in rural areas. Even when applying a less rigorous definition of urban areas (including less dense areas of urban municipalities and neighboring municipalities of large

175The influence of land use and mobility policy of travel behavior: Flanders and the Netherlands
and regional cities), only 56% of additional dwellings were built in urban areas (Voets et al. 2010). De Decker (2001) indicated that this objective was difficult to realize, since the limited grounds available in urban areas are often inferior (e.g., situated near busy roads) or in private hands. Although not all objec-tives have (until now) been successfully implemented, Flanders’s land-use policy has shifted over the past years toward an urban policy (unlike the anti-urban policy in previous decades). Flanders now tries to increase the attractiveness of cities as residential places. By emphasizing positive aspects of the city (such as a large supply of jobs, culture, or recreation), Flanders now tries to restrict a further urban exodus, especially of young families with children (http://www.thuisindestad.be).
Figure 2: Schematic representation of the desired land-use pattern of Flanders. Source: MVG (1997).
2.2 Spatial planning in the Netherlands
The well-developed suburbanization that characterized Flanders in the nineteenth and twentieth cen-tury was only present in the Netherlands to a limited degree. The industrialization began later than in Belgium, while the solution for the increasing urban population was found elsewhere. The Netherlands (especially in the beginning of the twentieth century) chose a systematic approach for urban expansion instead of allowing urbanization of the countryside. This can be partly explained by the absence of a catholic dominance (the socio-political lines in the Netherlands are more segregated between liberals, Protestants, Roman Catholics, and social-democrats), whereby a detached dwelling with garden in the countryside was not stimulated as much as in Belgium (by means of inexpensive government loans and a cheap and widespread public transportation network), resulting in a more clustered land-use pattern. Furthermore, with the so-called Housing Act (1901), the financing of public housing is mainly orga-nized on a national level. Municipalities and housing corporations were given subsidies to make sure urban expansion was organized and well structured. This resulted in large-scale urban expansions with
Large or regional urban area
Small urban area
Urban network ‘Flemish diamond’
Urban Network
Econmic network
River/stream
Rural area
Corridor rural areaRural area center
Sea port
Air port
High speed railway station
Main Road
Main railroad
Railroad ‘Iron Rhine’
Main waterway

176 JOURNAL OF TRANSPORT AND LAND USE 8.1
the help of development plans. The countryside was consequently more protected against urban sprawl than in Belgium (Bontje 2001; Terhorst and van de Ven 2001; van der Cammen and de Klerk 2003).
After the Second World War, the rise of the car and the expected population growth threatened to result in the emergence of sprawling patterns. By means of the First and Second Physical Planning Memorandum (MVRO 1960 and MVRO 1966, “Eerste en Tweede Nota Ruimtelijke Ordening”), the Dutch government tried to restrict suburbanization of the countryside, mainly the open area in the western part of the Netherlands (between the largest cities)—the “green heart” of Holland. The most important principle to do so, first mentioned in the Second Physical Planning Memorandum, was “concentrated decentralization” (Bontje 2001; Dieleman et al. 1999). To protect open areas, the possible suburbanization needed to be regulated as much as possible. New urban developments were concentrated in growth centers, mostly situated in proximity to existing large cities. Sixteen growth centers (e.g., Almere, Zoetermeer, Alkmaar) were designated in the Second and Third Physical Planning Memorandum (MVRO 1966, and MVRO 1974, “Tweede en Derde Nota Ruimtelijk Ordening”). This policy was mainly implemented in the seventies and eighties and was, to a large extent, successful in restricting urban sprawl; new urban developments concentrated in these growth centers and the open spaces (the “green heart” in particular) remained free from urban sprawl (Faludi and Van der Valk 1990; Priemus 1998; van der Cammen and de Klerk 2003).
At the end of the 1980s the Dutch planning policies changed course. The fast population increase of the growth centers resulted in an urban exodus from the city centers of large cities. Furthermore, growth centers were criticized by their unvarying dwelling types and a weak social cohesion. To restrict a further urban exodus, Dutch planning policies now tried to concentrate urban development within existing large cities and their urban region. This policy, comparable with the compact city concept, is formulated in the Fourth Physical Planning Memorandum (MVRO 1988, “Vierde Nota Ruimtelijke Ordening”). New neighborhoods were raised at the edge of existing cities (“VINEX”locations), within the urban region. This Memorandum also states that 75% of the additional dwellings must be realized within existing urban regions, protecting open spaces in the countryside. However, little attention was paid to the liveability in the city centers, resulting in a reduced attraction of these places to live and work. With the help of urban renewal projects, fitted into the “big cities policy,” the Dutch government tried to increase the attractiveness of city centers (Priemus 1998; Schwanen et al. 2004; Van Der Burg & Dieleman 2004).
The Fourth Physical Planning Memorandum also introduced a policy for the location of firms, the ABC location policy. This policy tried to locate firms in a way that discouraged the use of cars and stimulated the use of car alternatives. Firms should be located close to main railway stations (A locations) or at least regional transportation nodes (B locations). Locations close to the highway (C locations) were reserved for goods-handling industries. However, the ABC policy turned out to be hard to implement; the growth in employment in the office sector was much larger than originally planned and could not be accommodated fully in A and B locations. Consequently, most firms located themselves in the larger and cheaper C locations (Dijst 1997; Schwanen et al. 2004; Van Der Burg and Dieleman 2004; van der Cammen and de Klerk 2003).
Since the interaction (i.e., commute flows) between Dutch cities has increased over the past de-cades (Limtanakool et al. 2009)—whereby networks of cities (i.e., urban networks) are becoming more important—the Fifth Physical Planning Memorandum (MVROM 2001, “Vijfde Nota Ruimtelijke Ordening”) has changed its policy concept from compact city to urban network. Such an urban net-work is a highly urbanized area formed by a network of large and smaller compact cities with their own characteristics. It is not an individual city, but the urban network that provides a complete supply of dwellings, jobs, and other services to its inhabitants. However, this memorandum was not approved

177The influence of land use and mobility policy of travel behavior: Flanders and the Netherlands
by the parliament because of the fall of the presiding Dutch government (Cabinet Kok II). The next Dutch government (Cabinet Balkenende II) revised the Fifth Physical Planning Memorandum into the so-called Memorandum Space (MVROM 2004, “Nota Ruimte”), approved by the parliament in 2006. In this memorandum the emphasis is also on urban networks (Figure 3). An interesting objective of this memorandum is to cluster urban development and infrastructure in national urban networks, economic core areas and main connecting corridors. By concentrating services and other amenities in urban net-works, this document also tries to protect open spaces from urban sprawl. Important regional functions are being concentrated around public transportation nodes and infrastructural nodes. Furthermore, road, rail, and water infrastructure is being clustered in main connecting corridors. These corridors connect the most important main ports (ports and airports) and urban areas in the Netherlands (and neighboring countries). Although the Memorandum Space provides some interesting concepts and vi-sions, it lacks tools for implementation.
Recently (March 2012), the Dutch government approved the Memorandum Infrastructure and Space (MIM 2012, “Structuurvisie Infrastructuur en Ruimte”). This document tries to outline the physical character of the Netherlands in 2040 and is in many ways a break with the trend of previous spatial planning documents. Spatial planning is being decentralized; provinces and municipalities will play a more important role, resulting in more subsidiarity. Furthermore, the urban network concept is being abandoned. In this document, compared with previous documents, the future function of areas is less fixed. In sum, the Dutch spatial planning policy is being decentralized and liberalized, entailing a shift toward Flemish spatial planning policies.
Figure 3: Desired Dutch urban networks according to the Memorandum Space. Source: MVROM (2004).
2.3 Mobility policy in Flanders and the Netherlands
Flanders and the Netherlands have their own mobility plan, respectively known as Mobility Plan Flan-ders (MVG 2003, “Mobiliteitsplan Vlaanderen”) and Memorandum Mobility (MVW 2004, “Nota Mobiliteit”). These plans form a framework for the mobility policy in the future. Noticeable differences
Clustering areaNew key projectNational urban network
Buffer area
1. Randstand Holland2. Brabantstad3. South Limburg4. Twente5. Arnhem - Nijmegen6. Groningen - Assen

178 JOURNAL OF TRANSPORT AND LAND USE 8.1
exist between the two mobility plans. The mobility Plan Flanders mainly focuses on the social aspects of mobility—i.e., keeping every place accessible for everybody. The four main goals of this plan are acces-sibility, safety, livability, and quality of the environment. The accessibility objective implies that all Flem-ings (even people living in remote areas) have the right to high-quality mobility. Therefore, Flanders tries to pursue maximum accessibility by building a large amount of infrastructure and offering a cheap and spatially widespread public transportation network to Flemish residents. However, a widespread public transportation network in a dispersed region such as Flanders is rather inefficient and not cost effective, since only a limited number of people reside in proximity to a public transportation line. The acces-sibility objective also implies that traveling in Flanders is relatively cheap; incorporating social objectives in the public transportation policy started in the nineteenth century with cheap public transportation passes so laborers could work in cities but live in the countryside (De Block and Polasky 2011). At present, public transportation is still relatively cheap in order to prevent social exclusion. However, this cheap travel can have negative effects since transportation costs become less important compared to land prices in residential location choices, resulting in more households choosing to live in remote areas, which initiates further urban sprawl (De Vos and Witlox 2013). Furthermore, not a lot of attention is paid to measures to decrease car use. This is remarkable since high car use, and the accompanying congestion and air pollution, is one of the most important (mobility) problems in the western world (e.g., Banister 2008). Moreover, the link with urban planning, and the Spatial Structure Plan Flanders in particular, is only present to a limited degree. The Mobility Plan Flanders and the Spatial Structure Plan Flanders are, at some points, clearly different. The Spatial Structure Plan, for instance, tries to (based on the compact city concept) cluster activities in urban areas and by doing so, protect open spaces in the countryside. The Mobility Plan Flanders, however, stimulates suburbanization by creating a widespread public transportation network to optimize accessibility.
The social aspect of mobility (e.g., accessibility) is less present in the Dutch Memorandum Mobil-ity. The emphasis of this document lies more on multimodality and stimulating car alternatives. The link with spatial planning, and the Memorandum Space, is clearly present. One of the most important topics of Memorandum Space, namely urban networks, is also present in the Memorandum Mobility. The priority for road and rail traffic lies with a limited number of connecting corridors (Figure 4). The most important residential areas, employment areas, and (air)ports are situated along these corridors. (Rail)roads along areas of high density and diversity are being optimized, while additional dwellings are being provided in proximity of these corridors, comparable with transit-oriented developments. Public transportation also focuses on a limited number of public transportation lines. The existing infrastruc-ture is not being expanded, but is being optimized to transport more people. The Netherlands chooses a limited but high-quality (high frequency and high capacity) public transportation service in urban networks where a high potential for travelers is present, while public transportation services in small cities and the countryside are limited. The Memorandum Mobility also tries to stimulate bicycle use by offering bicycle services (bike lanes, bicycle parkings) in proximity of railway stations. The Memo-randum Mobility has since March 2012 been replaced by the Memorandum Infrastructure and Space. This memorandum still emphasizes connecting corridors; however, these are mainly disconnected from spatial developments. Although spatial planning and mobility are now combined in one document (Memorandum Infrastructure and Space), their link has weakened in comparison with the period when spatial planning and mobility had their own memorandums (Memorandum Space and Memorandum Mobility).

179The influence of land use and mobility policy of travel behavior: Flanders and the Netherlands
Figure 4: Main connecting corridors for roads (left) and rail roads (right). Source: MVW (2004).
3 Travel behavior in Flanders and the Netherlands
In this section we focus on travel mode choice (car, train, bus/tram/metro, walking, cycling) and travel distance in Flanders and the Netherlands. To thoroughly examine these travel behavior characteristics, we also made distinctions according to the type of trip (commute trips, leisure trips, and shopping trips) and subdivided the respondents according to their residential location (ranging from large cities to countryside).
3.1 Data and methods
Travel behavior in Flanders and the Netherlands is analyzed based on mobility surveys in both regions, namely “Research Travel Behaviour Flanders” (3) (OVG 3) and “Mobility Research The Netherlands 2008” (MON 2008). Both surveys asked respondents for information on travel mode choice, travel distance, origin and destination of trips, type of trips, and some socio-demographic variables. The survey in Flanders was executed in the period from September 2007 to September 2008. 8,800 individuals of six years and older participated in the survey, of which 7,273 were retained after data cleaning (Witlox 2007; http://www.mobielvlaanderen.be). The mobility survey in the Netherlands was executed during the complete year 2008. After data cleaning, 30,121 respondents were retained (http://www.rijkswa-terstaat.nl). Both surveys asked respondents to note all the trips they made on a specific, randomly selected day in the near future, defined on the questionnaire. These two surveys were chosen because the method and period of data collection are comparable. More recent mobility surveys in both regions are present; however, in Flanders data collection is now spread out over 5 years (2009–2013) while in
Connecting corridorMissing link in connecting corridorsRemaining primary roadsRoads in foreign countries
Remaining primary railroads
Connecting corridorMissing link in connecting corridors
Railroads in foreign countries

180 JOURNAL OF TRANSPORT AND LAND USE 8.1
the Netherlands the last mobility survey in this form was held in 2009. Since then, a new Dutch survey (OViN, “Onderzoek Verplaatsingen in Nederland”), with different sampling and measurement meth-ods, is introduced.
Since the residential location can have an important effect on people’s travel behavior, we subdi-vided the respondents according to the level of urbanization of their municipality. Five categories were retained: large cities (cities with more than 100,000 inhabitants); regional cities (cities with more than 50,000 but less than 100,000 inhabitants); suburbs (suburbs of large and regional cities)3; small cities (cities with more than 20,000 inhabitants but less than 50,000 inhabitants); and countryside (munici-palities with less than 20,000 inhabitants). For the Netherlands, we also retained the 16 growth centers. Since Flanders has a dispersed land-use pattern with a limited number of large and regional cities (for example, only three cities exceed 100,000 inhabitants—Antwerp: 500,000 inhabitants, Ghent: 250,000 inhabitants, and Bruges: 120,000 inhabitants), only a small share of Flemings (24.9%) lives in big or regional cities (respectively, 13.6% and 11.3%) (Table 1). A large share (41.6%) of the Flemish popula-tion resides in the countryside, where they are spread over more than half (54.5%) of the Flemish area. In the Netherlands, a lot more people (45.3%) live in large or regional cities, while only a limited amount of people (9.7%) live in the countryside, indicating that Dutch dwellings, compared to Flemish dwellings, are more clustered in urban areas. Table 1 also indicates that suburbs of Dutch cities have a higher population density than Flemish suburbs, while the density of regional cities, small cities, and the countryside are considerably lower.
Although the socio-demographic variables of Dutch and Flemish respondents are comparable, small variances can be noticed (Table 2)4. The Dutch survey contains more young respondents (0–19 years)5 and older respondents (60+ years) than the Flemish survey, while the Dutch survey also has slightly more women and retired people but fewer students. Household car possession and driving li-cense possession are slightly higher in the Flemish survey than in the Dutch survey. Some differences are also noticeable between respondents living in varying residential locations. Both in Flanders and in the Netherlands, more young respondents (0–19 years) and respondents between the ages of 40 and 59 live
Table 1: Population density indicators in different residential locations of Flanders and the Netherlands.
Flanders The Netherlands
Avg. pop. density
(inh./km2)
% of total population
% of total areaAvg. pop. density
(inh./km2)
% of total population
% of total area
Large city 1736 13.6 3.7 1662 29.7 9.3
Regional city 1039 11.3 4.8 707 15.6 11.5
Suburb 654 12.9 9.9 1324 8.2 3.2
Small city 672 20.6 27.1 311 29.8 49.5
Countryside 317 41.6 54.5 211 9.7 23.8
Growth center N/A N/A N/A 1363 7.0 2.7Source: http://www.statbel.fgov.be/; http://statline.cbs.nl.
3 The selection of suburban municipalities is based on MVG (1997, 2011) for Flanders and Vliegen (2005) for The Nether-lands. Both studies select municipalities applying the same methodology. Suburban municipalities where the urban develop-ment directly connects with the urban development of the regional or large city are retained.4 Education and income were not retained as socio-demographic variables, since comparing these variables between Flanders and The Netherlands entails difficulties. The educational systems (especially in primary and secondary schools) in both regions are organized differently, while the net income of Dutch citizens cannot be compared with the net income of Flemings, since the Dutch pay less in taxes. As a result, the average net income of the Dutch is higher than the average net income of Flemings who, however, pay less for elements such as education and health insurance, in return for paying more taxes.5 This is rather obvious since the Flemish survey does not include respondents younger than six years.
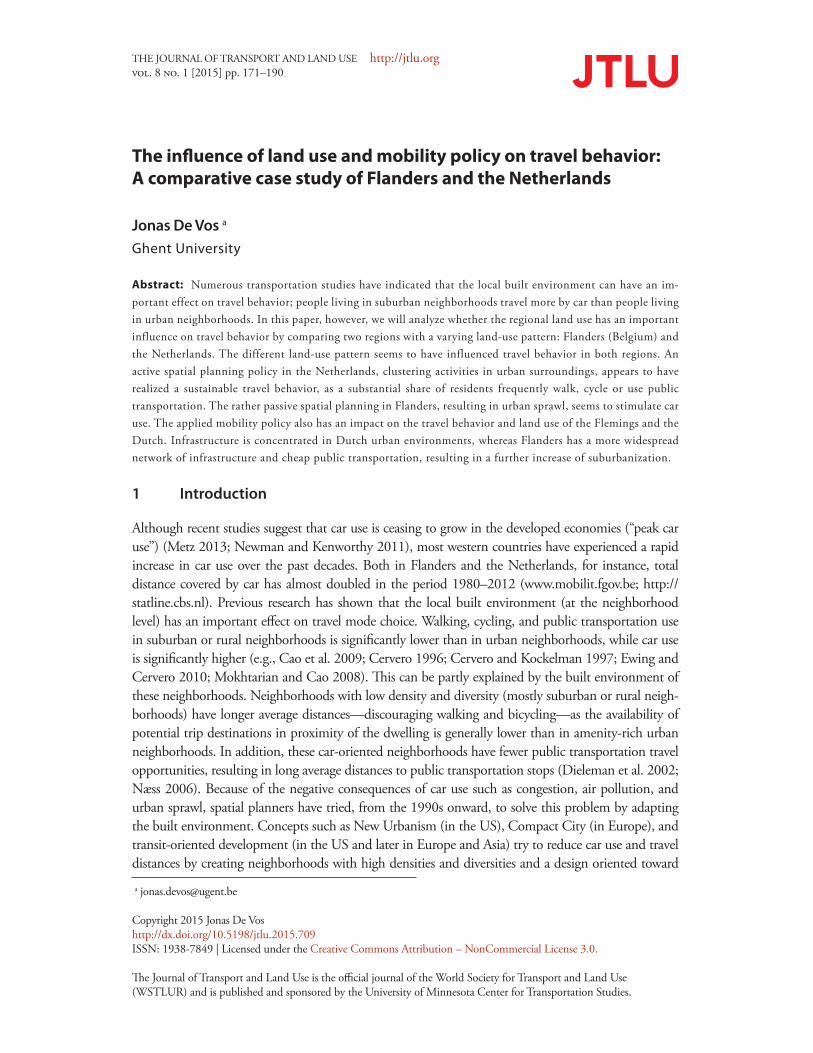
181The influence of land use and mobility policy of travel behavior: Flanders and the Netherlands
in less urbanized locations, while respondents between the age of 20 and 39 tend to live more in larger cities. Household size, household car possession, and driving license possession increase with decreasing levels of urbanization. In the Netherlands, people living in large and regional cities are, in the Dutch sample, slightly underrepresented, while people living in small cities and the countryside are somewhat overrepresented. In the Flemish survey, these differences are negligible.
Table 2: Socio-demographic factors of Flemish and Dutch respondents according to their residential location.
Large
city
Regional
city
Suburb Small
city
Countryside Growth
center
Total
Flanders
Average age (year) 42.3 42.1 40.9 41.7 41.4 N/A 41.6Age distribution 0-19 years 16.8 17.4 20.5 19.2 19.3 N/A 18.9 20-39 years 31.0 28.7 25.7 27.1 26.0 N/A 27.2 40-59 years 28.6 31.1 33.0 32.1 34.3 N/A 32.4 60+ years 23.6 22.8 20.7 21.6 20.4 N/A 21.5Gender (female) 50.0 48.1 47.7 48.2 49.3 N/A 48.8Average household size 2.8 3.1 3.2 3.1 3.2 N/A 3.1Employment statusa
Student 20.9 22.9 24.9 22.7 23.4 N/A 23.1 Employed 54.6 53.4 54.8 54.9 55.5 N/A 54.9 Unemployed 2.9 2.9 2.1 2.3 2.3 N/A 2.3 Retired 21.6 20.8 18.2 20.1 18.9 N/A 19.7Household car possession (>1) 22.6 37.5 45.3 45.6 47.5 N/A 42.4Driving license possessionb 79.7 81.1 86.6 86.6 88.4 N/A 85.9% of respondents 11.8 11.1 13.9 20.6 42.6 N/A 100The Netherlands
Average age (year) 42.3 42.0 43.6 42.6 41.9 40.3 42.2Age distribution 0-19 years 20.3 22.1 21.4 22.9 24.0 24.4 22.4 20-39 years 24.1 20.9 18.8 18.8 18.1 20.7 20.2 40-59 years 30.0 31.2 31.2 31.0 32.0 33.2 31.2 60+ years 25.8 25.8 28.6 27.3 25.8 21.7 26.1Gender (female) 51.8 51.8 52.2 50.8 50.6 50.3 51.1Average household size 2.7 2.9 2.8 3.0 3.1 3.0 2.9Employment statusa
Student 19.7 22.0 19.7 22.3 23.3 21.9 21.7 Employed 56.1 54.5 54.1 52.4 52.7 58.1 54.1 Unemployed 1.6 1.3 1.0 1.0 0.9 1.1 1.2 Retired 22.6 22.1 25.2 24.3 23.1 18.9 23.0Household car possession (>1) 27.3 33.4 37.9 41.0 42.3 36.2 36.7Driving license possessionb 79.3 83.1 82.4 85.7 86.0 81.9 83.5% of respondents 22.8 13.7 7.0 33.5 14.2 8.8 100
a for this variable, respondents younger than 12 were not retained.b for this variable, respondents younger than 18 were not retained.

182 JOURNAL OF TRANSPORT AND LAND USE 8.1
3.2 Travel mode choice
Flemings and the Dutch seem to a have a different modal split (Figure 5); especially car and bicycle use differ considerably. In Flanders, the car is used (for all types of trips) for more than 60% of the trips, while in the Netherlands the modal share of car use lies below 50%. Bicycle use, on the other hand, is noticeably lower in Flanders than in the Netherlands. In Flanders, modal share of the bicycle lies below 17% for all types of trips while in the Netherlands bicycle use is considerably higher (e.g., 21.7, 26.9, and 29.4% for leisure, commute, and shopping trips, respectively). Public transportation use, especially for commuting trips, is higher in the Netherlands. With 21.6% of commuting trips by public transpor-tation, this travel mode is being used more than twice as much in the Netherlands compared with Flanders (where it only accounts for 9.8% of the commute trips). The modal share of public transporta-tion for leisure and shopping trips is also higher in the Netherlands. The share of walking seems to be evenly balanced; only for leisure trips can a difference be noticed in favor of the Netherlands (26.7% in the Netherlands versus 22.1% in Flanders). In sum, the car is by far the dominant travel mode in Flan-ders, while in the Netherlands car alternatives have a considerable share of the modal split. Travel mode choice in the Netherlands is therefore more sustainable, since limited car use reduces both present-day problems, such as congestion, and possible future problems, such as a lack of fossil fuels and global warming.
Figure 5: Travel mode choice in Flanders and the Netherlands for different types of trips.
Travel mode choice in Flanders and the Netherlands can be explained by different factors. The high bicycle use in the Netherlands, for instance, can be explained by differences in culture and mobility policy. Although Flemings—compared with other Europeans—cycle rather frequently, bicycle use in the Netherlands seems a way of life and is deep-rooted in the society (Pelzer 2010; Stoffers and Ooster-huis 2012), resulting in the highest bicycle use of Europe (ECMT 2004). The Dutch mobility policy, devoting a lot of attention to cycling, is one of the reasons for the high rate of bicycle use. In 1975, the Dutch government developed a cycling policy, focusing on the construction of bicycle lanes and parking space for bicycles. Together with the revival of Dutch inner cities in the eighties, bicycle use increased (De la Bruheze and Veraart 1999). In 1990 the “masterplan bicycle” was developed, organizing all kinds of projects to improve bicycle lanes, safety, and parking places and to reduce bicycle theft. Currently, the
Flanders The Netherlands
carpublic transportationbicycleon foot
commute leisure shopping commute leisure shopping
perc
enta
ge o
f trip
s
0
10
20
30
40
50
60
70

183The influence of land use and mobility policy of travel behavior: Flanders and the Netherlands
Dutch government tries to make cycling safer and more attractive by improving the design of bicycle lanes and constructing “bicycle highways” (ECMT 2004).
The high public transportation use in the Netherlands is realized with the help of the ABC policy. Although the implementation of this policy was only partly successful, it resulted in an increase of offices in the proximity of major railway stations. This high density near important public transportation nodes resulted in an increase of public transportation use. Since highly educated people often obtain more specialized jobs, which are generally concentrated in high-density or central business district office parks, these people are more likely to commute long distances and have higher rates of car use (Van Acker and Witlox 2010). A clustering of specialized jobs near railway stations can therefore realize a notable modal shift. This seems to have been the case in the Netherlands (Limtanakool et al. 2006; Schwanen et al. 2002).
The ABC policy is not the only element explaining the high public transportation ridership in the Netherlands. Although the public transportation network is less dispersed and subsidized than in Flan-ders, the limited number of public transportation lines attracts more travelers. In the Netherlands, the emphasis lies on high-quality (i.e., high frequency and high capacity) urban transportation. The Dutch do not focus on expanding their public transportation network but on optimizing their existing net-work—concentrated in and between major cities—so a lot of people can be attracted by just one public transportation line. As a result, a bearing surface exists for offering public transportation with a high frequency and a high capacity, which in turn stimulates further public transportation use. Since urban sprawl is limited in the Netherlands and most people live in dense residential areas, public transportation is relatively easy to organize. In the countryside, where population densities are lower, the bearing surface for offering public transportation is largely absent (MVW 2004).
3.3 Travel behavior according to the residential loaction
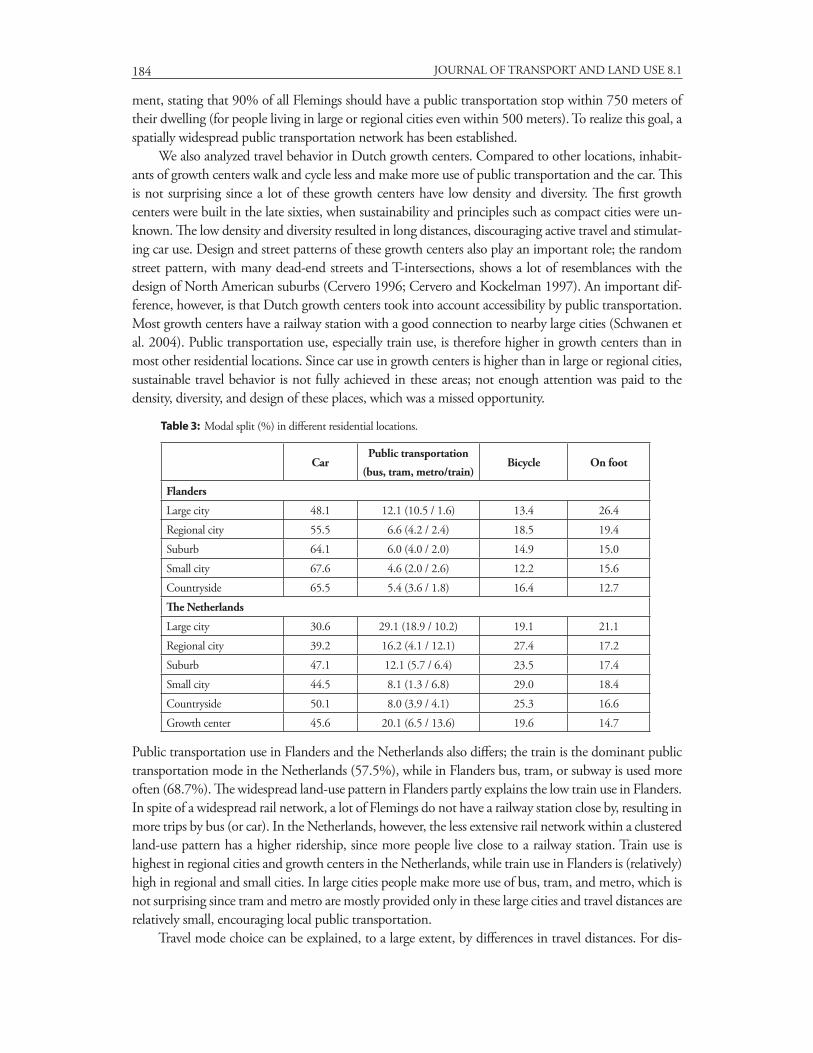
Previous studies have indicated that the built environment and the residential location have an influence on travel behavior. People living in urban neighborhoods travel less by car than people living in subur-ban or rural neighborhoods (e.g., Cao et al. 2009; Cervero 1996; Cervero and Kockelman 1997; Ewing and Cervero 2010; Mohtarian and Cao 2008). Noticeable differences in travel mode choice according to the level of urbanization of municipality can be observed (Table 3). Public transportation and car use in the Netherlands show a logical evolution from large cities to countryside; public transportation use decreases while car use increases. Although cycling and public transportation can be complementary, whereby people reach a public transportation stop by bicycle (e.g., Pucher and Buehler 2008), cycling in Dutch large cities seems to be dealing with competition from public transportation; bicycle use in large cities is lower than in other residential locations. The share of walking is highest in large cities, while in other locations the modal share of walking fluctuates around 17%. In Flanders, the share of walk-ing decreases with decreasing levels of urbanization; large cities have the highest share of respondents walking, while the countryside has the smallest share. Bicycle use seems less subject to competition with public transportation; respondents cycle more in regional cities than in small cities. Since Flemings make less use of public transportation than Dutch citizens, the competition with public transportation is only noticeable in Flemish large cities. Travel behavior in the Flemish countryside is rather remark-able. Respondents living in these locations travel more with car alternatives (except for walking) and less by car than respondents living in small cities. This can be partly explained by the public transportation services in the Flemish countryside. Although public transportation is not used as frequently as in the Netherlands, the public transportation network is more widespread. As a result, most people living in the countryside are able to travel with public transportation (De Vos et al. 2012). This can be explained by the Flemish mobility policy. In 2001 the decree “basic mobility” was ratified by the Flemish parlia-
184 JOURNAL OF TRANSPORT AND LAND USE 8.1
ment, stating that 90% of all Flemings should have a public transportation stop within 750 meters of their dwelling (for people living in large or regional cities even within 500 meters). To realize this goal, a spatially widespread public transportation network has been established.
We also analyzed travel behavior in Dutch growth centers. Compared to other locations, inhabit-ants of growth centers walk and cycle less and make more use of public transportation and the car. This is not surprising since a lot of these growth centers have low density and diversity. The first growth centers were built in the late sixties, when sustainability and principles such as compact cities were un-known. The low density and diversity resulted in long distances, discouraging active travel and stimulat-ing car use. Design and street patterns of these growth centers also play an important role; the random street pattern, with many dead-end streets and T-intersections, shows a lot of resemblances with the design of North American suburbs (Cervero 1996; Cervero and Kockelman 1997). An important dif-ference, however, is that Dutch growth centers took into account accessibility by public transportation. Most growth centers have a railway station with a good connection to nearby large cities (Schwanen et al. 2004). Public transportation use, especially train use, is therefore higher in growth centers than in most other residential locations. Since car use in growth centers is higher than in large or regional cities, sustainable travel behavior is not fully achieved in these areas; not enough attention was paid to the density, diversity, and design of these places, which was a missed opportunity.
Public transportation use in Flanders and the Netherlands also differs; the train is the dominant public transportation mode in the Netherlands (57.5%), while in Flanders bus, tram, or subway is used more often (68.7%). The widespread land-use pattern in Flanders partly explains the low train use in Flanders. In spite of a widespread rail network, a lot of Flemings do not have a railway station close by, resulting in more trips by bus (or car). In the Netherlands, however, the less extensive rail network within a clustered land-use pattern has a higher ridership, since more people live close to a railway station. Train use is highest in regional cities and growth centers in the Netherlands, while train use in Flanders is (relatively) high in regional and small cities. In large cities people make more use of bus, tram, and metro, which is not surprising since tram and metro are mostly provided only in these large cities and travel distances are relatively small, encouraging local public transportation.
Travel mode choice can be explained, to a large extent, by differences in travel distances. For dis-
Table 3: Modal split (%) in different residential locations.
CarPublic transportation
(bus, tram, metro/train)Bicycle On foot
Flanders
Large city 48.1 12.1 (10.5 / 1.6) 13.4 26.4
Regional city 55.5 6.6 (4.2 / 2.4) 18.5 19.4
Suburb 64.1 6.0 (4.0 / 2.0) 14.9 15.0
Small city 67.6 4.6 (2.0 / 2.6) 12.2 15.6
Countryside 65.5 5.4 (3.6 / 1.8) 16.4 12.7
The Netherlands
Large city 30.6 29.1 (18.9 / 10.2) 19.1 21.1
Regional city 39.2 16.2 (4.1 / 12.1) 27.4 17.2
Suburb 47.1 12.1 (5.7 / 6.4) 23.5 17.4
Small city 44.5 8.1 (1.3 / 6.8) 29.0 18.4
Countryside 50.1 8.0 (3.9 / 4.1) 25.3 16.6
Growth center 45.6 20.1 (6.5 / 13.6) 19.6 14.7

185The influence of land use and mobility policy of travel behavior: Flanders and the Netherlands
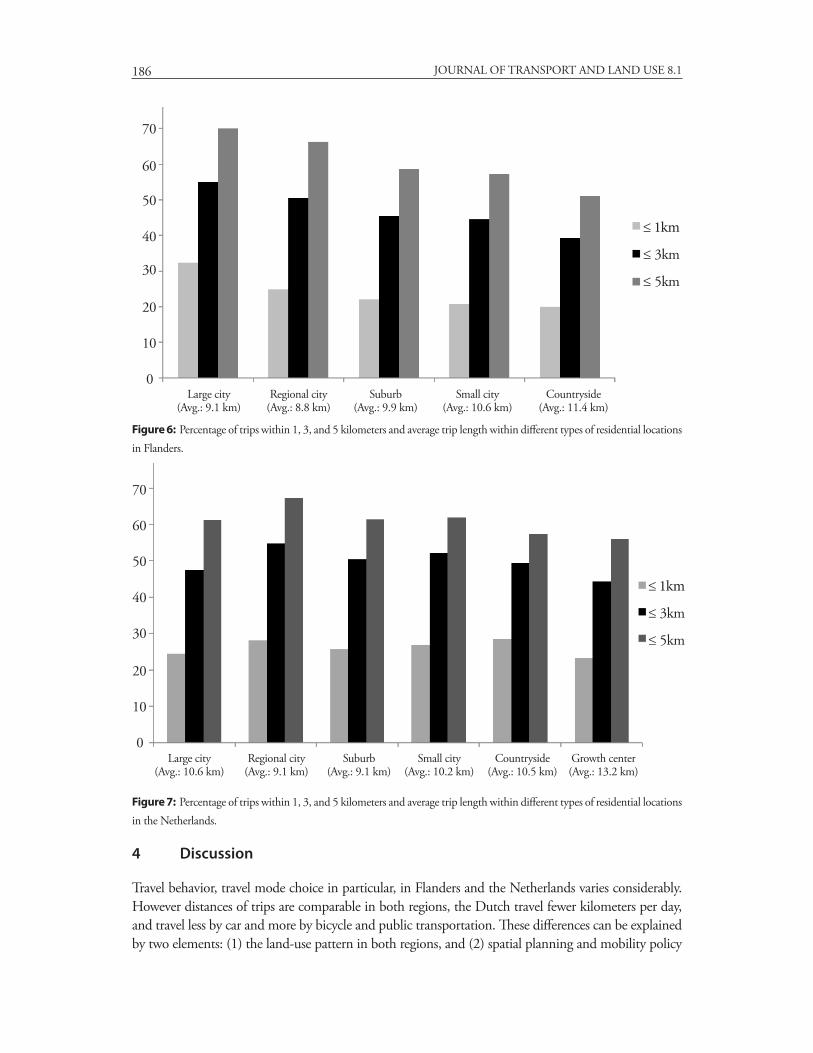
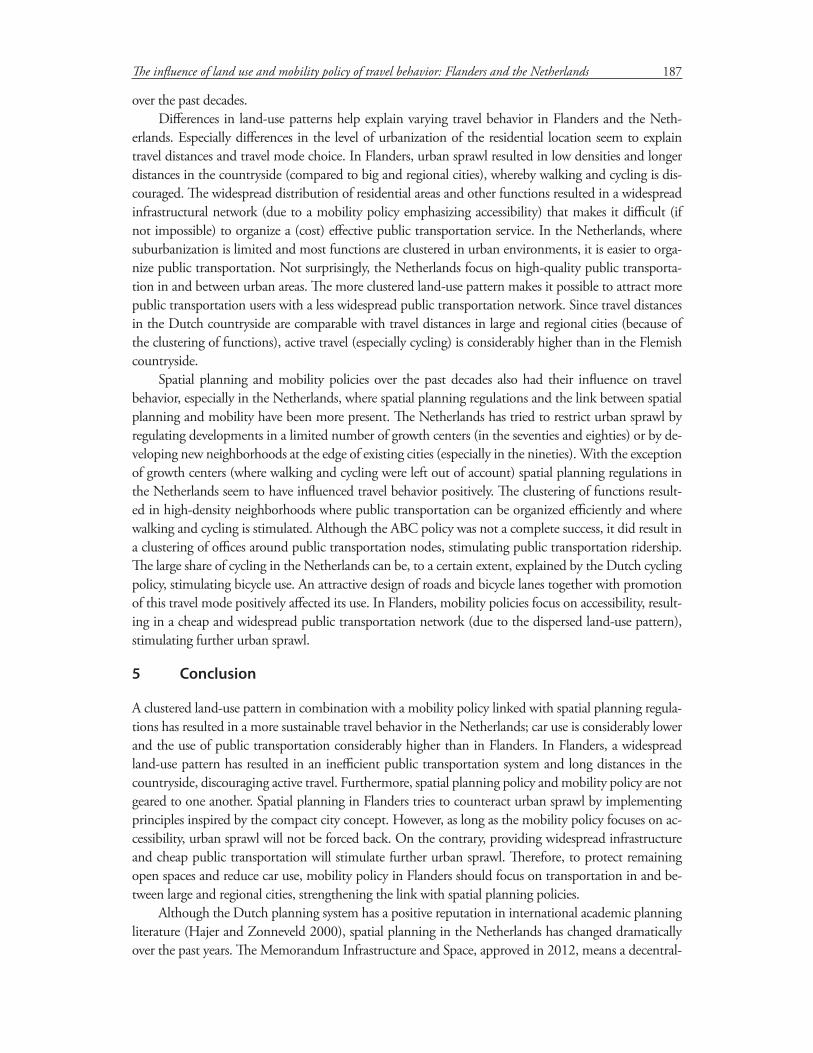
tances longer than 10 kilometers, for instance, walking and cycling is not feasible, increasing car and public transportation use. Although the total average amount of kilometers traveled per day per person is higher in Flanders (50.6 kilometers) than in the Netherlands (39.4 kilometers)—due to a higher average number of trips per day in Flanders (3.8 trips per day, versus 2.8 trips per day in the Nether-lands)—average travel distances in Flanders and the Netherlands are rather similar (10.4 km and 11.0 km, respectively). This might be partly explained by the fact that Dutch respondents are able to perform more activities at one trip destination than Flemings, since activities are more clustered. Although this can still imply short trips at the destination of a longer trip (for instance, when people walk from one shop to another in a city center), respondents might perceive this as just one trip (e.g., from home to city center and back). However, differences in travel distances between different residential locations can be noticed. In Flanders, the longest average distances (11.4 km) are traveled in the countryside, while shortest average travel distances occur in regional and large cities (8.8 km and 9.1 km, respectively). In the Netherlands, the longest average distances are traveled in growth centers (13.2 km), while average distances in other locations are on comparable levels, around 10 km. In Flanders, average distances increase when levels of urbanization decrease. In the Netherlands, however, average distances are (with exception of growth centers) on comparable levels. Figure 6 shows that in Flemish large cities, a lot of trips can be covered on foot or by bicycle. More than 30% of the trips lie within reasonable walking distance (≤ 1 km), more than 50% within reasonable cycling distance (≤ 3 km) and 70% of the trips can easily be covered with urban public transportation (≤ 5 km). The number of short trips decreases with decreasing levels of urbanization. In the countryside, only 20% of the trips lie within reasonable walking distance, less than 40% within cycling distance, and around 50% within reasonable public transportation distance. In the Netherlands, the situation is different; for all residential locations (in lesser extent for growth centers) trips within reasonable walking distance fluctuate around 25%, within reasonable cycling distance around 50%, and within reasonable public transportation distance around 60% (Figure 7). The Dutch spatial planning regulations, restricting urban sprawl and clustering activi-ties, seem to have resulted in travel distances in the countryside that are no longer than those in large or regional cities. These differences can help explain differences in travel mode choice. Shorter distances in Flemish large and regional cities partly explain the larger share of active travel (especially walking) com-pared to smaller cities and the countryside. In the Netherlands, however, the share of active travel does not decrease much when the level of urbanization decreases, possibly due to small differences in average distances between varying Dutch residential locations (in addition to the feasible competition between active travel (especially bicycling) and public transportation in large Dutch cities). In Flanders, car use increases with decreasing levels of urbanization, due to increasing average distances. In the Netherlands, however, car use in small cities, suburbs, and the countryside is considerably lower than in their Flemish counterparts, since average distances and locations within walking, cycling, and public transportation distances are comparable with these of Dutch large and regional cities.
186 JOURNAL OF TRANSPORT AND LAND USE 8.1
Figure 6: Percentage of trips within 1, 3, and 5 kilometers and average trip length within different types of residential locations in Flanders.
Figure 7: Percentage of trips within 1, 3, and 5 kilometers and average trip length within different types of residential locations in the Netherlands.
4 Discussion
Travel behavior, travel mode choice in particular, in Flanders and the Netherlands varies considerably. However distances of trips are comparable in both regions, the Dutch travel fewer kilometers per day, and travel less by car and more by bicycle and public transportation. These differences can be explained by two elements: (1) the land-use pattern in both regions, and (2) spatial planning and mobility policy
0
10
20
30
40
50
60
70
Large city(Avg.: 9.1 km)
Regional city(Avg.: 8.8 km)
Suburb(Avg.: 9.9 km)
Small city(Avg.: 10.6 km)
Countryside(Avg.: 11.4 km)
≤ 1km
≤ 3km
≤ 5km
0
10
20
30
40
50
60
70
Large city(Avg.: 10.6 km)
Regional city(Avg.: 9.1 km)
Suburb(Avg.: 9.1 km)
Small city(Avg.: 10.2 km)
Countryside(Avg.: 10.5 km)
≤ 1km
≤ 3km
≤ 5km
Growth center(Avg.: 13.2 km)
187The influence of land use and mobility policy of travel behavior: Flanders and the Netherlands
over the past decades. Differences in land-use patterns help explain varying travel behavior in Flanders and the Neth-
erlands. Especially differences in the level of urbanization of the residential location seem to explain travel distances and travel mode choice. In Flanders, urban sprawl resulted in low densities and longer distances in the countryside (compared to big and regional cities), whereby walking and cycling is dis-couraged. The widespread distribution of residential areas and other functions resulted in a widespread infrastructural network (due to a mobility policy emphasizing accessibility) that makes it difficult (if not impossible) to organize a (cost) effective public transportation service. In the Netherlands, where suburbanization is limited and most functions are clustered in urban environments, it is easier to orga-nize public transportation. Not surprisingly, the Netherlands focus on high-quality public transporta-tion in and between urban areas. The more clustered land-use pattern makes it possible to attract more public transportation users with a less widespread public transportation network. Since travel distances in the Dutch countryside are comparable with travel distances in large and regional cities (because of the clustering of functions), active travel (especially cycling) is considerably higher than in the Flemish countryside.
Spatial planning and mobility policies over the past decades also had their influence on travel behavior, especially in the Netherlands, where spatial planning regulations and the link between spatial planning and mobility have been more present. The Netherlands has tried to restrict urban sprawl by regulating developments in a limited number of growth centers (in the seventies and eighties) or by de-veloping new neighborhoods at the edge of existing cities (especially in the nineties). With the exception of growth centers (where walking and cycling were left out of account) spatial planning regulations in the Netherlands seem to have influenced travel behavior positively. The clustering of functions result-ed in high-density neighborhoods where public transportation can be organized efficiently and where walking and cycling is stimulated. Although the ABC policy was not a complete success, it did result in a clustering of offices around public transportation nodes, stimulating public transportation ridership. The large share of cycling in the Netherlands can be, to a certain extent, explained by the Dutch cycling policy, stimulating bicycle use. An attractive design of roads and bicycle lanes together with promotion of this travel mode positively affected its use. In Flanders, mobility policies focus on accessibility, result-ing in a cheap and widespread public transportation network (due to the dispersed land-use pattern), stimulating further urban sprawl.
5 Conclusion
A clustered land-use pattern in combination with a mobility policy linked with spatial planning regula-tions has resulted in a more sustainable travel behavior in the Netherlands; car use is considerably lower and the use of public transportation considerably higher than in Flanders. In Flanders, a widespread land-use pattern has resulted in an inefficient public transportation system and long distances in the countryside, discouraging active travel. Furthermore, spatial planning policy and mobility policy are not geared to one another. Spatial planning in Flanders tries to counteract urban sprawl by implementing principles inspired by the compact city concept. However, as long as the mobility policy focuses on ac-cessibility, urban sprawl will not be forced back. On the contrary, providing widespread infrastructure and cheap public transportation will stimulate further urban sprawl. Therefore, to protect remaining open spaces and reduce car use, mobility policy in Flanders should focus on transportation in and be-tween large and regional cities, strengthening the link with spatial planning policies.
Although the Dutch planning system has a positive reputation in international academic planning literature (Hajer and Zonneveld 2000), spatial planning in the Netherlands has changed dramatically over the past years. The Memorandum Infrastructure and Space, approved in 2012, means a decentral-

188 JOURNAL OF TRANSPORT AND LAND USE 8.1
ization and liberalization of spatial planning. Furthermore, the strong link between spatial planning and mobility, one of the reasons for sustainable travel behavior currently, is only present to a limited degree. Hopefully, this will not result in a wave of suburbanization and an increase in car use.
References
Albrechts, L. 1999. Planners as catalysts and initiators of change. The new structure plan for Flanders. European Planning Studies 7(5): 587–603.
Albrechts, L., P. Healey, and K. R. Kunzmann. 2003. Strategic spatial planning and regional governance in Europe. Journal of the American Planning Association 69(2): 113–129.
Allaert, G. 2008. Ruimte en planning. Van planningstheorie tot de Vlaamse planningspraktijk. Ghent: Aca-demia Press.
Banister, D. 2008. The sustainable mobility paradigm. Transport Policy 15(2): 73–80.Bontje, M. 2001. The challenge of planned urbanization. Doctoral dissertation, Amsterdam study for
the Metropolitan Environment, Department of Geography and Planning, University of Amsterdam.Bouckaert, B., and T. De Waele. 2000. Ruimtelijke ordening en stedenbouw in het Vlaamse Gewest. Ghent:
Mys and Breesch. Boussauw, K., G. Allaert, and F. Witlox. 2013. Colouring inside what lines? Interference of the urban
growth boundary and the political–administrative border of Brussels. European Planning Studies 21(10): 1509–1527.
Cervero, R. 1996. Traditional neighborhoods and commuting in the San Francisco Bay Area. Transpor-tation 23(4): 373–394.
Cervero, R., and K. Kockelman. 1997. Travel demand and the 3Ds: Density, diversity and design. Transportation Research Part D 2(3): 199–219.
De Block, G., and J. Polasky. 2011. Light railways and the rural-urban continuum: technology, space and society in late nineteenth-century Belgium. Journal of Historical Geography 37(3): 312–328.
De Decker, P. 2001. Dient de Vlaamse gaai het RSV te lezen? Over duurzaamheid, sociale bijziendheid en eenheidsdenken in de ruimtelijke planning. Ruimte & Planning 21(1): 73–105.
De Decker, P. 2011. Understanding housing sprawl: The case of Flanders, Belgium. Environment and Planning A 43(7): 1634–1654.
de Geyter, X., G. Bekaert, L. de Boeck, and V. Patteeuw. 2002. After-sprawl. Onderzoek naar de he-dendaagse stad. Rotterdam: NAi Uitgevers; Antwerpen: deSingel Internationaal Kunstcentrum.
De la Bruhèze, A. A., and F. Veraart. 1999. Fietsverkeer in praktijk en beleid in de twintigste eeuw. The Hague: Ministry of Transport, Public Works and Water Management.
De Vos, J., B. Derudder, V. Van Acker, and F. Witlox. 2012. Reducing car use: Changing attitudes or relocating? The influence of residential dissonance on travel behavior. Journal of Transport Geography 22: 1–9.
De Vos, J. and F. Witlox. 2013. Transportation policy as spatial planning tool; reducing urban sprawl by increasing travel costs and clustering infrastructure and public transportation. Journal of Transport Geography 33: 117–125.
Dieleman, F. M., M. Dijst, and G. Burghouwt. 2002. Urban form and travel behaviour: Micro-level household attributes and residential context. Urban Studies 39(3): 507–527.
Dieleman, F. M., M. J. Dijst, and T. Spit. 1999. Planning the compact city: The Randstad Holland experience. European Planning Studies 7(5): 605–621.
Dijst, M. J. 1997. Spatial policy and passenger transportation. Netherlands Journal of Housing and the Built Environment 12(1): 91–111.
European Conference of Ministers of Transport (ECMT). 2004. National policies to promote cycling.

189The influence of land use and mobility policy of travel behavior: Flanders and the Netherlands
Ljubljana 27 April 2004.Faludi, A. and A. Van der Valk. 1990. De Groeikernen als Hoekstenen van het Nederlands Ruimtelijke
Ordeningsdoctrine. Assen/Maastricht: van Gorcum.Friedman, B., S. P. Gordon, and J. B. Peers. 1994. Effect of neotraditional neighborhood design on
travel characteristics. Transportation Research Record 1466: 63–70.Hajer, M., and W. Zonneveld. 2000. Spatial planning in the network society—Rethinking the prin-
ciples of planning in the Netherlands. European Planning Studies 8(3): 337–355.Kesteloot, C., and F. De Maesschalk. 2001. Anti-urbanism in Flanders: The political and social conse-
quences of a spatial class struggle strategy. Belgeo 1–2: 41–62.Limtanakool, N., M. Dijst, and T. Schwanen. 2006. The influence of socioeconomic characteristics,
land use, and travel time considerations on mode choice for medium- and longer-distance trips. Journal of Transport Geography 14(5): 327–341.
Limtanakool, N., M. Dijst, and T. Schwanen. 2009. Developments in the Dutch urban system on the basis of flows. Regional Studies 43(2): 179–196.
Metz, D. 2013. Peak car and beyond: the fourth era of travel. Transport Reviews 33(3): 255–270.Ministerie van Infrastructuur en Milieu (MIM). 2012. Ontwerp Structuurvisie Infrastructuur en Ruimte.
Nederland concurrerend, bereikbaar, leefbaar en veilig. The Hague: Ministry of Infrastructure and Environment.
Ministerie van de Vlaamse Gemeenschap (MVG). 1997. Ruimtelijk Structuurplan Vlaanderen. Brussels: Ministry of the Flemish Community.
Ministerie van de Vlaamse Gemeenschap (MVG). 2011. Ruimtelijk Structuurplan Vlaanderen (gecoör-dineerde versie). Brussels: Ministry of the Flemish Community.
Ministerie van de Vlaamse Gemeenschap (MVG). 2003. Mobiliteitsplan Vlaanderen. Naar een duurzame mobiliteit in Vlaanderen. Beleidsvoornemens. Brussels: Ministry of the Flemish Community.
Ministerie van Volkshuisvesting en Ruimtelijke Ordening (MVRO). 1960. Eerste Nota Ruimtelijke Or-dening. The Hague: Ministry of Housing and Spatial Planning.
Ministerie van Volkshuisvesting en Ruimtelijke Ordening (MVRO). 1966. Tweede Nota Ruimtelijke Ordening. The Hague: Ministry of Housing and Spatial Planning.
Ministerie van Volkshuisvesting en Ruimtelijke Ordening (MVRO). 1974. Derde Nota Ruimtelijke Or-dening. The Hague: Ministry of Housing and Spatial Planning.
Ministerie van Volkshuisvesting, Ruimtelijke Ordening en Milieubeheer (MVROM). 1988. Vierde Nota Ruimtelijke Ordening. The Hague: Ministry of Housing, Spatial Planning and the Environment.
Ministerie van Volkshuisvesting, Ruimtelijke Ordening en Milieubeheer (MVROM). 2001. Vijfde Nota Ruimtelijke Ordening: Ruimte maken, Ruimte delen. The Hague: Ministry of Housing, Spatial Plan-ning and the Environment.
Ministerie van Volkshuisvesting, Ruimtelijke Ordening en Milieubeheer (MVROM). 2004. Nota Rui-mte. The Hague: Ministry of Housing, Spatial Planning and the Environment.
Ministerie van Verkeer en Waterstaat (MVW). 2004. Nota Mobiliteit. Naar een betrouwbare en voor-spelbare bereikbaarheid. The Hague: Ministry of Transport, Public Works and Water Management.
Mougenot, C. 1988. Promoting the single-family house in Belgium: The social construction of model housing. International Journal of Urban and Regional Research 12(4): 531–549.
Newman, P. and J. Kenworthy. 2011. Peak car use: Understanding the demise of automobile depen-dence. World Transport Policy and Practice 17(2): 31–42.
Næss, P. 2006. Accessibility, activity participation and location of activities: Exploring the links between residential location and travel behaviour. Urban Studies 43(3): 627–652.
Pelzer, P. 2010. Bicycling as a way of life: A comparative case study of bicycle culture in Portland, OR

190 JOURNAL OF TRANSPORT AND LAND USE 8.1
and Amsterdam. Paper presented at the 7th Cycling and Society Symposium, Oxford, July.Priemus, H. 1998. Contradictions between Dutch housing policy and spatial planning. Tijdschrift voor
Economische en Sociale Geografie 89(1): 31–43.Pucher, J., and R. Buehler. 2008. Making cycling irresistible: Lessons from the Netherlands, Denmark
and Germany. Transport Reviews 28(4): 495–528.Scheers, J. 2006. Spatial planning in the economic core of Europe: The transition from land use plan-
ning to spatial structure planning in Flanders. In Adams, N., J. Alden, and N. Harris (Eds.), Regional Development and Spatial Planning in an Enlarged European Union. Aldershot: Ashgate.
Schwanen, T., M. Dijst, and F.M. Dieleman. 2002. A microlevel analysis of residential context and travel time. Environment and Planning A 34(8): 1487–1507.
Schwanen, T., M. Dijst, and F. M. Dieleman. 2004. Policies for urban form and their impact on travel: The Netherlands experience. Urban Studies 41(3): 579–603.
Schwanen, T., and P. L. Mokhtarian. 2005. What affects commute mode choice: Neighborhood physi-cal structure or preferences toward neighborhoods? Journal of Transport Geography 13(1): 83–99.
Stoffers, M., and H. Oosterhuis. 2012. Cycling as heritage: representing the history of cycling in the Netherlands. Paper presented at the 9th International Conference on the History of Transport, Ber-lin, October.
Terhorst, P., and J. van de Ven. 2001. Territorialisation of the state and urban trajectories: Amsterdam and Brussels compared. In G. Dijkink and H. Knippenberg (Eds.), The Territorial Factor. Amster-dam: Political Geography in a Globalising World.
Van Acker, V., and F. Witlox. 2010. Car ownership as a mediating variable in car travel behavior research using a structural equation modelling approach to identify its dual relationship. Journal of Transport Geography 18(1): 65–74.
Van Der Burg, A. J., and F. M. Dieleman. 2004. Dutch urbanisation policies: from ‘compact city’ to “urban network.” Tijdschrift voor Economische en Sociale Geografie 95(1): 108–116.
van der Cammen, H. and L. de Klerk. 2003. Ruimtelijke ordening. Van grachtengordel tot Vinex-wijk. Utrecht: Het Spectrum.
Verhetsel, A., I. Thomas, and M. Beelen. 2010. Commuting in Belgian metropolitan areas: The power of the Alonso-Muth model. Journal of Transport and Land Use 2(3/4): 109–131.
Verhetsel, A., and F. Witlox. 2006. Children and housing: “Only the best is good enough.” Some evi-dence from Belgium. Childhood. A Global Journal of Child Research 13(2): 205–224.
Vliegen, M. 2005. Grootstedelijke agglomeraties en stadsgewesten afgebakend. Voorburg/Heerlen: Centraal Bureau voor de Statistiek.
Voets, J., B. De Peuter, B Vandekerckhove, D. Broeckaert, M. Le Roy, P. Maes, P. De Decker, W. Ber-voets, R. Van Der Heijden, and P. Blummel. 2010. Evaluerend onderzoek naar de effectiviteit van de uitvoering van het ruimtelijk beleid in Vlaanderen. Brussels: Ministry of the Flemish Community
Witlox, F. 2007. Evaluating the reliability of reported distance data in urban travel behaviour analysis. Journal of Transport Geography 15(3): 172–183.