Embed Size (px)
Citation preview
JOURNAL OF APPLIED SCIENCES RESEARCH
ISSN: 1819-544X Published BY AENSI Publication EISSN: 1816-157X http://www.aensiweb.com/JASR
2017 November; 13(8): pages 16-23 Open Access Journal
To Cite This Article: Muhammad Yusuf Abduh, Janus Manabu Ono, Maulidia Khairani, Robert Manurung, The Influence of Light Intensity on the Protein Content of Azolla Microphylla and Pre-treatment with Saccharomyces cerevisiae to Increase Protein Recovery.
23-16 Pages: ;)8(13. esearchRciences Spplied Aournal of J .7201
The Influence of Light Intensity on the Protein Content of Azolla Microphylla and Pre-treatment with Saccharomyces cerevisiae to Increase Protein Recovery
1Muhammad Yusuf Abduh, 1Janus Manabu Ono, 1Maulidia Khairani, 1Robert Manurung 1Department of Bioengineering, School of Life Sciences and Technology, Institut Teknologi Bandung, Bandung, Indonesia
Received July 2017; Accepted 10th October 2017
Address For Correspondence: Muhammad Yusuf Abduh, Department of Bioengineering, School of Life Sciences and Technology, Institut Teknologi Bandung, 40132. Bandung. Indonesia. Phone: +62-22-2511575l; E-mail: [email protected]
Copyright © 2017 by authors and American-Eurasian Network for Scientific Information (AENSI Publication).
er the Creative Commons Attribution International License (CC BY).This work is licensed undhttp://creativecommons.org/licenses/by/4.0/
ABSTRACT
This study was carried out to examine the effect of light intensity to the growth and protein content of
using three different type of 2465 W/m-ht intensity was varied from 10. The ligAzolla microphyllashading materials; vinyl, polyethylene and 50% shade net. The protein content of Azolla microphylla was extracted at different pH (2-12) and pre-treatment with Saccharomyces cerevisiae. The highest relative
was cultivated using a transparent Azolla microphyllawas obtained when 1-d1-growth rate of 0.18 g.g Azolla microphylla. At this condition, 2vinyl plastic with an average maximum light intensity of 465 W/m
had a doubling time of 3.9 d with a protein content of 30 wt%, dry basis. The highest protein recovery of 28 wt%, dry basis was obtained when Azolla microphylla was pre-treated with Saccharomyces cerevisiae
for 17 h prior to extraction with sodium hydroxide (pH 12) or hydrochloric acid (pH 2).
KEYWORDS: Azolla microphylla; Light Intensity; Protein; Saccharomyces cerevisiae; Extraction;
INTRODUCTION
Azolla spp. is a small aquatic fern (1-5 cm) which has a high biomass productivity and able to grow in
varied environments globally. Azolla spp. also has a high rate of N fixation and lives often in symbiosis with
cyanobacteria Anabena azollae which has been extensively used for N fertilisation of paddy crops and green
manure [9]. Azolla spp. is also known for its high protein content and can be easily cultivated for a sustainable
alternative of protein source [1].
A. microphylla is among the species of Azolla that has the highest biomass productivity and protein content.
According to the study by Arora and Singh [1], A. microphylla has a biomass productivity of 12 ton.ha-1yr-1 (dry
basis). The protein content of A. microphylla was reported to be in the range of 28- 32 wt%, dry weight as
reported by Sanginga and Van Hove [11]. It was also shown in a similar study that A. microphylla contain a
variety and high amount essential amino acids in comparison to other species with leucine (2.3 wt%, d.w.).
The protein content of A. microphylla may be increased by altering the light intensity during the cultivation
of A. microphylla. Optimum light intensity is crucial for the growth kinetic and biomass development.
According to a study reported by Cary and Weerts [5], increasing light intensity resulted in an increase of
17 Abduh et al., 2017/ Journal of Applied Sciences Research. 13(8) November 2017, Pages: 16-23
growth kinetics and biomass content of A. pinnata dan A. filiculoides. Introducing shading during the cultivation
which resulted in plants receiving 30% of greenhouse sunlight reduced the biomass yield which was less than
one-third those plants that were not subjected to shading. In another study by Sarkar [12], the chlorophyll,
organic carbon, nitrogen and phosphorus content of A. pinnata were higher when the biomass was cultivated at a
higher light intensity of 1200 mol.m-2s-1 than that of 700 mol.m-2s-1.
The protein content in A. microphylla may be extracted by using chemical solvents such acidic, basic or
buffer solution or using aqueous enzymatic extraction [4]. According to the previous study by Widyarani et al
[22], the extraction of protein from dehulled rubber seeds using a basic solution resulted in a protein recovery of
50-71 %. The protein yield and recovery from A. microphylla may also be increased by pre-treating the biomass
with a biological agent during a fermentation process. According to a study by Chinma et al. [6], fermentation
of wheat with yeast increased the protein yield from 10.2 to 23.3 %.
Hence, this study aimed to investigate the effect of light intensity on the growth and protein content of A.
microphylla. The yield and protein recovery after the extraction process was also investigated by pre-treating the
biomass with S. Cerevisiae and extraction of protein at different pH.
2. Objectives:
The objectives of this study were to investigate the effect of light intensity on the growth and protein
content of A. microphylla and the effect of pre-treatment with Saccharomyces cerevisiae to increase protein
recovery.
MATERIALS AND METHODS
A. microphylla plant used in this study was received in October 2015 from Cimahi, West Java, Indonesia.
The received plant was cultivated and sub-cultured periodically using AB mix hydroponic medium
(Cibeuniying, Bandung). Saccharomyces cerevisiae used in this study was obtained from a commercial yeast
(Fermipan) purchased at Borma (Rancabolang, Bandung). Hydrochloric acid, sodium hydroxide, potassium
phosphate buffer were obtained from School of Life Sciences and Technology, Institut Teknologi Bandung.
Cultivation of Azolla microphylla:
A. microphylla plant was cultivated in plastic containers (16.5 x 11 x 5 cm) containing 0.4 L of standard AB
mix hydroponic medium [17] with a plant density of 60 g/m2. The pH of the medium was set at 5.5 and the
medium in the containers was replaced with a fresh medium every 5 d. The containers were placed under a
metal frame (203 x 70 x 80 cm) covered with different type of shading materials; vinyl, polyethylene and 50%
shade net that would allowed different light intensity. The plant was harvested in the morning (08.00-09.00
a.m.) and weighed before dried in an oven at 103ᴼC until a constant weight was obtained. The cultivation of A.
microphylla was carried out for 10 d. Light intensity, relative humidity as well as bulk and medium temperature
were measured three times daily (08.00 a.m., 12.00 p.m. and 16.00 p.m.) throughout the study.
Extraction of Protein:
Biomass of A. microphylla was shade dried for 3 d followed by oven drying at 60 ᴼC until the moisture
content of the biomass was less than 5%. The biomass was then ground using a coffee grinder and filtered with
60 mesh to produce a powdered biomass. Extraction of protein from the A. microphylla powder was carried out
at three different pH particularly pH 2, 7 and 12. Approximately 4 g of A. microphylla powder was weighed and
dissolved in 40 ml of either 0.1 M HCl, 0.2 M potassium phosphate buffer containing 0.5 M NaCl or 0.1 M
NaOH in a 100 ml Erlenmeyer flask. The flask was mixed using a shaker at 110 rpm for 1 h at 25 ᴼC. The
mixed solution was then centrifuged twice at 1520 x g for 20 min before filtered with a filter paper. The
supernatant was frozen using a freeze dryer.
Analytical methods:
Moisture content in the biomass of A. microphyll was determined by drying the sample in an oven at 103 ᴼC
overnight until a constant weight was obtained and calculated using Eq. (1).
Moisture content (wt%) = (Fresh weight (g) – dry weight (g))/ fresh weight (g) x 100% (1)
The chlorophyll content of A. microphylla was determined using the methods suggested by Wintermans and
De Mots [21]. Approximately 0.1 g fresh biomass of A. microphylla was ground and extracted with 10 ml of
ethanol (96%) in dark conditions for 15 min. The mixture was then filtered with a filter paper (Whatman no. 1).
The chlorophyll content in the filtrate was determined by measuring the absorbance at 649 and 665 nm using a
spectrophotometer. The concentration of chlorophyll a, chlorophyll b and total chlorophyll was calculated using
the following equation as suggested by Winterman and De Mots [21].
18 Abduh et al., 2017/ Journal of Applied Sciences Research. 13(8) November 2017, Pages: 16-23
Chlorophyll a (mg/l) = 13.7 x A665 – 5.76 x A649
Chlorophyll b (mg/l) = 25.8 x A649 – 7. 60 x A665
Total chlorophyll (mg/l) = 6.10 x A665 – 20.0 x A649 (2)
where A649 is the absorbance at the wavelength of 649 nm and A665 is the absorbance at the wavelength of
665 nm . The concentration of chlorophyll in mg/l was converted into dry weight percentage using Eq. (3).
Chlorophyll content (wt%, d.w.) = chlorophyll (mg/l) / (10000 x (1-MC)) x 100% (3)
Where MC is the moisture content of fresh biomass in wt%.
The lignocellulose content of the samples was determined using a Chesson-Datta method [7]. The protein
content of the sample was analyzed by Kjedahl method whereas the fat content of the sample was analyzed by
using a Soxhlet extraction method (SNI-01-2891-1992). The analyses were carried out at the Analytical
Laboratory, University of Padjajaran, Jatinangor.
Data analysis:
The relative growth rate (RGR) of A. microphylla was determined using Eq. (4) whereas the doubling time
was calculated using Eq. (5).
Relative growth rate (g.g-1d-1) = (ln Wt – ln Wo)/t (4)
Where Wt is the final dry weight of the sample (g) and Wo is the initial dry weight of the sample (g).
Doubling time (d) = ln 2/Relative growth rate (g.g-1d-1) (5)
The percentage of protein recovery was calculated by comparing the amount of extracted protein with the
initial amount of protein as shown in Eq. (6).
Protein recovery (%) = mass of extracted protein (g)/mass of total protein (g) (6)
The productivity of biomass was estimated based on the dry weight of A. microphylla obtained at the end of
the cultivation period (10 d) in a container with a surface area of 0.01815 m2.
Assuming that the biomass can be harvested every 10 d (36 times in a year) and the amount of biomass
produced in a container of 0.01815 m2 was approximately equivalent to that cultivation area of 1 ha, the biomass
productivity can be estimated by Eq. (7).
Productivity of biomass (ton.ha-1yr-1) = dry weight of biomass (ton) x 10000/0.01815 (ha-1) x 36 (yr-1) (7)
Productivity of total protein contained in the biomass was estimated based on the total protein content in the
biomass multiply with the productivity of biomass whereas the productivity of extracted protein was estimated
based on the productivity of total protein multiply with the percentage of protein recovery as shown in the
following equations.
Productivity of total protein (ton.ha-1yr-1) = total protein content (wt%, d.w.) x productivity of biomass (ton.ha-
1yr-1) (8)
Productivity of extracted protein (ton.ha-1yr-1)=protein recovery (wt%, d.w.) x productivity of total protein
(ton.ha-1yr-1) (9)
RESULTS AND DISCUSSION
Effect of light intensity on the growth and protein content of A. microphylla:
The cultivation of A. microphylla in this study was carried out in plastic containers containing AB mix
hydroponic medium. The containers were covered with different shading materials particularly transparent
vinyl, polyethylene and 50% shade net. The containers were placed in an open environment with a surrounding
temperature of 27 - 32 ᴼC as shown in Table 1. The medium temperature was slightly lower than the
surrounding temperature and varied from 25 - 30 ᴼC. These values were within the range of optimum
temperature for the cultivation of A. microphylla which lies in the range 18 – 28 ᴼC as reported by Tuan and
Thuyet [14].
19 Abduh et al., 2017/ Journal of Applied Sciences Research. 13(8) November 2017, Pages: 16-23
Table 1: Microclimate conditions for the cultivation of A. microphylla under different shading materials
Material Surrounding temperature (ᴼC)
Medium temperature (ᴼC) Relative humidity (%)
Vinyl 27-31 25-29 65-70
Polyethylene 28-32 25-30 62-70
Shade net 50% 28-32 25-28 61-71
A previous study by Tung and Watanabe [15] reported that exposure of Azolla to 30 ᴼC (day)/29 ᴼC (night)
range decreased the heterocyst frequency of Anabena which affects the nitrogen-fixing ability of the association
in comparison to growth at 28 ᴼC/20 ᴼC. Cultivation of Azolla at 37 ᴼC/29 ᴼC also caused the biomass to stop
growing after two weeks and the leaves became yellowish in color [20]. The water content of A. microphylla
cultivated under different shading materials had similar value particularly around 95 wt%. This value resembles
the water content of Azolla spp. reported in other studies which lies in the range of 94-95 wt%. The biomass
water content is influenced by the relative humidity. From table 1 it can be seen that the relative humidity for all
cultivation condition resembles one another which lies in the range of 61-71 wt%. These values were slightly
lower than the relative optimum relative humidity for the cultivation of Azolla spp. which lies in the range of 75-
90 wt% [18,19]. Nevertheless, these values are still above the minimum relative humidity of 60 wt% required to
avoid the biomass from becoming dry and fragile [16].
Table 2 shows the irradiance, illumination and percentage of light transmitted to the containers used for the
cultivation of A. microphylla under different shading materials. The irradiance highly depends on the type of
shading materials with vinyl plastic had the highest average irradiation (27-465 W/m2) followed by polyethylene
film (22-299 W/m2) and shade net 50% (10-171 W/m2). The illumination also showed similar trend which
varied from 1202-44945 Lux. The irradiance and illumination fluctuated depending on the position of the sun
with respect to the containers during the time of data measurement. Higher values of irradiance and illumination
for containers covered under vinyl plastic can be rationalized by a higher percentage of light transmitted to the
plant with an average value of 84%. The percentage of light transmitted decreased to 61% and 31% when the
containers were covered by polyethylene film and shade net 50%, respectively which consequently resulted in
lower values of irradiance and illumination.
Table 2: Light intensity conditions for the cultivation of A. microphylla under different shading materials
Material Irradiance
(W/m2)
Illumination
(Lux)
Light transmitted (%)
Vinyl 27-465 3393-44945 84 Polyethylene 22-299 2462-20661 61
Shade net 50% 10-171 1202-15813 31
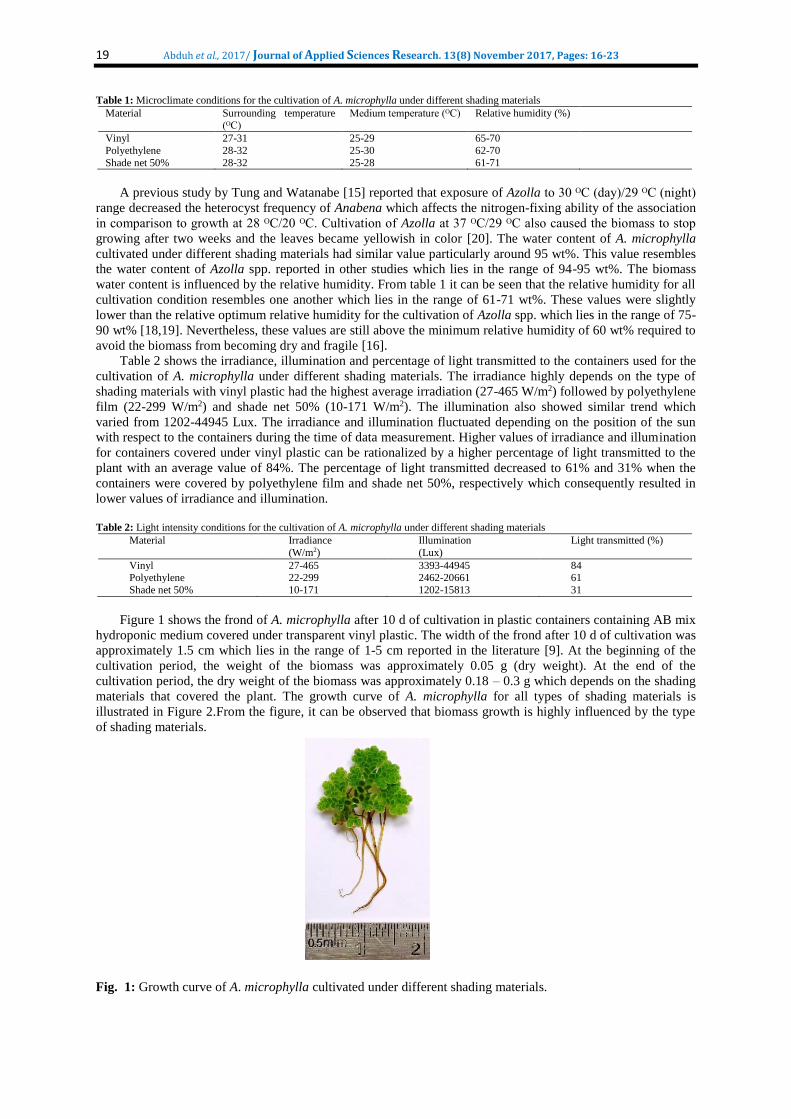
Figure 1 shows the frond of A. microphylla after 10 d of cultivation in plastic containers containing AB mix
hydroponic medium covered under transparent vinyl plastic. The width of the frond after 10 d of cultivation was
approximately 1.5 cm which lies in the range of 1-5 cm reported in the literature [9]. At the beginning of the
cultivation period, the weight of the biomass was approximately 0.05 g (dry weight). At the end of the
cultivation period, the dry weight of the biomass was approximately 0.18 – 0.3 g which depends on the shading
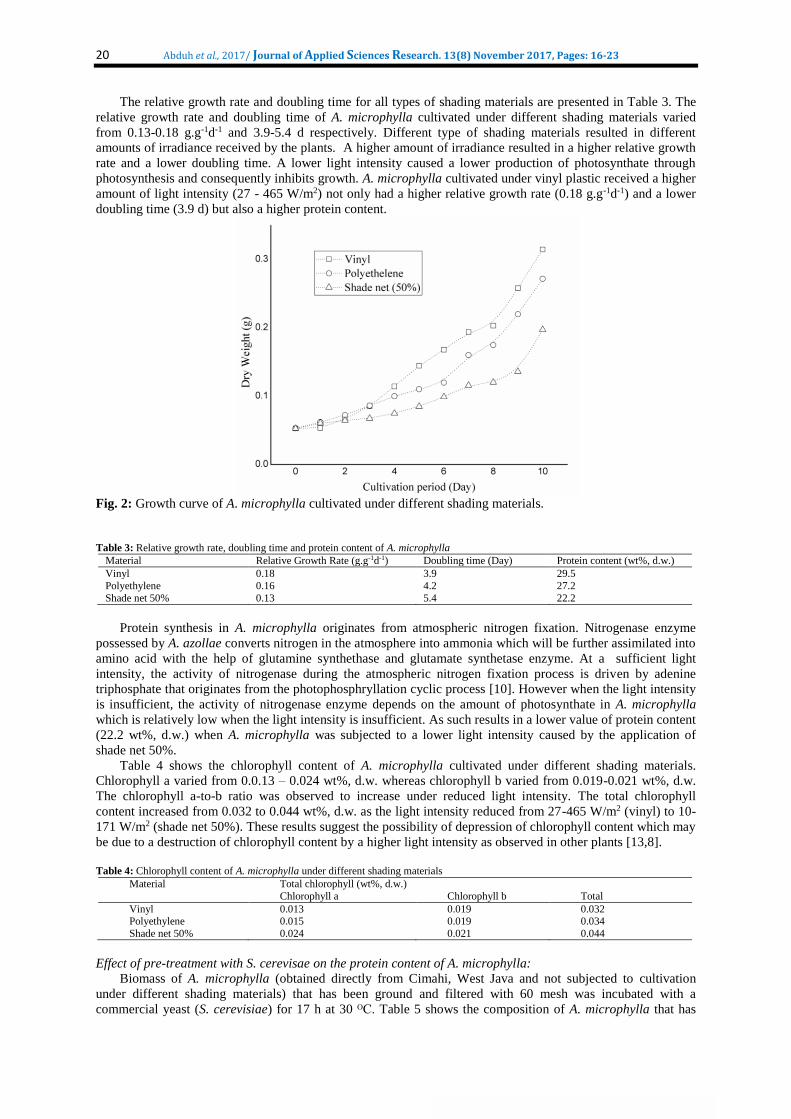
materials that covered the plant. The growth curve of A. microphylla for all types of shading materials is
illustrated in Figure 2.From the figure, it can be observed that biomass growth is highly influenced by the type
of shading materials.
Fig. 1: Growth curve of A. microphylla cultivated under different shading materials.
20 Abduh et al., 2017/ Journal of Applied Sciences Research. 13(8) November 2017, Pages: 16-23
The relative growth rate and doubling time for all types of shading materials are presented in Table 3. The
relative growth rate and doubling time of A. microphylla cultivated under different shading materials varied
from 0.13-0.18 g.g-1d-1 and 3.9-5.4 d respectively. Different type of shading materials resulted in different
amounts of irradiance received by the plants. A higher amount of irradiance resulted in a higher relative growth
rate and a lower doubling time. A lower light intensity caused a lower production of photosynthate through
photosynthesis and consequently inhibits growth. A. microphylla cultivated under vinyl plastic received a higher
amount of light intensity (27 - 465 W/m2) not only had a higher relative growth rate (0.18 g.g-1d-1) and a lower
doubling time (3.9 d) but also a higher protein content.
Fig. 2: Growth curve of A. microphylla cultivated under different shading materials.
Table 3: Relative growth rate, doubling time and protein content of A. microphylla
Material Relative Growth Rate (g.g-1d-1) Doubling time (Day) Protein content (wt%, d.w.)
Vinyl 0.18 3.9 29.5
Polyethylene 0.16 4.2 27.2
Shade net 50% 0.13 5.4 22.2
Protein synthesis in A. microphylla originates from atmospheric nitrogen fixation. Nitrogenase enzyme
possessed by A. azollae converts nitrogen in the atmosphere into ammonia which will be further assimilated into
amino acid with the help of glutamine synthethase and glutamate synthetase enzyme. At a sufficient light
intensity, the activity of nitrogenase during the atmospheric nitrogen fixation process is driven by adenine
triphosphate that originates from the photophosphryllation cyclic process [10]. However when the light intensity
is insufficient, the activity of nitrogenase enzyme depends on the amount of photosynthate in A. microphylla
which is relatively low when the light intensity is insufficient. As such results in a lower value of protein content
(22.2 wt%, d.w.) when A. microphylla was subjected to a lower light intensity caused by the application of
shade net 50%.
Table 4 shows the chlorophyll content of A. microphylla cultivated under different shading materials.
Chlorophyll a varied from 0.0.13 – 0.024 wt%, d.w. whereas chlorophyll b varied from 0.019-0.021 wt%, d.w.
The chlorophyll a-to-b ratio was observed to increase under reduced light intensity. The total chlorophyll
content increased from 0.032 to 0.044 wt%, d.w. as the light intensity reduced from 27-465 W/m2 (vinyl) to 10-
171 W/m2 (shade net 50%). These results suggest the possibility of depression of chlorophyll content which may
be due to a destruction of chlorophyll content by a higher light intensity as observed in other plants [13,8].
Table 4: Chlorophyll content of A. microphylla under different shading materials
Material Total chlorophyll (wt%, d.w.)
Chlorophyll a Chlorophyll b Total
Vinyl 0.013 0.019 0.032 Polyethylene 0.015 0.019 0.034
Shade net 50% 0.024 0.021 0.044
Effect of pre-treatment with S. cerevisae on the protein content of A. microphylla:
Biomass of A. microphylla (obtained directly from Cimahi, West Java and not subjected to cultivation
under different shading materials) that has been ground and filtered with 60 mesh was incubated with a
commercial yeast (S. cerevisiae) for 17 h at 30 ᴼC. Table 5 shows the composition of A. microphylla that has
21 Abduh et al., 2017/ Journal of Applied Sciences Research. 13(8) November 2017, Pages: 16-23
been pre-treated with yeast in comparison to the composition without yeast pre-treatment. The protein content
slightly increased from 26.5 to 27.6 wt%, d.w. when the biomass was pre-treated with S. cerevisae. A slight
increase of protein content in the pre-treated sample may be due to the biosynthesis of amino acids by S.
cerevisiae. Nevertheless, this value is relatively lower as compared to the protein content when A. microphylla
was cultivated under vinyl plastic (29.5 wt%, d.w.). As such highlights the importance of suitable light intensity
during the cultivation phase.
From the table, it can be observed that the lignocellulose composition for both conditions are approximately
similar. As such most probably due to the absence of lignocellulosic enzymes in S. cerevisiae [2]. S. cerevisae is
reported to contain an invertase enzyme that can degrade sucrose into glucose and fructose as well as maltase
enzyme that can degrade maltose into two molecules of glucose [3] which may be consumed by S. cerevisiae as
its carbon source.
Table 5: Composition of A. microphylla with and without pre-treatment with S. cerevisae
Component Composition (wt%, d.w.) Without pre-treatment Pre-treatment with S. cerevisae
Ash 19.5 18.8
Crude protein 26.5 27.6
Crude fiber 16.6 15.1 Fat 2.9 1.1
Nitrogen free extractable material 34.6 37.5
Lignin 1.2 1.0 Cellulose 26.2 25.3
Hemicellulose 3.3 4.7
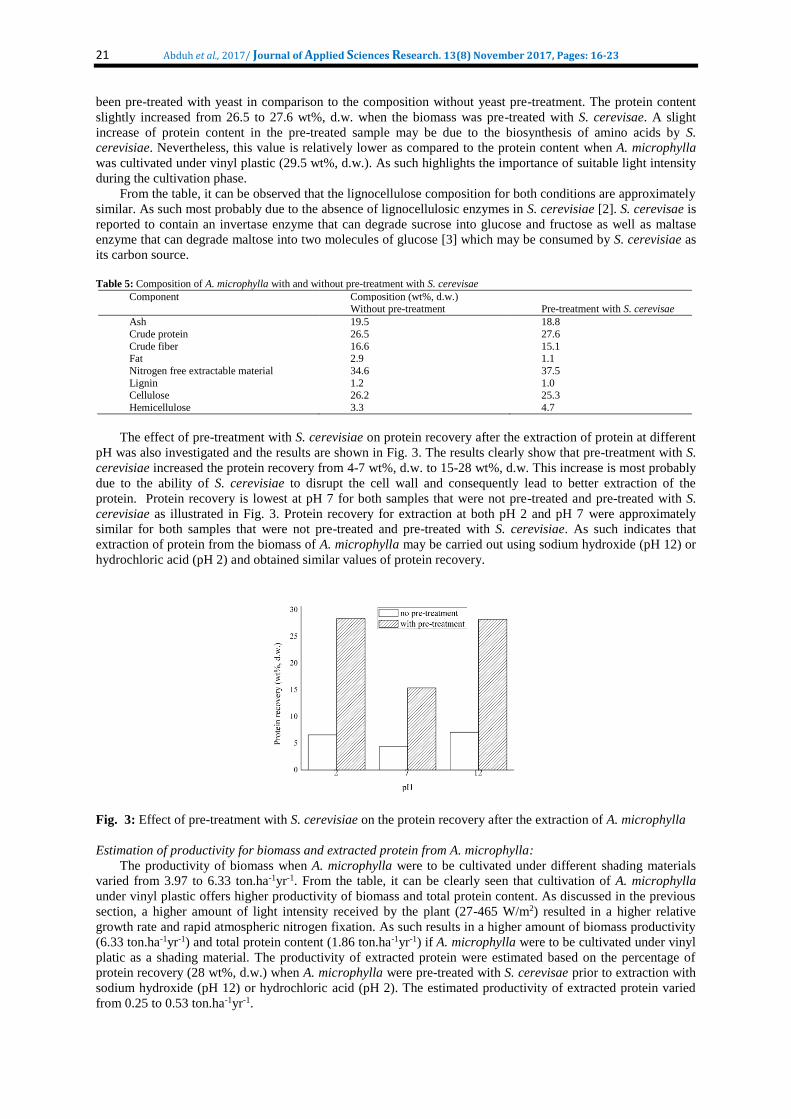
The effect of pre-treatment with S. cerevisiae on protein recovery after the extraction of protein at different
pH was also investigated and the results are shown in Fig. 3. The results clearly show that pre-treatment with S.
cerevisiae increased the protein recovery from 4-7 wt%, d.w. to 15-28 wt%, d.w. This increase is most probably
due to the ability of S. cerevisiae to disrupt the cell wall and consequently lead to better extraction of the
protein. Protein recovery is lowest at pH 7 for both samples that were not pre-treated and pre-treated with S.
cerevisiae as illustrated in Fig. 3. Protein recovery for extraction at both pH 2 and pH 7 were approximately
similar for both samples that were not pre-treated and pre-treated with S. cerevisiae. As such indicates that
extraction of protein from the biomass of A. microphylla may be carried out using sodium hydroxide (pH 12) or
hydrochloric acid (pH 2) and obtained similar values of protein recovery.
Fig. 3: Effect of pre-treatment with S. cerevisiae on the protein recovery after the extraction of A. microphylla
Estimation of productivity for biomass and extracted protein from A. microphylla:
The productivity of biomass when A. microphylla were to be cultivated under different shading materials
varied from 3.97 to 6.33 ton.ha-1yr-1. From the table, it can be clearly seen that cultivation of A. microphylla
under vinyl plastic offers higher productivity of biomass and total protein content. As discussed in the previous
section, a higher amount of light intensity received by the plant (27-465 W/m2) resulted in a higher relative
growth rate and rapid atmospheric nitrogen fixation. As such results in a higher amount of biomass productivity
(6.33 ton.ha-1yr-1) and total protein content (1.86 ton.ha-1yr-1) if A. microphylla were to be cultivated under vinyl
platic as a shading material. The productivity of extracted protein were estimated based on the percentage of
protein recovery (28 wt%, d.w.) when A. microphylla were pre-treated with S. cerevisae prior to extraction with
sodium hydroxide (pH 12) or hydrochloric acid (pH 2). The estimated productivity of extracted protein varied
from 0.25 to 0.53 ton.ha-1yr-1.
22 Abduh et al., 2017/ Journal of Applied Sciences Research. 13(8) November 2017, Pages: 16-23
Table 5: Estimated productivity of biomass and extracted protein from A. microphylla
Material Productivity ( ton.ha-1yr-1) Biomass Total protein Extracted protein
Vinyl 6.33 1.86 0.53
Polyethylene 5.46 1.48 0.42
Shade net 50% 3.97 0.88 0.25
Conclusion:
The effect of light intensity to the growth and protein content of A. microphylla has been studied. The
highest relative growth rate of 0.18 g/g.d was obtained when A. microphylla was cultivated using a transparent
vinyl plastic with an average maximum light intensity of 465 W/m2. At this condition, A. microphylla had a
doubling time of 3.9 d with a protein content of 30 wt%, dry basis. The effect of pre-treatment with
Saccharomyces cerevisiae and pH of extraction to the protein recovery was also investigated. The highest
protein recovery of 28 wt%, dry basis was obtained when Azolla microphylla was pre-treated with
Saccharomyces cerevisiae for 17 h prior to extraction with either sodium hydroxide (pH 12) or hydrochloric
acid (pH 2).
ACKNOWLEDGMENTS
There is no acknowledgment
REFERENCES
1. Arora, A., P.K. Singh, 2003. Comparison of biomass productivity and nitrogen fixing potential of Azolla
spp. Biomass and Bioenergy, 24(3): 175-178.
2. Beck, C., H.K. Von Meyenburg, 1968. Enzyme pattern and aerobic growth of Saccharomyces cerevisiae
under various degrees of glucose limitation. J Bacteriol., 96(2): 479-486.
3. Bekatorou, A., C. Psarianos, A. Koutinas, 2006. Production of Food Grade Yeasts. Food Technol.
Production, pp: 407-415.
4. Boye, J.I., C. Barbana, 2012. Protein proessing in food and and bioprodiuct manufacturing. Food and
Industrial Bioproducts., pp: 85-108. Iowa, John Wiley & Sons.
5. Carry, P.R., P.G.J. Weerts, 1992. Growth and nutrient composition of Azolla pinnata R. Brown and Azolla
filiculoide Lamarch as affected by water temperature, nitrogen and phosphorus supply, light intensity and
pH. Aquatic Botany, 43(2): 163-180.
6. Chinma, C.E., M. Ilowefah, K. Muhammad, 2014. Optimization of Rice Bran Fermentation Conditions
Enhanced by Baker’s Yeast. Nigerian Food J. 32(1): 126-132.
7. Datta, R., 1981. Acidogenic Fermentation of Lignocellulose – Acid Yield and Conversion of Components.
Biotechnol. and Bioengineering, 23: 2167-2170.
8. Kannaiyan, S., C. Somporn, 1989. Effect of high temperature on growth, nitrogen fixation, and chlorophyll
content of five species of Azolla-Anabaena symbiosis. Biology and Fertility of Soils, 7(2): 168-172.
9. Lumpkin, T.A., D.L. Plucknett, 1980. Azolla: botany, physiology and use as green manure. Economic
Botany, 34(20): 111-153.
10. Peters, G.A., J.C. Meeks, 1989. The Azolla-Anabaena symbiosis: basic biology. Annual Review of Plant
Biology, 40(1): 193-210.
11. Sanginga, N., C. Van Hove, 1989. Amino acid composition of Azolla as affected by strains and population
density. Plant and Soil, 117(2): 263-267.
12. Sarkar, A., 1986. Effects of light intensity on growth of Azolla pinnata cultured in effluent collected from
the Banka stream in West Bengal, India. Aquatic Botany, 26: 189-194.
13. Tieszen, L.L., E.K. Bonde, 1967. The influence of light intensity on growth and chlorophyll in artic,
subarctic, and alpine populations of Deschampsia caespitosa and Trisetum spicatum. Series in Biology, pp:
39.
14. Tuan, D.T., T.Q. Thuyet, 1979. Use of Azolla in rice production in Vietnam. Nitrogen and rice symposium
proceedings. pp: 395-405.
15. Tung, H.F., I. Watanabe, 1983. Differential response of Azolla Anabaena associations to high temperature
and minus phosphorus treatments. New Phytol., 93: 423-431.
16. Wagner, G.M., 1997. Azolla: a review of its biology and utilization. The Botanical Review, 63(1): 1-26.
17. Watanabe, I., C.R. Espinas, N.S. Berja, B.V. Alimagno, 1977. The utilization of the Azolla-Anabaena
complex as a nitrogen fertilizaer for rice. International Rice Research Institute.
18. Watanabe, I., 1982. Azolla – Anabaena symbiosis – its physiology and use in tropical agriculture. In
Microbiology of tropical soils and plant productivity, pp: 169-185.

23 Abduh et al., 2017/ Journal of Applied Sciences Research. 13(8) November 2017, Pages: 16-23
19. Watanabe, I., C. Lin, T. Santiaago-Ventura, 1989. Response to high temperature of the Azolla-Anabena
association, deternined in both the fern and in the cyanobacterium. New Phytol, 111: 625-630.
20. Watanabe, I., 1982. Azolla – Anabaena symbiosis – its physiology and use in tropical agriculture. In
Microbiology of tropical soils and plant productivity, pp: 169-185.
21. Wintermans, J.F.G.M., A. De Mots, 1965. Spectrophotometric characteristics of chlorophylls a and b and
their phenophytins in ethanol. Biochimica et Biophysica Acta (BBA)-Biophysics including Photosynthesis,
109(2): 448-453.
22. Widyarani, Ratnaningsih ER, Sanders JPM, Bruins ME. Biorefinery method for separation of protein and
oil fractions from rubber seed kernel. Ind. Crops Prod. 2014: 62, 323-332.