Embed Size (px)
Citation preview
THE INFLUENCE OF MOBILE APPLICATION DESIGN FEATURES ON CONSUMERS’
EMOTIONAL RESPONSE AND STICKINESS INTENTIONS
by
BRIANA MONIQUE MARTINEZ
(Under the Direction of Laura McAndrews)
ABSTRACT
This study investigated the effects of three types of mobile design features on a
consumers’ mobile app stickiness intention, as mediated by consumer’s emotional response
(pleasure, arousal, and dominance). The study employed a 3 (mobile design features: present/
absent) x 2 (type of scenario: hedonic vs utilitarian trips) experimental survey method in a retail
mobile app setting. Three hundred and four participants were recruited though Amazon
Mechanical Turk, and conditional process modeling was used to conduct hypotheses testing.
The results confirmed the influence of mobile design features on mobile app stickiness
intentions, as mediated by consumers’ feelings of pleasure and arousal. Specifically, consumer
led interaction features and product promotion features were found to influence pleasure, arousal,
and dominance whereas multimedia product viewing features were found to only influence
arousal. Additionally, while consumers’ state of pleasure and arousal were found to impact
mobile app stickiness intentions, dominance was not a predictor of mobile app stickiness
intentions despite the influence of product promotion and consumer led interaction features.
These results imply that marketers must go beyond the normal imagery and video content
present to arouse consumers in relation to the mobile design features of multimedia product
viewing. In addition, it is important to understand the relationship between product promotion
features and other mobile design features especially in how they relate to consumer led
interaction features. Third, marketers need to focus more on consumer led interaction features as
these features elicited consumers’ emotional response more than other mobile design features.
Finally, it is important to note the lack of support for between dominance and mobile app
stickiness behavior.
INDEX WORDS: Mobile design features, Pleasure, Arousal, Dominance, Mobile app stickiness
intention, Conditional process modeling
THE INFLUENCE OF MOBILE APPLICATION DESIGN FEATURES ON CONSMERS’
EMOTIONAL RESPONSE AND STICKINESS INTENTIONS
by
Briana Monique Martinez
B.S., Clemson University, 2009
M.S., The University of Georgia, 2011
A Dissertation Submitted to the Graduate Faculty of The University of Georgia in Partial
Fulfillment of the Requirements for the Degree
DOCTOR OF PHILOSOPHY
ATHENS, GEORGIA
2017

© 2017
Briana Monique Martinez
All Rights Reserved
THE INFLUENCE OF MOBILE APPLICATION DESIGN FEATURES ON CONSUMERS’
EMOTIONAL RESPONSE AND STICKINESS INTENTIONS
by
BRIANA MONIQUE MARTINEZ
Major Professor: Laura McAndrews
Committee: Patricia Hunt-Hurst
Kathryn Roulston
Yoo-Kyoung Seock
Electronic Version Approved:
Suzanne Barbour
Dean of the Graduate School
The University of Georgia
August 2017
iv
DEDICATION
To my mommy and daddy
for their unconditional love and support
v
ACKNOWLEDGEMENTS
Never in my wildest dreams did I think I would be where I am now. I must first thank
my lord and savior for giving me the strength to get through this journey. We had many a
conversation over the years usually in the dead of night.
To Dr. Laura McAndrews, my major professor, thank you for standing beside me when I
felt all my support was nowhere to be found. I thank God for sending you to me. Thank you for
believing in me. Thank you for your comments and always making time for me. I will miss our
Panera lunch meetings and our thought provoking methods discussions. Thank you for taking
this journey with me.
To Clair McClure and Terrence Wilson, thank you for allowing me to vent my tears,
anger, and frustration. Thank you for being a sounding board; thank you for sharing your
opinions; thank you for making this dissertation better. Clair, if it wasn’t for you, I would have
never applied to a doctoral program in the first place, thank you for giving me that first push on
this path. Terrence, you are a life saver, who knew, you would be the one to solve my statistical
brain malfunction after days of long nights and little sleep. I love you both dearly and I couldn’t
have done this without you.
Finally, to my parents, Javier and Sonia Martinez, thank you for always being proud of
me. Thank you for always showering me with love and support. Thank you for instilling in me a
love of learning and the value of education. Thank you! I love you mommy and daddy, and guess
what…I’m done!
vi
TABLE OF CONTENTS
Page
ACKNOWLEDGEMENTS .............................................................................................................v
LIST OF TABLES ....................................................................................................................... viii
LIST OF FIGURES .........................................................................................................................x
CHAPTER
1 INTRODUCTION .................................................................................................................1
Background of Mobile Commerce and Mobile Apps ......................................................1
Purpose of Study ..............................................................................................................7
Significance......................................................................................................................7
Definitions of Key Operational Terms ............................................................................8
Organization of Study ....................................................................................................10
2 LITERATURE REVIEW ....................................................................................................11
Atmospherics .................................................................................................................11
Mobile Design Features .................................................................................................17
Pleasure, Arousal, and Dominance ................................................................................28
Stickiness .......................................................................................................................30
3 THEORETICAL FRAMEWORK .......................................................................................33
Overall Research Gaps ...................................................................................................33
M-Marketing Design Framework ..................................................................................34
S-O-R Paradigm .............................................................................................................35
vii
Proposed Conceptual Model ..........................................................................................36
Summary of Research Hypotheses ................................................................................37
4 METHODS ..........................................................................................................................39
Research Design.............................................................................................................39
Experimental Design ......................................................................................................39
Phase 1: Pilot Study ......................................................................................................41
Phase 2: SOR Experiment .............................................................................................59
5 RESULTS ............................................................................................................................70
Phase 1: Stimuli Development Analysis .......................................................................70
Phase 2: SOR Experiment Analysis ..............................................................................73
6 DISCUSSION ......................................................................................................................92
Summary of Study .........................................................................................................92
Contributions and Implications ......................................................................................95
Limitations and Future Research .................................................................................102
REFERENCES ............................................................................................................................105
APPENDICIES
A IRB APPROVAL FOR PILOT STUDY ..........................................................................118
B RECRUITMENT MATERIALS AND CONSENT FORMS ...........................................120
C INTERVIEW INSTRUMENT ..........................................................................................124
D IRB APPROVAL FOR STIMULI CHECK .....................................................................127
E IRB APPROAL FOR SOR EXPERIMENT .....................................................................129
F SURVEY INSTRUMENT ................................................................................................131
viii
LIST OF TABLES
Page
Table 3.1: Summary of Hypotheses ..............................................................................................38
Table 4.1: Experimental Design Layout .......................................................................................40
Table 4.2: Interview Research Concepts and Questions ...............................................................43
Table 4.3: Demographic Characteristics of Participants...............................................................46
Table 4.4: Mobile Design Features and Retail Apps Manipulated ...............................................57
Table 4.5: Survey Constructs, Item Scores, and Cronbach Alphas ..............................................67
Table 5.1: Demographic Characteristics of Stimuli Check ..........................................................71
Table 5.2: Realism of Stimuli .......................................................................................................72
Table 5.3: Shopping Intention of Stimuli .....................................................................................72
Table 5.4: Demographic Characteristics of Study: SOR experiment ..........................................74
Table 5.5: Reliability of Scales .....................................................................................................75
Table 5.6: Number of Cases per Design Feature ..........................................................................76
Table 5.7: Direct and Conditional effects with MMV as Reference Group .................................83
Table 5.8: Direct and Conditional effects with PPF as Reference Group ....................................84
Table 5.9: Direct and Conditional effects with CLI as Reference Group .....................................85
Table 5.10: Conditional Indirect effects of MMV with CLI as Reference Group ........................86
Table 5.11: Conditional Indirect effects of PPF with CLI as Reference Group ...........................87
Table 5.12: Conditional Indirect effects of CLI with MMV as Reference Group ........................87
Table 5.13: Conditional Indirect effects of CLI with PPF as Reference Group ...........................88
ix
Table 5.14: Supported Hypotheses Relative to Reference Group ................................................91
x
LIST OF FIGURES
Page
Figure 2.1: Stimuli and Organism Phase of Model.......................................................................30
Figure 2.2: Full Proposed Model ..................................................................................................32
Figure 3.1: Magrath and McCormick (2013b) M-Marketing Design Framework .......................35
Figure 3.2: Mehrabian and Russell (1974) S-O-R Framework .....................................................36
Figure 3.3: Proposed Conceptual Model ......................................................................................37
Figure 3.4: Full Conceptual Model with Hypotheses ...................................................................37
Figure 4.1: Hedonic Multimedia Product Viewing Stimuli ..........................................................63
Figure 4.2: Utilitarian Multimedia Product Viewing Stimuli .......................................................63
Figure 4.3: Hedonic Product Promotion Stimuli ..........................................................................64
Figure 4.4: Utilitarian Product Promotion Stimuli .......................................................................64
Figure 4.5: Hedonic Consumer Led Interaction Stimuli ...............................................................65
Figure 4.6: Utilitarian Consume Led Interaction Stimuli .............................................................65
Figure 5.1: PROCESS Model 4 Conceptual Diagram ..................................................................77
Figure 5.2: PROCESS Model 4 Statistical Diagram ....................................................................77
Figure 5.3: MDF Conceptual Model with MMV as reference group ...........................................89
Figure 5.4: MDF Conceptual Model with PPF as reference group ..............................................89
Figure 5.5: MDF Conceptual Model with CLI as reference group ...............................................90
1
CHAPTER 1 INTRODUCTION
Chapter 1 includes (a) background of mobile commerce and mobile apps, (b) purpose of
the study, (c) significance of the study, (d) definition of key terms, and (e) organization of the
study.
Background of Mobile Commerce and Mobile Apps
Mobile Commerce
Mobile commerce research first appeared in 1999 by management information systems
scholars. Since then the research into mobile commerce has grown tremendously. However due
to technology growth and the frame of this research, there are many definitions for mobile
commerce. In early research, mobile commerce was defined as an extension of e-commerce
(Ko, Kim, & Lee, 2009). It was called wireless e-commerce and was defined as a method to
conduct electronic commerce through wireless terminals. This linkage to e-commerce was
necessary at the time as mobile commerce was not seen as a different marketing channel but an
extension of the existing channel, e-commerce (Swilley & Hofacker, 2006).
As growth in mobile commerce continued, so did the definition of mobile commerce.
Many definitions in the early to mid-2000s began to reference mobile commerce with the type of
device used. For instance, it was often defined as a form of monetary transaction over
telecommunication or wireless networks using x device, with x being the most popular mobile
device of the time such as pagers and cell phones (Swilley & Hofacker, 2006). Most definitions
focused on how transactions occurred (Chong, 2013; Hew, Lee, Leong, Hew, & Ooi, 2016; Kim,
Shin, & Lee, 2009; Wu & Wang, 2005); however, few definitions explored the dimensions or
2
benefits of mobile devices. While some researchers (Chong, Chan, & Ooi, 2012; Ngai &
Gunasekaran, 2007; Swilley & Hofacker, 2006; Yadav, Sharma, & Tarhini, 2016) argue that
mobile commerce should be defined in a manner that not only answers how transactions are
conducted but also distinguishes the advantages to the consumer by making clear the difference
between mobile commerce and e-commerce. Researchers defined mobile commerce as “the
ability to offer value through virtual transactions that allow for location-specificity and time-
sensitivity, as well as the ability to build personalized relationships with the customer” (Swilley
& Hofacker, 2006, p. 22). In this study, mobile commerce will be defined as the ability to offer
value through information and monetary transactions while creating personalized relationships
with customers.
Mobile commerce has followed a path similar to e-commerce in terms of consumers’ rate
of adoption. However, it is vital to distinguish between the two as mobile commerce offers
additional benefits, namely ubiquity and localization services (Chong et al., 2012; Faqih &
Jaradat, 2015; Krotov, Junglas, & Steel, 2015; Mahatanankoon, Wen, & Lim, 2005; Zhang, Zhu,
& Liu, 2012). It may be due to these distinctions that mobile web adoption is growing faster
than web adoption did in the 90’s. As of 2013, mobile traffic accounted for 15% of all web
traffic (Mau, 2013). In the US, mobile commerce sales reached approximately 24.66 billion
dollars in 2012 (Mau, 2013) and made up 11.6% of the 303 billion US e-commerce total (Meola,
2016). According to Business Insider, mobile commerce accounted for 20.6% or 79 billion
dollar in e-commerce sales in 2016, and by 2020 will account for 45% or 284 billion dollars in
sales (Meola, 2016; Milnes, 2016).
3
Mobile Application: Definition and Constructs
Mobile apps are software that performs certain tasks for users through their mobile
devices (Bomhold, 2013; Islam, Islam, & Mazumder, 2010). In fact, there are three distinct
kinds of apps: native apps, web apps, and hybrid apps. Native apps such as the popular gaming
app, Angry Birds, are developed for a specific operating system such as iOS, operating system
for iPhone. Web apps like Financial Times are websites that favor the look of native apps; these
apps are accessed through the mobile browser, in which the user is then given the option of
installing the app onto their device. Hybrid apps such as Banana Republic blend both the native
app and web app (Budiu, 2013; Lionbridge, 2012; Skidmore, 2013). Some of the task apps
provide tools and productivity (calendar, notes, flashlight, weather), shopping (retail based apps),
and games and music (games, music player, radio) (Bomhold, 2013; S. J. Kim, Wang, &
Malthouse, 2015).
It is predicted that the annual number of apps downloaded will reach 268 billion by 2017
(Gartner, 2013). However, it is important to note 20% of the apps downloaded are only used
once, apps that are bugged (frozen upon opening or closes at random) resulted in half of
consumers deleting the app (Smartbear, 2014). Despite this, mobile apps constitute more than
50% of time spent on digital media (Lipsman, 2014). Furthermore, in 2013, 56% of consumers
who possessed a smartphone or tablet worldwide spent most of their time (80%) on their device
within an app (Moon & Domina, 2015). Mobile app development is vital to companies as most
are actively engaged in creating mobile strategies with an app as the focus. Hinchcliffe (2013)
predicts mobile strategies to continue to be a challenge and for branded mobile apps to be widely
adopted in years to come.
4
Branded mobile apps are downloadable software to a mobile device in which the brand
identity is predominantly displayed usually through the combination of the name of the app and
the brand logo or icon (Bellman, Potter, Treleaven-Hassard, Robinson, & Varan, 2011). Zhao
and Balagué (2015) identify five types of branded apps: tool-, game-, social-, design-, and m-
commerce centric. Tool centric apps are utilitarian based apps with the goal of identifying
consumers’ motivation and requirements in using a product or service as well as usage
assistance. For example, Colgate employs a dental advisor app that includes a toothbrush timer
to teach good dental hygiene skills. Game centric apps are the opposite, possessing high hedonic
value such as the Johnson &Johnson Happy Nurse app, a race game in which the user is a nurse
who must avoid obstacles in their way. Social centric apps are simply web 2.0 apps; these apps
focus on socialization with others such as Instagram, Pinterest, and Facebook. Design centric
apps focus on creation and imagination. One such example is Nike’s Making of Making app
which informs designers and creators about the impact of their materials. Finally, m-commerce
centric apps are created with the goal of selling products. These apps utilize many features such
as customization and personalization to achieve their objective. There is a plethora of m-
commerce apps such as the IKEA catalog app and Macy’s retail app (Zhao & Balagué, 2015).
While brands tend to have more than one branded app, this study focuses strictly on mobile
commerce centric apps.
Mobile commerce centric apps. In a comScore study, in October of 2015, 21% of
smartphone owners had approximately three to five retail apps on their device; in April of 2016,
23% of smartphone owners had the same amount of retail apps on their device (eMarketer,
2016); in general, there is an increase in the amount of mobile retail apps consumers have on
their personal devices. However, as noted by a 2012 study, less than 25% of mobile shoppers are
5
using mobile applications over mobile browsers (Tang, 2013). Although, 61% of those mobile
shoppers have installed at least one mobile app on their smartphone and 30% have more than
four apps on their phone. Retailer apps, loyalty card organizers, and coupon apps are the most
prevalent types of app consumers are downloading (Tang, 2013).
Through the creation of branded apps, retailers can control the in-store experience. Store
apps allow retailers to create support for each stage of the consumer decision process from need
recognition through purchase to post purchase behavior (Wright, 2012). Because of increased
environmental control, ability to customize videos, images, and reviews through the targeting of
buying history and browsing behavior, apps have shown a higher conversion rate over desktop
and mobile websites. Wright (2012) found the conversion rate for dedicated retail apps 21%
higher than retailers who do not have a dedicated app. A retailer’s app can provide relevant
information and remove barriers creating a higher share of transactions in comparison to a
mobile website. In quarter four of 2015, mobile app transaction accounted for more than half of
all mobile transactions (mobile app +mobile browser) (Criteo, 2016).
Mobile shoppers between the ages of 18-34 and 65 and older are the two age segments
most likely to use shopping applications (Tang, 2013) and tend to browse four times as many
products. They also are 50% more likely to add a product to their basket than non-mobile app
consumers (Criteo, 2016). Therefore, mobile app consumers can be said to have higher loyalty
intentions as well as display a higher likelihood to purchase, in addition are more likely to
purchase more per shopping trip (Criteo, 2016).
Research application of mobile apps. Early research focused on mobile commerce
without making any distinction as to whether the commerce was happening through the usage of
the mobile browser or the mobile app. Mobile commerce research to date has been focused on
6
the constructs that will influence adoption intention of mobile shopping (Ko, Kim, & Lee, 2009;
Shih & Chen, 2013; Yang, Wang, & Wei, 2014), intention to purchase via mobile device (Kumar
& Mukherjee, 2013; San-Martín, López-Catalán, & Ramón, 2013), and attitude (Maghnati &
Ling, 2013; Yang, 2012). Many of these early studies utilized technolgoy theories, framework,
and models. The technology acceptance model (TAM) was often used to analyze the main
drivers and impediments that influence mobile behavioral intentions. Research also has shown
the addition of technology based consumer characteristics such as technology fit, tool experience
as well as insecurity and discomfort (Kumar & Mukherjee, 2013; Shih & Chen, 2013; Yang,
2012); these variables usually derived from the addition of another framework such as the
technology readiness index(TRI) or task technology fit model (TTF). While both qualitative and
quantitative studies have been employed to study behavioral intentions of mobile commerce,
much of the research analyzed technology acceptance or purchase intention. Few studies
analyzed consumer characteristics not closely tied to technology traits. Ko et al. (2009) looked
at the concept of enjoyment in addition to the variables common to the extended TAM model;
although enjoyment was found to influence adoption intention; no direct effect was found. Thus,
much of early research into mobile commerce focused on utilitarian benefits to mobile adoption
and purchase intention.
Mobile commerce is a marketing tool for fashion retailers. Through the proper and
effective use of mobile commerce, retailers can advertise, promote, and sell their products
through third party and retailer specific mobile apps (Kim, Ma, & Park, 2009). While the
research on mobile commerce is vast, research on mobile apps is relatively rare. Even more so,
research on fashion mobile apps is rare, especially when focusing on consumer behavior (Moon
& Domina, 2015).
7
While some studies have analyzed mobile apps specifically, still the main focus has
tended toward technology adoption or purchase intention (Ahuja & Khazanchi, 2016; Hew, Lee,
Ooi, & Wei, 2015; Hsu & Lin, 2015; Lee, Tsao, & Chang, 2015; Maghnati & Ling, 2013). More
recent studies into mobile apps are starting to focus on other areas such as engagement (Kim,
Lin, & Sung, 2013), loyalty (Chang, 2015), and other behavioral intentions (Taylor & Levin,
2014) as well as hypothesizing framework geared specially towards mobile applications
(Magrath & McCormick, 2013a, 2013b; Tarasewhich, 2003).
Mobile apps focus on real time customer-retailer relationships; therefore, it is a
continuous challenge for companies to control how best to capture user attention. While Ho and
Syu (2010) determined the motives and rewards from using mobile apps are entertainment,
functionality, information, socialization, intellectual stimulation, following a trend, and learning;
there is no research that has identified the features companies should focus on to enable the
development of branded app strategies.
Purpose of the Study
The main purpose of this study was to determine the influence of mobile design features
on consumers’ mobile app stickiness intentions, as mediated by consumers’ emotional response
(pleasure, arousal, and dominance). This study adds to the body of knowledge in atmospherics
and will help retailers in the development of mobile brand strategies through the analysis of
features that enable more tailored responses to identified target markets.
Significance
While research studies on the design of web sites were prevalent, design aspects of
mobile apps were rare (E. Kim et al., 2013; S. J. Kim et al., 2015) and often look at informational
design content or the visual appeal overall. This study added to the literature by simulating real
8
life interactions with mobile design features through an experimental research setting. In
addition, while the stimulus-organism-response paradigm was used often in the research of web
sites, this study was one of the first to employ this framework in the mobile app setting.
Definitions of Key Operational Terms
The definitions for the key terms used throughout the text are available in this section:
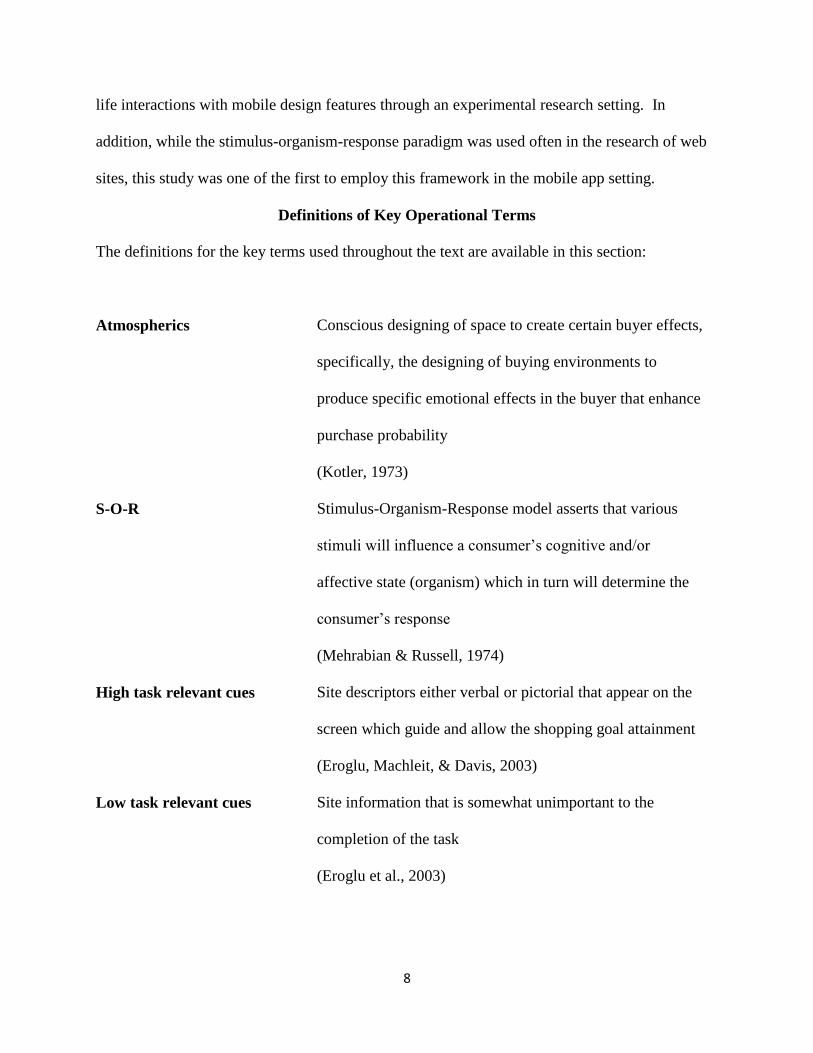
Atmospherics Conscious designing of space to create certain buyer effects,
specifically, the designing of buying environments to
produce specific emotional effects in the buyer that enhance
purchase probability
(Kotler, 1973)
S-O-R Stimulus-Organism-Response model asserts that various
stimuli will influence a consumer’s cognitive and/or
affective state (organism) which in turn will determine the
consumer’s response
(Mehrabian & Russell, 1974)
High task relevant cues Site descriptors either verbal or pictorial that appear on the
screen which guide and allow the shopping goal attainment
(Eroglu, Machleit, & Davis, 2003)
Low task relevant cues Site information that is somewhat unimportant to the
completion of the task
(Eroglu et al., 2003)
9
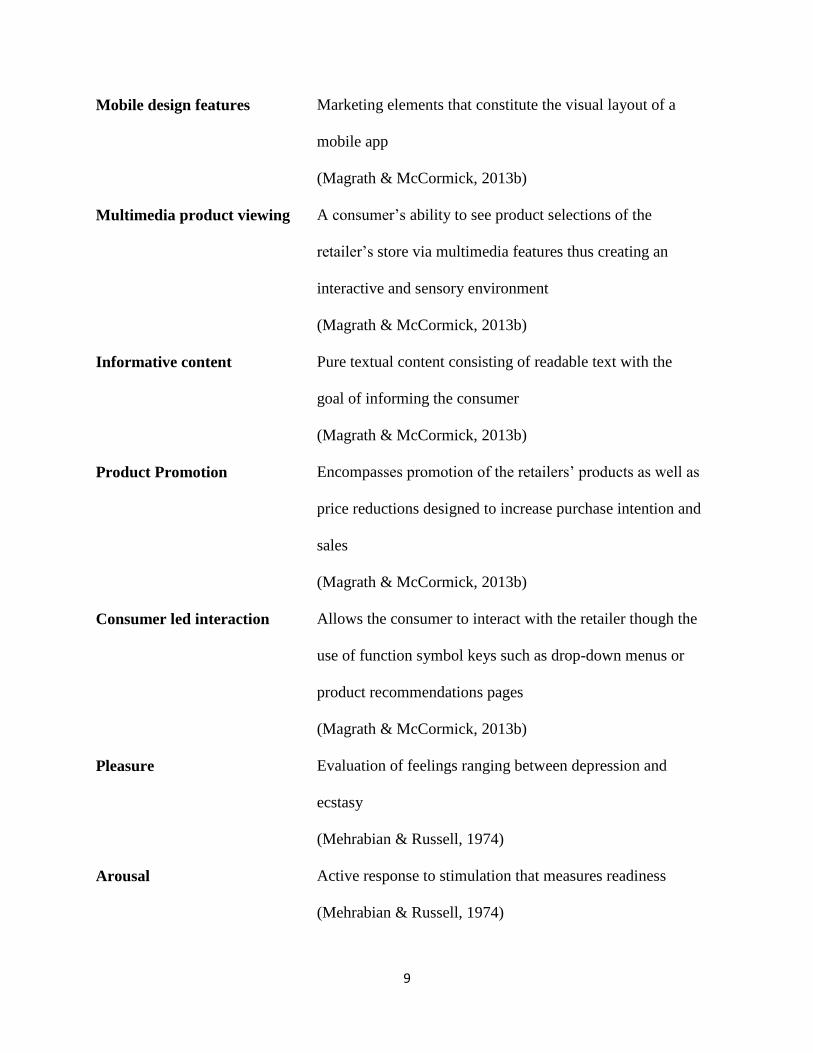
Mobile design features Marketing elements that constitute the visual layout of a
mobile app
(Magrath & McCormick, 2013b)
Multimedia product viewing A consumer’s ability to see product selections of the
retailer’s store via multimedia features thus creating an
interactive and sensory environment
(Magrath & McCormick, 2013b)
Informative content Pure textual content consisting of readable text with the
goal of informing the consumer
(Magrath & McCormick, 2013b)
Product Promotion Encompasses promotion of the retailers’ products as well as
price reductions designed to increase purchase intention and
sales
(Magrath & McCormick, 2013b)
Consumer led interaction Allows the consumer to interact with the retailer though the
use of function symbol keys such as drop-down menus or
product recommendations pages
(Magrath & McCormick, 2013b)
Pleasure Evaluation of feelings ranging between depression and
ecstasy
(Mehrabian & Russell, 1974)
Arousal Active response to stimulation that measures readiness
(Mehrabian & Russell, 1974)
10
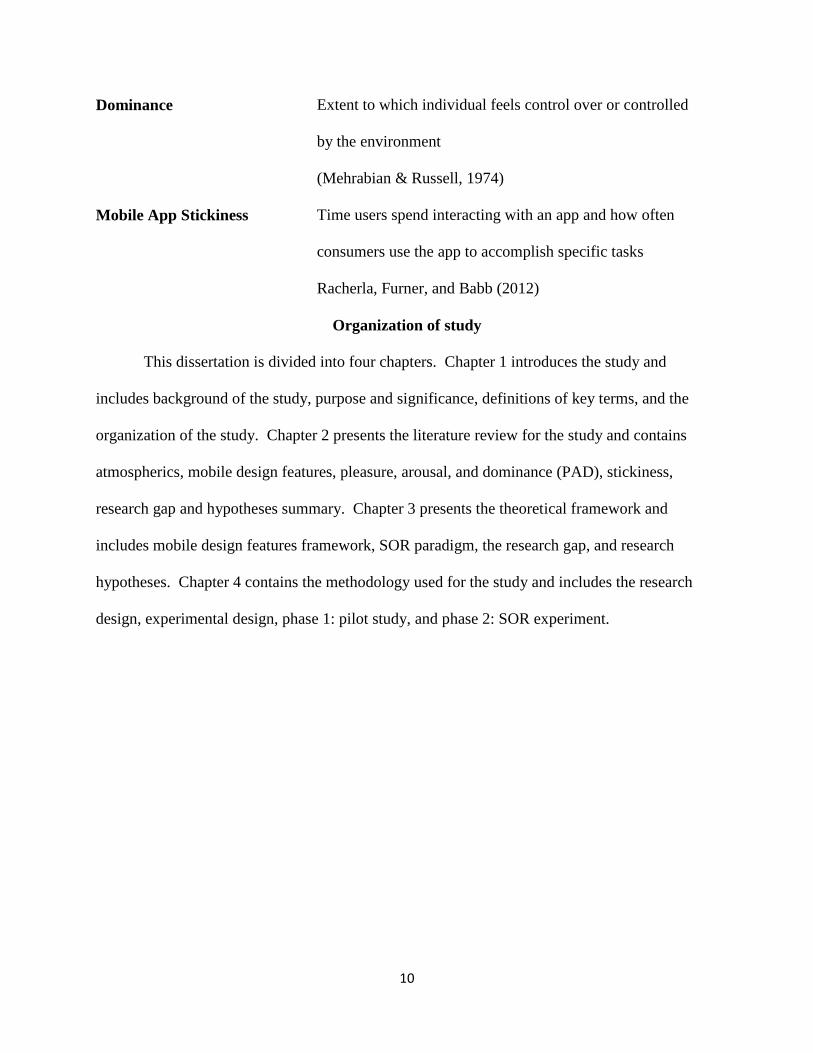
Dominance Extent to which individual feels control over or controlled
by the environment
(Mehrabian & Russell, 1974)
Mobile App Stickiness Time users spend interacting with an app and how often
consumers use the app to accomplish specific tasks
Racherla, Furner, and Babb (2012)
Organization of study
This dissertation is divided into four chapters. Chapter 1 introduces the study and
includes background of the study, purpose and significance, definitions of key terms, and the
organization of the study. Chapter 2 presents the literature review for the study and contains
atmospherics, mobile design features, pleasure, arousal, and dominance (PAD), stickiness,
research gap and hypotheses summary. Chapter 3 presents the theoretical framework and
includes mobile design features framework, SOR paradigm, the research gap, and research
hypotheses. Chapter 4 contains the methodology used for the study and includes the research
design, experimental design, phase 1: pilot study, and phase 2: SOR experiment.
11
CHAPTER 2 LITERATURE REVIEW
Chapter 2 includes the discussion of (a) atmospherics, (b) mobile design features, (c)
pleasure, arousal, and dominance (PAD), (d) stickiness, (e) research gap and hypotheses
summary.
Atmospherics
One of the major determinants of the effectiveness of an online retailer are the
atmospheric qualities of the medium in which consumers interact with products or services (C.
Shih, 1998). Atmospherics was conceptualized by Kotler (1973) who stated that the way
retailers design a specific shopping environment would greatly affect the consumers’ purchasing
decisions. Atmospherics has been defined as “the conscious designing of space to create certain
buyer effects. More specifically, atmospherics is the effort to design buying environments to
produce specific emotional effects in the buyer that enhance his purchase probability” (Kotler,
1973, p. 50). The same can be said for a retailer’s mobile app as it serves as the medium through
which consumers interact. It has long been supported that the environment of a traditional
retailer impacts psychological and behavioral shopping outcomes. These same ideas were also
tested in the online retailing context and found to show comparable results. Therefore, certain
atmospheric qualities of a retailer’s mobile app may also affect the likelihood of use and other
behavioral outcomes (Eroglu, Machleit, & Davis, 2001).
Atmospherics can account for up to two thirds of in-store purchases, and they are one of
the differentiating factors among retailers (Hausman & Siekpe, 2009). Early research into the
impact of atmospherics can be credited to Mehrabian and Russell (1974)’s stimulus-organism-
12
response framework. Then Donovan and Rossiter (1982) took the S-O-R framework and applied
it in a retail context. Their findings supported the impact of consumers’ emotional states in a
retail environment on approach avoidance behavior.
Julie Baker (1986) showcased a typology of store environment elements, grouping them
into three categories: social factors, design factors, and ambient factors. Social factors are often
the results of customer-customer interactions and contain the elements that determine other
customer perceptions, OCP; notably, the perceived appearance, similarities, and behaviors of
other customers (Ngo, Northey, Duffy, Thao, & Tam, 2016). It is important to note that service
factors can also include service personnel. Design factors describe the visual appeal of the retail
environment, focusing on layout, interior design, and color (Julie Baker, 1986) whereas the
ambient factor consists of nonvisual factors that impact our subconscious, mainly smells and
sounds (Julie Baker, 1986; Eroglu et al., 2001).
Bitner (1992) then examined the impact of the physical surrounding on the social
elements with a focus on service organizations. She also identified three categories with slightly
different grouping: ambient elements, layout and functionality elements, and signs, symbols, and
artifacts. Bitner’s (1992) dimensions at their roots are consistent with the three defined by Julie
Baker (1986). Other atmospheric cues such as music, lighting, color, and scent have also been
studied. These initial studies into atmospherics overall have determined the significant role
atmospherics play in determining consumers’ responses and behavior within the retail and
service environment.
Application of Atmospherics in Research
Mazaheri, Richard, Laroche, and Ueltschy (2014) examined the influence of website
atmospherics on three dimensions of intangibility between three different cultures. The three
13
atmospherics analyzed were informativeness, effectiveness, and entertainment; however, unlike
other research into atmospherics these scholars utilized atmospherics as antecedents to PAD
dimensions, in this research PAD dimensions is the antecedent to the atmospherics cues
analyzed. Mazaheri et al. (2014) found a difference between the emotional dimensional effects
(pleasure, arousal, and dominance) and the three examined cultures, Middle Eastern, North
American, and Chinese. They also found that arousal had the smallest influence on consumer
perceptions of a site’s atmospherics; in fact, arousal was found to not be significant at all for
North America’s perception of arousal on effectiveness.
Hsieh, Hsieh, Chiu, and Yang (2014) used the pleasure, arousal, dominance (PAD) model
to examine the influence of website atmospherics on PAD through task-relevant cues. They
highly stressed the importance of dominance in their model arguing that the dimension of
dominance is highly relevant for an online environment due to a consumers’ ability to control the
entire shopping process. Their findings support their argument for the inclusion of dominance in
research applied in online settings. Hsieh et al. (2014) state that consumers who feel
independent and unrestricted expressed higher intentions to purchase from a web site. Their
findings also showed that all atmospheric cues measured strongly through emotions, once again
furthering support for the inclusion of dominance in the usage of PAD model. Another
interesting finding that resulted from the study was the suggestion that if a consumer has a higher
perceived dominance then they are more likely to have a pleasurable browsing experience
leading to increased purchase intention. Entertainment (low task relevant cue) was the only
atmospheric cue tested to have an influence on arousal, and shows that low task relevant cues
can indeed have an impact on a consumers’ emotional state within the shopping process.
14
Atmospheric and S-O-R
Mehrabian and Russell’s (1974) stimulus organism response, S-O-R, has been used in
numerous studies to examine the influence of environmental cues. The SOR model indicates
that various stimuli will influence a consumer’s cognitive and/or affective state (organism) which
in turn will determine the consumer’s response. Stimuli are external cues to consumers that grab
their attention. In the online retail environment, these stimuli have been defined as all the visual
and audible cues that can interact with a consumer. These online stimuli can be presented in a
variety of forms such as product reviews, 3D product viewing, and visual aesthetics of a site, etc.
The organism reflects the cognitive and affective internal processes that intervene between the
stimuli and final end behavior or response. The intervening process of cognitive and affective
state are composed of the information processing portion that is most commonly referred to as
the cognitive state and the affective state composed of feelings or emotions. The response
portion of the SOR model has been used in many forms under the broader categories of
perceptions or behavioral intentions and acquisitions of products (Benlian, 2015; Eroglu et al.,
2001).
High and Low Task Relevant Cues
Eroglu, Machleit, and Davis (2000) hypothesized that the online store environment can
be categorized into high and low task relevant cues. High task relevant cues were defined as the
verbal or pictorial site descriptors that appear on the screen which guide and allow the shopping
goal attainment. On the other hand, low task relevant cues are the site information that are
somewhat unimportant to the completion of the task. High task relevant cues include the
following: descriptions of the merchandise, price, terms of sale, delivery, return policies,
pictures of merchandise, product reviews, navigational aids, etc. whereas low task relevant cues
15
are comprised of elements such as colors, borders, font, animation, sounds, music,
entertainments, decorative pictures, etc. High task relevant cues are utilitarian in nature.
Whereas low task relevant cues are thought of as opportunities to increase hedonic or
experiential value of shopping. In an online environment, these cues are more influential as
ambient and social factors are lacking, and these task relevant cues are believed to be able to
trigger memory of previous shopping trips in brick and mortar stores (Eroglu et al., 2003; Koo,
Cho, & Kim, 2014; Richard & Habibi, 2016).
Koo et al. (2014) examined consumers’ delight as the emotional response mediating the
effect of atmospheric cues on purchase intention in an online environment. They named their
high task relevant cues information cues and their low task relevant cues were called visual cues.
Consumer delight was described as the emotional response involving pleasure, arousal, and
surprise. Koo et al. (2014) found that when consumers identify with the online stores, they form
more favorable perceptions of both visual cues and information cues. Koo et al. (2014) also
found visual cues to have a stronger impact on a consumer’s delight; thus concluding that online
stores should place more importance on improving visual cues to generate delight in consumers
thus leading to increased purchase intention.
Zhang, Lu, Wang, and Wu (2015) investigated the impacts of social media environments
and co-creations experience on customer participation. The social media environments were
analyzed using high and low task relevant cues. The high task relevant cues were called task
relevant (TR) cues and referred to the site description as well as aspects of goal attainment such
as security, ease of navigation, and information fit to task. Zhang et al. (2015) named the low
task relevant cues as affection relevant (AR) cues in this study, and these cues consisted of
factors such as images, visual presentation, and music. These cues were considered a crucial
16
aspect to creating a lasting customer experience through an affective environment. They also
noted that the cognitive and emotional reaction on a site could be induced by the affection
relevant cues meaning the cues would in turn influence behavior. The AR cues were
operationalized through perceived visual appeal and the TR cues were operationalized though
perceived information fit to task. Zhang et al.’s (2015) study concluded that the TR cues to have
a stronger influence on co-creation experiences in comparison to the AR cues which are in line
with other studies’ conclusions of a stronger significance of hard task relevant cues to low task
relevant cues.
Floh and Madlberger’s (2013) study focused on the role atmospheric cues have in
influencing impulse buying behavior. They examined three types of atmospheric cues: e-store
content, e-store navigation, and e-store design. E-store navigation is considered a high task
relevant cue and e-store design is considered a low task relevant cue. Floh and Madlberger
(2013) found that e-store design did indeed affect impulse buying behavior through the
mediation variables of shopping enjoyment, browsing, and impulsiveness. E-store design was
the strongest factor influencing impulse behavior thus indicating the importance to retailers as
the site’s design is easily manipulated and controlled.
Eroglu et al. (2003) tested the hypothesized high and low relevant task cues using the S-
O-R framework with a fictitious T-shirt site. One site contained only high relevant task cues
whereas the other site contained both high and low relevant task cues. The moderating factors of
involvement and atmospheric response were included as well. The study confirmed that online
store atmospherics did indeed make a difference in consumers’ shopping behavior. An increase
in atmospheric qualities was said to increase the level of pleasure felt by the shopper. The study
17
also confirmed the moderating effects of involvement and atmospheric responsiveness on the
relationship between the site atmosphere (high and low task relevant cues) and emotion.
Richard and Habibi (2016) developed and tested an advanced model on consumer
behavior focusing on atmospherics cues and the mediation roles of hedonism and culture. They
selected two high task relevant cues (effectiveness and information content) and one low task
relevant cue (entertainment), and three cultures (North American, Chinese, and Middle Eastern).
They found the low task relevant cue of entertainment to be stronger for Chinese culture
claiming the more context sensitive a culture is the more low task relevant cues are valued. In
comparison, the high task relevant cues of effectiveness and information were stronger for North
American culture then it was for Chinese culture, once again suggesting that low context
sensitive cultures place more value on high task relevant cues (Richard & Habibi, 2016).
Mobile Design Features
Retailers need to optimize their apps for a seamless consumer experience, for example,
eBay deleted the ads from its app to optimize the viewing interface by make it less distracting for
making purchases (Mau, 2013). This is an example of how retailers can modify their
atmospherics. Atmospherics in a mobile context can be better described as mobile design
features. Mobile design features, in this study, are the low task marketing elements that
constitute the visual layout of a mobile app.
Magrath and McCormick (2013a, 2013b) focused on developing new framework to
capture the design elements of mobile apps for the fashion retail industry. They argued that the
design elements that are used for e-commerce design (online sales sites) cannot be directly
translated to a mobile site or app, and to assume such could cost the retailer potentially lost
profit.
18
Magrath and McCormick (2013b) found 18 individual design elements and grouped them
into 4 stimulus categories. Those categories were (a) multimedia product viewing (video, image
interactivity, and graphics), (b) informative content (practical product information, practical
service information, trend information, style advice, and social media), (c) product promotions
(coupons, incentives, rewards, discounts, competitions, and social media promotions), and (d)
consumer-led interactions (personalization, customization, and augmented reality).
Constructs of Mobile Design Features
Multimedia product viewing. Multimedia product viewing is the consumer’s ability to
see product selections of the retailer’s store via multimedia features thus creating an interactive
and sensory environment (Gulliver & Ghinea, 2010). It has been said to improve involvement as
well as provide customer satisfaction, enjoyment, information and entertainment (Gulliver &
Ghinea, 2010; Simmons, 2007). These features could be videos, graphics, and/ or image
interactivity such as zoom or rotation (Magrath & McCormick, 2013b; McCormick & Livett,
2012).
Video. Dennis, King, Kim, and Forsythe (2007) classified videos as multimedia product
viewing elements when they are produced to sell and market products. Videos are important for
the enhancement of the consumers’ shopping experience (Kim & Lennon, 2010); they could be
videos of fashion week shows or product promotion videos as well as catwalk videos that help
consumers visualize what the product looks like in action. Videos are intended to enhance
visualization of a product as well as to promote the product (McCormick & Livett, 2012).
Graphics. Graphics are pictures, logos, or images that are used for either marketing
purposes or retailers’ brand strategy (Rowley, 2004). Graphic imagery either illustrates the
product (product imagery) or promotes the product (promotional imagery) (Ha, Kwon, &
19
Lennon, 2007). Product imagery refers to the images of products for viewing and purchasing.
The images offer an accurate representation of garment appearance therefore being of high
relevance for a customer (Ha et al., 2007; Ha & Lennon, 2010). For mobiles, these images are
laid out as small thumbnails due to screen size limitations (Kim, Kim, & Lennon, 2006; Kim &
Lennon, 2008; Santos, 2003). Because retailers are aware of the positive effects of larger
pictures, the increase of mobile screen size allows for the capitalization of full screen mode.
Promotional imagery while it displays products in the same manner that product imagery does
differs due to its advertising purpose (Ha & Lennon, 2010). These images can also be
categorized as a sales promotion tool that influences purchase intention and enjoyment (Fiore,
2002).
ITT. Interactivity uses product viewing functions such as zoom, close-up pictures, and
3D models to enhance experience. Interactivity enables both hedonic and utilitarian user
experiences through the delivery of entertainment while reducing time and effort. Higher
interactivity leads to increased influence to browse, attitudes, purchase intention, and other
behavioral intentions. Virtual technology also belongs within the construct of interactivity (Fiore
& Jin, 2003; In Shim & Lee, 2011).
Mobile apps that incorporate ITT elements may increase the influence on a variety of
behavioral intentions such as satisfaction, trust, and purchase intention (Dennis et al., 2007; In
Shim & Lee, 2011; Li, Daugherty, & Biocca, 2001). Most transactional fashion apps do have
partial ITT elements incorporated into them such as 360° views, enlargement option, etc. (Shao
Yeh & Li, 2009).
Informative content. Informative content is purely textual consisting of readable text
with the goal of informing the consumer (Grandon & Ranganathan, 2001; McCormick & Livett,
20
2012). It at times can have visual aids, but its goal is to pass along information to the consumer
about the product or service at hand. Informative content can include product information
(McCormick & Livett, 2012), service information (Huizingh, 2000), company information,
FAQs (Lohse & Spiller, 1999), and fashion information (McCormick & Livett, 2012), all of
which are information based (Magrath & McCormick, 2013b). The design of information needs
to be portrayed accurately as consumers may be influenced to engage with the site through
browsing and/ or purchasing (Cyr, 2008; Lu & Rastrick, 2014). Because informative content is
any copy found on the app with the intention of informing the consumer, it is considered a hard
task relevant cue. Magrath and McCormick (2013b) hypothesize five elements of informative
content: product information, service information, trend information, style advice, and social
media.
Product information. The worded content that accompanies a product image informs the
consumer about that product to aid understanding (Ha & Lennon, 2010; Rowley, 2009). Product
related information includes color, price, care instruction, product content, and sizing availability
(Kim & Lennon, 2010). This information helps to instill a sense of trust and satisfaction with the
retailer; thus, product information is essential (Simmons, Thomas, & Truong, 2010). This is
especially true when shopping through a mobile app as it may help to ease consumers’
perception of risk (Dennis et al., 2007).
Service information. Any information used to inform consumers of retail services falls
under the umbrella of service information (Rowley, 2009). This includes information related to
careers, store locations, FAQs, contact info, delivery and return information as well as company
policies (Lohse & Spiller, 1999; Magrath & McCormick, 2013b). In an app, this information is
usually condensed and normally only includes relevant and practical information for services
21
associated with the app such as delivery and return information. However, it is important to note
that while all the typical service information is not embedded within the app, it is usually present
but will open in the mobile browser. For instance, if a consumer was interested in career
opportunities, that information would open through a mobile browser instead of within the app.
While this information may not be used as frequently as product information, it has been found
that high quality service information will increase a consumer’s sense of satisfaction (Ha &
Lennon, 2010) as well as delivery and return policy information.
Trend information. Siddiqui, O'Malley, McColl, and Birtwistle (2003) believe trend
information to be an expected trait of fashion retailers. Retailers inform consumers of newest
trends through blogs and look books. This information not only informs but also promotes the
retailers’ product assortment (Dawson & Kim, 2010). Trend information has been found to
induce feelings of pleasure and inspiration while adding value to the consumer’s experience
(McCormick & Livett, 2012; Siddiqui et al., 2003). However, while some mobile apps do have
trend information on their app; Magrath and McCormick (2013b) note that this information may
not be as essential for the on the go consumer.
Style advice. Style advice differs from trend information. Style advice assists and makes
recommendations to consumers. Style advice aids consumers by assisting them through the
discovery of new products as well as aiding in the purchase decision process (Hsiao, Lin, Wang,
Lu, & Yu, 2010; Ranganathan & Ganapathy, 2002). Consumers are often offered suggestions on
how to wear an item, what other items people typically purchased or browsed when viewing an
item, and alternative items they may also like. This type of information often stimulates strong
hedonic experiences (Jayawardhena & Wright, 2009; McCormick & Livett, 2012).
22
Social media. Social media content is created by either retailer, consumers, or a third
party. Its sole purpose is to enhance entertainment, add value, and promotion (product or brand)
(Kaplan & Haenlein, 2010; Mangold & Faulds, 2009; Shin, 2010). The content is typically
spread through social media platforms and can be integrated within the app. While social media
is believed to encourage consumer interaction, often it is used as a medium to inform consumers
of events, news, and promotions. While web sites use social media platforms such as Twitter or
Facebook, Kaplan and Haenlein (2010) found that numerous apps utilize newsletters or blogs
(Keng & Ting, 2009; Magrath & McCormick, 2013b).
Product promotion. Product promotion encompasses promotion of the retailers’
products as well as price markdowns to increase purchase intention and sales (Tong, Lai, &
Tong, 2012). Promotions are a persuasive incentive enticing the consumer to purchase the
product (Park & Lennon, 2009). Product promotions will often contain visual and textual
information to create powerful persuasions. Magrath and McCormick (2013b) indicate the high
relevancy of product promotion to mobile store design and merchandising. The following six
product promotion techniques are held as most suitable for mobile apps: coupons, incentives,
rewards, discounts, competitions, and social media promotion.
Coupons. Coupons remain one of the most popular form of sales promotion (Solomon,
2009). Consumers obtain a heightened sense of product value through the usage of promotional
codes; these codes often lead to an increase in purchase intention (Park & Lennon, 2009). Some
retailers’ coupons not only work through the mobile app but in fact also work in stores leading to
in store patronage as well as brand image congruity (Fiore & Jin, 2003; Muller, 2008).
Incentives. Incentives are a sales tactic to encourage product consumption due to a
convincing motivation. Some of the more familiar incentives are buy one, get one free, buy one
23
get one half off, shipping discounts such as free shipping over 50 dollars. These incentives are
often loyalty based encouraging consumers to buy more to receive the discount. Mobile app
incentives are identical to web site incentives (Dawson & Kim, 2010; Meyer-Waarden, 2008).
Rewards. Rewards specifically refer to retailer loyalty rewards (Meyer-Waarden, 2008).
In other words, the benefits of being a frequent shopper. These rewards include the sharing of
discount codes, price promotions and gifts (Park & Lennon, 2009) usually distributed through a
loyalty card or email list (Singh, Veron-Jackson, & Cullinane, 2008). Rewards are one type of
customer retention technique as they show gratitude for consumers continued patronage
(Chaffey, Ellis-Chadwick, Mayer, & Johnston, 2009). Rewards on a mobile app platform can be
either mobile only discount codes or mobile exclusives. Some apps in fact offer a reward on the
initial download of the app; Singh et al. (2008) suggest this act alone showcases loyalty
intentions (Magrath & McCormick, 2013b).
Discounts. Discounts take a percentage off the original price of a product without the
need of a coupon (Lowe, Maxwell, & Estelami, 2010). Retailers use discounts to promote sales
in hopes to increase impulse purchases decisions. Other types of discount sales include
clearance, seasonal, and limited time only sales (Dawson & Kim, 2010; Lowe et al., 2010). All
discount sales are geared towards increasing purchases and profits. In the mobile environment,
there is an additional type of discount sales referred to as a sales event. These events are usually
displayed on the home screen in the form of a banner. This banner typically stays at the top of
the screen regardless of where the consumer is within the mobile store. This is intentional as it
aims to increase sales awareness (Magrath & McCormick, 2013b).
Competitions. Some retailers hold competitions in which consumers may enter in hopes
to win the prize. Competitions are a direct and influential manner to obtain consumers’ personal
24
information to use later for direct marketing purposes (Chaffey et al., 2009). They also generate
retailer publicity while creating a buzz that drives consumer interest. Competitions may also
help with the building of retailer-consumer relationships (Rowley, 2009; Solomon, 2009).
However, competitions are uncommon in fashion retailer mobile apps (Magrath & McCormick,
2013b).
Social media promotion. Self-enhancement for the consumer is created through the
ability to share product information and promotions with virtual friends through social media
platforms (Ho & Dempsey, 2010; Jayawardhena & Wright, 2009). Many retailers incorporate
social media within their page allowing consumers to voluntarily share or recommend products
to their “friends”. Social media promotion is a consumer centric tool that generates an increase
in word of mouth intention (Ho & Dempsey, 2010; Magrath & McCormick, 2013b; Rowley,
2009; Singh et al., 2008).
Consumer led interaction. These are used to aid the consumer’s experience and service
but by their, the consumers’, own lead. Consumer led interactions do not intentionally promote
the product but instead focus on giving consumers control over their experience, therefore,
creating personalized shopping experiences (Lee, Yejean Park, Kim, Kim, & Moon, 2011;
Ranganathan & Ganapathy, 2002). Consumer led interaction is the consumer’s personal and
unique interaction with the mobile app design stimuli (Yoon, Choi, & Sohn, 2008). They are
identified in an app by determining if consumers have control over how they interact with the
content or how they benefit from the interactive experience with the retailer or app (Lee et al.,
2011). Incorporating these elements into a mobile app can lead to an increase in customer
satisfaction (Dholakia & Miao, 2009) as well as lay the building blocks to developing a
consumer-retailer relationship (Feinberg & Kadam, 2002).
25
Relationships between the consumer and the retailer are possible via the internet, and
these interactions center around quick and relevant exchange of information, perceived consumer
control, and the ability to create experiences using virtual or digital imagery. Because of this
Magrath and McCormick (2013b) suggest the mobile design category of consumer led
interaction features are comprised of three elements: personalization, customization, and
augmented reality.
Personalization. Personalization affects consumer satisfaction, loyalty, patronage
intentions, and brand relationships (H. H. Chang & Wang, 2011; Kalyanaraman & Sundar, 2006;
Nguyen & Mutum, 2012; Srinivasan, Andderson, & Ponnavolu, 2002). It is inarguably a vital
element of site design. The retailer can provide personalized features through the personal
information gathered through the consumer’s interactions with the site. This allows individual
personalization as well as target need based solutions (Vesanen, 2007). On mobile apps, this
may be displayed through promotion targeted at what the consumer last viewed or views the
most. It may also suggest products not viewed based on mobile shopping behavior (Goldman,
2010; Magrath & McCormick, 2013b).
Customization. Customization is the tailoring of settings to a consumer’s desired
specifications. Communication with a consumer should be determined on a product by product
basis as Weathers, Sharma, and Wood (2007) found evidence for a distinction between
experience goods and search goods regarding effectiveness of communication practices.
Allowing consumers to have control over search good information has been shown to reduce
uncertainty while increasing enjoyment. Online, this can be seen through presenting information
in a non-fixed format such as the usage of hyperlinks or on an app, it allows consumers to filter
product reviews by an assortment of features thus creating a form of customized information
26
(Manganari, Siomkos, Rigopoulou, & Vrechopoulos, 2011; Mild & Reutterer, 2003; Weathers et
al., 2007). The ability to filter products on an app has been found to produce higher levels of
satisfaction and trust (Shao Yeh & Li, 2009).
Augmented reality. Augmented reality overlays digital data over a live camera feed
giving the appearance of the digital imagery being present in the physical world in a computer
mediated environment (Li et al., 2001; Yuzhu Lu & Smith, 2008). In contradiction to virtual
reality, augmented reality becomes a part of the real environment instead of creating life-like
scenes (Yuzhu Lu & Smith, 2008; Shim & Lee, 2011). Augmented reality can enhance product
viewing but it is an element in which the consumer controls what items to view and whether to
use it at all. Mobile apps geared toward apparel and accessories have seen the use of augmented
reality in glassware retailers where the consumers can digitally place the selected glasses on their
face (Magrath & McCormick, 2013b). Augmented reality has also been utilized in the beauty
industry as well as in the homewares market.
Mobile constructs in research
Multimedia product viewing, product promotion, and consumer led interactions can be
said to be elements that make up the low task visual design. The visual design is the aesthetics
of a site by using elements in terms of “balance, emotional appeal, and uniformity of the website
overall graphical look” (Cyr, 2008, p. 53). Hsu (2012) found that the more effective the visual
design, the easier time consumers have, therefore, improving a consumer’s intention to use a site.
Aesthetics had little influence on consumer’s evaluation of a website (Lončaric´, Prodan, &
Ribaric´, 2016).
Hasan (2016) examined the impact of website design (visual, navigation, and information
design) on a consumer’s perceived irritation in an online shopping environment. Ninety-three
27
undergraduates and graduate students at a university in the Midwest who had made a purchase
online in the past year participated in a simulation experiment. A real apparel site was used to
simulate the online shopping process with participants exiting out before a transaction was
completed. Hasan (2016) found that visual, navigation, and information design were all
significant predictors of customers’ perceived irritation therefore explaining a site’s undesirable
visual design could produce feelings of irritation towards the site. The design features such as
poor layouts, small font size, undesirable contrast of color, and inappropriate graphics should be
avoided to decrease the likelihood of feelings of irritation toward a site. Hasan (2016) noted the
importance of good visual design to sites that sell apparel products as it is the only way for a
consumer to assess a product’s look, feel, and quality.
Hasan (2016) found information design to be a significant indicator of perceived
irritation; however, was not as strong of an indicator as its counterparts (visual design and
navigation design). Hasan (2016) believed this could be due to the nature of the study as
participants were not required to make an actual purchase in the simulation experiment.
Therefore, little information seeking tendencies were required.
Research has shown that atmospherics have been analyzed from various aspects
including brick and mortar and websites. Atmospherics have usually been approached from a
high and low relevant task cue lens. The focus of this research is low relevant task cue,
specifically mobile design features. However, it is important to contrast the low task mobile
design feature elements of a mobile app with high task relevant cue. High task relevant cues
focus more on utilitarian based motivation and have often been shown to influence factors such
as usability, ease of use, and emotion. While high task relevant cues are important as is evident
by the body of research, there is more to a mobile app than these especially when the switching
28
cost barrier is low. Retailers must go beyond high task relevant cues to continue to drive traffic
and promote other end behavior.
Pleasure, Arousal, Dominance (PAD)
A store’s environment, a website’s layout, or as in the case of this study, a mobile app’s
design features create an atmosphere. This atmosphere generates emotional responses from the
consumer. The way consumers respond will in turn affect their behavior. According to
Mehrabian and Russell’s (1974) S-O-R paradigm, all emotional responses elicited can be
categorized into three states: arousal-non-arousal, pleasure-displeasure, and dominance-passivity
(Mehrabian & Russell, 1974; Ridgway, Dawson, & Bloch, 1990).
Pleasure is the evaluation of feelings ranging between depression to ecstasy. The
emotional state of pleasure consists of strong preference towards stimuli, positive reinforcement,
and satisfaction. Arousal is defined as an active response to stimulation that measures readiness.
Arousal can range from feelings of calm and unresponsive to high alert. Dominance is the extent
to which individuals feel control over or controlled by the environment. In other words,
dominance level ranges from submissiveness (controlled by the environment) to displaying
complete mastery over the environment (control over) (Clark, Ezell, Clark, & Sheffield, 2009;
Lutz & Kakkar, 1975; Mehrabian & Russell, 1974).
Functional features of a retail environment can create affective responses in consumers
and mood and emotions are the outcome of consumer response to the stimuli (Cheng, 2009; Roy
& Tai 2003). Novak, Hoffman, and Yung (2000) examined the relationship between online
experiences and consumer behaviors; it was found that web site features have an impact on
arousal. Wu, Lee, Fu, and Wang (2013) concluded that the layout design of a site as well as the
atmosphere had a positive influence on the emotional states of arousal and pleasure. Kim and
29
Lennon (2013) analyzed the effect of website design on emotion as part of a larger study on
website quality and reputation. They concluded that website design did in fact have a significant
influence on a consumers’ emotional state. Mummalaneni’s (2005) investigation of web site
characteristics, emotional response, and shopping behavior revealed a positive influence of web
site characteristics on pleasure and arousal, in addition the research supported the notion of a
consumer’s emotional state influencing their shopping behavior; however only pleasure and
arousal were analyzed. Therefore, based on the S-O-R paradigm and past research, it is safe to
conclude that mobile design features will have similar positive influences on a consumer’s
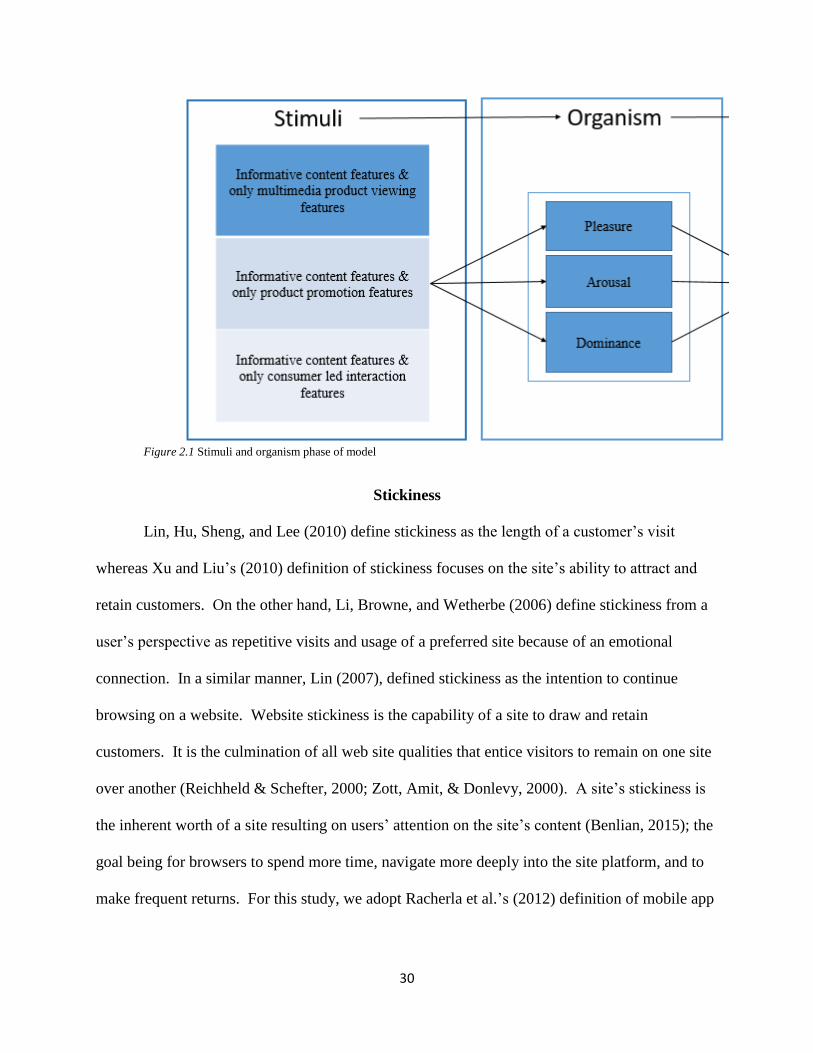
emotional state in the same manner that a website has had on consumers (see Figure 2.1).
Therefore, this study proposes:
H1a: Multimedia product viewing will have a significant positive affect on pleasure.
H1b: Multimedia product viewing will have a significant positive affect on arousal.
H1c: Multimedia product viewing will have a significant positive affect on dominance.
H2a: Product promotion features will have a significant positive affect on pleasure.
H2b: Product promotion features will have a significant positive affect on arousal.
H2c: Product promotion features will have a significant positive affect on dominance.
H3a: Consumer led interaction features will have a significant positive affect on
pleasure.
H3b: Consumer led interaction features will have a significant positive affect on arousal.
H3c: Consumer led interaction features will have a significant positive effect on
dominance.
30
Figure 2.1 Stimuli and organism phase of model
Stickiness
Lin, Hu, Sheng, and Lee (2010) define stickiness as the length of a customer’s visit
whereas Xu and Liu’s (2010) definition of stickiness focuses on the site’s ability to attract and
retain customers. On the other hand, Li, Browne, and Wetherbe (2006) define stickiness from a
user’s perspective as repetitive visits and usage of a preferred site because of an emotional
connection. In a similar manner, Lin (2007), defined stickiness as the intention to continue
browsing on a website. Website stickiness is the capability of a site to draw and retain
customers. It is the culmination of all web site qualities that entice visitors to remain on one site
over another (Reichheld & Schefter, 2000; Zott, Amit, & Donlevy, 2000). A site’s stickiness is
the inherent worth of a site resulting on users’ attention on the site’s content (Benlian, 2015); the
goal being for browsers to spend more time, navigate more deeply into the site platform, and to
make frequent returns. For this study, we adopt Racherla et al.’s (2012) definition of mobile app
31
stickiness. Racherla et al.’s (2012, p. 28) defined mobile app stickiness as “the time users spend
interacting with an app and how often consumers use the app to accomplish specific tasks.”
Stickiness increases with interactivity and if a retailer’s customer base perceives value in
the site, stickiness will increase. Stickiness is dependent on a variety of factors such as website
quality, satisfaction, attitude towards the site, and value (Li et al., 2006; Wang, 2010). Research
has also shown that stickiness is influenced by content value, context value, infrastructure value,
and promotional value of an e-retail website (Beldona & Cai, 2006; Xu & Liu, 2010). In
addition, if a consumer likes (emotion) a site, the intention to stick to the site increases (Hoffman
& Novak, 1996).
Stickiness is one of the most important characteristics of a site as it is a vital antecedent
to customer commitment, trust, and loyalty (Li et al., 2006; Wang, 2010). Stickiness has often
been considered an antecedent to loyalty which directly impacts a retailer’s bottom line;
therefore, businesses have put much emphasis on effective site design and strategies to increase
positive return behavior by improving site’ stickiness (Lin et al., 2010). For consumers,
stickiness is highly related to the “interestingness” of the site showing their level of satisfaction
to an extent. The stickier a site is, the more satisfied a consumer appears (Novak et al., 2000).
High levels of consumer stickiness are associated with attraction, conversion, and retention. All
of which are desirable qualities that businesses are interested in (Agarwal & Venkatesh, 2002).
If a consumer has positive emotions towards a mobile app, the more likely they are to spend
more time and return more often thus increasing stickiness toward the mobile app. Therefore,
this study proposes:
H5a: Pleasure will have a significant positive affect on mobile app stickiness intention.
H5b: Arousal will have a significant positive affect on mobile app stickiness intention.
32
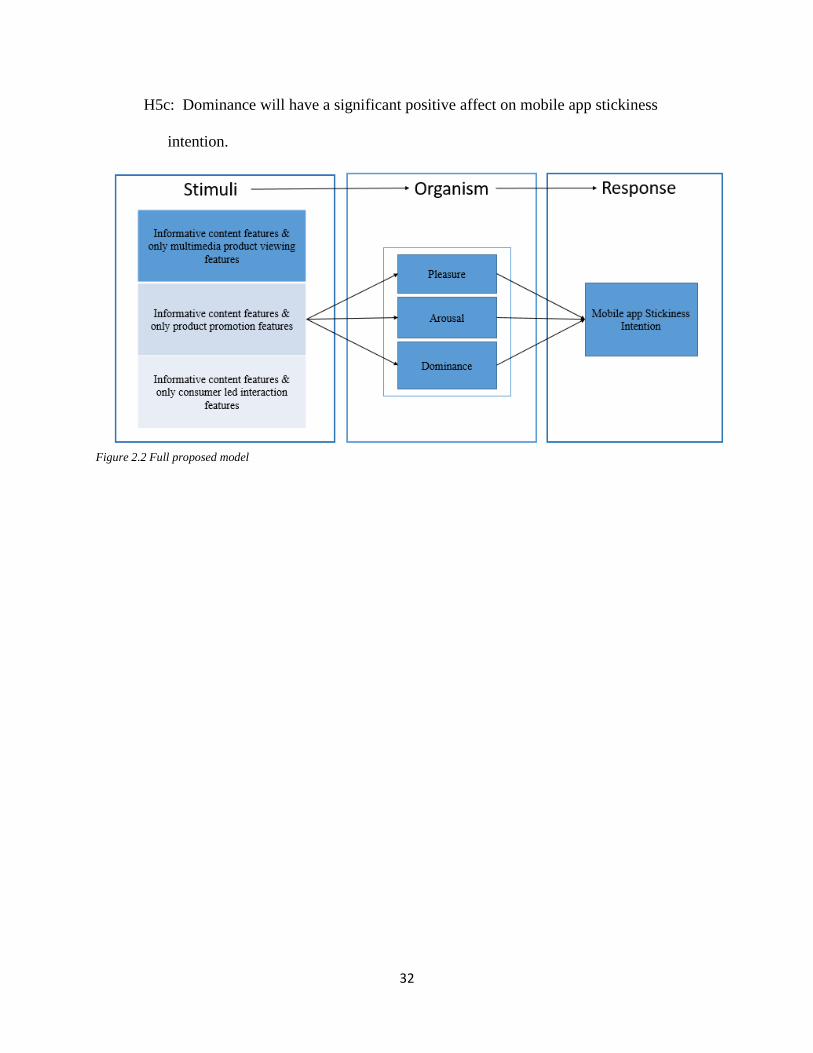
H5c: Dominance will have a significant positive affect on mobile app stickiness
intention.
Figure 2.2 Full proposed model
33
CHAPTER 3 THEORETICAL FRAMEWORK
Chapter 3 includes (a) overall research gaps, (b) Magrath and McCormick (2013b) m-
marketing design framework, (c) Mehrabian and Russell (1974) S-O-R paradigm, (d) proposed
conceptual model, and (e) summary of research hypotheses.
Overall Research Gaps
It has long been agreed that the environment in which consumers shop will impact their
purchasing decisions. Kotler (1973) coined the term atmospherics to refer to the creation of this
shopping environment. Specifically, the way in which a shopping environment is created will
affect both psychological and behavioral shopping outcomes. Baker (1986) created a typology
of the environment forming three categories: social, design, and ambient factors. Bitner (1992)
expanded Baker’s (1986) work, analyzing the social elements impact the service industry. While
Bitner (1992) redefined the preexisting typology; the dimensions are in line with the original and
serve as another milestone into the significance atmospherics play in the shaping of consumer
decision process.
The 1990s was the decade of the internet; however, by the early 2000s; it was clear that
the internet would remain as a mainstay medium for shopping. Therefore, many researchers
conducted numerous studies in online consumer behavior and atmospherics. It was then that
Eroglu et al. (2000) applied the traditional brick and mortar atmospherics concept into the online
retail setting. Eroglu et al. (2000) found the online store environment to be divided into two
factors: high task relevant cues and low task relevant cues. High task relevant cues consisted of
all the information and vital aspects of a shopping experience needed for a consumer to make a
34
purchase. On the other hand, low task relevant cues were the nonessential elements to complete
a purchase such as color, graphics, and other entertainment aspects. Since then much research
has been conducted to shape our understanding of how a physical and online store environment
will impact all aspects of the consumer’s decision process. While research into store
environment is vast (Eroglu et al., 2003; Floh & Madlberger, 2013; Hsieh et al., 2014; Mazaheri
et al., 2014; Richard & Habibi, 2016; Zhang et al., 2015), and much of the groundwork has been
laid; there is little research into how the “atmospherics” of the mobile environment will begin to
shape the mobile consumer decision process.
M-Marketing Design Framework
With the growth of the smartphone in the US still rising, it is essential for retailers to
have a thriving and successful mobile channel. Because this channel unlike any of the others is
ubiquitous, retail marketers have the challenge of creating a successful advantageous extension
of their preexisting channels. While researchers have explored the impact of marketing, stimuli,
design, information process, and emotion, in the online environment, few have analyzed the
effects of the marketing design for a mobile application (app).
One of the reasons to study mobile apps is the need to understand the differences between
mobile and online channels for retailers to select the best medium for their needs. This is
especially true as mobile phones display challenges unrelated to desktops or laptops such as
small screen size, internet data concerns, and localization features. Because of these issues in
conjunction with the lack of understanding of the mobile environment, it is necessary for
research to delve into the atmospherics of mobile, specifically mobile apps.
Magrath and McCormick (2013b) developed a framework to analyze the components of a
mobile app for a fashion retailer. As shown in Figure 3.1, the framework consists of 4 factors:
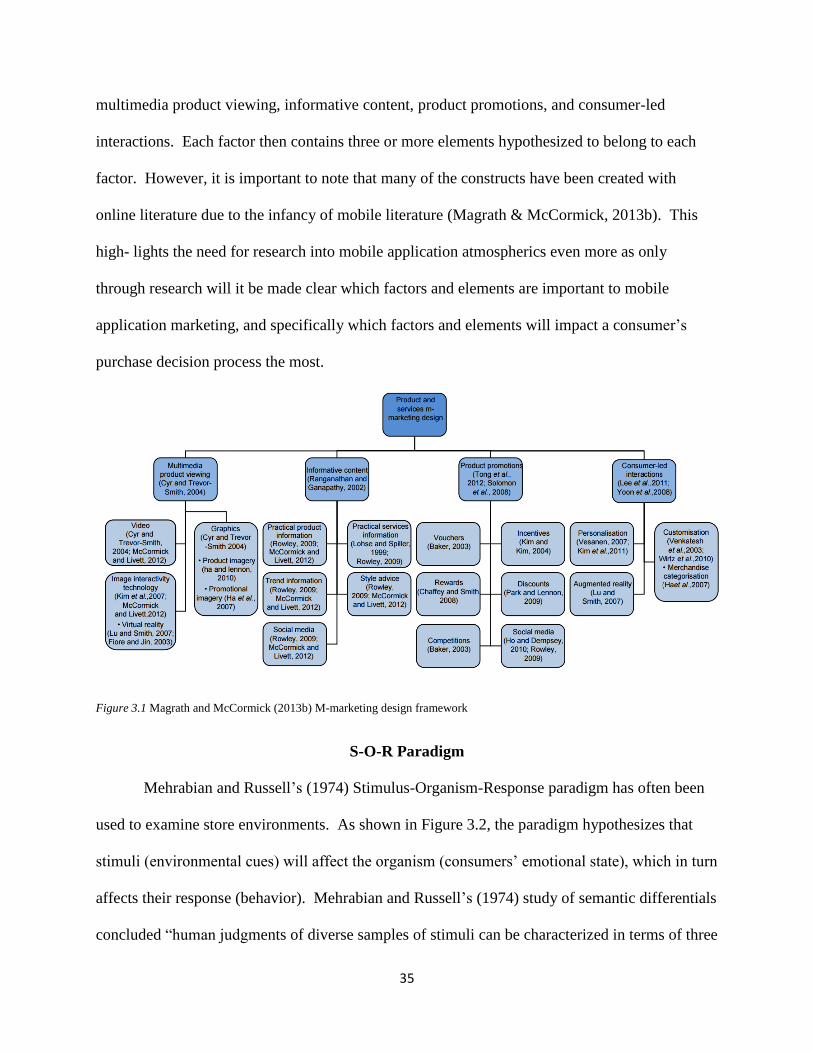
35
multimedia product viewing, informative content, product promotions, and consumer-led
interactions. Each factor then contains three or more elements hypothesized to belong to each
factor. However, it is important to note that many of the constructs have been created with
online literature due to the infancy of mobile literature (Magrath & McCormick, 2013b). This
high- lights the need for research into mobile application atmospherics even more as only
through research will it be made clear which factors and elements are important to mobile
application marketing, and specifically which factors and elements will impact a consumer’s
purchase decision process the most.
Figure 3.1 Magrath and McCormick (2013b) M-marketing design framework
S-O-R Paradigm
Mehrabian and Russell’s (1974) Stimulus-Organism-Response paradigm has often been
used to examine store environments. As shown in Figure 3.2, the paradigm hypothesizes that
stimuli (environmental cues) will affect the organism (consumers’ emotional state), which in turn
affects their response (behavior). Mehrabian and Russell’s (1974) study of semantic differentials
concluded “human judgments of diverse samples of stimuli can be characterized in terms of three
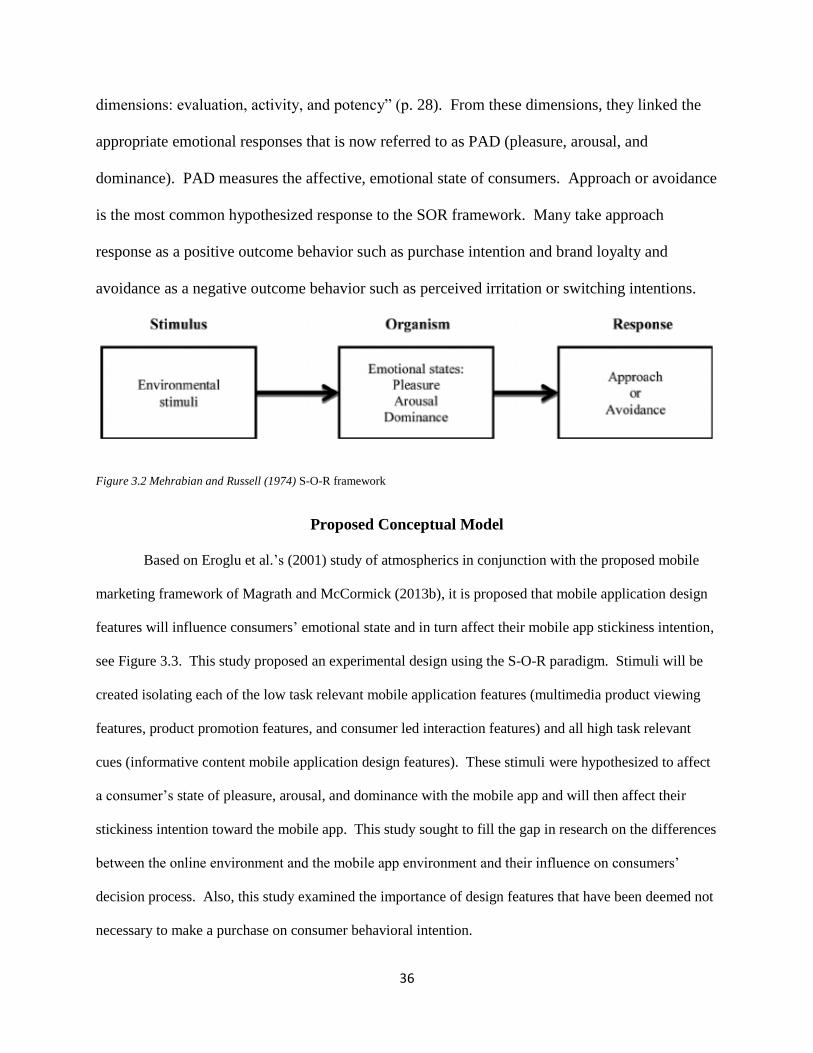
36
dimensions: evaluation, activity, and potency” (p. 28). From these dimensions, they linked the
appropriate emotional responses that is now referred to as PAD (pleasure, arousal, and
dominance). PAD measures the affective, emotional state of consumers. Approach or avoidance
is the most common hypothesized response to the SOR framework. Many take approach
response as a positive outcome behavior such as purchase intention and brand loyalty and
avoidance as a negative outcome behavior such as perceived irritation or switching intentions.
Figure 3.2 Mehrabian and Russell (1974) S-O-R framework
Proposed Conceptual Model
Based on Eroglu et al.’s (2001) study of atmospherics in conjunction with the proposed mobile
marketing framework of Magrath and McCormick (2013b), it is proposed that mobile application design
features will influence consumers’ emotional state and in turn affect their mobile app stickiness intention,
see Figure 3.3. This study proposed an experimental design using the S-O-R paradigm. Stimuli will be
created isolating each of the low task relevant mobile application features (multimedia product viewing
features, product promotion features, and consumer led interaction features) and all high task relevant
cues (informative content mobile application design features). These stimuli were hypothesized to affect
a consumer’s state of pleasure, arousal, and dominance with the mobile app and will then affect their
stickiness intention toward the mobile app. This study sought to fill the gap in research on the differences
between the online environment and the mobile app environment and their influence on consumers’
decision process. Also, this study examined the importance of design features that have been deemed not
necessary to make a purchase on consumer behavioral intention.
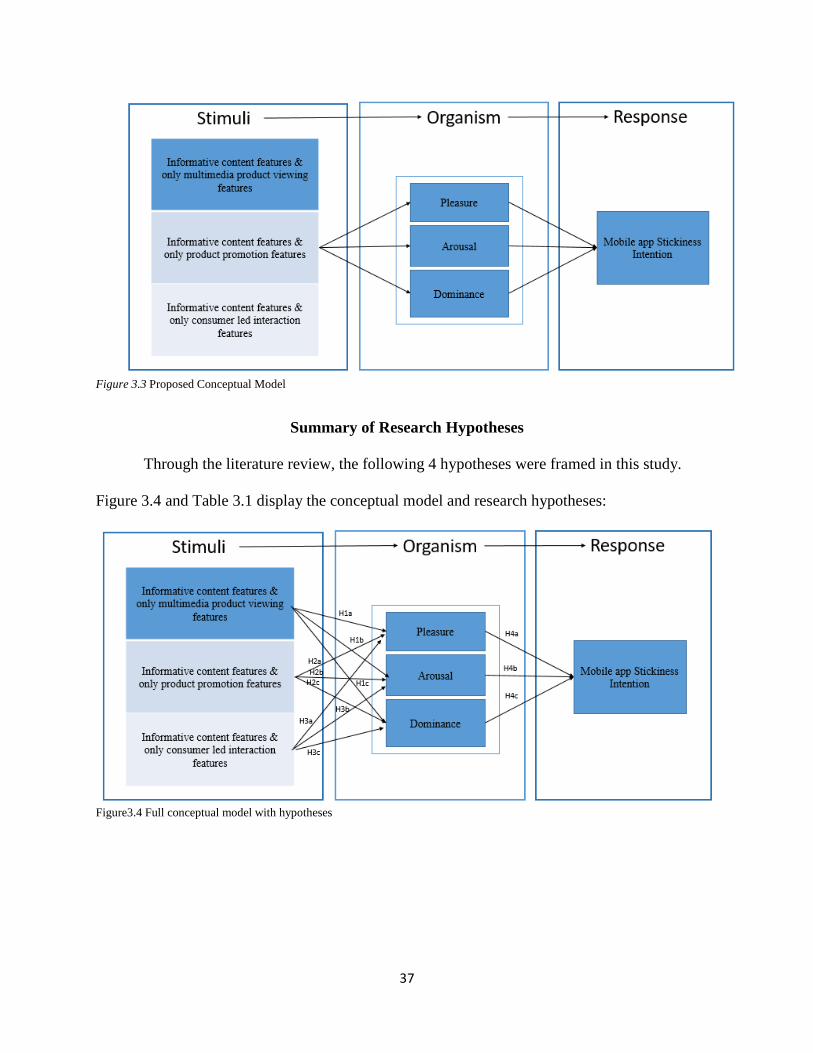
37
Figure 3.3 Proposed Conceptual Model
Summary of Research Hypotheses
Through the literature review, the following 4 hypotheses were framed in this study.
Figure 3.4 and Table 3.1 display the conceptual model and research hypotheses:
Figure3.4 Full conceptual model with hypotheses
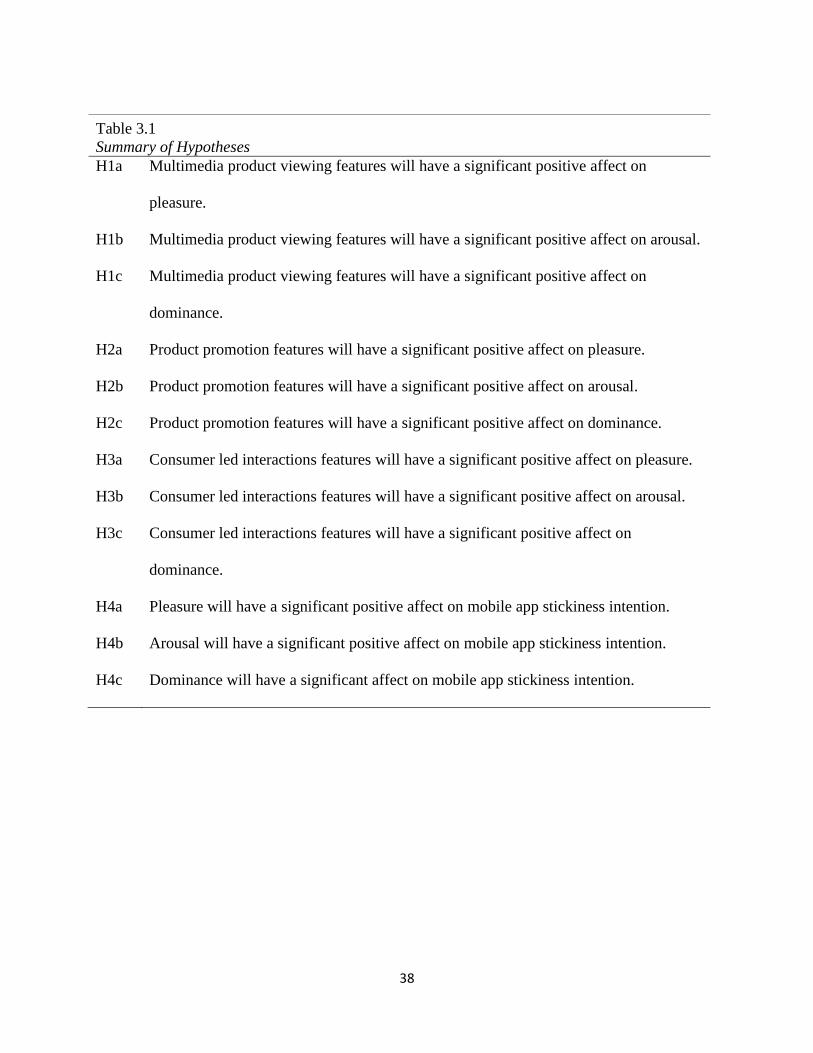
38
Table 3.1
Summary of Hypotheses
H1a Multimedia product viewing features will have a significant positive affect on
pleasure.
H1b Multimedia product viewing features will have a significant positive affect on arousal.
H1c Multimedia product viewing features will have a significant positive affect on
dominance.
H2a Product promotion features will have a significant positive affect on pleasure.
H2b Product promotion features will have a significant positive affect on arousal.
H2c Product promotion features will have a significant positive affect on dominance.
H3a Consumer led interactions features will have a significant positive affect on pleasure.
H3b Consumer led interactions features will have a significant positive affect on arousal.
H3c Consumer led interactions features will have a significant positive affect on
dominance.
H4a Pleasure will have a significant positive affect on mobile app stickiness intention.
H4b Arousal will have a significant positive affect on mobile app stickiness intention.
H4c Dominance will have a significant affect on mobile app stickiness intention.
39
CHAPTER 4 METHODS
This chapter includes (a) research design, (b) experimental design, (c) phase 1: pilot
study, and (d) phase 2: SOR experiment.
Research Design
The main purpose of this study was to examine the impact of several types of mobile
design features (e.g., multimedia product viewing features, product promotion features, and
consumer led interaction features) on consumer’s behavioral intentions mediated through a
consumer’s emotional response (pleasure, arousal, and dominance). The research model is
presented in Figure 3. In this model, three stimuli are presented to capture mobile design
features, each of the three design features with the respected high task relevant cues. A
consumers’ emotional response (PAD) was the mediator, and mobile app stickiness was the
dependent variable. The conceptual model was tested using an experimental design survey
method in a mobile application setting. Past research into store environments used experimental
design to simulate real life experiences, and this study recreated a real life mobile shopping
experience. In addition, the usage of the S-O-R paradigm itself was experimental in nature.
Experimental design has high internal validity due to low self-reporting as participants were
responding to stimuli mechanisms. However as experimental design creates artificial situations,
generalizability was limited due to lower external validity.
Experimental design
As shown in table 4.1, this study employed a 3 (mobile design feature: present/ absent) x
2 (type of scenario: hedonic vs utilitarian shopping trips) experimental design. Participants were
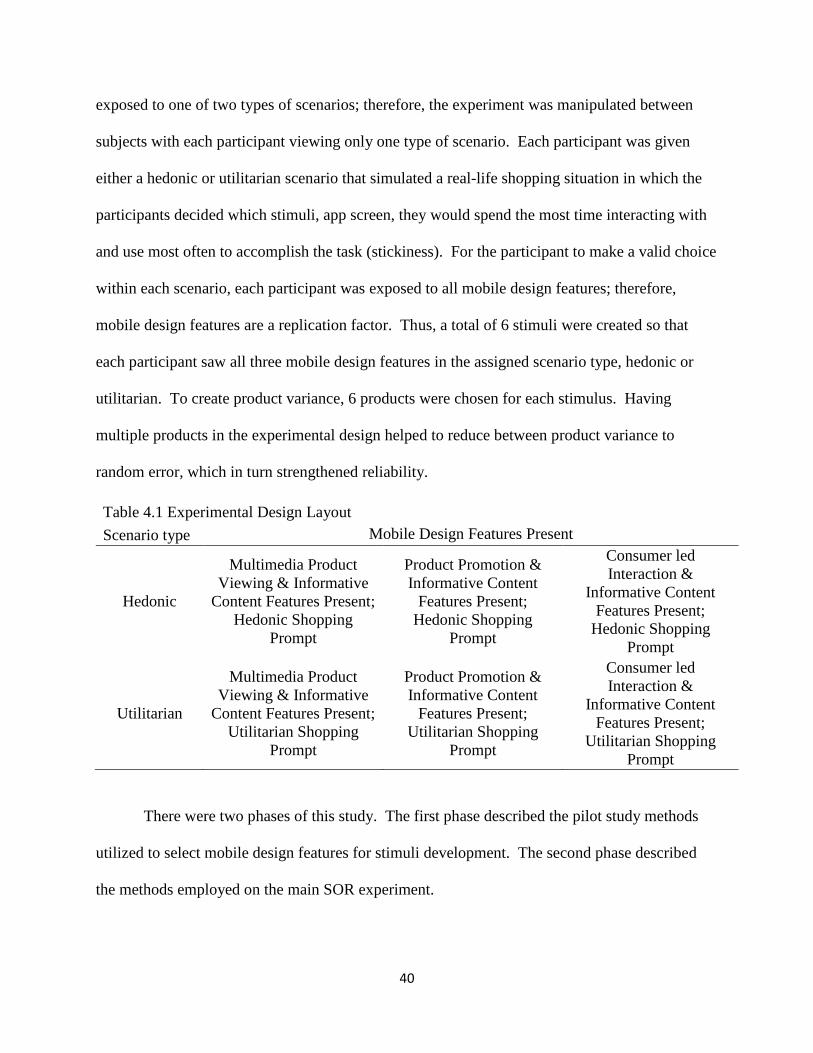
40
exposed to one of two types of scenarios; therefore, the experiment was manipulated between
subjects with each participant viewing only one type of scenario. Each participant was given
either a hedonic or utilitarian scenario that simulated a real-life shopping situation in which the
participants decided which stimuli, app screen, they would spend the most time interacting with
and use most often to accomplish the task (stickiness). For the participant to make a valid choice
within each scenario, each participant was exposed to all mobile design features; therefore,
mobile design features are a replication factor. Thus, a total of 6 stimuli were created so that
each participant saw all three mobile design features in the assigned scenario type, hedonic or
utilitarian. To create product variance, 6 products were chosen for each stimulus. Having
multiple products in the experimental design helped to reduce between product variance to
random error, which in turn strengthened reliability.
Table 4.1 Experimental Design Layout
Scenario type Mobile Design Features Present
Hedonic
Multimedia Product
Viewing & Informative
Content Features Present;
Hedonic Shopping
Prompt
Product Promotion &
Informative Content
Features Present;
Hedonic Shopping
Prompt
Consumer led
Interaction &
Informative Content
Features Present;
Hedonic Shopping
Prompt
Utilitarian
Multimedia Product
Viewing & Informative
Content Features Present;
Utilitarian Shopping
Prompt
Product Promotion &
Informative Content
Features Present;
Utilitarian Shopping
Prompt
Consumer led
Interaction &
Informative Content
Features Present;
Utilitarian Shopping
Prompt
There were two phases of this study. The first phase described the pilot study methods
utilized to select mobile design features for stimuli development. The second phase described
the methods employed on the main SOR experiment.
41
Phase 1: Pilot Study for Selection of Mobile Design Features
The purpose of this study was to investigate mobile design features and to see their
influence on consumers’ emotional response and behavior. Therefore, this study required the
need for mobile design features to be selected due to the vast number of features currently
present in the design of mobile applications. The selection of mobile design features took a two-
step approach.
First, a pilot study was conducted to generate and understand the feasibility of the stimuli
being developed for the main study. Pilot studies can be quantitative or qualitative in nature. In
fact, researchers often use “qualitative data collection and analysis on a relatively unexplored
topic, using the results to design a subsequent quantitative phase of the study” (Tashakkori &
Teddlie, 1998, p. 47). Since mobile app research along with low task design features are still a
relatively new area of research, a qualitative pilot study was proposed. An in-depth interview
was conducted to address the features to be used in a large-scale questionnaire survey (Van
Teijlingen & Hundley, 2010).
Qualitative interviews were used as the researcher sought to gain in-depth knowledge
from participants about their experiences with mobile shopping apps. In order to create a
complete picture of the experiences of the participants, open-ended interview were necessary so
that participants could share their depth of knowledge on the topic (deMarrais, 2004). In-depth
semi structured qualitative interviews were employed. The researcher was interested in how
consumers navigated apps, their behaviors while on an app, how consumers responded to certain
features within an app, and their likes and dislikes of an app and its features.
Therefore, in-depth qualitative interviews were collected to determine what mobile
design features as well as which high task cues should be selected for stimuli development. The
42
researcher interviewed seven students and recorded their mobile screen session during the
interview. The aim of the interview was to shed some insight into the following stimuli
development research questions:
RQ1: To explore mobile applications and features that drive consumer purchases on
mobile devices and to understand the typical behavior of the mobile shopper their mobile
shopping process.
RQ2: To explore the mobile application design features that aid in consumer shopping
process and identify mobile application design features most prevalent in mobile
shopping.
Case selection for pilot study
The sample for the pilot study was purposive in nature. Critical case purposive sampling
was used as the sample size was small, seven, and the researcher selected participants aware of
the phenomena, shopping on mobile apps (Etikan, Musa, & Alkassim, 2016). Critical case
purposive sampling is a form of intensity sampling as it seeks to find information rich cases.
Thus, intensity sampling seeks individuals who are well informed with the phenomena of interest
(Roulston & Martinez, 2015). The pilot study utilized millennial students as the sample.
Millennials or Generation Y, individuals born between the years of 1981 and 2004, are the first
generation to grow up with technology, and thus are up to date and comfortable with technology
and its various uses. This is especially true in the case of smartphones as their usage of
smartphones out rank any other generation (Donnelly & Scaff; "Millennials”, 2014). Therefore,
using millennials as the sample generated an accurate and knowledgeable representation of
design features in mobile apps.
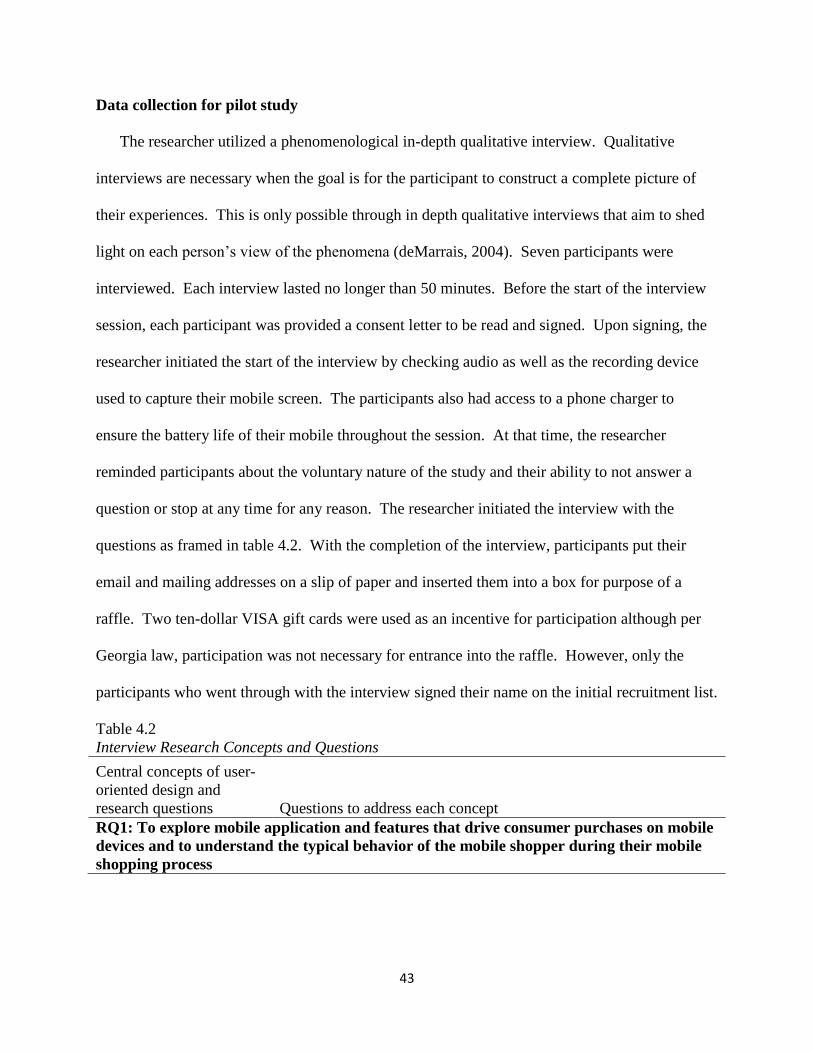
43
Data collection for pilot study
The researcher utilized a phenomenological in-depth qualitative interview. Qualitative
interviews are necessary when the goal is for the participant to construct a complete picture of
their experiences. This is only possible through in depth qualitative interviews that aim to shed
light on each person’s view of the phenomena (deMarrais, 2004). Seven participants were
interviewed. Each interview lasted no longer than 50 minutes. Before the start of the interview
session, each participant was provided a consent letter to be read and signed. Upon signing, the
researcher initiated the start of the interview by checking audio as well as the recording device
used to capture their mobile screen. The participants also had access to a phone charger to
ensure the battery life of their mobile throughout the session. At that time, the researcher
reminded participants about the voluntary nature of the study and their ability to not answer a
question or stop at any time for any reason. The researcher initiated the interview with the
questions as framed in table 4.2. With the completion of the interview, participants put their
email and mailing addresses on a slip of paper and inserted them into a box for purpose of a
raffle. Two ten-dollar VISA gift cards were used as an incentive for participation although per
Georgia law, participation was not necessary for entrance into the raffle. However, only the
participants who went through with the interview signed their name on the initial recruitment list.
Table 4.2
Interview Research Concepts and Questions
Central concepts of user-
oriented design and
research questions Questions to address each concept
RQ1: To explore mobile application and features that drive consumer purchases on mobile
devices and to understand the typical behavior of the mobile shopper during their mobile
shopping process
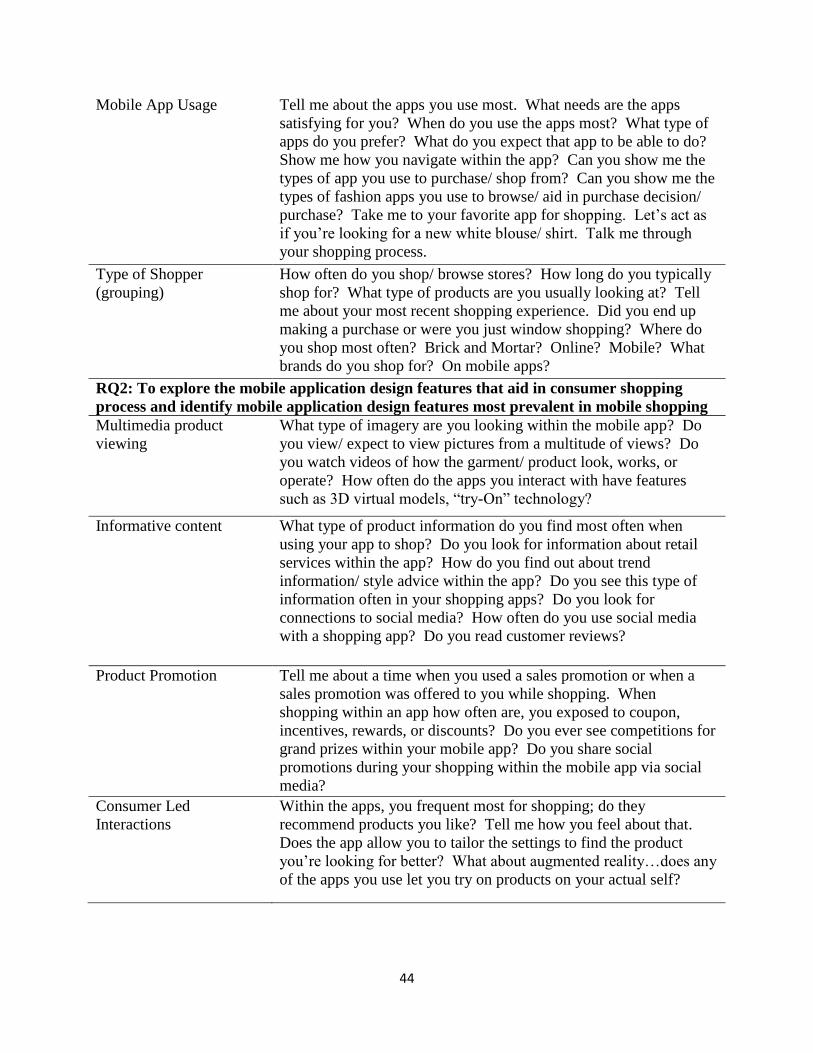
44
Mobile App Usage
Tell me about the apps you use most. What needs are the apps
satisfying for you? When do you use the apps most? What type of
apps do you prefer? What do you expect that app to be able to do?
Show me how you navigate within the app? Can you show me the
types of app you use to purchase/ shop from? Can you show me the
types of fashion apps you use to browse/ aid in purchase decision/
purchase? Take me to your favorite app for shopping. Let’s act as
if you’re looking for a new white blouse/ shirt. Talk me through
your shopping process.
Type of Shopper
(grouping)
How often do you shop/ browse stores? How long do you typically
shop for? What type of products are you usually looking at? Tell
me about your most recent shopping experience. Did you end up
making a purchase or were you just window shopping? Where do
you shop most often? Brick and Mortar? Online? Mobile? What
brands do you shop for? On mobile apps?
RQ2: To explore the mobile application design features that aid in consumer shopping
process and identify mobile application design features most prevalent in mobile shopping
Multimedia product
viewing
What type of imagery are you looking within the mobile app? Do
you view/ expect to view pictures from a multitude of views? Do
you watch videos of how the garment/ product look, works, or
operate? How often do the apps you interact with have features
such as 3D virtual models, “try-On” technology?
Informative content
What type of product information do you find most often when
using your app to shop? Do you look for information about retail
services within the app? How do you find out about trend
information/ style advice within the app? Do you see this type of
information often in your shopping apps? Do you look for
connections to social media? How often do you use social media
with a shopping app? Do you read customer reviews?
Product Promotion Tell me about a time when you used a sales promotion or when a
sales promotion was offered to you while shopping. When
shopping within an app how often are, you exposed to coupon,
incentives, rewards, or discounts? Do you ever see competitions for
grand prizes within your mobile app? Do you share social
promotions during your shopping within the mobile app via social
media?
Consumer Led
Interactions
Within the apps, you frequent most for shopping; do they
recommend products you like? Tell me how you feel about that.
Does the app allow you to tailor the settings to find the product
you’re looking for better? What about augmented reality…does any
of the apps you use let you try on products on your actual self?
45
Data interpretations of pilot study
Upon completion of participant interviews and observation, the recorded audio data were
downloaded and transcribed through Transcribe.Wreally and exported into Microsoft Word. In
adherence to the IRB protocol, all subjects and identity linkage were coded. All names were
changed to pseudonyms. Once transcriptions were complete; the researcher double checked the
transcription; in addition, any written notes that were not audio recoded from the researcher were
added. During this process, the researcher pieced together concepts as well as double check
transcripts, requiring the researcher to be fully engaged with the data.
The researcher extracted emerging themes and concepts from the coded and interpreted
transcripts. The McCracken’s guide (1988) was used allowing a detailed analysis where the
researcher is fully immersed and can put together and break apart the data, finding details and
moving to general observations. Creswell’s (2007) analysis spiral or cyclical process was also
used. This process codes and classifies concepts, identifies themes and sub themes through a
clustering method in which data is brought together to be pulled apart and brought together in
different groupings. The spiral process starts with raw data moving towards themes to only
narrow itself down into the most basic themes to represent the data. This method of theme
development resulted in numerous more detailed sub themes under the main themes (Creswell,
2007). The goal was to create a prototype of mobile design features for stimuli development.
Pilot analysis and stimuli development
Sample characteristics. After receiving Institutional Review Board approval, a total of
twelve participants were recruited through in class recruitment process. The recruitment took
place during a fashion merchandising class; however, all students were not fashion majors. The
class was selected for convenience; however, intensity sampling does strive to find individuals
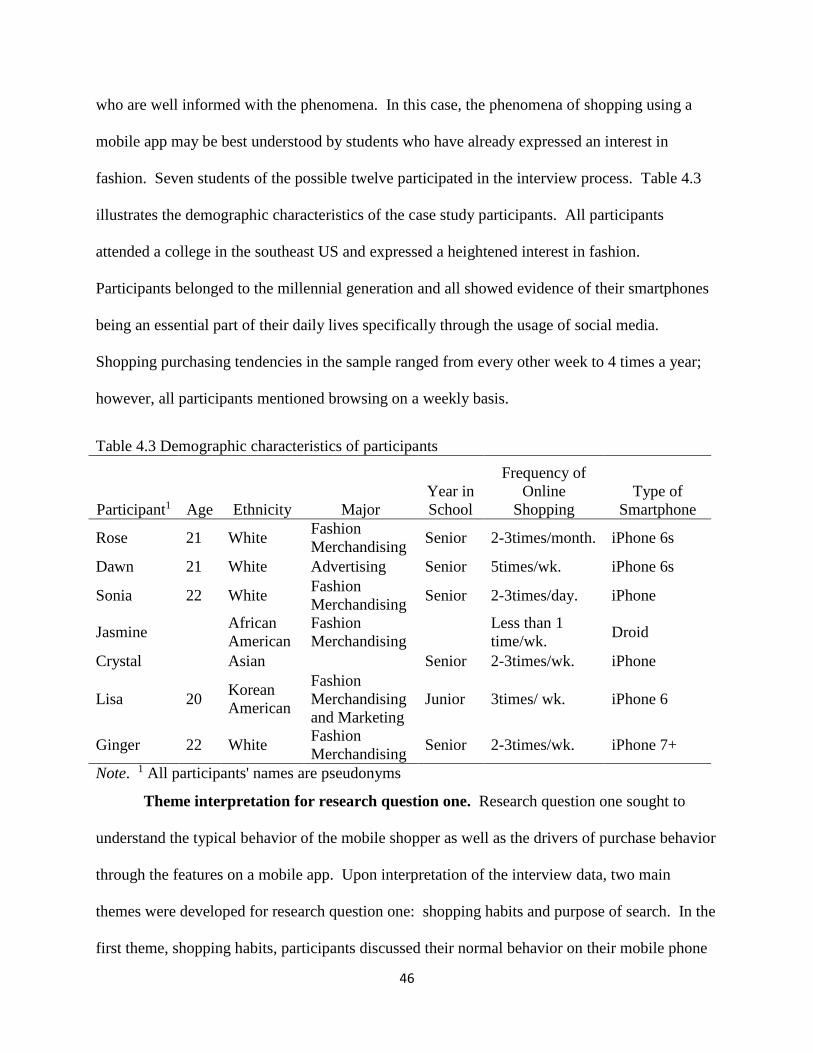
46
who are well informed with the phenomena. In this case, the phenomena of shopping using a
mobile app may be best understood by students who have already expressed an interest in
fashion. Seven students of the possible twelve participated in the interview process. Table 4.3
illustrates the demographic characteristics of the case study participants. All participants
attended a college in the southeast US and expressed a heightened interest in fashion.
Participants belonged to the millennial generation and all showed evidence of their smartphones
being an essential part of their daily lives specifically through the usage of social media.
Shopping purchasing tendencies in the sample ranged from every other week to 4 times a year;
however, all participants mentioned browsing on a weekly basis.
Theme interpretation for research question one. Research question one sought to
understand the typical behavior of the mobile shopper as well as the drivers of purchase behavior
through the features on a mobile app. Upon interpretation of the interview data, two main
themes were developed for research question one: shopping habits and purpose of search. In the
first theme, shopping habits, participants discussed their normal behavior on their mobile phone
Table 4.3 Demographic characteristics of participants
Participant1 Age Ethnicity Major
Year in
School
Frequency of
Online
Shopping
Type of
Smartphone
Rose 21 White Fashion
Merchandising Senior 2-3times/month. iPhone 6s
Dawn 21 White Advertising Senior 5times/wk. iPhone 6s
Sonia 22 White Fashion
Merchandising Senior 2-3times/day. iPhone
Jasmine
African
American
Fashion
Merchandising
Less than 1
time/wk. Droid
Crystal
Asian
Senior 2-3times/wk. iPhone
Lisa 20 Korean
American
Fashion
Merchandising
and Marketing
Junior 3times/ wk. iPhone 6
Ginger 22 White Fashion
Merchandising Senior 2-3times/wk. iPhone 7+
Note. 1 All participants' names are pseudonyms
47
to include typical daily interactions with their device. For the second theme, purpose of search,
participants expressed the differences in their behavior based on the nature of their search. In
other words, participants shared their experience of how they shopped on a mobile app for a need
based purchase versus a “window” shopping purchase.
Shopping habits. Through the exploration of participants’ typical routine in relation to
their mobile usage, the results of the analysis revealed participants need to use their phone
throughout their day to distract themselves as well as to see what everyone in their social circle is
doing. In exploring shopping habits, it became clear early in the interview process that many
millennials frequented mobile apps specifically social media and retail apps as a way to keep
boredom at bay as well as to stay current with what was new in their favorite stores.
Sonia: Um, definitely before I go to sleep, when I wake up, um…in between
classes…sometimes in class, haha, uh… just whenever I’m bored
Dawn: Snapchat and Instagram…those are like my go to, and probably like when I’m
bored I use Facebook…just scrolling through
Rose: I actually have like a um, folder on my phone that’s just labeled shopping for my
store apps and stuff…so occasionally I’ll actually you know whenever I want to see if
you know one of my favorite shops has anything new. I’ll just get on the app and look at
it and stuff.
Purpose of search. Participants utilized numerous retail apps to shop.; however, they
frequented a particular retail app dependent on the reason they were shopping. For instance,
48
Sonia noted that the placement of her retail apps on her phone were dependent on how often she
shopped those apps as well as by average price of the garments.
Sonia: Yeah, these I use more frequently and then these I don’t use as frequently or like
maybe I don’t need to use these as frequently because they’re bad for my bank account.
When the researcher asked the participant to walk them through their shopping process
given the need to find a specific garment, many participants went to an app they were most
familiar with as well as one that they would typically purchase from in comparison to some of
the apps they frequented to stay “in the know”.
Sonia: I love nasty gal so that’s where I would go to probably…I can go here and see
what type of dresses…so for wedding maybe I want a black dress so you just scroll
through, click on this, heart it where it would save it to my things, or I could just buy it.
In addition, when given a specific item to look for participants immediately begin their
shopping process by narrowing down the search as well as by frequenting product reviews or
suggested items.
Dawn: So I typically um, if I want a white blouse, I’m usually like…I like to know
visually what it looks like on a person
49
In comparison when Dawn showed interest in a new trend of black crop tops, she spoke
of gaining inspiration as well as spending numerous hours just browsing to see the many
variation retailers offered of this trend with no real intentions to actually make a purchase.
Dawn: what looks really cute with the stuff that I have, and I try to get inspiration…is it
something I really want, what did these girls do with it….it could be anywhere from like
30minutes to 3 hours…if I have absolutely nothing going on.
Theme interpretation for research question two. Upon interpretation of the interview
data, three main themes were developed for research questions two (explore the mobile
application design features that aid in consumer shopping process and identify mobile
application design features most prevalent in mobile shopping): picture and videos, promos, and
suggestions. These themes aligned with the mobile design features described previously. The
first theme, pictures and videos, aligned with the mobile design feature multimedia product
viewing. In this theme, participants discussed their views and experiences with product images
and videos as well as their wishes for more features such as these. The second theme, promos,
aligned with the mobile design feature product promotion. Participants discussed their
experiences with using features such as promo codes, discounts, and love of free shipping. The
third theme, suggestions, paired with the mobile design feature consumer led interactions.
Participants shared their views toward suggested items and product reviews. Because the themes
that emerged during the interpretation of the data aligned so closely with the framework defined
by Magrath and McCormick (2013b) and to aid in understanding, the themes are discussed using
the mobile design features: multimedia product viewing, product promotions, and consumer led
50
interactions. These findings helped to shape the understanding of the design aspect of current
retail mobile apps.
Multimedia product viewing. Through the exploration of mobile apps’ multimedia
product viewing, the results of the analysis revealed two features most present in multimedia
product viewing: multiple pictures and videos. The participants described their shopping
experiences in the need to see multiple images of products and their mixed emotions on the
display of video showcasing the product. In exploring multimedia product viewing, it became
clear that multiple images had a strong connection to a consumer’s browsing behavior.
Crystal: The first thing I do is look at the multiple views.
Sonia: I look at the different pictures and the close-ups of it, what they paired it
with sometimes.
Almost all the retail brands mentioned had apps displaying products with multiple views.
These views most often involved the participant swiping to the right and was denoted by the
presence of an ellipses, showing how many images there were. Some retailer apps such as
Nordstrom, Urban Outfitters, and H&M displayed their images by the next view being partly
visible. When the number of images displayed was mentioned, Sonia stated “I think it has 3 or
4. Probably at the minimum 3, most 4 or 5 sometimes.” Apps that displayed only one or two
images were frowned upon as participants voiced their concern over lack of views to be able to
gauge what the product looked like from all possible angles, citing it as very important because
they were not able to hold the physical garment.
51
Rose: I hate it, for instance, I love Topshop, but they only give you 1 picture. I
guess it just depends on the app.
Sonia: I probably won’t buy anything from there because you want to see what
the whole thing looks like.
The importance of multiple images was stressed repeatedly. Dawn told a story of
getting scammed on Cyber Monday when attempting to purchase boots. Since then she
has become very wary and untrusting of retailers. Due to this, she relies on several
features to discern the trustworthiness of retailers and their products.
Dawn: I think it's very important I like to be able to see front, back. Um, I think
it's really cool that they moved to like 360 view and stuff. Um, that's really cool
when companies do that and your kind of able to scroll around and see, but I'm
definitely a person where I take it into consideration, like some dresses they have
a cute front but the back maybe go down too low. …I'm like well it might go too
low for how short I am.
One of the components that arose was the usage of videos to aid in showcasing
products. Many participants were indifferent to whether they were present; however,
they noted that when they did see a video option they almost always viewed them. When
asked what retailers they were familiar with who had video options, it was surprising to
find out most of the apps that participants frequented did not have video features, apart
52
from the mobile retailer, ASOS. Two of the participants noted the importance of videos
to help see how the garment flowed on a human form.
Sonia: They have like little videos where you can watch them walk…but if I
can’t tell if a garment is like tight fitting or loose or exactly how the material is
going to look, then it helps because you can see how it flows when you’re
walking in it.
Crystal: I much prefer the video cause it’s like moving, and with the picture you
don’t know if the model has to sit, stand in an awkward position to make sure the
garment looks well…so seeing the video is a lot more ensuring.
Product promotions. Participants utilized numerous forms of promotions; however, they
never went searching for them purposely. This could be due to the placement of the promotional
material as most participants made remarks of a top banner showing the sales information or
pasted in large font on the home screen of the mobile app. Others noted belonging to a loyalty
program or signing up for notifications and receiving promotional material through email.
Upon receipt of promotional material, many would begin to browse to see what they
would find. Dawn expressed that she is constantly browsing for dresses for formals and parties
to attend. While she plans to wear the garments more than once, she always looks for a new
dress to wear for the big events. Due to this need, when she stumbles upon a sale, she takes her
time to maximize her saving and suit her needs.
53
Dawn: Recently when I bought my formal dresses from Tibi, it was 50% off your entire
order…So I ended up ordering like I think 4 dresses after that. I was like 50% of each
dress would be like 12 dollars or something. I can’t remember what it was; I used that,
that was a big thing…I took advantage of that.
Consumer-led interactions. Participants were split in their view of consumer led
interactions. The two most commonly mentioned features were suggested items and product
reviews. The suggested items displayed on retail apps were usually of the same style and price
point; however, they showcased assorted colors and brands. At times, the retail apps would split
these items into ‘consumer has recently viewed’ or ‘other consumers had viewed’ and ‘you
might also like’ sections. Half of the participants were indifferent towards suggested items
stating they made no difference to them and they never looked at them. While others viewed
them in order to pass the time.
Rose: I’ll look at them…but I don’t want to get distracted so I look at a garment
and I’ll go back to that page…but if it is something that I’m kind of on the edge about
and um then I’ll look at the related stuff and see maybe if they suggest something that is
similar to this and maybe I’ll like it better. Sometimes I do find things…it depends on
the price…usually the same price which I don’t like cause usually I’m like dang that’s a
really cute jacket but that is way too expensive. Related products are basically the same
price just a different designer and in just a different color so I’m like no that doesn’t help
me there.
54
Crystal: Once I browse through pretty much all of my options, I go to the ‘you might
also like’ cause then they’ll throw in some color, and then I’ll get sidetracked to those,
and then I’ll like go through those.
All participants expressed their love for and the importance of reviews. Many noted how
the retail apps varied on the amount of information posted in reviews. For instance, Rent the
Runway and ModCloth were praised for extremely detailed reviews and their ability to allow
consumers to post self-portraits wearing the clothes.
Jasmine: Modcloth does it better cause sometimes the review features the customer
wearing it themselves. They have very thorough reviews; the fit, if it’s true to size, what
was wrong with it…and that’s important to me.
Rose: I really like how they give the renter access to type in there and give a
review…you can say however much you want to say.
Participants were not very pleased when some of their favorite apps like ASOS did not
put reviews on product pages and expressed that at times this made them switch apps especially
if it was a product that they were unsure about.
Sonia: I’ll look at their reviews too. ASOS doesn’t give reviews which is sometimes
annoying.
55
Customer reviews also appeared to be vital in the formation of the decision whether to
purchase a garment. Participants indicated that when shopping online, these reviews provided
necessary information on how the garment wore, how the material felt, and if the money was
worth it.
Sonia: I definitely like to look at customer reviews and see how it worked for them.
Crystal: I love them. If a single review says the product is not worth it, I’ll move on. I
won’t even give it a chance.
Stimuli development process. Through the exploration of participants’ mobile shopping
experiences, many types of retailers were mentioned from department stores such as Nordstrom
and Bloomingdales to specialty retailers such as Urban Outfitters and H& M to pure play, online
presence only, retailers like ASOS. Using the information gleaned from interview data and
exploration of suggested retail apps, stimuli were developed to mimic shopping experiences
detailed by the participants. The retail apps and design elements used are shown in table 4.4.
ASOS and Nordstrom were used to create the multimedia product viewing stimuli.
ASOS was the only app mentioned that had videos of models displaying the products; therefore,
the video icon image was utilized to stimulate this feature. In addition, all apps had the ability to
show multiple images of a product. Many participants stated that retail apps had at least three
views. All apps showcased the multiple images of a product by swiping left or right on the
image usually denoted by the presence of an ellipse at the bottom of the product image. Images
from Nordstrom were utilized as the additional images were half displayed opaquely next to the
56
image urging consumers to swipe right. In addition, the ellipses from ASOS were also utilized to
make this feature more evident.
Numerous retailers were utilized to create the product promotion stimuli. This was
mainly due to the nature of product promotion as not all retailers have all promotions at the same
time; therefore, the retailers used were chosen from the apps participants mentioned in the pilot
study as well as retailers who had a current ongoing product promotion at the time of the stimuli
creation. Product images and other informative content from Anthropologie, Shopbop and
Nordstrom were utilized. Incentive elements utilized were pulled from Anthropologie and
Bloomingdales. Bloomingdales was also utilized for reward elements specifically loyalty sign
in. Anthropologie and Shopbop were also used to display discount elements through the usage
of their clearance section. Many apps used a share option to promote social media promotion;
however, Anthropologie had the clearest icon to showcase this element.
ASOS, Rent the Runway, and Nordstrom were chosen to create the stimuli for consumer
led interactions. Nordstrom was used for hard task relevant cues as well as product reviews to
display customization elements. Images from Rent the Runway and ASOS were used for
product selection. In addition, elements from both were manipulated for the creation of “people
who viewed this also viewed” and “you may also like” element.
In addition, to the selected mobile design feature (multimedia product viewing, product
promotion, and consumer led interactions) all stimuli also showed hard task relevant cues.
Through the interview process, hard task relevant cues were aligned with the mobile design
feature of informative content. Informative content is textual in nature and includes information
consumers need to make an informed purchase such a price, color options, and size.
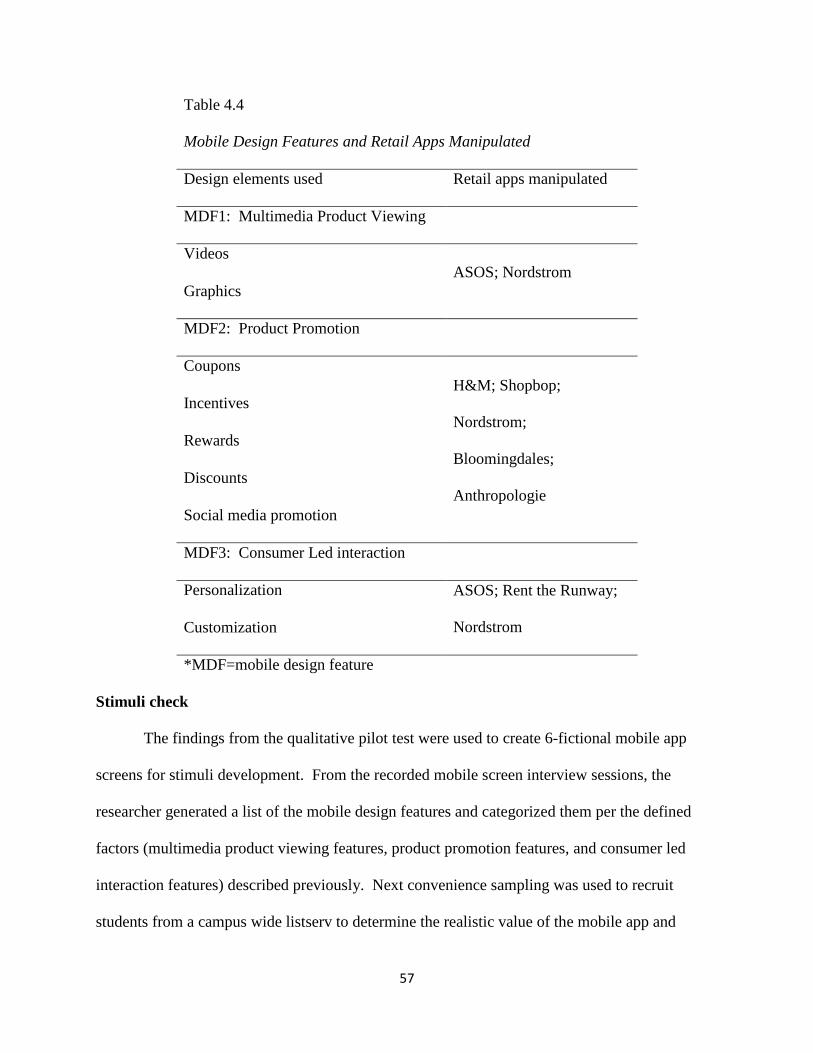
57
Table 4.4
Mobile Design Features and Retail Apps Manipulated
Design elements used Retail apps manipulated
MDF1: Multimedia Product Viewing
Videos
ASOS; Nordstrom
Graphics
MDF2: Product Promotion
Coupons
H&M; Shopbop;
Nordstrom;
Bloomingdales;
Anthropologie
Incentives
Rewards
Discounts
Social media promotion
MDF3: Consumer Led interaction
Personalization ASOS; Rent the Runway;
Nordstrom Customization
*MDF=mobile design feature
Stimuli check
The findings from the qualitative pilot test were used to create 6-fictional mobile app
screens for stimuli development. From the recorded mobile screen interview sessions, the
researcher generated a list of the mobile design features and categorized them per the defined
factors (multimedia product viewing features, product promotion features, and consumer led
interaction features) described previously. Next convenience sampling was used to recruit
students from a campus wide listserv to determine the realistic value of the mobile app and
58
whether it resembles a mobile app that they would use to shop. Convenience sampling was
appropriate here as this portion of the research was a pilot study, and convenience sampling was
not used in the main study.
Each participant saw all six developed stimuli. For realism value, participants were
asked to indicate their level of agreement with three statements specifying how realistic the
fictional app stimuli are to mobile apps they have experienced on a 7-point Likert scale. For
shopping intentions, participants were asked to indicate their level of agreement with three items
specifying their intention to visit or frequent mobile app such as the stimuli on a 7-point Likert
scale. In addition, an open-ended question was presented at the end for suggestions on how to
make the app more realistic or highly preferred as a mobile app to visit. Demographic questions
were also presented. A panel of experts were also consulted to determine the realistic value of
the stimuli.
Six stimuli were developed using a fictional mobile shopping app as the basis. The six
stimuli were as follows: (1) high task relevant cues and only multimedia product viewing
features for both hedonic and utilitarian experiential prompts, (2) high task relevant cues and
only product promotion features for both hedonic and utilitarian experiential prompts, and (3)
high task relevant cues and only consumer led interaction features for both hedonic and
utilitarian experiential prompts. Three mobile design features were presented for each scenario
resulting in six stimuli total. Upon completion of developing the stimuli, a stimuli check was
performed.
59
Phase 2: SOR Experiment
The second phase of the study encompassed the main stimulus-organism-response
experiment. This section contained stimuli development, instrument development, sample
selection, data collection procedure, and data analysis.
Stimuli development
The development of the stimuli followed a multi-step approach: creation of the written
scenario and choosing appropriate products for each scenario. These were then combined with
the mobile app simulations developed in phase one of the study.
Stimuli scenarios
The findings from research question one revealed that participants’ interactions with
mobile shopping apps differed greatly based on the purpose of their search. Participants who
were looking for something particular often had a prescribed method to find the garment they
sought. In comparison when participants were “just browsing” through mobile apps, they tended
to browse for longer periods of time as well as to interact with more features and to dig deeper
into the product offerings. Therefore, to accurately capture a consumer’s potential shopping
process, two types of scenarios were presented: hedonic and utilitarian. The reasons for selecting
these two types of scenarios are discussed below.
Hedonic-utilitarian shopping values. The driving motivator for shopping tends to vary
from the need to find a specific product to time consumption and social outings. Often the way
researchers tend to categorize these needs is based on hedonic or utilitarian shopping motivations
(Hirschman & Holbrook, 1982). Utilitarian motivation is defined as task oriented behavior with
benefits achieved through efficiency and task completion in the shopping process (Babin,
William, & Mitch, 1994; Batra & Ahtola, 1991). In comparison, hedonic motivation is
60
characterized by consumption behaviors steeped in positive emotion such as happiness, fantasy,
and enjoyment. Utilitarian motivation is often explained as a critical, rational, and goal oriented
process (Batra & Ahtola, 1991; Hirschman & Holbrook, 1982). Utilitarian motivation is relevant
for task specific use of the shopping process such as price comparisons (Hoffman & Novak,
1996). On the other hand, the emotional and experiential nature of shopping is the main benefit
of hedonic motivation. Consumers who love shopping due to the experiential value of the
process have been deemed a crucial element of shopping especially online shopping (Babin et
al., 1994; Hoffman & Novak, 1996). Because all consumers experience both types of shopping
motivations, it was necessary to present scenarios based on each.
Product selection for written scenarios. Due to the nature of the experiment, six
products were chosen to correspond with the six stimuli to be featured, three mobile design
features from the hedonic perspective and three mobile design features from the utilitarian
perspective. In July of 2014, seven out of 10 US adults made clothing purchases online (Staff,
2014). However, in terms of shopping through smartphones or tablets, digital content such as
movies, music, and e-books were much more prevalent. In addition, females were more likely to
purchase clothing and accessories whereas males were more likely to purchase digital content
(Staff, 2014). As of August 2016; the top three product categories purchased by consumers in
the US online were fashion, technology, and culture (videogames, books, and DVDs) (Staff,
2016). In fact, fashion is the most commonly purchased e-commerce category in nine of the 15
markets analyzed in a study by Marketing Chart Staff (Staff, 2016). These nine countries were:
The United States, France, Belgium, Germany, the Netherlands, Hong Kong, Singapore,
Australia, and India. Therefore, between the years of 2014 and 2016, the trend toward the online
consumption of fashion products has remained relatively the same. Thus, to create realistic
61
scenarios for stimuli development, six products from the fashion product categories, three
hedonic products and three utilitarian products were chosen. Utilitarian products can be
described as helpful, functional, and practical; in contrast, hedonic products are classified as fun,
exciting, and enjoyable. It is important to note that the distinction is not limited to just product
types, but also is applicable to attributes (Lu, Liu, & Fang, 2016). The three hedonic products
chosen for this study were bathing suits, high heels, and a summer dress, and the three utilitarian
products chosen for this were jeans, sandals, and a dress for a formal wedding
Written scenarios. Before the participants could view the stimuli, they were given the
following prompt: “Before looking at the following mobile screens, please read the following
scenarios, taking about two minutes to really get into the mood of the situation. After reading
the prompt, participants were then provided with one of two scenarios, hedonic or utilitarian.
Participants were also instructed further about the nature of the screen to be viewed, the survey
stated before each stimulus, “The following images show the way a product is displayed on a
typical retail app. Please note that you will not be able to interact with the image through linking
to other pages, swiping left or right, etc. Upon visual inspection of the app's page, please answer
the questions following each image.”
Hedonic: You are on your way to New York City for the weekend, but your flight has
been delayed yet again. You suddenly find yourself with a bunch of down time and
begin to get a little bored. You decide to shop online through some of your favorite
mobile apps to pass the time.
62
Utilitarian: One of your longtime friends is getting married in Key West this June. The
wedding weekend is full of events before the actual wedding itself on Saturday night.
After looking at your closet and the weather for that weekend, you realize you need a
dress to wear for the formal event. In addition, you could really use a new pair of sandals
and some jeans for going out at night.
Mobile app simulation
All stimuli were developed using screen shots of retail mobile apps and were manipulated
using Photoshop. The usage of Photoshop allowed realistic creation of fictitious mobile screens
in the same dimensions of the screen of an iPhone 6splus, one of the largest screen sizes at 5.5
inches. Each stimulus was a composite of two or more retail mobile apps. Six stimuli were
created, three representing hedonic shopping experiences and three representing utilitarian
shopping experiences. Each set of stimuli was composed of two screen shots as seen in Figure
4.1- Figure 4.6.
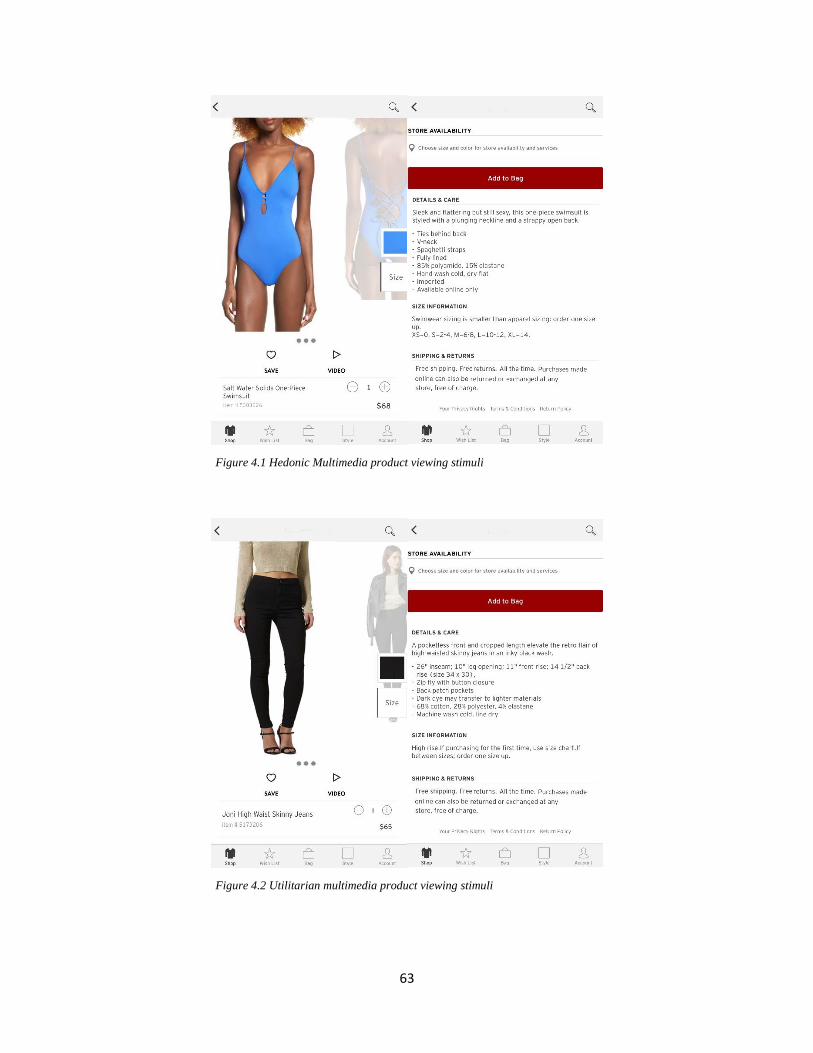
63
Figure 4.1 Hedonic Multimedia product viewing stimuli
Figure 4.2 Utilitarian multimedia product viewing stimuli
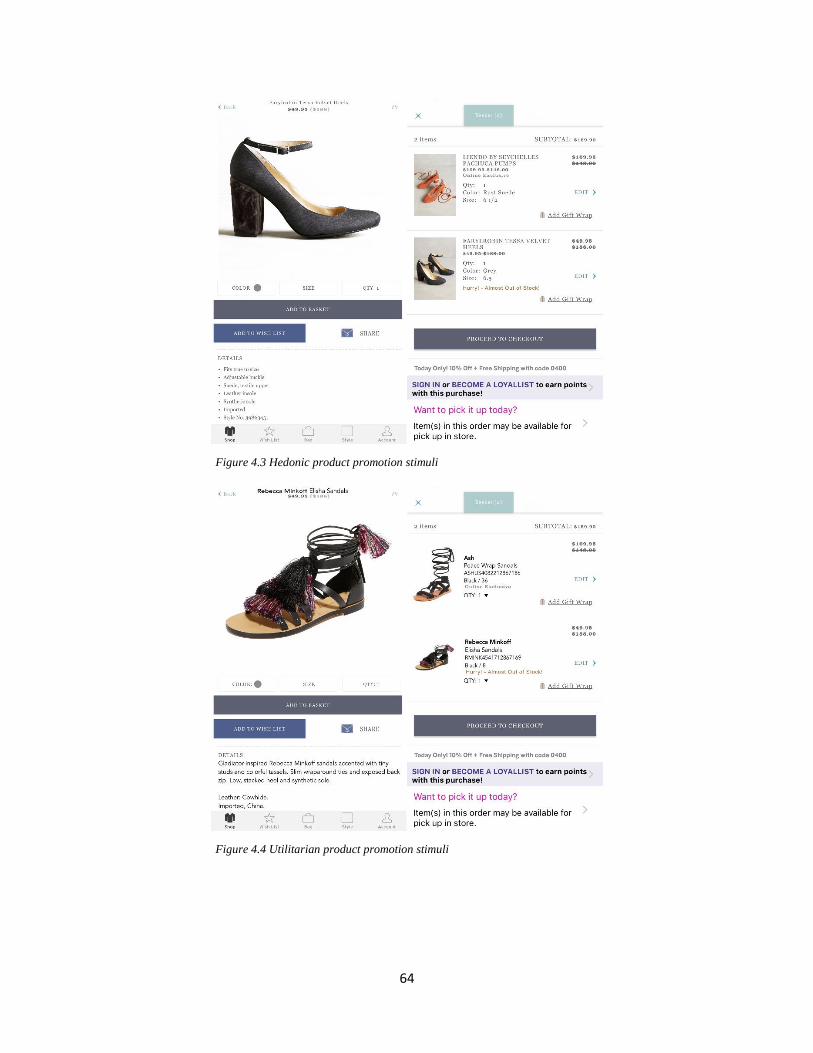
64
Figure 4.3 Hedonic product promotion stimuli
Figure 4.4 Utilitarian product promotion stimuli
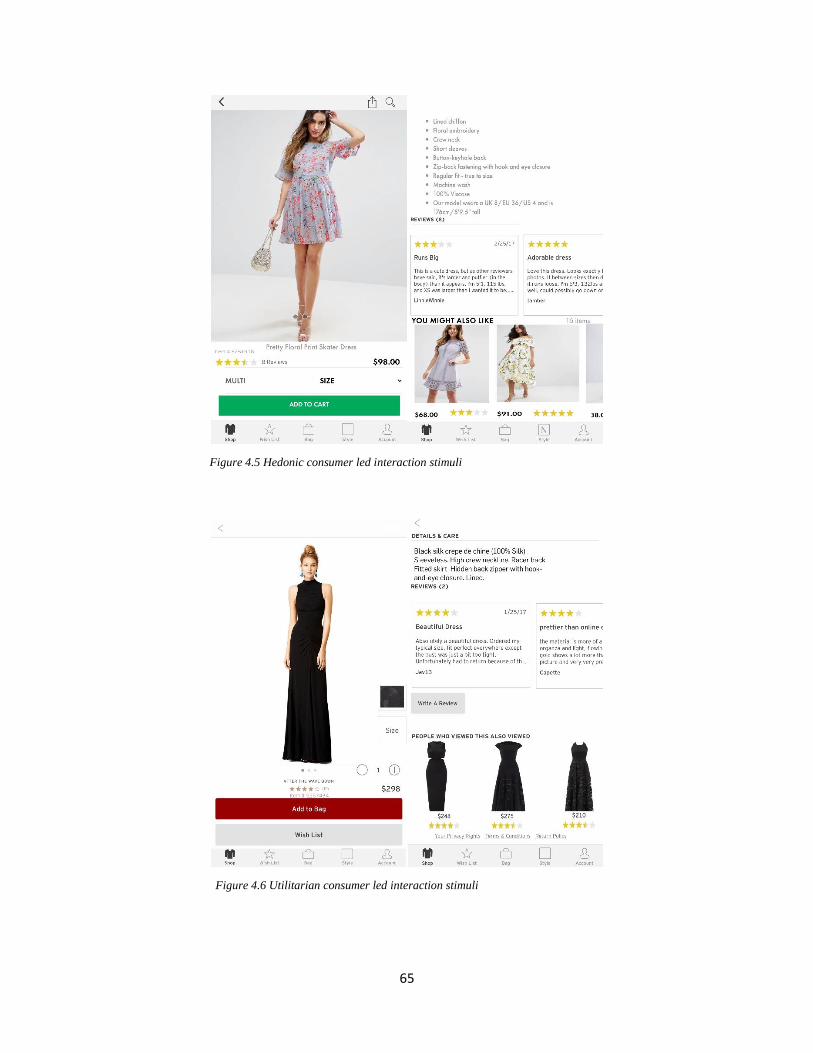
65
Figure 4.5 Hedonic consumer led interaction stimuli
Figure 4.6 Utilitarian consumer led interaction stimuli
66
Instrument development
The survey had four sections: stimuli, organism, response, and demographics. In the first
section, stimuli, the researcher presented participants with one of two scenarios, hedonic or
utilitarian, in which they were given a shopping related task. The participants then viewed three
stimuli, each isolating one type of mobile design feature. The next section, organism, consisted
of questions pertaining to their emotional response. The PAD paradigm was used to measure
emotion. All items measuring PAD were adapted from Mehrabian and Russell (1974). Pleasure,
arousal, and dominance was measured with six items each on a 7-point semantic differential
scale. The third section, response, contained items measuring mobile app stickiness. Mobile app
stickiness was measured with four items adapted from Benlian (2015). The items were measured
on a 7-point Likert scale from strongly agree to strongly disagree. Demographic items were
presented. All constructs, items, and reliability’s can be found in Table 4.5.
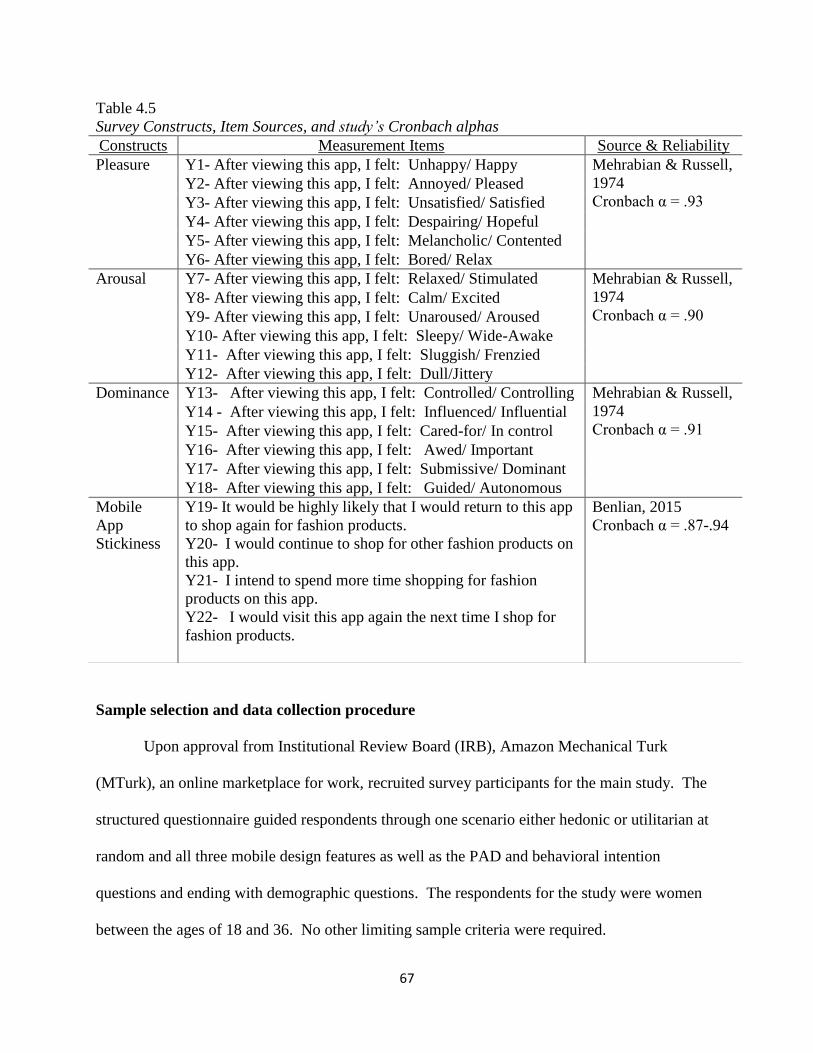
67
Sample selection and data collection procedure
Upon approval from Institutional Review Board (IRB), Amazon Mechanical Turk
(MTurk), an online marketplace for work, recruited survey participants for the main study. The
structured questionnaire guided respondents through one scenario either hedonic or utilitarian at
random and all three mobile design features as well as the PAD and behavioral intention
questions and ending with demographic questions. The respondents for the study were women
between the ages of 18 and 36. No other limiting sample criteria were required.
Table 4.5
Survey Constructs, Item Sources, and study’s Cronbach alphas
Constructs Measurement Items Source & Reliability
Pleasure Y1- After viewing this app, I felt: Unhappy/ Happy Mehrabian & Russell,
1974
Cronbach α = .93 Y2- After viewing this app, I felt: Annoyed/ Pleased
Y3- After viewing this app, I felt: Unsatisfied/ Satisfied
Y4- After viewing this app, I felt: Despairing/ Hopeful
Y5- After viewing this app, I felt: Melancholic/ Contented
Y6- After viewing this app, I felt: Bored/ Relax
Arousal Y7- After viewing this app, I felt: Relaxed/ Stimulated Mehrabian & Russell,
1974
Cronbach α = .90 Y8- After viewing this app, I felt: Calm/ Excited
Y9- After viewing this app, I felt: Unaroused/ Aroused
Y10- After viewing this app, I felt: Sleepy/ Wide-Awake
Y11- After viewing this app, I felt: Sluggish/ Frenzied
Y12- After viewing this app, I felt: Dull/Jittery
Dominance Y13- After viewing this app, I felt: Controlled/ Controlling Mehrabian & Russell,
1974
Cronbach α = .91 Y14 - After viewing this app, I felt: Influenced/ Influential
Y15- After viewing this app, I felt: Cared-for/ In control
Y16- After viewing this app, I felt: Awed/ Important
Y17- After viewing this app, I felt: Submissive/ Dominant
Y18- After viewing this app, I felt: Guided/ Autonomous
Mobile
App
Stickiness
Y19- It would be highly likely that I would return to this app
to shop again for fashion products.
Y20- I would continue to shop for other fashion products on
this app.
Y21- I intend to spend more time shopping for fashion
products on this app.
Y22- I would visit this app again the next time I shop for
fashion products.
Benlian, 2015
Cronbach α = .87-.94
68
Data analysis
Data for this study were collected from Qualtrics. It was then downloaded and imported
to SPSS where the data was cleaned, checked for normality, and missing data was handled
through multiple imputations. Descriptive and inferential analyses were conducted on the study
data. Descriptive statistics were used to analyze demographic variables such as age and
ethnicity. Inferential statistics were used to determine the reliability of scales and to test
hypotheses through conditional process analysis.
To test the study’s conceptual model containing mediators, conditional process modeling
was used. Process modeling is carried out when the goal of the research is to understand,
explore, and estimate the path that the casual variables affect through one or more intermediary
variables. It has been used often in psychology based research as it explains the predictors and
mediators responsible for influencing certain effects simultaneously (Hayes & Scharkow, 2013;
Hayes & Preacher, 2013). Conditional process modeling is used when the goal is believed to be
reliant on additional variables. Conditional process modeling estimated direct and indirect paths
through the variable conveyed effects and models the size of those effects. Therefore,
conditional process modeling can be thought of as a combination of the conceptual and analytical
ideas of mediation and moderation analysis (Hayes & Preacher, 2013).
Conditional process modeling is more appropriate for this study over SEM as this study is
experimental in nature. In addition, Kalyanaraman and Sundar (2006) utilized conditional
process modeling as the analysis method in their study on web portal customization and its
effects on users (Hayes & Preacher, 2014). Kalyanaraman and Sundar’s (2006) study design is
similar to the current study design as both utilize experimental design aspects to understand the
nature of a technology based platform with multiple independent variables. Experimental design
69
research on average does not yield large sample sizes. Therefore, due to the nature of SEM
practices of utilizing the normal distribution to derive p-values, path coefficients are more likely
to have little in error in smaller sample sizes. In comparison, the PROCESS tool used in
conditional process modeling makes use of the t distribution in OLS (ordinary least square)
regression for the derivation of p-values for regression coefficients (Hayes, 2013). While the
distinction is minor for large sample sizes, it does pose a factor for smaller sample sizes.
Therefore, conditional process modeling is the best statistical method to analyze the effect of
mobile design features.
70
CHAPTER 5 RESULTS
This chapter includes (a) phase 1: stimuli development analysis; (b) phase 2: SOR
experiment analysis.
Phase 1: Stimuli Development Analysis
Sample Descrption
Prior to testing the full SOR experiment, the stimuli material created based on the three
mobile design features were subjected to a manipulation check. Two aspects of the stimuli were
checked for successful manipulation: (a) realism and (b) shopping intention.
For this study, 271 participants were recruited for this phase of the study using a campus
wide listserv from a U.S. southeast university. Each participant saw all six stimuli and
responded to six items (three for realism and three for shopping intention) following each
stimuli. The demographic makeup of the participants can be viewed in Table 5.1. The
participants were all female with 84.5 percent using a mobile device that operated on the apple
operating system in comparison to 15.1 percent of the participants utilizing an android operating
system. The participants were majority white/ Caucasian at 68.6 percent; the remaining
participants identified as black/ African American (11.1%), Asian (9.2%), multi-racial (4.8%),
and Hispanic (4.1%). The educational makeup of the participants were seniors (49.8%) and
graduate students (46.1%). Over half (58.4%) of the participants were between 18-23 years old.

71
Table 5.1
Demographic Characteristics of Stimuli Check
Variable Levels Frequency %
Gender Female 271 100
Operating
System Apple 229 84.5
Android 41 15.1
No response 1 0.4
Race/ Ethnicity White/ Caucasian 186 68.6
Black/ African American 30 11.1
American Indian or Alaska Native 1 0.4
Asian 25 9.2
Hispanic 11 4.1
Multi-racial 13 4.8
Other 5 1.8
Education Freshman 1 0.4
Sophomore 1 0.4
Junior 6 2.2
Senior 135 49.8
Graduate 125 46.1
No response 3 1.1
Age 18-23 158 58.4
24-29 73 27.0
30-36 40 14.7
Note. Number of participants (n) =271
Stimuli Check Analysis
In order to check if the created stimuli were similar to actual mobile app pages,
participants were asked on a 7-point Likert scale (1=strongly disagree and 7=strongly agree) to
indicate if each stimuli they saw was “realistic,” “life like,” and “ similar to an app [I] have used
before.” To check if the stimuli yielded positive reactions toward shopping intentions,
participants were asked on a 7-point Likert scale (1= strongly disagree and 7= strongly agree) to
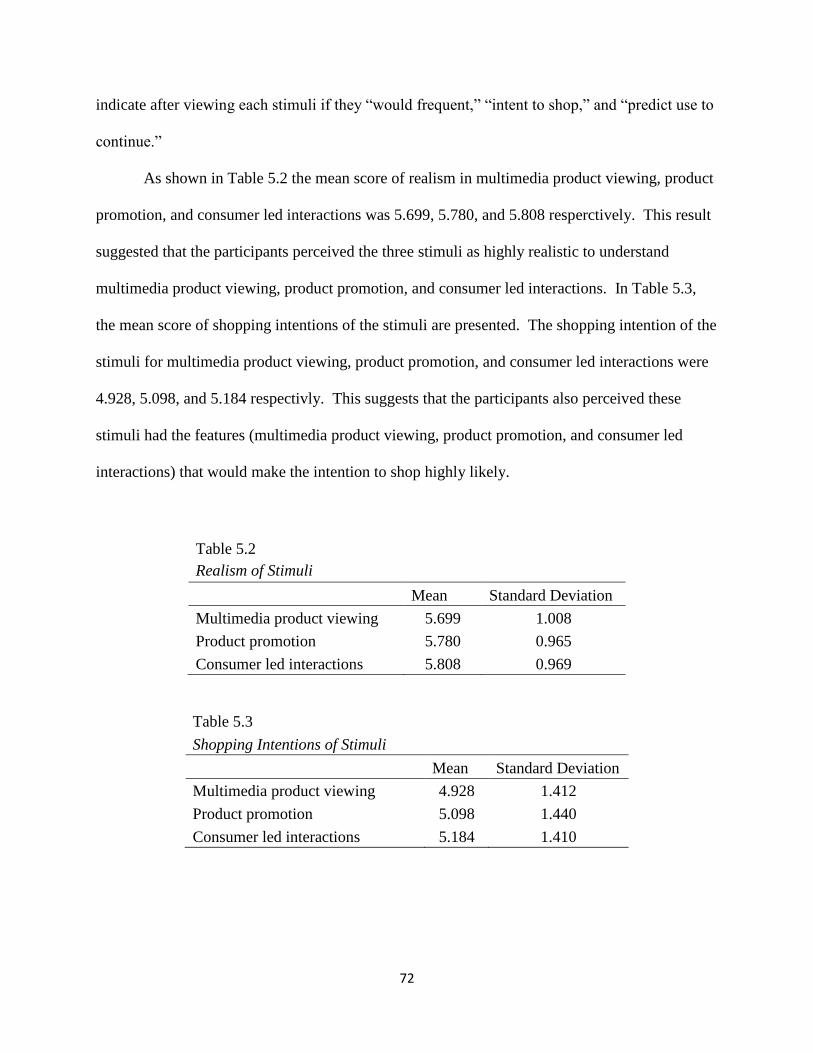
72
indicate after viewing each stimuli if they “would frequent,” “intent to shop,” and “predict use to
continue.”
As shown in Table 5.2 the mean score of realism in multimedia product viewing, product
promotion, and consumer led interactions was 5.699, 5.780, and 5.808 resperctively. This result
suggested that the participants perceived the three stimuli as highly realistic to understand
multimedia product viewing, product promotion, and consumer led interactions. In Table 5.3,
the mean score of shopping intentions of the stimuli are presented. The shopping intention of the
stimuli for multimedia product viewing, product promotion, and consumer led interactions were
4.928, 5.098, and 5.184 respectivly. This suggests that the participants also perceived these
stimuli had the features (multimedia product viewing, product promotion, and consumer led
interactions) that would make the intention to shop highly likely.
Table 5.2
Realism of Stimuli
Mean Standard Deviation
Multimedia product viewing 5.699 1.008
Product promotion 5.780 0.965
Consumer led interactions 5.808 0.969
Table 5.3
Shopping Intentions of Stimuli
Mean Standard Deviation
Multimedia product viewing 4.928 1.412
Product promotion 5.098 1.440
Consumer led interactions 5.184 1.410
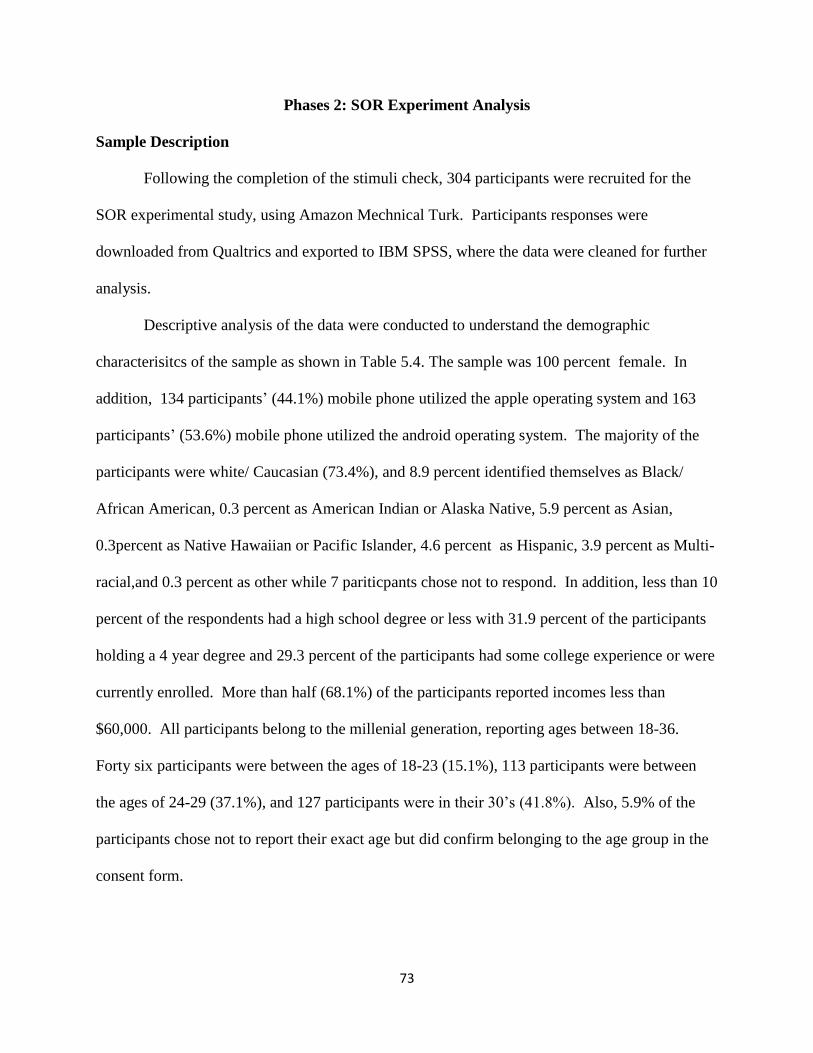
73
Phases 2: SOR Experiment Analysis
Sample Description
Following the completion of the stimuli check, 304 participants were recruited for the
SOR experimental study, using Amazon Mechnical Turk. Participants responses were
downloaded from Qualtrics and exported to IBM SPSS, where the data were cleaned for further
analysis.
Descriptive analysis of the data were conducted to understand the demographic
characterisitcs of the sample as shown in Table 5.4. The sample was 100 percent female. In
addition, 134 participants’ (44.1%) mobile phone utilized the apple operating system and 163
participants’ (53.6%) mobile phone utilized the android operating system. The majority of the
participants were white/ Caucasian (73.4%), and 8.9 percent identified themselves as Black/
African American, 0.3 percent as American Indian or Alaska Native, 5.9 percent as Asian,
0.3percent as Native Hawaiian or Pacific Islander, 4.6 percent as Hispanic, 3.9 percent as Multi-
racial,and 0.3 percent as other while 7 pariticpants chose not to respond. In addition, less than 10
percent of the respondents had a high school degree or less with 31.9 percent of the participants
holding a 4 year degree and 29.3 percent of the participants had some college experience or were
currently enrolled. More than half (68.1%) of the participants reported incomes less than
$60,000. All participants belong to the millenial generation, reporting ages between 18-36.
Forty six participants were between the ages of 18-23 (15.1%), 113 participants were between
the ages of 24-29 (37.1%), and 127 participants were in their 30’s (41.8%). Also, 5.9% of the
participants chose not to report their exact age but did confirm belonging to the age group in the
consent form.
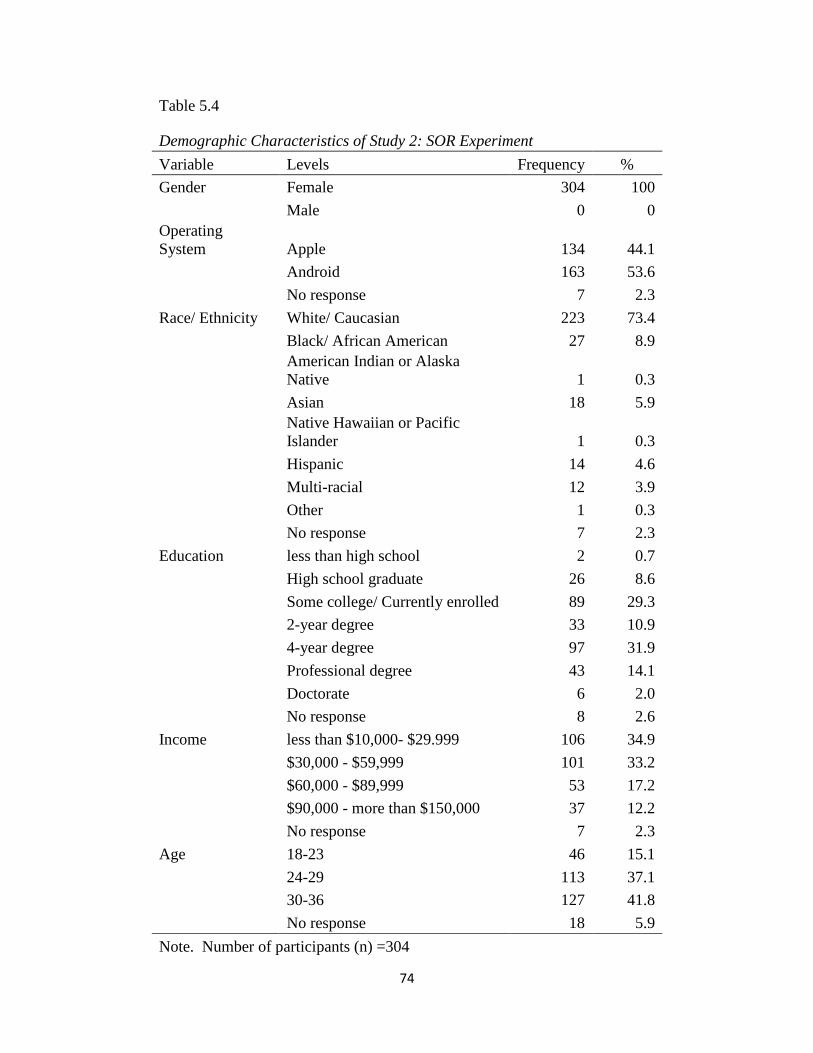
74
Table 5.4
Demographic Characteristics of Study 2: SOR Experiment
Variable Levels Frequency %
Gender Female 304 100
Male 0 0
Operating
System Apple 134 44.1
Android 163 53.6
No response 7 2.3
Race/ Ethnicity White/ Caucasian 223 73.4
Black/ African American 27 8.9
American Indian or Alaska
Native 1 0.3
Asian 18 5.9
Native Hawaiian or Pacific
Islander 1 0.3
Hispanic 14 4.6
Multi-racial 12 3.9
Other 1 0.3
No response 7 2.3
Education less than high school 2 0.7
High school graduate 26 8.6
Some college/ Currently enrolled 89 29.3
2-year degree 33 10.9
4-year degree 97 31.9
Professional degree 43 14.1
Doctorate 6 2.0
No response 8 2.6
Income less than $10,000- $29.999 106 34.9
$30,000 - $59,999 101 33.2
$60,000 - $89,999 53 17.2
$90,000 - more than $150,000 37 12.2
No response 7 2.3
Age 18-23 46 15.1
24-29 113 37.1
30-36 127 41.8
No response 18 5.9
Note. Number of participants (n) =304
75
Scale reliability
Cronbach’s α was used to assess the internal reliability of the measures. All items
measuring PAD (pleasure, arousal, and dominance) were adapted from Mehrabian and Russell
(1974). Pleasure, arousal, and dominance was measured with six items each on a 7-point
semantic differential scale. The reliability of scales measuring pleasure, arousal, and dominance
were acceptable with coefficient alphas reported as 0.974, 0.858, and 0.795 accordingly. Four
items measuring mobile app stickiness were adapted from Benlian (2015). These items were
measured on a 7-point Likert scale. The reliability of scales for mobile app stickiness generated
an acceptable coefficient alpha of 0.969. Table 5.5 below shows the reliability of scales.
Table 5.5
Reliability of Scales
Scale No. of Items Reliability (Cronbach's α)
Pleasure 6 0.947
Arousal 6 0.858
Dominance 6 0.795
Mobile App Stickiness 4 0.969
Hypothesis testing and analysis
To test the study’s conceptual model containing multiple mediators, conditional process
analysis with bootstrapped confidence intervals were used. Each participant viewed three mobile
design features’ stimuli and answered the corresponding items following each stimuli; therefore,
particpants completed three separate experiments. Thus the potential N of the SOR experiment
was 912 cases. However after cleaning the data and using multiple imputations to deal with
missing data, N resulted in 903 cases. Table 5.6 shows the breakdown of cases per mobile
design feature. The responses to pleasure, arousal, dominance, and mobile app stickiness were
76
averaged to obtain one score for each construct for each participant, after checking reliabilities of
the scales.
Table 5.6
Number of cases per mobile design feature
Mobile Design Features N
Multimedia product viewing 304
Product promotion features 301
Consumer led interactions 298
Total 903
Conditional Process Modeling
Hayes’ (2014) process modeling allows x to be multicategorical by relying “on the fact
that mean differences can be estimated with a linear model by representing groups with a set of
k-1 variables, where k is the number of groups” (p. 455). This allows a mathematical model
identical to ANOVA but also allows the reproduction of k groups means on the mediator and the
dependent variable. Therefore, the model, parameter estimates, and model fit statistics keep the
information about how the groups differ from one another.
This is possible through the coding of the multicategorical variable. Therefore dummy
coding was used to indicate the type of mobile design feature viewed, (1) multimedia product
viewing, (2) product promotion, (3) consumer led interactions. K- 1 groups were created with Di
set to 1 if a case is in the selected group, and 0 otherwise. One group received no coding, all k-1
dummy variables are set to 0 in that group. This group becomes the reference group in analysis
hence parameters are quantified relative to their reference group. However due to the study
design, no true control group was created in efforts of keeping stimuli as realistic as possible;
therefore, the analysis was ran three times, alternating reference groups.
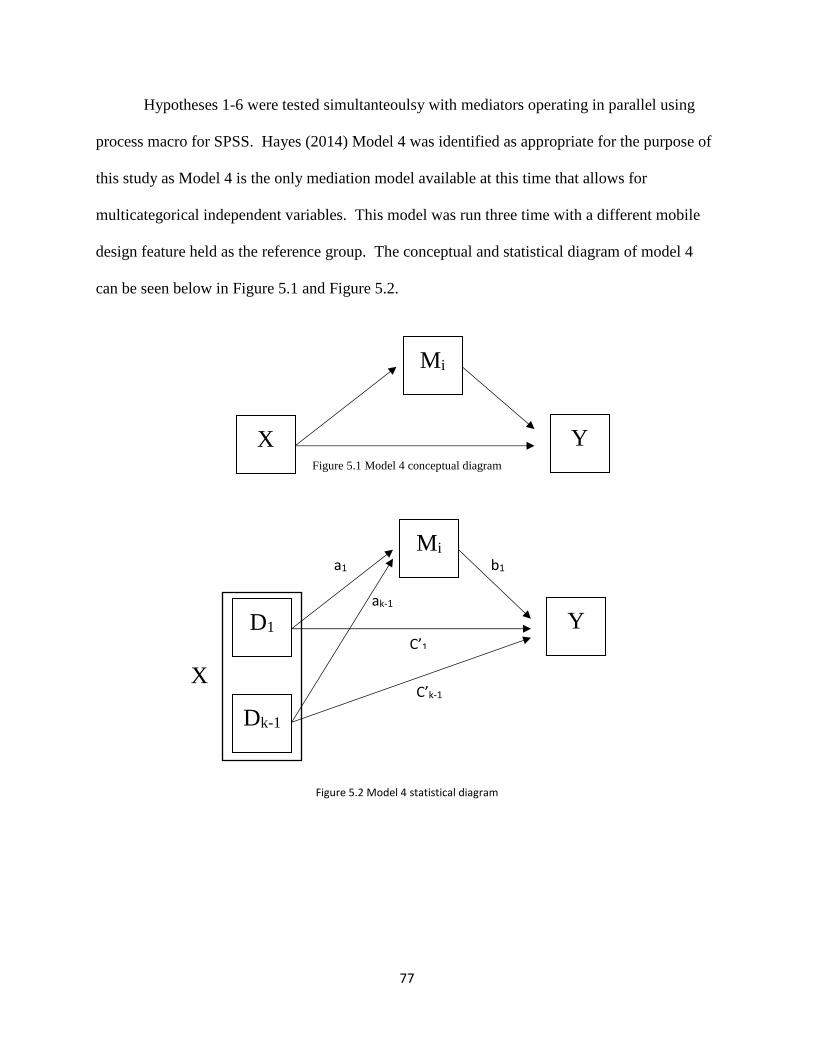
77
Hypotheses 1-6 were tested simultanteoulsy with mediators operating in parallel using
process macro for SPSS. Hayes (2014) Model 4 was identified as appropriate for the purpose of
this study as Model 4 is the only mediation model available at this time that allows for
multicategorical independent variables. This model was run three time with a different mobile
design feature held as the reference group. The conceptual and statistical diagram of model 4
can be seen below in Figure 5.1 and Figure 5.2.
Figure 5.1 Model 4 conceptual diagram
Figure 5.2 Model 4 statistical diagram
X
X Y
Mi
a1
ak-1
C’1
C’k-1
b1
D1 Y
Mi
Dk-1
78
Multimedia product viewing as the reference group
Table 5.7 shows the results of the hypotheses tests when multimedia product viewing was
held as the reference group. Hypotheses 2a, 2b, and 2c proposed the product promotion features
will have a significant positive affect on pleasure, arousal, and dominance accordingly. The
analysis results did not support a statistical influence from product promotion to any of the
dimensions of PAD (unstandardized β= -.05, p=.657; unstandardized β= .096, p=.318;
unstandardized β= .023, p=.755). Therefore hypotheses 2a, 2b, and 2c were not supported when
multimedia product viewing was held as the reference group.
Hypotheses 3a, 3b, and 3c proposed the consumer led interactions would have a
significant positive affect on pleasure, arousal, and dominance. The analysis results did not
support a statistical influence from consumer led interactions to pleasure (unstandardized β=
.197, p=.081). Therefore hypothesis 3a was not supported when multimedia product viewing
was held as the reference group. Howerver the results did show a statistically significant
influence from consumer led interactions to arousal (unstandardized β= .344, p<.001). Thus,
holding all other factors constant, every unit change in consumer led interactions will result in a
0.344 unit change in arousal in the same direction. Therefore, hypothesis 3b was supported
when multimedia product viewing was held as the reference group. The results also showed a
statistically significant influence from consumer led interactions to dominance (unstandardized
β= .179, p=.024). Thus, holding all other factors constant, every unit change in consumer led
interactions will result in a 0.179 unit change in dominance in the same direction. Therefore,
hypothesis 3c was supported when multimedia product viewing was held as the reference group.
Hypotheses 4a, 4b, and 4c proposed that pleasure, arousal, and dominance would have a
positive significant effect on mobile app stickiness. The PROCESS results supported a
79
statistically significant influence of pleasure on mobile app stickiness (unstandardized β= .747,
p<.001). Consequently, holding all other factors constant, every unit change in pleasure will
result in a .747 unit change in mobile app stickiness in the same direction. In addition the results
also showed a statistically signficiant influence of arousal on mobile app stickiness
(unstandardized β= .130, p=.005). Hence if all other factors are held constant every unit change
in arousal will result in a .130 unit change in mobile app stickiness in the same direction. Thus,
hypothesis 4a and 4b are supported when multimedia product viewing is held as the reference
group. However, analysis results did not support a statistical influence from dominance to
mobile app stickiness (unstandardized β= -.04, p=.305). Therefore hypothesis 4c was not
supported when multimedia product viewing was held as the reference group.
Product promotion features as the reference group
Table 5.8 shows the results of the hypotheses tests when product promotion features was
held as the reference group. Hypotheses 1a, 1b, and 1c proposed multimedia product viewing
features will have a significant positive effect on pleasure, arousal, and dominance accordingly.
The analysis results did not support a statistical influence from multimedia product viewing
features to any PAD dimensions (unstandardized β= .051, p=.660; unstandardized β= -.010,
p=.323; unstandardized β= -.020, p=.763). Therefore hypotheses 1a, 1b, and 1c are not
supported when product promotion features were held as the reference group.
Hypotheses 3a, 3b, and 3c proposed the consumer led interactions will have a significant
positive effect on pleasure, arousal, and dominance. The analysis results supported a statistical
significant influence from consumer led interactions to pleasure (unstandardized β= .248,
p=.033). Thus when all other factors are held constant, every unit change in consumer led
interactions will result in a .248 unit change in pleasure in the same direction. Therefore
80
hypothesis 3a was supported when product promotion features was held as the reference group.
In addition, the results did show a statistically significant influence from consumer led
interactions to arousal (unstandardized β= .247, p=.012). Thus, holding all other factors
constant, every unit change in consumer led interactions will result in a 0.012 unit change in
arousal in the same direction. Therefore, hypothesis 3b was supported when product promotion
features was held as the reference group. The results also showed a statistically significant
influence from consumer led interactions to dominance (unstandardized β= .155, p=.048). Thus,
holding all other factors constant, every unit change in consumer led interactions will result in a
0.155 unit change in dominance in the same direction. Therefore, hypothesis 3c was supported
when product promotion features was held as the reference group.
Hypotheses 4a, 4b, and 4c proposed that pleasure, arousal, and dominace would have a
positive significant effect on mobile app stickiness. The PROCESS results supported a
statitsically significant influence of pleasure on mobile app stickiness (unstandardized β= .747,
p<.001). Consequently, holding all other factors constant, every unit change in pleasure will
result in a .747 unit change in mobile app stickiness in the same direction. In addition the results
also showed a statistically signficiant influence of arousal on mobile app stickiness
(unstandardized β= .130, p=.005). Hence if all other factors are held constant every unit change
in arousal will result in a .130 unit change in mobile app stickiness in the same direction. Thus,
hypothesis 4a and 4b are supported when product promotion features is held as the reference
group. However, analysis results did not support a statistical influence from dominance to
mobile app stickiness (unstandardized β= -.04, p=.305). Therefore hypothesis 4c was not
supported when product promotion features was held as the reference group.
81
Consumer led interactions as the reference group
Table 5.9 shows the results of the hypotheses tests when consumer led interaction
features was held as the reference group. Hypotheses 1a, 1b, and 1c proposed multimedia
product viewing features will have a significant positive affect on pleasure, arousal, and
dominance accordingly. The analysis results did not support a statistical influence from
multimedia product viewing features to pleasure and dominance (unstandardized β= -.200,
p=.088; unstandardized β= -.180, p=.222). Therefore hypotheses 1a and 1c are not supported
when consumer led interactions are held as the reference group. However, PROCESS showed a
statistically significant influence between multimedia product viewing features and arousal
(unstandardized β= -.034, p<.001). So when all other factors are held constant for every unit
change in multimedia product viewing features will result in a -.034 unit change in arousal in the
same direction. Therefore hypotheses 1b is supported when consumer led interaction features
were held as the reference group.
Hypotheses 2a, 2b, and 2c proposed that product promotion features will have a
significant positive affect on pleasure, arousal, and dominance. The analysis results supported a
statistical signigicant influence from product promotion features to pleasure (unstandardized β= -
.250, p=.033). Thus when all other factors are held constant, every unit change in product
promotion features will result in a -.250 unit change in pleasure in the same direction. Therefore
hypothesis 2a was supported when consumer led interaction features was held as the reference
group. In addition, the results did show a statistically significant influence from product
promotion features to arousal (unstandardized β= -.250, p=.012). Thus, holding all other factors
constant, every unit change in product promotion features will result in a 0.012 unit change in
arousal in the same direction. Therefore, hypothesis 2b was supported when consumer led
82
interaction features was held as the reference group. The results also showed a statistically
significant influence from product promotion features to dominance (unstandardized β= -.160,
p=.048). Thus, holding all other factors constant, every unit change in product promotion
features will result in a -.160 unit change in dominance in the same direction. Therefore,
hypothesis 2c was supported when consumer lead interaction features was held as the reference
group.
Hypotheses 4a, 4b, and 4c proposed that pleasure, arousal, and dominace would have a
positive significant effect on mobile app stickiness. The PROCESS results supported a
statitsically significant influence of pleasure on mobile app stickiness (unstandardized β= .747,
p<.001). Consequently, holding all other factors constant, every unit change in pleasure will
result in a .747 unit change in mobile app stickiness in the same direction. In addition the results
also showed a statistically significant influence of arousal on mobile app stickiness
(unstandardized β= .130, p=.005). Hence if all other factors are held constant every unit change
in arousal will result in a .130 unit change in mobile app stickiness in the same direction. Thus,
hypothesis 4a and 4b are supported when consumer led interaction features is held as the
reference group. However, analysis results did not support a statistical influence from
dominance to mobile app stickiness (unstandardized β= -.04, p=.305). Therefore hypothesis 4c
was not supported when consumer led interaction features was held as the reference group.
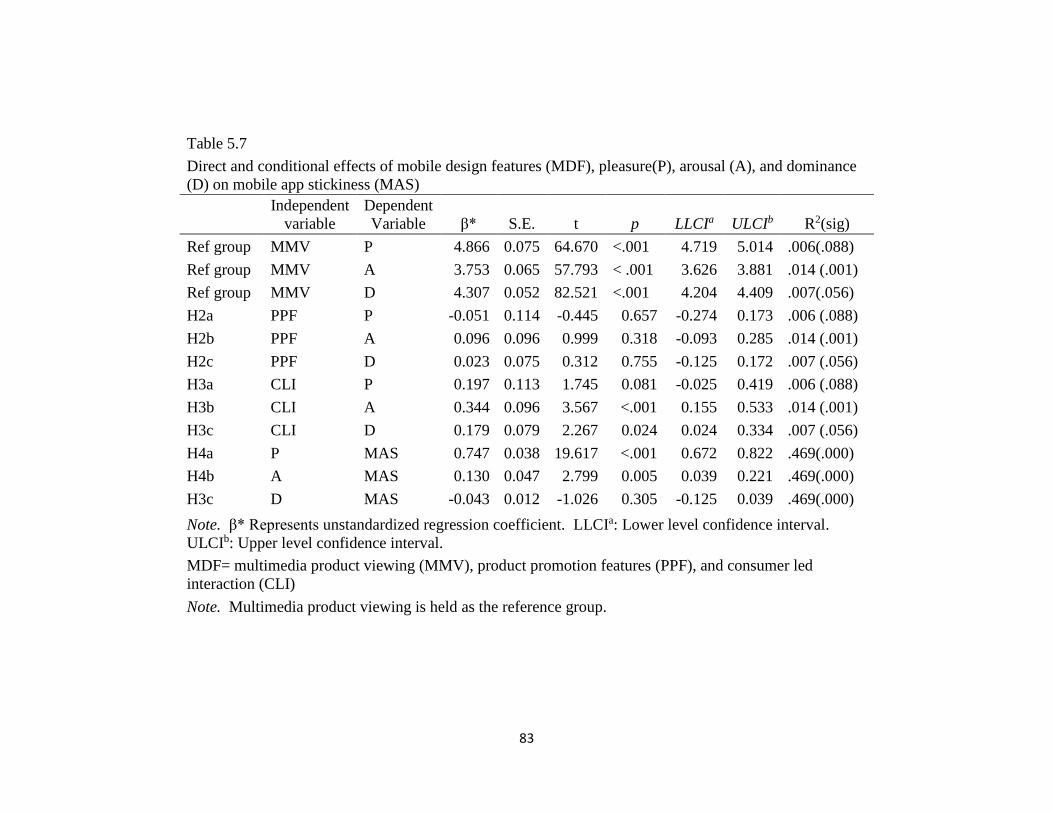
83
Table 5.7
Direct and conditional effects of mobile design features (MDF), pleasure(P), arousal (A), and dominance
(D) on mobile app stickiness (MAS)
Independent
variable
Dependent
Variable β* S.E. t p LLCIa ULCIb R2(sig)
Ref group MMV P 4.866 0.075 64.670 <.001 4.719 5.014 .006(.088)
Ref group MMV A 3.753 0.065 57.793 < .001 3.626 3.881 .014 (.001)
Ref group MMV D 4.307 0.052 82.521 <.001 4.204 4.409 .007(.056)
H2a PPF P -0.051 0.114 -0.445 0.657 -0.274 0.173 .006 (.088)
H2b PPF A 0.096 0.096 0.999 0.318 -0.093 0.285 .014 (.001)
H2c PPF D 0.023 0.075 0.312 0.755 -0.125 0.172 .007 (.056)
H3a CLI P 0.197 0.113 1.745 0.081 -0.025 0.419 .006 (.088)
H3b CLI A 0.344 0.096 3.567 <.001 0.155 0.533 .014 (.001)
H3c CLI D 0.179 0.079 2.267 0.024 0.024 0.334 .007 (.056)
H4a P MAS 0.747 0.038 19.617 <.001 0.672 0.822 .469(.000)
H4b A MAS 0.130 0.047 2.799 0.005 0.039 0.221 .469(.000)
H3c D MAS -0.043 0.012 -1.026 0.305 -0.125 0.039 .469(.000)
Note. β* Represents unstandardized regression coefficient. LLCIa: Lower level confidence interval.
ULCIb: Upper level confidence interval.
MDF= multimedia product viewing (MMV), product promotion features (PPF), and consumer led
interaction (CLI)
Note. Multimedia product viewing is held as the reference group.
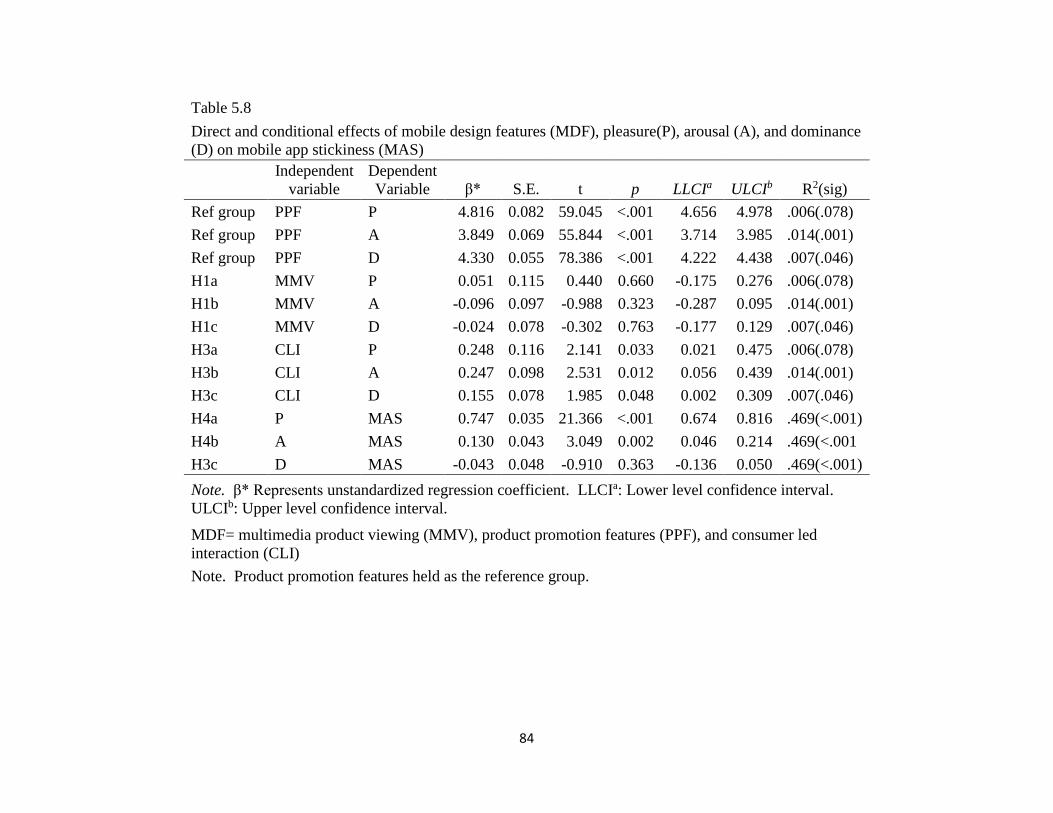
84
Table 5.8
Direct and conditional effects of mobile design features (MDF), pleasure(P), arousal (A), and dominance
(D) on mobile app stickiness (MAS)
Independent
variable
Dependent
Variable β* S.E. t p LLCIa ULCIb R2(sig)
Ref group PPF P 4.816 0.082 59.045 <.001 4.656 4.978 .006(.078)
Ref group PPF A 3.849 0.069 55.844 <.001 3.714 3.985 .014(.001)
Ref group PPF D 4.330 0.055 78.386 <.001 4.222 4.438 .007(.046)
H1a MMV P 0.051 0.115 0.440 0.660 -0.175 0.276 .006(.078)
H1b MMV A -0.096 0.097 -0.988 0.323 -0.287 0.095 .014(.001)
H1c MMV D -0.024 0.078 -0.302 0.763 -0.177 0.129 .007(.046)
H3a CLI P 0.248 0.116 2.141 0.033 0.021 0.475 .006(.078)
H3b CLI A 0.247 0.098 2.531 0.012 0.056 0.439 .014(.001)
H3c CLI D 0.155 0.078 1.985 0.048 0.002 0.309 .007(.046)
H4a P MAS 0.747 0.035 21.366 <.001 0.674 0.816 .469(<.001)
H4b A MAS 0.130 0.043 3.049 0.002 0.046 0.214 .469(<.001
H3c D MAS -0.043 0.048 -0.910 0.363 -0.136 0.050 .469(<.001)
Note. β* Represents unstandardized regression coefficient. LLCIa: Lower level confidence interval.
ULCIb: Upper level confidence interval.
MDF= multimedia product viewing (MMV), product promotion features (PPF), and consumer led
interaction (CLI)
Note. Product promotion features held as the reference group.
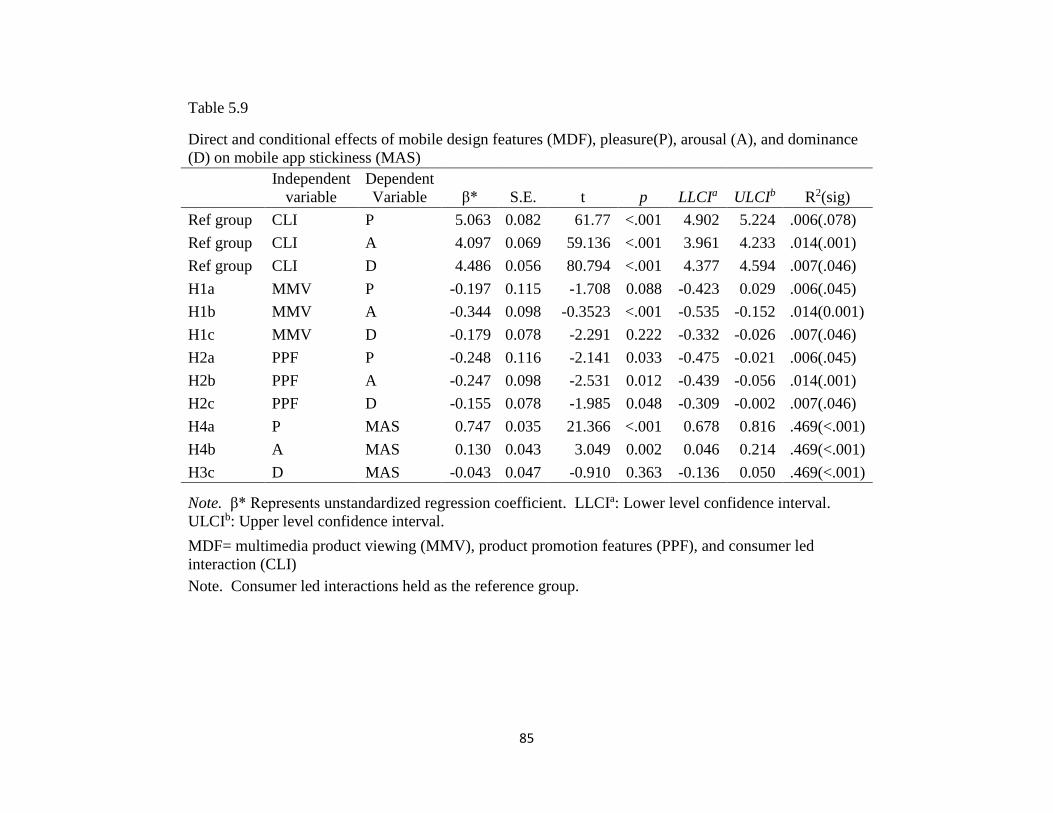
85
Table 5.9
Direct and conditional effects of mobile design features (MDF), pleasure(P), arousal (A), and dominance
(D) on mobile app stickiness (MAS)
Independent
variable
Dependent
Variable β* S.E. t p LLCIa ULCIb R2(sig)
Ref group CLI P 5.063 0.082 61.77 <.001 4.902 5.224 .006(.078)
Ref group CLI A 4.097 0.069 59.136 <.001 3.961 4.233 .014(.001)
Ref group CLI D 4.486 0.056 80.794 <.001 4.377 4.594 .007(.046)
H1a MMV P -0.197 0.115 -1.708 0.088 -0.423 0.029 .006(.045)
H1b MMV A -0.344 0.098 -0.3523 <.001 -0.535 -0.152 .014(0.001)
H1c MMV D -0.179 0.078 -2.291 0.222 -0.332 -0.026 .007(.046)
H2a PPF P -0.248 0.116 -2.141 0.033 -0.475 -0.021 .006(.045)
H2b PPF A -0.247 0.098 -2.531 0.012 -0.439 -0.056 .014(.001)
H2c PPF D -0.155 0.078 -1.985 0.048 -0.309 -0.002 .007(.046)
H4a P MAS 0.747 0.035 21.366 <.001 0.678 0.816 .469(<.001)
H4b A MAS 0.130 0.043 3.049 0.002 0.046 0.214 .469(<.001)
H3c D MAS -0.043 0.047 -0.910 0.363 -0.136 0.050 .469(<.001)
Note. β* Represents unstandardized regression coefficient. LLCIa: Lower level confidence interval.
ULCIb: Upper level confidence interval.
MDF= multimedia product viewing (MMV), product promotion features (PPF), and consumer led
interaction (CLI)
Note. Consumer led interactions held as the reference group.
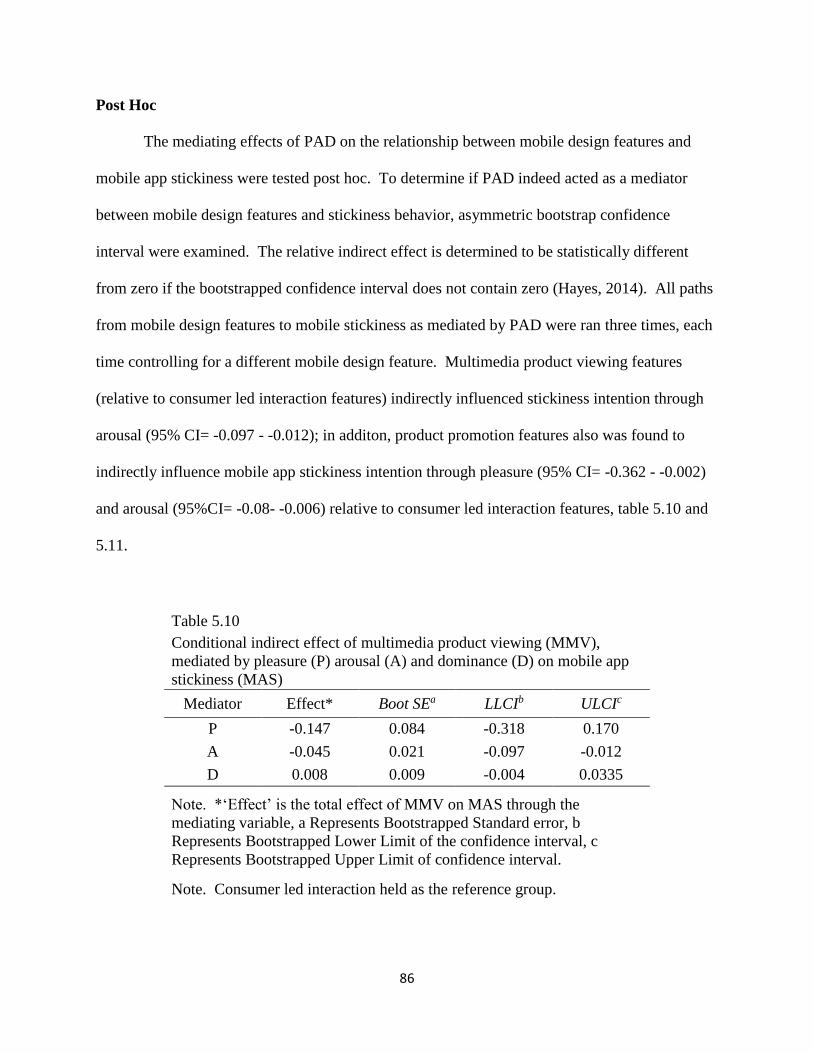
86
Post Hoc
The mediating effects of PAD on the relationship between mobile design features and
mobile app stickiness were tested post hoc. To determine if PAD indeed acted as a mediator
between mobile design features and stickiness behavior, asymmetric bootstrap confidence
interval were examined. The relative indirect effect is determined to be statistically different
from zero if the bootstrapped confidence interval does not contain zero (Hayes, 2014). All paths
from mobile design features to mobile stickiness as mediated by PAD were ran three times, each
time controlling for a different mobile design feature. Multimedia product viewing features
(relative to consumer led interaction features) indirectly influenced stickiness intention through
arousal (95% CI= -0.097 - -0.012); in additon, product promotion features also was found to
indirectly influence mobile app stickiness intention through pleasure (95% CI= -0.362 - -0.002)
and arousal (95%CI= -0.08- -0.006) relative to consumer led interaction features, table 5.10 and
5.11.
Table 5.10
Conditional indirect effect of multimedia product viewing (MMV),
mediated by pleasure (P) arousal (A) and dominance (D) on mobile app
stickiness (MAS)
Mediator Effect* Boot SEa LLCIb ULCIc
P -0.147 0.084 -0.318 0.170
A -0.045 0.021 -0.097 -0.012
D 0.008 0.009 -0.004 0.0335
Note. *‘Effect’ is the total effect of MMV on MAS through the
mediating variable, a Represents Bootstrapped Standard error, b
Represents Bootstrapped Lower Limit of the confidence interval, c
Represents Bootstrapped Upper Limit of confidence interval.
Note. Consumer led interaction held as the reference group.
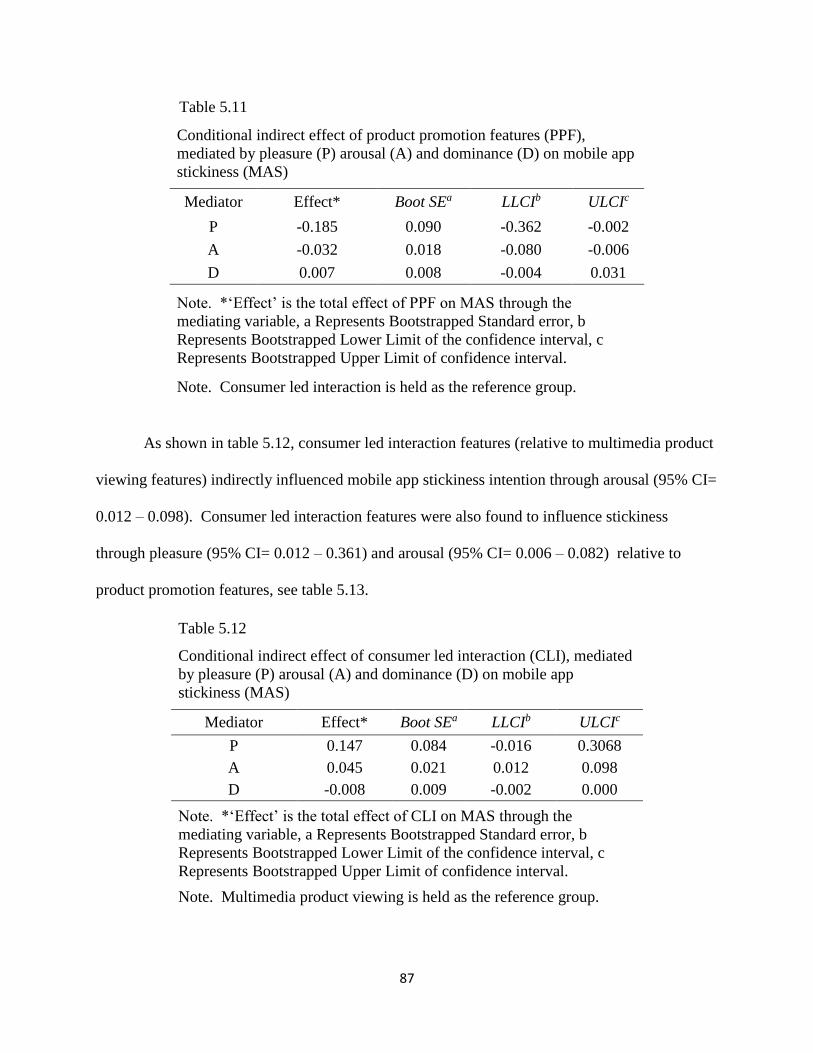
87
Table 5.11
Conditional indirect effect of product promotion features (PPF),
mediated by pleasure (P) arousal (A) and dominance (D) on mobile app
stickiness (MAS)
Mediator Effect* Boot SEa LLCIb ULCIc
P -0.185 0.090 -0.362 -0.002
A -0.032 0.018 -0.080 -0.006
D 0.007 0.008 -0.004 0.031
Note. *‘Effect’ is the total effect of PPF on MAS through the
mediating variable, a Represents Bootstrapped Standard error, b
Represents Bootstrapped Lower Limit of the confidence interval, c
Represents Bootstrapped Upper Limit of confidence interval.
Note. Consumer led interaction is held as the reference group.
As shown in table 5.12, consumer led interaction features (relative to multimedia product
viewing features) indirectly influenced mobile app stickiness intention through arousal (95% CI=
0.012 – 0.098). Consumer led interaction features were also found to influence stickiness
through pleasure (95% CI= 0.012 – 0.361) and arousal (95% CI= 0.006 – 0.082) relative to
product promotion features, see table 5.13.
Table 5.12
Conditional indirect effect of consumer led interaction (CLI), mediated
by pleasure (P) arousal (A) and dominance (D) on mobile app
stickiness (MAS)
Mediator Effect* Boot SEa LLCIb ULCIc
P 0.147 0.084 -0.016 0.3068
A 0.045 0.021 0.012 0.098
D -0.008 0.009 -0.002 0.000
Note. *‘Effect’ is the total effect of CLI on MAS through the
mediating variable, a Represents Bootstrapped Standard error, b
Represents Bootstrapped Lower Limit of the confidence interval, c
Represents Bootstrapped Upper Limit of confidence interval.
Note. Multimedia product viewing is held as the reference group.
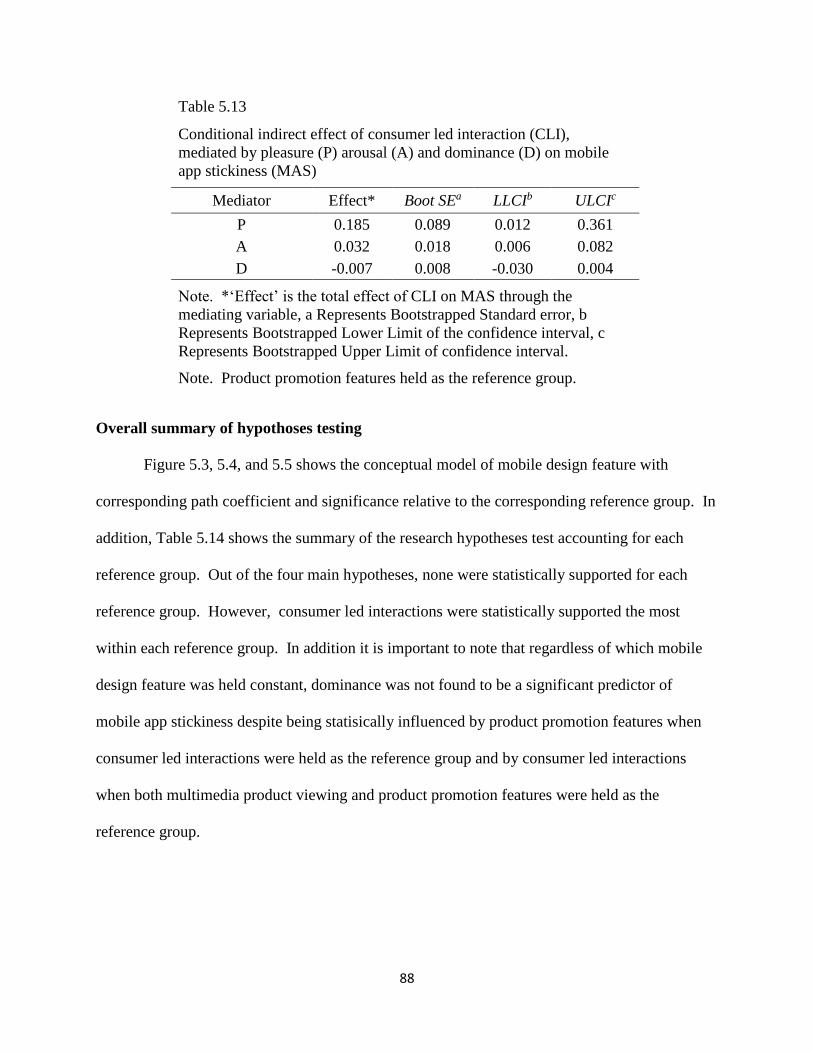
88
Table 5.13
Conditional indirect effect of consumer led interaction (CLI),
mediated by pleasure (P) arousal (A) and dominance (D) on mobile
app stickiness (MAS)
Mediator Effect* Boot SEa LLCIb ULCIc
P 0.185 0.089 0.012 0.361
A 0.032 0.018 0.006 0.082
D -0.007 0.008 -0.030 0.004
Note. *‘Effect’ is the total effect of CLI on MAS through the
mediating variable, a Represents Bootstrapped Standard error, b
Represents Bootstrapped Lower Limit of the confidence interval, c
Represents Bootstrapped Upper Limit of confidence interval.
Note. Product promotion features held as the reference group.
Overall summary of hypothoses testing
Figure 5.3, 5.4, and 5.5 shows the conceptual model of mobile design feature with
corresponding path coefficient and significance relative to the corresponding reference group. In
addition, Table 5.14 shows the summary of the research hypotheses test accounting for each
reference group. Out of the four main hypotheses, none were statistically supported for each
reference group. However, consumer led interactions were statistically supported the most
within each reference group. In addition it is important to note that regardless of which mobile
design feature was held constant, dominance was not found to be a significant predictor of
mobile app stickiness despite being statisically influenced by product promotion features when
consumer led interactions were held as the reference group and by consumer led interactions
when both multimedia product viewing and product promotion features were held as the
reference group.
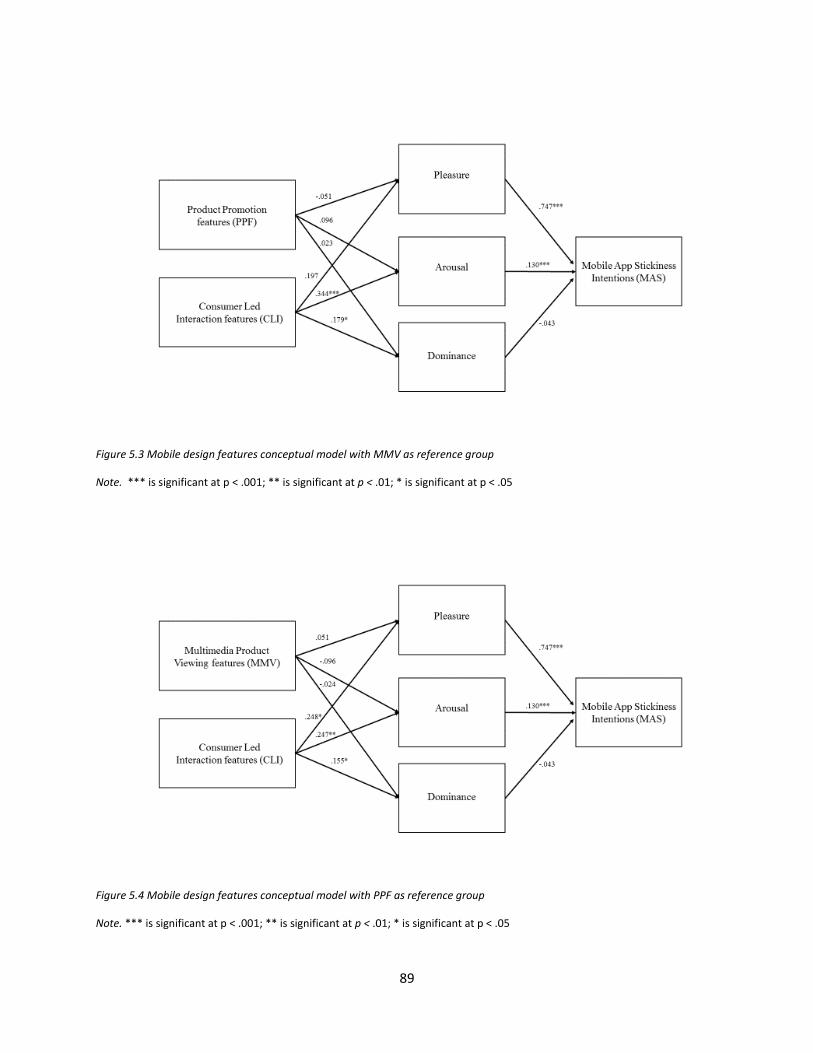
89
Figure 5.3 Mobile design features conceptual model with MMV as reference group
Note. *** is significant at p < .001; ** is significant at p < .01; * is significant at p < .05
Figure 5.4 Mobile design features conceptual model with PPF as reference group
Note. *** is significant at p < .001; ** is significant at p < .01; * is significant at p < .05
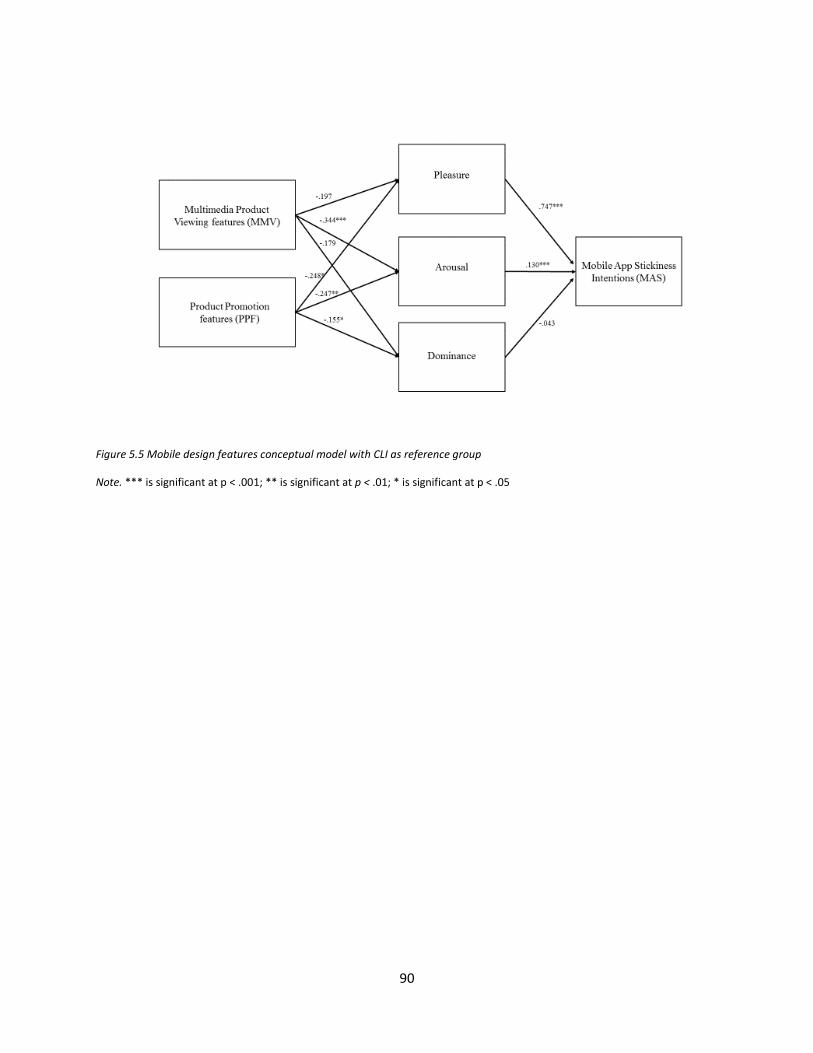
90
Figure 5.5 Mobile design features conceptual model with CLI as reference group
Note. *** is significant at p < .001; ** is significant at p < .01; * is significant at p < .05
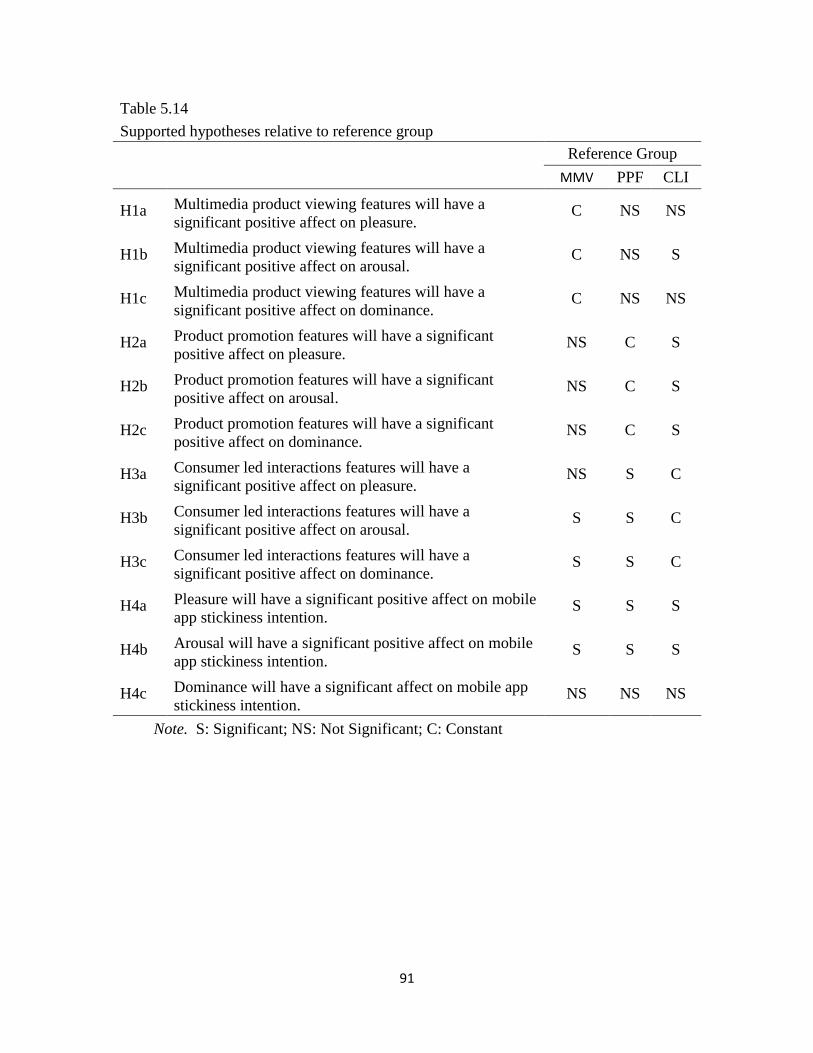
91
Table 5.14
Supported hypotheses relative to reference group
Reference Group
MMV PPF CLI
H1a Multimedia product viewing features will have a
significant positive affect on pleasure. C NS NS
H1b Multimedia product viewing features will have a
significant positive affect on arousal. C NS S
H1c Multimedia product viewing features will have a
significant positive affect on dominance. C NS NS
H2a Product promotion features will have a significant
positive affect on pleasure. NS C S
H2b Product promotion features will have a significant
positive affect on arousal. NS C S
H2c Product promotion features will have a significant
positive affect on dominance. NS C S
H3a Consumer led interactions features will have a
significant positive affect on pleasure. NS S C
H3b Consumer led interactions features will have a
significant positive affect on arousal. S S C
H3c Consumer led interactions features will have a
significant positive affect on dominance. S S C
H4a Pleasure will have a significant positive affect on mobile
app stickiness intention. S S S
H4b Arousal will have a significant positive affect on mobile
app stickiness intention. S S S
H4c Dominance will have a significant affect on mobile app
stickiness intention. NS NS NS
Note. S: Significant; NS: Not Significant; C: Constant
92
Chapter 6 Discussion
Chapter 6 contains the following sections: (a) summary of the study, (b) contributions
and implications, and (c) limitations and scope of future research.
Summary of Study
Mobile commerce is projected to be a 200 billion plus dollar industry by 2020 (Meola,
2016; Milnes, 2016). This future growth can be attributed to a number of distinctive factors such
as ubiquity and localization services (Chong et al., 2012; Faqih & Jaradat, 2015; Krotov, Junglas,
& Steel, 2015; Mahatanankoon, Wen, & Lim, 2005; Zhang, Zhu, & Liu, 2012), and the growth
of mobile adoption, specifically mobile apps (Gartner, 2013; Lipsman, 2014; Moon & Domina,
2015). The creation of branded apps allows retailers to control the store expereince and create
content for every phase of the consumer decision process. In addition apps have a higher
conversion rate over desktops and mobile websites (Wright, 2012); hence, strengthening the need
for retailers to engage in app strategies and development. However, the multitude of branded
apps available in the market has generated the need for retailers to set their experience apart from
their competitors. Thus to create mobile app strategies to effectively engage consumers, it is
important to understand how added features will incentivize stickiness behavior.
This research was designed to investigate how the atmospheric environment created by a
retailers’ branded app would shape mobile app stickiness behavior. Following early research
into atmospherics as well as low and high task relevant cues (Baker, 1986; Bitner, 1992; Eroglu
et al., 2000; Kotler 1973), this research investigated the impact low task relevant cues has on
stickiness behavior. Utilizing the framework of Magarth and McCormick (2013b), this research
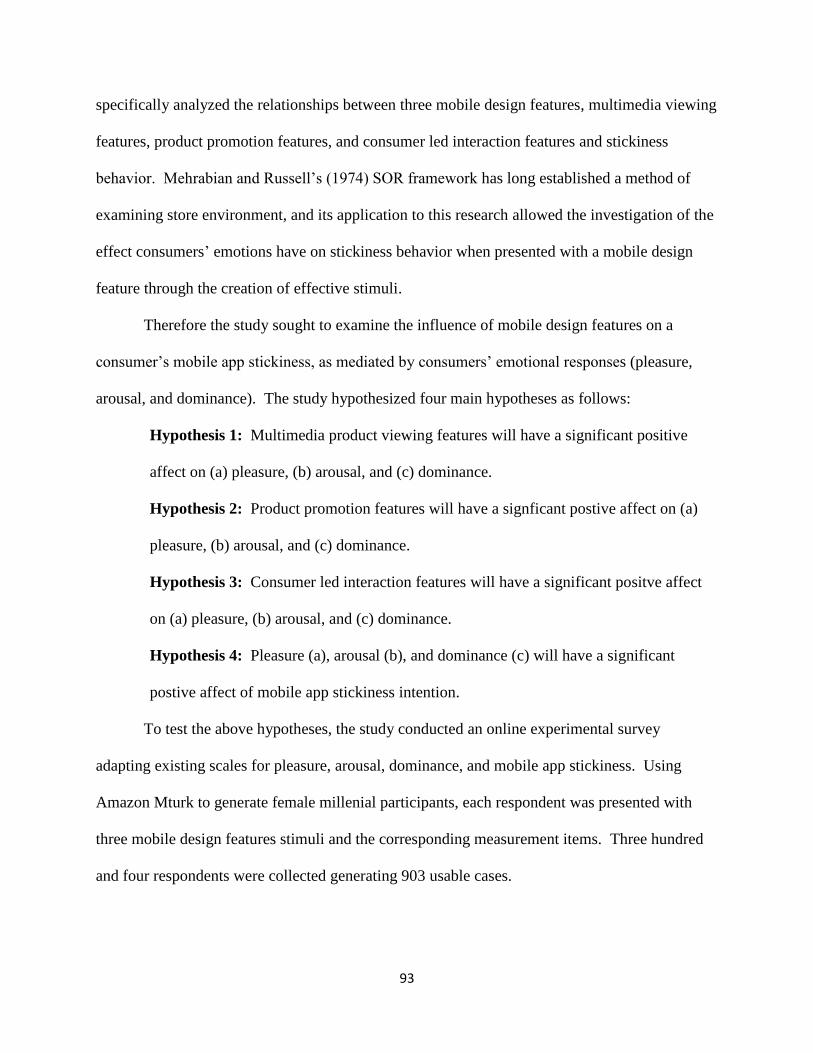
93
specifically analyzed the relationships between three mobile design features, multimedia viewing
features, product promotion features, and consumer led interaction features and stickiness
behavior. Mehrabian and Russell’s (1974) SOR framework has long established a method of
examining store environment, and its application to this research allowed the investigation of the
effect consumers’ emotions have on stickiness behavior when presented with a mobile design
feature through the creation of effective stimuli.
Therefore the study sought to examine the influence of mobile design features on a
consumer’s mobile app stickiness, as mediated by consumers’ emotional responses (pleasure,
arousal, and dominance). The study hypothesized four main hypotheses as follows:
Hypothesis 1: Multimedia product viewing features will have a significant positive
affect on (a) pleasure, (b) arousal, and (c) dominance.
Hypothesis 2: Product promotion features will have a signficant postive affect on (a)
pleasure, (b) arousal, and (c) dominance.
Hypothesis 3: Consumer led interaction features will have a significant positve affect
on (a) pleasure, (b) arousal, and (c) dominance.
Hypothesis 4: Pleasure (a), arousal (b), and dominance (c) will have a significant
postive affect of mobile app stickiness intention.
To test the above hypotheses, the study conducted an online experimental survey
adapting existing scales for pleasure, arousal, dominance, and mobile app stickiness. Using
Amazon Mturk to generate female millenial participants, each respondent was presented with
three mobile design features stimuli and the corresponding measurement items. Three hundred
and four respondents were collected generating 903 usable cases.
94
First, the study found consumers who viewed multimedia product viewing features to be
more likley to express feelings of arousal realtive to consumers who viewed consumer led
interaction features. It is also important to note that arousal did mediate the relationship between
multimedia product viewing features and mobile app stickiness intention. This implies that
multimedia product viewing features have to go beyond the normal three or five images and
must include new innovative methods to viewing products in order to arouse consumers to spend
time on an app.
Second the study’s results found consumers who viewed product promotion features
relative to those who viewed consumer led interaction features evoked feelings of arousal,
pleasure, and dominance. However only pleasure and arousal mediated the relationship
beteween product promotion features and mobile app stickiness. This implies that consumers
place high value on promotional features such as discounts, loyalty accounts, and other savings
offerings in comparison to product reviews and suggested items. Although consumers felt they
had control over the promotions they viewed and used, these feeling of control were not enough
to make them spend time on the app.
Third, consumer led interaction features overall influenced consumers’ emotional
responses more than any other mobile design feature. Consumer led interaction features relative
to product promotion features were more likely to express feelings of pleasure, arousal, and
dominance, and pleasure and arousal helped to mediate the relationship to mobile app stickiness.
In addition, consumer led interaction features relative to consumers who viewed multimedia
product viewing features evoked feeling of arousal and pleasure; however only arousal acted as a
mediator between consumer led interaction features and mobile app stickiness intentions.
95
Fourth, it is important to note that regardless of some mobile design features having an
impact on dominance, dominance did not have a significant influence on stickiness behavior. On
the other hand, pleasure and arousal were both significant contributors of mobile app stickiness
intentions. This implies that for mobile design features to influence stickiness intention, it is
important for apps to focus on features that drive arousal and pleasure. This also suggests that
dominance may only influence stickiness behavior in the prescence of hard task relevant cues.
Overall these results are important as they suggest the impact that low task relevant cues,
the design of an app, have on consumers’ intention to stay on an app longer and return more
often. Additionally, the findings imply that retailers can benefit from increased inclusion of
consumer led interaction features in app development as these fetaures overall had the most
significant pathways to stickiness intentions. The findings also show that retail and app
developers need to find new innovative methods of showcasing products for consumers to
express feelings of arousal and pleasure in their time spent on an app. In addition, these results
support the notion that a retailer must have more than the expected offerings of an app for a
consumer to deem the app worthy of their time spent. This is important as much research has
shown the limited time in which consumers make the decision to keep or delete an app.
Contributions and Implications
This study makes several important contributions to the body of knowledge of
atmospheric research and retail mobile app development. This section discusses the study’s
contributions and implications from the persepctive of theory development and apparel digital
marketing departments.
96
Theorectical implications
First, the theories used for this study are from the fields of pyschology, marketing, and
retailing. The findings of this study have implications to theory as the findings went against
previous literature. Prior literature in pyschology, marketing, and retail has predominately
focused on the adoption, usage, and purchase intentions related to mobile commerce though the
examination of techology based theories and framework. In addition, very few of these prior
studies examined mobile applications specifically with many not distinguishing between
commerce occuring on a mobile site versus a mobile app.
This study examined the phenomena of mobile apps though the usage of marketing and
pyschology theories not centered on technology adoption and usage but instead on design
elements and the SOR paradigm. While the prior studies on technology adoption and acceptance
are vital to understanding the mobile commerce realm, this study took the next step in research to
examine the mobile app environment in relation to visual design aspects. This study was able to
simulate a mobile shopping experience of a branded fashion app by testing the relationship
between mobile design features, emotion, and stickiness intention. While not all mobile design
features examined had an impact on stickiness intention as mediated by consumers’ emotional
response, this study did emphasize the importance of design on consumer stickiness intention.
Other variables not captured in this study along with other mobile design features may be better
able to explain a consumer’s mobile app stickiness intention. Therefore the findings encourage
new opportunities and avenues of research to understand how mobile design features can be
implemented effectively to impact consumers emotional response and stickiness intentions.
Second, the findings of this study were aligned with previous literature on atmospherics.
This study investigated low task relevant cues, mobile design features, by breaking mobile
97
design features down into smaller grouping features created of design elements as suggested by
Magarth and McCormick (2013b); the findings found consumer led interaction features and
product promotion features to have a positive relationship with pleasure, arousal, and dominance;
whereas, multimedia product viewing features only had positive relationship with arousal.
Therefore, multimedia product viewing features, product promotion features, and consumer led
interactions need to be effectively implemented within a retailer’s mobile app to influence
consumers’ emotional response and stickiness intention. Although previous literature has
examined the low task relevant cues of store atmospherics, these cues were grouped together in
large categories usually termed visual cues (Koo et al, 2014), affection relevant cues (Zhang et
al, 2015), and store design (Floh and Madlberger, 2013). Thus while their findings did show
influence on behavior, one was not able to attribute it to a specific marketing element as most of
the time the low task relevant cues were operationalized as overall visual appeal. The current
study’s findings also supported previous literature which states the more effective the visual
design, the more likely consumers will have a positive usage intention (Hsu, 2012). Hence the
more effective a retailer’s mobile design features are, the more emotion they will exude,
therefore, improving a consumer mobile app stickiness intention.
This study added to the breadth of research showing the vital need for effective usage of
mobile design features (multimedia product viewing features, product promotion features, and
consumer led interaction features) to impact consumers’ emotional response and stickiness
behavior. Magarth and McCormick’s (2013b) m-marketing design framework evaluated the
design aspects of website layout and design suggesting the examination of these elements in a
mobile app context to distinguish what elements are important in the mobile environment.
Additionally, early researchers in atmospeherics evaluated store environments through the usage
98
of Mehrabian and Russell’s (1974) S-O-R pardigm suggesting the best way to examine a
consumer’s response to an environement. However, a discussion of the influence of a mobile
app’s environment is lacking within the body of knowledge on atmospherics. This study
theorectically supports the influence of mobile design features on emotional response (the
organism) and stickiness intention (the response).
Third, the findings of this study also revealed results mixed with prior literature in
regards to the relationship between mobile design features and the dimensions of emotions
(pleasure, arousal, and dominance). Hsieh, Hsieh, Chiu, and Yang (2014) stressed the
importance of the emotional elements of dominance in online shopping environment as the
consumer is able to exhibit a heightened sense of control over the shopping process, and their
findings supported the inclusion of dominance in online settings. However, this study also
employed shopping in an online setting (mobile apps) but failed to support the inclusion of
dominance in mobile app settings. This implies that consumers’ views of mobile design features
may enhance feelings of dominance however it does not lead to stickiness intention. On the
other hand, the study’s findings did show that mobile design features especially consumer led
interaction features would have a positive influence on pleasure and arousal in turn leading to a
significant influence on mobile app stickiness intentions. This is in line with previous literature
that found features of a retail environment to influence consumers mood and emotions (Cheng,
2009; Roy and Tai, 2003; Novak, Hoffman, and Yung, 2000; Wu, Lee, Fu, and Wang, 2013).
Thus marketers should focus their mobile app strategies to enhance features that lead to feelings
of arousal and pleasure as these two emotions were found to influence mobile app stickiness
intention.
99
Industry implication
First, the findings can be applied to industry by incorporating purposeful interactvity into
the retail app; in addition, these findings support the importance of creating additional design
factors to complement product viewing options. Multimedia product viewing features were not a
significant predictor of pleasure or dominance regardless of the mobile design feature held
constant. Thus, hypotheses 1a and 1c were not supported. This could be due to the lack of
interactivity in the stimuli. Feelings of dominance are rooted in the ability to have control over
the environment; however, the stimuli developed in this study were stationary. Therefore,
consumers were not given any ability to display elements of control on how many images they
viewed or whether or not to view a video, or leave that product offering completely. In addition,
pleasure consists of feelings of strong preference towards a stimuli. In the case of multimedia
product viewing, the choice of product could have been a deterent to whether or not the
respondent displayed preference, and without any additonal offering, pleasure potentially was
not as strong as other emotional responses.
However multimedia product viewing was a significant predictor of arousal only when
consumer led interaction features was held as the reference group. Thus, hypothesis 1b was
partially supported. Therefore, consumers who viewed an app’s multimedia viewing features
(multiple product images and videos) generated a stronger influence on arousal when controlled
for consumer led interaction features only. Arosual is an active response to a stimuli measuring
a consumers readiness. Through the displaying of product images and video contents,
consumers’ readiness about the shopping process could be heightened thus preparing one to
spend more time on the app or to come back more frequently based on their experience.
100
Second, industry leaders can apply these findings by understanding the impact of product
promotion in conjunction with consumer generated reviews and high quality product viewing
options. Product promotion features were not a signficant predictor of any emotional response in
consumers relative to viewing multimedia product viewing features. This could be because
consumers deem product promotion features as irrelevant unless they also are able to view the
product. On the other hand when consumer led interactions were held as the reference group,
product promotion features were held as a significant predictor of pleasure, arousal, and
dominance. Thus hypothesis 2a,2b, and 2c were partially supported. This could be due to the
elements that compose consumer led interaction features specifically product reviews and
suggested items; thus, product promotions had more weight to garnering emotional response
relative to consumer led interaction features potentially because they are only considered once
the consumer has formed a decision toward a ‘product suggestion’ or purchase; in comparison,
product promotion features may be necessary to form an opinion toward a product thus
generating an emotional response. Therefore consumers who viewed an app’s product
promotions features (coupons, incentives, rewards, discounts, and social media promos) would
yield an increase in their feelings of pleasure, arousal, and dominance when controlled for
consumer led interactions (product reviews and suggested items), but product promotion features
did not have an impact on emotion when controlled for multimedia viewing features (multiple
images and videos).
Third, the findings can be used by apparel digital marketing departments to understand
the importance of customized information and user generated content to promote product
offerings. Consumer led interaction features were an overall significant predictor of both arousal
and dominance, but was only a predictor of pleasure when controlled for product promotion
101
features. Thus hypothesis 3a was partially supported, and hypotheses 3b and 3c were supported.
Hence when a consumer viewed an app’s consumer led interaction features their feelings of
pleasure were heightened only when controlled for product promotion features, but heightened
feelings of arousal and dominance were present regardless of the control group. Consumer led
interaction features had the most significant relationship with a consumer’s emotional response.
In addition, consumer led interaction features are the only mobile design feature that utilized
consumer generated content through the creation of product review. Consumer led interaction
features also utilize tailored consumer data through “product suggestions”. This could explain
why consumers showed the most emotional response for consumer led interaction features over
other categories of mobile design features as well as were strong predictors of stickiness
intentions. This implies that marketers need to enhance and create tailored experiences to garner
positive emotional response and stickiness behavior to increase customer base toward a retail
app.
Fourth, these findings can be applied by industry through the application of creating
mobile design features that elicit strong feelings of pleasure and arousal when viewed. The
emotional response of pleasure and arousal were found to be significant predictors as well as
mediators of mobile app stickiness whereas dominance was not found to be a predicotor. Thus
consumers with heightened feelings of pleasure and arousal from a mobile app’s design features
are more likley to have increased mobile app stickiness intentions. These findings are in line
with prior literature suggesting that low task relevant cues are more likely to enhance feelings of
pleasure and arousal when implemented correctly while only hard task relevant cues can enhance
a consumer’s dominance. Thus marketers should focus on design elements that will foster
102
feelings of pleasure and arousal as opposed to control as these are the most likely to lead to
stickiness behavior.
Overall, the findings of this study confirmed the importance atmospherics have on a store
environment as it relates to behavioral intentions. In particular this study shows mobile design
features impact on consumers’ emotional response and its influence on mobile app stickiness
intention. Thus consumers experience emotions (pleasure, arousal, and dominance) differently
and held varying degrees of mobile app stickiness intentions for the different types of mobile
design features, multimedia product viewing, product promotions, and consumer led interactions.
Accordingly, this implies that marketers must be intentional in their selection and usage of
mobile design features to increase mobile app stickiness intentions. Marketers need to
understand which mobile design features best generates positive emotions in their target market
and how it relates to consumers’ intention to stay on an app longer and return to the app more
often (mobile app stickiness intention).
Limitations and Scope of Future Research
As with all research, this study has limitations which can lead to future research
opportunities. First, the study’s sample was comprised of female millenials. Although millenials
are the driving group of mobile app usage and females are still the predominant shoppers, their
usage limits the generalizability of this study. Future research could look to expand the
generational group of the study and/ or include males in the participants pool. This would yield
interesting results of whether mobile design features influence is affected by gender or
generation.
Second, while this study utilized photoshop to create realistic app screens, the app
screens themselved acted as screenshots of a mobile shopping experience. This limited the depth
103
of the findings as interactive apps are more realistic and would more likely yield different results.
Future research should create a functioning app or an exisitng app to replicate the study’s design.
In addition, the stimuli created were a composite of multiple brands yielding fictitous images
devoid of branding. While this research did not look at the impact of brand image or congruity,
future research could incoporate these factors to either act as control over consumer emotional
response or as predictor of mobile app stickiness.
Third, this research viewed three mobile design featues as a whole. Future research could
look at each individual mobile design feature and the elements that constitue them to determine
which elements are the contributing factors to mobile app stickiness. This could be valuable to
enhance and tailor consumer experience. In addition to note, this study did not utilize a control
group. As the scope of this research aimed to generate mobile experience that were as real as
possible thus the usage of a hard task relevent cue control group would have generated a mobile
app screen with block of text devoid of color, graphics, and layout. Future research should aim
to remedy this issue by creating a control group which either has only hard task relevant cues or
encompasses all elements of mobile design featues.
Fourth, this study limited the research setting to a branded mobile fashion apparel
retailer. Consumers response may vary according to their involvement or familiarity with
apparel products as well as with shopping for apparel through a mobile app. Future research
should look to expand the products used as a stimuli. In addition, future research could use other
types of apps such as wholesale or third party retailers to garner a more complete view of the the
impact of mobile design features on retail apps and stickiness behavior.
Fifth, this study used qualitative methods only in preparation of stimuli development.
Therefore, future research should take a qualitative approach to understanding the dynamic
104
between consumers’ emotional response and mobile design features. Specifically qualitative
research may be able to shed some light on questions unanswered from a quantitative viewpoint
such as the reason multimedia product viewing features did not influence a consumer’s
emotional response. In addition, research into mobile app design features and mobile
atmospherics is new; therefore, much emphasis should be placed on understanding the reasons
consumers interact with their mobile app.
105
REFERENCES
Agarwal, R., & Venkatesh, V. (2002). Assessing a firm's Web presence: A heuristic evaluation
procedure for the measurement of usability. Information Systems Research, 13(2), 168-
186.
Ahuja, V., & Khazanchi, D. (2016). Creation of a Conceptual Model for Adoption of Mobile
Apps for Shopping from E-Commerce Sites–An Indian Context. Procedia Computer
Science, 91, 609-616. doi:10.1016/j.procs.2016.07.152
Babin, B. J., William, R. D., & Mitch, G. (1994). Work and/ or fun: measuring hedonic and
utilitarian shopping value. Journal of Consumer Research, 20(4), 644-656.
Baker, J. (1986). The role of the environment in marketing services: The consumer perspective.
The services challenge: Integrating for competitive advantage, 1(1), 79-84.
Batra, R., & Ahtola, O. T. (1991). Measuring the hedonic and utilitarian sources of customer
attitudes. Marketing Letters, 12(2), 159-170.
Beldona, S., & Cai, L. A. (2006). An exploratory evaluation of rural tourism websites. Paper
presented at the Journal of Convention & Event Tourism.
Bellman, S., Potter, R. F., Treleaven-Hassard, S., Robinson, J. A., & Varan, D. (2011). The
effectiveness of branded mobile phone apps. Journal of Interactive Marketing, 25(4),
191-200.
Benlian, A. (2015). Web Personalization Cues and Their Differential Effects on User
Assessments of Website Value. Journal of Management Information Systems, 32(1), 225-
260. doi:10.1080/07421222.2015.1029394
Bitner, M. J. (1992). Servicescapes: The impact of physical surroundings on customers and
employees. The Journal of Marketing, 57-71.
Bomhold, C. R. (2013). Educational use of smart phone technology: A survey of mobile phone
application use by undergraduate university students. Program, 47(4), 424-436.
Budiu, R. (2013). Mobile: Native apps, web apps, and hybrid apps. Nielsen Norman Group, 49-
53.
Chaffey, D., Ellis-Chadwick, F., Mayer, R., & Johnston, K. (2009). Internet marketing: strategy,
implementation and practice: Pearson Education.
106
Chang, C.-C. (2015). Exploring mobile application customer loyalty: The moderating effect of
use contexts. Telecommunications Policy, 39(8), 678-690.
Chang, H. H., & Wang, H.-W. (2011). The moderating effect of customer perceived value on
online shopping behaviour. Online Information Review, 35(3), 333-359.
Chong, A. Y.-L. (2013). Predicting m-commerce adoption determinants: A neural network
approach. EXPERT SYSTEMS WITH APPLICATIONS, 40(2), 523-530.
Chong, A. Y.-L., Chan, F. T., & Ooi, K.-B. (2012). Predicting consumer decisions to adopt
mobile commerce: Cross country empirical examination between China and Malaysia.
Decision Support Systems, 53(1), 34-43.
Clark, W. R., Ezell, J., Clark, J., & Sheffield, D. N. (2009). Stay or leave: Applying Approach–
Avoidance Theory to virtual environments. Journal of Database Marketing & Customer
Strategy Management, 16(4), 231-240.
Creswell, J. W. (2007). Qualitative inquiry & research design: choosing among five approaches.
Sage Publications. Thousand Oaks, CA.
Criteo. (2016). Leading mobile retailers dominate-and the gap is growing Q4 2015. State of
Mobile Commerce. Retrieved from http://www.criteo.com/media/3750/criteo-state-of-
mobile-commerce-report-q4-2015.pdf
Cyr, D. (2008). Modeling web site design across cultures: relationships to trust, satisfaction, and
e-loyalty. Journal of Management Information Systems, 24(4), 47-72.
Dawson, S., & Kim, M. (2010). Cues on apparel web sites that trigger impulse purchases.
Journal of Fashion Marketing and Management: An International Journal, 14(2), 230-
246.
deMarrais, K. (2004). Qualitative interview studies: Learning through experience. Foundations
for research: Methods of inquiry in education and the social sciences, 1(1), 51-68.
Dennis, C., King, T., Kim, J., & Forsythe, S. (2007). Hedonic usage of product virtualization
technologies in online apparel shopping. International Journal of Retail & Distribution
Management, 35(6), 502-514.
Dholakia, R. R., & Miao, Z. (2009). How does it influence customer satisfaction and behavioral
intentions? International Journal of Retail & Distribution Management, 37(10), 821-838.
doi:10.1108]09590550910988011
Donnelly, C., & Scaff, R. Who are the millennial shoppers? and what do they really want?
Outlook. Retrieved from https://www.accenture.com/us-en/insight-outlook-who-are-
millennial-shoppers-what-do-they-really-want-retail
107
Donovan, R. J., & Rossiter, J. R. (1982). Store Atmosphere: An Environmental Psychology
Approach. Journal of Retailing, 58(1), 34.
Etikan, I., Musa, S. A., & Alkassim, R. S. (2016). Comparison of convenience sampling and
purposive sampling. American Journal of Theoretical and Applied Statistics, 5(1), 1-4.
eMarketer. (2016). Shoppers Are Downloading More Mobile Retail Apps. Retail and
eCommerce. Retrieved from https://www.emarketer.com/Article/Shoppers-Downloading-
More-Mobile-Retail-Apps/1014041
Eroglu, S., Machleit, K., & Davis, L. (2000). Online retail atmospherics: Empirical tests of a cue
typology. Retailing, 144-150.
Eroglu, S. A., Machleit, K. A., & Davis, L. M. (2001). Atmospheric qualities of online retailing.
A conceptual model and implications. Journal of Business Research, 54, 177-184.
doi:10.1016/S0148-2963(99)00087-9
Eroglu, S. A., Machleit, K. A., & Davis, L. M. (2003). Empirical testing of a model of online
store atmospherics and shopper responses. Pyschology and Marketing, 20(2), 139-150.
Faqih, K. M., & Jaradat, M.-I. R. M. (2015). Assessing the moderating effect of gender
differences and individualism-collectivism at individual-level on the adoption of mobile
commerce technology: TAM3 perspective. Journal of Retailing and Consumer Services,
22, 37-52.
Feinberg, R., & Kadam, R. (2002). E-CRM Web service attributes as determinants of customer
satisfaction with retail Web sites. INTERNATIONAL JOURNAL OF SERVICE
INDUSTRY MANAGEMENT, 13(5), 432-451.
Fiore, A. M. (2002). Effects of experiential pleasure from a catalogue environment on approach
responses toward fashion apparel. Journal of Fashion Marketing and Management: An
International Journal, 6(2), 122-133.
Fiore, A. M., & Jin, H. J. (2003). Influence of image interactivity on approach responses towards
an online retailer. Internet Research, 13(1), 38-48.
Floh, A., & Madlberger, M. (2013). The role of atmospheric cues in online impulse-buying
behavior. Electronic Commerce Research and Applications, 12(6), 425-439.
Gartner. (2013). Gartner says mobile app stores will see annual downloads reach 102 billion in
2013 [Press release]. Retrieved from http://www.gartner.com/newsroom/id/2592315
Goldman, S. M. (2010). Transformers. Journal of Consumer Marketing, 27(5), 469-473.
Grandon, E., & Ranganathan, C. (2001). The impact of content and design of web sites on online
sales. AMCIS 2001 Proceedings, 179.
108
Gulliver, S. R., & Ghinea, G. (2010). Cognitive style and personality: impact on multimedia
perception. Online Information Review, 34(1), 39-58.
Ha, Y., Kwon, W.-S., & Lennon, S. J. (2007). Online visual merchandising (VMD) of apparel
web sites. Journal of Fashion Marketing and Management: An International Journal,
11(4), 477-493.
Ha, Y., & Lennon, S. J. (2010). Online visual merchandising (VMD) cues and consumer
pleasure and arousal: purchasing versus browsing situation. Psychology & Marketing,
27(2), 141-165.
Hasan, B. (2016). Full length article: Perceived irritation in online shopping: The impact of
website design characteristics. Computers in Human Behavior, 54, 224-230.
doi:10.1016/j.chb.2015.07.056
Hausman, A. V., & Siekpe, J. S. (2009). The effect of web interface features on consumer online
purchase intentions. Journal of Business Research, 62, 5-13.
doi:10.1016/j.jbusres.2008.01.018
Hayes, A. F., & Preacher, K. J. (2014). Statistical mediation analysis with a multicategorical
independent variable.British Journal of Mathematical and Statistical Psychology, 67(3),
451-470.
Hayes, A. F. (2013). Introduction to mediation, moderation, and conditional process analysis: A
regression-based approach: Guilford Press.
Hayes, A. F., & Preacher, K. J. (2013). Conditional process modeling: Using structural equation
modeling to examine contingent causal processes. Structural equation modeling: A
second course, 2, 217-264.
Hayes, A. F., & Scharkow, M. (2013). The relative trustworthiness of tests of indirect effects in
statistical mediation analysis.Does method really matter?PsychologicalScience,24,1918–
1927. doi:10.1177/0956797613480187
Hew, J.-J., Lee, V.-H., Leong, L.-Y., Hew, T.-S., & Ooi, K.-B. (2016). The dawning of mobile
tourism: what contributes to its system success? International Journal of Mobile
Communications, 14(2), 170-201.
Hew, J.-J., Lee, V.-H., Ooi, K.-B., & Wei, J. (2015). What catalyses mobile apps usage intention:
an empirical analysis. Industrial Management & Data Systems, 115(7), 1269-1291.
Hinchcliffe, D. (2013). 2013 predicitons for enterprise social media. Social Enterprise. Retrieved
from http://www.zdnet.com/article/2013-predictions-for-enterprise-social-media/
Hirschman, E. C., & Holbrook, M. B. (1982). Hedonic consumption: emerging concepts,
methods and propositions. Journal of Marketing, 46(2), 92-101.
109
Ho, H.-Y., & Syu, L.-Y. (2010). Uses and gratifications of mobile application users. Paper
presented at the Electronics and Information Engineering (ICEIE), 2010 International
Conference On.
Ho, J. Y., & Dempsey, M. (2010). Viral marketing: Motivations to forward online content.
Journal of Business Research, 63(9), 1000-1006.
Hoffman, D. L., & Novak, T. P. (1996). Marketing in hypermedia computer-mediated
environments: conceputal foundations. Journal of Marketing, 60(3), 50-68.
Hsiao, K. L., Lin, J. C. C., Wang, X. Y., Lu, H. P., & Yu, H. J. (2010). Antecedents and
consequences of trust in online product recommendations An empirical study in social
shopping. Online Information Review, 34(6), 935-953.
Hsieh, J.-K., Hsieh, Y.-C., Chiu, H.-C., & Yang, Y.-R. (2014). Customer response to web site
atmospherics: Task-relevant cues, situational involvement and PAD. Journal of
Interactive Marketing, 28(3), 225-236. doi:10.1016/j.intmar.2014.03.001
Hsu, C.-L., & Lin, J. C.-C. (2015). What drives purchase intention for paid mobile apps?–An
expectation confirmation model with perceived value. Electronic Commerce Research
and Applications, 14(1), 46-57.
Hsu, C. C. (2012). Comparison of general differences in young people's blog interface
preferences and design. Displays, 33(3), 119-128.
Huizingh, E. K. R. E. (2000). The content and design of web sites: an empirical study.
Information & Management, 37, 123-134. doi:10.1016/S0378-7206(99)00044-0
In Shim, S., & Lee, Y. (2011). Consumer's perceived risk reduction by 3D virtual model.
International Journal of Retail & Distribution Management, 39(12), 945-959.
Islam, R., Islam, R., & Mazumder, T. (2010). Mobile application and its global impact.
International Journal of Engineering & Technology (IJEST), 10(6), 72-78.
Jayawardhena, C., & Wright, L. T. (2009). An empirical investigation into e-shopping
excitement: antecedents and effects. European Journal of Marketing, 43(9-10), 1171-
1187.
Kalyanaraman, S., & Sundar, S. S. (2006). The psychological appeal of personalized content in
web portals: does customization affect attitudes and behavior? Journal of
Communication, 56(1), 110-132.
Kaplan, A. M., & Haenlein, M. (2010). Users of the world, unite! The challenges and
opportunities of Social Media. Business Horizons, 53, 59-68.
doi:10.1016/j.bushor.2009.09.003

110
Keng, C. J., & Ting, H. Y. (2009). The acceptance of blogs: using a customer experiential value
perspective. Internet Research, 19(5), 479-495.
Kim, E., Lin, J.-S., & Sung, Y. (2013). To App or Not to App: Engaging Consumers via Branded
Mobile Apps. Journal of Interactive Advertising, 13(1), 53.
doi:10.1080/15252019.2013.782780
Kim, G., Shin, B., & Lee, H. G. (2009). Understanding dynamics between initial trust and usage
intentions of mobile banking. Information Systems Journal, 19(3), 283-311.
Kim, H., & Lennon, S. J. (2010). E-atmosphere, emotional, cognitive, and behavioral responses.
Journal of Fashion Marketing & Management, 14(3), 412-428.
doi:10.1108/13612021011061861
Kim, J., & Lennon, S. J. (2013). Effects of reputation and website quality on online consumers'
emotion, perceived risk and purchase intention: Based on the stimulus-organism-response
model. Journal of Research in Interactive Marketing, 7(1), 33-56.
Kim, J., Ma, Y. J., & Park, J. (2009). Are US consumers ready to adopt mobile technology for
fashion goods? An integrated theoretical approach. Journal of Fashion Marketing &
Management, 13(2), 1361-2026.
Kim, M., Kim, J.-H., & Lennon, S. J. (2006). Online service attributes available on apparel retail
web sites: an ES-QUAL approach. Managing Service Quality: An International Journal,
16(1), 51-77.
Kim, M., & Lennon, S. (2008). The effects of visual and verbal information on attitudes and
purchase intentions in internet shopping. Psychology & Marketing, 25(2), 146-178.
Kim, S. J., Wang, R. J.-H., & Malthouse, E. C. (2015). The effects of adopting and using a
brand's mobile application on customers' subsequent purchase behavior. Journal of
Interactive Marketing, 31, 28-41.
Ko, E., Kim, E. Y., & Lee, E. K. (2009). Modeling consumer adoption of mobile shopping for
fashion products in Korea. Psychology & Marketing, 26(7), 669-687.
Koo, W., Cho, E., & Kim, Y.-K. (2014). Actual and ideal self-congruity affecting consumers’
emotional and behavioral responses toward an online store. Computers in Human
Behavior, 36, 147-153.
Kotler, P. (1973). Atmospherics as a marketing tool. Journal of Retailing, 49(4), 48-64.
Krotov, V., Junglas, I., & Steel, D. (2015). The mobile agility framework: an exploratory study
of mobile technology enhancing organizational agility. Journal of theoretical and applied
electronic commerce research, 10(3), 1-7.
111
Kumar, A., & Mukherjee, A. (2013). Shop while you talk: determinants of purchase intentions
through a mobile device. International Journal of Mobile Marketing, 8(1), 23-37.
Lee, C.-Y., Tsao, C.-H., & Chang, W.-C. (2015). The relationship between attitude toward using
and customer satisfaction with mobile application services. Journal of Enterprise
Information Management, 28(5), 680-697. doi:10.1108/JEIM-07-2014-0077
Lee, D., Yejean Park, J., Kim, J., Kim, J., & Moon, J. (2011). Understanding music sharing
behaviour on social network services. Online Information Review, 35(5), 716-733.
Li, D., Browne, G. J., & Wetherbe, J. C. (2006). Why do internet users stick with a specific web
site? A relationship perspective. International Journal of Electronic Commerce, 10(4),
105-141.
Li, H., Daugherty, T., & Biocca, F. (2001). Characteristics of virtual experience in electronic
commerce: A protocol analysis. Journal of Interactive Marketing, 15(3), 13-30.
Lin, J. C.-C. (2007). Online stickiness: its antecedents and effect on purchasing intention.
Behaviour & Information Technology, 26(6), 507-516. doi:10.1080/01449290600740843
Lin, L., Hu, P. J.-H., Sheng, O. R. L., & Lee, J. (2010). Is stickiness profitable for electronic
retailers? Communications of the ACM, 53(3), 132-136.
Lionbridge. (2012). Mobile web apps vs. mobile native apps: how to make the right choice.
Retrieved from http://www.lionbridge.com/files/2012/11/Lionbridge-
WP_MobileApps2.pdf
Lipsman, A. (2014). Major mobile milestones in may: apps now drive half of all time spent on
digital. Insights. Retrieved from https://www.comscore.com/Insights/Blog/Major-Mobile-
Milestones-in-May-Apps-Now-Drive-Half-of-All-Time-Spent-on-Digital
Lohse, G. L., & Spiller, P. (1999). Internet retail store design: How the user interface influences
traffic and sales. Journal of Computer-Mediated Communication, 5(2).
Lončaric´, D., Prodan, M. P., & Ribaric´, I. (2016). The influence of a visitor's perceptions of a
museum's website design on behavioural intentions. Ekonomski Vjesnik, 29(1), 65-79.
Lowe, B., Maxwell, S., & Estelami, H. (2010). Consumer perceptions of extra free product
promotions and discounts: the moderating role of perceived performance risk. Journal of
Product & Brand Management, 19(7), 496-503.
Lu, J., Liu, Z., & Fang, Z. (2016). Hedonic products for you, utilitarian products for me.
Judgment & Decision Making, 11(4), 332.
112
Lu, Y., & Rastrick, K. (2014). Impacts of Website Design on the Adoption Intention of Mobile
Commerce: Gender as a Moderator. New Zealand Journal of Applied Business Research
(NZJABR), 12(2), 51-68.
Lu, Y., & Smith, S. (2008). Augmented reality e-commerce: how the technology benefits people's
lives: INTECH Open Access Publisher.
Lutz, R. J., & Kakkar, P. (1975). The psychological situation as a determinant of consumer
behavior. NA-Advances in Consumer Research Volume 02.
Maghnati, F., & Ling, K. C. (2013). Exploring the Relationship between Experiential Value and
Usage Attitude towards Mobile Apps among the Smartphone Users. International
Journal of Business & Management, 8(4), 1-9.
Magrath, V., & McCormick, H. (2013a). Branding design elements of mobile fashion retail apps.
Journal of Fashion Marketing & Management, 17(1), 98-114.
doi:10.1108/13612021311305164
Magrath, V., & McCormick, H. (2013b). Marketing design elements of mobile fashion retail
apps. Journal of Fashion Marketing & Management, 17(1), 115-134.
doi:10.1108/13612021311305173
Mahatanankoon, P., Wen, H. J., & Lim, B. (2005). Consumer-based m-commerce: exploring
consumer perception of mobile applications. Computer Standards & Interfaces, 27(4),
347-357.
Manganari, E. E., Siomkos, G. J., Rigopoulou, I. D., & Vrechopoulos, A. P. (2011). Virtual store
layout effects on consumer behaviour: applying an environmental psychology approach
in the online travel industry. Internet Research, 21(3), 326-346.
Mangold, W. G., & Faulds, D. J. (2009). Social media: The new hybrid element of the promotion
mix. Business Horizons, 52, 357-365. doi:10.1016/j.bushor.2009.03.002
Mau, D. (2013). How retailers are using mobile to fuel your shopping addiction. Retrieved from
Tech website: http://fashionista.com/2013/08/how-retailers-are-using-mobile-to-fuel-
your-shopping-addiction/
Mazaheri, E., Richard, M. O., Laroche, M., & Ueltschy, L. C. (2014). The influence of culture,
emotions, intangibility, and atmospheric cues on online behavior. Journal of Business
Research, 67(3), 253-259.
McCormick, H., & Livett, C. (2012). Analysing the influence of the presentation of fashion
garments on young consumers' online behaviour. Journal of Fashion Marketing &
Management, 16(1), 21-41. doi:10.1108/13612021211203014
McCracken, G. (1988). The long interview (Vol. 13): Sage.
113
Mehrabian, A., & Russell, J. A. (1974). An Approach to Environmental Psychology. Cambridge,
M.A.
Meola, A. (2016). The rise of m-commerce: mobile shopping stats & trends. Retrieved from
http://www.businessinsider.com/mobile-commerce-shopping-trends-stats-2016-10
Meyer-Waarden, L. (2008). The influence of loyalty programme membership on customer
purchase behaviour. European Journal of Marketing, 42(1/2), 87-114.
Mild, A., & Reutterer, T. (2003). An improved collaborative filtering approach for predicting
cross-category purchases based on binary market basket data. Journal of Retailing and
Consumer Services, 10(3), 123-133.
Millennials: Technology=social connection. (2014). Insights. Retrieved from
http://www.nielsen.com/us/en/insights/news/2014/millennials-technology-social-
connection.html
Milnes, H. (2016). Where mobile commerce is going in 2016. Retrieved from
http://digiday.com/brands/mobile-commerce-going-2016/
Moon, E., & Domina, T. (2015). Willingness to use Fashion Mobile Applications to Purchase
Fashion Products: A comparison between the United States and South Korea. Journal of
Textile & Apparel Technology & Management (JTATM), 9(3), 1-15.
Moustakas, C. (1994). Phenomenological research methods: Sage.
Muller, B. (2008). Consistency between brand image and website image: Does it matter?
International Journal of Internet Marketing and Advertising, 4(4), 350-361.
Mummalaneni, V. (2005). An empirical investigation of Web site characteristics, consumer
emotional states and on-line shopping behaviors. Journal of Business Research, 58(4),
526-532.
Ngai, E. W., & Gunasekaran, A. (2007). A review for mobile commerce research and
applications. Decision Support Systems, 43(1), 3-15.
Ngo, L. V., Northey, G., Duffy, S., Thao, H. T. P., & Tam, L. T. H. (2016). Perceptions of
others, mindfulness, and brand experience in retail service setting. Journal of Retailing
and Consumer Services, 33, 43-52. doi:10.1016/j.jretconser.2016.07.003
Nguyen, B., & Mutum, D. S. (2012). A review of customer relationship management: successes,
advances, pitfalls and futures. Business Process Management Journal, 18(3), 400-419.
Novak, T. P., Hoffman, D. L., & Yung, Y.-F. (2000). Measuring the customer experience in
online environments: A structural modeling approach. Marketing science, 19(1), 22-42.
114
Park, M., & Lennon, S. J. (2009). Brand name and promotion in online shopping contexts.
Journal of Fashion Marketing & Management, 13(2), 149-160.
Racherla, P., Furner, C., & Babb, J. (2012). Conceptualizing the implications of mobile app
usage and stickiness: A research agenda. Available at SSRN 2187056.
Ranganathan, C., & Ganapathy, S. (2002). Key dimensions of business-to-consumer web sites.
Information & Management, 39(6), 457-465.
Reichheld, F. F., & Schefter, P. (2000). E-loyalty: your secret weapon on the web. Harvard
Business Review, 87(4), 105-113.
Richard, M.-O., & Habibi, M. R. (2016). Advanced modeling of online consumer behavior: The
moderating roles of hedonism and culture. Journal of Business Research, 69(3), 1103-
1119.
Ridgway, N. M., Dawson, S. A., & Bloch, P. H. (1990). Pleasure and arousal in the marketplace:
Interpersonal differences in approach-avoidance responses. Marketing Letters, 1(2), 139-
147.
Roulston, K., & Martinez, B. (2015). 3 Recruitment and Sampling in Consumer Research.
Qualitative Research Methods in Consumer Psychology: Ethnography and Culture, 2,
33.
Rowley, J. (2009). Online branding strategies of UK fashion retailers. Internet Research, 19(3),
348-369.
San-Martín, S., López-Catalán, B., & Ramón, M. A. (2013). Mobile shoppers: types, drivers,
and impediments. Journal of organizational computing and electronic commerce, 23(4),
350-371.
Santos, J. (2003). E-service quality: a model of virtual service quality dimensions. Managing
Service Quality: An International Journal, 13(3), 233-246.
Shao Yeh, Y., & Li, Y.-M. (2009). Building trust in m-commerce: contributions from quality and
satisfaction. Online Information Review, 33(6), 1066-1086.
Shih, C. (1998). Telepresence and bricolage: a conceptual model of consumer experiences in
virtual environments. Paper presented at the 1998 Winter Society for Consumer
Psychology Conference Proceedings.
Shih, Y.-Y., & Chen, C.-Y. (2013). The study of behaavioral intention for mobile commerce:
via integrated model of TAM and TTF. Quality & Quantity, 47(2), 1009-1020.
Shim, S. I., & Lee, Y. (2011). Consumer's perceived risk reduction by 3D virtual model.
International Journal of Retail & Distribution Management, 39(12), 945-959.
115
Shin, D. H. (2010). Analysis of online social networks: a cross-national study. Online
Information Review, 34(3), 473-495.
Siddiqui, N., O'Malley, A., McColl, J., & Birtwistle, G. (2003). Retailer and consumer
perceptions of online fashion retailers: Web site design issues. Journal of Fashion
Marketing & Management, 7(4), 345-355.
Simmons, G., Thomas, B., & Truong, Y. (2010). Managing i-branding to create brand equity.
European Journal of Marketing, 44(9-10), 1260-1285.
Simmons, G. J. (2007). “i-Branding”: developing the internet as a branding tool. Marketing
Intelligence & Planning, 25(6), 544-562.
Singh, T., Veron-Jackson, L., & Cullinane, J. (2008). Blogging: A new play in your marketing
game plan. Business Horizons, 51(4), 281-292.
Skidmore, S. (2013). Native, HTML5 or hybrid? Retrieved from
https://www.apperian.com/mam-blog/enterprise-mobile-apps-native-html5-hybrid/
Smartbear. (2014). The state of Mobile Retrieved from
http://www2.smartbear.com/rs/smartbear/images/smartbear-2014-software-industry-
survey-testing.pdf
Solomon, M. R. (2009). Marketing: Real people, real decisions: Pearson Education.
Srinivasan, S. S., Andderson, R., & Ponnavolu, K. (2002). Customer loyalty in e-commerce: an
exploration of its antecedents and consequences. Journal of Retailing, 78(1), 41-50.
Staff, M. (2014). Americans' most popular online and mobile purchases. Retrieved from
http://www.marketingcharts.com/online/americans-most-popular-online-and-mobile-
purchases-44246/
Staff, M. (2016). Which categories are most popular with online shoppers across the world?
Retrieved from http://www.marketingcharts.com/online/which-categories-are-most-
popular-with-online-shoppers-across-the-world-69989/
Swilley, E., & Hofacker, C. F. (2006). Defining mobile commerce in a marketing context.
International Journal of Mobile Marketing, 1(2).
Tang, H. (2013). Should retailers invest in mobile shopping apps?, 5. Retrieved from Consumer
Insights for Digital Marketers website: https://blog.compete.com/2013/07/10/retailers-
invest-mobile-shopping-app/
Tarasewhich. (2003). Designing Mobile Commerce Applications. Communications of the ACM,
46(2), 57-60.
116
Tashakkori, A., & Teddlie, C. (1998). Mixed methodology: Combining qualitative and
quantitative approaches (Vol. 46): Sage.
Taylor, D. G., & Levin, M. (2014). Predicting mobile app usage for purchasing and information-
sharing. International Journal of Retail & Distribution Management, 42(8), 759-774.
doi:10.1108/ijrdm-11-2012-0108
Tong, D. Y. K., Lai, K. P., & Tong, X. F. (2012). Ladies' purchase intention during retail shoes
sales promotions. International Journal of Retail & Distribution Management, 40(2), 90.
Van Manen, M. (2016). Researching lived experience: Human science for an action sensitive
pedagogy: Routledge.
Van Teijlingen, E. R., & Hundley, V. (2010). The importance of pilot studies. Social Research
Update, 35, 49-59.
Vesanen, J. (2007). What is personalization? A conceptual framework. European Journal of
Marketing, 41(5/6), 409-418.
Wang, E. S.-T. (2010). Impact of multiple perceived value on consumers' brand preference and
purchase intention: a case of snack foods. Journal of food products marketing, 16(4),
386-397.
Weathers, D., Sharma, S., & Wood, S. L. (2007). Effects of online communication practices on
consumer perceptions of performance uncertainty for search and experience goods.
Journal of Retailing, 83, 393-401. doi:10.1016/j.jretai.2007.03.009
Wright, M. (2012). The influence of mobile: how consumer behavior evolved. Inside FMM: A
curated project of Macala Wright 2008-2012. Retrieved from Mobile website:
http://insidefmm.com/2012/08/the-influence-of-mobile-how-consumer-behavior-evolved/
Wu, J.-H., & Wang, S.-C. (2005). What drives mobile commerce?: An empirical evaluation of
the revised technology acceptance model. Information & Management, 42(5), 719-729.
Wu, W.-Y., Lee, C.-L., Fu, C.-S., & Wang, H.-C. (2013). How can online store layout design
and atmosphere influence consumer shopping intention on a website? International
Journal of Retail & Distribution Management, 42(1), 4-24.
Xu, J., & Liu, Z. (2010). Study of online stickiness: its antecedents and effect on repurchase
intention. Paper presented at the e-Education, e-Business, e-Management, and e-
Learning, 2010. IC4E'10. International Conference on.
Yadav, R., Sharma, S. K., & Tarhini, A. (2016). A multi-analytical approach to understand and
predict the mobile commerce adoption. Journal of Enterprise Information Management,
29(2), 222-237.
117
Yang, K. (2012). Consumer technology traits in determining mobile shopping adoption: An
application of the extended theory of planned behavior. Journal of Retailing and
Consumer Services, 19(5), 484-491.
Yang, S., Wang, Y., & Wei, J. (2014). Integration and consistency between web and mobile
services. Industrial Management & Data Systems, 114(8), 1246-1269.
doi:10.1108/IMDS-06-2014-0167
Yoon, D., Choi, S. M., & Sohn, D. (2008). Building customer relationships in an electronic age:
The role of interactivity of E-commerce Web sites. Psychology & Marketing, 25(7), 602-
618.
Zhang, H., Lu, Y., Wang, B., & Wu, S. (2015). The impacts of technological environments and
co-creation experiences on customer participation. Information & Management, 52(4),
468-482.
Zhang, L., Zhu, J., & Liu, Q. (2012). A meta-analysis of mobile commerce adoption and the
moderating effect of culture. Computers in Human Behavior, 28(5), 1902-1911.
Zhao, Z., & Balagué, C. (2015). Designing branded mobile apps: Fundamentals and
recommendations. Business Horizons, 58(3), 305-315.
Zott, C., Amit, R., & Donlevy, J. (2000). Strategies for value creation in e-commerce:: best
practice in Europe. European Management Journal, 18(5), 463-475.

118
Appendix A
Institutional Review Board Approval for Pilot Study
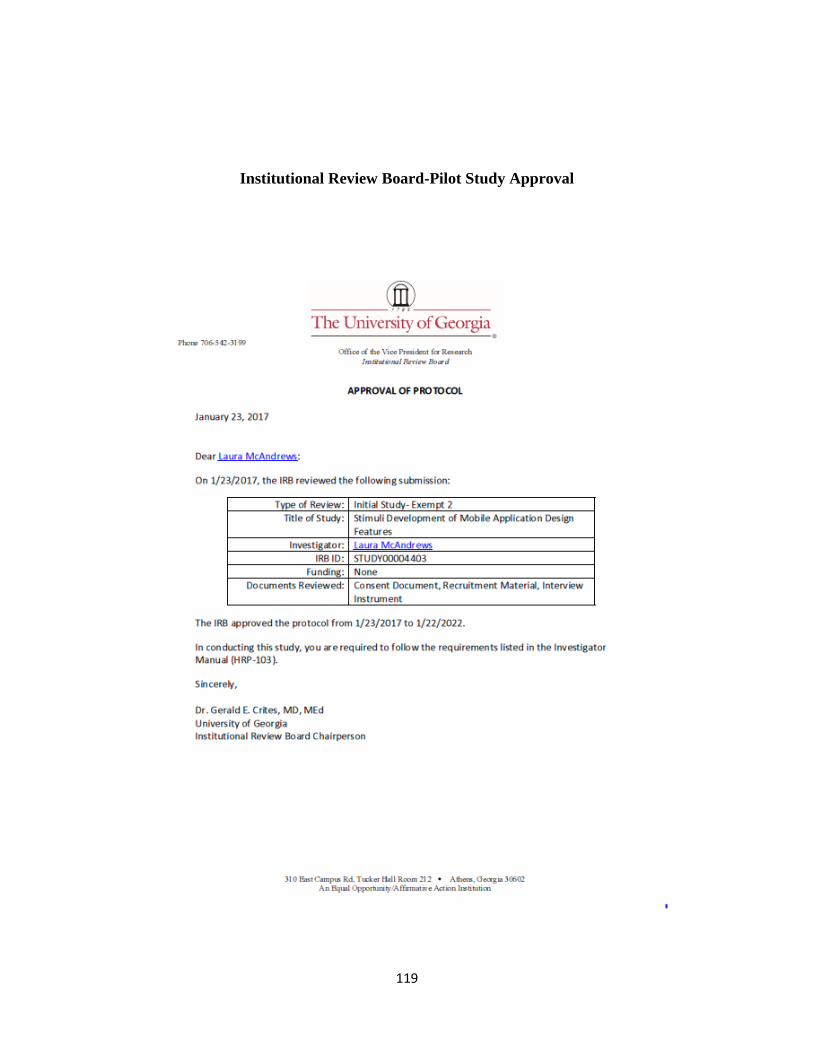
119
Institutional Review Board-Pilot Study Approval
120
APPENDIX B
RECRUITMENT MATERIAL AND CONSENT FORMS FOR PILOT STUDY
121
RECRUIMENT SCRIPT
Hi! My name is Briana Martinez and I am a PhD candidate here in TXMI under the
direction of Dr. Laura McAndrews. I am currently working on developing some stimuli for my
dissertation research on the design features of mobile apps. I would like to conduct interview
with millennial students who use their mobile phone to shop.
It doesn’t matter whether or not you have made a purchase on your mobile phone. It only
matters that you use mobile apps to aid in the shopping process. To be able to participate in the
50 minute interviews, you need to be over the age of 18, own a smartphone, and have used
mobile apps in the shopping process. In addition, there will be a raffle of two 10-dollar visa gift
card. While your participation in the interview is not necessary to enter, I do hope you all help
me out with your participation.
So, if you are interested, please leave your email and mailing addresses on this paper
here, that I will pass around. I will then enter you into the drawing and contact you by weeks
end to set up an interview time that will work best for you schedule. If you have any additional
questions, please contact me at [email protected]. Thank you so much for your help!
122
Consent Letter
Date:
Dear Prospective Participant:
I am a graduate student under the direction of Dr. Laura McAndrews in the department of
Textiles, Merchandising, and International Trade at the University of Georgia. I invite you to
participate in a research study entitled “Stimuli Development of Mobile Design Features.” To be
applicable for participation you simply need to be 18 years of age or older, own a smartphone,
and have experience with shopping on a mobile app. The purpose of this study is to design
several stimuli emphasizing the mobile design features most applicable to todays’ mobile app.
Your participation will involve an in-depth interview pertaining your mobile app usage, the type
of shopper you are, and the mobile design features you are most familiar with. This research will
be undertaken as an interview which should take no more than 50 minutes of your time. The
interview consists of 2 main parts: exploration of mobile app usage and mobile shopper
behavior and mobile design features used to aid in shopping process. Participation in this
interview has no direct benefits; however, your participation in this interview can aid the
understanding of the influence of mobile design features on the shopping process. No foreseen
risk is seen in this research; however, if at any time during this survey you feel any discomfort,
you can stop participation in the survey. There is a 10-dollar visa gift card raffle incentive for
your participation in this study; however, participation is not required to enter the raffle. If you
should win the raffle, your gift card will be mailed to you at the address provided in your raffle
entry.
The data collected about the participants will be anonymous as names will not be collected for
the interview. The interview will be audio recorded in order to be transcribed but no identifying
information will be recorded. The audio recordings will be deleted at the completion of the
study. The mobile screen of your phone will be video recorded with permission and will cease
as any time you feel uncomfortable. The video recording will only be of your mobile screen.
The mobile recorded sessions are to be used as a visual aid in stimuli development. The results
of the research study may be published, but your name or any identifying information will not be
used. Your involvement in the study is voluntary, and you may choose not to participate or to
stop at any time without penalty or loss of benefits to which you are otherwise entitled. Your
decision about participation will have no bearing on your grades or class standing.
The main researcher conducting this study is Dr. Laura McAndrews, a professor at the
University of Georgia. Please ask any questions you may have at this time. If you have
questions later, you may contact Dr. McAndrews at [email protected] or me at
[email protected]. If you have any questions or concerns regarding your rights as a research
123
participant in this study, you may contact the Institutional Review Board (IRB) Chairperson at
706.542.3199 or [email protected].
By reading and signing this letter, you are agreeing to participate in the above described research
project. Thank you for your consideration! A copy of this letter will be provided, please keep
for your records.
Sincerely,
Briana Martinez XX_________________________________________
124
APPENDIX C INTERVIEW INSTRUMENT
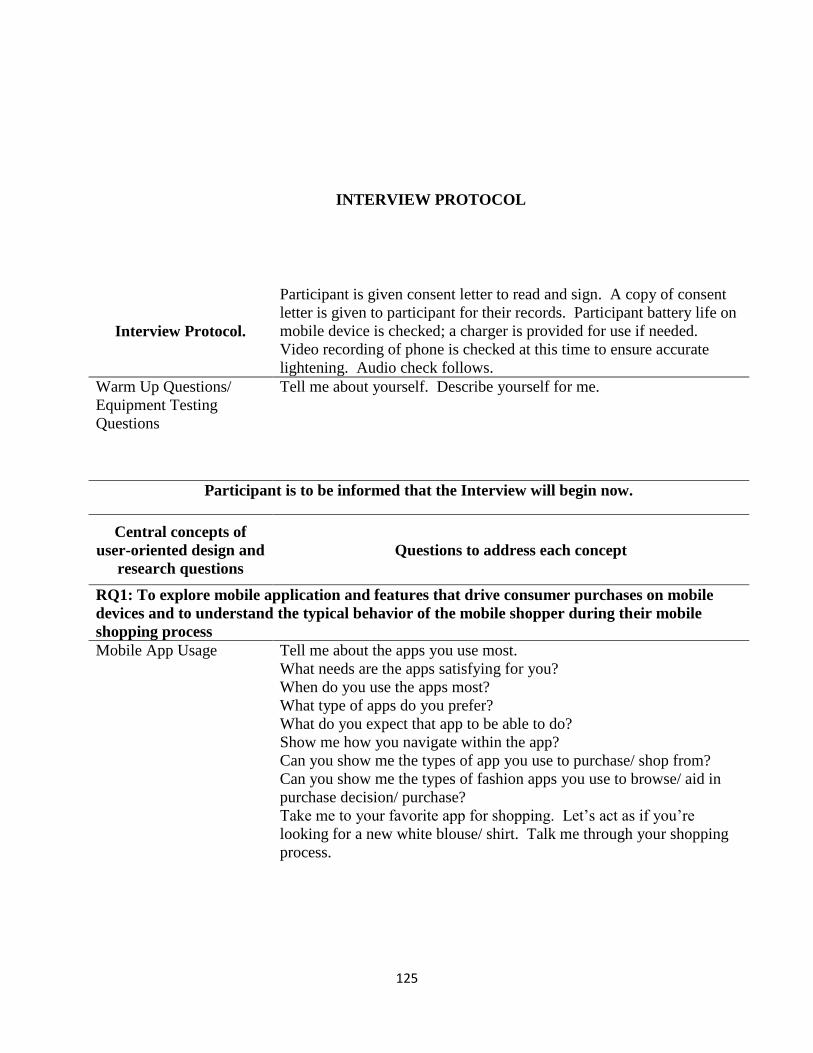
125
INTERVIEW PROTOCOL
Interview Protocol.
Participant is given consent letter to read and sign. A copy of consent
letter is given to participant for their records. Participant battery life on
mobile device is checked; a charger is provided for use if needed.
Video recording of phone is checked at this time to ensure accurate
lightening. Audio check follows.
Warm Up Questions/
Equipment Testing
Questions
Tell me about yourself. Describe yourself for me.
Participant is to be informed that the Interview will begin now.
Central concepts of
user-oriented design and
research questions
Questions to address each concept
RQ1: To explore mobile application and features that drive consumer purchases on mobile
devices and to understand the typical behavior of the mobile shopper during their mobile
shopping process
Mobile App Usage
Tell me about the apps you use most.
What needs are the apps satisfying for you?
When do you use the apps most?
What type of apps do you prefer?
What do you expect that app to be able to do?
Show me how you navigate within the app?
Can you show me the types of app you use to purchase/ shop from?
Can you show me the types of fashion apps you use to browse/ aid in
purchase decision/ purchase?
Take me to your favorite app for shopping. Let’s act as if you’re
looking for a new white blouse/ shirt. Talk me through your shopping
process.
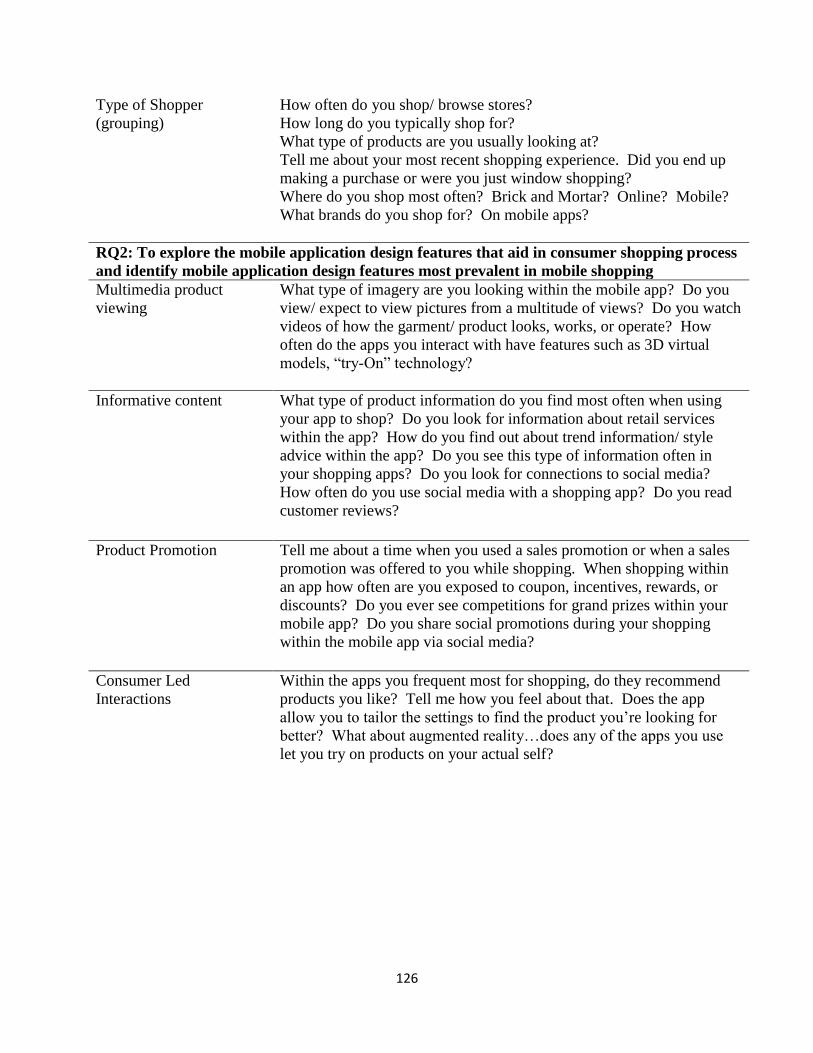
126
Type of Shopper
(grouping)
How often do you shop/ browse stores?
How long do you typically shop for?
What type of products are you usually looking at?
Tell me about your most recent shopping experience. Did you end up
making a purchase or were you just window shopping?
Where do you shop most often? Brick and Mortar? Online? Mobile?
What brands do you shop for? On mobile apps?
RQ2: To explore the mobile application design features that aid in consumer shopping process
and identify mobile application design features most prevalent in mobile shopping
Multimedia product
viewing
What type of imagery are you looking within the mobile app? Do you
view/ expect to view pictures from a multitude of views? Do you watch
videos of how the garment/ product looks, works, or operate? How
often do the apps you interact with have features such as 3D virtual
models, “try-On” technology?
Informative content
What type of product information do you find most often when using
your app to shop? Do you look for information about retail services
within the app? How do you find out about trend information/ style
advice within the app? Do you see this type of information often in
your shopping apps? Do you look for connections to social media?
How often do you use social media with a shopping app? Do you read
customer reviews?
Product Promotion Tell me about a time when you used a sales promotion or when a sales
promotion was offered to you while shopping. When shopping within
an app how often are you exposed to coupon, incentives, rewards, or
discounts? Do you ever see competitions for grand prizes within your
mobile app? Do you share social promotions during your shopping
within the mobile app via social media?
Consumer Led
Interactions
Within the apps you frequent most for shopping, do they recommend
products you like? Tell me how you feel about that. Does the app
allow you to tailor the settings to find the product you’re looking for
better? What about augmented reality…does any of the apps you use
let you try on products on your actual self?
127
APPENDIX D
IRB APPROVAL FOR STIMULI CHECK
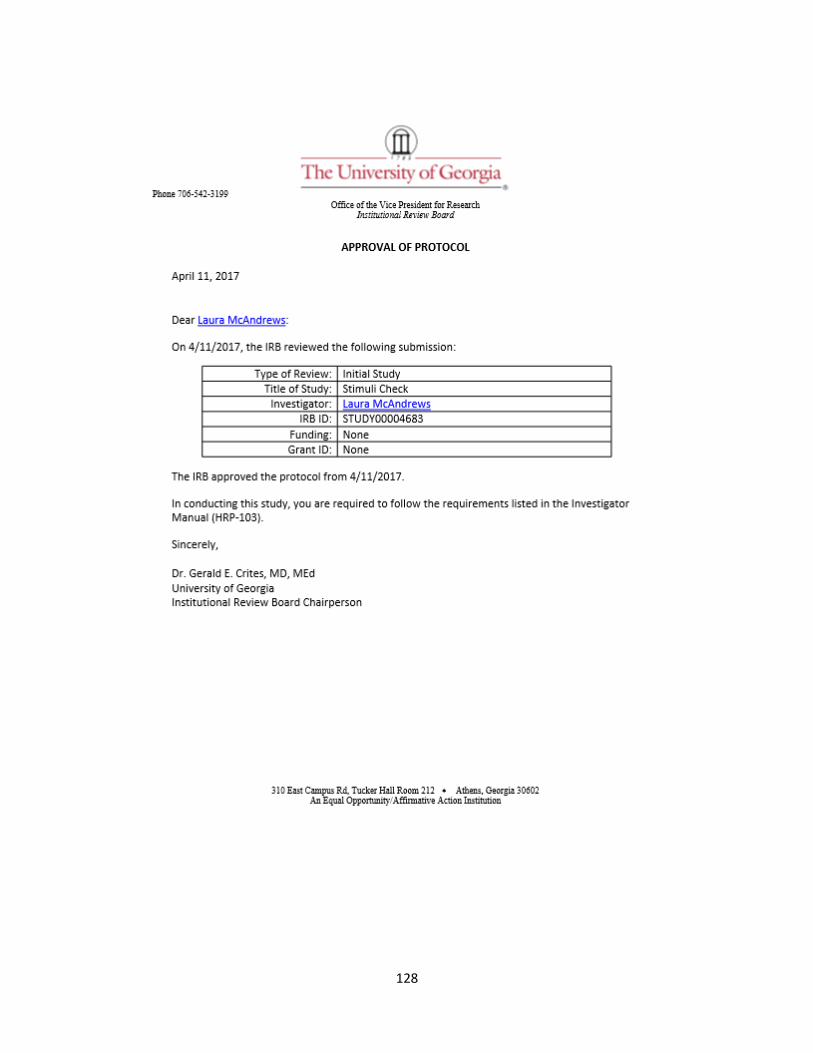
128

129
APPENDIX E
IRB APPROVAL FOR SOR EXPERIMENT
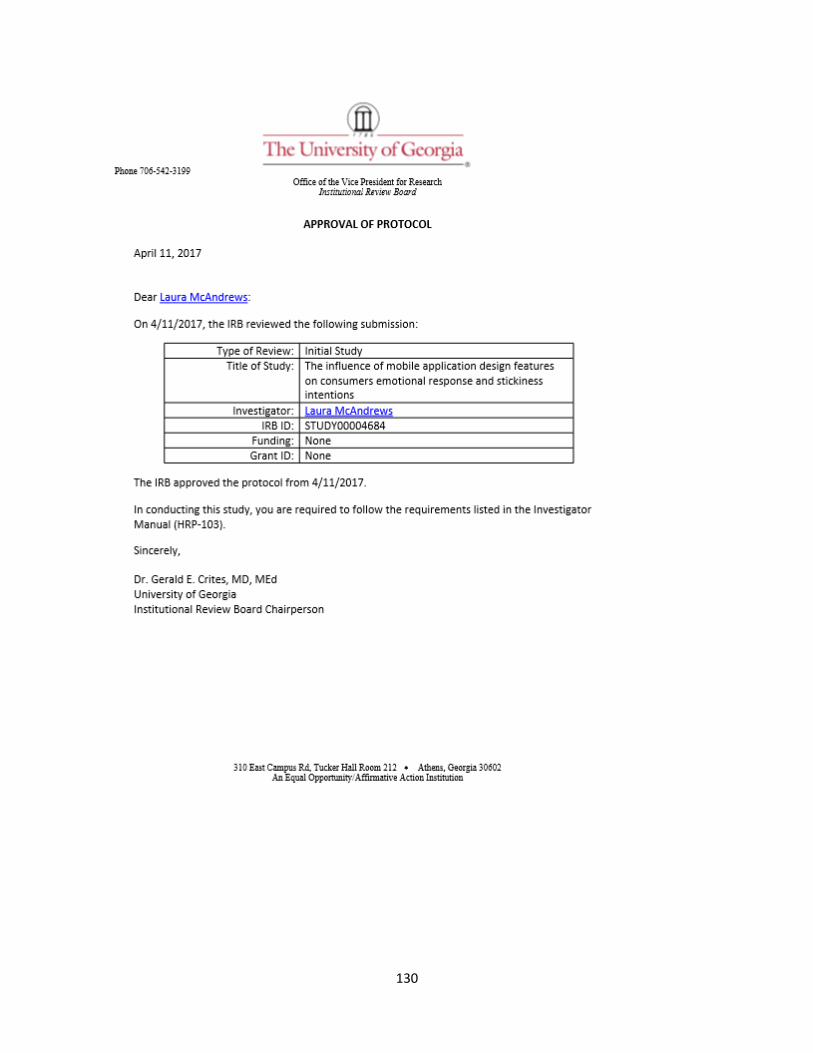
130
131
APPENDIX F
SURVEY INSTRUMENTS
132
SURVERY FOR HEDONIC EXPERIENCE
Before looking at the following mobile screens, please read the following scenarios,
taking about two minutes to really get into the mood of the situation.
You are on your way to New York City for the weekend, but your fight has been delayed
yet again. You suddenly find yourself with a bunch of down time and begin to get a little bored.
You decide to shop online through some of your favorite mobile apps to pass the time.
The following images show the way a product is displayed on a typical retail app. Please
note that you will not be able to interact with the image through linking to other pages, swiping
left or right, etc. Upon visual inspection of the app's page, please answer the questions following
each image.
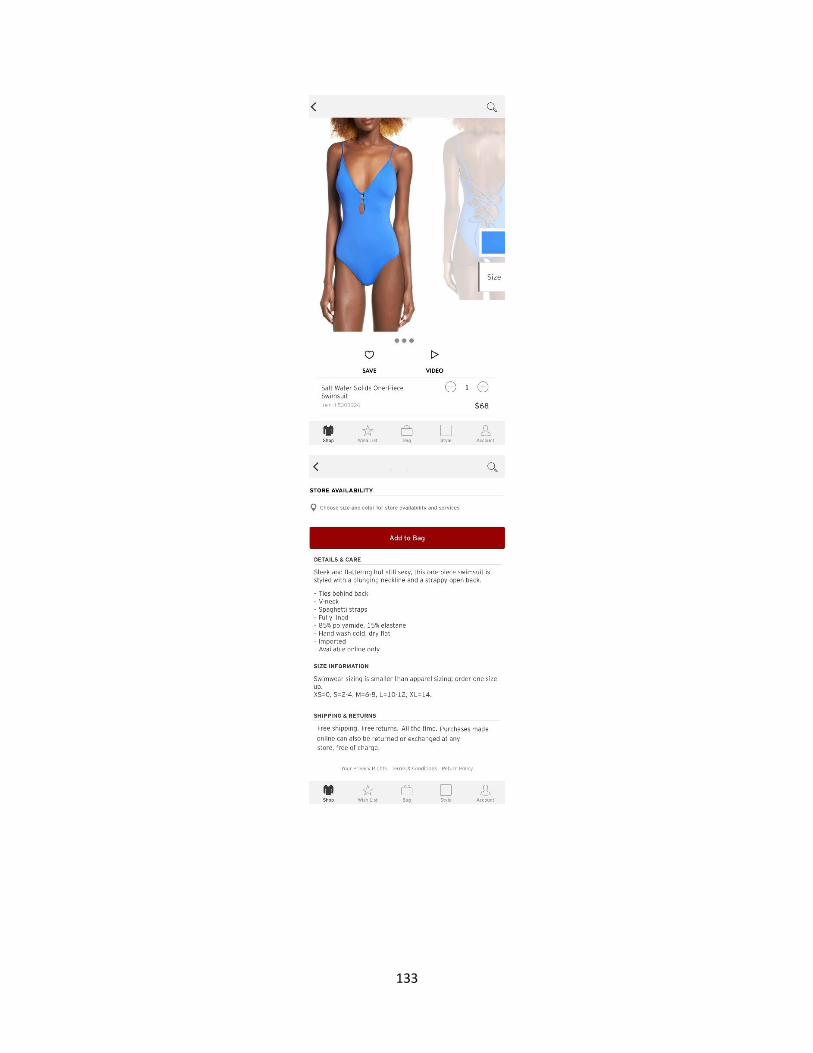
133

134
Rate your feelings in the situation with the adjective pairs below. Some of the pairs
might seem unusual, but you’ll probably feel more one way than the other. So, for each pair,
mark the circle close to the adjective which you believe to describe your feelings better. The
more appropriate that adjective seems, the closer you put your mark.
After viewing this app, I felt:
Unhappy
○
○
○
○
○
○
Happy
○
Annoyed
○
○
○
○
○
○
Pleased
○
Unsatisfied
○
○
○
○
○
○
Satisfied
○
Despairing
○
○
○
○
○
○
Hopeful
○
Melancholic
○
○
○
○
○
○
Contented
○
Bored
○
○
○
○
○
○
Relax
○
Relaxed
○
○
○
○
○
○
Stimulated
○
Calm
○
○
○
○
○
○
Excited
○
Unaroused
○
○
○
○
○
○
Aroused
○
Sleepy
○
○
○
○
○
○
Wide-
Awake
○
Sluggish
○
○
○
○
○
○
Frenzied
○
Dull
○
○
○
○
○
○
Jittery
Controlled
○
○
○
○
○
Controlling
Influenced
○
○
○
○
○
Influential
Cared for
○
○
○
○
○
In control
Awed
○
○
○
○
○
Important
Submissive
○
○
○
○
○
Dominant
Guided
○
○
○
○
○
○
Autonomous
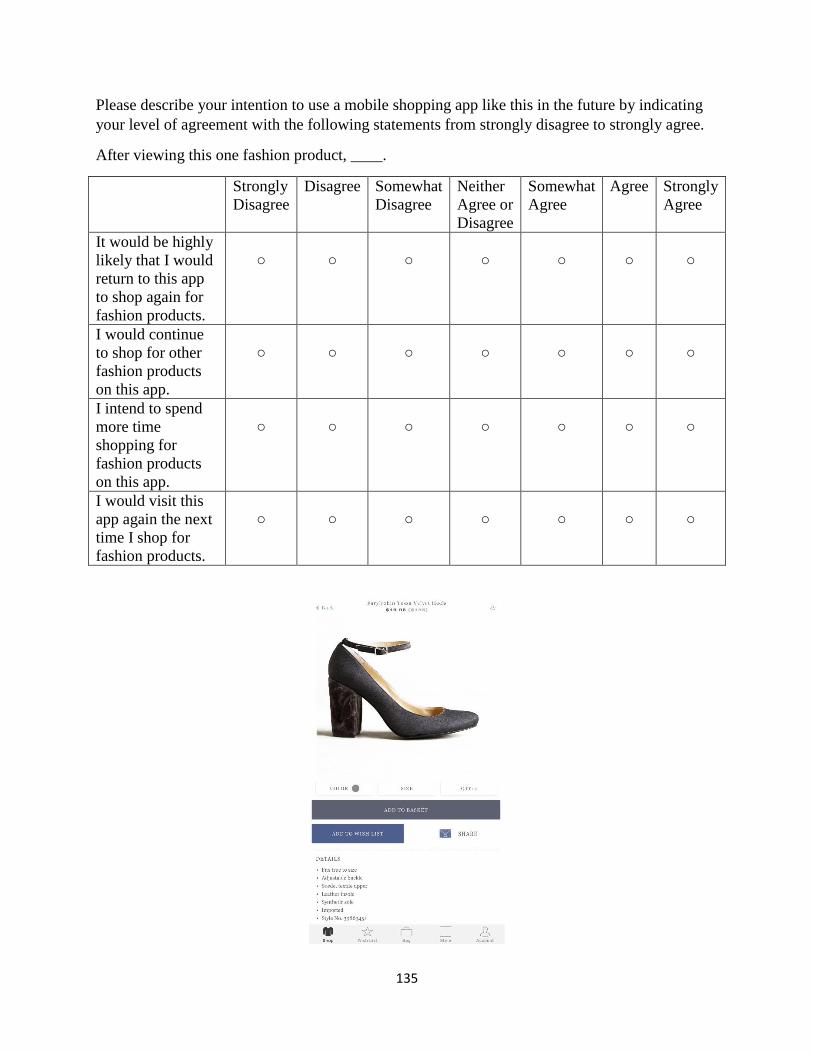
135
Please describe your intention to use a mobile shopping app like this in the future by indicating
your level of agreement with the following statements from strongly disagree to strongly agree.
After viewing this one fashion product, ____.
Strongly
Disagree
Disagree Somewhat
Disagree
Neither
Agree or
Disagree
Somewhat
Agree
Agree Strongly
Agree
It would be highly
likely that I would
return to this app
to shop again for
fashion products.
○
○
○
○
○
○
○
I would continue
to shop for other
fashion products
on this app.
○
○
○
○
○
○
○
I intend to spend
more time
shopping for
fashion products
on this app.
○
○
○
○
○
○
○
I would visit this
app again the next
time I shop for
fashion products.
○
○
○
○
○
○
○
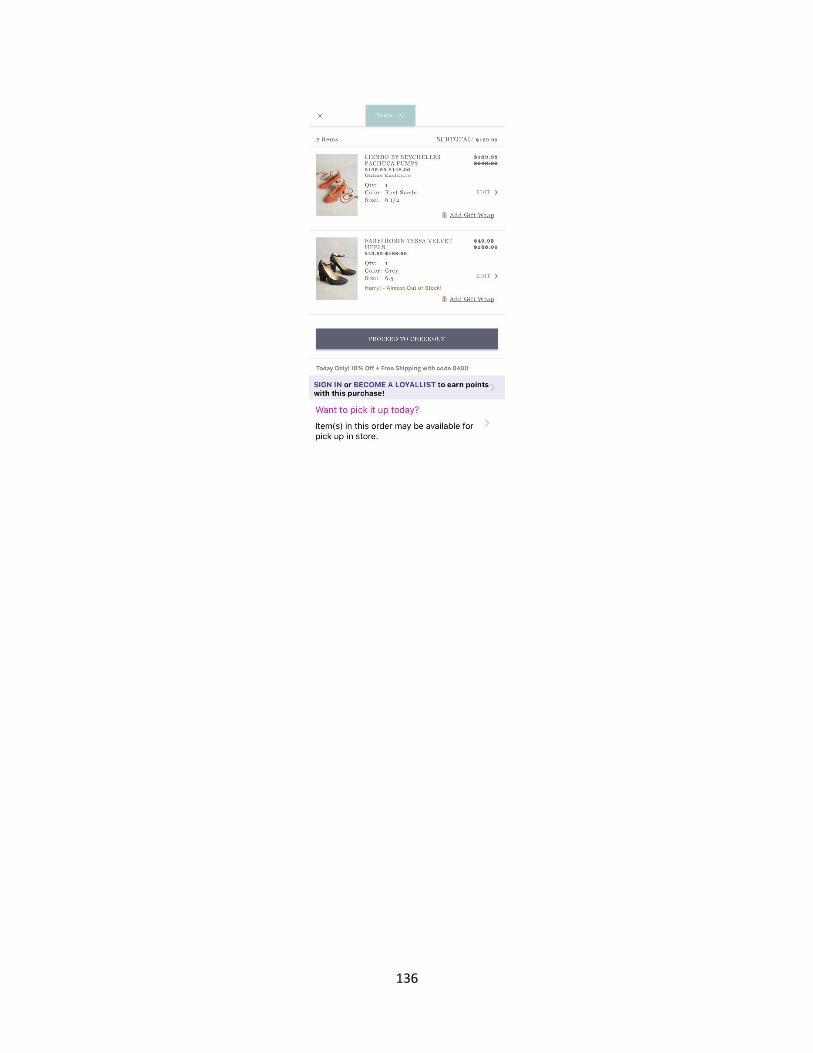
136

137
Rate your feelings in the situation with the adjective pairs below. Some of the pairs
might seem unusual, but you’ll probably feel more one way than the other. So, for each pair,
mark the circle close to the adjective which you believe to describe your feelings better. The
more appropriate that adjective seems, the closer you put your mark.
After viewing this app, I felt:
Unhappy
○
○
○
○
○
○
Happy
○
Annoyed
○
○
○
○
○
○
Pleased
○
Unsatisfied
○
○
○
○
○
○
Satisfied
○
Despairing
○
○
○
○
○
○
Hopeful
○
Melancholic
○
○
○
○
○
○
Contented
○
Bored
○
○
○
○
○
○
Relax
○
Relaxed
○
○
○
○
○
○
Stimulated
○
Calm
○
○
○
○
○
○
Excited
○
Unaroused
○
○
○
○
○
○
Aroused
○
Sleepy
○
○
○
○
○
○
Wide-
Awake
○
Sluggish
○
○
○
○
○
○
Frenzied
○
Dull
○
○
○
○
○
○
Jittery
Controlled
○
○
○
○
○
Controlling
Influenced
○
○
○
○
○
Influential
Cared for
○
○
○
○
○
In control
Awed
○
○
○
○
○
Important
Submissive
○
○
○
○
○
Dominant
Guided
○
○
○
○
○
○
Autonomous
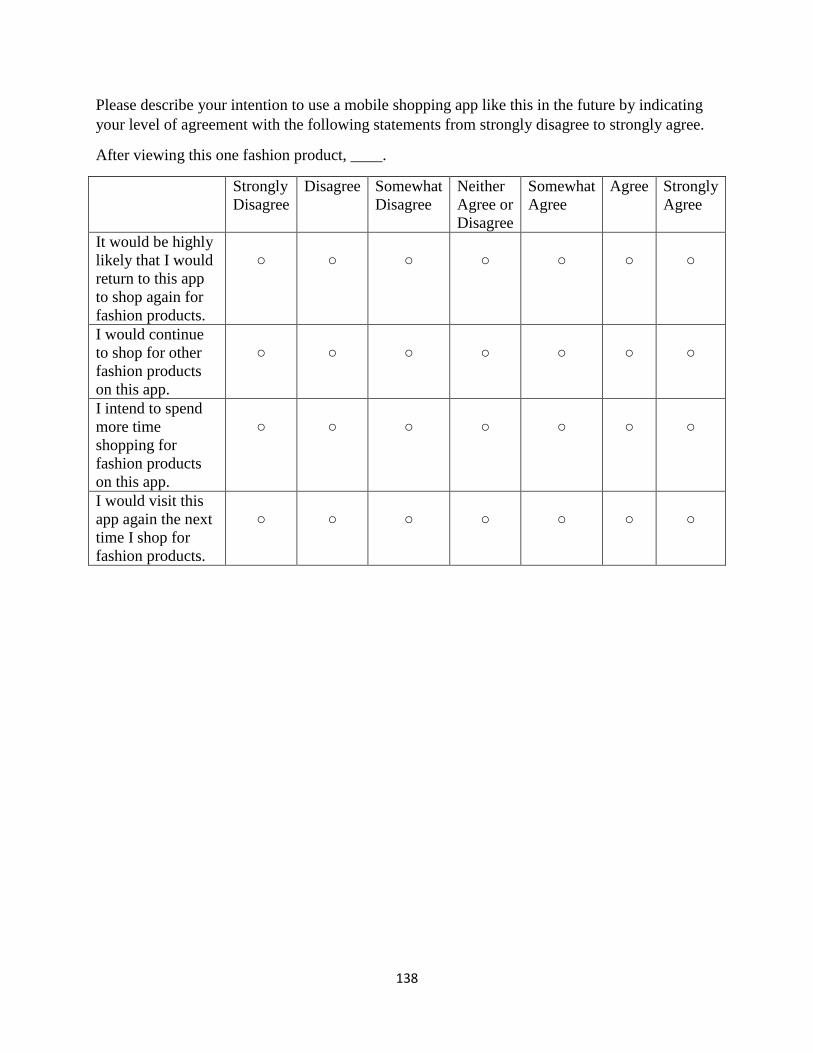
138
Please describe your intention to use a mobile shopping app like this in the future by indicating
your level of agreement with the following statements from strongly disagree to strongly agree.
After viewing this one fashion product, ____.
Strongly
Disagree
Disagree Somewhat
Disagree
Neither
Agree or
Disagree
Somewhat
Agree
Agree Strongly
Agree
It would be highly
likely that I would
return to this app
to shop again for
fashion products.
○
○
○
○
○
○
○
I would continue
to shop for other
fashion products
on this app.
○
○
○
○
○
○
○
I intend to spend
more time
shopping for
fashion products
on this app.
○
○
○
○
○
○
○
I would visit this
app again the next
time I shop for
fashion products.
○
○
○
○
○
○
○
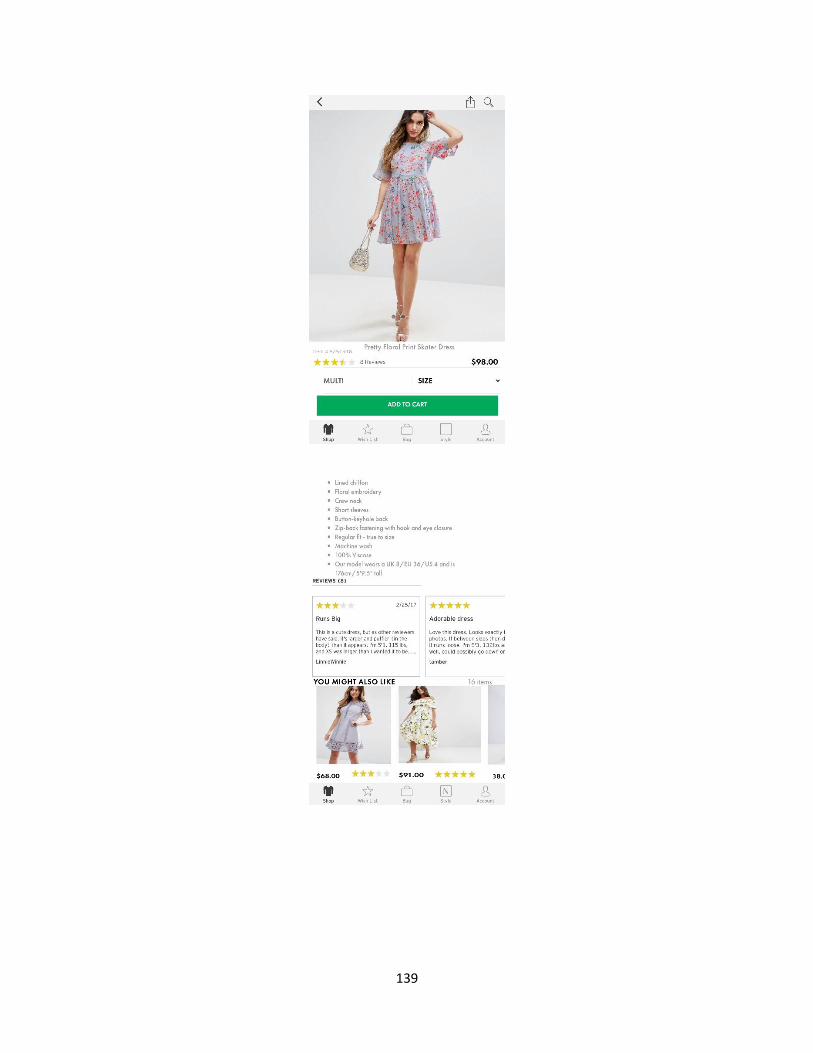
139

140
Rate your feelings in the situation with the adjective pairs below. Some of the pairs
might seem unusual, but you’ll probably feel more one way than the other. So, for each pair,
mark the circle close to the adjective which you believe to describe your feelings better. The
more appropriate that adjective seems, the closer you put your mark.
After viewing this app, I felt:
Unhappy
○
○
○
○
○
○
Happy
○
Annoyed
○
○
○
○
○
○
Pleased
○
Unsatisfied
○
○
○
○
○
○
Satisfied
○
Despairing
○
○
○
○
○
○
Hopeful
○
Melancholic
○
○
○
○
○
○
Contented
○
Bored
○
○
○
○
○
○
Relax
○
Relaxed
○
○
○
○
○
○
Stimulated
○
Calm
○
○
○
○
○
○
Excited
○
Unaroused
○
○
○
○
○
○
Aroused
○
Sleepy
○
○
○
○
○
○
Wide-
Awake
○
Sluggish
○
○
○
○
○
○
Frenzied
○
Dull
○
○
○
○
○
○
Jittery
Controlled
○
○
○
○
○
Controlling
Influenced
○
○
○
○
○
Influential
Cared for
○
○
○
○
○
In control
Awed
○
○
○
○
○
Important
Submissive
○
○
○
○
○
Dominant
Guided
○
○
○
○
○
○
Autonomous
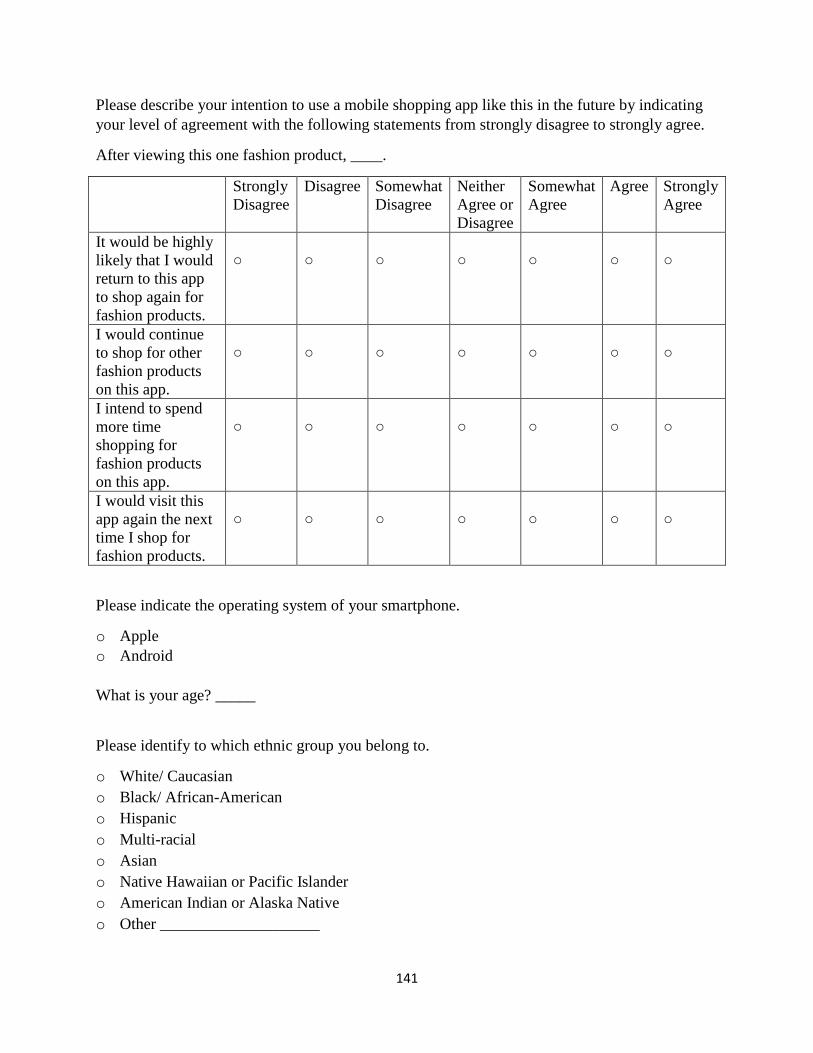
141
Please describe your intention to use a mobile shopping app like this in the future by indicating
your level of agreement with the following statements from strongly disagree to strongly agree.
After viewing this one fashion product, ____.
Strongly
Disagree
Disagree Somewhat
Disagree
Neither
Agree or
Disagree
Somewhat
Agree
Agree Strongly
Agree
It would be highly
likely that I would
return to this app
to shop again for
fashion products.
○
○
○
○
○
○
○
I would continue
to shop for other
fashion products
on this app.
○
○
○
○
○
○
○
I intend to spend
more time
shopping for
fashion products
on this app.
○
○
○
○
○
○
○
I would visit this
app again the next
time I shop for
fashion products.
○
○
○
○
○
○
○
Please indicate the operating system of your smartphone.
o Apple
o Android
What is your age? _____
Please identify to which ethnic group you belong to.
o White/ Caucasian
o Black/ African-American
o Hispanic
o Multi-racial
o Asian
o Native Hawaiian or Pacific Islander
o American Indian or Alaska Native
o Other ____________________

142
Please indicate your highest level of education completed.
o Less than high school
o High school graduate
o Some college/ currently enrolled
o 2-year degree
o 4-year degree
o Professional degree
o Doctorate
Please indicate your annual household income.
o Less than $10,000
o $10,000-$19,999
o $20,000- $29,999
o $30,000-$39,999
o $40,000-$49,000
o $50,000- $59,999
o $60,000-$69,999
o $70,000-$79,999
o $80,000- $89,999
o $90,000- $99,999
o $100,000- $149,999
o More than $150,000
143
SURVERY FOR UTILITARIAN EXPERIENCE
Before looking at the following mobile screens, please read the following scenarios,
taking about two minutes to really get into the mood of the situation.
One of your longtime friends is getting married in Key West this June. The wedding
weekend is full of events before the actual wedding itself on Saturday night. After looking at
your closet and the weather for that weekend, you realize you need a dress to wear for the formal
event. In addition, you could really use a new pair of sandals and some jeans for going out at
night.
The following images show the way a product is displayed on a typical retail app. Please
note that you will not be able to interact with the image through linking to other pages, swiping
left or right, etc. Upon visual inspection of the app's page, please answer the questions following
each image.
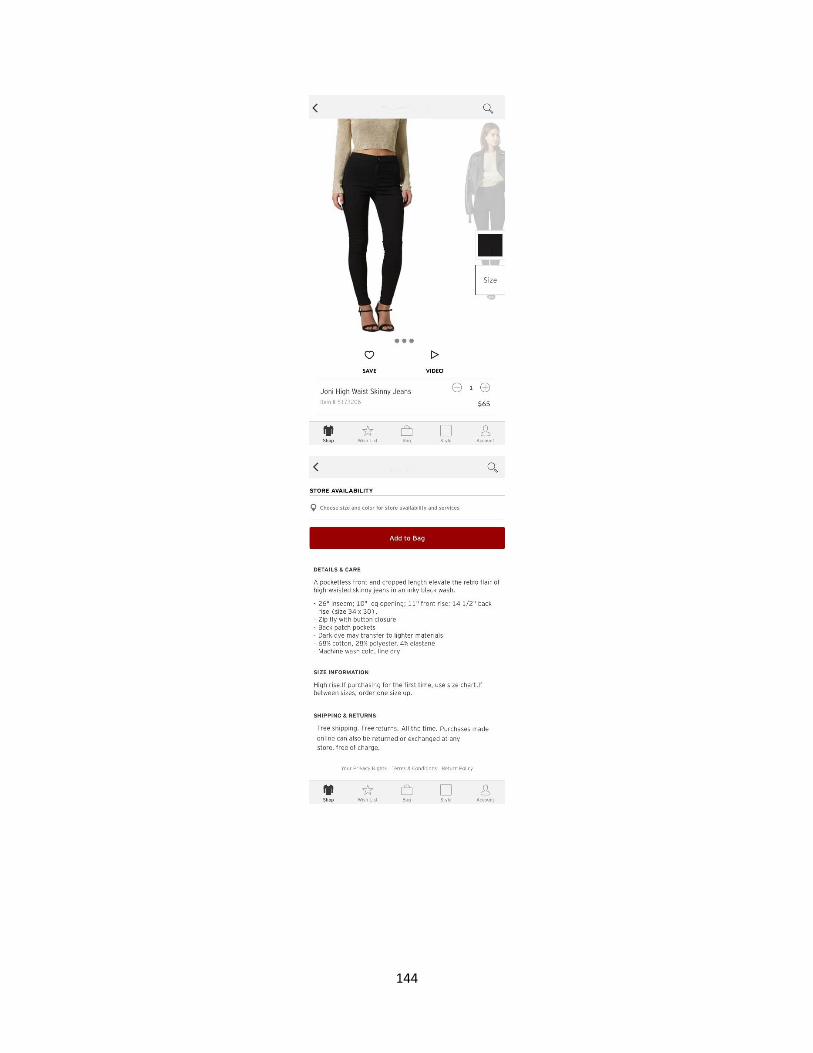
144

145
Rate your feelings in the situation with the adjective pairs below. Some of the pairs
might seem unusual, but you’ll probably feel more one way than the other. So, for each pair,
mark the circle close to the adjective which you believe to describe your feelings better. The
more appropriate that adjective seems, the closer you put your mark.
After viewing this app, I felt:
Unhappy
○
○
○
○
○
○
Happy
○
Annoyed
○
○
○
○
○
○
Pleased
○
Unsatisfied
○
○
○
○
○
○
Satisfied
○
Despairing
○
○
○
○
○
○
Hopeful
○
Melancholic
○
○
○
○
○
○
Contented
○
Bored
○
○
○
○
○
○
Relax
○
Relaxed
○
○
○
○
○
○
Stimulated
○
Calm
○
○
○
○
○
○
Excited
○
Unaroused
○
○
○
○
○
○
Aroused
○
Sleepy
○
○
○
○
○
○
Wide-
Awake
○
Sluggish
○
○
○
○
○
○
Frenzied
○
Dull
○
○
○
○
○
○
Jittery
Controlled
○
○
○
○
○
Controlling
Influenced
○
○
○
○
○
Influential
Cared for
○
○
○
○
○
In control
Awed
○
○
○
○
○
Important
Submissive
○
○
○
○
○
Dominant
Guided
○
○
○
○
○
○
Autonomous
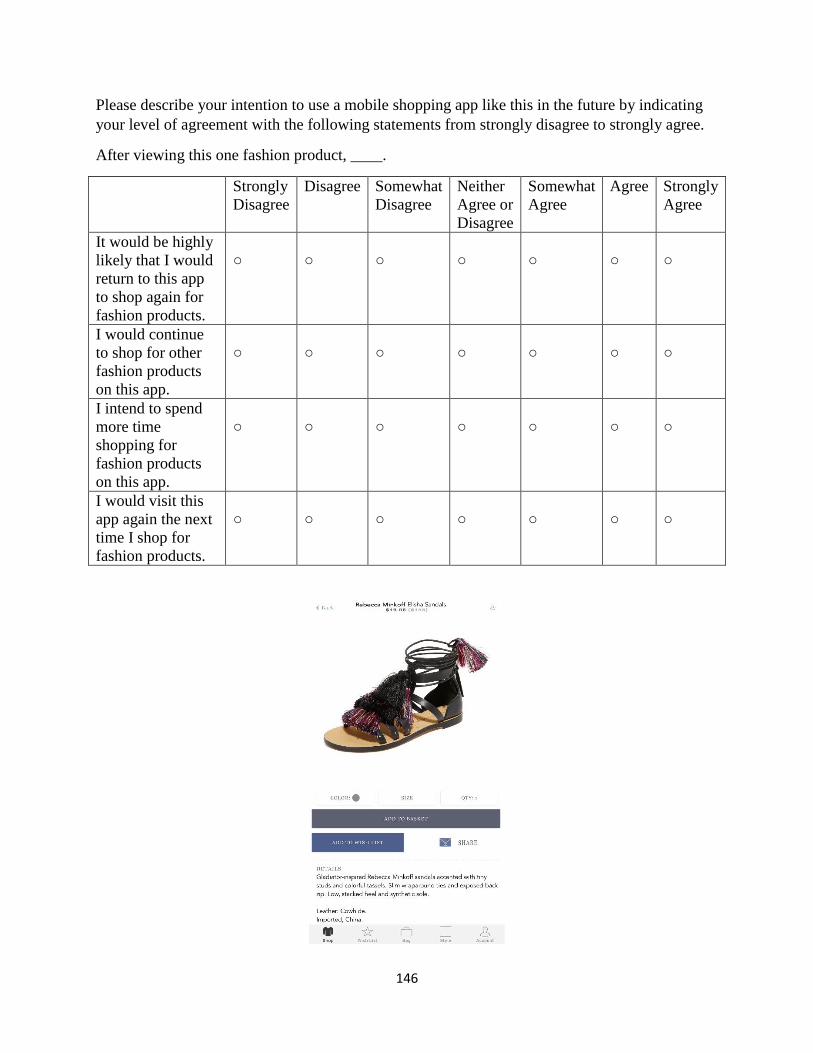
146
Please describe your intention to use a mobile shopping app like this in the future by indicating
your level of agreement with the following statements from strongly disagree to strongly agree.
After viewing this one fashion product, ____.
Strongly
Disagree
Disagree Somewhat
Disagree
Neither
Agree or
Disagree
Somewhat
Agree
Agree Strongly
Agree
It would be highly
likely that I would
return to this app
to shop again for
fashion products.
○
○
○
○
○
○
○
I would continue
to shop for other
fashion products
on this app.
○
○
○
○
○
○
○
I intend to spend
more time
shopping for
fashion products
on this app.
○
○
○
○
○
○
○
I would visit this
app again the next
time I shop for
fashion products.
○
○
○
○
○
○
○
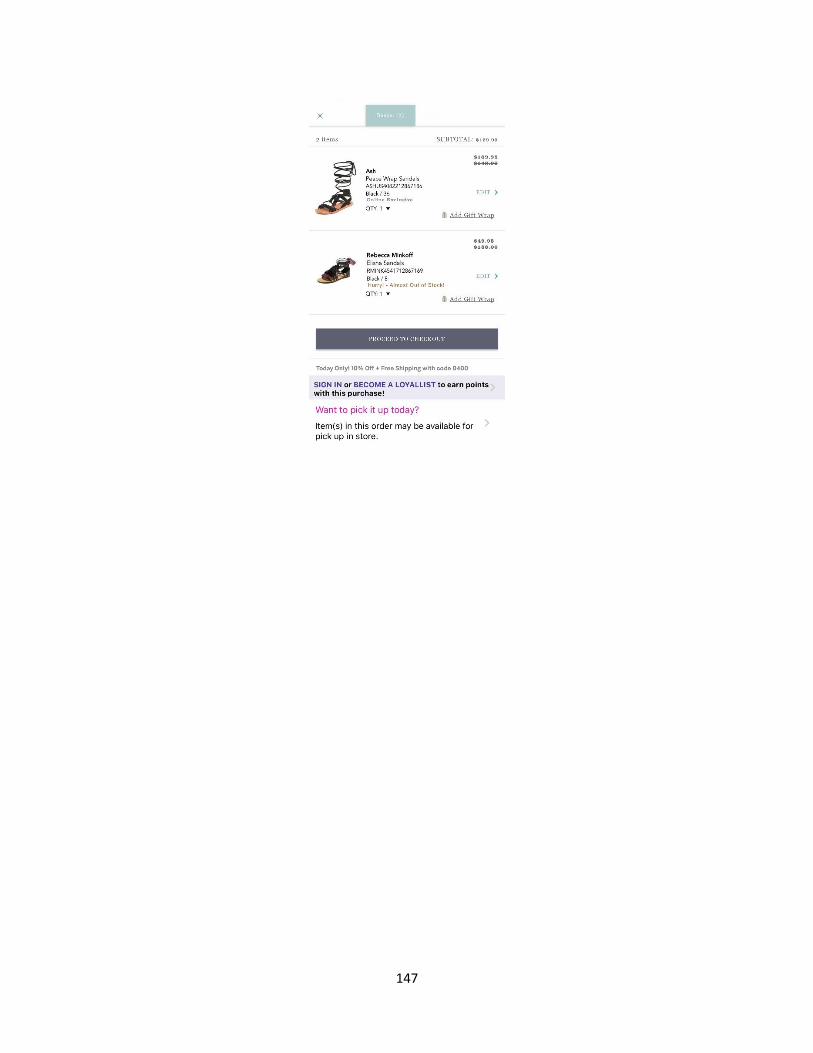
147

148
Rate your feelings in the situation with the adjective pairs below. Some of the pairs
might seem unusual, but you’ll probably feel more one way than the other. So, for each pair,
mark the circle close to the adjective which you believe to describe your feelings better. The
more appropriate that adjective seems, the closer you put your mark.
After viewing this app, I felt:
Unhappy
○
○
○
○
○
○
Happy
○
Annoyed
○
○
○
○
○
○
Pleased
○
Unsatisfied
○
○
○
○
○
○
Satisfied
○
Despairing
○
○
○
○
○
○
Hopeful
○
Melancholic
○
○
○
○
○
○
Contented
○
Bored
○
○
○
○
○
○
Relax
○
Relaxed
○
○
○
○
○
○
Stimulated
○
Calm
○
○
○
○
○
○
Excited
○
Unaroused
○
○
○
○
○
○
Aroused
○
Sleepy
○
○
○
○
○
○
Wide-
Awake
○
Sluggish
○
○
○
○
○
○
Frenzied
○
Dull
○
○
○
○
○
○
Jittery
Controlled
○
○
○
○
○
Controlling
Influenced
○
○
○
○
○
Influential
Cared for
○
○
○
○
○
In control
Awed
○
○
○
○
○
Important
Submissive
○
○
○
○
○
Dominant
Guided
○
○
○
○
○
○
Autonomous
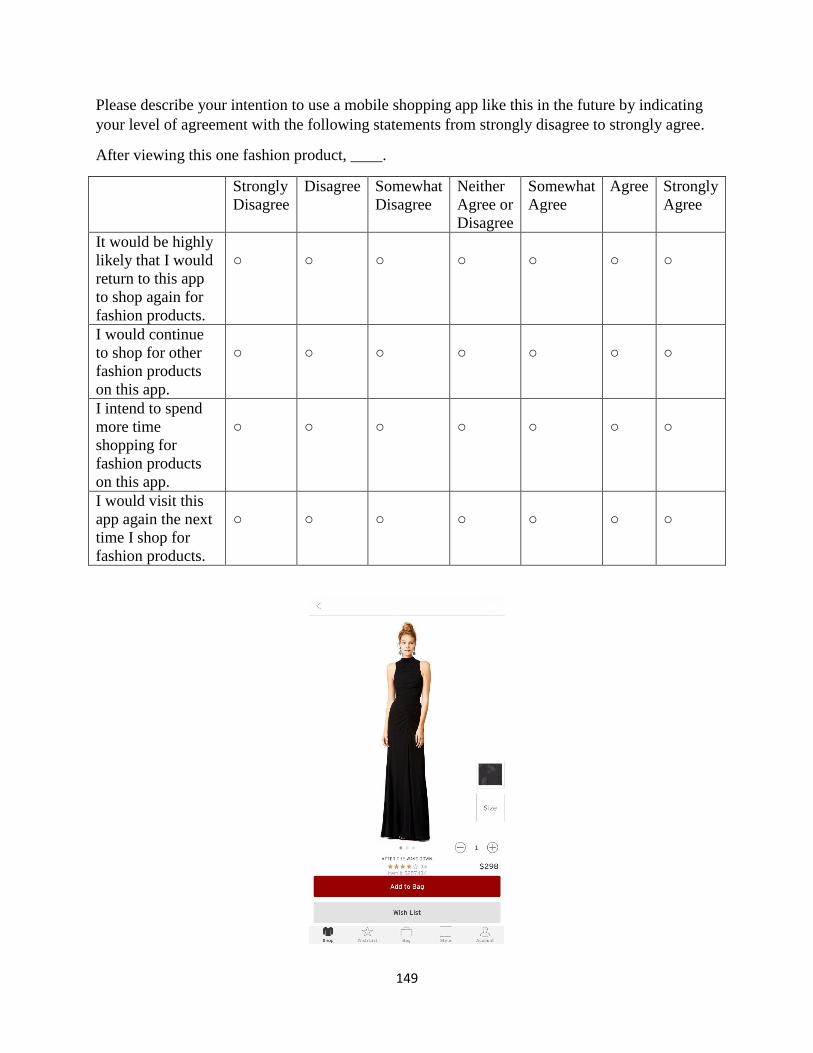
149
Please describe your intention to use a mobile shopping app like this in the future by indicating
your level of agreement with the following statements from strongly disagree to strongly agree.
After viewing this one fashion product, ____.
Strongly
Disagree
Disagree Somewhat
Disagree
Neither
Agree or
Disagree
Somewhat
Agree
Agree Strongly
Agree
It would be highly
likely that I would
return to this app
to shop again for
fashion products.
○
○
○
○
○
○
○
I would continue
to shop for other
fashion products
on this app.
○
○
○
○
○
○
○
I intend to spend
more time
shopping for
fashion products
on this app.
○
○
○
○
○
○
○
I would visit this
app again the next
time I shop for
fashion products.
○
○
○
○
○
○
○
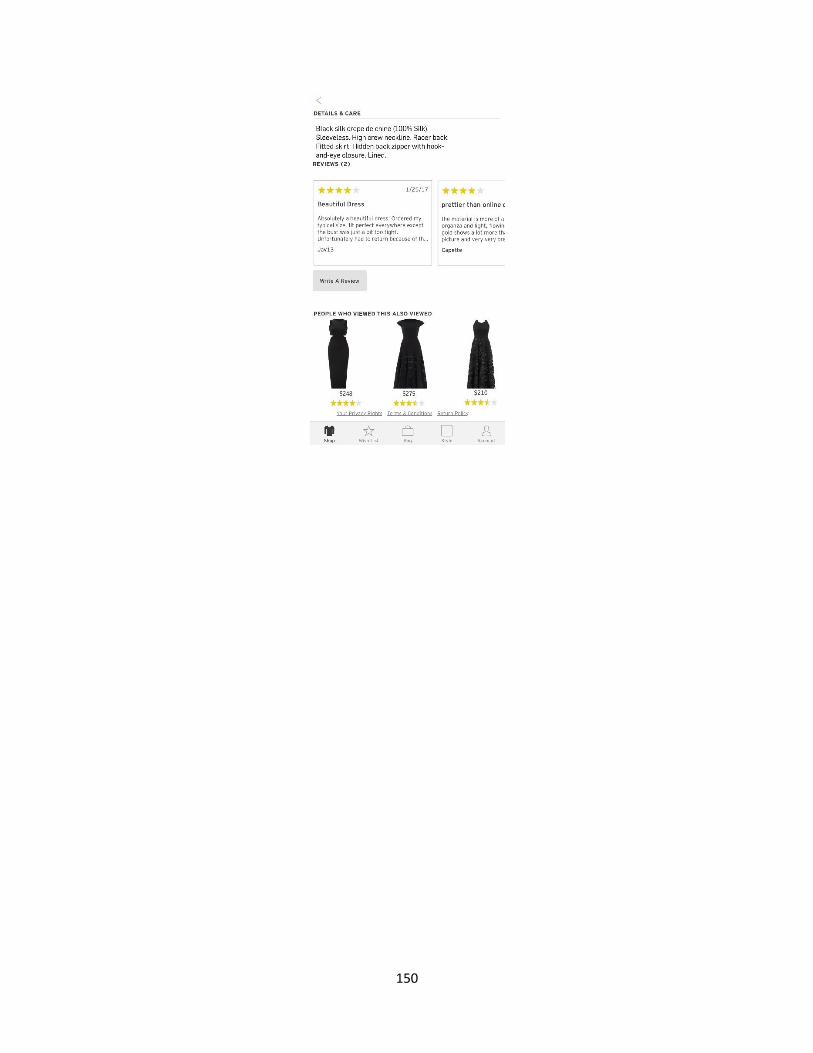
150
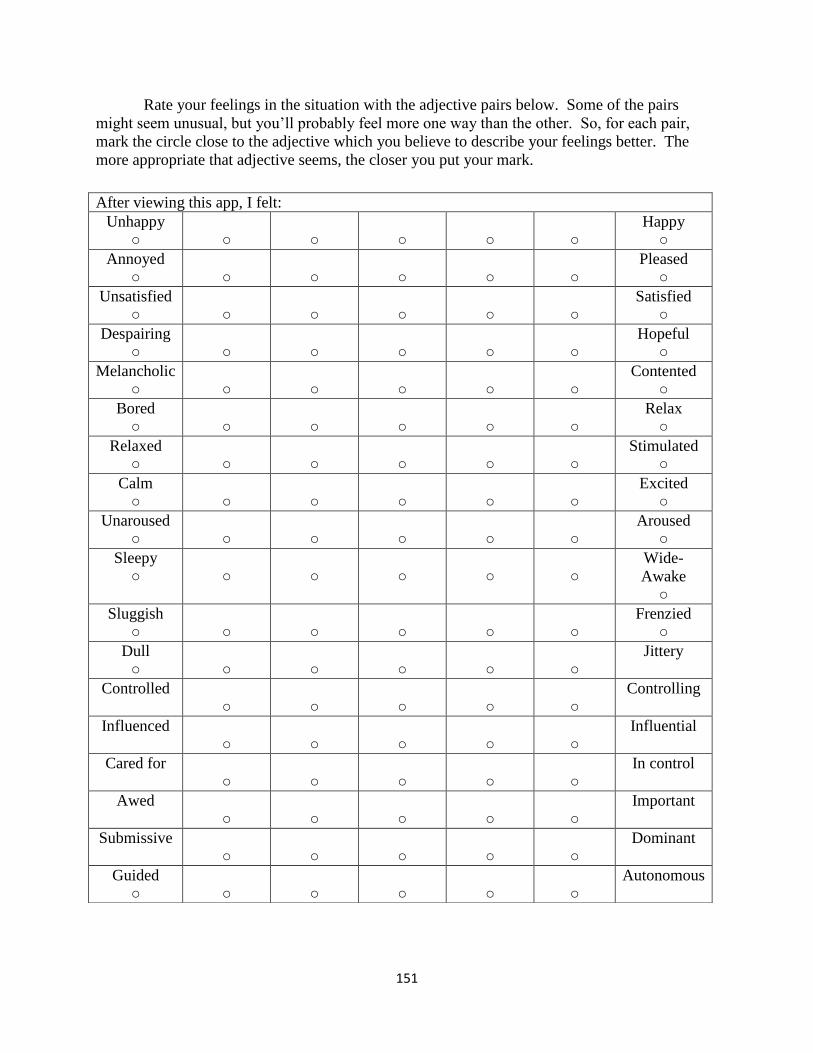
151
Rate your feelings in the situation with the adjective pairs below. Some of the pairs
might seem unusual, but you’ll probably feel more one way than the other. So, for each pair,
mark the circle close to the adjective which you believe to describe your feelings better. The
more appropriate that adjective seems, the closer you put your mark.
After viewing this app, I felt:
Unhappy
○
○
○
○
○
○
Happy
○
Annoyed
○
○
○
○
○
○
Pleased
○
Unsatisfied
○
○
○
○
○
○
Satisfied
○
Despairing
○
○
○
○
○
○
Hopeful
○
Melancholic
○
○
○
○
○
○
Contented
○
Bored
○
○
○
○
○
○
Relax
○
Relaxed
○
○
○
○
○
○
Stimulated
○
Calm
○
○
○
○
○
○
Excited
○
Unaroused
○
○
○
○
○
○
Aroused
○
Sleepy
○
○
○
○
○
○
Wide-
Awake
○
Sluggish
○
○
○
○
○
○
Frenzied
○
Dull
○
○
○
○
○
○
Jittery
Controlled
○
○
○
○
○
Controlling
Influenced
○
○
○
○
○
Influential
Cared for
○
○
○
○
○
In control
Awed
○
○
○
○
○
Important
Submissive
○
○
○
○
○
Dominant
Guided
○
○
○
○
○
○
Autonomous

152
Please describe your intention to use a mobile shopping app like this in the future by indicating
your level of agreement with the following statements from strongly disagree to strongly agree.
After viewing this one fashion product, ____.
Strongly
Disagree
Disagree Somewhat
Disagree
Neither
Agree or
Disagree
Somewhat
Agree
Agree Strongly
Agree
It would be highly
likely that I would
return to this app
to shop again for
fashion products.
○
○
○
○
○
○
○
I would continue
to shop for other
fashion products
on this app.
○
○
○
○
○
○
○
I intend to spend
more time
shopping for
fashion products
on this app.
○
○
○
○
○
○
○
I would visit this
app again the next
time I shop for
fashion products.
○
○
○
○
○
○
○
Please indicate the operating system of your smartphone.
o Apple
o Android
What is your age? _____
Please identify to which ethnic group you belong to.
o White/ Caucasian
o Black/ African-American
o Hispanic
o Multi-racial
o Asian
o Native Hawaiian or Pacific Islander
o American Indian or Alaska Native
o Other ____________________
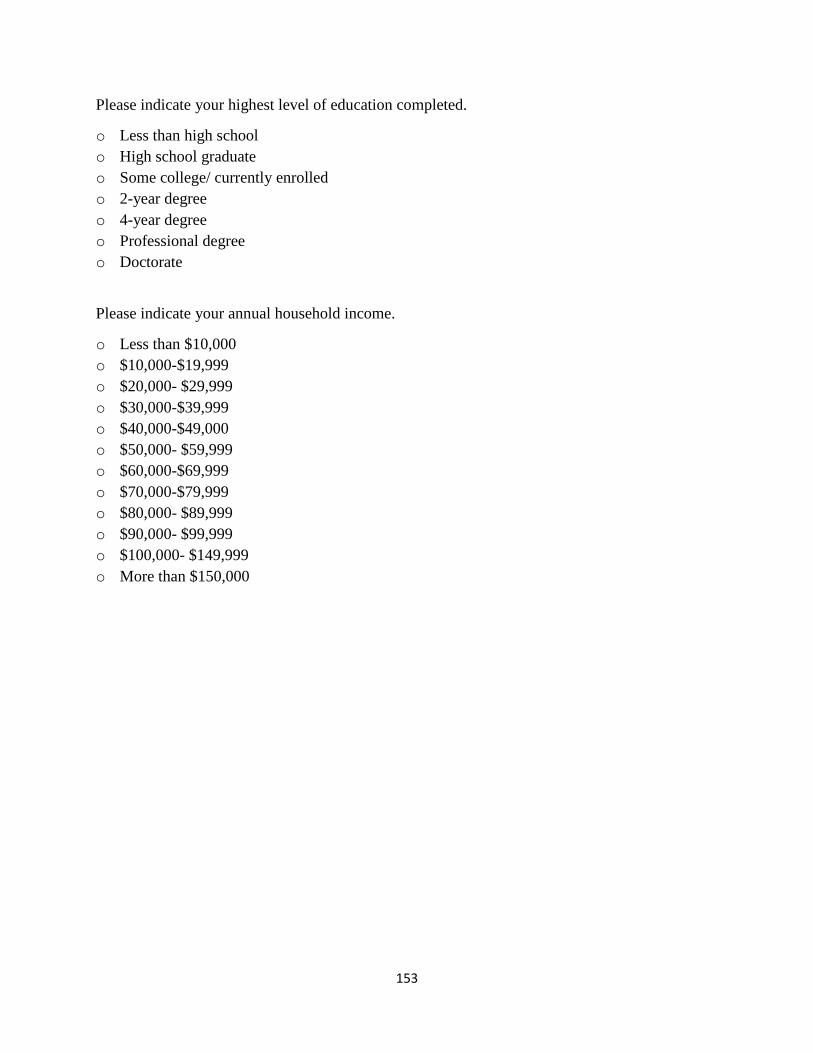
153
Please indicate your highest level of education completed.
o Less than high school
o High school graduate
o Some college/ currently enrolled
o 2-year degree
o 4-year degree
o Professional degree
o Doctorate
Please indicate your annual household income.
o Less than $10,000
o $10,000-$19,999
o $20,000- $29,999
o $30,000-$39,999
o $40,000-$49,000
o $50,000- $59,999
o $60,000-$69,999
o $70,000-$79,999
o $80,000- $89,999
o $90,000- $99,999
o $100,000- $149,999
o More than $150,000