Embed Size (px)
Citation preview

The influence of monetary and fiscal policy on aggregate demand
(Chapter 35 in Mankiw and Taylor)

Effects of fiscal and monetary policy
• Already analysed long run effects
– Seen how fiscal policy affects saving, investment and long-run economic growth (via the market for loanable funds)
•Cf. your practice essay and effects of budget deficits
– Seen how monetary policy affects, via the money supply, prices in the long run (the quantity theory, monetary neutrality and the classical dichotomy)
•Prices adjust to equilibrate money demand & supply

Short run effects
• We will now use our AD-AS model to consider the short run effects of fiscal and monetary policy
• We will see how they influence the position of the AD curve, and thereby affect short run economic fluctuations
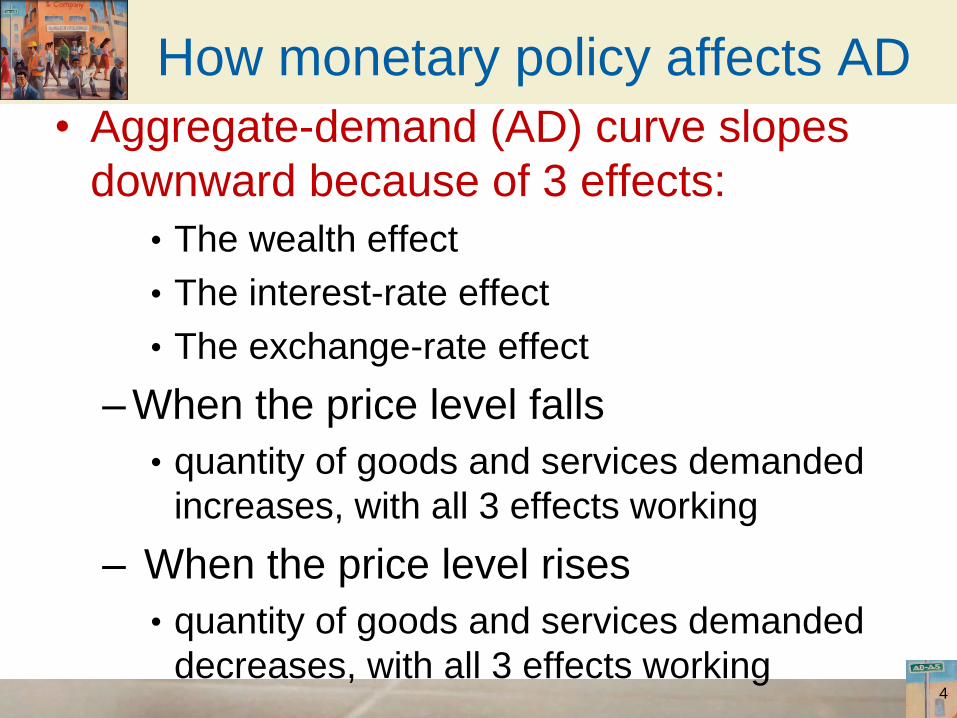
How monetary policy affects AD
• Aggregate-demand (AD) curve slopes
downward because of 3 effects:
• The wealth effect
• The interest-rate effect
• The exchange-rate effect
– When the price level falls
• quantity of goods and services demanded
increases, with all 3 effects working
– When the price level rises
• quantity of goods and services demanded
decreases, with all 3 effects working
4
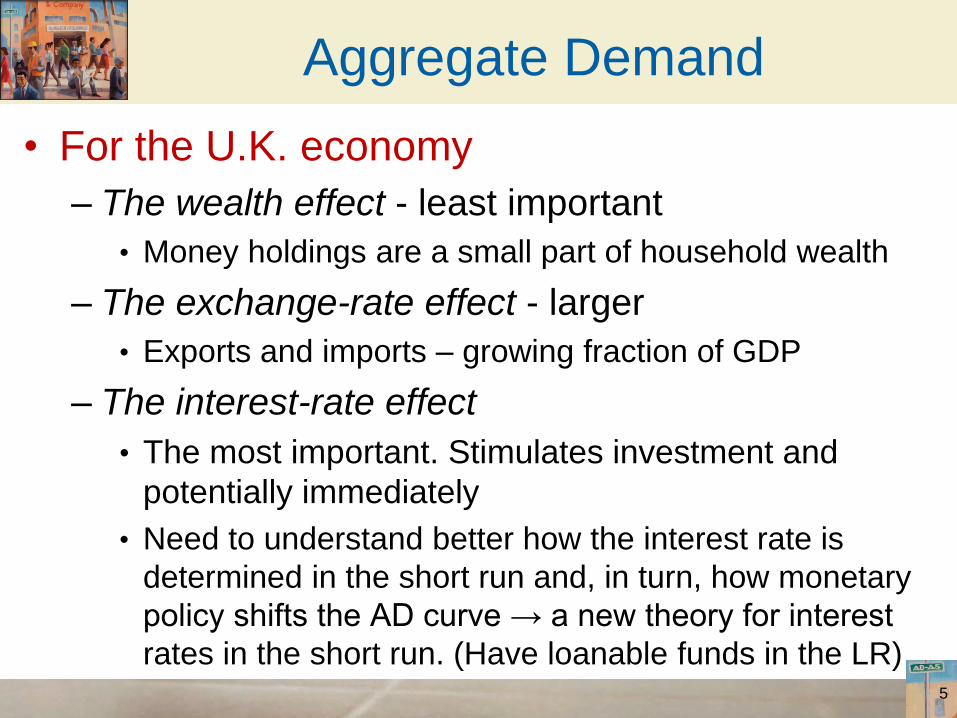
Aggregate Demand
• For the U.K. economy
– The wealth effect - least important
• Money holdings are a small part of household wealth
– The exchange-rate effect - larger
• Exports and imports – growing fraction of GDP
– The interest-rate effect
• The most important. Stimulates investment and
potentially immediately
• Need to understand better how the interest rate is
determined in the short run and, in turn, how monetary
policy shifts the AD curve → a new theory for interest
rates in the short run. (Have loanable funds in the LR) 5

The theory of liquidity preference
• Keynes’ 1936 theory
– Interest rate adjusts:
• To bring money supply and money demand
into balance
– As in IS-LM analysis (i.e., money supply and
demand underlie the LM curve)
– Explains both the nominal interest rate
and the real interest rate since
• Assumption: expected rate of inflation is
constant, as assumed in short run analysis
6

Demand and Supply of Money
• Money supply
– Controlled by the Central Bank
– Quantity of money supplied
• Fixed by Central Bank policy
• Doesn’t vary with the interest rate
– Central Bank alters the money supply
• By changing the quantity of reserves in the
banking system via the
– Purchase and sale of government bonds in open-
market operations
7
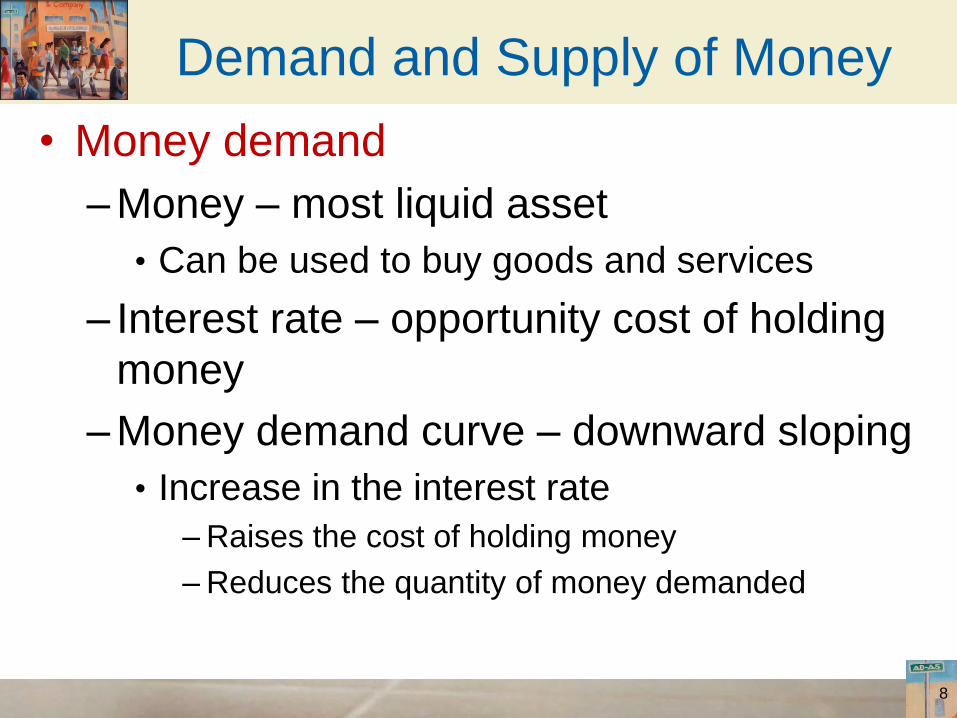
Demand and Supply of Money
• Money demand
– Money – most liquid asset
• Can be used to buy goods and services
– Interest rate – opportunity cost of holding
money
– Money demand curve – downward sloping
• Increase in the interest rate
– Raises the cost of holding money
– Reduces the quantity of money demanded
8

Demand and Supply of Money
• Equilibrium in the money market
– Interest rate adjusts to balance the supply
and demand for money
• Equilibrium interest rate
• Quantity of money demanded exactly
balances the quantity of money supplied
9

Demand and Supply of Money
• If interest rate > equilibrium
– Quantity of money people want to hold
• Less than quantity supplied
– People holding the surplus
• Buy interest-bearing assets
– Lowers the interest rate
– People - more willing to hold money
– Until: equilibrium
10
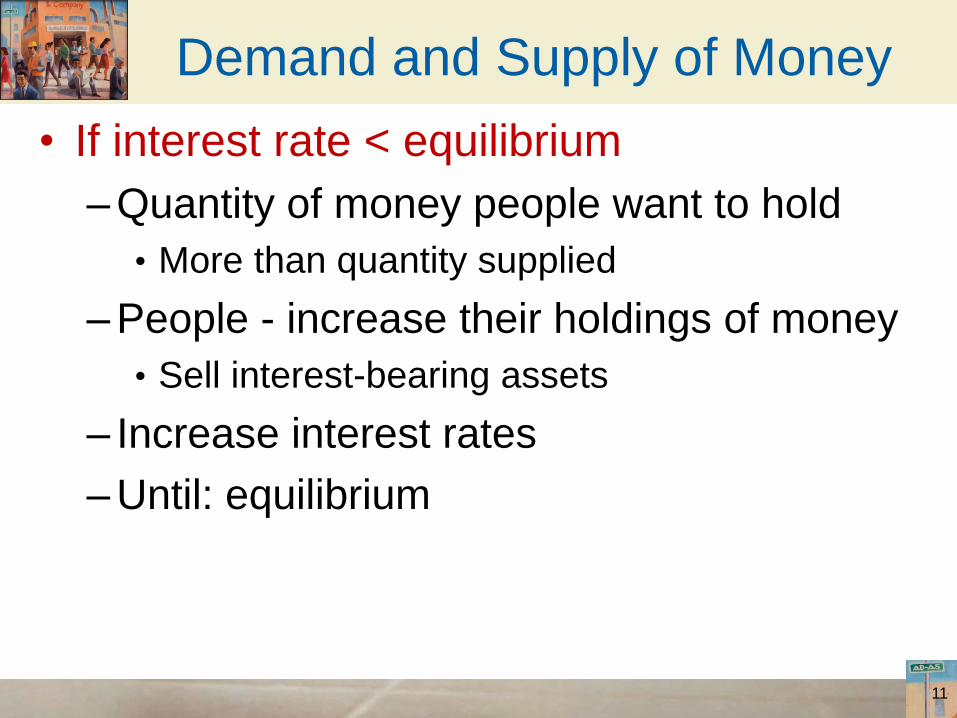
Demand and Supply of Money
• If interest rate < equilibrium
– Quantity of money people want to hold
• More than quantity supplied
– People - increase their holdings of money
• Sell interest-bearing assets
– Increase interest rates
– Until: equilibrium
11
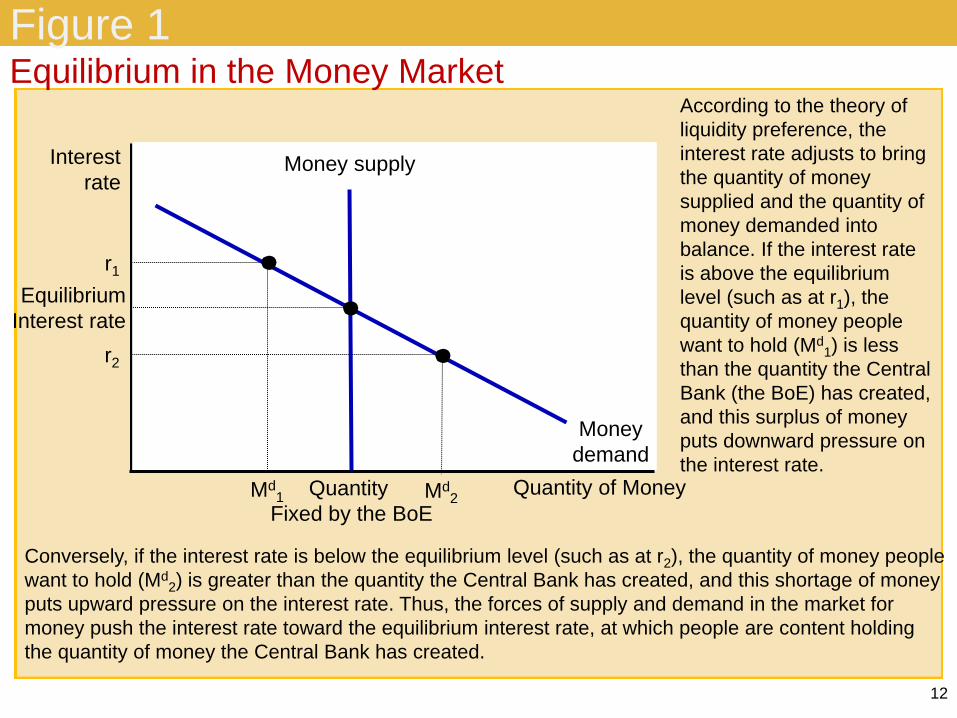
Figure 1
12
Equilibrium in the Money Market
Interest
rate
Quantity of Money
r1
Money
demand
Md1
Conversely, if the interest rate is below the equilibrium level (such as at r2), the quantity of money people
want to hold (Md2) is greater than the quantity the Central Bank has created, and this shortage of money
puts upward pressure on the interest rate. Thus, the forces of supply and demand in the market for
money push the interest rate toward the equilibrium interest rate, at which people are content holding
the quantity of money the Central Bank has created.
r2
Md2
Money supply
Quantity
Fixed by the BoE
Equilibrium
Interest rate
According to the theory of
liquidity preference, the
interest rate adjusts to bring
the quantity of money
supplied and the quantity of
money demanded into
balance. If the interest rate
is above the equilibrium
level (such as at r1), the
quantity of money people
want to hold (Md1) is less
than the quantity the Central
Bank (the BoE) has created,
and this surplus of money
puts downward pressure on
the interest rate.
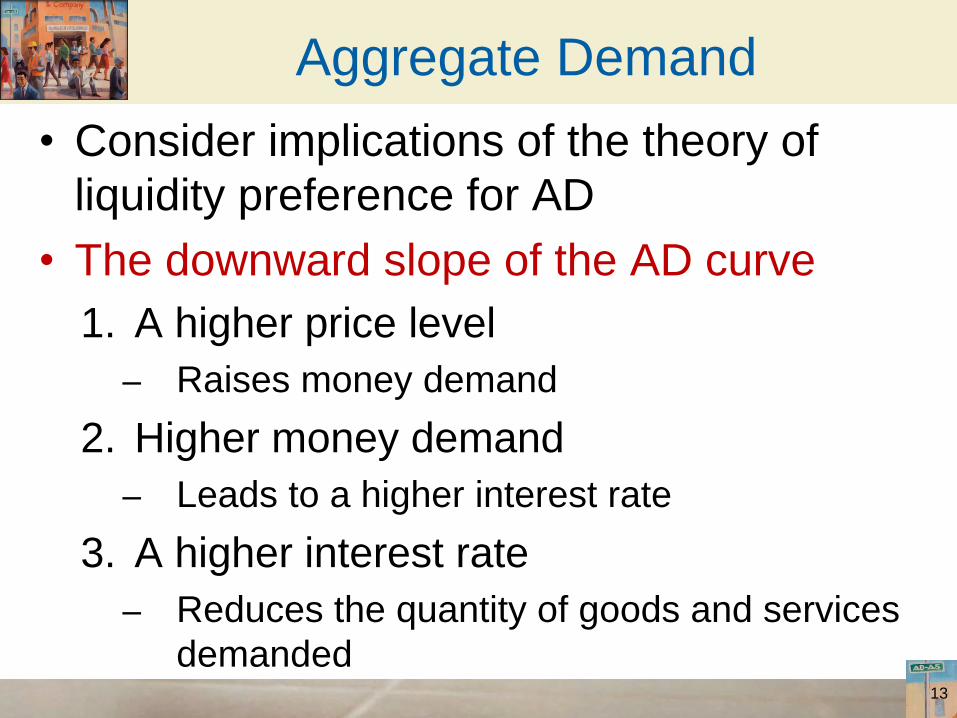
Aggregate Demand
• Consider implications of the theory of
liquidity preference for AD
• The downward slope of the AD curve
1. A higher price level
– Raises money demand
2. Higher money demand
– Leads to a higher interest rate
3. A higher interest rate
– Reduces the quantity of goods and services
demanded 13

Figure 2
14
The Money Market and the Slope of the Aggregate-Demand Curve
Interest
rate
An increase in the price level from P1 to P2 shifts the money-demand curve to the right, as in
panel (a). This increase in money demand causes the interest rate to rise from r1 to r2. Because
the interest rate is the cost of borrowing, the increase in the interest rate reduces the quantity of
goods and services demanded from Y1 to Y2. This negative relationship between the price level
and quantity demanded is represented with a downward-sloping aggregate-demand curve, as in
panel (b).
Quantity
of money
0
(a) The Money Market Price
level
Quantity
of output
0
(b) The Aggregate-Demand Curve
Aggregate
demand
P2
Money demand at
price level P1, MD1
Money
supply
Quantity fixed
by the BoE
Money demand at
price level P2, MD2
r2
r1
Y2
P1
Y1
1. An increase in the price level . . . 2. . . . increases the
demand for money . . .
3. . . . which increases
equilibrium interest rate . . .
4. . . . which in turn
reduces the quantity
of goods and
services demanded.
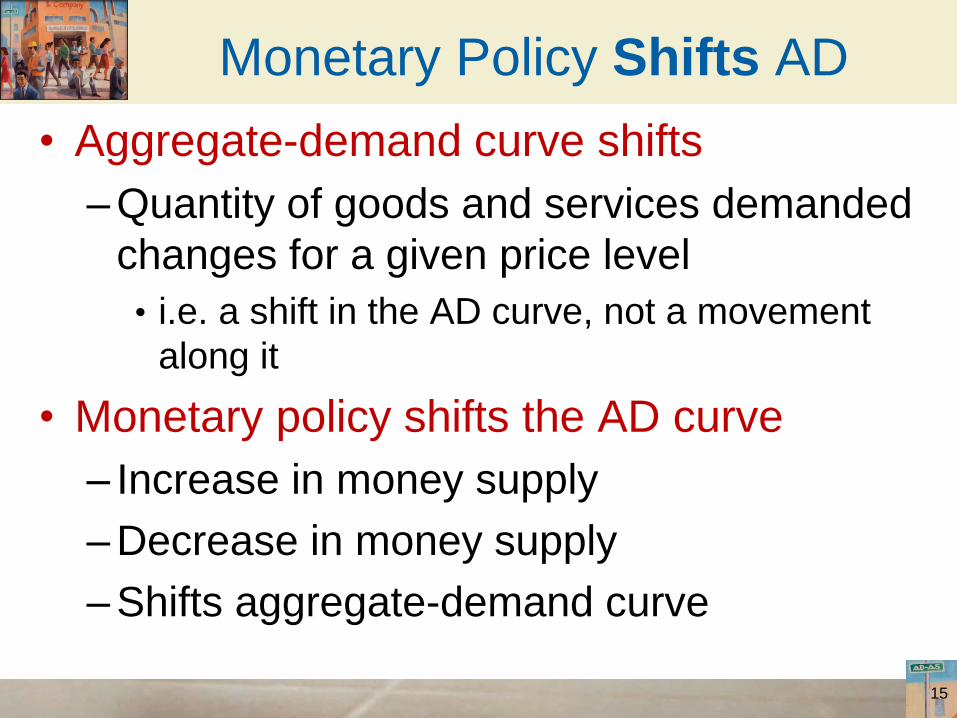
Monetary Policy Shifts AD
• Aggregate-demand curve shifts
– Quantity of goods and services demanded
changes for a given price level
• i.e. a shift in the AD curve, not a movement
along it
• Monetary policy shifts the AD curve
– Increase in money supply
– Decrease in money supply
– Shifts aggregate-demand curve
15
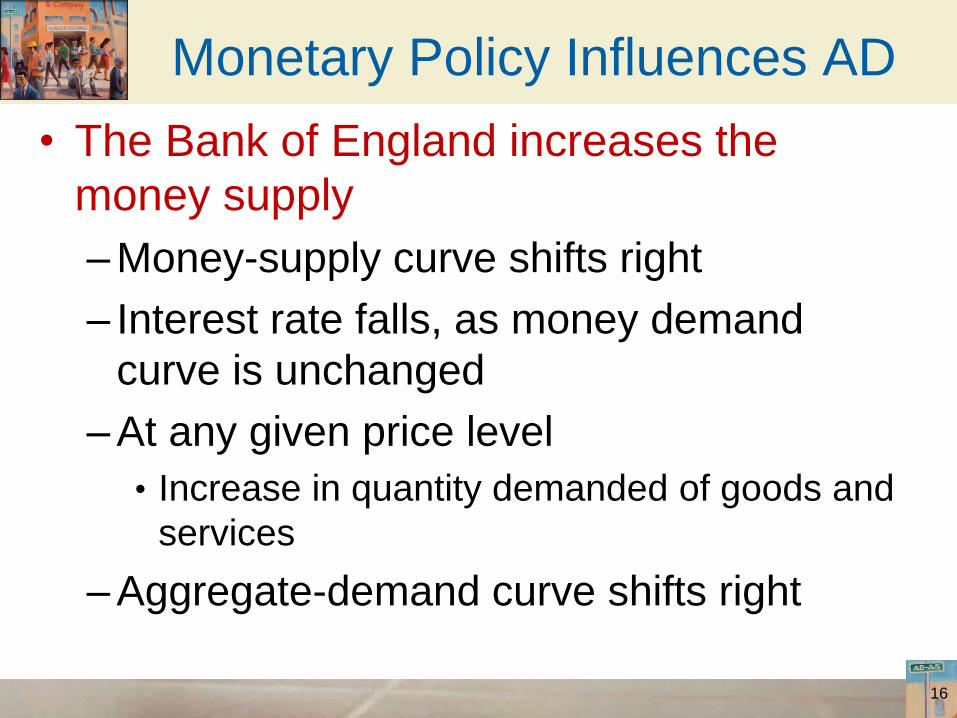
Monetary Policy Influences AD
• The Bank of England increases the
money supply
– Money-supply curve shifts right
– Interest rate falls, as money demand
curve is unchanged
– At any given price level
• Increase in quantity demanded of goods and
services
– Aggregate-demand curve shifts right
16

Figure 3
17
A Monetary Injection Interest
rate
In panel (a), an increase in the money supply from MS1 to MS2 reduces the equilibrium interest
rate from r1 to r2. Because the interest rate is the cost of borrowing, the fall in the interest rate
raises the quantity of goods and services demanded at a given price level from Y1 to Y2. Thus,
in panel (b), the aggregate-demand curve shifts to the right from AD1 to AD2.
Quantity
of money
0
(a) The Money Market Price
level
Quantity of output 0
(b) The Aggregate-Demand Curve
Aggregate
demand, AD1
Money demand
at price level P
Money supply,
MS1
r1
Y1
P
1. When the BoE
increases the
money supply . . .
MS2
r2
AD2
Y2
2. . . . the equilibrium
interest rate falls . . . 3. . . . which increases the quantity of goods
and services demanded at a given price level.
Monetary Policy Influences AD
• The BoE decreases the money supply
– Money-supply curve shifts left
– Interest rate increases
– At any given price level
• Decrease in quantity demanded of goods and
services
– Aggregate-demand curve shifts left
18
The tool of Monetary Policy?
• We have treated the money supply as the BoE’s
policy tool
• In reality the BoE adjusts the Repo rate
– Interest rate banks charge one another for short-term loans
• But the theory of liquidity preference shows us that
monetary policy changes can be affected either by
adjusting the money supply or changing the interest
rate
– In reality, to achieve an interest rate target the central
bank’s bond traders are told to supply enough money
(buy/sell enough bonds in OMOs) to ensure the target is
met
19

Summary
• Changes in monetary policy
– Aimed at expanding aggregate demand
• Increasing the money supply
• Lowering the interest rate
• Changes in monetary policy
– Aimed at contracting aggregate demand
• Decreasing the money supply
• Raising the interest rate
20

Why the Fed Watches the Stock Market
(and Vice Versa)
• Fluctuations in stock prices
– Sign of broader economic developments
– Economic boom of the 1990s
• Rapid GDP growth and falling unemployment
• Rising stock prices (fourfold)
– Deep recession of 2008 and 2009
• Falling stock prices
– From November 2007 to March 2009, the stock
market lost about half its value
21
Why the Fed Watches the Stock Market
(and Vice Versa)
• The Fed
– Not interested in stock prices themselves
– Monitor and respond to developments the
overall economy
• Stock market boom expands the AD
– Households – wealthier
• Stimulates consumer spending
– Firms – want to sell new shares of stock
• Stimulates investment spending
22
Why the Fed Watches the Stock Market
(and Vice Versa)
• The Fed’s goal: stabilise AD
– Greater stability in output and price level
• The Fed’s response to a stock-market
boom
– Keep money supply lower
– Keep interest rates higher
• The Fed’s response to a stock-market fall
– Increase money supply
– Lower interest rates
23
Why the Fed Watches the Stock Market
(and Vice Versa)
• Stock-market participants
– Keep an eye on the Fed
– The Fed can
• Influence interest rates and economic activity
• Alter the value of stocks
• The Fed - raises interest rates
– Less attractive owning stocks
• Bonds - earning a higher return
• Reduced demand for goods and services
24
Fiscal Policy Influences AD
• Government policymakers set the level of
government spending and taxation – We have seen how fiscal policy affects saving, investment
and growth in the long run
– But, in the short run, the main consequence is to shift the
aggregate demand curve
– But whether a £1 increase leads to AD rising by more or
less than £1 depends on the balance of the:
• Multiplier effect
– Amplifies the effect on AD of an increase in autonomous
expenditure
• Crowding-out effect
– Says shift in AD could be smaller than the initial increase
25
Fiscal Policy Influences AD
• The multiplier effect of an increase in
government purchases by £20 billion
– Aggregate-demand curve
• Shifts right by exactly £20 billion
– Consumers respond
• Increase spending
– Aggregate-demand curve
• Shifts right again
26

Figure 4
27
The Multiplier Effect
Price
level
Quantity of
Output
Aggregate demand, AD1
An increase in government purchases of £20 billion can shift the aggregate-demand
curve to the right by more than £20 billion. This multiplier effect arises because
increases in aggregate income stimulate additional spending by consumers.
AD2
AD3
£20 billion
1. An increase in government purchases
of £20 billion initially increases aggregate
demand by £20 billion . . .
2. . . . but the multiplier effect
can amplify the shift in
aggregate demand.
Fiscal Policy Influences AD
• Multiplier effect
– Response of consumer spending
– Response of investment
• Investment accelerator
– Higher government demand
• Higher demand for investment goods
– Positive feedback from demand to
investment
28

Fiscal Policy Influences AD
• Spending multiplier
– Contingent on the marginal propensity to
consume, MPC
• Fraction of extra income that consumers
spend
– A larger MPC
• Larger multiplier
29
Fiscal Policy Influences AD
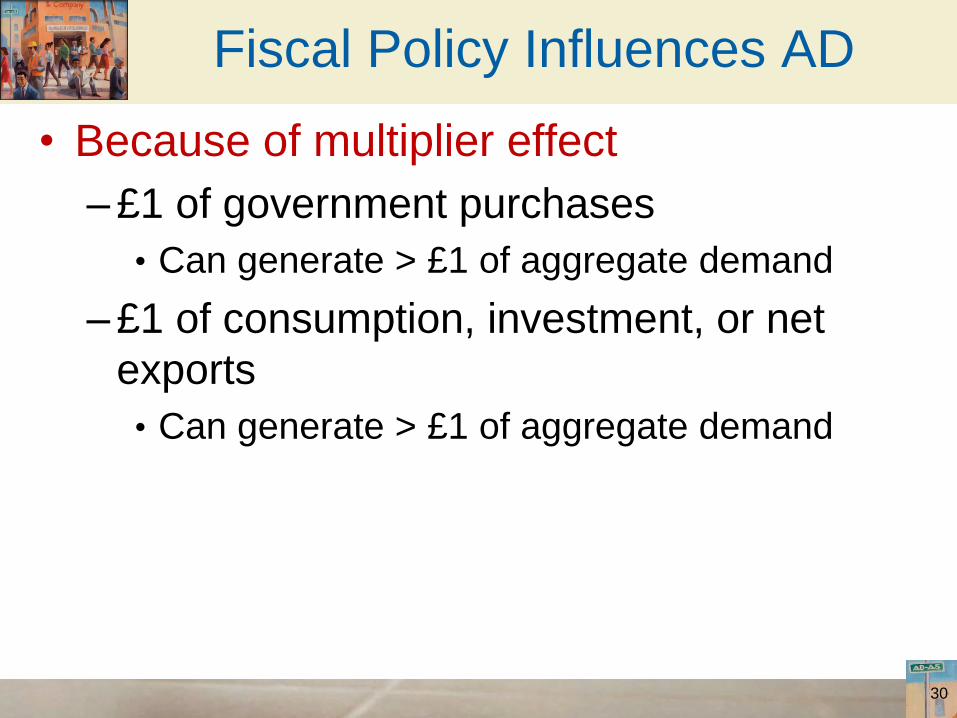
• Because of multiplier effect
– £1 of government purchases
• Can generate > £1 of aggregate demand
– £1 of consumption, investment, or net
exports
• Can generate > £1 of aggregate demand
30

Fiscal Policy Influences AD
• The crowding-out effect
– Offset in aggregate demand
– Results when expansionary fiscal policy
raises the interest rate
– Thereby reduces investment spending
31

Fiscal Policy Influences AD
• The crowding-out effect of an increase in
government spending
– Aggregate demand curve – shifts right
• Increase in income
• Money demand – increases
• Interest rate – increases
– Thereby reducing investment spending
• Aggregate-demand curve shifts back to the
left
32

Exhibit 5
33
The Crowding-Out Effect Interest
rate
Panel (a) shows the money market. When the government increases its purchases of goods and services, the
resulting increase in income raises the demand for money from MD1 to MD2, and this causes the equilibrium
interest rate to rise from r1 to r2. Panel (b) shows the effects on aggregate demand. The initial impact of the
increase in government purchases shifts the aggregate-demand curve from AD1 to AD2. Yet because the interest
rate is the cost of borrowing, the increase in the interest rate tends to reduce the quantity of goods and services
demanded, particularly for investment goods. This crowding out of investment partially offsets the impact of the
fiscal expansion on aggregate demand. In the end, the aggregate-demand curve shifts only to AD3.
Quantity
of money
0
(a) The Money Market
Price
level
Quantity
of output
0
(b) The Aggregate-Demand Curve
Aggregate demand, AD1 Money demand, MD1
Money
supply
Quantity fixed
by the BoE
MD2
r2
r1
1. When an increase in
government purchases
increases aggregate demand…
2. . . . the increase in
spending increases
money demand . . .
3. . . . which increases the
equilibrium interest rate . . .
4. . . which in turn partly offsets the
initial increase in aggregate demand.
AD2
AD3
$20 billion
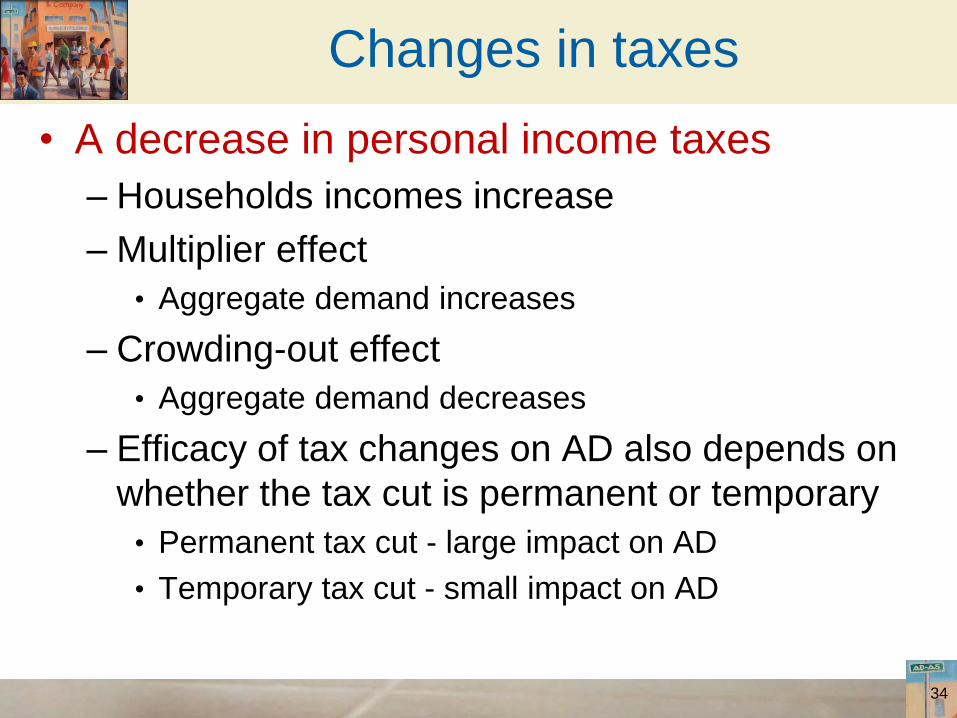
Changes in taxes
• A decrease in personal income taxes
– Households incomes increase
– Multiplier effect
• Aggregate demand increases
– Crowding-out effect
• Aggregate demand decreases
– Efficacy of tax changes on AD also depends on
whether the tax cut is permanent or temporary
• Permanent tax cut - large impact on AD
• Temporary tax cut - small impact on AD
34

Fiscal Policy and AS
• Fiscal policy may also have affects on AS
– “Supply-side economics”
• This is because tax changes affect
incentives
• People may work harder if taxes are
reduced; and so AS curve may shift to the
right
• Extra government expenditure on roads
and schools increases capital stock and
may also shift the AS curve to the right
35

Arguments for and against stabilisation
• The case for active stabilisation policy
– A change in aggregate-demand
• The government
– Use fiscal policy
• The Fed
– Use monetary policy
• To stabilise the economy
– Ensure full-employment and stable inflation
– In the face of shocks to the economy and waves
of optimism and pessimism (animal spirits) which
cause AD to fluctuate in the short run
36

Using Policy for Stabilisation
• Keynes
– Key role of AD in explaining short-run
economic fluctuations
– The government should actively stimulate
aggregate demand
• When AD appeared insufficient to maintain
production at its full-employment level
• A key lesson from the Great Depression is
that AD can be insufficient
37

Using Policy for Stabilisation
• Case against active stabilisation policy
– Government
• Should avoid active use of monetary and fiscal policy to
try to stabilise the economy; as could make matters
worse by intervening…
• Since policy only affects the economy with ‘long and
variable’ lags; and any effects still depend on unknown
elasticities and multipliers etc.
– Given this lag, it is necessary to condition policy on economic
forecasts and these too can be unreliable
– Policy instruments
• Should be set to achieve long-run goals
• The economy – left alone to deal with short-run
fluctuations 38
Using Policy for Stabilisation
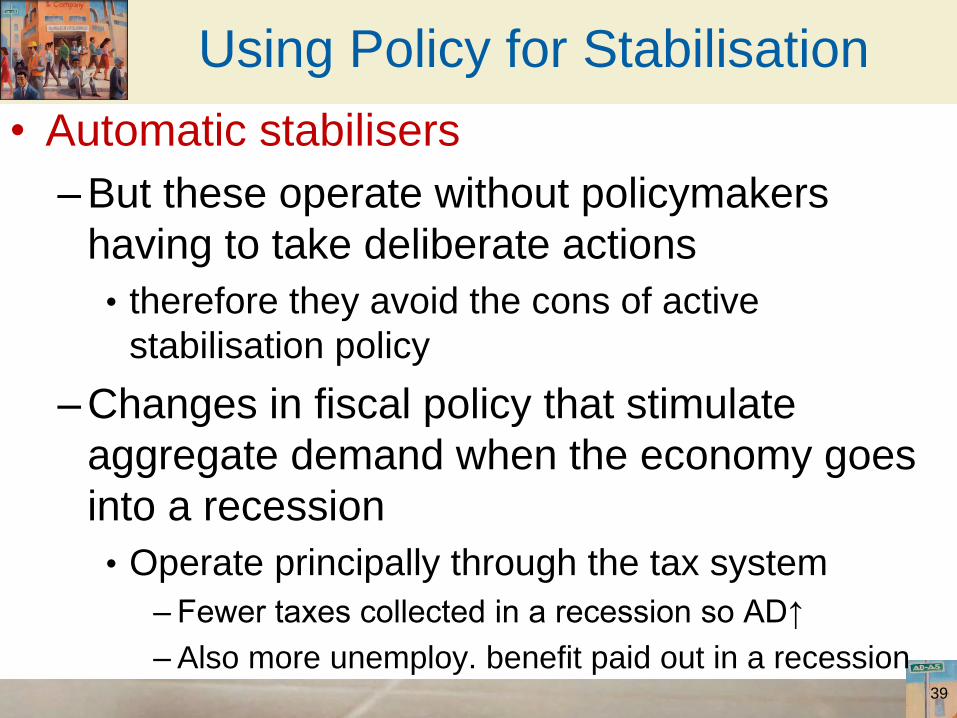
• Automatic stabilisers
– But these operate without policymakers
having to take deliberate actions
• therefore they avoid the cons of active
stabilisation policy
– Changes in fiscal policy that stimulate
aggregate demand when the economy goes
into a recession
• Operate principally through the tax system
– Fewer taxes collected in a recession so AD↑
– Also more unemploy. benefit paid out in a recession 39
Using Policy for Stabilisation
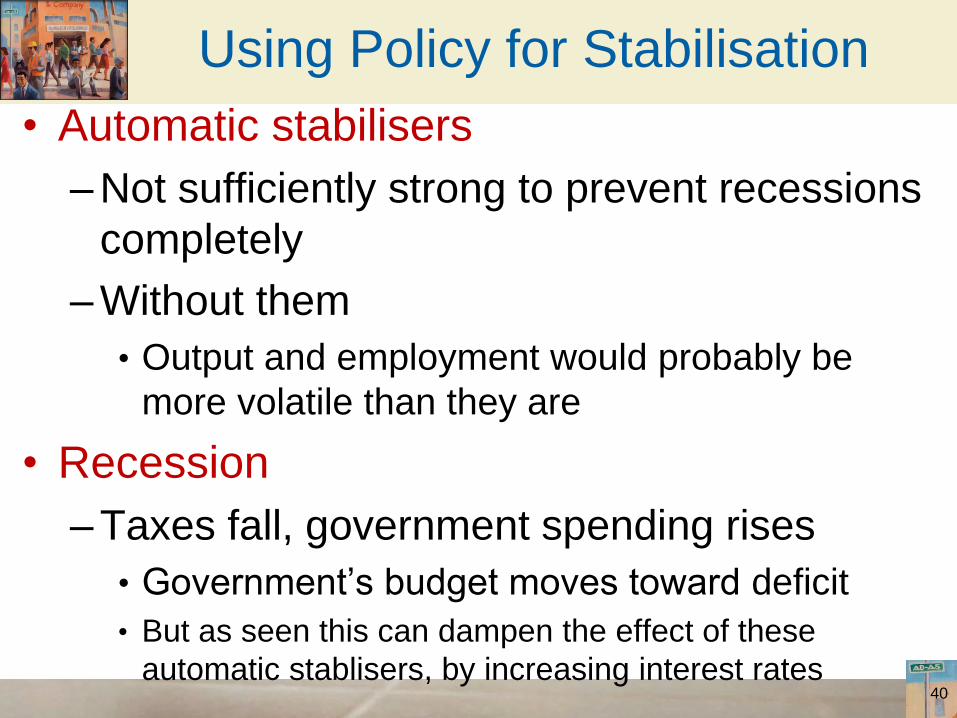
• Automatic stabilisers
– Not sufficiently strong to prevent recessions
completely
– Without them
• Output and employment would probably be
more volatile than they are
• Recession
– Taxes fall, government spending rises
• Government’s budget moves toward deficit
• But as seen this can dampen the effect of these
automatic stablisers, by increasing interest rates 40

The Recession of 2008–2009
• 2008-2009, financial crisis, severe
downturn in economic activity
– Worst macroeconomic event in more than
half a century
• Large contractionary shift in AD
– Real GDP fell sharply
• By 4% between the forth quarter of 2007 and
the second quarter of 2009
– Employment fell sharply
• Unemployment rate rose from 4.4% in May
2007 to 10.1% in October 2009
41

The Recession of 2008–2009
• Three policy actions - aimed in part at
returning AD to its previous level
– The Central Banks in US, UK and Europe
• Cut their targets for the repo rate
– Cut essentially to about zero in late 2008
• Started buying government bonds,
mortgage-backed securities and other
private loans
– In open-market operations
– Provided banks with additional funds
42
The Recession of 2008–2009
• Three policy actions
– October 2008, In the US, Congress
appropriated $700 billion
• For the Treasury to use to rescue the
financial system
• To stem the financial crisis on Wall Street
• To make loans easier to obtain
• Equity injections into banks
• U.S. and U.K. governments – temporarily (?)
became a part owner of some banks
43

The Recession of 2008–2009
• Three policy actions
– January 2009, Barack Obama
• Large increase in government spending
• $787 billion stimulus bill, February 17, 2009
• U.S. Economy, at least, appears to be
– starting to recover from the economic
downturn
– Real GDP - growing again
– Unemployment still persistent though
– Even less clear-cut in U.K. 44