Embed Size (px)
Citation preview
i
THE INFLUENCE OF NPL, NIM and ROA TOWARD EARNING
PER SHARE (EPS) OF COMMERCIAL BANK IN INDONESIA
(A case study of PT. Bank Central Asia Tbk period 2007 - 2016)
By:
Billy Thenu
ID: 014201400025
A Skripsi presented to the
Faculty of Business President University
In partial fulfillment of the requirements for
Bachelor Degree in Management
May 2018
ii
PANEL OF EXAMINERS
APPROVAL SHEET
The Panel of Examiners declare that the skripsi entitled “THE
INFLUENCE OF NPL, NIM & ROA TOWARD EARNING PER
SHARE (EPS) OF COMMERCIAL BANK IN INDONESIA (A case
study of PT. Bank Central Asia Tbk. period 2007-2016)” that was
submitted by Billy Thenu majoring in Management from the Faculty of
Business was assessed and approved to have passed the Oral Examinations
on 22 May 2018
Purwanto S.T., M.M.
Chair-Panel of Examiner
Liswandi S.Pd,M.M.,Ph.D
Examiner 2
Pandu Adi Cakranegara S.E, M.Sc. FI,MBA
Examiner 3
iii
DECLARATION OF ORIGINALITY
I declare that this skripsi, entitled “THE INFLUENCE OF
NPL, NIM AND ROA TOWARD EARNING PER SHARE
(EPS) OF COMMERCIAL BANK IN INDONESIA (A case
study of PT. Bank Central Asia Tbk. period 2007-2016)” is,
to the best of my knowledge and belief, an original piece of work
that has not been submitted, either in a whole or in a part, to
another university to obtain a degree.
Cikarang, Indonesia, 1 May 2018
Billy Thenu
iv
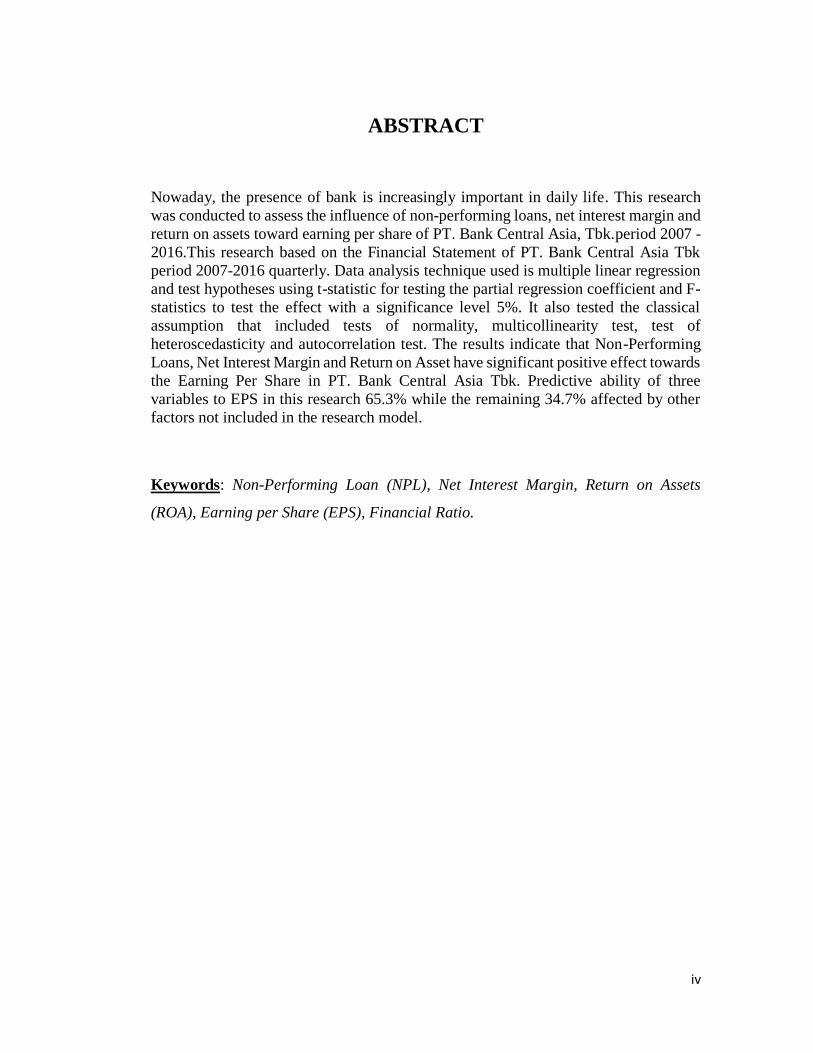
ABSTRACT
Nowaday, the presence of bank is increasingly important in daily life. This research
was conducted to assess the influence of non-performing loans, net interest margin and
return on assets toward earning per share of PT. Bank Central Asia, Tbk.period 2007 -
2016.This research based on the Financial Statement of PT. Bank Central Asia Tbk
period 2007-2016 quarterly. Data analysis technique used is multiple linear regression
and test hypotheses using t-statistic for testing the partial regression coefficient and F-
statistics to test the effect with a significance level 5%. It also tested the classical
assumption that included tests of normality, multicollinearity test, test of
heteroscedasticity and autocorrelation test. The results indicate that Non-Performing
Loans, Net Interest Margin and Return on Asset have significant positive effect towards
the Earning Per Share in PT. Bank Central Asia Tbk. Predictive ability of three
variables to EPS in this research 65.3% while the remaining 34.7% affected by other
factors not included in the research model.
Keywords: Non-Performing Loan (NPL), Net Interest Margin, Return on Assets
(ROA), Earning per Share (EPS), Financial Ratio.

v
ACKNOWLEDGEMENT
First of all, the researcher would like praise to God for his blessings, the researcher
could finish this research as a requirement to obtain a Bachelor Degree. In this preface,
the researcher would like to express sincere gratitude to:
1. Researcher’s family who always help and support me to complete this skripsi.
Without their help and support I might not be able to complete this skripsi.
2. Mr. Purwanto ST., M.M as researcher thesis advisor who have taught and guide
me to complete this thesis.
3. Researcher’s friends that can’t be mentioned one by one and those who
indirectly contribute in this research, thank you very much..
The researcher is fully aware that this thesis is far away from perfection, but hopefully
this thesis can give positive contribution to the readers and provide information for
people who need it. The researcher hope this thesis can give positive contribution to
the readers.

vi
TABLE OF CONTENTS
PANEL OF EXAMINERS ..................................................................... i
APPROVAL SHEET ............................................................................ ii
DECLARATION OF ORIGINALITY................................................iii
ABSTRACT .......................................................................................... iv
ACKNOWLEDGEMENT .................................................................... v
TABLE OF CONTENTS ..................................................................... vi
LIST OF TABLES ............................................................................... ix
LIST OF FIGURES............................................................................... x
LIST OF EQUATION .......................................................................... xi
LIST OF ACRONYMS ....................................................................... xii
CHAPTER I INTRODUCTION .......................................................... 1
1.1. Background of the Study .......................................................... 1
1.2. Problem Identification .............................................................. 3
1.3 Statement of Problem ................................................................... 3
1.4. Research Objective ...................................................................... 3
1.5. Definition of Terms ....................................................................... 4
1.6 Scope and Limitation .................................................................... 5
1.7 Benefit of the study ...................................................................... 5
1.7.1 For Academic ........................................................................ 5
1.7.2 For the Organization ............................................................. 5
1.7.3 For Future Researcher ........................................................... 5
CHAPTER II LITERATURE REVIEW ............................................. 6

vii
2.1 Theoretical Review .................................................................. 6
2.1.1 Non-Performing Loan ........................................................... 6
2.1.2 Net Interest Margin ............................................................... 7
2.1.3 Return on Assets ................................................................... 7
2.1.4 Earnings per Share ................................................................ 8
2.2 The relationship between NPL, NIM and ROA to EPS ............ 8
2.2.1 The relationship between NPL to EPS .................................. 8
2.2.2. Relationship between ROA and NIM to EPS ........................ 9
2.3 Bank....................................................................................... 10
2.4 Analysis Method of financial statements ................................ 11
2.5 Method of Ratio Analysis ...................................................... 12
2.6 Financial ratios ....................................................................... 13
2.6 Previous Research ................................................................. 14
2.7 Theoretical Framework ............................................................... 16
2.8 Hypothesis ............................................................................. 17
CHAPTER III METHODOLOGY .................................................... 18
3.1. Research Design..................................................................... 18
3.2. Research Framework .............................................................. 19
3.3 Research Instrument ............................................................... 20
3.3.1 Type and source of data ...................................................... 20
3.3.2 Data Collection Method ...................................................... 21
3.3.3 Data Analysis Method .......................................................... 21
3.4. Sampling Design .................................................................... 22
3.5. Testing the Hypothesis and Data Analysis ............................. 23
3.5.1 Multiple Regression Analysis ............................................. 23
3.5.2 Classical Assumption Test .................................................. 24
3.5.3 Measuring the Variability of the Regression Model ............ 28
3.5.4 Testing the Hypothesis ........................................................ 29
CHAPTER IV ANALYSIS AND INTERPRETATION ................... 32
viii
4.1. PT. Bank Central Asia Tbk. Company Profile ........................ 32
4.2. Data Analysis .............................................................................. 33
4.2.1 Description of each variable ...................................................... 33
4.2.2 Descriptive Statistical Analysis .............................................. 35
4.2.3 Classical Assumption Test Result .......................................... 37
1. Normality Test ............................................................................ 37
2. Autocorrelation Test ................................................................... 38
3. Multicollinearity Test ................................................................. 39
4.2.3 Multiple Regression Analysis ............................................. 41
4.2.4 Goodness or Fit Test ........................................................... 42
4.3. Interpretation of Results ......................................................... 45
4.3.1 The influence of Non-Performing Loan (NPL) towards
Earning Per Share (EPS) ................................................................. 45
4.3.2 The influence of NIM towards EPS..................................... 45
4.3.3 The influence of ROA towards EPS .................................... 45
4.3.4 The influence of NPL, NIM & ROA towards EPS. ............. 46
CHAPTER V CONCLUSION AND RECOMMENDATION .......... 47
5.1. Conclusion................................................................................. 47
5.2 Recommendation ....................................................................... 47
BIBLIOGRAPHY ............................................................................... 49
APPENDIX .......................................................................................... 56
ix
LIST OF TABLES
Table 4.1 Bank Central Asia financial highlight…………………….. 33
Table 4.2 Component ratio of each variable………………………….. 34
Table 4.3 Descriptive Statistic………………………………………... 37
Table 4.4 Autocorrelation Test……………………………………….. 39
Table 4.5 Multicollinearity Test……………………………………… 40
Table 4.6 Coefficients………………………………………………... 42
Table 4.7 F-Test………………………………………………………. 43
Table 4.8 R-Square………………………………………………….... 45
x
LIST OF FIGURES
Figure 2.1 Theoretical Framework…………………………………….. 18
Figure 3.1 Research Framework………………………………………. 21
Figure 4.1 Normal P-Plot of Regression Standardized Residual……… 38
Figure 4.2 Histogram………………………………………………….. 39
Figure 4.3 Scatterplot…………………………………………………...41
xi
LIST OF EQUATION
Equation 1 Non-Performing Loan………………………….. 7
Equation 2 Net Interest Margin…………………………….. 8
Equation 3 Return On Asset……………………………….. 9
Equation 4 Earning Per Share ……………………………... 10
Equation 5 Multiple Linear Regression Model…………….. 24
Equation 6 Variance Inflation Factor Model ………………… 26
Equation 7 Durbin-Watson D-Test ………………………….. 27
Equation 8 Coefficient of Determination……………………. 29
Equation 9 Coefficient of Correlation ……………………….. 30
Equation 10 F-Test…………………………………………….. 31
Equation 11 T-Test…………………………………………….. 32

xii
LIST OF ACRONYMS
NPL : Non-Performing Loan
NIM : Net Interest Margin
ROA : Return On Asset
EPS : Earning per Share`
1
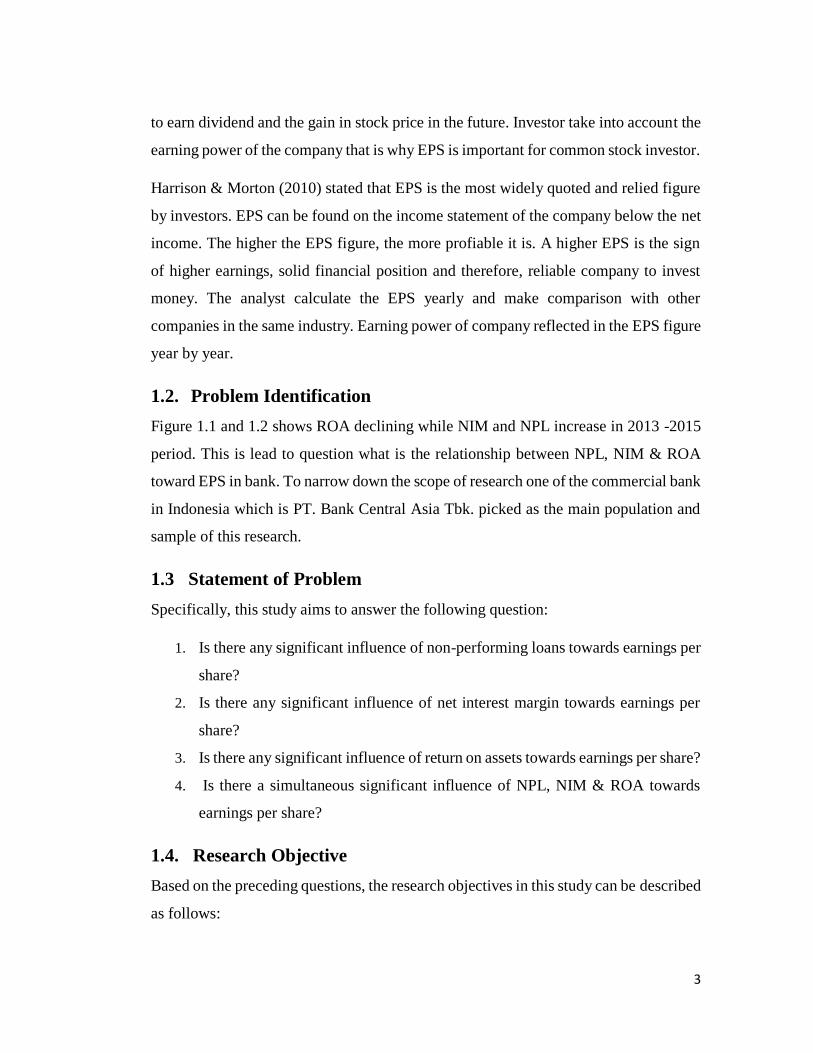
CHAPTER 1
INTRODUCTION
1.1. Background of the Study
Bank holds important role in every country economy. Since many sectors are rely on
banking industry support such as agriculture, farm, construction, trade, real estate and
other sector. In addition, banking industry provide investor instrument to channel their
fund or in other word provide investment instrument. Bank financial statement provide
key metric for their stakeholder especially investor.
Essentially, banking can be translated as the business activity of accepting and
preserving money by depositor, and then lending out this money in order to earn a
profit (Goyal, 2014). To be more specific, banking is vital economic infrastructures,
which perform three main functions: accepting deposits, lending money and money
transfer services.
Broadly speaking bank plays an important role in economy. Modern financial set-up
contributes to economic improvement and consequently lead to the increasing living
standards as it is put on numerous contribution to the remainder economy in present
day. Bank specialize in function to ensure borrowers fulfill their obligations related to
the credit. There is a tendency a more developed country capital market's dominantly
supplying financial products and services relative supplied by the bank (Bollard, 2011).
Since decades, the banking industry in Indonesia has made tremendous progress in the
country. This is due to the Indonesian government’s deregulation of the banking
industry commenced in June 1983 (Low, 1997).The changes are technology innovation
and financial services deregulation (Mihaljek, 2009).
2
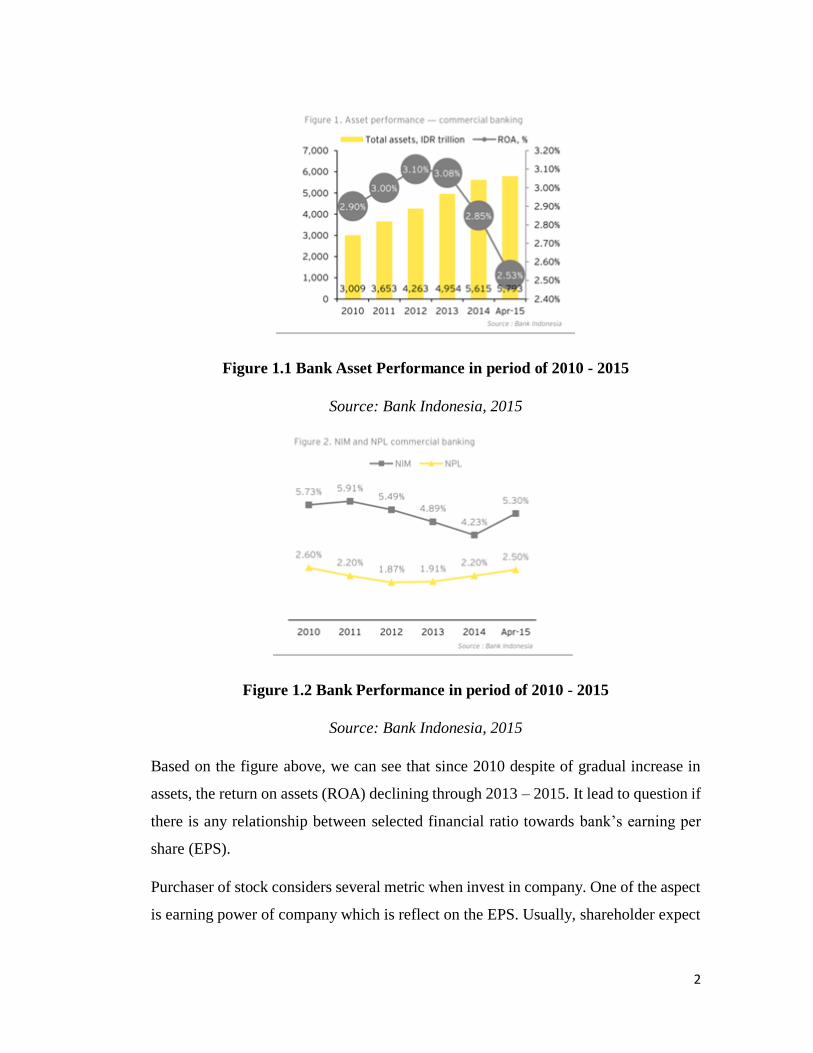
Figure 1.1 Bank Asset Performance in period of 2010 - 2015
Source: Bank Indonesia, 2015
Figure 1.2 Bank Performance in period of 2010 - 2015
Source: Bank Indonesia, 2015
Based on the figure above, we can see that since 2010 despite of gradual increase in
assets, the return on assets (ROA) declining through 2013 – 2015. It lead to question if
there is any relationship between selected financial ratio towards bank’s earning per
share (EPS).
Purchaser of stock considers several metric when invest in company. One of the aspect
is earning power of company which is reflect on the EPS. Usually, shareholder expect
3
to earn dividend and the gain in stock price in the future. Investor take into account the
earning power of the company that is why EPS is important for common stock investor.
Harrison & Morton (2010) stated that EPS is the most widely quoted and relied figure
by investors. EPS can be found on the income statement of the company below the net
income. The higher the EPS figure, the more profiable it is. A higher EPS is the sign
of higher earnings, solid financial position and therefore, reliable company to invest
money. The analyst calculate the EPS yearly and make comparison with other
companies in the same industry. Earning power of company reflected in the EPS figure
year by year.
1.2. Problem Identification
Figure 1.1 and 1.2 shows ROA declining while NIM and NPL increase in 2013 -2015
period. This is lead to question what is the relationship between NPL, NIM & ROA
toward EPS in bank. To narrow down the scope of research one of the commercial bank
in Indonesia which is PT. Bank Central Asia Tbk. picked as the main population and
sample of this research.
1.3 Statement of Problem
Specifically, this study aims to answer the following question:
1. Is there any significant influence of non-performing loans towards earnings per
share?
2. Is there any significant influence of net interest margin towards earnings per
share?
3. Is there any significant influence of return on assets towards earnings per share?
4. Is there a simultaneous significant influence of NPL, NIM & ROA towards
earnings per share?
1.4. Research Objective
Based on the preceding questions, the research objectives in this study can be described
as follows:
4
1. To determine if there's significant influence of non-performing loans toward
the earnings per share.
2. To determine if there's significant influence of net interest margin toward the
earnings per share.
3. To determine if there's significant influence of return on asset toward the
earnings per share.
4. To determine if there's a significant simultaneous influence of NPL, NIM and
ROA toward the earnings per share.
1.5. Definition of Terms
Some terms used in this research are as follow:
1. Bank: A financial institution acting as a receiver of deposits from the public
and lend them for investment purpose (Josh, 2012).
2. Bank Capital: funds kept by banks from the depositors and published in the
balance sheet in order to cover depositors and creditors against loss. (Olalekan,
2013).
3. Commercial Bank: common type of bank that is mainly handle loans and
deposits and having access to financial market (Kugiel, 2009).
4. Non-Performing Loans: is a loan that is default or close to being in default.
Generally, this loans become non-performing after being default for 3 months
(90 days) depend on the contract (Aziz, 2009).
5. Net Interest Margin: a metric that examines how successful a company's
funding decisions are compared to its debt situation (Evans, 2014). Is one the
indicators that can assess the profitability. NIM is a ratio that used to examine
their activity of asset productivity in order to get an interest.
6. Earnings Per Share: profit attributable to equity owned divided by number of
ordinary shares.
7. Return On Assets: is a metric to measure a company’s ability to generate
earnings from investment activities.
5
1.6 Scope and Limitation
This study is limited to the scope of biggest bank by total assets in Indonesia. The
author chose PT. Bank Central Asia Tbk because it is the largest bank by total asset
and public non-government companies. In other word not owned by government. The
financial ratio is limited to NPL, NIM, ROA & EPS.
1.7 Benefit of the study
This research has objectives to be achieved in academic research community,
organization and other researchers. The following below are the benefit of this
research:
1.7.1 For Academic
To give the contribution to the academic study and other. This research give an insight
that the theory studied by students will have application in the real working world. It
would be better for academic institution to have various approach on teaching theory
by combination with this study.
This will definitely help students to solve problems and not focused on proposed theory
without observing the real business condition.
1.7.2 For the Organization
It provide company information about their positioning and historical data as a
benchmarking for company to perform better than before.
1.7.3 For Future Researcher
Because this research is for partial fulfilment of the requirement for Bachelor Degree
and also by doing this research the researcher can apply the theory that obtained during
study process into the real market environment. There are more knowledge about NPL,
NIM, ROA and Earnings Per Share (EPS). The researcher gains knowledge &
motivation in higher education institution. This knowledge will be useful in the future
to be applied in when entering workplace.
6
CHAPTER II
LITERATURE REVIEW
2.1 Theoretical Review
Since this paper about financial ratios relation correspond to profitability which is
important for the business shareholders which is the investor, the value maximization
theory is comprised. Value maximization theory as mentioned in this paper states the
one objective of a firm’s existence is to maximize profits in the short run and maximize
shareholders wealth in the long run (Friedman, 1970). The theory said that all the
organization activities primary goal is to profit even though there are charitable
activities included in the company activities. The value maximization theory point-out
shareholder's wealth maximization including financial claimant maximization such as
debt and warrant holders. Therefore, EPS which is a profitability metric which may
influenced by NPL, NIM and ROA are one of the important metric the investor count
on when decide to invest in a company.
2.1.1 Non-Performing Loan
IMF (2004) stated non-performing loans is any loan already exceeds its maturity date
and part of the loan is still outstanding. The specific definition is dependent upon the
loan’s particular terms.
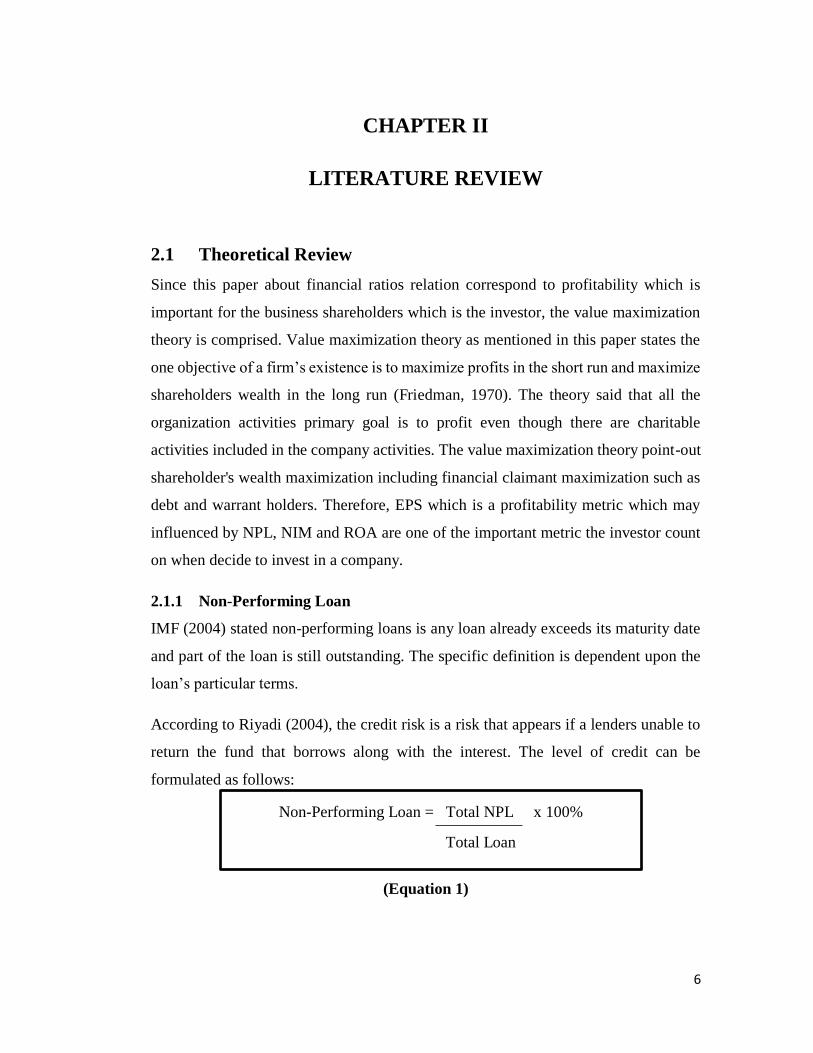
According to Riyadi (2004), the credit risk is a risk that appears if a lenders unable to
return the fund that borrows along with the interest. The level of credit can be
formulated as follows:
(Equation 1)
Non-Performing Loan = Total NPL x 100%
Total Loan
7
2.1.2 Net Interest Margin
Net interest margin is one of the indicators that can assess the profitability aspect. NIM
is a ratio that used to determine an ability of the bank management in their activity of
asset productivity in order to get an interest. According to Riyadi (2004), NIM is a
calculated by deducting net interest income minus interest expenses divided with the
average interest earning assets. This ratio is to determine that the level of interest
income get by the productive assets own by the bank. The more NIM means the assets
that ran by the bank has just a little problem to calculate the NIM can be used a formula
below:
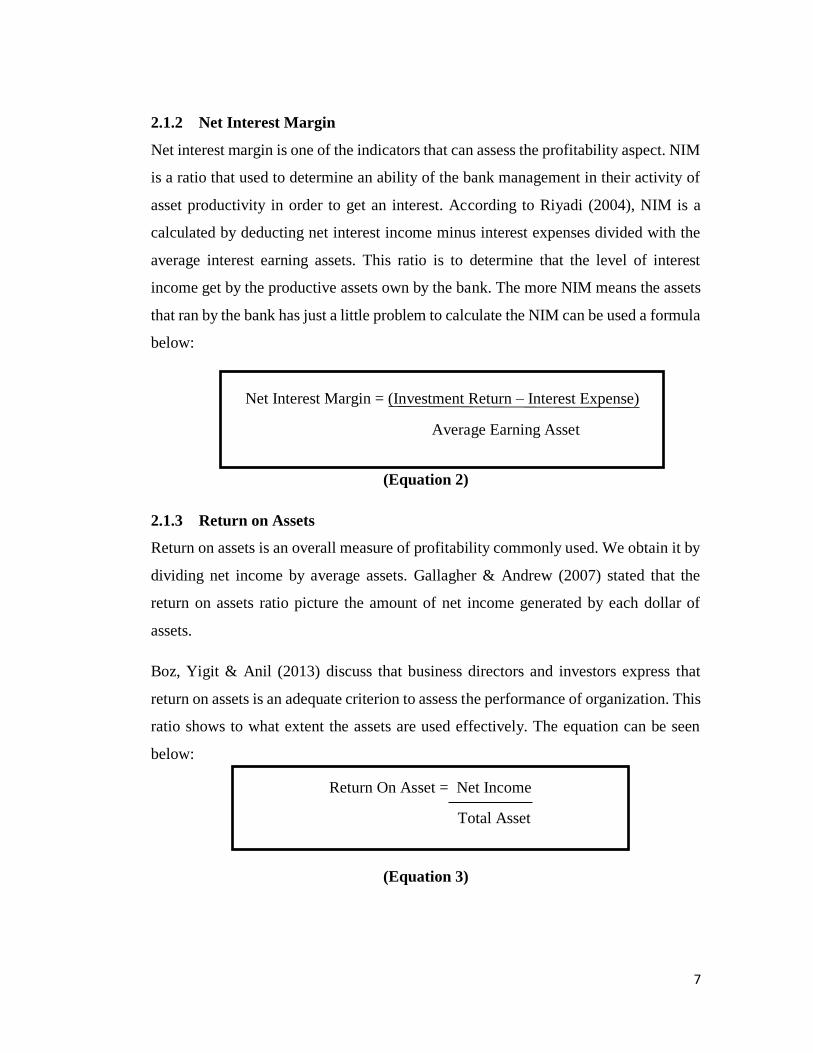
(Equation 2)
2.1.3 Return on Assets
Return on assets is an overall measure of profitability commonly used. We obtain it by
dividing net income by average assets. Gallagher & Andrew (2007) stated that the
return on assets ratio picture the amount of net income generated by each dollar of
assets.
Boz, Yigit & Anil (2013) discuss that business directors and investors express that
return on assets is an adequate criterion to assess the performance of organization. This
ratio shows to what extent the assets are used effectively. The equation can be seen
below:
(Equation 3)
Net Interest Margin = (Investment Return – Interest Expense)
Average Earning Asset
Return On Asset = Net Income
Total Asset
8
2.1.4 Earnings per Share
Several literature added as researcher study material in this research all of them are
Ohlson (1995) research about security valuation, talks about the role of EPS and its
part in security valuation. While Collins, Pincus and Xie examine the role of earning,
book value and dividends.
The limitation of EPS is EPS does not consider the amount of capital needed to generate
earning in other words efficiency in utilizing capital doesn't take into account. To
obtain EPS can be done by deducting net income with preferred dividend and divide
by the average number of common shares outstanding.
The equation is as follows:
(Equation 4)
2.2 The relationship between NPL, NIM and ROA to EPS
2.2.1 The relationship between NPL to EPS
On this research, researcher want to mention the relationship between NPL and the
liquidity risk to prove that they have effect to EPS. Decision of commercial bank
managers took refers to the liquidity control and particularly to the assessment related
to the procedures of deposits and loans (Anas & Mounira ,2008).
Berge & Boye (2007) noted that for bank maintaining high liquidity imply for bank
intention to gain from investment transaction that is profitable. Babihuga (2007) said it
puts bank with high liquidity ratio less risky and less profitable. Liquidity risk possibly
affect financial institution negatively if the financial institution not able to meet its
current cash obligations efficiently and on time.
Basic Earning Per Share = Net Income – Preferred Dividend
Weighted Average Number of
Common Share Outstanding
9
Lynch (2007), stated that financial institution as well as banker put substantial concern
in cash adequacy for clearing responsibilities on time. Liquidity risk could happen if
the management unable to mitigate risk and plan in finding cash sources. Liquidity risk
occurs when there is a sudden rush in liability withdrawals resulting in a bank to
liquidate assets to meet the demand (Eakins, 2008). Maintaining cash reserves while at
the same time increase investment to maximize earnings (Brigham & Ehrhardt, 2005).
It concluded that NPL and EPS have a negative relationship because NPL belongs to
Liquidity ratio in bank.
2.2.2. Relationship between ROA and NIM to EPS
Both of ROA and NIM are belong to profitability ratios. EPS is a good indicator of the
profitability and it is used measures of profitability (Ratios, 2012). Hence, ROA and
NIM have close relationship with EPS.
ROA shows investors what earning had been generated from invested capital (assets).
ROA for public banks can range significantly and might be pretty dependent on the
industry. This is why when using ROA as a comparative measure, it is best to compare
it towards the ROA of comparable bank. The ROA is a better gauge than simple EPS
of how bank is deploying its capital to build a profitable business. The higher ROA,
the more wealth the bank is creating for its shareholders and the better return they can
expect from their investment (Streissguth, 2014). The bank's ROA should be compared
to that of its competitors and other banks, whereas EPS is better used as a gauge of
whether the shares themselves are sometimes over or undervalued. If ROA increase in
the number, it will be a positive influence to EPS.
Based on the model developed by Ho & Saunders (1981), bank uncertainty derived
from asynchronous and random coming of deposits and loans. Typically, bank choose
the most beneficial loans and deposits increase / reduction. It mitigates the unused
demand of deposits or loans supply. Maximization of NIM in these models is the basic
assumption in bank behavior for these models.

10
2.3 Bank
A bank is a licensed order by a government to accept money from depositor, act as an
intermediary in financial transactions, clear checks, lend money and offer other
financial services to its clients. Jeanne Gobat (2012) explained some functions of a
bank include making loans, creating money and transmitting monetary policy. Her
explanations will be listed below.
Making Loans
When people make some deposits to a bank, the bank may be used the money as long-
term loans. That money which is the shorter-term deposits is used by banks to make
longer - term goals.
Creating Money
Banks also involved in creation of money. Bank have to maintain reserve and not lend
out, some portion of their deposits.
Transmitting Monetary Policy
Banks has important role in the monetary policy transmission for achieving economic
growth without inflation. Bank safety and soundness are a major public concern, one
of the government’s critical tools and government regulations were designed to limit
bank failures and the panic they can cause. Every bank tries to avoid the exposure risks
like credit risk, market risk and overall solvency risk. That is where regulations are
designed for.
In general, any company either bank or non-bank in a certain period will do reporting
its financial activity. Information about the company's financial processes, company
performance, cash flow and any information referring to the activities of financial
statements received from the company's financial statements. According to Bachtiar
(2014) the financial statements will present most of the data on the economic activities
of public companies that investors and other parties need. According to PSAK financial
statements are reports that illustrate the financial impact of transactions and other
11
events classified in several major groups according to their economic characteristics.
Based on the previous sentence it can be said that the financial statements are reports
that present the company's economic activities derived from transactions and other
events classified in groups that are expected to provide information or a better picture
of the prospects and risks of the company to investors and other parties who appeal.
2.4 Analysis Method of financial statements
According to Kashmir (2014) analysis of financial report needs to be done. Financial
statements become more useful so it can be understood by various parties.
For owners and management, the main purpose of financial statement analysis is to
know the current financial position of the company. By knowing the position of
financial statements, after the analysis of financial statements in depth, will look,
whether the company can achieve the target that has been planned previously or not.
The results of this financial statement analysis will also tell information about the
weaknesses and strengths of the company. By understanding this, management can
improve or cover-up those weaknesses. Then the strength of the company must be
maintained or even improved.
There are two kind of financial statements technique analysis commonly used
according to Kashmir (2014), namely:
a. Vertical Analysis (Static)
Vertical analysis is an analysis performed on only one financial reporting period.
Analysis is conducted between existing posts, in one period. Information obtained only
for one period only and unknown progress from period to period.
b. Horizontal analysis (Dynamic)
Horizontal analysis is an analysis performed by comparing the financial statements for
several periods. From the results of this analysis will see the development of the
company from one period to another. Then, in addition to the methods used above,
12
there are also other financial statement analysis, here are some analysis that can be
done.
1) Trend Analysis
Trend Analysis or tendency is an analysis of financial statements that are usually
expressed in certain percentages. This analysis is conducted from period to period
so it will be seen whether the company experienced a change that is up, down, or
fixed, and how big the change is calculated in percentage.
2) Fund Source and Use of Fund Analysis
Analysis of sources and use of funds is an analysis conducted to determine the
sources of corporate funds and the use of funds in a period. This analysis is also to
determine the amount of working capital and the causes of changes in working
capital of a company within a period.
3) Source Analysis and Cash Usage
Analysis of sources and use of cash is an analysis used to determine the source of
the company's cash and use of cash in a period. In addition, also to determine the
causes - the change in the amount of cash in a certain period.
2.5 Method of Ratio Analysis
Ratio analysis is an analysis used to determine the relationship that exist in one
financial statement or between the balance sheet financial statements and income
statement.
a) Gross Profit Analysis
Gross profit analysis is an analysis used to determine the amount of gross profit
from period to period. Then also to find out the causes of the change in gross profit
between periods.
13
b) Break Even Point Analysis
Break-even point analysis. The purpose of this analysis is to find out on what
conditions the sale of the product is done and the company does not lose. The
usefulness of this analysis is to determine the amount of profit at different levels of
sales.
2.6 Financial ratios
The definition of financial ratios according to James C Van Horne (2014) is an index
that relates two accounting numbers and is obtained by dividing one number by
another. Financial ratios are used to evaluate the company's financial condition and
overall performance. From the results of this financial ratio will be seen the health
condition of the company concerned. The company's financial ratios can help us to
identify some of the weaknesses and strengths of the company. With this financial ratio
we can make two ways of comparison, ie by comparing the ratio between time and we
can also compare the ratio of companies with other companies (Keown, et al, 2011).
So we can conclude the financial ratios is an analytical method obtained by dividing a
number by another number contained in the balance sheet or income statement
individually or in combination of both reports are used to know and evaluate the
financial condition and performance of the company concerned.
Forms of financial ratios:
According to Dendawijaya (2005) form of financial ratio are as follows:
1. Liquidity Ratio
Dendawijaya (2005), stated liquidity ratios used in regular basis in assessing bank
performance such as cash ratio, required amount of reserve, loan to deposit ratio, loan
to asset ratio, net call liabilities ratio. The liquidity ratio analysis performed to analyse
the bank's ability to meet its short-term liabilities or matured liabilities.
14
2. Solvency Ratio
Dendawijaya (2005), elaborate solvency ratio is the bank's ability to fulfill its long-
term liability or the capability of banks to meet obligations in the event of bank
liquidation. In addition, it is used to specify the ratio between the extent (amount) of
funds received from various debts (short-term and long-term) as well as different
external resources by the number of investment in various kind of assets owned by the
bank. The ratios are capital adequacy ratio, debt to equity ratio, long term debt to assets
ratio.
3. Profitability Ratio
It is a tool to analyze or measure the level of business efficiency and profitability.
Further, it is used to measure bank soundness. Profitability ratios are usually sought
reciprocal relationship between posts contained in the income statement of banks with
accounts on bank balance sheets in order to obtain various indications. The analysis of
rentability ratio of a bank, among others are ROA, ROE, net profit margin, operational
cost ratio (Dendawijaya, 2005).
2.6 Previous Research
1. Sam (2012) conducted a research entitled "Analysis of effect of LDR, NPL and
ROA to the CAR of the Regional Development Bank in Indonesia period 2007
– 2011". It is mainly about the effect of non-performing loan, return on assets
and loan to deposit ratio toward capital adequacy ratio. Data used in this
research based on Bank Indonesia published report period 2007 to 2012. Data
used in this research was normally distributed. Empirical evidence shown loan
to deposit ratio, non-performing loan, Return on assets to have influence toward
capital adequacy ratio of regional development bank in Indonesia over period
2007 – 2011 at level of significance less than 5% and together LDR, NPL and
ROA to have influence toward CAR.

15
2. Mahamat (2012), conducted. a research entitled "Analysis of Influence of
BOPO, NPL, NIM and CAR on PT. Bank Negara Indonesia (persero) Tbk.
Period 2006-2013" . This research was conducted to assess the influence of
operating revenue to operating expense ratio (BOPO), non-performing loan, net
interest margin and capital adequacy ratio toward loan to deposit ratio. This
research based on PT. Bank Negara Indonesia Tbk. period 2006-2013 quarterly
report. The results indicate that operating revenue to operating expense have no
significant effect towards LDR in PT. Bank Negara Indonesia, Tbk. The
variable NPL, NIM and CAR significantly has positive effect on the LDR.
Predictive ability of three variables to EPS in this research of 90.3% while the
remaining 9.7% affected by other factors not included in the research model.
3. Karim, Chan & Hassan (2010), conducted a research entitled "Bank Efficiency
and Non-Performing Loans. Evidence from Malaysia and Singapore". The
intent of this study is to analyze the connection among NPL and bank efficiency
in Malaysia and Singapore. The author use stochastic cost frontier with
assumption of normal-gamma efficiency distribution model proposed. The
outcomes imply that there is no significant distinction in cost efficiency
between bank in Singapore and Malaysia even though banks in Singapore
shows higher average cost efficiency. Likewise, lower cost efficiency will
increase non-performing loans. The result support the terrible management
hypothesis proposed that bad management inside the banking institutions
results in bad loans quality and then escalates the level of non-appearing loans.
4. Bhatt & Sumangala (2012), conducted a research entitled "Impact of Earnings
Per Share on Market Value of an Equity Share : an Empirical Study in Indian
Capital Market". Equity valuation is a central question which the academicians
and researchers in the field of capital markets are looking to address through
different perspective. At the same time, the stock trading practitioner have been
working through different clues. The most important variable affecting market
value of equity share is earning. Usually when a successful company starts build
16
up reserve they also look for expanding its scale of operation to increase its
earnings. Once a company starts earning attractive sum, the equity share will
have more and more thus increase its earnings. Then the equity share will have
more demand resulting increase in market value of equity attractive sum, the
equity share will have more and more demand which will result in increase in
market value of the equity. This paper attempt to study the impact of EPS on
the market value of an equity share in the India.
5. Mayasari & Setiawan (2013), conducted a research entitled "Capital Ratios on
Regional Development Banks". PDN partially has positive significant influence
toward CAR, LDR, IPR, NPL, FBIR and NIM partially have positive but not
significant influence toward CAR. APB and IRR partially have negative
significant influence toward CAR, OER and ROA partially have negative
insignificant influence to CAR. Policies related to APB, based on research
results APB has a negative impact on CAR and that have the most impact. All
independent variables have significant influence simultaneously toward CAR.
6. Seetharaman & Raj (2013), conducted a research entitled "An Empirical Study
on the Impact of Earnings per Share on Stock Prices of Listed Bank in
Malaysia". An impact of an announcement of EPS on stock prices had been the
interest of stakeholder. It is since EPS is one of the investment tools to evaluate
a company’s performance either in the short or long term. EPS can be used to
measure the financial performance and company prospect. In this research
finding, it can be concluded that there is a very strong positive correlation
between public bank EPS and that there is a significant impact of earnings
announcement on public bank stock prices.
2.7 Theoretical Framework
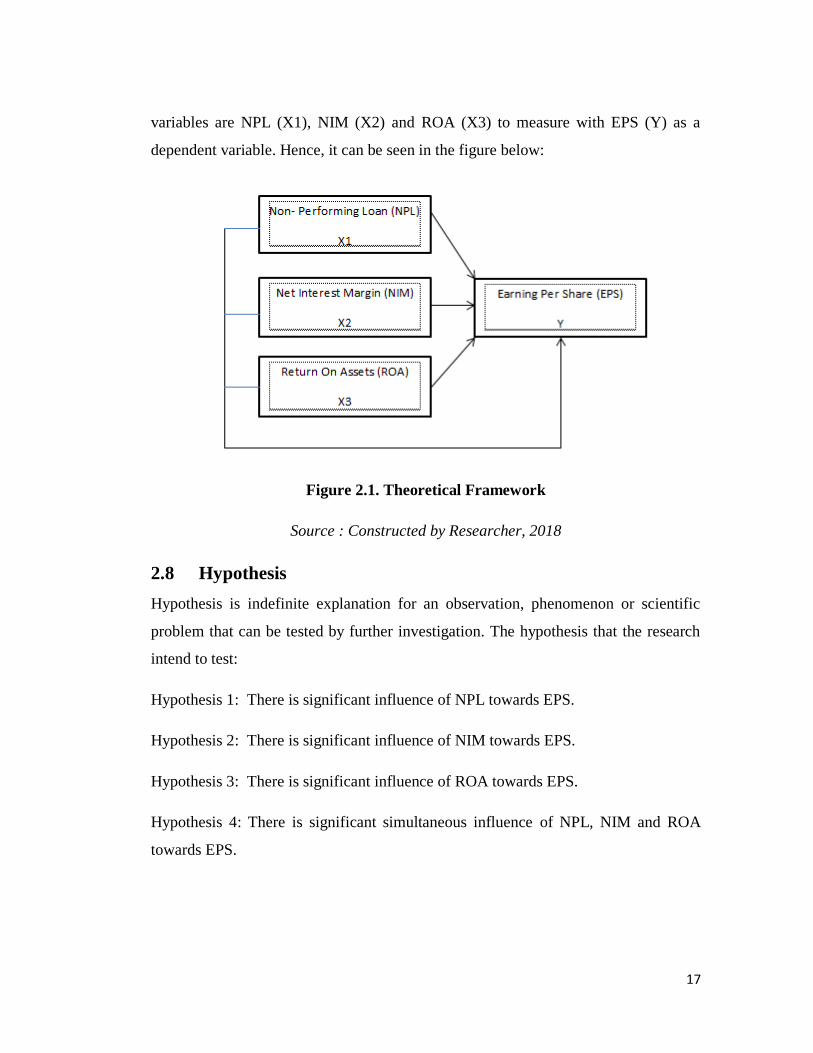
Based on the model theoretical review above and previous study, so this research use
three independent variables to measure the dependent variable. The independent
17
variables are NPL (X1), NIM (X2) and ROA (X3) to measure with EPS (Y) as a
dependent variable. Hence, it can be seen in the figure below:
Figure 2.1. Theoretical Framework
Source : Constructed by Researcher, 2018
2.8 Hypothesis
Hypothesis is indefinite explanation for an observation, phenomenon or scientific
problem that can be tested by further investigation. The hypothesis that the research
intend to test:
Hypothesis 1: There is significant influence of NPL towards EPS.
Hypothesis 2: There is significant influence of NIM towards EPS.
Hypothesis 3: There is significant influence of ROA towards EPS.
Hypothesis 4: There is significant simultaneous influence of NPL, NIM and ROA
towards EPS.
18
CHAPTER III
METHODOLOGY
3.1. Research Design
According to Render (2006), in doing scientific research there are two methods, those
are qualitative and quantitative approach. The differences between qualitative and
quantitative are the type of data, research process, instrument in collecting data and the
purpose of research.
1. Qualitative method usually gathered observation, interviews, can be from
written evidence and case studies. It is more about attribute value.
2. Quantitative method entails only a few respondents, utilizes open-ended
questionnaires, great for answering how and why questions.
Quantitative observations are made using mathematical tools and measurements. The
results can be scrutinized and any other person trying to quantitatively examine the
same mode ought to turn up to be with the identical outcomes. In quantitative method
portions of data that can be counted mathematically, it also includes accrued via
surveys from huge numbers of respondents selected randomly and it is analysed using
statistical methods best used to answer what, when and who questions. The researcher
make use of quantitative method in undertaking this studies.
Render (2006), stated that the essence of quantitative analysis is the process of
manipulating raw data into significant information. Quantitative approach is
predetermined and use large number of respondent. Per se, analysis must be objective
and valid. The sample size for a survey is calculated using formulas to determine how
large a sample size might be needed from a given population to attain findings with an
acceptable degree of accuracy. Typically, researchers are trying to find sample sizes
19
which yield findings with at least a 95% confidence interval, margin error of 5 percent.
The surveys are designed to produce a smaller margin of error.
Therefore, in this study the writer uses the quantitative method with Factor Analysis
and Multiple Regressions Analysis to answer the research questions. Quantitative
method will be used because of the objective of this research is to appoint mathematical
models, theories and/or hypotheses relating phenomena. Mujis (2011), stated that in
the social sciences, quantitative research refers to give an explanation of phenomena
by collecting numerical data that are analysed using mathematically based methods
(especially statistics).
According to research objective in this research which is to explain effect of
independent variable (variable used to predict) to dependent variable (variable to be
predicted) which are the analysis of relationship among NPL, NIM & ROA toward
EPS.
Using quantitative research method, data can be easily converted into number and
analyzed through mathematical expression. Quantitative research shows the
relationship between independent variables and the dependent variable.
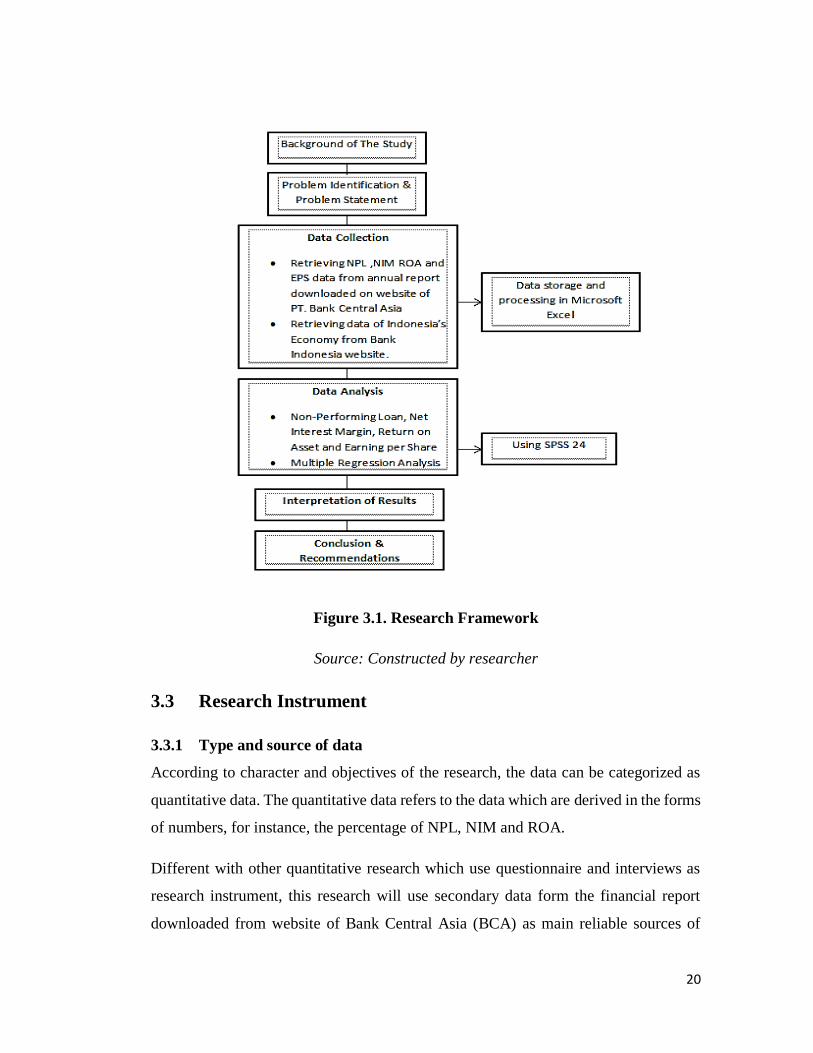
3.2. Research Framework
This research specifically investigates the influence of NPL, NIM and ROA toward
EPS on Bank Central Asia. Before conducting this research, the researcher had to find
out the information and overview about Bank Central Asia.
20
Figure 3.1. Research Framework
Source: Constructed by researcher
3.3 Research Instrument
3.3.1 Type and source of data
According to character and objectives of the research, the data can be categorized as
quantitative data. The quantitative data refers to the data which are derived in the forms
of numbers, for instance, the percentage of NPL, NIM and ROA.
Different with other quantitative research which use questionnaire and interviews as
research instrument, this research will use secondary data form the financial report
downloaded from website of Bank Central Asia (BCA) as main reliable sources of
21
information. According to the sources, the data that the researcher preferred to use is
secondary data. Secondary data is not originated by the investigator who doing this
research itself, but basically it obtains the source from someone else’s record. Such
data are cheaper and more quickly to obtain than the primary data and also may be
available when the primary data cannot be obtained at all (Render, Stair & Hanna,
2006).
According to (Malhotra & Peterson, 1996), secondary data is collected from some
purpose other than problem at hand”. Actually, secondary data is used for exploratory
study, but more formalised studies are typically structured which clearly stated
hypothesis or investigate questions which are known as descriptive studies.
3.3.2 Data Collection Method
Lind & Wathen (2010) states that collection of data should be systematic because if the
data is not systematic, it will be inhibit the writer to accomplish this research. The
writer used secondary data to do this research; the data was collected from several
reliable Indonesian institution source which is Bank of Indonesia.
Indonesia’s economic data from 2009-2013 taken from the official website of Bank
Indonesia which controls all of the banking system and operating system and operating
business in Indonesia. This website provided full information about overview of
Indonesia’s Economy every year.
NPL, NIM, ROA and EPS data from year 2007 - 2016 was taken from public non-
government bank official website which is PT. Bank Central Asia, Tbk.
3.3.3 Data Analysis Method
Because there are three (3) variables in this research that three of X (independent
variable) correlated to one Y (dependent variable). Multiple Regression will be used to
analyze the data. Regression analysis is a technique for modelling and analyzing
variables, when focus is on the relationship between a dependent variable and one or
more independent variables (Lind & Wathen, 2010). Moreover, multiple regression
22
analysis enables the researcher to understand how the value of the dependent variable
changes when any one of the independent variables is varied, while the other
independent variables are held fixed (Render, Stair & Hanna, 2006)
Multiple Regression is widely used for predicting and forecasting but also to
understand which among the independent variables are related to the dependent
variable, and to explore the forms of these relationships (Levine, Krehbiel and
Berenson, 2009). So, in order to find correlation between variables researched, the
author will use multiple regression method.
For the process of analyzing the data, the researcher will use SPSS 24 for statistic
purpose and Microsoft Excel software. It makes the calculation can be done easily by
this software. For making the report or book of this research, Microsoft Word was used
to make diagram and framework.
3.4. Sampling Design
Sampling Design is part of statistical methodology that related in taking a portion of
the population. If a sampling is done correctly, statistical analysis can be used to
generalize whole population (Sekaran, Bougie, 2010).
a. Population
Population includes each element from the set of observation. The population of
this research is largest public non-government owned by total assets. Banks in
Indonesia which is the population is also a sample used only for Bank Central Asia
(BCA) ,which is as main population.
b. Sample
Sample consists only observation drawn from the population. From this research
the sample is taking from the annual of time based on the financial statement of
Bank Central Asia (BCA). The sample that used come from the quarterly report of
financial statement released, with the period from 2007-2016.
23
3.5. Testing the Hypothesis and Data Analysis
3.5.1 Multiple Regression Analysis
According to Berenson, Levine & Krehbiel (2009), multiple regression model is used
for estimating or forecasting the value of variable Y, which calculated using several
variables that affect Y. The research on relationship between 1 dependent variable (Y)
with three other independent variables (X1, X2,X3) used to understand the relationship
between them . According to Render, Stair & Hanna (2006), there is an implied
assumption that a relationship exists between the variables and can be tested. That one
may decide whether to reject or accept the hypothesis, the writer use random error 𝑎 =
5 that can be predicted.
The result from this regression analysis will be used to accept or to reject the hypothesis
as to observe whether there is any effect or not between dependent and independent
variables. Referring to the research objective to examine how significance the
correlations between NPL, NIM, ROA and EPS on PT. Bank Central Asia Tbk. , the
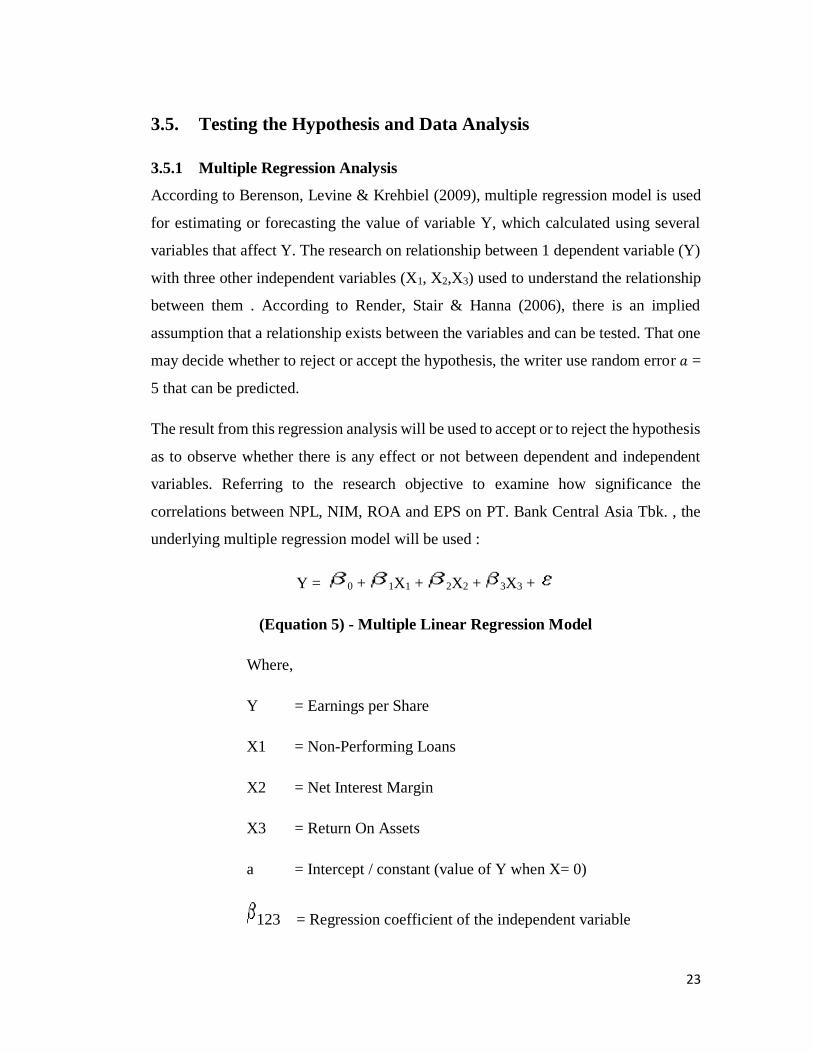
underlying multiple regression model will be used :
Y = 0 + 1X1 + 2X2 + 3X3 +
(Equation 5) - Multiple Linear Regression Model
Where,
Y = Earnings per Share
X1 = Non-Performing Loans
X2 = Net Interest Margin
X3 = Return On Assets
a = Intercept / constant (value of Y when X= 0)
123 = Regression coefficient of the independent variable
24
= Random Error
However, in order to finish the regression model to see the correlation between the
variables, there are some tests including measuring the regression model to test the
validity of the data which are normality test & classic assumption tests.
3.5.2 Classical Assumption Test
The estimation method used in this research is the Ordinary Least Square (OLS)
method. Least Square method determines a regression equation by minimizing the sum
of the squares of the vertical distance between the actual Y values and the predicted
values of Y (Lind & Wathen, 2010). This method is chosen because it is the most
powerful and popular methods of regression analysis. Moreover, it is also simpler
mathematically. The use of this mathematic has to meet several assumptions to make
sure that the data collected are valid and reliable distribution (Levine, Krehbiel and
Berenson, 2009).
1. Normality Test
It's far assumed in a multiple of regression that residuals (predicted minus observed
values) are distributed normally. This test can be achieved with the aid of producing
histograms for the residual as well as normal probability plots, if you want to look into
the distribution of the residual values (Render, Stair & Hanna, 2006).
The normality test also can be done by using SPSS statistical software and can be
viewed in the graph of normal probability plot that is a graphical device to study the
shape of the probability density function. Normal probability plot is used to assess how
well empirical data approximates a particular theoretical (Levine, Krehbiel and
Berenson, 2009). In this case a linear relationship distribution; the data can also be
plotted on the probability scale by plotting the cumulative probabilities of the data
under the assumed distribution against their expected probabilities.
25
2. Multicollinearity Test
Multicollinearity is the correlation among the independent variables which makes it
difficult to make conclusion about the individual regression coefficients and their
individual effects on the dependents variables. Another reason for avoiding correlated
independent variable is they may lead to false results in the hypothesis test for the
individual independent variables. In practice, it is nearly impossible to select the
independent variables that are completely unrelated or not correlated in some degree
(Lind & Wathen, 2010). Multicollinearity problems arise if there is perfect relationship
or certainly among the few independent variables or all variables in the model. In cases
of serious multicollinearity, regression coefficients are no longer showing pure effect
on independent variables in the model. Multicollinearity does not affect the multiple
regression equation’s ability to predict the dependent variable. However, it might show
unexpected results on the relationship between each independent variables and the
dependent variable (Levine , Krehbiel and Berenson, 2009)
If Multicollinearity shows in a multiple regression model, the model is still good for
prediction, but the interpretation of individual coefficient is not valid. There are many
methods to detect the presence of multicollinearity, in this research the writer would
like to do a test on the variables with the measurement of the Variance Inflation Factor
(VIF) (Lind & Wathen, 2010).
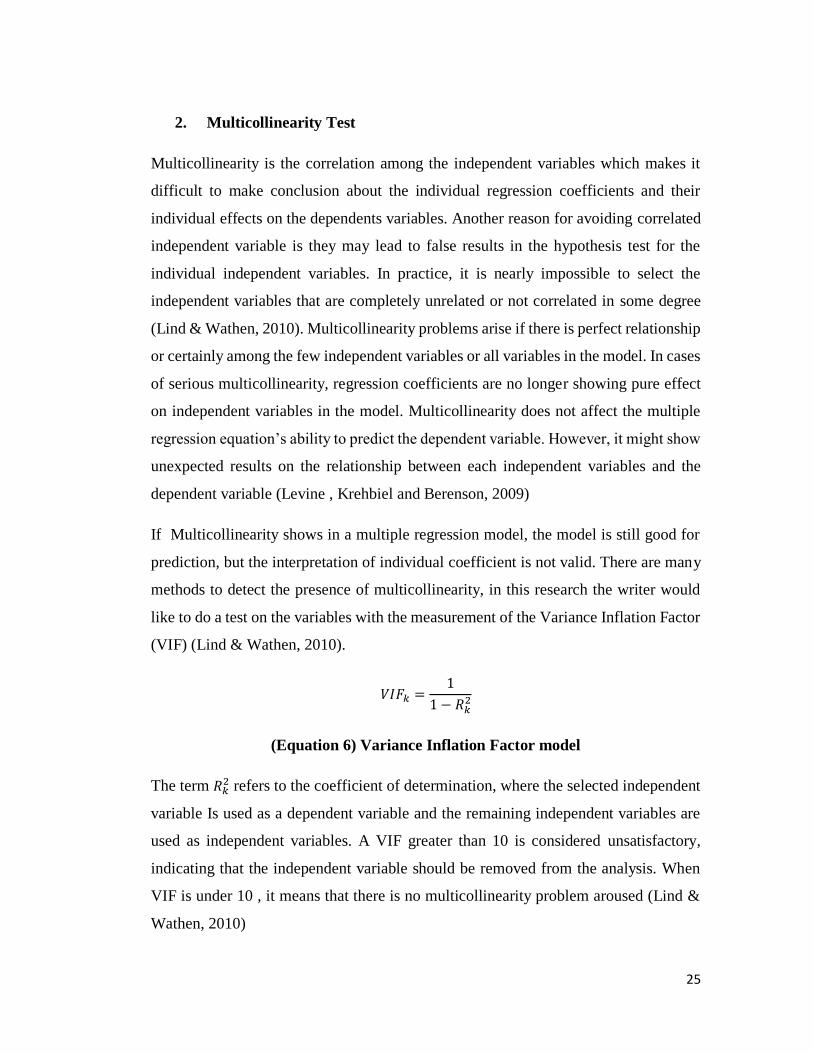
𝑉𝐼𝐹𝑘 =1
1 − 𝑅𝑘2
(Equation 6) Variance Inflation Factor model
The term 𝑅𝑘2 refers to the coefficient of determination, where the selected independent
variable Is used as a dependent variable and the remaining independent variables are
used as independent variables. A VIF greater than 10 is considered unsatisfactory,
indicating that the independent variable should be removed from the analysis. When
VIF is under 10 , it means that there is no multicollinearity problem aroused (Lind &
Wathen, 2010)
26
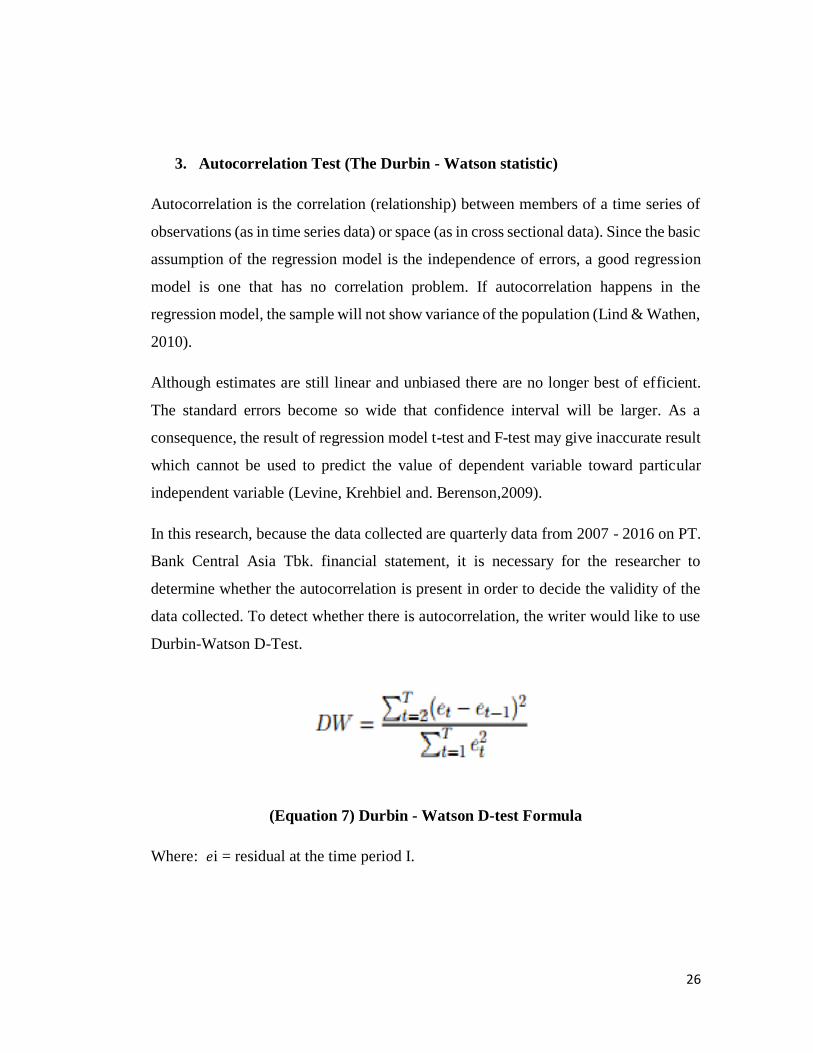
3. Autocorrelation Test (The Durbin - Watson statistic)
Autocorrelation is the correlation (relationship) between members of a time series of
observations (as in time series data) or space (as in cross sectional data). Since the basic
assumption of the regression model is the independence of errors, a good regression
model is one that has no correlation problem. If autocorrelation happens in the
regression model, the sample will not show variance of the population (Lind & Wathen,
2010).
Although estimates are still linear and unbiased there are no longer best of efficient.
The standard errors become so wide that confidence interval will be larger. As a
consequence, the result of regression model t-test and F-test may give inaccurate result
which cannot be used to predict the value of dependent variable toward particular
independent variable (Levine, Krehbiel and. Berenson,2009).
In this research, because the data collected are quarterly data from 2007 - 2016 on PT.
Bank Central Asia Tbk. financial statement, it is necessary for the researcher to
determine whether the autocorrelation is present in order to decide the validity of the
data collected. To detect whether there is autocorrelation, the writer would like to use
Durbin-Watson D-Test.
(Equation 7) Durbin - Watson D-test Formula
Where: 𝑒i = residual at the time period I.
27
According to Keller (2009), in order to test the positive autocorrelation at significance
𝑎, sample n and k number of independent variables, the test statistic d is compared to
lower and upper critical values (dL,a and d𝑈, 𝑎) :
a. If (4 - d) < d𝐿, 𝑎 there is statistical evidence that the error terms are negatively
autocorrelated.
b. If (4-d) > d𝑈, 𝑎 there is statistical evidence that the error terms are not negatively
correlated.
c. If d𝐿, 𝑎 < (4- d) < d𝑈, 𝑎 : the test is inconclusive.
A good regression model should have no presence of autocorrelation to validate the
result of t-test and F-test to predict the value of dependent variable toward particular
independent variable (Keller, 2009).
4. Heteroscedasticity Test
Heteroscedasticity occurs when the variance of errors is constant. When the dispersion
of term's probability distribution is not constant, heteroscedasticity likely exists.
Heteroscedasticity often arises in the analysis of cross sectional data and time series
data (Lind & Wathen, 2010).
If heteroscedasticity exist in the regression model, the variance and standard error will
tend to increase as the t value will not get lower than the actual t value. The
consequences are the t- test and F-test will be inaccurate and fail to reject the null
hypotheses (Levine, Krehbiel and Berenson, 2009).
A simple test for heteroscedasticity is to plot the standardized residuals (on vertical
axis) against the dependent variable (horizontal axis). If no heteroscedasticity occurs,
the plot will appear to spread randomly. If a systematic pattern (wave, straight, narrow,
widen) appears in the scatter plot then heteroscedasticity exists (Levine, Krehbiel and
Berenson, 2009).
28
3.5.3 Measuring the Variability of the Regression Model
A regression equation can be developed for any variables X and Y, even random
numbers. There are two ways to know that the model is actually helpful in predicting
Y based on X :
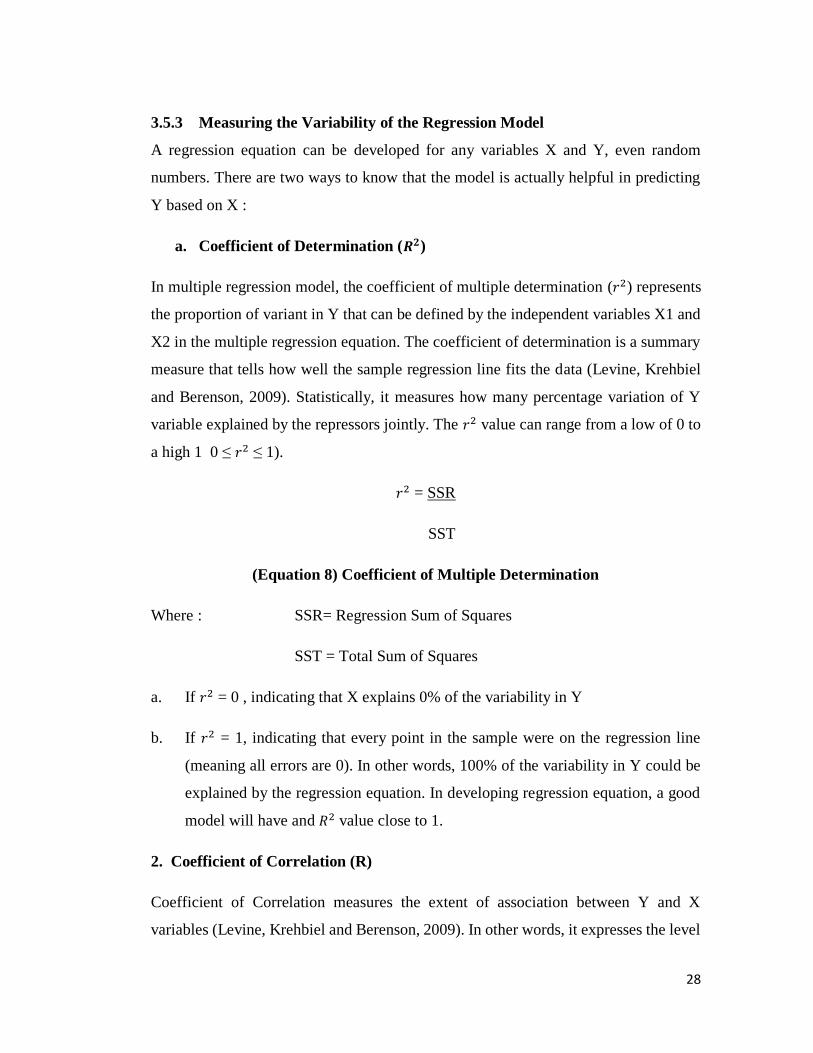
a. Coefficient of Determination (𝑹𝟐)
In multiple regression model, the coefficient of multiple determination (𝑟2) represents
the proportion of variant in Y that can be defined by the independent variables X1 and
X2 in the multiple regression equation. The coefficient of determination is a summary
measure that tells how well the sample regression line fits the data (Levine, Krehbiel
and Berenson, 2009). Statistically, it measures how many percentage variation of Y
variable explained by the repressors jointly. The 𝑟2 value can range from a low of 0 to
a high 1 0 ≤ 𝑟2 ≤ 1).
𝑟2 = SSR
SST
(Equation 8) Coefficient of Multiple Determination
Where : SSR= Regression Sum of Squares
SST = Total Sum of Squares
a. If 𝑟2 = 0 , indicating that X explains 0% of the variability in Y
b. If 𝑟2 = 1, indicating that every point in the sample were on the regression line
(meaning all errors are 0). In other words, 100% of the variability in Y could be
explained by the regression equation. In developing regression equation, a good
model will have and 𝑅2 value close to 1.
2. Coefficient of Correlation (R)
Coefficient of Correlation measures the extent of association between Y and X
variables (Levine, Krehbiel and Berenson, 2009). In other words, it expresses the level

29
of strength of the linear relationship. The coefficient of correlation can be computed
directly from the coefficients of determination as follows:
r = ±√𝑟2
Or from the sample data:
(Equation 9) Formula of Coefficient of Correlation
The result of r can be stated at any number between +1 and -1. The value of r is the
square root of 𝑟2. It is negative if the slope is negative and it is positive if the slope is
positive.
3.5.4 Testing the Hypothesis
1. Testing the Model for Significance
A statistical test (F- test and T-test) is performed to determine if there is a linear
relationship between X and Y. The null hypothesis is that there is no linear relationship
between the two variables (i.e. β = 0) and the alternate hypothesis is that there is a linear
relationship (i.e. β ≠ 0) .If the null hypothesis rejected, we have proven that a linear
relationship does exist.
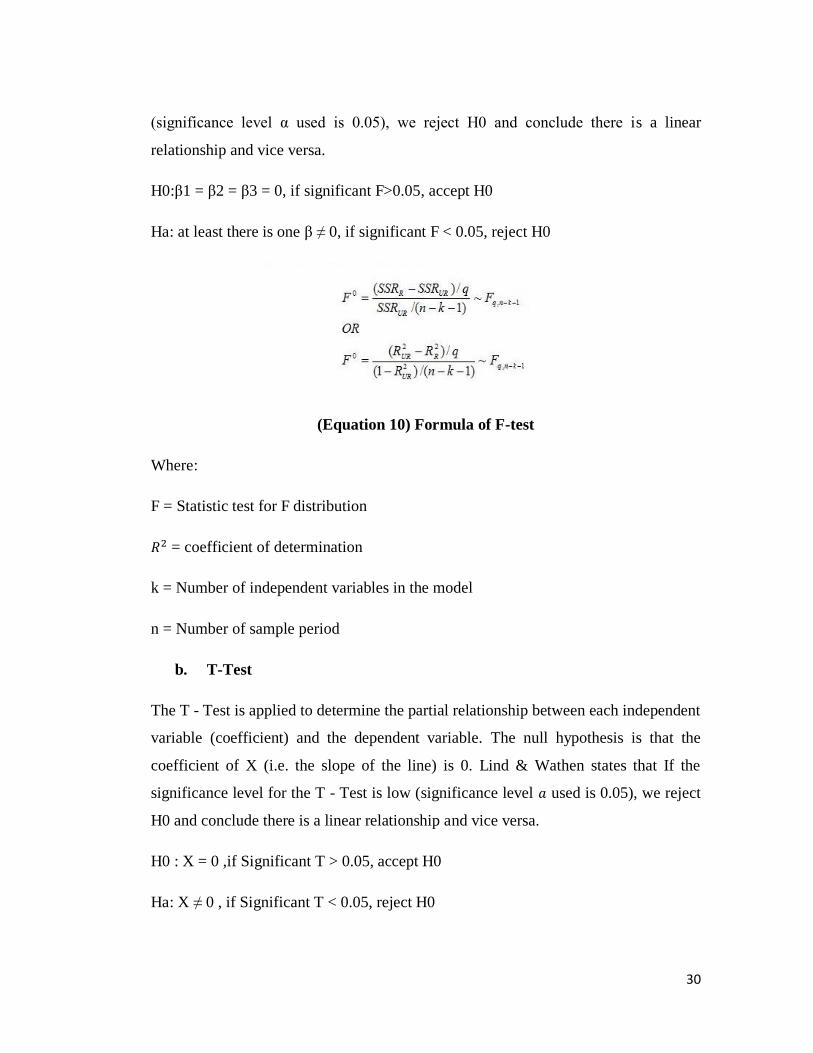
a. F-test
The F-test determines whether or not there is a relationship between set of independent
variables & dependent variable simultaneously. And F-test is used to test statistically
the null hypothesis that there is no linear relationship between the X and Y variables
(i.e.β=0). Lind & Wathen states that If the significance level for the F-test is low
30
(significance level α used is 0.05), we reject H0 and conclude there is a linear
relationship and vice versa.
H0:β1 = β2 = β3 = 0, if significant F>0.05, accept H0
Ha: at least there is one β ≠ 0, if significant F < 0.05, reject H0
(Equation 10) Formula of F-test
Where:
F = Statistic test for F distribution
𝑅2 = coefficient of determination
k = Number of independent variables in the model
n = Number of sample period
b. T-Test
The T - Test is applied to determine the partial relationship between each independent
variable (coefficient) and the dependent variable. The null hypothesis is that the
coefficient of X (i.e. the slope of the line) is 0. Lind & Wathen states that If the
significance level for the T - Test is low (significance level 𝑎 used is 0.05), we reject
H0 and conclude there is a linear relationship and vice versa.
H0 : X = 0 ,if Significant T > 0.05, accept H0
Ha: X ≠ 0 , if Significant T < 0.05, reject H0
31
We use correlation coefficient (r) to measure the strength of the relationship between
two numerical variables, the test for the existence of correlation is using t-test.
(Equation 11) Formula of T-test
x̄ = sample mean
μ0 = population mean
s = sample standard deviation
n = sample size
2. Testing the Partial Correlation
Correlation test is conducted to find out the correlation between one independent
variable partially to the dependent variable. The result can be shown in the Pearson
correlation table. The positive sign gives information on the increase of the values of
one variable relative to the increase value of another variable and vice versa (Levine,
Krehbiel and Berenson, 2009).
32
CHAPTER IV
ANALYSIS AND INTERPRETATION
4.1. PT. Bank Central Asia Tbk. Company Profile
Bank Central Asia is the third-largest bank in Indonesia in terms of assets. It provides
financial services that are supported by its subsidiaries in various financing (BCA
Finance), capital market brokerage (BCA Securities), insurance (BCA General
Insurance, BCA Life Insurance), shariah banking (BCA Syariah) and remittance (BCA
Remittance Ltd.). It was established on 21 February 1957 and is headquartered in
Jakarta, Indonesia. PT Bank Central Asia Tbk is a subsidiary of PT Dwimuria
Investama Andalan. BCA took a big step by becoming a public company. The Initial
Share Offer took place in 2000, selling 22.55% of the shares from the divestment of
IBRA. After the Initial Share Offer, IBRA still controls 70.30% of all BCA shares. The
second stock offering took place in June and July 2001, with IBRA divesting 10% more
of its shares in BCA.
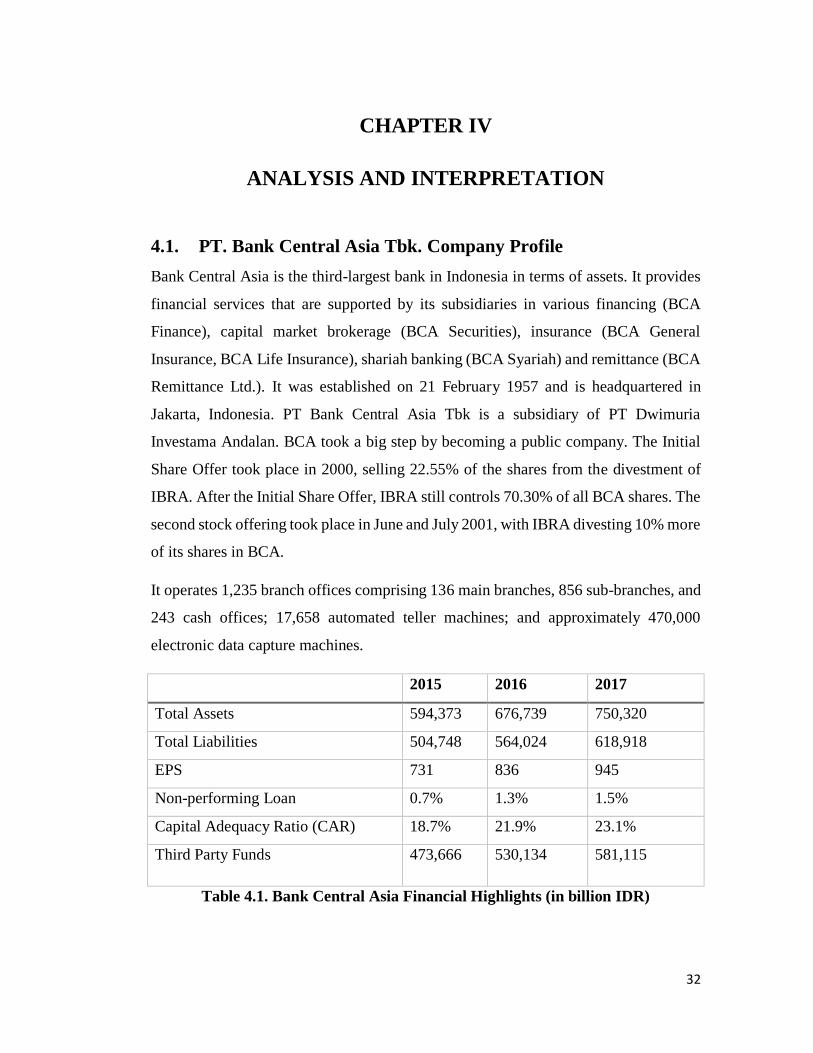
It operates 1,235 branch offices comprising 136 main branches, 856 sub-branches, and
243 cash offices; 17,658 automated teller machines; and approximately 470,000
electronic data capture machines.
2015 2016 2017
Total Assets 594,373 676,739 750,320
Total Liabilities 504,748 564,024 618,918
EPS 731 836 945
Non-performing Loan 0.7% 1.3% 1.5%
Capital Adequacy Ratio (CAR) 18.7% 21.9% 23.1%
Third Party Funds 473,666 530,134 581,115
Table 4.1. Bank Central Asia Financial Highlights (in billion IDR)
33
Source: Annual Report of Bank Central Asia, 2017
4.2. Data Analysis
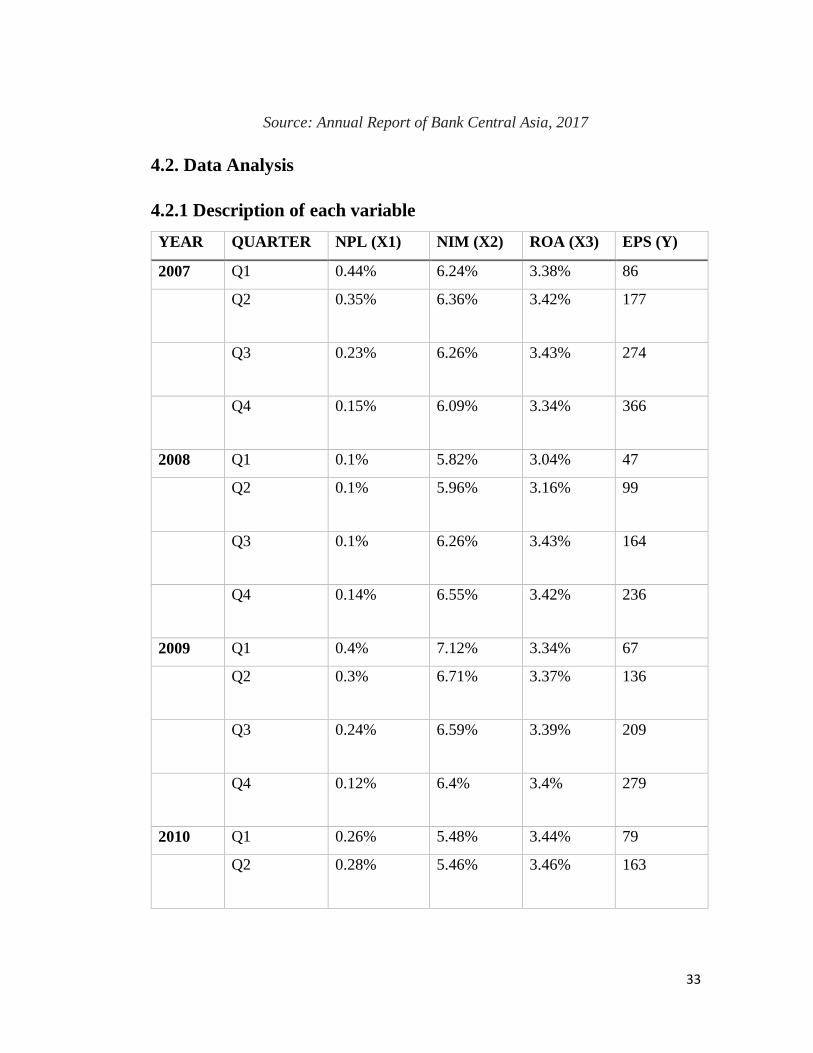
4.2.1 Description of each variable
YEAR QUARTER NPL (X1) NIM (X2) ROA (X3) EPS (Y)
2007 Q1 0.44% 6.24% 3.38% 86
Q2 0.35% 6.36% 3.42% 177
Q3 0.23% 6.26% 3.43% 274
Q4 0.15% 6.09% 3.34% 366
2008 Q1 0.1% 5.82% 3.04% 47
Q2 0.1% 5.96% 3.16% 99
Q3 0.1% 6.26% 3.43% 164
Q4 0.14% 6.55% 3.42% 236
2009 Q1 0.4% 7.12% 3.34% 67
Q2 0.3% 6.71% 3.37% 136
Q3 0.24% 6.59% 3.39% 209
Q4 0.12% 6.4% 3.4% 279
2010 Q1 0.26% 5.48% 3.44% 79
Q2 0.28% 5.46% 3.46% 163
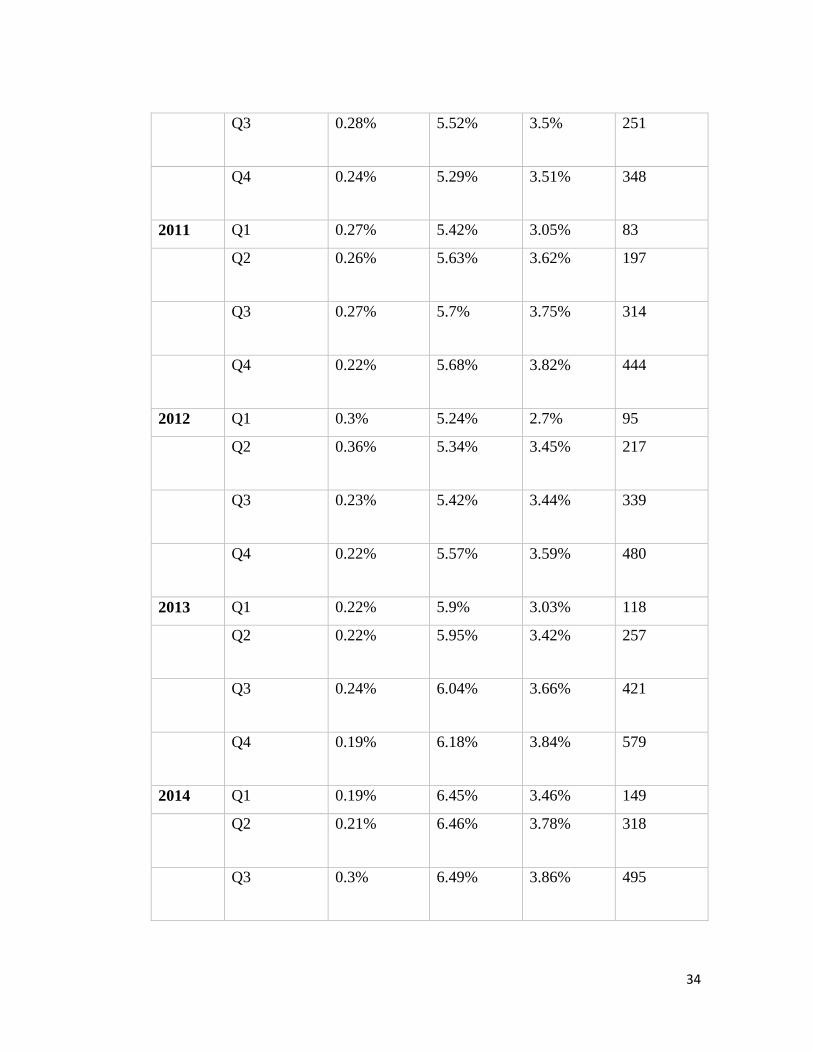
34
Q3 0.28% 5.52% 3.5% 251
Q4 0.24% 5.29% 3.51% 348
2011 Q1 0.27% 5.42% 3.05% 83
Q2 0.26% 5.63% 3.62% 197
Q3 0.27% 5.7% 3.75% 314
Q4 0.22% 5.68% 3.82% 444
2012 Q1 0.3% 5.24% 2.7% 95
Q2 0.36% 5.34% 3.45% 217
Q3 0.23% 5.42% 3.44% 339
Q4 0.22% 5.57% 3.59% 480
2013 Q1 0.22% 5.9% 3.03% 118
Q2 0.22% 5.95% 3.42% 257
Q3 0.24% 6.04% 3.66% 421
Q4 0.19% 6.18% 3.84% 579
2014 Q1 0.19% 6.45% 3.46% 149
Q2 0.21% 6.46% 3.78% 318
Q3 0.3% 6.49% 3.86% 495
35
Q4 0.22% 6.53% 3.86% 669
2015 Q1 0.23% 6.53% 3.48% 165
Q2 0.25% 6.57% 3.75% 346
Q3 0.27% 6.61% 3.86% 542
Q4 0.22% 6.72% 3.84% 731
2016 Q1 0.28% 7.04% 3.57% 183
Q2 0.35% 6.99% 3.86% 388
Q3 0.36% 6.88% 3.99% 614
Q4 0.31% 6.81% 3.96% 836
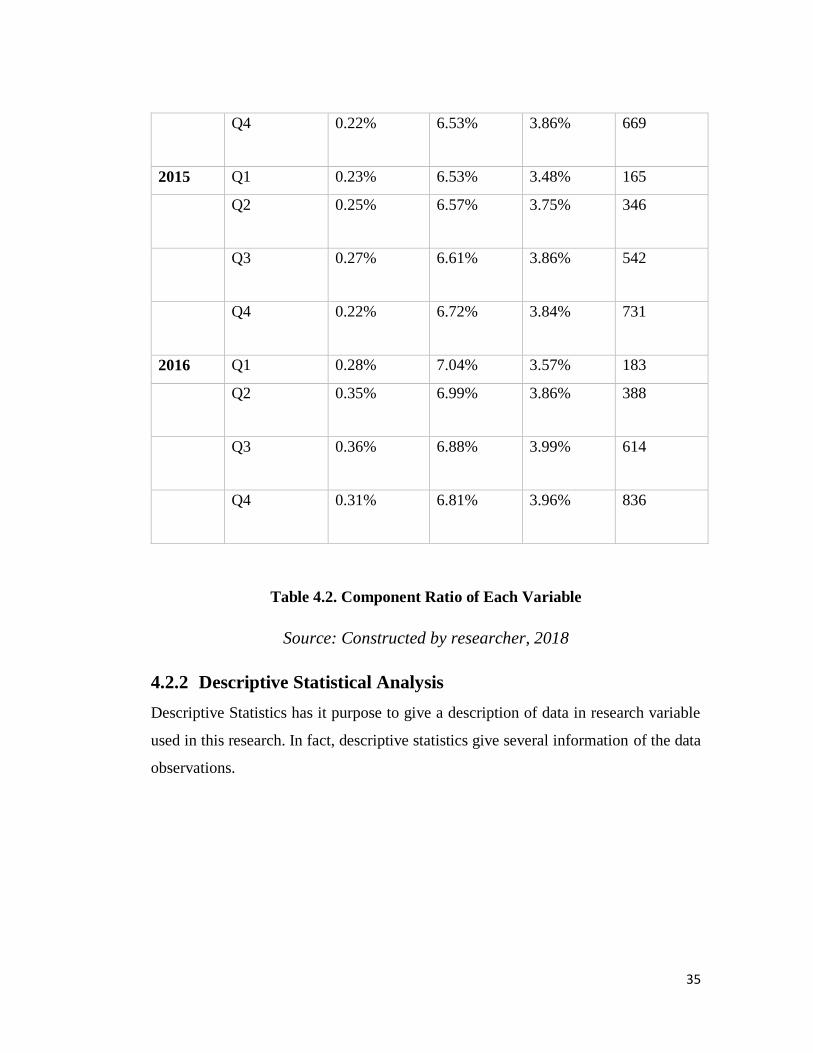
Table 4.2. Component Ratio of Each Variable
Source: Constructed by researcher, 2018
4.2.2 Descriptive Statistical Analysis
Descriptive Statistics has it purpose to give a description of data in research variable
used in this research. In fact, descriptive statistics give several information of the data
observations.
36
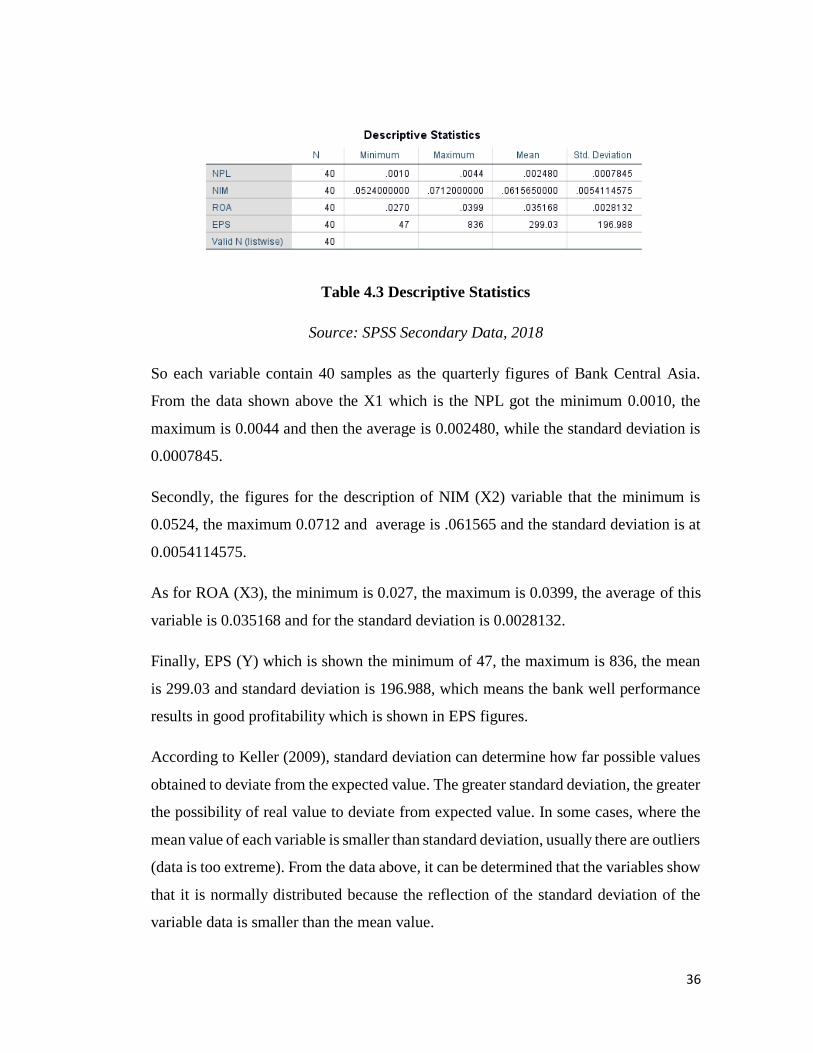
Table 4.3 Descriptive Statistics
Source: SPSS Secondary Data, 2018
So each variable contain 40 samples as the quarterly figures of Bank Central Asia.
From the data shown above the X1 which is the NPL got the minimum 0.0010, the
maximum is 0.0044 and then the average is 0.002480, while the standard deviation is
0.0007845.
Secondly, the figures for the description of NIM (X2) variable that the minimum is
0.0524, the maximum 0.0712 and average is .061565 and the standard deviation is at
0.0054114575.
As for ROA (X3), the minimum is 0.027, the maximum is 0.0399, the average of this
variable is 0.035168 and for the standard deviation is 0.0028132.
Finally, EPS (Y) which is shown the minimum of 47, the maximum is 836, the mean
is 299.03 and standard deviation is 196.988, which means the bank well performance
results in good profitability which is shown in EPS figures.
According to Keller (2009), standard deviation can determine how far possible values
obtained to deviate from the expected value. The greater standard deviation, the greater
the possibility of real value to deviate from expected value. In some cases, where the
mean value of each variable is smaller than standard deviation, usually there are outliers
(data is too extreme). From the data above, it can be determined that the variables show
that it is normally distributed because the reflection of the standard deviation of the
variable data is smaller than the mean value.
37
4.2.3 Classical Assumption Test Result
1. Normality Test
It is assumed in multiple linear regression that residuals are distributed normally to
create the validity of the data. This normality test is to determine a random variable is
normally distributed or not. It can be explained after inputting the data into SPSS , this
test can be done by producing histograms for the residual as well as normal probability
plots, in order to inspect the distribution of the residual values (Render, 2006). The
normality test should be done for every residual, especially the dependent variable.
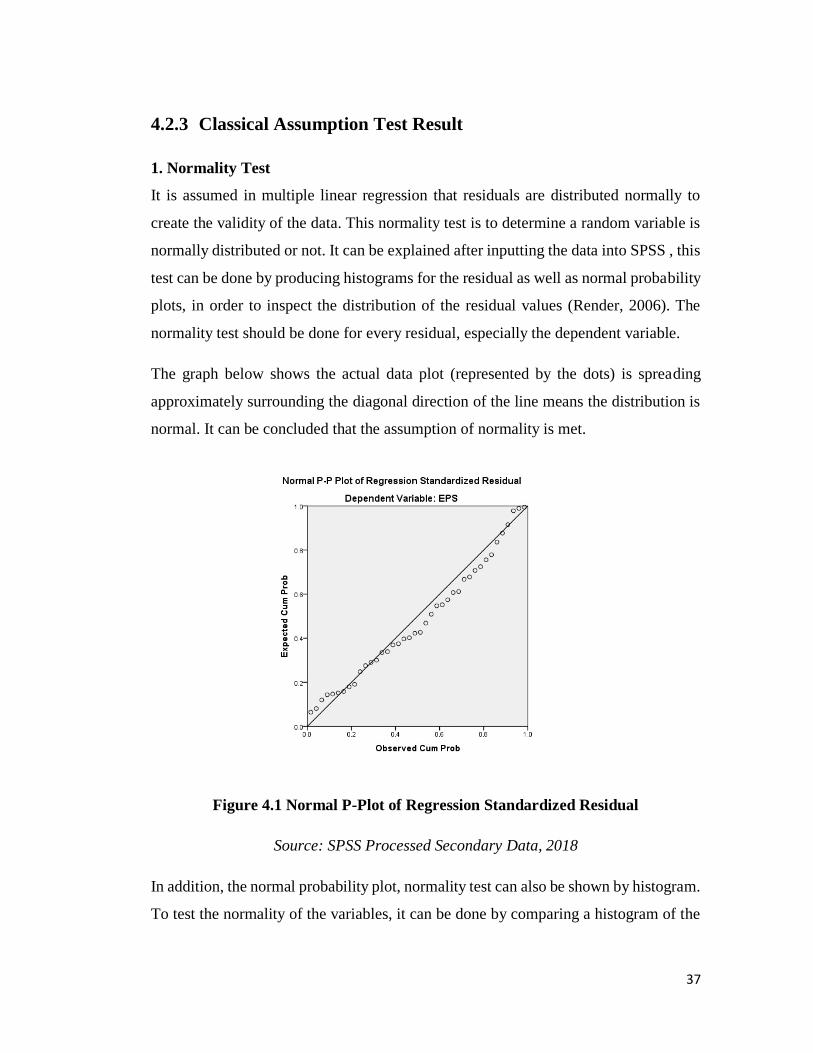
The graph below shows the actual data plot (represented by the dots) is spreading
approximately surrounding the diagonal direction of the line means the distribution is
normal. It can be concluded that the assumption of normality is met.
Figure 4.1 Normal P-Plot of Regression Standardized Residual
Source: SPSS Processed Secondary Data, 2018
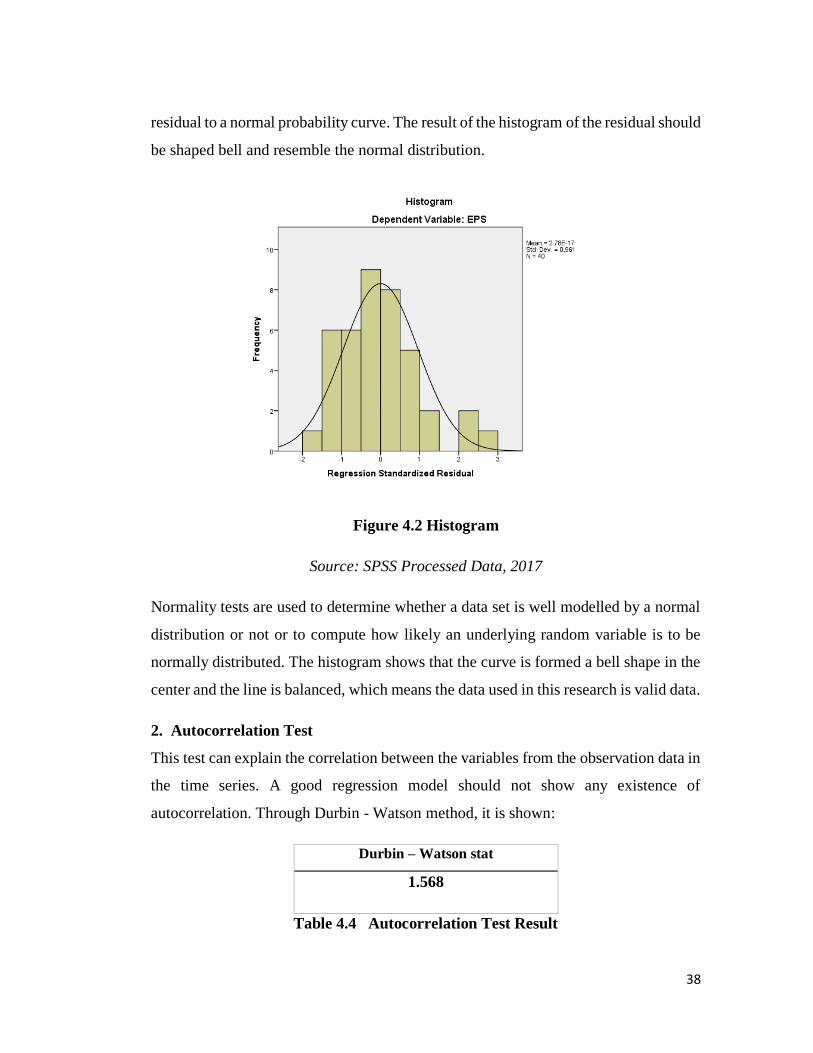
In addition, the normal probability plot, normality test can also be shown by histogram.
To test the normality of the variables, it can be done by comparing a histogram of the
38
residual to a normal probability curve. The result of the histogram of the residual should
be shaped bell and resemble the normal distribution.
Figure 4.2 Histogram
Source: SPSS Processed Data, 2017
Normality tests are used to determine whether a data set is well modelled by a normal
distribution or not or to compute how likely an underlying random variable is to be
normally distributed. The histogram shows that the curve is formed a bell shape in the
center and the line is balanced, which means the data used in this research is valid data.
2. Autocorrelation Test
This test can explain the correlation between the variables from the observation data in
the time series. A good regression model should not show any existence of
autocorrelation. Through Durbin - Watson method, it is shown:
Durbin – Watson stat
1.568
Table 4.4 Autocorrelation Test Result
39
Source: SPSS Processed Data,2017
The value of Durbin - Watson in this model is 1.568. Which is the test is acceptable
and free from autocorrelation problem.
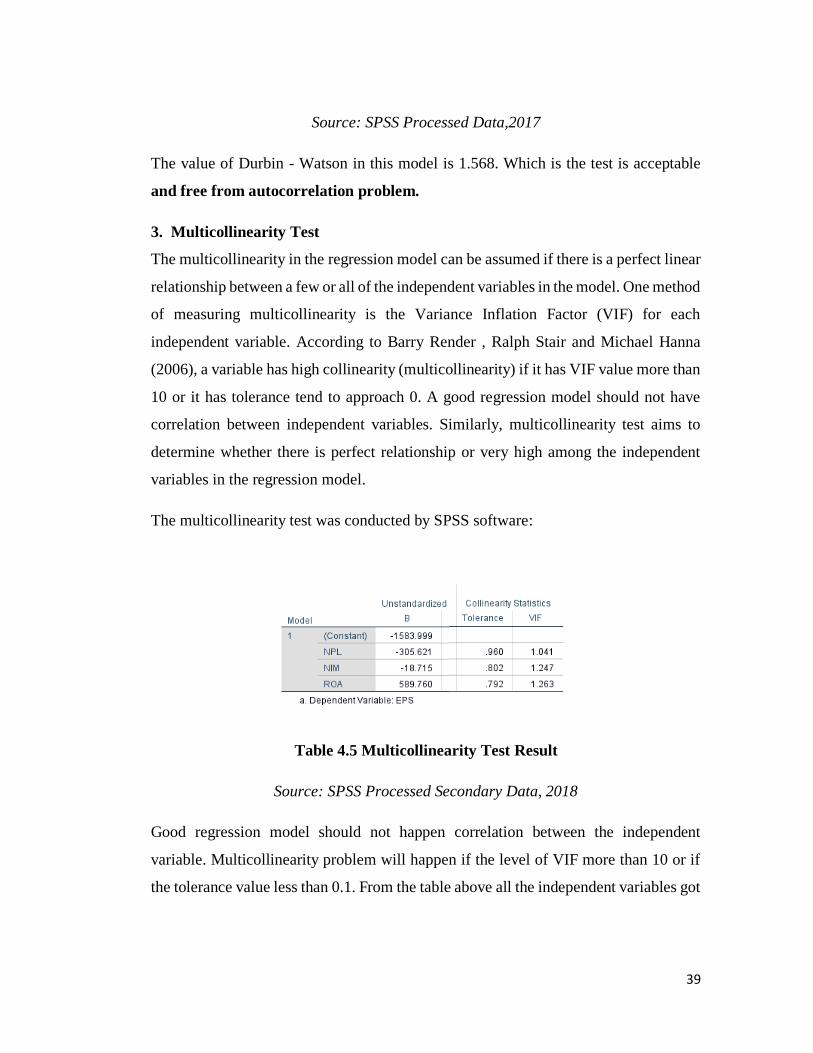
3. Multicollinearity Test
The multicollinearity in the regression model can be assumed if there is a perfect linear
relationship between a few or all of the independent variables in the model. One method
of measuring multicollinearity is the Variance Inflation Factor (VIF) for each
independent variable. According to Barry Render , Ralph Stair and Michael Hanna
(2006), a variable has high collinearity (multicollinearity) if it has VIF value more than
10 or it has tolerance tend to approach 0. A good regression model should not have
correlation between independent variables. Similarly, multicollinearity test aims to
determine whether there is perfect relationship or very high among the independent
variables in the regression model.
The multicollinearity test was conducted by SPSS software:
Table 4.5 Multicollinearity Test Result
Source: SPSS Processed Secondary Data, 2018
Good regression model should not happen correlation between the independent
variable. Multicollinearity problem will happen if the level of VIF more than 10 or if
the tolerance value less than 0.1. From the table above all the independent variables got

40
tolerance value above 0.1 and VIF is far below 10, so the result there is no
multicollinearity problem.
3. Heteroscedasticity Test
Heteroscedasticity test of the regression model is to measure that whether the
disturbance variance is constant, or homogenous, across observation. The result of the
test can be seen by looking at the distribution of residual values toward the predicted
values in the scatterplot. If the distribution spread randomly and does not make any
systematic such as increasing or decreasing pattern, then the heteroscedasticity
assumption is fulfilled.
Figure 4.2. Scatterplot
Source: SPSS Processed Secondary Data, 2018
From the scatterplot graph above, it can be concluded that this is heteroscedasticity in
nature because the plots are spreading throughout the figures are very clear. However,
the graph also shows a random dispersion around zero. It means that the T-test and F-

41
test are accurate and valid, and this regression model is eligible to predict the EPS based
on the independent variables.
4.2.3 Multiple Regression Analysis
In the multiple regression this research test the hypothesis by using the T-test, F-Test
and R Square. All the variables using in this regression model such as NPL, NIM &
ROA as the independent variable and for the dependent variable EPS.
Table 4.6 Coefficients
Source: SPSS Processed Secondary Data, 2018
Based on table above the multiple regression equation becomes as follow:
EPS = -1583.999 - 305.621NPL - 18.715NIM + 589.760ROA + e
From the data above the multiple regression can be explained:
1. Coefficient Variable NPL= -305.621 means that in every 1 unit increase of NPL
will cause the decrease of EPS by 305.621, with the assumption that
independent variables are constant.
2. Coefficient variable NIM = -18.715 means that in every 1 unit increase of NIM
will cause the decrease of EPS by 18.715, with assumption that independent
variables are constant.
3. Coefficient variable ROA = 589.760 means that in every 1 unit increase of ROA
will cause the increase of EPS bt 589.760, with assumption that independent
variables are constant.
42
From the explanation of multiple regression above, then researcher will be testing
the hypothesis both partially and simultaneously.
4.2.4 Goodness or Fit Test
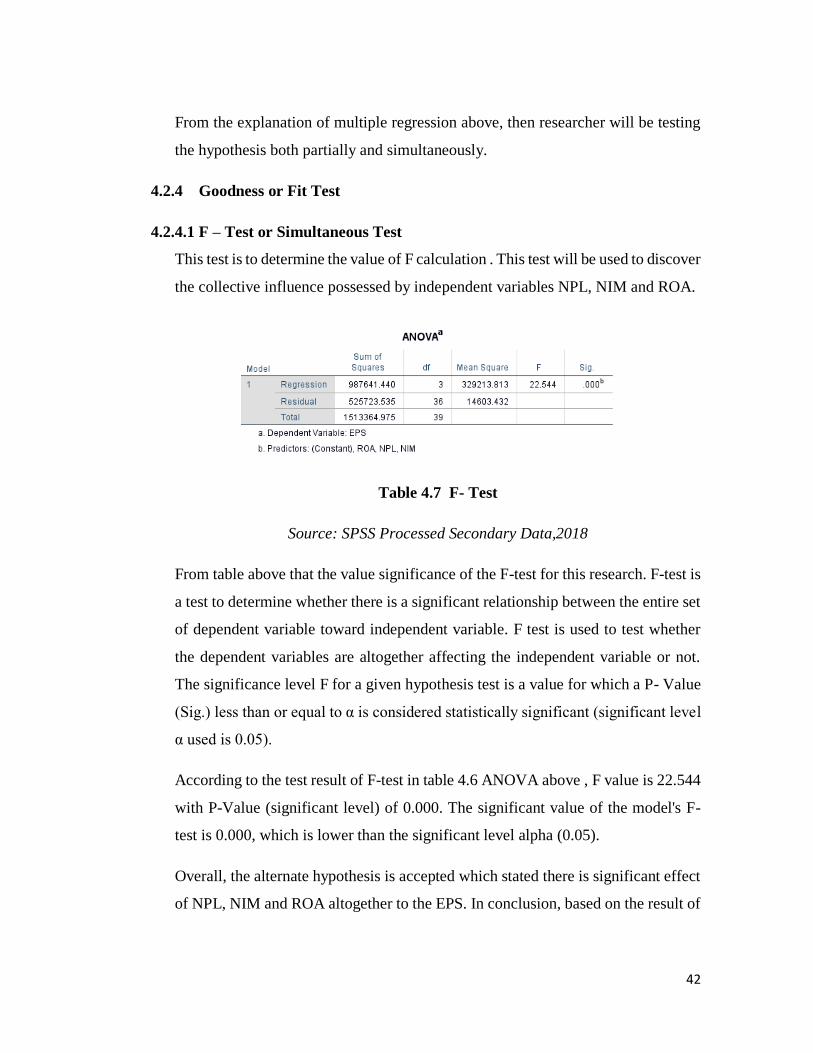
4.2.4.1 F – Test or Simultaneous Test
This test is to determine the value of F calculation . This test will be used to discover
the collective influence possessed by independent variables NPL, NIM and ROA.
Table 4.7 F- Test
Source: SPSS Processed Secondary Data,2018
From table above that the value significance of the F-test for this research. F-test is
a test to determine whether there is a significant relationship between the entire set
of dependent variable toward independent variable. F test is used to test whether
the dependent variables are altogether affecting the independent variable or not.
The significance level F for a given hypothesis test is a value for which a P- Value
(Sig.) less than or equal to α is considered statistically significant (significant level
α used is 0.05).
According to the test result of F-test in table 4.6 ANOVA above , F value is 22.544
with P-Value (significant level) of 0.000. The significant value of the model's F-
test is 0.000, which is lower than the significant level alpha (0.05).
Overall, the alternate hypothesis is accepted which stated there is significant effect
of NPL, NIM and ROA altogether to the EPS. In conclusion, based on the result of
43
F-test, it can be stated there is altogether effect of NPL,NIM and ROA to the EPS
of PT. Bank Central Asia Tbk (BCA) during 10 years from 2007 to 2016.
4.2.4.2 T - test
Based on the table 4.5 Coefficients above can be explained that the partial test or T
–test is used to measure the influence of each independent variable toward the
dependent variable. If the level of signifcance is 0.05, the Ha will be accepted. And
if the level of significance more than 0.05 the H0 will be accepted. The hypothesis
for T-test can be shown below:
T-test is used to analyze the partial relationship between each of independent
variables (coefficient) to the dependent variable. The significance level T for a
given hypothesis test is a value for which a P-value (sig.) less than or equal to α is
probability value, if the level of significant lower than 0.05 or 5% so the hypothesis
is accept or significant, just the opposite if the value of significant higher than 0.05
or 5% so the hypothesis will be reject or does not significant.
a. Non – Performing Loans (NPL)
According to the table 4.5 coefficient above, p-value of t-statistics 0.23 > 0.05. It
means that NPL does not have a significant effect to the EPS. Thus, researcher
reject the alternate hypothesis (Ha) and accept null hypothesis (H0). It means there
is no significant impact of NPL (X1) toward EPS (Y).
b. Net Interest Margin (NIM)
P-value (sig.) of NIM is 0.622 which is higher than α. It means that NIM doesn't
significantly affect the EPS. Therefore, researcher conclude to reject the null
hypothesis (H0) and accept alternate hypothesis (Ha). It means there is no
significant effect of NIM (X2) toward EPS (Y).
c. Return on Assets (ROA)
44
P-value of ROA is 0.000 which is lower than α (0.05 or P-value <0.05). It means
that on partially, ROA signifcantly affects the EPS. Therefore, researcher conclude
to accept the alternate hypothesis (Ha) and reject null hypothesis (H0). It means
there is a significant effect of NIM (X3) toward EPS (Y).
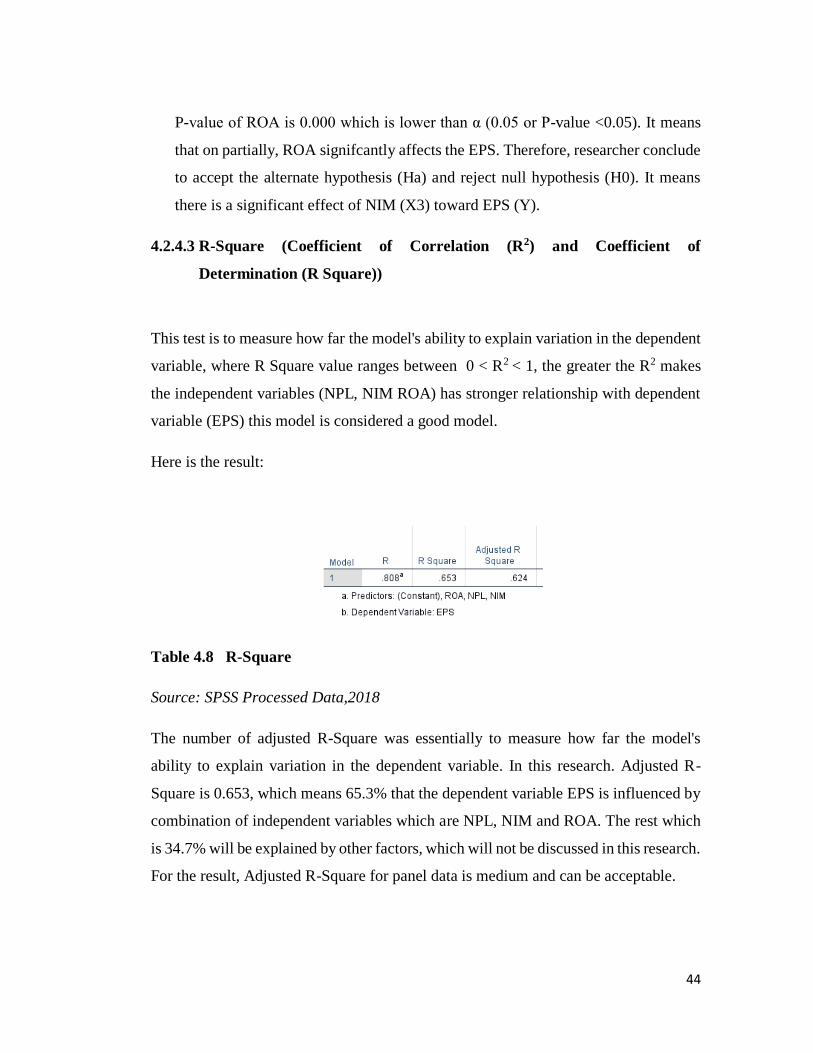
4.2.4.3 R-Square (Coefficient of Correlation (R2) and Coefficient of
Determination (R Square))
This test is to measure how far the model's ability to explain variation in the dependent
variable, where R Square value ranges between 0 < R2 < 1, the greater the R2 makes
the independent variables (NPL, NIM ROA) has stronger relationship with dependent
variable (EPS) this model is considered a good model.
Here is the result:
Table 4.8 R-Square
Source: SPSS Processed Data,2018
The number of adjusted R-Square was essentially to measure how far the model's
ability to explain variation in the dependent variable. In this research. Adjusted R-
Square is 0.653, which means 65.3% that the dependent variable EPS is influenced by
combination of independent variables which are NPL, NIM and ROA. The rest which
is 34.7% will be explained by other factors, which will not be discussed in this research.
For the result, Adjusted R-Square for panel data is medium and can be acceptable.

45
4.3. Interpretation of Results
The data that input in SPSS based on the quarterly period of PT. Bank Central Asia
Tbk. Starting 2007 –2016. From the data analysis above which already done by
research using SPSS about NPL, NIM and ROA as the independent variables towards
EPS as dependent variable. So the result can be interpreted as follows:
4.3.1 The influence of Non-Performing Loan (NPL) towards Earning Per Share
(EPS)
From the descriptive statistic data that mentioned above the variable NPL , the mean is
0.2480% and the standard deviation the standard deviation is 0.07845% which means
that the deviation data for this variable is good. Based on the result of T-test can be
explained that the variable NPL towards EPS shows the t result is –1.214, the
coefficient regression is –1.22 and the significance level is 0.233 which is higher than
0.05. Therefore, the result can determine that NPL negatively correlated with EPS &
doesn't have significant effect towards the EPS of PT. Bank Central Asia Tbk.
According the result of this research the less NPL ratios the better the EPS ratio and
vice versa since it means less credit risk lead to higher earning.
4.3.2 The influence of NIM towards EPS
Based on the result of t-test can be explained that the variable NIM towards EPS shows
the t result –0.469 and significance level is 0.642 which is higher than 0.05, so NIM
have insignificant negative effect towards the EPS in PT. Bank Central Asia Tbk.
Hence, this research can be explained that NIM ratio have insignificant negative
correlation can be accepted. The less NIM means the more effective bank placed their
assets in form of credit. This finding is in line with the research of Ho & Saunders
(1981) which showed that NPL doesn't affect the profitability of bank which is reflected
by EPS.
4.3.3 The influence of ROA towards EPS
Based on the result of t-test can be explained that the variable ROA towards EPS shows
the t result 7.630 the coefficient regression is 0.842 and significance level is 0.000
46
which is lower than 0.05, so ROA have a positive and significant effect towards the
EPS in PT Bank Central Asia Tbk. ROA has a positive influence toward EPS, means
every 1% increases would derive increasing EPS value. Hence, this research can be
explained that ROA ratio has a significant positive correlation can be accepted.
The finding is bank able to generate earning efficiently using asset owned. ROA has a
positive influence toward EPS, in other word ROA influence the profitability of the
bank which is reflected by EPS.
4.3.4 The influence of NPL, NIM & ROA towards EPS.
Based on F test result, it shows that the value of significance is 0.000. It means that is
lower than 0.05. Hence, it can be interpreted that NPL, NIM and ROA has a significant
influence to EPS simultaneously.
According to the researcher before all the independent variables that in simultaneously
influence to the EPS, this research shows that all the dependent variables have a strong
influence to the independent variable and it have been proved and accepted that the
Earning Per Share cannot be separated or cannot be done well unless those variables
are really influence it.
47
CHAPTER V
CONCLUSION AND RECOMMENDATION
5.1. Conclusion
This research is entitled Analysis of the influence of Non-Performing Loans (NPL),
Net Interest Margin (NIM), and Return on Assets (ROA) toward Earning Per Share
(EPS) of Commercial Bank in Indonesia (A study case of PT. Bank Central Asia Tbk.
Period 2007 –2016). In this research, researcher used four variables included NPL,
NIM, ROA and EPS. Based on the analysis result and discussion on chapter IV, data
analysis and interpretation of result, the conclusion could be drawn as follows:
1. According the result of this research the less NPL ratios the better the EPS ratio
and vice versa since it means less credit risk lead to higher earning.
2. This research can be explained that less NIM means the more effective bank
placed their assets in form of credit.
3. The finding is bank able to generate earning efficiently using asset owned. ROA
has a positive influence toward EPS, in other word ROA influence the
profitability of the bank positively which is reflected by EPS..
4. Based on simultaneously testing using F-test. It can be concluded that all
independent variables altogether have significant simultaneous influence to the
dependent variable which is EPS. NPL, NIM & ROA influence 65.3% of EPS
ratio which is a strong influence.
5.2 Recommendation
1. To PT. Bank Central Asia (BCA) Tbk.
The bank may reconsider to see the influence of variables including NPL, NIM and
ROA toward EPS. Because of the importance of EPS, investors will consider to
48
invest after see EPS and other financial reports. Hence, the bank should give clearly
ratio of EPS in financial report. In other hand, NPL, NIM and ROA are factors that
will affect to EPS, so they are important metrics in the eye of investor.
2. To the future researcher
For the future researcher are expected to research more specifically to the other
variables that are not include or unsolved by the researcher. Perhaps on the next
research taken by other researcher that also can improve the quality of the research
which is the time period could be longer and also can compare from other bank not
only focus on one bank.

49
BIBLIOGRAPHY
BOOKS
Keown, A., Martin , J.D. , Petty , J.W., Scott ,D.F. Jr. . Financial Management:
Principles and Applications .Pearson Prentice Hall, 2004 – pg.457.
Berenson, M. L., Levine, D. M. , & Krehbiel , T.c. (2009). Basic Business Statistic :
Concepts and Applications 5th Edition. New Jersey : Pearson Prentice Hall.
Barry, R., Stair R. M., Jr., Hanna, M. E.(2006). Quantitative Analysis For
Management. New Jersey : Pearson Education, Inc.
Berge T.O & Boye K.G. (2007). An Analysis of Banks Problem Loans. USA: McGraw-
Hill.
Boz,I. T., Yigit, I. & Anil, I (2013). 9th International Strategic Management Conference.
The relationship between diversification strategy and organizational
performance: A research intended for comparing Belgium and Turkey, 997-
1006.
Bringham, E.F. & Ehrhardt, M.C. (2005). Financial Management: 3rd Edition.
Australia, Alice Springs: Thomson Publishers.
Balnaves & Caputi (2001) Introduction to Quantitative Research Methods :An
Investigative Approach . Sage Publishing.
Collins, D., M., Pincus, & H. Xie (1999). Equity valuation and negative earnings: The
role of book value of equity.
Levine, D. M. , Krehbiel T. C. & Berenson ,M. L. (2009). Business Statistics (6th
Edition). Pearson Inc.
Dendawijaya & Lukman (2005). Manajemen Perbankan . Bogor : Ghalia Indonesia.
Eakins, G.S. (2008). Financial Markets and Institutions. 3rd Edition. USA, Beverly
Hills: Sage Publication.
Gallagher, T.J., & Andrew, J.D. (2007). Financial Management: Principles and
50
Practice. The United States of American: Freeload Press.
Keller, G. (2009). Statistics For Management. Cengage Learning.
Kasmir (2014). Analisis Laporan Keuangan . 1st Edition. 7th Print. Jakarta: PT Raja
Grafindo Persada.
Lind, D. M., & Wathen, S. (2010). Basic Statistics for business and economics.
McGraw Hill Education.
Lynch, D. (2007). The Art and Science of Financial Management. (Quality in the
finance function). New York : Longman Inc.
Malhotra & Peterson. (1996). Methodological Issues in Cross-culture Marketing
Research. International Marketing Review, Vol.14 (5) 7-43.
Mujis, D. (2011). Doing Quantitative Research in Education with SPSS. London:
SAGE Publication, Ltd.
Ohlson (1995). Earnings, book value and dividends in equity valuation. Contemporary
Accounting Research 11, 661-689.
Sekaran, U., Bougie, R.(2010). Research Methods for Business: A Skill Building
Approach, 5th Edition.
Journal Articles / Working Papers
Anas, E., Mounira ,B.A. (2008). Managing Risks and Liquidity in an Interest Free
Banking Framework, the Case of the Islamic Banks. International Journal of
Business and Management, Vol.3 page 7-30.
Babihuga, R. (2007). Macroeconomic and Financial soundness indicators: An
Empirical investigation, IMF working paper. No.115.
Barr, R. L. Seiford & T. Siems. (1994). Forecasting Banking Failure : A Non-
51
Parametric Frontier stimation Approach. Researches Economiquies de
Lovvain (60), 417-429.
Berger, Allen N. & Robert De Young. (1997). Problem Loans and Cost of Efficiency
in Commercial Banks. Journal of Banking and Finance , Vol.21.
Chen, P.,& G., Zhang. (2007). How do accounting variables explain stock price
movement – Theory and Evidence. Journal of Accounting and Economics, 43
(2-3):219-244
Collins, D., & Kothari, S.P. (1989). An analysis of cross-sectional and intertemporal
determinants of earnings response coefficients. Journal of Accounting and
Economics , 26, (1-3) 1-34.
Dechow (1999). An Empirical Assessment of Residual Income Valuation Model.
Journal of Accounting and Economics, 26, (1-3) 1-34.
Harrison, J.L. & Morton, A. (2010), Adjusted earnings: an initial investigation of EPS
disclosures in annual reports, Euro-Mediterranean Economics and Finance
Review, vol. 5, no. 2, pp. 62-74.
Ho & Saunders. (1981). The Determinants of Bank Interest Margins : Theory and
Empirical Evidence. Journal of financial and Quantitative Analysis, 16, no. 4:
581-600.
Kwan, Simon & Robert, E. (1994). An Analysis of Inefficiencies in Banking : A
Stochastic Cost Frontier Approach.
Uyangoda, J. (2011). Writing Research Proposals in the Social Sciences and
Humanities: A theoretical and practical guide. Colombo: Social Scientists's
Association.
52
Kugiel, Lukasz (March 2009). Fund Transfer Pricing in a Commercial Bank. MSc in
Finance and International Business. Aarhus School of Business. Page 12.
Miller, M., Modigliani, F. (1961). Dividend policy, Growth and the Valuation of
Shares. Journal of Business, no 4 Vol 35 1961, p 412-433.
Ming, C. Lee, Pham & H.Y. Chen(2016). Factors affect NPL in Taiwan Banking
Industry, Journal of Accounting, Finance and Economics Vol. 6. No. 1. March
2016. Pp. 65 – 87.
Olalekan, Asikhia (2013). Capital Adequacy and Bank Profitability : An Empirical
Evidence from Nigeria. American International Journal of Contemporary
Research. Volume 3, page 88.
Resti & Andrea (1995).Linear Programming and Econometric Methods for Bank
Efficiency Evaluation: An Empirical Comparison Based on a Panel of Italian
Banks.
Riyadi. (2004) . Banking Asset & Liability Management. Lembaga Penerbit Fakultas
Ekonomi, Universitas Indonesia, Edisi ke-2 : Jakarta.
Mihaljek, Hawkins, J. & Dubravko (2009). The banking industry in the emerging
market economies: competition, consolidation and systemic stability – an
overview. Journal name : BIS papers.
Uyangoda, J., (2011). Writing Research Proposals in the Social Sciences and
Humanities: A theoretical and practical guide. Colombo: Social Scientists's
Association.
Reports
Bank Indonesia. (2007). The Indonesian Economy in 2007. Indonesia: Bank Indonesia.
53
Bank Indonesia. (2008). The Indonesian Economy in 2008. Indonesia: Bank Indonesia.
Bank Indonesia. (2009). The Indonesian Economy in 2009. Indonesia: Bank Indonesia.
Bank Indonesia. (2010). The Indonesian Economy in 2010. Indonesia: Bank Indonesia.
Bank Indonesia. (2011). The Indonesian Economy in 2011. Indonesia: Bank Indonesia.
Bank Indonesia. (2012). The Indonesian Economy in 2012. Indonesia: Bank Indonesia.
Bank Indonesia. (2013). The Indonesian Economy in 2013. Indonesia: Bank Indonesia.
Bank Indonesia. (2014). The Indonesian Economy in 2014. Indonesia: Bank Indonesia.
Bank Indonesia. (2015). The Indonesian Economy in 2015. Indonesia: Bank Indonesia.
Bank Indonesia. (2016). The Indonesian Economy in 2016. Indonesia: Bank Indonesia.
Bank Indonesia. (2017). The Indonesian Economy in 2017. Indonesia: Bank Indonesia
Guy, K. (2010). Non-Performing Loans. Economic Review, Volume XXXVII,
Number 1 pg. 9.
Indrawati, S.M. (2008). Keynote Speech of the Minister of Finance for the Oxford
University Global Economic Governance Lecture.
Low, A. (1997). Indonesian Banking: An Exercise in Reregulation Deregulation.
(p.39.).
Websites / Electronic Sources
Bollard, C.H. (2011, August 6). The role of banks in the economy – improving the
performance of the New Zealand banking system after the Global Financial
Crisis. Retrieved from Reserve Bank of New Zealand :
http://www.rbnz.govt.nz/reseearch_and_publications/speeches/2011/4487002.
html
54
Bachtiar (2014). Financing and Control of Palm Oil and Sustainable Finance in
Indonesia. Retrieved from:
http://www.tuk.or.id/wp-content/uploads/2015/07/Rekomendasi-
Kebijakan-Sustainable-Finance.pdf
Evans, B. (2014, August 13). Banking on Banks. Retrieved from
ADVISORPERSPECTIVES:
http://www.advisorperspectives.com/commentaries/heartland_081314.php
Friedman, M. (1970), Social Responsibility of Business, The New York Times,
September 13, 1970; reprinted in An Economist Protest, New-Jersey: Thomas
Horton and Co,(1972). https://www.gla.ac.uk/media/media_292782
Goyal, R. (2014). Define what is banking? Definition of Banking, Basics of Banking.
Banking for dummies. Retrieved from AllBankingSolution.com:
http://www.allbankingsolutions.com/banking-tutor/what-is-banking.shtml.
Health Indicators of Banks and Financial Ratios. (2013, December 13). Retrieved
from:http://businessreview-article.blogspot.com/p/about-me.html.
Jeanne Gobat (2012). Back to Basics: What Is a Bank? -- Back to Basics, Finance . IMF
.http://www.imf.org/external/pubs/ft/fandd/2012/03/basics.html.
Jagran Josh. (2012, November 3). What is Bank: Introduction & Features. Retrieved
from JAGRAN JOSH – Simplifying Test Prep: http://www.quora.com/What-
are-the-financial-ratios-that-every-investor-should-know-about.
55
Ratios,R.(2012). ReadyRatios. Retrieved from readyratios.com:
http://www.readyratios.com/reference/accounting/earnings_per_share_eps.ht
ml.
Streissguth, T. (2014). The Difference Between a Return on Assets & Earnings per
Share. Retrieved from The Motley Fool:
http://wiki.fool.com/The_Difference_Between_a_Return_on_Equity_%26_Ea
rnings_per_Share_#Earnings_Per_Share.
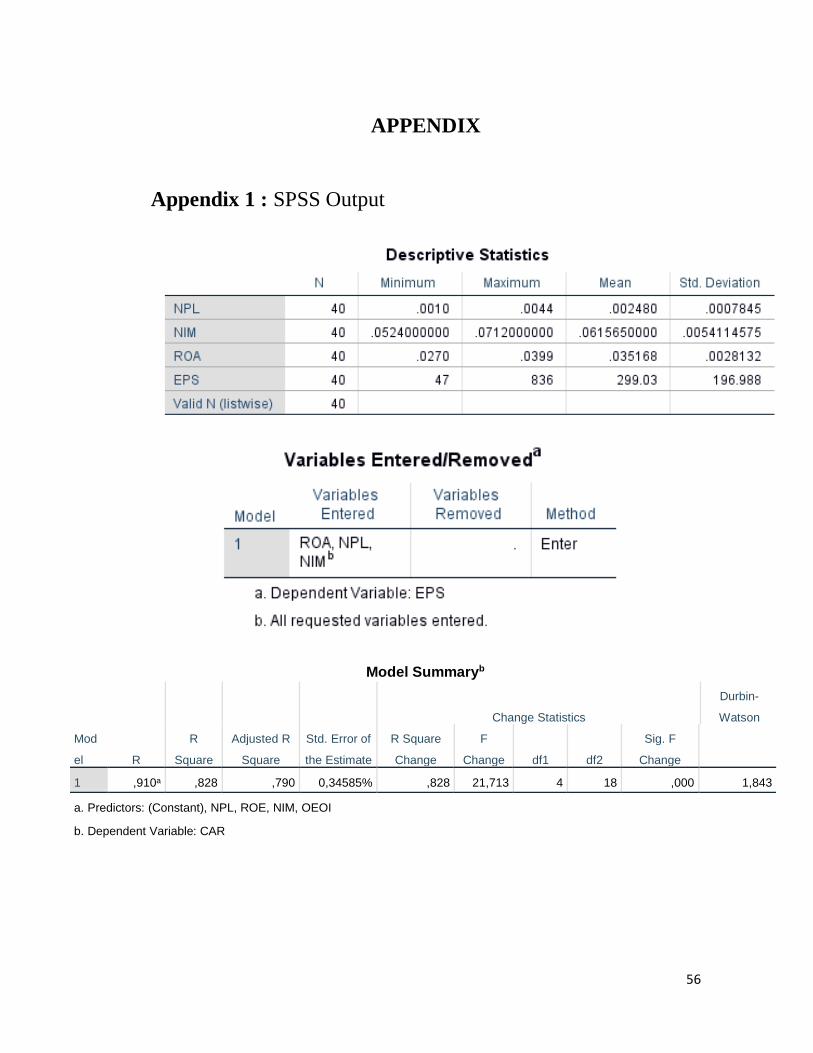
56
APPENDIX
Appendix 1 : SPSS Output
Model Summaryb
Mod
el R
R
Square
Adjusted R
Square
Std. Error of
the Estimate
Change Statistics
Durbin-
Watson
R Square
Change
F
Change df1 df2
Sig. F
Change
1 ,910a ,828 ,790 0,34585% ,828 21,713 4 18 ,000 1,843
a. Predictors: (Constant), NPL, ROE, NIM, OEOI
b. Dependent Variable: CAR
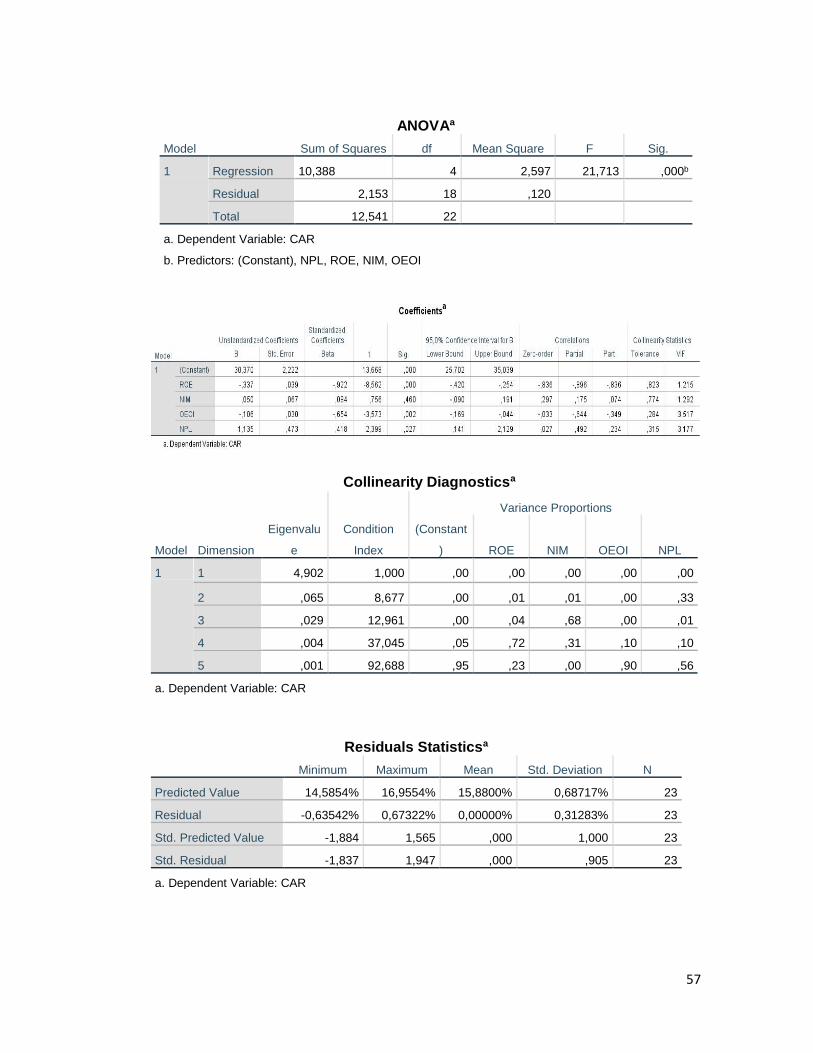
57
ANOVAa
Model Sum of Squares df Mean Square F Sig.
1 Regression 10,388 4 2,597 21,713 ,000b
Residual 2,153 18 ,120
Total 12,541 22
a. Dependent Variable: CAR
b. Predictors: (Constant), NPL, ROE, NIM, OEOI
Collinearity Diagnosticsa
Model Dimension
Eigenvalu
e
Condition
Index
Variance Proportions
(Constant
) ROE NIM OEOI NPL
1 1 4,902 1,000 ,00 ,00 ,00 ,00 ,00
2 ,065 8,677 ,00 ,01 ,01 ,00 ,33
3 ,029 12,961 ,00 ,04 ,68 ,00 ,01
4 ,004 37,045 ,05 ,72 ,31 ,10 ,10
5 ,001 92,688 ,95 ,23 ,00 ,90 ,56
a. Dependent Variable: CAR
Residuals Statisticsa
Minimum Maximum Mean Std. Deviation N
Predicted Value 14,5854% 16,9554% 15,8800% 0,68717% 23
Residual -0,63542% 0,67322% 0,00000% 0,31283% 23
Std. Predicted Value -1,884 1,565 ,000 1,000 23
Std. Residual -1,837 1,947 ,000 ,905 23
a. Dependent Variable: CAR
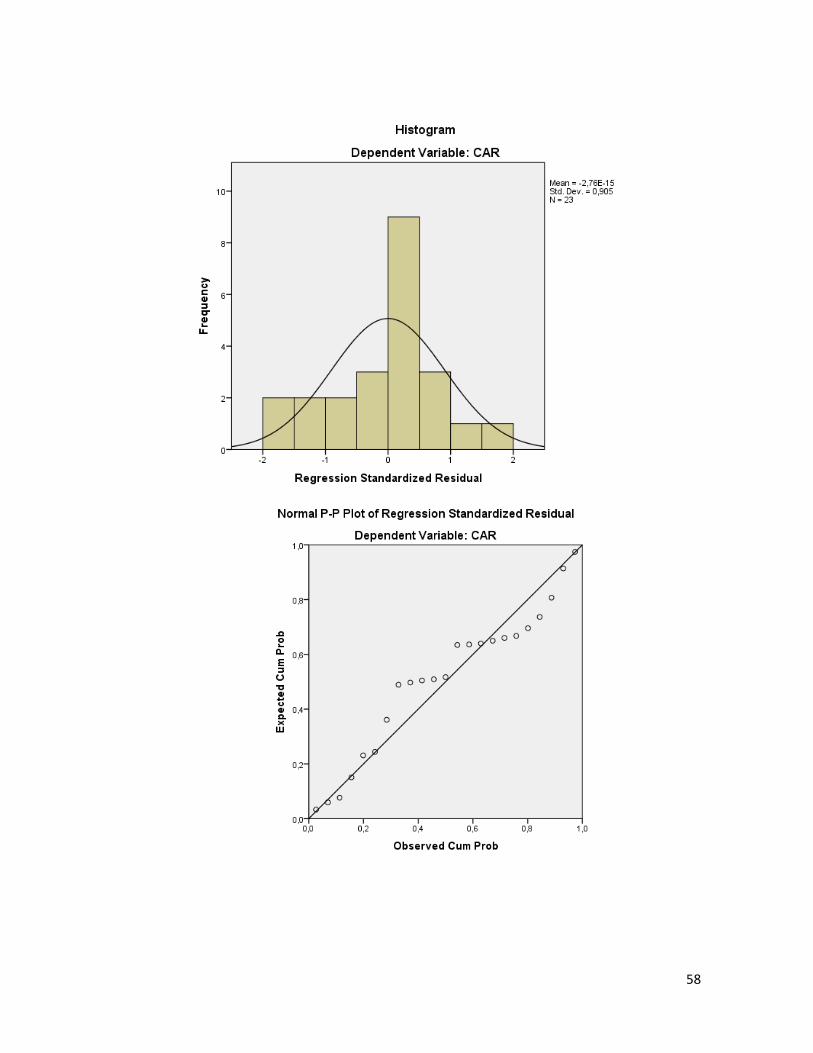
58

59
Appendix 2 : Quarterly report of PT. Bank Central Asia Tbk.
starting from 2007-2016.
YEAR QUARTER NPL (X1) NIM (X2) ROA (X3) EPS (Y)
2007 Q1 0.44% 6.24% 3.38% 86
Q2 0.35% 6.36% 3.42% 177
Q3 0.23% 6.26% 3.43% 274
Q4 0.15% 6.09% 3.34% 366
2008 Q1 0.1% 5.82% 3.04% 47
Q2 0.1% 5.96% 3.16% 99
Q3 0.1% 6.26% 3.43% 164
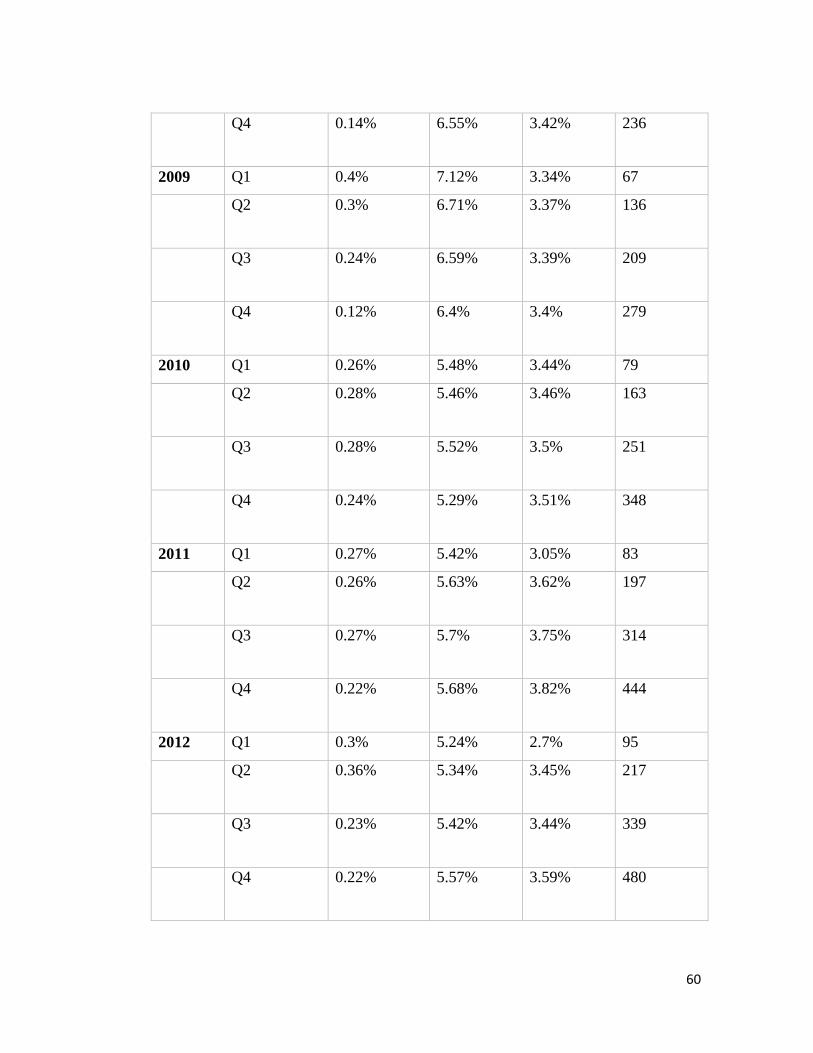
60
Q4 0.14% 6.55% 3.42% 236
2009 Q1 0.4% 7.12% 3.34% 67
Q2 0.3% 6.71% 3.37% 136
Q3 0.24% 6.59% 3.39% 209
Q4 0.12% 6.4% 3.4% 279
2010 Q1 0.26% 5.48% 3.44% 79
Q2 0.28% 5.46% 3.46% 163
Q3 0.28% 5.52% 3.5% 251
Q4 0.24% 5.29% 3.51% 348
2011 Q1 0.27% 5.42% 3.05% 83
Q2 0.26% 5.63% 3.62% 197
Q3 0.27% 5.7% 3.75% 314
Q4 0.22% 5.68% 3.82% 444
2012 Q1 0.3% 5.24% 2.7% 95
Q2 0.36% 5.34% 3.45% 217
Q3 0.23% 5.42% 3.44% 339
Q4 0.22% 5.57% 3.59% 480

61
2013 Q1 0.22% 5.9% 3.03% 118
Q2 0.22% 5.95% 3.42% 257
Q3 0.24% 6.04% 3.66% 421
Q4 0.19% 6.18% 3.84% 579
2014 Q1 0.19% 6.45% 3.46% 149
Q2 0.21% 6.46% 3.78% 318
Q3 0.3% 6.49% 3.86% 495
Q4 0.22% 6.53% 3.86% 669
2015 Q1 0.23% 6.53% 3.48% 165
Q2 0.25% 6.57% 3.75% 346
Q3 0.27% 6.61% 3.86% 542
Q4 0.22% 6.72% 3.84% 731
2016 Q1 0.28% 7.04% 3.57% 183
Q2 0.35% 6.99% 3.86% 388
Q3 0.36% 6.88% 3.99% 614
Q4 0.31% 6.81% 3.96% 836
Source : Financial Statement of PT. Bank Central Asia , constructed by researcher