Embed Size (px)
Citation preview

The Influence of Online Sales Promotion and Online Service Quality
toward Youth Customer Satisfaction that impacts
on Online Customer Loyalty at Lazada.com
By :
Siti Nurma Faujiah
1113081100010
MANAGEMENT DEPARTEMENT
INTERNATIONAL CLASS PROGRAM
THE FACULTY OF ECONOMICS AND BUSINESS
SYARIF HIDAYATULLAH STATE ISLAMIC UNIVERSITY
JAKARTA
1438H/2017M

i
THE INFLUENCE OF ONLINE SALES PROMOTION AND
ONLINE SERVICE QUALITY TOWARD YOUTH CUSTOMER
SATISFACTION THAT IMPACTS ON ONLINE CUSTOMER
LOYALTY AT LAZADA.COM
Undergraduate Thesis
Submitted to Faculty of Economics and Business in Partial Fulfilment of the
Requirements
For Acquiring Bachelor Degree of Economics
By:
Siti Nurma Faujiah
1113081100010
Under the supervision of
Cut Erika Ananda Fatimah, S.E., MBA
NIDN: 0318107403
DEPARTMENT OF MANAGEMENT
INTERNATIONAL CLASS PROGRAM
FACULTY OF ECONOMICS AND BUSINESS
SYARIF HIDAYATULLAH STATE ISLAMIC UNIVERSITY
JAKARTA
1438H/2017M

ii

iii
SHEET STATEMENT
AUTHENTICITY SCIENTIFIC WORKS
Signature below:
Name : Siti Nurma Faujiah
Student ID : 1113081100010
Faculty : Economic and Business
Department : Management
Hereby declare that in the writing of this thesis, I;
1. Do not use other people‟s ideas without being able to develop and
accountable
2. Do not plagiarism of other people‟s work manuscript
3. Do not use other people‟s work without mentioning the original source
or without the owner‟s permissions
4. Do not manipulate and falsify the data
5. Own work and able to work responsible for this work
If in the future there is a demand from the other side of my work, and have been
accountably proved, is indeed found evidence that I have violated the above
statement, then I am already to be sanctioned according to rules applicable in the
Faculty of Economics and Business Syarif Hidayatullah State Islamic University
Jakarta.
Thus, this statement is truly made with sincerity.
Jakarta, Juli 2017
Siti Nurma Faujiah
iv
CURRICULUM VITAE
Personal Identities
Name : Siti Nurma Faujiah
Gender : Female
Place of Birth : Tangerang
Date of Birth : September 3rd
1995
Address : Pamulang 2 Benda Barat 13 c32 no.13
Phone/Mobile : 081297692099/083805565249
E-mail Address : [email protected]
Format Education
College : UIN Syarif Hidayatullah Jakarta
Senior High School : MAN 1 Serpong - Serpong
Junior High School : SMP AL-Amanah - Pocis
Elementary School : SDN Pondok Benda 4 – Pamulang 2
Work Experience
*Gerai Blackberry Asyahra Phone Mart
Position Financial department and customer services
Period 12 June- 22 November 2012
Length of work 6 months
Job Specification 1.calculating cash flows of department per day and per months
2.operated Ms.Excel and Ms.Word

v
3. sent email of income per months to the owner
4.conducting data collection of incoming and outgoing goods
5.to respond the complaints, suggestions and purchases by phone
*private teacher for elementary school student
places Jl.Babakan Pocis
Position Guru bimbel UN kelas 6 SDN Babakan Pocis
Period Januari- Mei 2015
Length of work 5 months
Job Specification Teaching for Math, english, social, religion
*Private teacher for senior high school student
Place Benda timur 13
Position Guru bimbingan belajar kelas 1 SMA Nipam
Period 7 Oktober- Februari 2017
Job Specification Teaching for Math, english, economic
vi
ABSTRACT
The purpose of this research is to analyze the influence of online sales
promotion and online service quality toward youth customer satisfaction that
impacts on online customer loyalty at Lazada.com. The data that have been used
for this research are primary data and it has been collected from 100 respondents
and the respondent is youth customer who ever shopping at Lazada.com more
than one. The technique sampling used in this research is purposive sampling.
The data obtained are further analyzed using path analysis on SPSS 24.0 for
windows. The results shows that online sales promotion has significant influence
partially on youth customer satisfaction, online service quality has no significant
influence partially on youth customer satisfaction, online sales promotion and
online service quality has no influence simultaneously on youth customer
satisfaction, online sales promotion has noinfluence partially toward online
customer loyalty, online service quality has influence partially toward online
customer loyalty, youth customer satisfaction has no influence partially toward
online customer loyalty, online sales promotion, online service quality, and youth
customer satisfaction have no influence simultaneously toward online customer
loyalty, online sales promotion and online service quality have no influence
simultaneously on online customer loyalty mediated by youth customer
satisfaction.
Keyword: Online Sales Promotion, Online Service Quality, Youth Customer
Satisfaction, Online Customer Loyalty.

vii
ABSTRAK
Tujuan dari penelitian ini adalah untuk menganalisa pengaruh promosi
penjualan online dan kualitas pelayanan online terhadap kepuasan pelanggan
remaja yang berdampak pada pembelian ulang online di Lazada.com. Data yang
telah di gunakan dalam penelitian ini adalah data primer dan data tersebut telah
dikumpulkan dari 100 responden yang melakukan pembelian online di
Lazada.com lebih dari satu kali. Teknik pengambilan sampel yang digunakan
dalam penelitian ini adalah metode purposive sampling. Data yang telah
didapatkan, selanjutnya dianalisa menggunakan analisis jalur pada SPSS 24.0.
Hasil dari penelitian ini menunjukan promosi penjualan online tidak berpengaruh
terhadap kepuasan pelanggan remaja, kualitas pelayanan online tidak
berpengaruh terhadap kepuasan pelanggan remaja, promosi penjualan online
dan kualitas pelayanan online tidak berpengaruh terhadap kepuasan pelanggan
remaja, promosi penjualan online tidak berpengaruh terhadap loyalitas
pelanggan online, kualitas pelayanan online berpengaruh terhadap loyalitas
pelanggan online, kepuasan pelanggan remajatidak berpengaruh terhadap
loyalitas pelanggan online , promosi penjualan online, kualitas pelayanan online,
dan kepuasan pelanggan remaja tidak berpengaruh terhadap loyalitas pelanggan
online, promosi penjualan online dan kualitas pelayanan online tidak
berpengaruh terhadap loyalitas pelanggan online melalui kepuasan pelanggan
remaja.
Kata Kunci: Promosi Penjualan Online, Kualitas Pelayanan Online, Kepuasan
Pelanggan Remaja, Loyalitas Pelanggan Online

viii
PREFACE
Assalamu’alaikum Wr. Wb
All praise to Allah SWT, the Most Gracious and the Most Merciful, the
Cherisher and Sustainer of the words; who always gives the writer all the best of
this life and there is no doubt about it. Shalawat and Salaam to the Prophet
Muhammad SAW and his family. With blessing and mercy from Allah SWT, the
writer can complete this thesis to fulfill one of the requirements in accomplishing
bachelor degree.
The writer is also well-aware that without advice and support from various
parties, this thesis will not be realized properly. Therefore, the writer would like to
take this opportunity to express his deep and sincere gratitude to the following:
1. God Allah SWT because without his guidance, I will be nothing and
misguided.
2. Thank you so much to my mother Wati Susanti and my father Ardiana
that always give me support and prayers that never stop during this
time. Thank you Mama and Papa for always beside me , thanks for
reminder me, helping me, caring me, advising me, and teach me how
to be patient. Without prayers and support you are, I was nothing in
this world. Thanks for everything I love you forever.
3. Thanks to my best friend ever Rachmatia Firda Adhana who help me
and support me in build this research also Jovanka Ardiansyah who

ix
never stop to always cheer up me and Ismi Ainul Yaqqin also always
support me thanks for you guys become my mood booster.
4. Dr. Amilin.., SE, Ak., M.Si, CA, QIA, BKP as the Dean of Economic
and Business Faculty.
5. Titi Dewi Warninda, SE, M.Si.., as the Vice Dean of Economic and
Business Faculty.
6. Cut Erika Ananda Fatimah, S.E., MBA as the thesis supervisor and as
the Led of Perbankan Syariah Department. By her advice, direction,
and guidance I can write this thesis properly. Thank you so much for
your time and kindness to help me in finishing this thesis.
7. All the lectures who have taught me many things patiently. Thank you
for all the knowledge that will lead me to a better future. May your
charity and deeds are always recorded by ALLAH SWT.
8. All the staffs in Economic and Business Faculty who always helps me
to provide me all the procedures I needs in making this thesis.
9. Ira, Ida, Anin, Azmi and Sahila my friends of arms in making research
and all my dear friends in Management International Program 2013.
Success for all you guys. I will never forget all the moment when we
spent together.
10. My Senior in international management program Ka Azka, Ka
Maulidan and Ka Azka thanks for helping me to complete this thesis,
thanks for recommendation, time, and teach me.

x
Finally, the author expect for any critics and suggestion that could
improve the content of this thesis, the author hopes to that the thought
provoking contributions can give benefit to the reader, hopefully this
thesis could be worthwhile for all of us. Amin
Wassalamualaikum Wr. Wb
Jakarta 4 July 2017
Siti Nurma Faujiah

xi
LIST OF CONTENTS
Certification of Comprehensive Exam Sheet ................................................. ii
Sheet Statement Authenticity Scientific Works ............................................ iii
Curriculum Vitae ........................................................................................... iv
Abstract ......................................................................................................... vi
Abstrak ......................................................................................................... vii
Preface ......................................................................................................... viii
List of Contents ............................................................................................. xi
List of Tables............................................................................................... xvi
List of Figures .............................................................................................. xx
List of Appendix ........................................................................................ xxi
Chapter I INTRODUCTION
A. Research Background....................................................... 1
B. Problem Formulation ....................................................... 9
C. Purpose Research ........................................................... 10
D. Benefit of Research ........................................................ 11
Chapter II LITERATURE REVIEW
A. Theoretical Basis ............................................................ 13
1. E-Commerce/Internet Marketing ............................. 13
2. Online Sales Promotion............................................ 14

xii
a. Understanding of Online Sales Promotion ......... 14
b. Dimension of Online Sales Promotion .............. 14
3. Online Service Quality ............................................. 16
a. Understanding of Online Service Quality .......... 16
b. Dimension of Online Service Quality ............... 17
4. Youth Customer Satisfaction ................................... 19
a. Understanding Customer Satisfaction ................ 19
b. Measurement of Customer Satisfaction ............. 19
5. Online Customer Loyalty ......................................... 20
a. Understanding Online Customer Loyalty .......... 20
b. Characteristic of Online Customer Loyalty ....... 21
B. Previous Research .......................................................... 22
C. Relationship among Variable ......................................... 29
D. Conceptual Framework .................................................. 30
E. Hypothesis ...................................................................... 32
Chapter III RESEARCH METHODOLODY
A. Scope of Research .......................................................... 35
B. Determine of Sample Method ........................................ 35
1. Population ................................................................ 35
2. Sample technique ..................................................... 36
C. Data Collection Method ................................................. 38
1. Types of Data ........................................................... 38

xiii
a. Primary Data ...................................................... 38
b. Secondary Data .................................................. 40
D. Data Analysis Methods .................................................. 41
1. Quality Data Testing ................................................ 41
a. Validity Test ....................................................... 41
b. Reliability Test ................................................... 42
c. Normality Test ................................................... 43
2. Descriptive Analysis ................................................ 43
3. Path Analysis ............................................................ 44
a. Hypothesis Test .................................................. 47
b. Correlation Analysis........................................... 49
c. Direct Effect, Indirect Effect and Total Effect ... 50
d. Trimming Test .................................................... 51
E. Operational Variable ..................................................... 52
Chapter IV RESULT AND ANALYSIS
A. General of Research Object ........................................... 55
1. Companies Profile of Lazada.com ........................... 55
2. History of Lazada.com ............................................. 55
B. Analysis and Discussion ................................................ 56
1. General Description and Respondent Data .............. 56
2. Quality Data Testing ................................................. 59
a. Validity Test ....................................................... 59

xiv
b. Reliability Test ................................................... 62
c. Normality Test .................................................... 65
3. Descriptive Analysis ................................................. 67
4. Path Analysis ............................................................ 79
a. Hypothesis Testing ............................................ 79
b. Correlation Analysis .......................................... 96
c. Direct, Indirect and Total Effects ...................... 97
d. Trimming Test ................................................. 100
Chapter V RESULT AND ANALYSIS
A. Conclusions .................................................................. 106
B. Suggestions ................................................................. 107
REFERENCE LIST ................................................................................. 109

xv
LIST OF TABLE
1.1 E-commerce Growth in 2014 & 2015 2
1.2 Rank of the Best e-Commerce and m-Commerce Indonesia 6
1.3 Distribution of the youth population in Indonesia 7
2.1 Previous Research 22
3.1 Agreement Scales of Five Levels 40
3.2 The Level of Coefficient Correlation 50
3.3 Operational Variable 52
4.1 Respondent based on Gender 57
4.2 Respondent based on Age 57
4.3 Respondent based on Province 58
4.4 Validity Test: Online Sales Promotion 59
4.5 Validity Test: Online Service Quality 60
4.6 Validity Test: Youth Customer Satisfaction 61
4.7 Validity Test: Online Customer Loyalty 61
xvi
4.8 Reliability Test: Online Sales Promotion 62
4.9 Reliability Test: Online Service Quality 63
4.10 Reliability Test: Youth Customer Satisfaction 64
4.11 Reliability Test: Online Customer Loyalty 64
4.12 The reduction of original price in Lazada.com already appropriate
with consumer desired 67
4.13 Lazada.com gave favorable code voucher 67
4.14 Free Shipping promotion make consumer wants to shop in
Lazada.com 68
4.15 Lazada.com helped consumer to fulfill consumer needed 69
4.16 Lazada.com keeping my personal information 69
4.17 Lazada.com provide accurately services already appropriate with my
desired 70
4.18 Lazada.com provide efficient services such as energy, money and
time that Lazada.com gave already appropriate with my desired 71
4.19 Lazada.com giving prompt services for me 71
4.20 Lazada.com gave comparable cost if there is damage in the
Produt 73
4.21 Live chat services that owned by Lazada.com could help my
Needed 73

xvii
4.22 The phone number that provided by Lazada.com is useful for me
when I get trouble 73
4.23 Email address that provided by Lazada.com is useful for consumer
when consumer get trouble 74
4.24 I am using Lazada.com because of overall evaluation product 79
4.25 I am using Lazada.com because of service based on the my past
experience 79
4.26 I intent to repurchase another product in Lazada.com 76
4.27 I intent to recommended Lazada.com to the others 77
4.28 I have done repurchase Lazada.com product 77
4.29 I have done repurchase another product in Lazada.com 78
4.30 I have recommended Lazada.com to the others 78
4.31 Model Summary Sub Structure I 80
4.32 ANOVA 81
4.33 Correlation Coefficient Sub Structure I 83
4.34 Model Summary Sub Structure II 88
4.35 ANOVA 89

xviii
4.36 Correlation Coefficient Sub Structure II 91
4.37 Correlation Analysis 97
4.38 Trimming Test: Model Summary Sub Structure I model 1 and 2 102
4.39 Trimming Test: ANOVA model 1 and 2 102
4.40 Trimming Test: Correlation Coefficient Substructure II model 1
and 103
4.41 Trimming Test: Model Summary Sub Structure II 104
4.42 Trimming Test: ANOVA Sub Structural II model 1 and 2 104
4.43 Trimming Test: Correlation Coefficient Substructure II model 1
and 2 105

xix
LIST OF FIGURE
2.1 Framework Model 31
2.2 Conceptual Framework 32
3.1 Path Analysis Model 45
3.2 Sub Structural I 46
3.3 Sub Structural II 47
4.1 The result of Normality Test Sub Structure I 65
4.2 The result of Normality Test Sub Structure II 66
4.3 Hypothesis Test: Model Sub Structure I 87
4.4 Hypothesis Test: Model Sub Structure II 96
4.5 Path Analysis Structure Model 101
4.6 Trimming Model: Sub Structure I 103
4.6 Trimming Model: Sub Structure I 106
4.7 Path Analysis Model after Trimming Test 106

xx
LIST OF APPENDIX
Appendix I : Research Questionnaire 115
Appendix II : Distribution Answer of Respondents 120
Appendix III : Results of Output SPSS 24 for Windows 135

1
CHAPTER I
INTRODUCTION
A. Research Background
As marketers, e-commerce is one of something important tool have to be
analyzing and understanding in marketing activity. E-commerce has focused on
using internet in trading the product or services.
In our daily activity, e-commerce gave so many changes toward people,
everything become easier and has advantages. E-commerce has gave influence to
several parties there are citizen, organization and also customers will feel the
`advantages such as cheap cost or affordability and efficiency (Shahriari, Shahriari
& Gheiji, 2015).
According to Khan (2016) electronic commerce is between customer and
seller use transaction by online channel on the buying a product of goods or
services. Then, use online channel also as the easier way to get some information
about the product and prices.
Now a days a majority of the people knowing e-commerce as a part of their
daily activity and changes their life style. Almost all country around the world has
use the e-commerce as a tool to sell the product or services. So many of market
has changes from traditional market to e-commerce market because every year e-
commerce was growth.
According to (Ecommerce Foundation 2016, „Global B2C E-commerce
report 2016‟ pp.11), the growth of e-commerce who had first ranked in the world

2
is Asia Pacific here, the number of data e-commerce growth around the world are
as follows:
Table 1.1
E-commerce Growth in 2014 & 2015
The data we can comparing from the previous data 2014 to 2015 are as follows:
Region 2014 2015 Growth
World $1,895.3bn $2,272.7bn +19.9%
Asia Pacific $822.8bn $1,056.8bn +28.4%
North America $572.5bn $644.0bn +12.5%
Europe $446.0bn $505.1bn +13.3%
Latin America $25.8bn $33.0bn +28.0%
MENA $21.7bn $26.8bn +18.6%
Source: e-commerce foundation/ www.ecommercefoundation.org
From the data above, it shows that the total number of the e-commerce
growth in the world every year was increasing, even it could be decreasing
anytime but it depend on online sales promotion, online service quality, youth
customer satisfaction and the online customer loyalty. These thing becomes main
discussion that will be described in this research.
To fulfill needs and wants the customer, marketing becomes important tool
for success in all organization and company, every single company or
organization have to understand how to satisfy the customer through create
promotion, planning etc. marketing as the process of planning that develop
strategy for promotion, conception, pricing and distribution of ideas, goods and
services to create exchanges that satisfy individual and organizational objectives.
(Belch and Belch 2009, p.8).

3
In this globalization era,e-commerce industry not only common in Indonesia
but also in foreign country. Zalora and Lazada are one of several big online
companies which are famous in Indonesia. (Widyastuti, 2013)
So many e-commerce markets gave modern fashion, to get a customer
satisfaction but not only fashion we have to consider the availability product
because it useless we have trend fashion without the availability product.
At the end the blow of e-commerce fashion industry it was depend on the
availability product. Based on BPS data, the export number of fashion product at
2015 achieve US$ 12.11 billion with the main market are United State, Europe,
and Japan. And then the contribution fashion toward national GDP amount 1.21%.
While, as labor-intensive sector, fashion industry able to hired the work force
amount two million people or 14.7% from total of work force in industry sector.
(Triwijanarko, 2017)
The e-commerce company which run a system efficiently and effectively
marketing will get more revenue. One of the element marketing in e-commerce
that can be used is online sales promotion, online service quality, youth customer
satisfaction and online customer satisfaction.
Promotion is one of elements marketing. E-commerce company never stop
give a good and effectively online promotion to customer, because promotion one
of stimuli the customers wants to buy the product. Effective online promotion will
create more revenue for company especially for e-commerce companies. Online
sales promotion is online price promotion in form of online discount, online
rebate, or free offer. (Himawan & Abduh, 2015)

4
In other side, e-commerce company never stop make revenue, it important
for their make sure they have a effectively online sales promotion. It can be
dangerous if e-commerce companies only think how to get revenue as much as
they can and they are forgot how to organize effectively online sales promotion. A
effective online sales promotion is how the e-commerce company create online
promotion based on need and wants the customer. A effective online sales
promotion will create a good online service quality.
Service is the one of important element in selling the product. E-commerce
company always try to increase their performance through service quality. A good
online service quality will create a good image of company. Online service quality
is includes in the step of a customer interactions with a web site such as website
facilitates, efficient and effective shopping, purchasing and delivery. (Yulianto et
al. 2014).
After the e-commerce company provides good online service quality,
consumers will feel the level of satisfaction. It refers to the customer satisfaction
and how far the excellent service quality of e-commerce companies we can see
from the satisfaction of young customer.
Young generation has dominate e-commerce industry around the world. So
many article and data shows that youth population is higher than another age
group in adopting technology and shop online.
For example, a majority of adopting technology and online shopping in
India is young generation. Youth population in India is more prefer to use online
channel for buy the product than traditional market. They have a data internet

5
users depend on age group. The data shows that 35% online shoppers in the age
group 18-25 years old, 55 % in the age group 26-35 years old, and then 8 % in the
age group of 36-45 years old and the last one is 2 % are in the age group of 45-60
years old. (Sanwal, Avasthi & Saxena 2016, p. 113).
According to („E-Commerce market Indonesia‟ 2016) said that young
population in Indonesia change their lifestyle become online customer , young
generation have penetration of internet amount 50 percent from 100 million
smartphones in use from the population in Indonesia.
In fact, another statement about the phenomenon between e-commerce and
young generation from the article and expert also there is coming from the
newsletter for example:
Sugiharto (2016) referred specifically to young generation in the age range
of 20-24 years old and 25-29 years old have a number of the penetration until
more than 80 percent internet users in Indonesia. The number is relatively higher
than the others age group according to the new research released organize internet
services association in Indonesia or (APJII). In the age group of 20-24 years old
found 22.3 million or equal to 82 percent from the total of population in that age
group. Whereas, in the age group 25-29 years old, found 24 million internet users
or equal to 80 percent in that age group.
The e-commerce is a tool of effective and efficient marketing will get more
revenue. One of element that can be used is online sales promotion, online service
quality, youth customer satisfaction and online customer loyalty. Youth
population was take effect to evaluate the strategy content of e-commerce because

6
as the data said in the above that the majority internet users are from young
generation.
In the other hand, the relationship from the data of age group online users
above in Indonesia have an impact to marketing tool of e-commerce industry, for
example online sales promotion, online service quality and online customer
loyalty, because the majority of online users coming from youth population so the
online customer satisfaction of young generation is important to considered.
In this research the object is Lazada.com. As we know Lazada is one of
popular marketplace in Indonesia. They had good reputation among another e-
commerce and they provide online sales promotion and online service quality to
maintenance good image and consumer will feel satisfaction and become loyal.
In fact, a few years ago started from 2015 and 2016 Lazada had decreased
ranked of the best brand e-commerce Indonesia. Here is the data from 2015 to
2016 according to brandindex.com:
Table 1.2
Rank of the Best e-Commerce and m-Commerce Indonesia
Rank Brand 2015
Score
Brand 2016
Score
1 Lazada 43.5 Tokopedia 45.2
2 Traveloka 41.4 Traveloka 39.5
3 Tokopedia 30.5 Bukalapak 36.9
4 Olx 24.3 Lazada 30.9
5 Zalora 23.1 Olx 20.4
Source: www.brandindex.com
From the data above, it shows that the total score of Lazada.com in 2015 get
score amount 43.5 and in 2016 get score 30.4 there is decreasing top brand rank
from the first rank to fourth rank.

7
Research needed to know what the factor of influence decreasing number of
top brand ranked. Several factor of variable it could be happened and will affect to
the satisfaction of online consumer.
The location and object survey in this research are located in DKI Jakarta,
West Java and Banten Province. Because the majority of youth population in
Indonesia coming from DKI Jakarta, West Java and Banten province, they are
included the biggest number of youth population in Indonesia if we comparing
with 33 another province in Indonesia (Adloetomo, Posselt, Utomo 2014, p. 28),
here are as follows:
Table 1.3
Distribution of the youth population in Indonesia
No
Province
Youth aged 15-29 Total Population Youth as
% of total
population Census
counts
Percentage
distribution
Census
counts
Percentage
distribution
1 Aceh 1,298.7 2.1 4,494.4 1.9 28.9
2 North
Sumatra
3,479.9 5.6 12,982.2 5.5 28.9
3 West
Sumatra
1,205.1 1.9 4,846.9 2.0 24.9
4 Riau 1,573.2 2.5 5,538.4 2.3 28.4
5 Jambi 862.5 1.4 3,092.3 1.3 27.9
6 South
Sumatra
2,106.4 3.4 7,450.4 3.1 28.3
7 Bengkulu 477.6 0.8 1,715.5 0.7 27.8
8 Lampung 2,022.4 3.3 7,608.4 3.2 26.6
9 Bangka
Belitung
350.4 0.6 1,223.3 0.5 28.6
10 Riau Island 525.6 0.8 1,679.2 0.7 31.3
11 DKI Jakarta 2,971.1 4.8 9,607.8 4.0 30.9
12 West Java 11,392.
7
18.4 43,053.7 18.1 26.5
13 Central Java 7,647.0 12.3 32,382.7 13.6
23.6

8
No
Province
Youth aged 15-29 Total Population Youth as
% of total
population Census
counts
Percentage
distribution
Census
counts
Percentage
distribution
14 DIYogyakart
a
860.3 1.4 3,457.5 1.5 24.9
15 Banten 3,125.1 5.0 10,632.2 4.5 29.6
16 East Java 8,911.3 14.4 37,476.8 15.8 23.8
17 Bali 900.3 1.5 3,890.8 1.6 23.1
18 West Nusa
Tenggara
1,219.6 2.0 4,500.2 1.9 27.1
19 East Nusa
Tenggara
1,112.7 1.8 4,683.8 2.0 24.0
20 West
Kalimantan
1,203.7 1.9 4,396.0 1.8 27.4
21 Central
Kalimantan
633.9 1.0 2,212.1 0.9 28.7
22 South
Kalimantan
994.1 1.6 3,626.6 1.5 27.4
23 East
Kalimantan
997.8 1.6 3,553.1 1.5 28.1
24 North
Sulawesi
535.3 0.9 2,270.6 1.0 23.6
25 Central
Sulawesi
681.6 1.1 2,635.0 1.1 25.9
26 South
Sulawesi
2,080.6 3.4 8,034.8 3.4 25.9
27 Southeast
Sulawesi
609.2 1.0 2,232.6 0.9 27.3
28 Gorontalo 270.0 0.4 1,040.2 0.4 26.0
29 West
Sulawesi
298.3 0.5 1,158.7 0.5 25.7
30 Maluku 402.6 0.6 1,533.5 0.6 26.3
31 North
Maluku
283.9 0.5 1,038.1 0.4 27.3
32 West Papua 226.8 0.4 760.4 0.3 29.8
33 Papua 813.2 1.3 2,833.4 1.2 28.7
Indonesia 62,082.
8
100.0 237,641.
3
100.0 26.1
Source: Derived from Population Census 2010, BPS [web]
http://sp10.bps.go.id.

9
From the data above it shows youth population in Indonesia in the age group
15-29 there are coming from DKI Jakarta amount 30.9%, West Java 26.5% and
Banten amount 29.6% if we comparing with 33 another province in Indonesia.
From the background above, the author took some of several variables
relating the background research to investigate the online sales promotion and
online service quality as exogenous variables (X), youth customer satisfaction and
online customer loyalty as a endogenous variable (Y). Based on these
descriptions, the author makes a research with title.
“THE INFLUENCE OF ONLINE SALES PROMOTION AND
ONLINE SERVICE QUALITY TOWARD YOUTH CUSTOMER
SATISFACTION THAT IMPACTS ON ONLINE CUSTOMER
LOYALTY”
B. Problem Formulation
Based on the background described above, so the formulation of the
problem that will be explained in this research are:
1. Does online sales promotion have influence youth customer satisfaction?
2. Does online service quality have influence youth customer satisfaction?
3. Do online sales promotion and online service quality have influence youth
customer satisfaction?
4. Does online sales promotion has influence online customer loyalty?

10
5. Does online service quality have influence online customer loyalty?
6. Does youth customer satisfaction have influence online customer loyalty?
7. Do online sales promotion, online service quality and youth customer
satisfaction influence online customer loyalty?
8. Does online sales promotion indirectly influence online customer loyalty
which is mediated by youth customer satisfaction?
9. Does online service quality indirectly influence online customer loyalty
which is mediated by youth customer satisfaction?
C. Purpose of Research
Every research had a purpose. There are:
1. To analyze the influence of online sales promotion on youth customer
satisfaction.
2. To analyze the influence of online service quality on youth customer
satisfaction.
3. To analyze the influence of online sales promotion and online service
quality on youth customer satisfaction.
4. To analyze the influence on online sales promotion on online customer
loyalty.
5. To analyze the influence of online service quality on online customer
loyalty
6. To analyze the influence of youth customer satisfaction on online
customer loyalty.

11
7. To analyze the influence of online sales promotion, online service quality
and youth customer satisfaction on online customer loyalty.
8. To analyze the indirect influence of online sales promotion on online
customer loyalty which is mediated by youth customer satisfaction
9. To analyze the indirect influence of online service quality on online
customer loyalty which is mediated by youth customer satisfaction
D. Benefit of Research
Given this research, the researcher hope that the result of this research has
benefits for all parties, there are:
1. For Author
Through this research the purpose of the author are to get more
knowledge and experience in conducting research, train the ability that
have been learned in lecture or class into scientific forms and compare
between the theory obtained by the fact that happen in the field.
2. For Lazada.com
Lazada.com will see the dominant factors among online shop promotion,
online service quality, youth customer satisfaction and online customer
loyalty. Therefore, based on these factors can help Lazada.com to repair
their performance become better than before and can increase their ranking
of the top brand or best e-commerce in Indonesia.
3. For Readers
Through this research the readers may use this research as the material for
comparing the factors that influence among online shop promotion, online

12
service quality, youth customer satisfaction and online customer loyalty.
So, the information can be used in future research and development

13
CHAPTER II
LITERATURE REVIEW
A. Theoretical Basis
1. E-Commerce / Internet Marketing
E-commerce is one of important tool in marketing activity, if
marketing has given advertising and selling product by manual but e-
commerce by online channel.
Definition of e-commerce has a lot of explanation by the expert. From
several experts there are have different explanation about the e-commerce
but all of them have similar understanding between each other. Here are,
definition of e-commerce from several expert:
According to Grandona & Pearson (2004) in Lie & Xie (2012), e-
commerce is the process of buying and selling products or services using
electronic data transmission via the Internet and the www.
According to Jelassi & Enders (2005) in Torres, Lisboa, & Yasin
(2015) Electronic commerce – or e-commerce – deals with the facilitation
of transactions and selling of products and services online, i.e. via the
Internet or any other telecommunication network
According to Shahriari, Shahriari, & Gheiji (2016) E-commerce is
trading in products or services using computer networks, such as the
Internet.
According from the definition above the conclusion about e-commerce
relates several expert that e-commerce is the process of transaction, buying

14
and selling the product or services via online channel. So many a strategies
for trading in e-commerce to get online customer satisfaction and become
loyal to our online product or services including depend on online sales
promotion.
2. Online Sales Promotion
a. Understanding of Online Sales Promotion
According to Neha & Manoj (2013) Sales promotion has been
considered as most stimulating technique of promotion for influencing.
purchase decision.
According to Strauss & Frost (2012) in Himawan & Abduh (2015)
sales promotions were short term incentives of gifts or money that
facilitated the movement of product from producer to end user.
According to Shamout (2016) is a technique which mainly used by
marketer on a temporary basis to create an attractive goods or services
to encourage the customers to purchase goods or services in a specific
time period by providing more benefits.
According from the definition above the conclusion of online sales
promotion is a technique used by marketer to stimulating the customer
to purchase a product.
b. Dimension of Online Sales Promotion
To create good online sales promotion to customer, we have to
determine various type of online sales promotion. In this case, there are

15
seven dimension online sales promotion based on Neha and Manoj
(2013) as follows:
1. Coupons
Offer a certificate that provides a price reduction at point of
purchase.
2. Rebates
Are cash back on product from the manufacturer on a purchase.
3. Free Trial
Provides the consumer with the opportunity to use the product by
giving a free small portion of the product for the consumer to test
4. Premium
Offer an increased quantity of the product without an increase in
normal price.
5. Contest
Provide a chance to win a large prize through skill.
6. Sweep takes
Provide a chance to win a large prize based on chance.
7. Price Packs
Offer a reduction in normal price of a product.
According to Huang (2012) in Himawan & Abduh (2015) to implement
online sales promotion activities, there are some popular online promotion
strategies that have been used such as online price discount, online coupon,
and free shipping that influence customer to buy.

16
So, according to the various experts, dimension of sales promotion is
usually consist of coupons, rebates, free trial, premium, contest, sweep
takes, and price but, for online sales promotion according to Huang (2012)
in Himawan & Abduh (2015) consist of:
1. Online price discount
Price discounts are the reduction of an original sale by a certain
percentage while bonus packs are deals in which the consumer receives
more for the original price. (Yin, Jin & Huang, 2014)
2. Online coupon
is that a coupon will need a special code to be entered during the
checkout phase for it to be applicable. („Discount, Coupon & Quantity
pricing‟, 2002-2017)
3. Free shipping
Free shipping can be offered as a promotion, either with, or without a
coupon.(„free shipping promotion‟, 2017)
In the other hand, online service quality is importance to be analysis in
marketing strategy, customer buy the product in e-commerce/online also
consider the service quality itself.
3. Online Service Quality
a. Understanding of Online Service Quality/E-Service Quality
According to Wen et al. (2014) Electronic service or e-service
quality is defined as overall customer evaluations and judgments

17
regarding the excellence and quality of e-service delivery in the virtual
marketplace.
According to Lin & Wu (2002) in Yulianto et al. (2014) define
online service quality (OSQ) as the difference between customer
expectations and perceptions of the online services offered.
According to Parasurahman et al. (2005), in Yen et al. (2017) e-
service quality is not the same as the website quality. E-service quality
addresses quality issues revolving around the service processes and
flows, while website quality is more concerned with the overall design
factors of the website.
According to the definition above, so the conclusion about online
service quality is depend on overall customer evaluation of e-service
quality when they serve online customer with the overall design factors
of the website. Very important for marketers to consider the
improvement of e-service quality when they want customer feel
satisfaction and become loyal.
b. Dimension of Online Service Quality
According to Yang & Fang (2004) there are seven online service
quality dimensions its, efficiency, reliability, fulfillment, privacy,
responsiveness, compensation, and contact.
Definition of each dimension:
1. Efficiency: The ability to do task well and correctly (no wasting
time, energy and cost). (Maulana 1995, p. 250)

18
2. Reliability: ability to perform the promised service dependably
and accurately (Lovelock and Wright 2007, p. 407)
3. Fulfillment: willingness to help cunsumer (Lovelock and Wright
2007, p. 407)
4. Privacy: privacy in terms of expected flows of personal
information, modeled with the construct of context-relative
informational norms (Nissenbaum, 2011)
5. Responsiveness: willingness to help customers and provide
prompt service (Lovelock and Wright 2007, p. 407)
6. Compensation: something that must be considered or calculate
balance and as something comparable (Andrew 1981, p.283)
7. Contact: communicate with (someone), typically in order to give
or receive specific information or to communicate with someone
by calling or sending them a letter, email,etc („Contact‟, 2017)
The conclusion from both of experts, online service quality
dimensions is all about the way how the customer revisit retail website
and comfort on the online service quality for example service quality
of fulfillment, information, system, reliability, efficiency,
responsiveness, compensation and contact.

19
4. Definition of Customer Satisfaction
a. Understanding Customer Satisfaction
According to Ludin & Cheng (2014) customer satisfaction is
commonly viewed as a result of comparison between the consumption
expectation and experience.
According to Caner & Banu (2015) customer satisfaction as an
important element of e-service quality is investigated from the
marketing and technical perspectives in an online retailing business
context.
The conclusion from the definition above that have been explained
by expert so, customer satisfaction is comparison between customer
expectation and customer experience.
b. Measurement of Customer Satisfaction
Lin (2007) in Lin (2011) indicated that an enterprise providing a
good service quality could really satisfy the diverse needs of customers
and customer satisfaction was the overall evaluation of the product and
the service based on the customers past experience.
defined that customer satisfaction coming from the measurement
product and services based on previous experience of customer also
based on overall evaluation of consumption experience.
Zeithaml dan Bitner (2000) in Tjahjaningsih (2013) explained that
customer satisfaction assumed as overall evaluation of the real
product and intagible product.

20
5. Definition of Online Customer Loyalty
a. Understanding of Online Customer Loyalty
Actually, between customer loyalty and online customer loyalty
have different perspectives of definition from the expert. There are:
According to Ludin and Cheng (2014) defined e-loyalty as
customer preferable attitude towards an e-commerce that leads to a
repeat buying behavior.
According to Winnie (2014), online customer loyalty is around
consumers who are likely to rebuy from the same website and e-
retailers, rather than switch to other websites.
According to Chi, Jiun & Lin (2015) is a commitment to
consistently revisit a website because of a preference for shopping on
that website without switching to other websites.
So, the conclusion from the definition above online customer
loyalty is buying the online product repeatedly in the same brand or
same website e-retailers.
b. Characteristic of Online Customer Loyalty
Wan dan Huang (2010) in Tjahjaningsih (2013) shows that
customer loyalty can be seen through attitude and behaviour. Attitude
include intent to repurchase another product in the company and intent
to recomeded to the others. Behaviour include repurchase the product,
purchase another product from the company and recommended to the
others.

21
According to Bowen and Chen (2005) there are two measures of
customer loyalty it is respondent‟s intent to return and their willingness
to perform marketing activities, such as recommending the product to
others.

22
B. Previous Research
No
Title, Researcher,
Journal Research Method Result Similarity Differences
1 Title: Analysis of
Online Sales
Promotion toward
Youth Purchase
Intention in
Indonesia (Case
study of apparel
industry)
Researcher:
Leonardus
Himawan and Dibia
Method: the study
used is a descriptive
research with
quantitative
methods of data
collection
Respondent: the
respondents of this
research gathered
for random
sampling are youth
The result of the study is that
there is a positive response
toward online pricing
promotion, and online coupon
promotion among youth online
consumers with the highest
positive respond is the online
pricing promotion
Online sales promotion as
independent variable
Different dependent
variable
Use descriptive
method

23
No
Title, Researcher,
Journal Research Method Result Similarity Differences
Abduh
Journal: Ijaber, Vol.
13, No. 7 (2015):
4677-4690
students high school
and university students
resides in Jakarta and
Tangerang are who
have exposed to any
type of online
promotion form, and
have experienced in
buying apparel product
online.

24
No
Title, Researcher,
Journal Research Method Result Similarity Differences
2 Title: The Effect of
Online Service
Quality toward
Perceived Risk,
Customer Attitudes,
Realtionship
Quality, Online
Purchase Intention,
E-Loyalty and
Purchasing
Behaviour
Method: the
analytical tool used
was the Generalized
Structured
Component
Analysis (GSCA) to
test the hypothesis
The study was
conducted on
consumers who
made online
The result showed that eight
hypothesis with significant
effect were online service
quality toward perceived risk,
online service quality toward
customer attitudes, online
service quality toward online
relationship quality, perceive
risk toward online relationship
quality, customer attitudes
toward online purchase
Online customer
loyalty as independent
variable
Use SPSS GSCA
(Generalized
Structured Component
Analysis)
Use E-Loyalty as
Independent Variable
Different dependent
variable

25
No
Title, Researcher,
Journal Research Method Result Similarity Differences
Researcher:
Yulianto, Edy, Sri
Astuti, Endang,
Suyadi, Imam,
Nayati Utami,
Hamidah
Journal: European
Journal of Business
and Management
ISSN2222-
purchasing SMEs who
were members of the
world‟s Top 50 SMEs
in the online version of
the Marketer magazine.
The unit of analysis
consist of 123
consumers
intention, online purchase
intention toward e-customer
loyalty, and e-loyalty toward
customer behaviors
The hypotheses with non-
significant effect were online
service quality toward online
purchase intention, perceived
risk toward customer attitude,
perceived risk toward online
purchase intention, and online
purchase intention toward

26
No
Title, Researcher,
Journal Research Method Result Similarity Differences
2839 (online) Vol.6,
No.22, 2014
online purchase intention,
perceived risk toward customer
attitude, perceived risk toward
online purchase intention, and
online purchase intention
toward online purchasing
behavior.
3 Title: Factors
Influencing
Customer
Satisfaction and E-
Method: statistical
Methods in
Statistical Package
for the Social
Findings show that only e-
service quality and information
quality have effects on
customer satisfaction. It was
Online customer loyalty as
independent variable
Use path analysis (SPSS)
Different dependent
variable

27
No Title, Researcher,
Journal
Research Method Result Similarity Differences
Loyalty: Online
Shopping Environment
among the Young
Adults
Researcher: Izyan
Hizza Bt. HILA
LUDIN, Boon Liat
CHENG
Journal:
Management
Dynamics in the
Science (SPSS).
Respondent: A
Convenience
sampling of 193
Responses were
collected
throughout the
Klang Valley And it
took about three
months to complete
the whole process
also found that customer
satisfaction does positively
impact e-loyalty.
On the other hand, the findings
reveal that website design and
security were insignificant
toward customer satisfaction

28
No Title, Researcher,
Journal
Research Method Result Similarity Differences
Knowledge Economy
Volume 2 (2014) no. 3,
pp. 462471
of data collection and
analyses

29
C. Relationship among Variable
1. The Relationship Online Sales Promotion and Online Serivice Quality
toward Online Customer Satisfaction
Relationship between online sales promotion and online service
quality toward customer satissfaction there was have significant effect
between variables either partially or simultaneously. Because online
consumer satisfaction is seen as one of the dimensions of market
performance, increase customer satisfaction tends to lead to long-term
sales growth. In addition to providing some benefits, it also provides a
good basis for the purchase and creation of customer loyalty, as well as
forming a recommendation by word of mouth that is profitable for the
company. (Susanti, 2016).
2. The Relationship Sales Promotion on Customer Loyalty
Relationship-orientated promotion can retain customer loyalty by
increasing their satisfaction, trust and commitment, and conflicts with
the view that promotion has short-term effects only. Promotion has
significantly positive effects on satisfaction and trust. Besides,
satisfaction, trust, and commitment are powerful and illustrative
components for explaining customer loyalty. (Pi and Huang 2011).
3. The Relationship customer satisfaction and customer loyalty
There is has positive influence among customer satisfaction and
customer loyalty. The result coming from two measures of customer
loyalty there are intent to return and willingness to perform marketing

30
activities such as recomending the hotel to others. and also was
measured by seven point Likert scale. (Bowen and Chen, 2005).
4. The Relationship promotion toward customer satisfaction that impact
on customer loyalty
Customer satisfaction, and promotion have affect positively
towards customer satisfaction. Image, promotion, and customer
satisfaction affect positively towards customer loyalty. Furthermore,
mediating effect of customer satisfaction apply to image effects on
customer loyalty. Customer satisfaction serves as a mediating variable
on customer loyalty. Mediating effect of customer satisfaction apply
for promotion effect on customer loyalty. Customer satisfaction serves
as a mediating variable between promotional variables on customer
loyalty. (Tjahjaningsih, 2013).
D. Conceptual Framework
Conceptual framework as a network, or “a plane” of interlinked
concepts that together provide a comprehensive understanding of a
phenomenon or phenomena. The concepts that constitute a conceptual
framework support one another, articulate their respective phenomena, and
establish a framework-specific philosophy. Conceptual frameworks possess
ontological, epistemological, and methodological assumptions, and each
concept within a conceptual framework plays an ontological or
epistemological role. The ontological assumptions relate to knowledge of the
“way things are,” “the nature of reality,” “real” existence, and “real” action.

31
(Jabareen, 2009). Based on the theory above so, it can be developed a
framework model and conceptual framework in figure 2.1 and 2.2 as follows:
Figure 2.1
Framework Model
Online Sales
Promotion (X1) Online Service
Quality (X2)
Youth Customer
Satisfaction (Y1)
Online Customer
Loyalty (Y2)
1.Quality Data Testing:
a. Validity Test
b. Reliability Test
c. Normality test
2.Descriptive Analysis
3.Path Analysis:
a. Hypothesis testing
b. Correlation Analysis
c. Direct, Indirect & Total effect
d. Trimming Test
Conclusion and Suggestion

32
In specific conceptual framework, there are two variables exogenous
such as online sales promotion and online service quality and two variables
endogenous such as youth customer satisfaction and online customer loyalty.
The purpose of this research is to analyze the influence of online sales
promotion and online service quality toward youth customer satisfaction that
impacts on online customer loyalty at Lazada.com. Here for the picture of
conceptual framework.
Figure 2.2
Conceptual Framework
Ɛ1 Ɛ2
py2x1
pyx1
rx1x2 py2y1
pyx2
py2x2
E. Hypothesis
According to (Cooper & Schindler 2006, p.756) hypothesis is a
proposition formulated for empirical testing; a tentative descriptive
statement that describes the relationship between two or more variables.
According to (Flick 2011, p. 249) hypothesis is assumption that is
formulated for study purposes (mostly coming from the literature or an
Online Sales
Promotion
(X1)
Online Service
Quality
(X2)
Youth
Customer
Satisfaction
(Y)
Online
Customer
Loyalty
(Z)

33
existing theory) in order to test it empirically in the course of the study.
The assumption should be based on marketing theory or previous research.
The assumption is called hypothesis. (Hair, Bush, & Ortinau 2003, p.537).
1. Sub Structural I
Hypothesis 1:
H0 = Online sales promotion doesn‟t have influence on youth customer
satisfaction
H1 = Online sales promotion has influence on youth customer satisfaction
Hypothesis 2:
H0 = Online service quality doesn‟t have influence on youth customer
satisfaction
H1 = Online service quality has influence on youth customer satisfaction
Hypothesis 3:
H0 = Online sales promotion and online service quality don‟t have
influence on youth customer satisfaction
H1 = Online sales promotion and online service quality have influence on
youth customer satisfaction
2. Sub Structural II
Hypothesis 4:
H0 = Online sales promotion doesn‟t have influence on online customer
loyalty
H1 = Online sales promotion has influence on online customer loyalty
Hypothesis 5:

34
H0 = Online service quality doesn‟t have influence on online customer
loyalty
H1 = Online service quality has influence on online customer loyalty
Hypothesis 6:
H0= Online customer satisfaction doesn‟t have influence on online
customer loyalty
H1= Online customer satisfaction has influence on online customer loyalty
Hypothesis 7:
H0 = Online sales promotion, online service quality and online customer
satisfaction don‟t have influence simultaneously on online customer
loyalty
H1 = Online sales promotion, online service quality and online customer
satisfaction have influence simultaneously on online customer loyalty
Hypothesis 8:
H0 = Online sales promotion has not influence on online customer loyalty
mediated by youth customer satisfaction
H1 = Online sales promotion has influence on online customer loyalty
mediated by youth customer satisfaction
Hypothesis 9:
H0 = Online service quality has not influence on online customer loyalty
mediated by youth customer satisfaction
H1 = online service quality has influence on online customer loyalty
mediated by youth customer satisfaction.

35
CHAPTER III
RESEARCH METHODOLOGY
A. Scope of Research
This research wants to test hypothesis about online sales promotion,
online service quality, online customer satisfaction, and online customer
loyalty of Lazada.com. Scope of research for this studies, are as follows:
1. The focus of the author in this study is the influence of online sales
promotion and online service quality toward online customer
satisfaction that impacts on online customer loyalty.
2. The location and object survey the customer of Lazada.com that
located in JABODETABEK (Jakarta, Bogor, Depok, Tangerang,
Bekasi).
3. In this study consisted used two variables are exogenous variables and
endogenous variable. Exogenous variable in this research is online
sales promotion given symbol (X1) and online service quality (X2).
Endogenous variable in this research is online customer satisfaction
given symbol (Y1) and online customer loyalty given symbol (Y2).
B. Determine of Sample Method
1. Population
The population in this research study is the customers of
Lazada.com, here the researcher wants to get the respondent based on
age group that is online youth population who ever shopping in

36
Lazada.com website. Population is the entire group of people about
whom the researcher needs to obtain information (Daniel and Gates,
2004, p.270).
According to Cooper & Schindler (2006, p.434) a population is
the total collection of elements about which we wish to make some
inferences. A population consists of all the items or individuals about
which you want to draw a conclusion (Levine et.al 2008, p.5).
2. Sample technique
According to Cooper & Schindler (2006, p.434) sample is the
process of selecting some elements from a population to represent that
population. The portion of a population selected for analysis also
called sample (Levine et.al 2008, p.5). Sample technique is technique/
style/ model of selecting sample from available population until fulfill
the standard of the research. The sample technique will be used is non-
probability sampling or sampling purposive because this research put
youth population as the sample, its more specific.
According to Cooper & Schindler (2006, p.439) non-
probability sampling is an arbitrary and subjective sampling procedure
where each population element does not have a known, nonzero
chance of being included. Sampling purposive is the process of
selecting sample technique from population based on specific
considerations (Seputra 2013, p.14). The researcher use Slovin formula
to determine sample size of non-probability sample.

37
The researcher takes 100 samples respondent, because the
researcher got the result sample size with the formula:
n = Z2 (1- P) e
2
Notes:
n = Sample
z = Confidence Level (100% = 1)
= Research Group Proportion (50% = 0,5)
= Failure rate, from 0,01until 0,05 (0,05)
With calculating:
n = Z2 (1- P)
e2
n = 12 . 0,5 (1 – 0,5)
0.052
n = 100
Then, according to (Supriyadi 2014, p.18) guidelines to determine
sample are as follows:
a. Sample size should be more than 30 and less than 500 is a good
for research
b. Generally, determine sample size depend on the existing budget
you have
Then, according to Sugiyono (2010, p.74) guidelines to determining
sample are as follows:
a. Sample size should be between 30-500 elements

38
b. If the sample is broken down further into sub-sample
(Male/Female, Elementary/Junior/High School, etc.) must be a
minimum number sub until 30
c. In the multivariate research (multiple linear regressions) the sample
size should be several times larger (10 times) than the number of
variables to be analyzed.
d. A simple experiment for research, with strict controls, sample size
between 10-20 elements.
C. Data Collection Methods
1. Types of Data
According to Seputra (2013, p.10) data is something knew or
assumed, it can be representing events or case happened and the case
would be happening.
a. Primary Data
According to Malhotra (2009, p.67) primary data is are
originated by the researcher for the specific problem under study
such as survey data. When the data collector is the one using the
data for analysis, the source is primary (Levine et.al 2008, p.6)
Primary data was collected through questioner methods.
According to Hair, Bush, and Ortinau (2004, p.448) questionnaire
is a formalized set of questions for obtaining information from
respondents. Questioner method is technique data collections that

39
had been done with give a set of questions or written statement to
the respondent to be answered (Sugiyono 2009, p.199). The data
will be processed using SPSS 24 for windows.
Data collection will be collecting through questionnaire obtained
from several respondents by Google form feature (google.doc
survey).
According to Betts (2017) The Google Forms feature in Google
Drive is an extremely powerful tool capable of creating the most
complex surveys. What lifts it above other survey creation tools is
the way it fully integrates with Google Docs and the rest of it
Google services. This means we can collaborate with others on
creating the surveys, or share the finished product with select
people, and then use the power of a spreadsheet to analyze for
responses.
This study used agreement scale that is consists of five levels.
Agreement scale is widely used a rating scale that requires the
respondents to indicate agreement and disagreement with each of a
series statement about the stimulus object. Typically, each scale
item has five response categories, ranging from “strongly disagree”
to “strongly agree” (Maholtra 20011, p.58)
Agreement scales are most often used with attitude statements or
factual type statements. (Malhotra 2011, p.58). Agreement scales

40
of five levels to express the attitude or the respondents answer are
as follows:
Table 3.1
Agreement Scales of Five Levels
(Malhotra 2011, p.58)
No Range Weight
1 Strongly Agree (SA) 5
2 Agree (A) 4
3 Neutral (N) 3
4 Disagree (D) 2
5 Strongly Disagree (SD) 1
b. Secondary Data
Secondary data are data collected for some purpose other
than the problem at hand, including data available on the
internet, from trade organization and etc. (Maholtra 2008,
p.67). In the development of this study research, technique for
take a secondary data will be used are:
1) Library study, done for collecting the data with information
through reference books, journals, internet and other
information which suitable according to this study.
2) Notes of Lazada such as background company, their competitor
and the ranking between lazada and competitor.

41
D. Data Analysis Methods
1. Quality Data Testing
a. Validity Test
According to Malhotra (2009, p.316) validity of a scale can
be defined as the extent to which differences in observed scale
scores reflect true differences in what is being measured, rather
than systematic or random error.
According to Cooper and Schindler (2006, p.348) validity
is the extent to which a test measures what we actually wish to
measure. Test validity used to measure the legal valid or un-valid
of a questionnaire.
According to Ghozali (2011, p. 52-55) Validity test is
divided into three different ways to measure:
1. Correlated between question score with the total score of
variable
2. Bivariate correlation between each score indicator with the total
score of variable
3. Confirmatory Factor Analysis (CFA)
In order to determine whether an items that are to be used
to or nor, usually done on the significance correlation coefficients
test on minimum correlation 0.30, means that an item is considered
valid if the total score is greater than 0.30 (Priyatno 2010, p. 90).

42
b. Reliability Test
According to Maholtra (2009, p.315) reliability refers to the
extent to which a scale produces consistent results if repeated
measurements are made on the characteristic.
According to Sugiyono (2008, p.456) reliability is often
defined as the consistency and stability of data findings. From a
positive perspective, reliability typically is considered to be
synonymous with consistency of data produced by observation
made by different researcher at different times.
Reliability test conducted by researcher is to measure the
consistency of the questions that include in the questionnaire on the
variables. According to Malholtra (2004, p.268) a questionnaire is
considered reliable when cronbach‟s alpha test reached 0.6 or
more. Cronbach‟s alpha is the average of all possible split half
coefficients resulting from different ways of splitting the scale
items (Malhotra 2004, p. 268).
c. Normality Test
According to Ghozali (2011, p. 160), normality test have a
purpose to examine whether residual regression variable model
have normal distribution. A good regression model is the model
has normal data distribution or at least approach to normal. In this
research, the way to detect whether the residual have normal
distribution or not that is we can see in histogram graph and see in

43
normal probability plot which is compared from normal
distribution to cumulative distribution. Normal distribution will
form one diagonal straight line and plotting of residual data and
compared by diagonal line. If residua distribution data is normal
then the line will described in truth data and following the line of
diagonal.
2. Descriptive Analysis
According to Istijanto (2009) descriptive study was conducted
where the research is done to provide wider exposure which has a
purpose to change the raw data become easy to comprehended in the
form of short time. The descriptive analysis used to explain general
description about the respondent. This way is done by distributing the
100 questioners to respondent and then processed with statistical
methods using SPPS 24 and Microsoft Excel.
3. Path Analysis
According to Riduwan & Engkos (2007, p. 2) path analysis model
was used to analyze the patterns of relationships between variables
with the aim to find out directly or indirectly influence the set of
independent variables (exogenous) against the dependent variable
(endogenous). There are some benefits using path analysis based on
(Riduwan & Engkos, p. 2) are as follows:

44
a. Description of the phenomenon studied or researched the problem.
b. The prediction variable (Y) based on the value of the variable (X)
and prediction with path analysis is qualitative.
c. Determination of the determinant factor variable (X) where the
dominant influence of the related variables (Y), can be used to
search for the mechanism (line) the influence of the free variable
(X) against variables bound (Y).
d. Use model theory test trimming good test reliability and test new
concepts of development. Application of method of trimming is
used to correct a structural path analysis model by way of
removing the exogenous variables the coefficient of the coaster is
not significant.
Figure 3.1
Path Analysis Model
Ɛ1
Ɛ2
py2x1
py1x1
rx1x2
py1x2
py2x2
Online Sales
Promotion
(X1)
Online Service
Quality
(X2)
Youth
Customer
Satisfaction
(Y)
Online
Customer
Loyalty
(Z)

45
Description:
py1x1 : Standardized coefficient, path coefficient direct effect X1 towards
Y1
py1x2 : Standardized coefficient, path coefficient direct effect X2 toward
Y1
py2x1 : Standardized coefficient, path coefficient direct effect X1 towards
Y2
py2x2 : Standardized coefficient, path coefficient direct effect X2 towards
Y2
X1 : Online Sales Promotion
X2 : Online Service Quality
Y : Youth Customer Satisfaction
Y2 : Online Customer Loyalty
Path diagram in this research consist of two structural equations
where X1 and X2 are exogenous variable and Y1 also Y2 are
endogenous variable. Structural equations in (Ridwan and Kuncoro
2008, p. 129 & 136) we can see as follows:
Hypothesis for Sub Structural I
Figure 3.2
Sub Structural I
pyx1
1
pyx2
Online Sales
Promotion (X1)
Online Service
Quality (X2)
Youth Customer
Satisfaction (Y)

46
From the figure above there is endogenous variable (Y) and
exogenous variable (X1 and X2), which have structure equation
Y = PY1X1 + PY1X2 + ϵ1
Hypothesis for Sub Structural II
Figure 3.3
Sub Structural II
Ɛ1 Ɛ2
py2x1
py1x1
rx1x2
py1x2
py2x2
From the figure above there is endogenous variable (Y2) and exogenous
variable (X1, X2, Y1), which is have structure equations
Y2 = PY2X1 + PY2Y1 + 2
Quality data testing of Path Analysis:
a. Hypothesis Testing
1. Coefficient Determination
According to Ghozali (2006, p. 202) the coefficient of
determination (r2) essentially measure how far the ability of
models to explain variation in the dependent variable. The
Online Sales
Promotion
(X1)
Online Service
Quality
(X2)
Youth
Customer
Satisfaction
(Y1)
Online
Customer
Loyalty
(Y2)

47
value determination of coefficient is between zero and one. The
small means that the ability of independent variables in
explaining variations in the dependent variable is very limited.
Basic weaknesses use the coefficient of determination is
based on the number of independent variables entered into the
model. Each additional one independent variable, then R2
would increase, no matter whether these variables affect the
dependent variable is not. Therefore, in this research used is the
R square that have been adapted or adjusted R Square as
adjusted for the variables used in this research. Adjusted R
Square. A value can rise or fail if an independent variable
added into the model.
2. F-test
According to Sarwono (2007, p. 29) F test is used to see the
influence exogenous variable to endogenous variable
simultaneously. According to Sarwono (2007:30) the criteria
for testing the significant level is 5% or 0.05. Step to examine
the hypothesis with Ftest are as follow (Sarwono 2007, p. 17):
- Calculate Ftest by SPSS
- Calculate the Ftable with the criteria significant level is 0.05
- Determine the criteria of hypothesis test as follows:

48
If Ftest > Ftable, H0 is rejected and H1 is accepted, it
means exogenous variable has significant influence to
endogenous variable simultaneously.
If Ftest < Ftable , H0 is accepted and H1 is rejected, it
means exogenous variable doesn‟t have significant
influence to endogenous variable simultaneously.
3. t-test
According to Sarwono (2007, p. 19) t test is used to see the
influence exogenous variable to endogenous variable
simultaneously. According to Sarwono (2007:19) the criteria
for testing the significant level is 5% or 0.05. Step to examine
the hypothesis with t test are as follow (Sarwono 2007, p. 19):
- Calculate t test by SPSS
- Determine the hypothesis
- Calculate the t table with the criteria significant level is 0.05
- Determine the criteria of hypothesis test as follows:
If t test > t table, H0 is rejected and H1 is accepted, it
means exogenous variable has significant influence to
endogenous variable simultaneously.
If t test < t table , H0 is accepted and H1 is rejected, it
means exogenous variable has no significant influence to
endogenous variable simultaneously.

49
b. Correlation Analysis
According to Sarwono (2007, p. 22) correlation of coefficient
is used to see how strong relationship and direction between one or
more variable. Coefficient of correlation can be shown by the
number of pearson correlation. Pearson correlation ranged from
zero until one. If pearson correlation is close to the number one, it
means the relationship is getting strong. Otherwise, if pearson
correlation is close to zero then the relationship is getting weak.
Table 3.2
The Level of Coefficient Correlation
(Sarwono 2007, p. 108)
Internal Coefficient Level of Relationship
0.0-0.25 Very Weak
>0.25-0.5 Weak
>0.5-0.75 Strong
>0.75-1 Very Strong
c. Direct Effect, Indirect Effect and Total Effects
Direct effect is the influence of one exogenous variable toward
endogenous variable which happen without another endogenous
variable. (Riduwan and Kuncoro 2012, p. 152).
Indirect effect is the influence of one exogenous variable
toward endogenous variable which happen through another
endogenous variable. (Riduwan and Kuncoro 2012, p. 152).

50
Total effect is the total influence of direct effect and indirect
effect. (Riduwan and Kuncoro 2012, p. 152).
d. Trimming Test
According to Riduwan & Kuncoro (2008, p.127) trimming model it
happened when path of coefficient tested in a whole if there is a variable
insignificant. Although there is one, two or more of insignificant variable,
the researcher must to correct the structure model of path analysis which is
have done hypothesize.
E. Operational Variable
According to Sugiyono (2008, p. 58) research operational are everything
that shaped whatever things which determined by researcher to learn and get
the information about those things, next make a conclusion. Here the table of
operational variable:
Table 3.3
Operational Variable
No Variable Dimensions Indicator Scale
1. Online Sales
Promotion
(X1)
(Himawan &
Abduh, 2015)
1) Online price
discount
1. Reduction
original
sales price
Agreement
2) Online coupon 2. Special
Code
voucher
3) Free shipping 3. Free

51
shipping
cost
2.
Online Service
Quality
(X2)
1) Fulfillment 4. willingness
to help
customer
Agreement
2) Privacy 5. Keeping
personal
Information of
the customer
3) Reliability 6. Give the
service
accurately
4) Efficiency 7. the ability to
do task well and
correctly (no
wasting time,
energy, and
cost)
5) Responsiveness 8. provide
prompt service
6) Compensation 8. Give
comparable
cost to the
customer if

52
No Variable Dimensions Indicator Scale
(Yang & Fang,
2013)
there is a
problems
7) Contact
10.live chat
11.phone number
12.email
3. Customer
satisfaction (Lin,
2007) in
(Lin, 2011)
1) Product
and
Services
13 Overall
evaluation of
the product
14 Service based
on the
customer‟s
past
experience
Agreement
4 Online Customer
Loyalty
(Y2)
(Wan and Huang,
2010) in
(Tjahjaningsih,
2013)
13. Attitude 15 intent to
repurchase
another
product in the
company
16 intent to
recommended
to the others
Agreement

54
No Variable Dimensions Indicator Scale
14. Behaviour 17 Repurchase product
18 Purchase another
product from the
same company
19 Recommending the
product to others
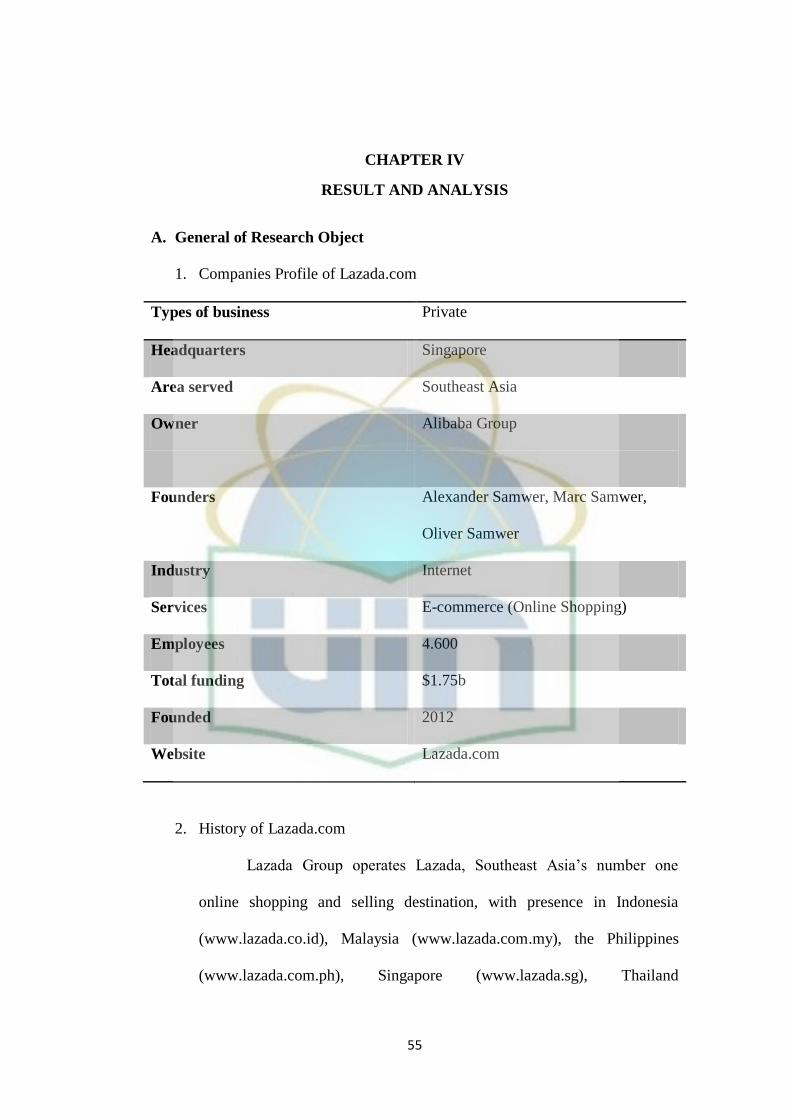
55
CHAPTER IV
RESULT AND ANALYSIS
A. General of Research Object
1. Companies Profile of Lazada.com
Types of business Private
Headquarters Singapore
Area served Southeast Asia
Owner Alibaba Group
Founders Alexander Samwer, Marc Samwer,
Oliver Samwer
Industry Internet
Services E-commerce (Online Shopping)
Employees 4.600
Total funding $1.75b
Founded 2012
Website Lazada.com
2. History of Lazada.com
Lazada Group operates Lazada, Southeast Asia‟s number one
online shopping and selling destination, with presence in Indonesia
(www.lazada.co.id), Malaysia (www.lazada.com.my), the Philippines
(www.lazada.com.ph), Singapore (www.lazada.sg), Thailand

56
(www.lazada.co.th) and Vietnam (www.lazada.vn). Launched in March
2012, Lazada Group has grown rapidly to approximately 7,000 FTEs. The
company has an online footprint of 5 million daily visits to its sites and
mobile apps, and the largest Facebook following in Southeast Asia with
more than 13 million fans.
Lazada is pioneering eCommerce in the region by providing
customers with an effortless shopping experience with multiple payment
methods including cash-on-delivery, extensive customer care and free
returns. Lazada features a wide product offering in categories ranging from
consumer electronics to household goods, toys, fashion and sports
equipment. Lazada offers brands and merchants a marketplace solution
with simple and direct access to about 550 million consumers in six
countries through one retail channel. Lazada Group also operates Lazada
Express, a provider of logistics services, and helloPay, an easy-to use
online payment platform that provides consumers with a secure way of
shopping online.
B. Analysis and Discussion
1. General Description and Respondent Data
The respondents in this research were the customer who ever shopping
in Lazada.com. Based on the data of 100 respondents through questioner,
the characteristic obtained based on gender, age and city.

57
a. General Description and Respondent based on Gender
From distributing the questioner to customer of lazada.com,
researcher got the description about gender from respondents as
follows:
Table 4.1
Respondent based on Gender
Gender Frequency Percentage
Male 45 45%
Female 55 55%
Total 100 100%
Source: Primary data Processed 2017
Based on the research results of 100 respondents, visible in the
table 4.1it can be seen that the percentage of female was larger than
male respondents. There were 45 respondents (45%) male and 55
respondents (55%) female from the results of gender respondents.
b. General Description and Respondent based on Age
From distributing the questioner to the Lazada customer, researcher
gets the description about age from respondents as follows:
Table 4.2
Respondent based on Age
Age Frequency Percentage
18 3 3%
19 3 3%
20 43 43%
21 27 27%
22 13 13%

58
Age Frequency Percentage
23 2 2%
24 1 1%
25 4 4%
Total 100 100%
Source: Primary data Processed 2017
Based on the research results of 100 respondents, visible in the
table 4.2 there were 3 respondents (3%) 18 years old, 3 respondents
(3%) 19 years old, 43 respondents (43%) 20 years old, 27 respondents
(27%) 21 years old, 13 respondents (13%) 22 years old, 2 respondents
(2%) 23 years old, 1 respondents (1%) 24 years old, 4 respondents
(4%) 25 years old.
c. General Description and Respondent based on city
From distributing the questioner to customer of Lazada.com,
Researcher gets the description about city from respondents as
follows:
Table 4.3
Respondent based on province
Province Frequency Percentage
DKI Jakarta 45 45%
West Java 15 15%
Banten 40 40%
Total 100 100%
Source: Primary data Processed 2017
Based on the research results of 100 respondents, visible in the
table 4.3 there were 45 respondents (45%) coming from DKI Jakarta,

59
15 respondents (15%) from West Java, 40 respondents (40%) coming
from Banten.
2. Quality Data Testing
a. Validity Test
The validity of a scale may be defined as the extent to which
differences in observed scale scores reflect true differences among on the
objects on the characteristic being measured, rather than systematic or
random eror. (Malhotra 2009, p. 269).
Test validity in determining the worth or absence of an item to be
used, usually performed significance test of correlation coefficient at 0.30
limitations minimal correlation, meaning that an item is considered valid if
the total score is greater than 0.30 (Priyatno 2010, p. 90).
The questionnaire is divided into four main factors, namely online
sales promotion (X1) with 3 questions, online service quality (X2) with 11
questions, youth customer satisfaction (Y2) with 10 questions, and online
customer loyalty (Y2) with 6 questions, so the total number of questions in
the questionnaire is 30 questions. The validity of each question can be
seen in the table below:
Table 4.4
Tryout Result
Validity Test: Online Sales Promotion (X1)
No Questions Table Value Calculated
Value
Describe
1 Online Sales
Promotion
0.30 0.766 Valid

60
No Questions Table Value Calculated
Value
Describe
2 Online Sales
Promotion
0.30 0.615 Valid
3 Online Sales
Promotion
0.30 0.672 Valid
Source: Primary data Output SPSS 24
From the table above, there are three questions to test online sales
promotion. It can be seen that all of the result of online sales promotion
questions are valid, because the score of total correlation more than 0.30.
Table 4.5
Tryout Result
Validity Test: Online Service Quality (X2)
No Questions Table Value Calculated
Value
Describe
1 Online Service
Quality
0.30 0.589 Valid
2 Online Service
Quality
0.30 0.561 Valid
3 Online Service
quality
0.30 0.656 Valid
4 Online Service
quality
0.30 0.516 Valid
5 Online Service
quality
0.30 0.760 Valid
6 Online Service
quality
0.30 0.762 Valid
7 Online Service
quality
0.30 0.689 Valid
8 Online Service
quality
0.30 0.706 Valid
9 Online Service
quality
0.30 0.663 Valid
Source: Primary data Output SPSS 24

61
From the data above, there are eleven questions to test online
service quality. It can be seen that all of the result of online service quality
are valid, because the score of total correlation more than 0.30.
Table 4.6
Tryout Result
Validity Test: Youth Customer Satisfaction (Y1)
No Questions Table
Value
Calculated
Value
Describe
1 Youth Customer
Satisfaction
0.30 0.779 Valid
2 Youth Customer
Satisfaction
0.30 0.745 Valid
Source: Primary data Output SPSS 24
From the data above, there are ten questions to test youth customer
satisfaction. It can be seen that all of the result of youth customer
satisfaction are valid, because the score of total correlation more than 0.30.
Table 4.7
Tryout Result
Validity Test: Online Customer Loyalty (Y2)
No Questions Table
Value
Calculated
Value
Describe
1 Online Customer
Loyalty
0.30 0.684 Valid
2 Online Customer
Loyalty
0.30 0.657 Valid
3 Online Customer
Loyalty
0.30 0.751 Valid
4 Online Customer
Loyalty
0.30 0.634 Valid
5 Online Customer
Loyalty
0.30 0.771 Valid
Source: Primary data Output SPSS 24

62
From the data above, there are six questions to test online customer
loyalty. It can be seen that all of the result of online customer loyalty are
valid, because the score of total correlation more than 0.30.
b. Reliability Test
Reliability test conducted by researcher to measures the consistency of
questions that include in the questioner on variables. According to
Malhotra (2004:268) a questioner is considered reliable when cronbach‟s
alpha test reached 0.60 or more. Cronbach‟s alpha is the average of all
possible split half coefficients resulting from different ways of splitting the
scale items. The table below shows the reliability test result as follows:
1) Online Sales Promotion
There are three questions about online sales promotion that will be
tested with using reliability test. The variable is categorizes reliable if
cronbach‟s alpha more than 0.60. Here are the results of reliability test
about online sales promotion as follows:
Table 4.8
Tryout Result
Reliability Test of Online Sales Promotion
Reliability Statistics
Croncach’s
Alpha
N of Items
.638 3
Source: Primary data Output SPSS 24

63
Based on the table above, it can be seen the number of cronbach‟s
alpha is 0.638. It means variable of online sales promotion is reliable
because the cronbach‟s alpha shows more than 0.60.
2) Online Service Quality
There are eleven questions about online service quality that will be
tested with using reliability test. The variable is categorizes reliable if
cronbach‟s alpha more than 0.60. Here are the results of reliability test
about online service quality as follows:
Table 4.9
Tryout Result
Reliability Test of Online Service Quality
Reliability Statistics
Croncach’s
Alpha
N of Items
.835 9
Source: Primary data Output SPSS 24
Based on the table above, it can be seen the number of cronbach‟s
alpha is 0.852. It means variable of online service quality is reliable
because the cronbach‟s alpha shows more than 0.60.
3) Youth Customer Satisfaction
There are ten questions about youth customer satisfaction that will be
tested with using reliability test. The variable is categorizes reliable if
cronbach‟s alpha more than 0.60. Here are the results of reliability test
about youth customer satisfaction as follows:

64
Table 4.10
Tryout Result
Reliability of Youth Customer Satisfaction
Reliability Statistics
Croncach’s
Alpha
N of Items
.667 2
Source: Primary data Output SPSS 24
Based on the table above, it can be seen the number of cronbach‟s
alpha is 0.667. It means variable of youth customer satisfaction is reliable
because the cronbach‟s alpha shows more than 0.60.
4) Online Customer Loyalty
There are six questions about online customer loyalty that will be
tested with using reliability test. The variable is categorizes reliable if
cronbach‟s alpha more than 0.60. Here are the results of reliability test
about online customer loyalty as follows:
Table 4.11
Tryout Result
Reliability of Online Customer Loyalty
Reliability Statistics
Croncach’s
Alpha
N of Items
.736 5
Source: Primary data Output SPSS 24
Based on the table above, it can be seen the number of cronbach‟s
alpha is 0.736. It means variable of online customer loyalty is reliable
because the cronbach‟s alpha shows more than 0.60.

65
c. Normality Test
According to (Ghozali 2011, p. 160), normality test have a purpose to
examine whether residual regression variable model have normal
distribution. A good regression model is the model have normal data
distribution or at least approach to normal. In this research, the way to
detect whether the residual have normal distribution or not that is we can
see in histogram graph and see in normal probability plot which is
compared from normal distribution to cumulative distribution. Normal
distribution will form one diagonal straight line and plotting of residual
data and compared by diagonal line. If residua distribution data is normal
then the line will described in truth data and following the line of diagonal.
Figure 4.1
The Result of Normality Test Sub Structure I
Source: Primary data Processed 2017

66
Based on the figure 4.1 above we can see the result of normality test
sub structure I showed that data or variable model have normal
distribution because the line will described in truth data and following the
line of diagonal.
d. Sub Structure II
Figure 4.2
The Result of Normality Test Sub Structure II
Based on the figure 4.2 above we can see the result of normality
test sub structure I showed that data or variable model have normal
distribution because the line will described in truth data and following the
line of diagonal.

67
3. Descriptive Analysis
a. Online Sales Promotion
There are three questions in online sales promotion, every question
have different frequency and percent. The frequency number gets from
respondent value. Here are the explanations of each question:
Table 4.12
The reduction of original price in Lazada.com already appropriate
with my desired
Answer Frequency Percent
Strongly Agree 18 18%
Agree 48 48%
Neutral 31 31%
Disagree 2 2%
Strongly Disagree 1 1%
Total 100 100%
Source: Primary data Processed 2017
Based on the table 4.11 showed that 18 respondent (18%) strongly
agree, 48 respondent (48%) agree, 31 respondent (31%) neutral, 2
respondent (2%) disagree, 1 respondent (1%) strongly disagree. The table
results shown the majority of respondents agree that the reduction of
original price in Lazada.com already appropriate with consumer desired.
Table 4.13
Lazada.com gave favorable code voucher
Answer Frequency Percent
Strongly Agree 17 17%
Agree 51 51%

68
Answer Frequency Percent
Neutral 29 29%
Disagree 3 3%
Strongly Disagree 0 0%
Total 100 100%
Source: Primary data Processed 2017
Based on the table 4.12 showed that 17 respondent (17%) strongly
agree, 51 respondent (51%) agree, 29 respondent (29%) neutral, 3
respondent (3%) disagree, 0 respondent (0%) strongly disagree. The table
results shown the majority of respondents agree that Lazada.com gave
favorable code voucher.
Table 4.14
Free shipping promotion make me wants to shop in Lazada.com
Answer Frequency Percent
Strongly Agree 58 58%
Agree 35 35%
Neutral 6 6%
Disagree 1 1%
Strongly Disagree 0 0%
Total 100 100%
Source: Primary data Processed 2017
Based on the table 4.13 showed that 58 respondent (58%) strongly
agree, 35 respondent (35%) agree, 6 respondent (6%) neutral, 1 respondent
(1%) disagree, 0 respondent (0%) strongly disagree. The table results
shown the majority of respondents strongly agree that free shipping
promotion make consumer wants to shop in Lazada.com.
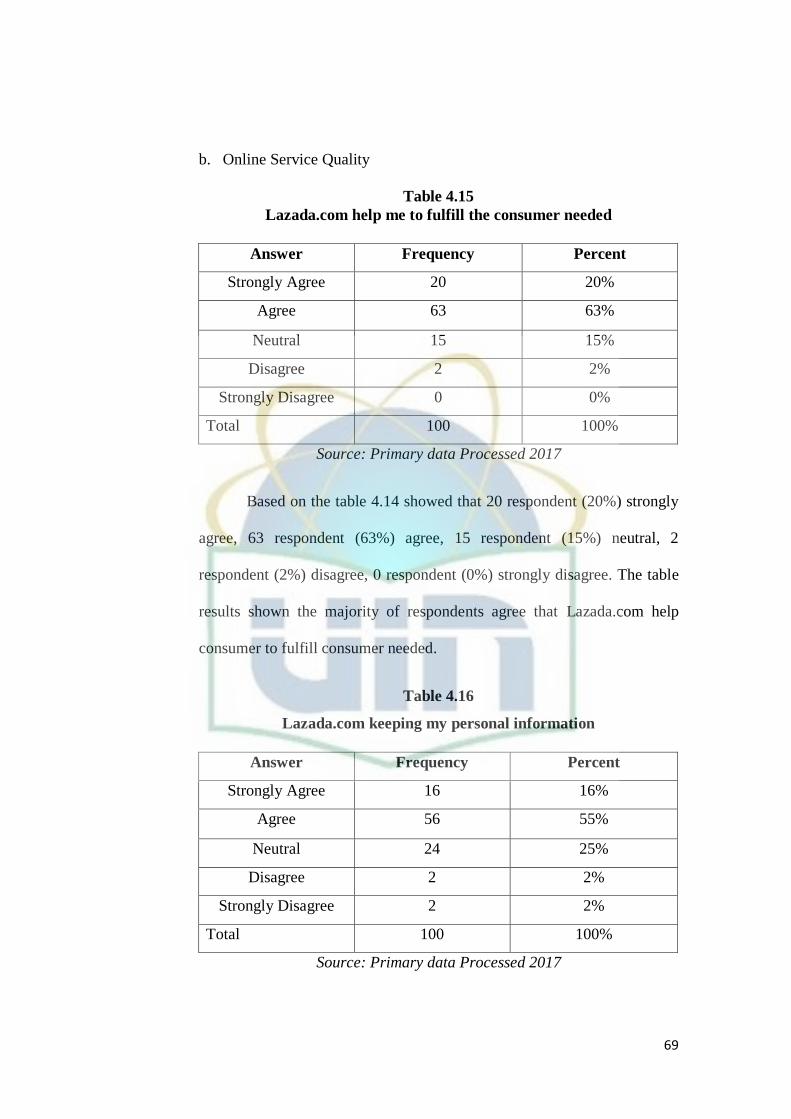
69
b. Online Service Quality
Table 4.15
Lazada.com help me to fulfill the consumer needed
Answer Frequency Percent
Strongly Agree 20 20%
Agree 63 63%
Neutral 15 15%
Disagree 2 2%
Strongly Disagree 0 0%
Total 100 100%
Source: Primary data Processed 2017
Based on the table 4.14 showed that 20 respondent (20%) strongly
agree, 63 respondent (63%) agree, 15 respondent (15%) neutral, 2
respondent (2%) disagree, 0 respondent (0%) strongly disagree. The table
results shown the majority of respondents agree that Lazada.com help
consumer to fulfill consumer needed.
Table 4.16
Lazada.com keeping my personal information
Answer Frequency Percent
Strongly Agree 16 16%
Agree 56 55%
Neutral 24 25%
Disagree 2 2%
Strongly Disagree 2 2%
Total 100 100%
Source: Primary data Processed 2017

70
Based on the table 4.15 showed that 16 respondent (16%) strongly
agree, 56 respondent (56%) agree, 24 respondent (24%) neutral, 2
respondent (2%) disagree, 2 respondent (2%) strongly disagree. The table
results shown the majority of respondents agree that Lazada.com keeping
consumer personal information.
Table 4.17
Lazada.com provide accurately services already appropriate with my
desired
Answer Frequency Percent
Strongly Agree 21 21%
Agree 56 56%
Neutral 21 21%
Disagree 2 2%
Strongly Disagree 0 0%
Total 100 100%
Source: Primary data Processed 2017
Based on the table 4.16 showed that 21 respondent (21%) strongly
agree, 56 respondent (56%) agree, 21 respondent (21%) neutral, 2
respondent (2%) disagree, 0 respondent (0%) strongly disagree. The table
results shown the majority of respondents agree that Lazada.com provide
accurately services already appropriate with consumer desired.

71
Table 4.18
Lazada.com provide efficient services such as energy, money & time
that lazada.com gave already appropriate with my desired
Answer Frequency Percent
Strongly Agree 12 12%
Agree 65 65%
Neutral 23 23%
Disagree 0 0%
Strongly Disagree 0 0%
Total 100 100%
Source: Primary data Processed 2017
Based on the table 4.17 showed that 12 respondent (12%) strongly
agree, 65 respondent (65%) agree, 23 respondent (23%) neutral, 0
respondent (0%) disagree, 0 respondent (0%) strongly disagree. The table
results shown the majority of respondents agree that Lazada.com provide
efficient services such as energy, money and time that Lazada.com gave
already appropriate with consumer desired.
Table 4.19
Lazada.com giving prompt services for me
Answer Frequency Percent
Strongly Agree 17 16%
Agree 57 57%
Neutral 23 23%
Disagree 3 3%
Strongly Disagree 0 0%
Total 100 100%

72
Source: Primary data Processed 2017
Based on the table 4.18 showed that 17 respondent (17%) strongly
agree, 57 respondent (57%) agree, 23 respondent (23%) neutral, 3
respondent (3%) disagree, 0 respondent (0%) strongly disagree. The table
results shown the majority of respondents agree that Lazada.com giving
prompt services for me.
Table 4.20
Lazada.com gave comparable cost if there is damage in the product
Answer Frequency Percent
Strongly Agree 23 23%
Agree 48 48%
Neutral 20 19%
Disagree 8 8%
Strongly Disagree 1 1%
Total 100 100%
Source: Primary data Processed 2017
Based on the table 4.19 showed that 23 respondent (23%) strongly
agree, 48 respondent (48%) agree, 20 respondent (20%) neutral, 8
respondent (8%) disagree, 1 respondent (1%) strongly disagree. The table
results shown the majority of respondents agree that Lazada.com gave
comparable cost if there is damage in the product.

73
Table 4.21
Live chat services that owned by Lazada.com helps my needed
Answer Frequency Percent
Strongly Agree 19 19%
Agree 55 55%
Neutral 20 20%
Disagree 5 5%
Strongly Disagree 1 1%
Total 100 100%
Source: Primary data Processed 2017
Based on the table 4.20 showed that 19 respondent (19%) strongly
agree, 55 respondent (55%) agree, 20 respondent (20%) neutral, 5
respondent (5%) disagree, 1 respondent (1%) strongly disagree. The table
results shown the majority of respondents agree that live chat services that
owned by Lazada.com helps consumer needed.
Table 4.22
The phone number that provided by Lazada.com is useful for me
when I get trouble
Answer Frequency Percent
Strongly Agree 15 15%
Agree 41 41%
Neutral 36 36%
Disagree 6 6%
Strongly Disagree 2 2%
Total 100 100%
Source: Primary data Processed 2017
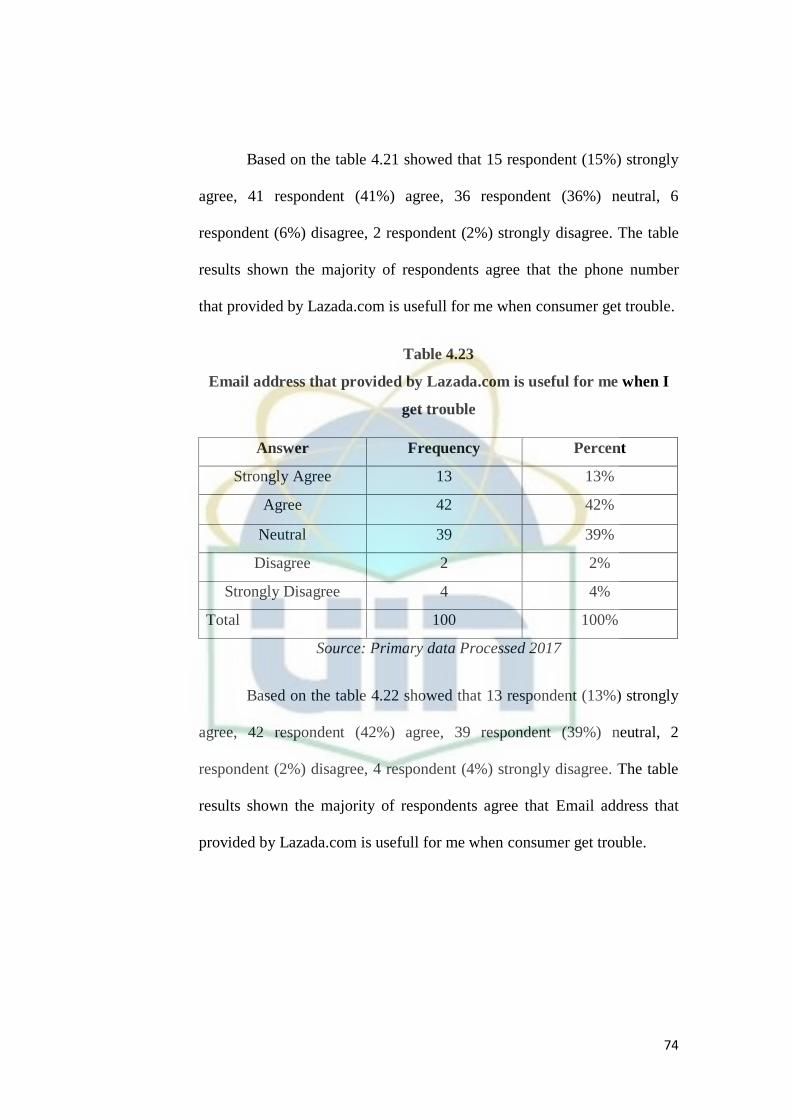
74
Based on the table 4.21 showed that 15 respondent (15%) strongly
agree, 41 respondent (41%) agree, 36 respondent (36%) neutral, 6
respondent (6%) disagree, 2 respondent (2%) strongly disagree. The table
results shown the majority of respondents agree that the phone number
that provided by Lazada.com is usefull for me when consumer get trouble.
Table 4.23
Email address that provided by Lazada.com is useful for me when I
get trouble
Answer Frequency Percent
Strongly Agree 13 13%
Agree 42 42%
Neutral 39 39%
Disagree 2 2%
Strongly Disagree 4 4%
Total 100 100%
Source: Primary data Processed 2017
Based on the table 4.22 showed that 13 respondent (13%) strongly
agree, 42 respondent (42%) agree, 39 respondent (39%) neutral, 2
respondent (2%) disagree, 4 respondent (4%) strongly disagree. The table
results shown the majority of respondents agree that Email address that
provided by Lazada.com is usefull for me when consumer get trouble.

75
c. Youth Customer Satisfaction
Table 4.24
I am using Lazada.com because of overall evaluation product
Answer Frequency Percent
Strongly Agree 18 19%
Agree 48 59%
Neutral 31 22%
Disagree 2 0%
Strongly Disagree 1 0%
Total 100 100%
Source: Primary data Processed 2017
Based on the table 4.25 showed that 18 respondent (18%) strongly
agree, 48 respondent (48%) agree, 31 respondent (31%) neutral, 2
respondent (2%) disagree, 1 respondent (1%) strongly disagree. The table
results shown the majority of respondents agree that consumer using
Lazada.com because of overall evaluation product.
Table 4.25
I am using Lazada.com because of service based on the my past
experience
Answer Frequency Percent
Strongly Agree 17 22%
Agree 51 65%
Neutral 29 11%
Disagree 3 0%
Strongly Disagree 0 2%
Total 100 100%

76
Source: Primary data Processed 2017
Based on the table 4.26 showed that 17 respondent (17%) strongly
agree, 51 respondent (51%) agree, 29 respondent (29%) neutral, 3
respondent (3%) disagree, 0 respondent (0%) strongly disagree. The table
results shown the majority of respondents agree that consumer using
Lazada.com because of service based on consumer past experience.
d. Online Customer Loyalty
Table 4.26
I intent to repurchase another product in Lazada.com
Answer Frequency Percent
Strongly Agree 20 15%
Agree 63 41%
Neutral 15 38%
Disagree 2 3%
Strongly Disagree 0 3%
Total 100 100%
Source: Primary data Processed 2017
Based on the table 4.35 showed that 20 respondent (20%) strongly
agree, 63 respondent (63%) agree, 15 respondent (15%) neutral, 2
respondent (2%) disagree, 0 respondent (0%) strongly disagree. The table
results shown the majority of respondents agree that consumer inrent to
repurchase another product in Lazada.com.

77
Table 4.27
I intent to recommended Lazada.com to the others
Answer Frequency Percent
Strongly Agree 16 15%
Agree 55 45%
Neutral 25 37%
Disagree 2 2%
Strongly Disagree 2 1%
Total 100 100%
Source: Primary data Processed 2017
Based on the table 4.36 showed that 16 respondent (16%) strongly
agree, 55 respondent (55%) agree, 25 respondent (25%) neutral, 2
respondent (2%) disagree, 2 respondent (2%) strongly disagree. The table
results shown the majority of respondents agree that consumer intent to
recommended Lazada.com to the others.
Table 4.28
I have repurchase Lazada.com product
Answer Frequency Percent
Strongly Agree 21 17%
Agree 56 33%
Neutral 20 41%
Disagree 2 4%
Strongly Disagree 1 5%
Total 100 100%
Source: Primary data Processed 2017
Based on the table 4.37 showed that 21 respondent (21%) strongly
agree, 56 respondent (56%) agree, 20 respondent (20%) neutral, 2

78
respondent (2%) disagree, 1 respondent (1%) strongly disagree. The table
results shown the majority of respondents agree that consumer has
repurchase Lazada.com product.
Table 4.29
I have repurchase another product in Lazada.com
Answer Frequency Percent
Strongly Agree 12 38%
Agree 65 55%
Neutral 23 6%
Disagree 0 1%
Strongly Disagree 0 0%
Total 100 100%
Source: Primary data Processed 2017
Based on the table 4.40 showed that 12 respondent (12%) strongly
agree, 65 respondent (65%) agree, 23 respondent (23%) neutral, 0
respondent (0%) disagree, 0 respondent (0%) strongly disagree. The table
results shown the majority of respondents agree that consumer has
repurchase another product in Lazada.com.
Table 4.30
I have recommended Lazada.com to the others
Answer Frequency Percent
Strongly Agree 17 20%
Agree 57 36%
Neutral 23 37%
Disagree 3 6%
Strongly Disagree 0 1%
Total 100 100%

79
Source: Primary data Processed 2017
Based on the table 4.38 showed that 17 respondent (17%) strongly
agree, 57 respondent (57%) agree, 23 respondent (23%) neutral, 3
respondent (3%) disagree, 0 respondent (0%) strongly disagree. The table
results shown the majority of respondents agree that consumer has
recommended Lazada.com to the others.
4. Path Analysis
a. Hypothesis Testing
1. Testing and Understanding Sub Structural I
The formula model of the sub structural I equation here are as follows:
Y= PY1X1 + PY1X2 +ϵ1
Based on the calculation results using SPSS 24, obtained the results
with simultaneously and partial here are as follows:
a) To see The Influence Online Sales Promotion (X1) and Online Service
Quality (X2) Simultaneously toward Youth Customer Satisfaction (Y1)
To see the influence online sales promotion variable and online
service quality toward youth customer satisfaction simultaneously we
can see from the calculation in Summary Model, especially R Square
number below:
Table 4.31
Model Summary Sub Structure I
Model R R Square Adjusted R
Square
Std. Error of
the Estimate
1 .911a
.830 .827 .487
80
a. Dependent Variable: Youth Customer Satisfaction
b. Predictors: (Constant), Online Service Quality, Online Sales Promotion
Source: Primary data Processed 2017
The number of R Square is 0.830. The number used to see how
much the influence of online sales promotion and online service
quality toward youth customer satisfaction in a way calculating the
coefficient determination using this formula:
KD = r2 x 100%
KD = 0.830 x 100%
KD = 83.0%
The number above have means that the influence of online sales
promotion and online service quality toward youth customer
satisfaction simultaneously is 83.0% and the residue is 17% (100% -
83.0%) influenced by another factor. In other word, youth customer
satisfaction can be explain using online sales promotion and online
service quality variable amount 83.0% while the influence amount
17% caused by another variable outside this model.
To know whether regression model above is correct or incorrect
needed to test hypothesis. Hypothesis testing using the number of F
test here are as follows:

81
Table 4.32
ANOVAa
Model Sum of
Squares
Df Mean
Square
F Sig.
1 Regression
residual
total
112.575
22.985
135.560
2
97
99
56.288
.237
237.545 .000b
a. Dependent Variable: Youth Customer Satisfaction
b. Predictors: (Constant), Online Service Quality, Online Sales Promotion
Source: Primary data Processed 2017
Here the hypothesis as follows:
H0: Online sales promotion and online service quality have no influence
on youth customer satisfaction
H1: Online sales promotion and online service quality have influence on
youth customer satisfaction
The test could be done in two ways:
1) Comparing the number of F test and F table on anova table, F test
obtained amount 237.545 and F table obtained amount 2.70.
If F test > F table H0 is rejected and H1 is accepted
If F test < F table H0 is accepted and H1 is rejected
From obtained results the number of F test amount 237.545 > 2.70
the results indicated that H0 is rejected and H1 is accepted , its means
Online sales promotion and online service quality have influence on
youth customer satisfaction.

82
2) Comparing the amount of the level significant with significant level
0.05
If the number of probability 0.05 smaller or equal with probability
number of significant or [0.05 ≤ Sig], so H0 is accepted and H1 is
rejected, its means insignificant.
If the number of probability 0.05 more than or equal with probability
number of significant or [0.05 ≥ Sig], so H0 is rejected and H1 is
accepted, its means significant.
Based on calculated from anova table the number of significant
(Sig.) is 0.000 the number shows that the number of significant level
0.05 more than or equal with the number of significant (Sig) [0.05 ≥
0.000] so H0 is rejected and H1 is accepted. Its means, online sales
promotion and online service quality have influence on youth customer
satisfaction.
b) To see The Influence Online Sales Promotion (X1) and Online Service
Quality (X2) Partially toward Youth Customer Satisfaction (Y)
To see the influence variable of online sales promotion and online
service quality partially with youth customer satisfaction using t test
whereas, to see magnitude of influence used the beta number or
Standardized Coefficient below here:

83
Table4.33
Correlation Coefficient Substructure I
Coefficientsa
Model
Unstandardized
Coefficient
Standardized
Coefficient
t
Sig. B Std.
Error
Beta
1 (Constant)
Online Sales
Promotion (X1)
-1.270
.679
.447
.037
.873
-2.842
18.501
.005
.000
Online Service
Quality (X2)
.019 .012 .076 1.614 .110
a. Dependent Variable: Youth Customer Satisfaction
Source: Primary data Processed 2017
1. The influence between online sales promotion and youth customer
satisfaction
The hypothesis as follows:
H0: Online sales promotion has no influence on youth customer
satisfaction
H1: Online sales promotion has influence on youth customer
satisfaction
The test could be done in two ways:
1) Comparing the number of t-test and t-table, t-test amount 18.501
and t-table obtained 1.664. With the formula degree of freedom (df)
= n – k (number of respondent – number of variable) or df = 100 - 4
or 96 the results amount 1.664. with the criteria hypothesis testing
are:
If t test > t table H0 is rejected and H1 is accepted

84
If t test < t table H0 is accepted and H1 is rejected
Based on the calculated obtained t test amount 18.501 > 1.664
so, H0 is rejected and H1 is accepted, its means online sales
promotion has influence on youth customer satisfaction.
2) Comparing the amount significant level with significant level of
0.05
If the number of the probability 0.05 smaller or equal than the
number of Sig probability or [0.05 ≤ Sig], so H0 is accepted and
H1is rejected, its means insignificant.
If the number of probability is 0.05 higher or equal with the
number of Sig probability or [0.05 ≥ Sig]. so H0 is rejected and H1
is accepted, its means significant.
Based on the results number of significant (Sig) coefficient table
for online sales promotion is 0.000 the number shown the
significant level of 0.05 smaller or equal with the number of
significant level (Sig) [0.05 ≥ 0.000] so H0 is rejected and H1 is
accepted. Its means online sales promotion has influence on youth
customer satisfaction.
2. The influence between online service quality and youth customer
satisfaction
The hypothesis as follows:
H0: Online service quality has no influence on youth customer
satisfaction

85
H1: Online service quality has influence on youth customer
satisfaction
The test could be done in two ways:
1) Comparing the number of t-test and t-table, t-test amount 1.614
and t-table obtained 1.664. With the formula degree of freedom
(df) = n – k (number of respondent – number of variable) or df =
100 - 4 or 96 the results amount 1.664. with the criteria
hypothesis testing are:
If t test > t table H0 is rejected and H1 is accepted
If t test < t table H0 is accepted and H1 is rejected
Based on the calculated obtained t test amount 1.614 <
1.664 so, H0 is accepted and H1 is rejected, its means online
service quality has no influence on youth customer
satisfaction.
2) Comparing the amount significant level with significant level of
0.05
If the number of the probability 0.05 smaller or equal than the
number of Sig probability or [0.05 ≤ Sig], so H0 is accepted and
H1is rejected, its means insignificant.
If the number of probability is 0.05 higher or equal with the
number of Sig probability or [0.05 ≥ Sig]. so H0 is rejected and H1
is accepted, its means significant.

86
Based on the results number of significant (Sig) coefficient
table for online service quality is 0.110 the number shown the
significant level of 0.05 smaller or equal with the number of
significant level (Sig) [0.05 ≤ 0. 110] so H0 is accepted and H1 is
rejected. Its means online service quality has no influence on
youth customer satisfaction.
This result appropriate with Susanti‟s journal, the title is
the influence of price, promotion, services and product quality
toward online customer satisfaction, the journal said that online
sales promotion has significant effect toward customer
satisfaction partially but there is a different also with susanti
journal that online service quality has no significant effect toward
customer satisfaction partially and online sales promotion with
online service quality has no significant effect simultaneously
toward customer satisfaction. Therefore in another words that
online sales promotion in Lazada.com has influence toward
youth customer satisfaction and online service quality in
Lazada.com has no ensure get youth customer satisfaction.
Because of online service quality has weak influence toward
youth customer satisfaction.
The equation of sub structural I become:
Y = 0.873X1 + 0.076X2 + ϵ1
The number of residue amount 0.478ɛ1 obtained from 1-R

87
1 – 0.830= 0.170
Figure 4.3
Hypothesis Test Model Sub Structure I
2. Testing and Understanding Sub Structural II
The formula model of the sub structural II equation here are as
follows:
Y2= PY2x1X1 + PY2Y1 + ɛ2
Based on the calculation results using SPSS 24, obtained the
results with simultaneously and partial here are as follows:
a) To see The Influence Online Sales Promotion (X1) and Online
Service Quality (X2) and Youth Customer Satisfaction (Y)
Simultaneously toward Online Customer Loyalty (Y2)
To see the influence Online Sales Promotion variable, Online
Service Quality and Youth Customer Satisfaction toward Online
Customer Loyalty, we can see from the calculation in Summary
Model, especially R Square number below here:
Table 4.34
Model Summary Sub Structure II
Model R R Square Adjusted R
Square
Std. Error of
the Estimate
1 .888a
.788 .782 1.135
Online Sales
Promotion (X1)
Online Service
Quality (X2)
Youth
Customer
Satisfaction
(y)
0.873
0.076
0.170

88
a. Predictors: (Constan) Online Service Quality
b. Dependent Variable: Youth Customer Satisfaction
Source: Primary data Processed 2017
The number of R Square is 0.788. The number used to see how
much the influence of online sales promotion, online service
quality and youth customer satisfaction toward online customer
loyalty in a way calculating the coefficient determination using this
formula:
KD = r2 x 100%
KD = 0.788 x 100%
KD = 78.8%
The number above have means that the influence of online sales
promotion, online service quality and youth customer satisfaction
toward online customer loyalty amount 78.8% and the residue is
21.2% (100% - 78.8%) influenced by another factor. In other word,
online customer loyalty can be explain using online sales
promotion, online service quality and youth customer satisfaction
variable amount 78.8% while the influence amount 21.2% caused
by another variable outside this model.
To know whether regression model above is correct or incorrect
needed to test hypothesis. Hypothesis testing using the number of F
test here are as follows:
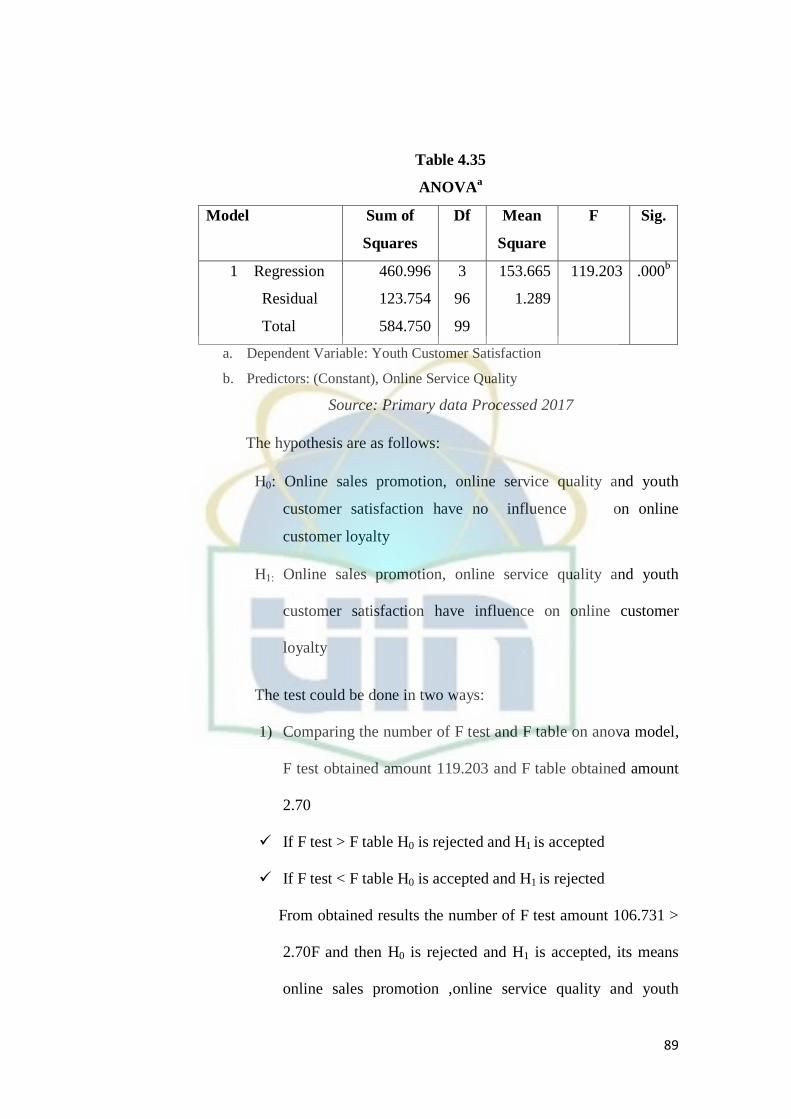
89
Table 4.35
ANOVAa
Model Sum of
Squares
Df Mean
Square
F Sig.
1 Regression
Residual
Total
460.996
123.754
584.750
3
96
99
153.665
1.289
119.203 .000b
a. Dependent Variable: Youth Customer Satisfaction
b. Predictors: (Constant), Online Service Quality
Source: Primary data Processed 2017
The hypothesis are as follows:
H0: Online sales promotion, online service quality and youth
customer satisfaction have no influence on online
customer loyalty
H1: Online sales promotion, online service quality and youth
customer satisfaction have influence on online customer
loyalty
The test could be done in two ways:
1) Comparing the number of F test and F table on anova model,
F test obtained amount 119.203 and F table obtained amount
2.70
If F test > F table H0 is rejected and H1 is accepted
If F test < F table H0 is accepted and H1 is rejected
From obtained results the number of F test amount 106.731 >
2.70F and then H0 is rejected and H1 is accepted, its means
online sales promotion ,online service quality and youth

90
customer satisfaction have influence on online customer
loyalty
2) Comparing the amount of the level significant with
significant level 0.05
If the number of probability 0.05 smaller or equal with
probability number of significant or [0.05 ≤ Sig], so H0 is
accepted and H1 is rejected, its means insignificant.
If the number of probability 0.05 more than or equal with
probability number of significant or [0.05 ≥ Sig], so H0 is
rejected and H1 is accepted, its means significant.
Based on calculated from anova table the number of
significant (Sig.) is 0.000 the number shows that the number
of significant level 0.05 more than or equal with the number
of significant (Sig) [0.05 ≥ 0.000] so H0 is rejected and H1 is
accepted. Its means, online sales promotion and online
service quality have influence on online customer loyalty.
b) To see The Influence Online Sales Promotion (X1) and Online
Service Quality (X2) and Youth Customer Satisfaction (Y1)
Simultaneously toward Online Customer Loyalty (Y2)
To see the influence variable of online sales promotion, online
service quality and youth customer satisfaction partially with
online customer loyalty using t test whereas, to see magnitude of

91
influence used the beta number or Standardized Coefficient below
here:
Table4.36
Correlation Coefficient Substructure II
Coefficientsa
Model
Unstandardized
Coefficient
Standardized
Coefficient
T
Sig. B Std.
Error
Beta
1 (Constant)
Online
Sales
Promotion
(X1)
4.720
-.234
1.085
.182
-.145
4.352
-1.288
.000
.201
Online
Service
Quality
(X2)
.485 .028 .922 17.165 .000
Youth
Customer
Satisfaction
.125 .237 .060 .529 .598
a. Dependent Variable: Online Customer Loyalty
Source: Primary data Processed 2017
1. The influence online sales promotion toward online customer loyalty
The hypothesis as follows:
H0: Online sales promotion has no influence on online customer loyalty
H1: Online sales promotion has influence on online customer loyalty
The test could be done in two ways:
1) Comparing the number of t-test and t-table, t test amount
-1.288 and t table obtained 1.664 with the formula degree of
freedom (df) = n – k (number

92
of respondent – number of variable) or df = 100 - 4 or 96 the results
amount 1.664. with the criteria hypothesis testing are:
If t test > t table H0 is rejected and H1 is accepted
If t test < t table H0 is accepted and H1 is rejected
Based on the calculated obtained t test amount -1.288 < 1.664 so,
H0 is accepted and H1 is rejected, its means online sales promotion
has no influence on online customer loyalty
2) Comparing the amount significant level with significant level of
0.05
If the number of the probability 0.05 smaller or equal than
the number of Sig probability or [0.05 ≤ Sig], so H0 is accepted and
H1is rejected, its means insignificant.
If the number of probability is 0.05 higher or equal with the
number of Sig probability or [0.05 ≥ Sig]. so H0 is rejected and H1
is accepted, its means significant.
Based on the results number of significant (Sig) coefficient table
for online sales promotion is 0.201 the number shown the
significant level of 0.05 smaller or equal with the number of
significant level (Sig) [0.05 ≤ 0. 201] so H0 is accepted and H1 is
rejected. Its means online sales promotion has no influence on
online customer loyalty

93
2. The influence between online service quality and online customer
loyalty
The hypothesis as follows:
H0: Online service quality has no influence on online customer
loyalty
H1: Online service quality has influence on online customer loyalty
The test could be done in two ways:
1) Comparing the number of t-test and t-table, t test amount 17.165
and t-table obtained 1.664. With the formula degree of freedom (df)
= n – k (number of respondent – number of variable) or df = 100 - 4 or
96 the results amount 1.664. with the criteria hypothesis testing are:
If t test > t table H0 is rejected and H1 is accepted
If t test < t table H0 is accepted and H1 is rejected
Based on the calculated obtained t test amount 17.165 > 1.664
then, H0 is rejected and H1 is accepted, its means Online service
quality has influence on online customer loyalty.
2) Comparing the amount significant level with significant level of 0.05
If the number of the probability 0.05 smaller or equal than the
number of Sig probability or [0.05 ≤ Sig], so H0 is accepted and H1is
rejected, its means insignificant.
If the number of probability is 0.05 higher or equal with the
number of Sig probability or [0.05 ≥ Sig]. So H0 is rejected and H1 is
accepted, its means significant.

94
Based on the results number of significant (Sig) coefficient
table for online service quality is 0.000 the number shown the
significant level of 0.05 smaller or equal with the number of significant
level (Sig) [0.05 ≥ 0.000] so H0 is rejected and H1 is accepted. Its
means online service quality has influence on online customer loyalty.
3. The influence between youth customer satisfaction and online
customer loyalty
The hypothesis as follows:
H0: Youth customer satisfaction has no influence on online
customer loyalty
H1: Youth customer satisfaction has influence on online customer
loyalty
The test could be done in two ways:
1) Comparing the number of t-test and t-table, t-test amount 0.529 and
t-table obtained 1.664. With the formula degree of freedom (df) = n –
k (number of respondent – number of variable) or df = 100 - 4 or 96
the results amount 1.664. with the criteria hypothesis testing are:
If t-test > t- table H0 is rejected and H1 is accepted
If t- test < t-table H0 is accepted and H1 is rejected
Based on the calculated obtained t-test amount 0.529 < 1.664 so,
H0 is accepted and H1 is rejected, its means youth customer
satisfaction has no influence on online customer loyalty
2) Comparing the amount significant level with significant level of 0.05

95
If the number of the probability 0.05 smaller or equal than the
number of Sig probability or [0.05 ≤ Sig], so H0 is accepted and H1is
rejected, its means insignificant.
If the number of probability is 0.05 higher or equal with the
number of Sig probability or [0.05 ≥ Sig]. So H0 is rejected and H1 is
accepted, its means significant.
Based on the results number of significant (Sig) coefficient table
for youth customer satisfaction is 0.598 the number shown the
significant level of 0.05 smaller or equal with the number of significant
level (Sig) [0.05 ≤ 0. 598] so H0 is accepted and H1 is rejected. Its
means youth customer satisfaction has no influence on online customer
loyalty.
This result different with Bowen and Chen‟s journal, the title is
the relationship between customer loyalty and customer satisfaction,
the journal said that there is has positive influence among customer
satisfaction and customer loyalty. Therefore in another words, that
youth customer satisfaction in Lazada.com has no ensure get online
customer loyalty. Because of youth customer satisfaction has weak
influence toward online customer loyalty.
The equation of sub structural II become:
Y2 = -0.145X1 +0.922X2+ 0.060Y1 + ɛ2
The number of residue amount 0.479ɛ1 obtained from 1-R
1 – 0.788 = 0.212

96
Figure 4.4
Hypothesis Test: Model Sub Structure II
ɛ2
b. Correlation Analysis
Table 4.37
Correlations
Online Sales
Promotion (X1)
Online Service
Quality (X2)
Online Sales
Promotion (X1)
Pearson Correlation
1 .464**
Sig. (2-tailed)
N
100
.000
100
Online Service
Quality (X2)
Pearson Correlation .464**
1
Sig. (2-tailed)
N
.000
Sig. (2-tailed)
N
.000
100
100
**.Correlation is significant at the 0.01 level (2-tailed)
Source: Primary data Processed 2017
The correlations between Online Sales Promotion and Online Service Quality
Online
Sales
Promotion
(X1)
Online
Service
Quality
(X2)
Youth
Customer
Satisfaction
(Y)
Online
Customer
Loyalty
(Y2)
-0.145
0.060
0.212
0.922

97
Based on the calculation results the correlation number between online
sales promotion variable and online service quality amount 0.464, to explain the
number, we used criteria as follows:
0.0-0.25 : very weak correlation
>0.25-0.5 : weak correlation
>0.5-0.75 : strong correlation
>0.75-1 : very strong correlation
The number correlation amount 0.464, its means relationship between online
sales promotion and online service quality they have weak correlation and the
correlation coefficient indicates that the relationship between variables is
negative. Negative correlation is a relationship between two variables in which
one variable increases as the other decreases, and vice versa. Both variable is
significant because the number of significant amount 0.000 < 0.05. If the number
of significant (sig,) < 0.05 so, the relationship both variable is significant, and the
other hand if the number of significant (sig.) > 0.05 so the relationship both
variable is insignificant.
c. Direct, Indirect and Total Effect
1. Direct Effect
To calculate direct effect, used the formula as follows:
a) The influence online sales promotion toward youth customer
satisfaction
X1 Y = 0.873

98
b) The influence online service quality toward youth customer
satisfaction
X2 Y = 0. 076
c) The influence online sales promotion toward online customer loyalty
X1 Z = -0.145
d) The influence online service quality toward online customer loyalty
X2 Z = 0.922
e) The influence youth customer satisfaction toward online customer
loyalty
Y Z = 0. 060
2. Indirect Effect
a) The influence variable of online sales promotion toward online
customer loyalty mediated by youth cus
b) tomer satisfaction
X1 Y Z = (0.873x 0.060) = 0.005
c) The influence variable of online service quality toward online
customer loyalty mediated by youth customer satisfaction
X2 Y Z = (0. 076 x 0.060) = 0.0005
3. Total Effect
a) The influence variable of online sales promotion toward online
customer loyalty mediated by youth customer satisfaction
X1 Y Z = (-0.145 + 0.060) = -0.085
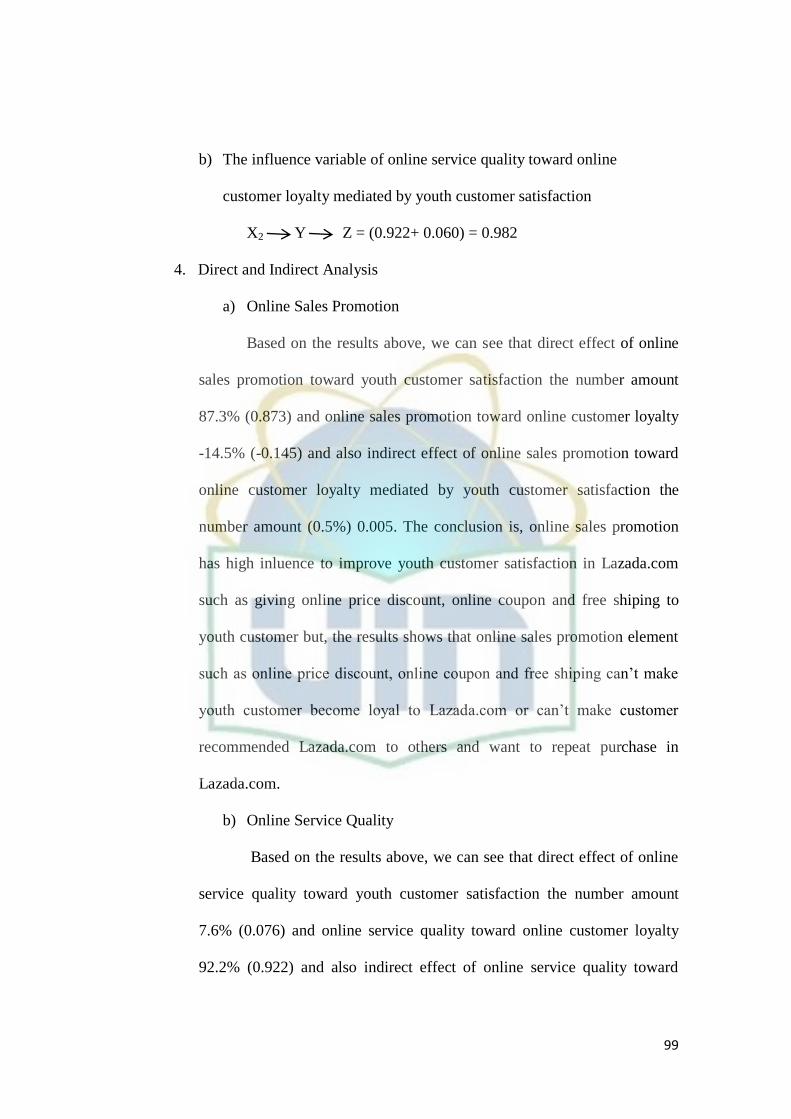
99
b) The influence variable of online service quality toward online
customer loyalty mediated by youth customer satisfaction
X2 Y Z = (0.922+ 0.060) = 0.982
4. Direct and Indirect Analysis
a) Online Sales Promotion
Based on the results above, we can see that direct effect of online
sales promotion toward youth customer satisfaction the number amount
87.3% (0.873) and online sales promotion toward online customer loyalty
-14.5% (-0.145) and also indirect effect of online sales promotion toward
online customer loyalty mediated by youth customer satisfaction the
number amount (0.5%) 0.005. The conclusion is, online sales promotion
has high inluence to improve youth customer satisfaction in Lazada.com
such as giving online price discount, online coupon and free shiping to
youth customer but, the results shows that online sales promotion element
such as online price discount, online coupon and free shiping can‟t make
youth customer become loyal to Lazada.com or can‟t make customer
recommended Lazada.com to others and want to repeat purchase in
Lazada.com.
b) Online Service Quality
Based on the results above, we can see that direct effect of online
service quality toward youth customer satisfaction the number amount
7.6% (0.076) and online service quality toward online customer loyalty
92.2% (0.922) and also indirect effect of online service quality toward

100
Online
Service
Quality
(X2)
Online Youth
Customer
Satisfaction
(Y)
Online
Customer
Loyalty
(Z)
Online
Sales
Promotion
(X1)
online customer loyalty mediated by youth customer satisfaction the
number amount 0.05% (0.0005).The conclusion is, online service quality
element such as Lazada.com have willingness to help customer, give the
service accurately, Lazada.com want to do task well and correctly ( no
wasting time, energy and cost, provide prompt service, give comparable
cost if there is a problem in Lazada‟s services, and live chat,phone number
& email which owned by Lazada.com is usefull when customer get
trouble. Those are all online service quality emelement directly has
significant influence toward online customer loyalty. The results shows
that Lazada‟s youth customer must not doing overall evaluation of product
and services based on the customer past experience to get online customer
loyalty but, just have good online service quality the customer will be
loyal to Lazada.com.
Figure 4.5
Path Analysis Structure Model
Ɛ1
Ɛ2
0.464
0.873
0. 076
0.170
0.145
0.922
0.060
0.212

101
d. Trimming Model
After we analysis overall path coefficient, in fact there are two
variable has no significant it is online service quality variable in
substructural I and online sales promotion variable in substructural II.
Therefore, the researcher needed to repair path analysis structure model
that have hypothesize.
1. Sub Structural I model 1 and 2
Table 4.38
Model Summary Sub Structure I
Model R R Square Adjusted R
Square
Std. Error of the
Estimate
1 .911a
.830 .827 .487
2 .905 .819 816 .449
a. Dependent Variable: Youth Customer Satisfaction
b. Predictors: (Constant) Online Sales Promotion
Source: Primary data Processed 2017
Table 4.39
ANOVAa
Model Sum of Squares Df Mean
Square
F Sig.
1 Regression
Residual
Total
112.575
22.985
135.560
2
97
99
56.288
.237
237.545 .000b
2 Regression
Residual
Total
68.546
15.168
83.714
1
61
62
68.546
.249
275.660 .000b
a. Dependent Variable: Youth Customer Satisfaction
b. Predictors: (Constant) Online Sales Promotion
Source: Primary data Processed 2017

102
Table4.40
Correlation Coefficient Substructure I
Coefficientsa
Model
Unstandardized
Coefficient
Standardized
Coefficient
t
Sig. B Std. Error Beta
1 (Constant)
Online Sales
Promotion
(X1)
-1.270
.679
.447
.037
.873
-2.842
18.501
.005
.000
Online
Service
Quality (X2)
.019 .012 .076 1.614 .110
Model
Unstandardized
Coefficient
Standardized
Coefficient
T
Sig. B Std. Error Beta
2 (Constant)
Online Sales
Promotion
(X1)
-.361
.659
.479
.040
.905
-.753
16.603
.454
.000
a. Dependent Variable: Youth Customer Satisfaction
Source: Primary data Processed 2017
Figure 4.3
Trimming Model Sub Structure I
Online Sales
Promotion (X1)
Youth Customer
Satisfaction 0.873 0.170

103
2. Sub Structural II model 1 and 2
Table 4.41
Model Summary Sub Structure II
Model R R Square Adjusted R
Square
Std. Error of the
Estimate
1 .888a
.788 .782 1.135
Model R R Square Adjusted R
Square
Std. Error of the
Estimate
2 .886 .785 .780 1.139
a. Predictors: (Constan) youth customer satisfaction, online service quality
b. Dependent Variable: online customer loyalty
Source: Primary data Processed 2017
Table 4.42
ANOVAa
Model Sum of Squares Df Mean
Square
F Sig.
1 Regression
Residual
Total
460.996
123.754
584.750
3
96
99
153.665
1.289
119.203 .000b
Model Sum of Squares Df Mean
Square
F Sig.
2 Regression
Residual
Total
458.858
125.892
584.750
2
97
99
229.429
1.298
176.775 .000b
a. Dependent Variable: online customer loyalty
b. Predictors: (Constant), youth customer satisfaction, online service
quality
Source: Primary data Processed 2017

104
Table4.43
Correlation Coefficient Substructure II
Coefficientsa
Model
Unstandardized
Coefficient
Standardized
Coefficient
t
Sig. B Std. Error Beta
1 (Constant)
Online Sales
Promotion
(X1)
4.720
-.234
1.085
.182
-.145
4.352
-1.288
.000
.201
Online
Service
Quality (X2)
.485 .028 .922 17.165 .000
Youth
Customer
Satisfaction
.125 .237 .060 .529 .598
Model
Unstandardized
Coefficient
Standardized
Coefficient
t
Sig. B Std. Error Beta
2 (Constant)
Online
Service
Quality (X2)
4.021
.483
.942
.028
.917
4.268
17.059
.000
.000
Youth
Customer
Satisfaction
-.144 .112 -.069 -1.289 .200
Dependent Variable: Online Customer Loyalty
Source: Primary data Processed 2017

105
Online
Sales
Promotion
(X1)
Online
Service
Quality
(X2)
Online Youth
Customer
Satisfaction
(Y)
Online
Customer
Loyalty
(Z)
Figure 4.6
Trimming Model Sub Structure II
ɛ2
Figure 4.7
Path Analysis Model After Trimming Test
Ɛ1
Ɛ2
Online
Service
Quality
(X2)
Youth
Customer
Satisfaction
(Y)
Online
Customer
Loyalty (Z)
0.464
0.873
0.170
0.922
0.060
0.212
Online
Sales
Promotion
(X1)
0.212

106
CHAPTER V
CONCLUSION AND SUGGESTION
A. Conclusions
Based on the results of analysis and discussion in the previous chapter then
obtained conclusion regarding, the influence of online sales promotion and
online service quality toward youth customer satisfaction that impacts on
online customer loyalty. These conclusions include are:
1. Online sales promotion has influence on youth customer satisfaction
partially 87.3%
2. Online service quality has influence on youth customer satisfaction
partially amount 7.6%
3. Online sales promotion and online service quality has influence
simultaneously on youth customer satisfaction amount 83%
4. Online sales promotion has influence partially toward online customer
loyalty -14.5%
5. Online service quality has influence toward online customer loyalty
amount 92.2%
6. Youth customer satisfaction has influence partially toward online customer
loyalty 6.0%
7. Online sales promotion, online service quality, and youth customer
satisfaction has influence toward online customer loyalty amount 78.8 %
8. Online sales promotion has influence on online customer loyalty mediated
by youth customer satisfaction amount 0.5%
107
9. Online service quality has influence on online customer loyalty mediated
by youth customer satisfaction amount 0.005%
B. Suggestion
Based on the research conclusion above, so the author recommend be in the form
of several suggestion as follows:
1. For company
Based on the research is known that online service quality variable got
assessment of responden in higher category toward online customer loyalty.
Therefore, very important for Lazada.com to repair in giving services towards its
customer. Such as:
a. Accelerate of product return and Lazada‟s services hours of customer
services more propagated
Because of several consumer experience troubles when doing product
returns. For example, when consumer has done fill the return product form
in Lazada, consumer must waiting email validation for one week
sometimes even more than one weeks, to accelerate of product return in
Lazada consumer must spend a houndred thousand rupiah to call and
posting in Lazada.com fanpage until finally accepted by Lazada.com.
things like this that will break customer loyalty of Lazada if continously
happen. Therefore, Lazada.com should be accelerate of product return at
least one week after fill return product form in Lazada.com and without
have to wait a long time to get email validation in order to consumer not
disappointed because of waiting for a certainty Lazada.com party.

108
b. Accelerate of product delivery consistently
Time inconsistency of product delivery owned by Lazada often making
consumers disappointed. Very important for Lazada to monitor the
delivery product time quickly and consistently, so that more and more the
consumer finally become loyal to Lazada and also the company get more
benefit from there.
In the other side, Based on the research is known that online sales promotion
variable got assessment of responden in lower category toward online customer
loyalty. Actually, basically online sales promotion owned by Lazada already good
and in accordance with the consumer desire so consumer feel satisfaction with the
promotion that given by Lazada. However, although Lazada.com have free
shipping in their promotion but nontheless, there is a shortage of delivery product
in Lazada which sometimes experience delays that make consumer become doubt
to loyal to Lazada.com. online sales promotion owned by Lazada.com will better
when all indicator of online service quality in Lazada.com have good performance
consistently.
2. For academics
As improvement material for next research, there are suggestion and
implication given to conduct research on other company‟s e-commerce,
because probably there is differentiation of research result. Besides that, in
conducting research, it is better to use large sample in order to get better
output.

109
REFERENCE LIST
Blech, George and Michel A. Blech 2009, Advertising and Promotion an
Integrated Marketing Communication Perspective. Eight Edition. Mc Graw-
Hill. USA.
Bowen, John T and Chen, Shiang-Lih 2005, „The Relationship between Customer
Loyalty and Customer Satisfaction‟. International Journal of Contemporary
Hospitality Management, vol. 13. pp. 213-217
Caner, Dincer & Banu, Dincer 2015, „Key Factors of Online Customer
Satisfaction‟, International Journal of Academic Research in Business and
Social Sciences, vol. 5, pp. 97-111
Chi, Shihyu Chou, Jiun, Wen Chen & Lin You 2015, „Female online shoppers:
examining the mediating roles of e-satisfaction and e-trust on e-loyalty
development‟, Internet Research/Emerald Insight, vol. 25, pp.-
Cooper, Donald R and Schindler, Pamela S 2006, Marketing Research., Andy
Winston Publishing, New York
Contact 2017, Cambridge Dictionary, Cambridge University Press
Daniel, Carl Mc, & Gates, Roger 2004, Marketing Research Essentials. Fourth
Edition. John Wiley & Sons, Inc, United State America.
E-commerce Foundation 2016 „Global B2C E-commerce Report 2016‟
Ecommerce Foundation, September 2016, pp.11
http://www.eccommercefoundation.org
„E-Commerce market Indonesia: online retail growing strongly‟ 2016, Indonesia-
Investment, 12 September

110
Flick, Uwe 2011, Intruducing Research Methodology, SAGE Publications Ltd,
Los Angeles, London, New Delhi, Singapore, Washington DC
Ghazali, Imam 2011, Aplikasi Analisis Multivariate dengan Menggunakan
Program SPSS, Universitas Diponegoro, Semarang.
Himawan, Leonardus & Abduh, Dibia 2013, „Analysis of Online Sales Promotion
toward Youth Purchase Intention in Indonesia (Case Study of Apparel
Industry)‟, Research Journal of Management Sciences, vol. 13, pp. 4677-
4690
Hair, Joseph F. JR, Bush, Robert P, & Ortinau David J 2003, Marketing Research,
John E. Biernat Publishing, New York
Jabareen, Yosef 2009, „Building a conceptual framework: philosophy, definitions,
and procedure‟, International Journal of Qualitative Methods, vol. 8, pp.
49-62
King, David, Jae Lee, Ting-Peng Liang, Deborah Turban 2012, A managerial
and social networks prespective . 7th
Edition. Pearson Education. England.
Li, Peixin & Xie, Wei 2012, „A strategic framework for determining e-commerce
adoption‟, Journal of Technology Management in China, vol. 7, pp. 22-3
Ludin, Izyan Hizza Bt. Hilla & Cheng, Boon Liat 2014, „Factors Influencing
Customer Satisfaction and E-Loyalty:Online Shopping Environment Among
the Young Adults‟ Management Dynamics in the Knowledge Economy, vol.
2, pp. 462-471
Malhotra, Naresh K 2011, Basic Marketing Research: Building Your Survey,
Qualtrics Labs, Inc Publihing, University Parkway, USA.
Malhotra, Naresh K. 2004, Marketing Research, Fourth Edition. Pearson.
Prentince Hall.

111
Neha, Soni & Manoj, Verghese 2013, „Impact of Sales Promotion Tools on
Consumer‟s Purchase Decision towards White Good (Refrigerator) at Durg
and Bhilai Region of CG, India‟, Research Journal of Management
Sciences, Vol. 2(7), pp. 10-14
Pi, Wng-Ping and Huang, Hsieh-Hong 2011, „Effects of Promotion on
Relationship Quality and Customer Loyalty in The Airline Industry: The
relationship marketing approach‟, African Journal of Business Management,
vol. 5, pp. 4403-4414
Pratminingsih, Sri Astuti, Lipuringtyas Christina & Rimenta, Tetty 2013, „Factor
influencing customer loyalty toward online shopping‟, International Journal
of Trade, Economics and Finance, vol. 4, pp. 104-110
Riduwan, & Engkos A.K 2007, Cara Mengunakan dan Memakai Analisis Jalur
atau Path Analisis. Alfabeta. Bandung.
Riduwan and Kuncoro, Engkos Achmad 2012, Cara Menggunakan dan Memakai
Path Analysis (Analisis Jalur). Alfabeta. Bandung.
Shamout, Mohamed Dawood 2016, „The Impact of Promotional Tools on
Consumer Buying Behavior in Retail Market‟, International Journal of
Business and Social Science, vol. 7, pp. 75-85
Sugiharto, Bintoro Agung 2016, „Pengguna Internet di Indonesia di Dominasi
oleh Anak Muda‟ CNN Indonesia,24 October, viewed 16 March 2017,
http://statistik.kominfo.go.id/site/data?idtree=424&iddoc=1321&data-
data_page=3
Shariari, Shahrzad, Shahriari, Mohammadreza, & Gheiji, Saeid, 2015, „E-
Commerce and It Impacts on Global Trend and Market‟ International
Journal of Research – Granthaalayah, vol. 3, pp. 49-55.

112
Sugiyono 2008, Metode Penelitian Bisnis (Pendekatan Kualitatif, Kuantitatif dan
R&D).12th
Edition. Alphabet Publishing, Jakarta.
Supriyadi, Edy 2014, SPSS+AMOS Perangkat Lunak Statistik , Mengolah Data
untuk Penelitian. In Media Publishing, Indonesia
Susanti, Dery Anzar 2016, „Analisis Pengaruh Harga, Promosi, Pelayanan, dan
Kualitas Produk Online terhadap Kepuasan Konsumen Online secara
Syariah‟, Analytical Islamia, vol. 5, pp. 368-393
Sanwal, Tanushree, Avasthi, Sandhya & Saxena, Sikha 2016, „E-Commerce and
its sway on the minds of young generation‟, International Journal of
Scientific and Research Publication, vol. 6, pp. 113
Seputra, Yulius Eka 2013, Belajar dan Analisis Tuntas Statistika Berbasis
Komputer, Mitra Wacana Media, Jakarta.
Sarwono, Jonathan 2007, Analisa Jalur untuk Riset Bisnis dengan SPSS, CV
ANDI OFFSET, Yogyakarta.
Tjahjaningsih, Endang 2013, „Pengaruh Citra dan Promosi terhadap Kepuasan
Pelanggan serta dampaknya terhadap Loyalitas Pelanggan (Studi Pada
Pelanggan Supermarket Carrefour di Semarang)‟ Jurnal Fakultas Ekonomi
Universitas Stikukbank,-
Torres, Pedro Marcel, Lisboa, Joao Verissimo, & Yasin, Mahmoud M, 2014, “E-
commerce strategies and corporate performance: an empirical investigation”
International journal of Emerald, vol. 24, pp. 463-481

113
Triwijanarko, Ramadhan 2016, „Benarkah Industri Fesyen E-Commerce Sudah
Jenuh?‟, Marketeers blog, Marketeers.com, 9 February, viewed 16 March
2017,
Wen, Chao, Prybutok, Victor R, Blankson, Charles, & Fang, Jiaming 2014, „The
role of E-quality within the consumer decision making process‟,
International Journal of Operations & Production Management, vol. 34,
pp. 1506 – 1536
Widyastuti, Dwinta 2013, „Indonesia: A thriving market for e-commerce?‟,
Jakarta Post, 19 December, p.2
Winnie, Poh Min Wong 2014, „The Effects of Website Quality on Customer e-
Loyalty: The Mediating Effect of Trustworthiness‟, International Journal of
Academic Research in Business and Social Sciences, vol. 4, pp. 19-41
Yulianto, Edy, Astuti, Sri, Endang, Suyadi, Iman, Utami, Nayati & Hamidah
2014, „The Effect of Online Service Quality towad Perceived Risk,
Customer Attitudes, Relationship Quality, Online Purchase Intention, E-
Loyalty, and Purchasing Behavior‟, European Journal of Business and
Management, vol.6, pp. 89-97
Yen, Yung, Chun Chen, Tzu, Cheng Shen Crystal, Fu, Ying Lee, Yu, Kai 2017,
„Measuring quality variations in e-service‟, Journal of Service Theory and
Practice, vol. 27, pp. 427 – 452
Yang, Zhilin & Fang, Xiang 2004, „Online Service Quality Dimensions and Their
Relationships with Satisfaction‟, International Journal of Service Industry
Management, vol. 15, pp. 302-326
http://marketeers.com/fesyen-ecommerce-indonesia-jenuh/
http://docs.magento.com/m1/ce/user_guide/marketing/price-rule-shopping-cart-
free-shipping.html
http://dictionary.cambridge.org/dictionary/english/contact

114
http://manajemen.fenaro.narotama.ac.id/wpcontent/uploads/2016/04/PENGARUH
-KOMPENSASI-FINANSIAL-DAN-NON-FINANSIAL-TERHADAP-
MOTIVASI-KERJA-CUSTOMER-SERVICE-GRAPARI-TELKOMSEL-
CABANG-PEMUDA-SURABAYA.pdf
http://globallavebookx.blogspot.co.id/2014/07/pengertian-efisiensi-menurut-para-
ahli.html

115
Lampiran I: Kuesioner Penelitian
KUESIONER PENELITIAN
PENGARUH PROMOSI PENJUALAN ONLINE DAN
KUALITAS PELAYANAN ONLINE TERHADAP KEPUASAN
PELANGGAN REMAJA YANG BERDAMPAK PADA LOYALITAS
PELANGGAN ONLINE DI LAZADA.COM
Dalam rangka menyelesaikan Program Strata Satu Fakultas Ekonomi dan Bisnis
Universitas Islam Negri Syarif Hidayatullah Jakarta, yang sedang menyusun
skripsi sebagai syarat memperoleh gelar Sarjana Ekonomi
Nama : Siti Nurma Faujiah
NIM : 1113081100010
Jurusan : International Management
Fakultas : Ekonomi dan Bisnis
Saya hendak melakukan penelitian dengan judul “Pengaruh Promosi Penjualan
Online dan Kualitas Pelayanan Online terhadap Kepuasan Pelanggan Remaja
yang berdampak pada Loyalitas Pelanggan Online di Lazada.com”. Untuk itu saya
mohon bantuan saudara/I agar sudi kiranya mengisi kuesioner ini.

116
Screening
Sebelum mengisi kuesioner mohon kesediaan Saudara/I untuk menjawab soal
dibawah ini dengan mengklik pada kotak yang disediakan di bawah ini.
1. Apakah anda pernah melakukan pembelian produk di Lazada.com?
Ya Tidak
Jika Ya, silahkan lanjut ke pertanyaan berikutnya.
Jika Tidak, silahkan berhenti menjawab sampai di sini.
2. Apakah usia anda berkisar 18-25 tahun?
Ya Tidak
Jika Ya, silahkan lanjut ke pertanyaan berikutnya.
Jika Tidak, silahkan berhenti menjawab sampai di sini.
3. Apakah provinsi tempat tinggal anda di DKI Jakarta, Jawa Barat atau
Banten?
Ya Tidak
Jika Ya, silahkan lanjut ke pertanyaan berikutnya.
Jika Tidak, silahkan berhenti menjawab sampai di sini.

117
Nama :
Usia :
Provinsi :
Jenis kelamin :
Catatan: SS : Sangat Setuju S : Setuju N : Netral TS : Tidak Setuju STS : Sangat Tidak Setuju
PROMOSI PENJUALAN ONLINE
No Pernyataan SS S N TS STS
1. Pengurangan harga asli (discount) yang
ditetapkakan Lazada.com sudah sesuai dengan
keinginan saya
2. Lazada.com memberikan kode voucher yang
menguntungkan
3. Promo gratis ongkos kirim membuat saya ingin
belanja di Lazada.com
KUALITAS PELAYANAN ONLINE
No Pernyataan SS S N TS STS
4. Lazada.com membantu saya memenuhi kebutuhan
5 Lazada.com menjaga informasi pribadi saya
6 Lazada.com memberikan pelayanan yang akurat
sesuai dengan keinginan saya
7 Lazada.com memberikan pelayanan yang efisien,

118
No Pernyataan SS S N TS STS
seperti tenaga, uang dan waktu yang diberikan
sesuai dengan keinginan saya
8 Lazada.com memberikan pelayanan yang cepat
bagi saya
9 Lazada.com memberikan biaya yang sebanding
apabila ada kerusakan atau masalah pada
produknya
10 Pelayanan live chat yang dimiliki oleh lazada.com
membantu kebutuhan saya
11 Nomer telepon yang disediakan oleh lazada.com
sangat berguna bagi saya apabila saya mengalami
kendala
12 Alamat email yang disediakan oleh lazada.com
sangat berguna bagi saya ketika saya mengalami
masalah
KEPUASAN PELANGGAN REMAJA
No Pernyataan SS S N TS STS
13 Saya menggunakan Lazada.com karena sudah
mengevaluasi produk Lazada.com
14. Saya mengggunakan Lazada.com karena
berdasarkan pengalaman pelayanan Lazada.com

119
No Pernyataan SS S N TS STS
Sebelumnya
LOYALITAS PELANGGAN ONLINE
No Pernyataan SS S N TS STS
15. Saya berr
niat untuk melakukan pembelian ulang untuk
product lain di Lazada.com
16. Saya berniat untuk merekomendasikan
Lazada.com kepada orang lain
17 Saya melakukan pembelian ulang product
Lazada.com
18 Saya melakukan pembelian ulang product lain di
Lazada.com
19. Saya merekomendasikan Lazada.com kepada
orang lain

120
Appendix II: Distribution Answer of Respondents
A. Distribution Answer of Respondents
ONLINE SALES PROMOTION
Q1 Q2 Q3 Total
R.1 3 4 5 12
R.2 3 5 5 13
R.3 3 3 4 10
R.4 3 4 4 11
R.5 3 4 4 11
R.6 4 3 5 12
R.7 4 4 5 13
R.8 5 4 4 13
R.9 4 3 5 12
R.10 5 3 5 13
R.11 4 3 5 12
R.12 5 5 5 15
R.13 3 4 5 12
R.14 3 4 3 10
R.15 3 2 3 8
R.16 5 5 5 15
R.17 4 4 4 12
R.18 4 4 5 13
R.19 5 3 5 13
R.20 4 4 5 13
R.21 5 4 4 13
R.22 5 5 5 15
R.23 4 3 5 12
R.24 4 4 5 13
R.25 4 4 4 12
R.26 3 3 3 9
R.27 3 4 4 11
R.28 3 4 5 12
R.29 5 5 4 14
R.30 4 4 3 11
R.31 4 4 5 13
R.32 4 3 5 12
R.33 2 5 4 11
R.34 4 4 5 13

121
Q1 Q2 Q3 Total
R.35 4 4 5 13
R.36 4 5 5 14
R.37 4 4 5 13
R.38 3 4 4 11
R.39 3 3 4 10
R.40 4 5 5 14
R.41 5 3 5 13
R.42 3 3 3 9
R.43 4 4 4 12
R.44 3 4 5 12
R.45 5 4 5 14
R.46 4 4 5 13
R.47 1 5 2 8
R.48 4 4 5 13
R.49 4 3 5 12
R.50 4 4 4 12
R.51 3 2 4 9
R.52 4 4 5 13
R.53 3 4 5 12
R.54 3 4 4 11
R.55 3 2 5 10
R.56 3 3 5 11
R.57 3 4 3 10
R.58 4 4 4 12
R.59 3 3 4 10
R.60 4 4 5 13
R.61 4 3 4 11
R.62 4 5 5 14
R.63 3 4 4 11
R.64 5 4 5 14
R.65 3 3 5 11
R.66 4 3 5 12
R.67 4 3 4 11
R.68 4 5 4 13
R.69 5 3 5 13
R.70 4 4 5 13
R.71 4 4 5 13
R.72 4 4 5 13
R.73 2 4 5 11
R.74 3 4 5 12

122
Q1 Q2 Q3 Total
R.75 3 3 4 10
R.76 5 3 4 12
R.77 4 5 5 14
R.78 4 3 5 12
R.79 4 3 5 12
R.80 3 3 4 10
R.81 3 3 5 11
R.82 4 3 4 11
R.83 4 4 5 13
R.84 4 4 4 12
R.85 4 3 4 11
R.86 4 4 5 13
R.87 3 3 4 10
R.88 4 5 5 14
R.89 3 4 5 12
R.90 5 4 5 14
R.91 4 4 4 12
R.92 4 4 5 13
R.93 3 4 4 11
R.94 5 5 5 15
R.95 4 4 4 12
R.96 5 5 4 14
R.97 5 4 5 14
R.98 4 5 5 14
R.99 4 4 4 12
R.100 5 5 4 14

123
Online Service Quality
Q1 Q2 Q3 Q4 Q5 Q6 Q7 Q8 Q9 Total
R.1 4 3 4 4 4 4 4 3 3 33
R.2 4 4 3 4 4 5 4 3 3 34
R.3 4 4 4 4 4 4 4 4 3 35
R.4 3 3 4 4 3 3 4 3 4 31
R.5 4 4 5 4 4 4 4 4 4 37
R.6 4 4 4 4 3 2 3 4 3 31
R.7 4 4 4 4 4 5 4 3 3 35
R.8 4 5 5 4 4 5 5 5 4 41
R.9 4 3 4 4 4 4 3 4 3 33
R.10 3 1 3 4 2 3 3 2 1 22
R.11 4 4 4 4 4 4 4 3 5 36
R.12 4 4 4 4 4 4 4 4 3 35
R.13 5 4 4 4 3 3 3 3 4 33
R.14 2 3 4 4 2 3 2 3 3 26
R.15 3 4 4 3 3 2 3 3 3 28
R.16 5 5 5 5 5 5 5 5 5 45
R.17 4 4 4 4 2 4 4 4 4 34
R.18 5 5 5 5 5 5 5 3 4 42
R.19 5 5 5 4 5 5 5 4 5 43
R.20 3 3 3 3 3 3 3 4 3 28
R.21 4 4 4 4 4 4 4 3 3 34
R.22 4 4 4 3 3 4 3 4 3 32
R.23 5 5 5 4 5 4 5 4 4 41
R.24 4 5 4 4 4 4 4 5 4 38
R.25 3 4 3 4 3 3 3 3 4 30
R.26 4 4 4 4 4 3 3 3 3 32

124
Q1 Q2 Q3 Q4 Q5 Q6 Q7 Q8 Q9 Total
R.27 5 5 4 4 4 4 4 3 4 37
R.28 4 3 2 4 3 2 2 2 3 25
R.29 4 4 4 4 4 4 4 3 3 34
R.30 5 4 5 5 5 5 4 5 4 42
R.31 4 4 3 4 4 4 4 5 5 37
R.32 4 4 4 4 4 4 3 3 3 33
R.33 4 2 4 5 4 4 4 4 5 36
R.34 4 4 4 4 4 5 4 5 4 38
R.35 4 4 4 4 4 5 4 5 4 38
R.36 3 3 4 3 3 3 3 3 4 29
R.37 4 3 4 3 4 4 4 4 3 33
R.38 3 3 4 4 4 4 3 3 3 31
R.39 4 3 4 4 3 4 3 3 3 31
R.40 4 4 4 4 4 4 4 2 4 34
R.41 4 4 5 4 5 4 4 4 4 38
R.42 4 4 3 4 4 2 2 3 3 29
R.43 4 5 3 3 4 3 5 3 3 33
R.44 4 4 5 4 4 5 4 4 4 38
R.45 4 4 3 4 4 4 5 4 4 36
R.46 4 3 4 3 4 4 4 5 4 35
R.47 4 4 3 4 5 3 4 2 1 30
R.48 4 3 4 5 4 4 5 4 3 36
R.49 4 4 3 3 4 3 4 4 5 34
R.50 4 4 4 4 4 4 4 4 4 36
R.51 4 2 4 4 3 1 1 1 1 21
R.52 4 4 4 4 4 4 4 4 4 36
R.53 3 3 3 3 4 3 4 3 4 30

125
Q1 Q2 Q3 Q4 Q5 Q6 Q7 Q8 Q9 Total
R.54 4 4 4 4 4 2 2 4 4 32
R.55 5 4 4 3 4 4 3 3 3 33
R.56 2 4 4 4 3 2 4 3 4 30
R.57 4 3 3 4 4 3 4 3 4 32
R.58 4 4 4 4 4 4 4 4 4 36
R.59 4 3 3 3 3 3 3 3 3 28
R.60 5 1 4 4 4 4 4 4 5 35
R.61 4 3 3 3 3 4 4 4 3 31
R.62 3 3 3 4 4 4 4 3 4 32
R.63 4 3 4 4 3 3 4 2 3 30
R.64 4 4 3 3 4 4 5 3 3 33
R.65 4 4 4 3 4 4 4 3 5 35
R.66 5 5 4 4 3 3 3 3 4 34
R.67 4 5 3 3 4 5 5 4 4 37
R.68 4 5 5 4 5 5 5 5 4 42
R.69 4 4 5 4 4 4 3 4 3 35
R.70 4 4 4 3 4 4 3 4 3 33
R.71 5 3 5 5 5 5 4 5 5 42
R.72 5 4 4 4 4 5 4 4 4 38
R.73 3 3 3 4 4 4 4 3 3 31
R.74 5 3 5 5 4 4 4 3 5 38
R.75 4 4 2 3 3 3 4 4 3 30
R.76 4 3 4 3 4 5 4 3 3 33
R.77 5 4 5 5 5 5 5 5 5 44
R.78 3 4 4 4 5 5 5 4 2 36
R.79 3 4 4 3 3 4 3 3 3 30
R.80 4 4 4 3 3 4 4 3 3 32

126
Q1 Q2 Q3 Q4 Q5 Q6 Q7 Q8 Q9 Total
R.81 3 3 4 4 3 2 5 4 2 30
R.82 4 3 3 3 3 4 4 4 3 31
R.83 5 4 5 4 5 4 4 5 4 40
R.84 5 4 4 4 4 4 4 4 4 37
R.85 4 5 4 4 3 2 2 2 3 29
R.86 5 4 3 3 4 3 4 3 3 32
R.87 3 3 3 3 3 3 3 3 3 27
R.88 4 4 4 4 4 4 4 1 1 30
R.89 4 4 4 4 4 5 5 4 4 38
R.90 4 5 5 4 4 3 4 4 5 38
R.91 5 4 4 4 5 5 4 4 4 39
R.92 3 4 5 4 5 4 4 4 4 37
R.93 4 4 4 4 4 4 5 5 4 38
R.94 4 4 5 4 5 5 5 4 3 39
R.95 4 5 5 5 5 5 4 4 4 41
R.96 4 4 4 4 4 4 5 5 4 38
R.97 5 5 5 5 4 4 4 4 4 40
R.98 4 4 5 5 4 4 4 5 4 39
R.99 5 5 4 5 4 5 5 4 4 41
R.100 4 4 4 4 5 5 4 4 5 39
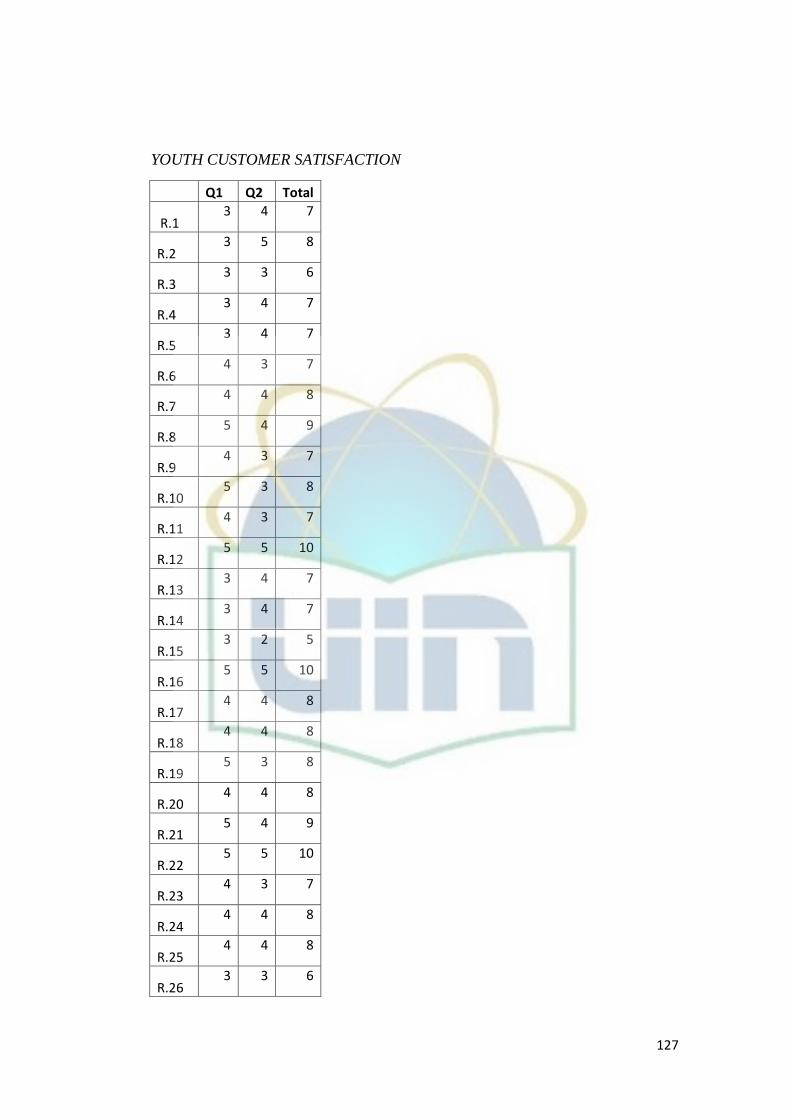
127
YOUTH CUSTOMER SATISFACTION
Q1 Q2 Total
R.1 3 4 7
R.2 3 5 8
R.3 3 3 6
R.4 3 4 7
R.5 3 4 7
R.6 4 3 7
R.7 4 4 8
R.8 5 4 9
R.9 4 3 7
R.10 5 3 8
R.11 4 3 7
R.12 5 5 10
R.13 3 4 7
R.14 3 4 7
R.15 3 2 5
R.16 5 5 10
R.17 4 4 8
R.18 4 4 8
R.19 5 3 8
R.20 4 4 8
R.21 5 4 9
R.22 5 5 10
R.23 4 3 7
R.24 4 4 8
R.25 4 4 8
R.26 3 3 6

128
Q1 Q2 Total
R.27 3 4 7
R.28 3 4 7
R.29 5 5 10
R.30 4 4 8
R.31 4 4 8
R.32 4 3 7
R.33 2 5 7
R.34 4 4 8
R.35 4 4 8
R.36 4 5 9
R.37 4 4 8
R.38 3 4 7
R.39 3 3 6
R.40 4 5 9
R.41 5 3 8
R.42 3 3 6
R.43 4 4 8
R.44 3 4 7
R.45 5 4 9
R.46 4 4 8
R.47 1 5 6
R.48 4 4 8
R.49 4 3 7
R.50 4 4 8
R.51 3 2 5
R.52 4 4 8
R.53 3 4 7

129
Q1 Q2 Total
R.54 3 4 7
R.55 3 2 5
R.56 3 3 6
R.57 3 4 7
R.58 4 4 8
R.59 3 3 6
R.60 4 4 8
R.61 4 3 7
R.62 4 5 9
R.63 3 4 7
R.64 5 4 9
R.65 3 3 6
R.66 4 3 7
R.67 4 3 7
R.68 4 5 9
R.69 5 3 8
R.70 4 4 8
R.71 4 4 8
R.72 4 4 8
R.73 2 4 6
R.74 3 4 7
R.75 3 3 6
R.76 5 3 8
R.77 4 5 9
R.78 4 3 7
R.79 4 3 7
R.80 3 3 6

130
Q1 Q2 Total
R.81 3 3 6
R.82 4 3 7
R.83 4 4 8
R.84 4 4 8
R.85 4 3 7
R.86 4 4 8
R.87 3 3 6
R.88 4 5 9
R.89 3 4 7
R.90 5 4 9
R.91 4 4 8
R.92 4 4 8
R.93 3 4 7
R.94 5 5 10
R.95 4 4 8
R.96 5 5 10
R.97 5 4 9
R.98 4 5 9
R.99 4 4 8
R.100 5 5 10

131
ONLIN E CUSTOMER LOYALTY
Q1 Q2 Q3 Q4 Q5 Total
R.1 4 3 4 4 4 19
R.2 4 4 3 4 4 19
R.3 4 4 4 4 4 20
R.4 3 3 4 4 3 17
R.5 4 4 5 4 4 21
R.6 4 4 4 4 3 19
R.7 4 4 4 4 4 20
R.8 4 5 5 4 4 22
R.9 4 3 4 4 4 19
R.10 3 1 3 4 2 13
R.11 4 4 4 4 4 20
R.12 4 4 4 4 4 20
R.13 5 4 4 4 3 20
R.14 2 3 4 4 2 15
R.15 3 4 4 3 3 17
R.16 5 5 5 5 5 25
R.17 4 4 4 4 2 18
R.18 5 5 5 5 5 25
R.19 5 5 5 4 5 24
R.20 3 3 3 3 3 15
R.21 4 4 4 4 4 20
R.22 4 4 4 3 3 18
R.23 5 5 5 4 5 24
R.24 4 5 4 4 4 21
R.25 3 4 3 4 3 17
R.26 4 4 4 4 4 20

132
Q1 Q2 Q3 Q4 Q5 Total
R.27 5 5 4 4 4 22
R.28 4 3 2 4 3 16
R.29 4 4 4 4 4 20
R.30 5 4 5 5 5 24
R.31 4 4 3 4 4 19
R.32 4 4 4 4 4 20
R.33 4 2 4 5 4 19
R.34 4 4 4 4 4 20
R.35 4 4 4 4 4 20
R.36 3 3 4 3 3 16
R.37 4 3 4 3 4 18
R.38 3 3 4 4 4 18
R.39 4 3 4 4 3 18
R.40 4 4 4 4 4 20
R.41 4 4 5 4 5 22
R.42 4 4 3 4 4 19
R.43 4 5 3 3 4 19
R.44 4 4 5 4 4 21
R.45 4 4 3 4 4 19
R.46 4 3 4 3 4 18
R.47 4 4 3 4 5 20
R.48 4 3 4 5 4 20
R.49 4 4 3 3 4 18
R.50 4 4 4 4 4 20
R.51 4 2 4 4 3 17
R.52 4 4 4 4 4 20
R.53 3 3 3 3 4 16

133
Q1 Q2 Q3 Q4 Q5 Total
R.54 4 4 4 4 4 20
R.55 5 4 4 3 4 20
R.56 2 4 4 4 3 17
R.57 4 3 3 4 4 18
R.58 4 4 4 4 4 20
R.59 4 3 3 3 3 16
R.60 5 1 4 4 4 18
R.61 4 3 3 3 3 16
R.62 3 3 3 4 4 17
R.63 4 3 4 4 3 18
R.64 4 4 3 3 4 18
R.65 4 4 4 3 4 19
R.66 5 5 4 4 3 21
R.67 4 5 3 3 4 19
R.68 4 5 5 4 5 23
R.69 4 4 5 4 4 21
R.70 4 4 4 3 4 19
R.71 5 3 5 5 5 23
R.72 5 4 4 4 4 21
R.73 3 3 3 4 4 17
R.74 5 3 5 5 4 22
R.75 4 4 2 3 3 16
R.76 4 3 4 3 4 18
R.77 5 4 5 5 5 24
R.78 3 4 4 4 5 20
R.79 3 4 4 3 3 17
R.80 4 4 4 3 3 18

134
Q1 Q2 Q3 Q4 Q5 Total
R.81 3 3 4 4 3 17
R.82 4 3 3 3 3 16
R.83 5 4 5 4 5 23
R.84 5 4 4 4 4 21
R.85 4 5 4 4 3 20
R.86 5 4 3 3 4 19
R.87 3 3 3 3 3 15
R.88 4 4 4 4 4 20
R.89 4 4 4 4 4 20
R.90 4 5 5 4 4 22
R.91 5 4 4 4 5 22
R.92 3 4 5 4 5 21
R.93 4 4 4 4 4 20
R.94 4 4 5 4 5 22
R.95 4 5 5 5 5 24
R.96 4 4 4 4 4 20
R.97 5 5 5 5 4 24
R.98 4 4 5 5 4 22
R.99 5 5 4 5 4 23
R.100 4 4 4 4 5 21

135
Appendix III: Results of Output SPSS 24 for Windows
1. Validity and Reliability Test
a. Online Sales Promotion (X1)
Tryout Result
Validity Test: Online Sales Promotion (X1)
No Questions Table Value Calculated
Value
Describe
1 Online Sales
Promotion
0.30 0.766 Valid
2 Online Sales
Promotion
0.30 0.615 Valid
3 Online Sales
Promotion
0.30 0.672 Valid
Tryout Result
Reliability Test of Online Sales Promotion
Reliability Statistics
Croncach’s
Alpha
N of Items
.638 3
b. Online Service Quality
Tryout Result
Validity Test: Online Service Quality (X2)
No Questions Table Value Calculated
Value
Describe
1 Online Service
Quality
0.30 0.589 Valid
2 Online Service
Quality
0.30 0.561 Valid
3 Online Service 0.30 0.656 Valid

136
quality
4 Online Service
quality
0.30 0.516 Valid
5 Online Service
quality
0.30 0.760 Valid
6 Online Service
quality
0.30 0.762 Valid
7 Online Service
quality
0.30 0.689 Valid
8 Online Service
quality
0.30 0.706 Valid
9 Online Service
quality
0.30 0.663 Valid
Tryout Result
Reliability Test of Online Service Quality
Reliability Statistics
Croncach’s
Alpha
N of Items
.835 9
c. Youth Customer Satisfaction
Tryout Result
Validity Test: Youth Customer Satisfaction (Y1)
No Questions Table
Value
Calculated
Value
Describe
1 Youth Customer
Satisfaction
0.30 0.779 Valid
2 Youth Customer
Satisfaction
0.30 0.745 Valid

137
Tryout Result
Reliability of Youth Customer Satisfaction
Reliability Statistics
Croncach’s
Alpha
N of Items
.667 2
d. Online Customer Loyalty
Tryout Result
Validity Test: Online Customer Loyalty (Y2)
No Questions Table
Value
Calculated
Value
Describe
1 Online Customer
Loyalty
0.30 0.684 Valid
2 Online Customer
Loyalty
0.30 0.657 Valid
3 Online Customer
Loyalty
0.30 0.751 Valid
4 Online Customer
Loyalty
0.30 0.634 Valid
5 Online Customer
Loyalty
0.30 0.771 Valid
Tryout Result
Reliability of Online Customer Loyalty
Reliability Statistics
Croncach’s
Alpha
N of Items
.736 5

138
2. Normality Test
a. Sub Structure I
The Result of Normality Test Sub Structure I
b. Sub Structure II
The Result of Normality Test Sub Structure II

139
3. Hypothesis Test
A. Sub Structure I
Model Summary Sub Structure I
Model R R Square Adjusted R
Square
Std. Error of
the Estimate
1 .911a
.830 .827 .487
a. Dependent Variable: Youth Customer Satisfaction
b. Predictors: (Constant), Online Service Quality, Online Sales Promotion
ANOVAa
Model Sum of
Squares
Df Mean
Square
F Sig.
1 Regression
residual
total
112.575
22.985
135.560
2
97
99
56.288
.237
237.545 .000b
a. Dependent Variable: Youth Customer Satisfaction b. Predictors: (Constant), Online Service Quality, Online Sales Promotion
Correlation Coefficient Substructure I
Coefficientsa
Model
Unstandardized
Coefficient
Standardized
Coefficient
T
Sig. B Std.
Error
Beta
1 (Constant)
Online Sales
Promotion (X1)
-1.270
.679
.447
.037
.873
-2.842
18.501
.005
.000
Online Service
Quality (X2)
.019 .012 .076 1.614 .110
a. Dependent Variable: Youth Customer Satisfaction

140
B. Sub Structure II
Model Summary Sub Structure II
Model R R Square Adjusted R
Square
Std. Error of
the Estimate
1 .888a
.788 .782 1.135
a. Predictors: (Constan) Online Service Quality
b. Dependent Variable: Youth Customer Satisfaction
ANOVAa
Model Sum of
Squares
Df Mean
Square
F Sig.
1 Regression
Residual
Total
460.996
123.754
584.750
3
96
99
153.665
1.289
119.203 .000b
a. Dependent Variable: Youth Customer Satisfaction
b. Predictors: (Constant), Online Service Quality
Correlation Coefficient Substructure II
Coefficientsa
Model
Unstandardized
Coefficient
Standardized
Coefficient
t
Sig. B Std.
Error
Beta
1 (Constant)
Online
Sales
Promotion
(X1)
4.720
-.234
1.085
.182
-.145
4.352
-1.288
.000
.201
Online
Service
Quality
(X2)
.485 .028 .922 17.165 .000
Youth
Customer
Satisfaction
.125 .237 .060 .529 .598
a. Dependent Variable: Online Customer Loyalty
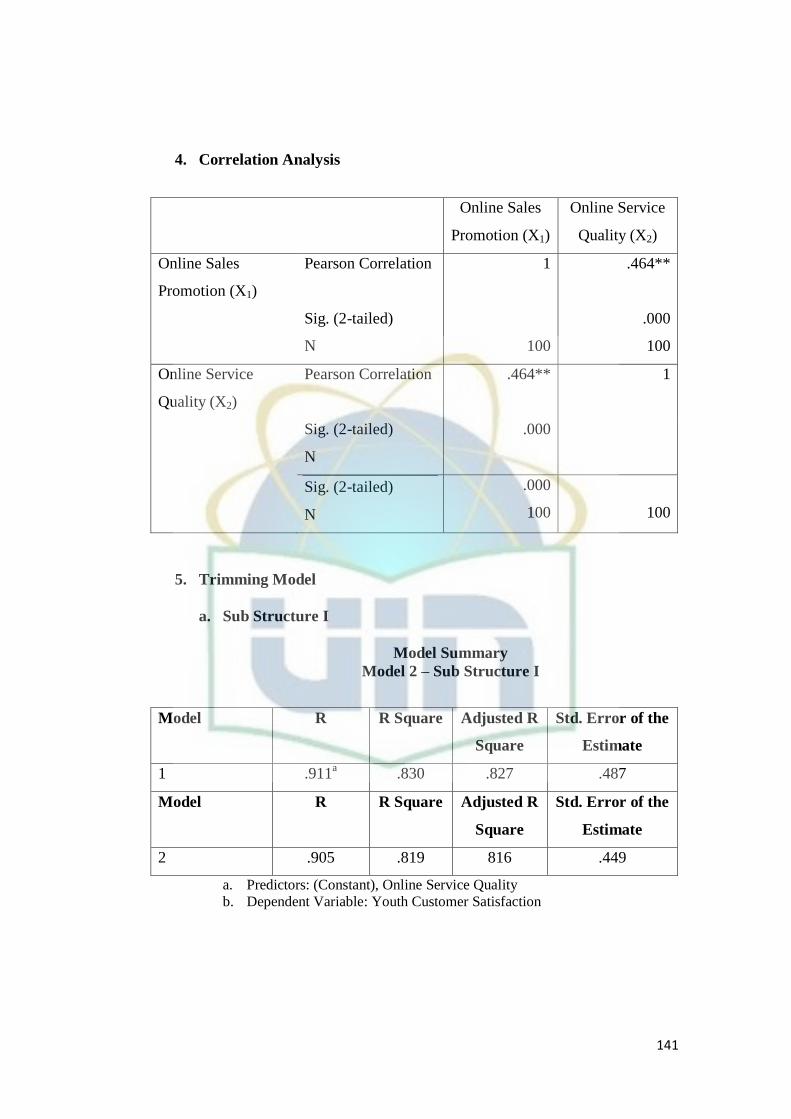
141
4. Correlation Analysis
Online Sales
Promotion (X1)
Online Service
Quality (X2)
Online Sales
Promotion (X1)
Pearson Correlation
1 .464**
Sig. (2-tailed)
N
100
.000
100
Online Service
Quality (X2)
Pearson Correlation .464**
1
Sig. (2-tailed)
N
.000
Sig. (2-tailed)
N
.000
100
100
5. Trimming Model
a. Sub Structure I
Model Summary
Model 2 – Sub Structure I
Model R R Square Adjusted R
Square
Std. Error of the
Estimate
1 .911a
.830 .827 .487
Model R R Square Adjusted R
Square
Std. Error of the
Estimate
2 .905 .819 816 .449
a. Predictors: (Constant), Online Service Quality
b. Dependent Variable: Youth Customer Satisfaction

142
Table 4.52
ANOVA
Model 2 – Sub Structure I
Model Sum of Squares Df Mean
Square
F Sig.
1 Regression
Residual
Total
112.575
22.985
135.560
2
97
99
56.288
.237
237.545 .000b
Model Sum of Squares Df Mean
Square
F Sig.
2 Regression
Residual
Total
68.546
15.168
83.714
1
61
62
68.546
.249
275.660 .000b
a. Dependent Variable: Youth Customer Satisfaction
b. Predictors: Online Service Quality
Table 4.53
Coefficients
Model 2 – Sub Structure I
Model
Unstandardized
Coefficient
Standardized
Coefficient
t
Sig. B Std. Error Beta
1 (Constant)
Online Sales
Promotion
(X1)
-1.270
.679
.447
.037
.873
-2.842
18.501
.005
.000
Online
Service
Quality (X2)
.019 .012 .076 1.614 .110
Model
Unstandardized
Coefficient
Standardized
Coefficient
t
Sig. B Std. Error Beta
2 (Constant)
Online Sales
Promotion
(X1)
-.361
.659
.479
.040
.905
-.753
16.603
.454
.000
a. sigDependent Variable: Youth Customer Satisfaction