Embed Size (px)
Citation preview

Journal of Urban Health: Bulletin of the New York Academy of Medicine, Vol. 90, No. 2doi:10.1007/s11524-012-9712-8* 2012 The Author(s). This article is published with open access at Springerlink.com
The Influence of Place on Weight Gain during EarlyChildhood: A Population-Based, Longitudinal Study
Megan Ann Carter, Lise Dubois, Mark S. Tremblay,and Monica Taljaard
ABSTRACT The objective of this paper was to determine the influence of place factors onweight gain in a contemporary cohort of children while also adjusting for early life andindividual/family social factors. Participants from the Québec Longitudinal Study ofChild Development comprised the sample for analysis (n=1,580). A mixed-effectsregression analysis was conducted to determine the longitudinal relationship betweenthese place factors and standardized BMI, from age 4 to 10 years. The averagerelationship with time was found to be quadratic (rate of weight gain increased overtime). Neighborhood material deprivation was found to be positively related to weightgain. Social deprivation, social disorder, and living in a medium density area wereinversely related, while no association was found for social cohesion. Early life factorsand genetic proxies appeared to be important in explaining weight gain in this sample.This study suggests that residential environments may play a role in childhood weightchange; however, pathways are likely to be complex and interacting and perhaps not asimportant as early life factors and genetic proxies. Further work is required to clarifythese relationships.
KEYWORDS Children, Neighborhood, Residential characteristics, Environment, Bodyweight, Body mass index, Longitudinal study, Mixed-models, Social factors
INTRODUCTION
Childhood overweight and obesity have risen dramatically in the last 25 years inCanada1,2 and in many other countries.3,4 In 2004, 26 % of Canadian children aged2–17 years were overweight and 8 % were obese.2 From 1978/1979 to 2004, theprevalence of overweight and obesity increased twofold among 6–17-year-olds. Dueto this striking increase, as well as its potential for adversely affecting health both inthe short and long term, being at excess weight during childhood has become amajor global public health concern.
The etiologic literature on childhood weight status has tended to focus onindividual characteristics rather than on broader contextual circumstances. The highprevalence of childhood obesity has not abated, suggesting that prevention
Carter and Dubois are with the Institute of Population Health, University of Ottawa, Ottawa, ON, Canada;Tremblay is with the Healthy Active Living and Obesity Research (HALO) CHEO Research Institute,Ottawa, ON, Canada; Taljaard is with the Ottawa Hospital Research Institute, Ottawa Hospital, CivicCampus, Ottawa, ON, Canada.
Correspondence: Megan Ann Carter, Institute of Population Health, University of Ottawa, Ottawa,ON, Canada. (E-mail: [email protected])
224
strategies, traditionally implemented at the individual level, may not be effective.Conceptualizing childhood obesity within multiple levels of influence, specificallywithin residential communities and over the life course, is necessary to designeffective prevention strategies that shift the distribution of risk downward. This isconsistent with a social–ecological theory of health.5
Neighborhoods are a natural way to conceptualize “place” in terms of childhealth and acquiring health resources. In the context of obesity, complexinteractions between individuals, families, local communities, and institutions, aswell as the broader social environment, lead neighborhoods to become geographicalareas that can: (1) structure opportunities/barriers for children to be physicallyactive and to eat healthy6 and (2) give rise to negative perceptions, which themselvesmay elicit chronic stress responses leading to weight gain.7
Studies are starting to find significant relationships between different neighbor-hood characteristics and weight status;8 however, this is a fairly new area of researchwhere the literature is heterogeneous and mostly cross-sectional.9 To better make thecase for causation, longitudinal studies are needed that use measured heights andweights. Accounting for early life factors known to be related to childhood obesitydevelopment, as well as individual and family-level social factors and measures ofthe family environment can provide a more holistic picture of why and how weightstatus changes over time in young children.
Among the few longitudinal studies investigating the influence of place onchildhood weight status, findings include significant negative relationships betweenchange in BMI and area greenness/degree of vegetation,10 neighborhood income/deprivation,11 and perceived safety.12
Using the Québec Longitudinal Study of Child Development (QLSCD), the mainobjective of this study was to assess the influence of place factors on change incohort children’s standardized weight for height while also accounting for otherpotentially important early life and individual-/family-level explanatory factors. Theoverall hypothesis was that unfavorable neighborhood characteristics such as highmaterial and social deprivation, high social disorder, and low population densitywould be positively related to weight gain, while favorable characteristics such ashigh social cohesion would be inversely related to weight gain in children.
METHODS
SampleThe QLSCD is a government-based cohort study conducted by the Institut de laStatistique du Québec (ISQ) to identify factors in early childhood that affect thehealth, social adjustment, and academic performance of young Quebeckers.13 Thecohort is comprised of a representative sample of 2,120 children born in Québec in1997/1998, who have been followed from 5 months of age.
Cohort children were randomly selected based on a three-stage, stratifieddesign.14 The territory covered by the survey was first divided into primarysampling units (PSUs) based on broad regions of Québec. The PSUs were thendivided into two groups: remote or nonremote. In stage 1, two out of the fourremote PSUs were chosen, and all 11 nonremote PSUs were chosen. The secondstage involved dividing the selected regions into secondary sampling units (SSUs)based on one or two county regional municipalities. These were further divided intotwo groups: areas registering a high number of births in 1996 and those registering a
PLACE AND EARLY WEIGHT GAIN 225

low number of births. A fixed number of SSUs were randomly selected from the lowbirthrate group, and all SSUs were selected from the high birthrate group. Finally, inthe third stage, a fixed number of children were randomly selected from the selectedSSUs, based on the 1997/1998 Québec Birth Registry.14 Sampling occurredthroughout the year to minimize the potential impact of seasonal influences (seeFigure 1 for the sampling process). Twins, children with major diseases at birth, andthose living in Northern Québec, Cree or Inuit territory, or Indian reserves wereexcluded.
From 5 months to 8 years of age, data collection occurred annually (timingchanged slightly when children began school). In order to minimize respondentburden, this changed to a biannual basis from 8 years onward. Data from 5 monthsto 10 years are used in the present analysis. Computer-assisted personal interviewingof the mother, in the child’s home, was the primary method of data collection.13
VARIABLES
OutcomeThe primary outcome for this study was weight relative to height, as measured byBMI (kg/m2), standardized for age and sex using the Centers for Disease Controland Prevention Growth Charts, to obtain BMI Z-scores.15 The Z-score is thedeviation of the value for an individual from the mean value of the referencepopulation divided by the standard deviation for the reference population; in thiscase, the reference population has been derived from five different US surveys.16 Theuse of the BMI Z-score has been recommended as superior than percentiles for use inlongitudinal analyses.17
Starting sample from sampling frame
(N = 2940)
Cooperating families
(83%; N = 2223)
Unable to match to Québec’s health insurance database (n = 172)
Families refused or could not be reached (n = 452)
‘Other’ reason for non-response - e.g. death (n =93)
Oversample for cross-sectional analysis at first data collection cycle (n = 103)
Final longitudinal sample
(N = 2120)
FIGURE 1. Sampling of children in the Québec Longitudinal Study of Child Development.
CARTER ET AL.226
Heights and weights were measured in the child’s home by trained interviewers atthe approximate ages of 4, 6, 7, 8, and 10 years.18 At each data collection cycle,body weight was measured in kilograms on scales set back to zero for eachmeasurement. Children wore light clothing and no shoes. Height was measured inmeters.
Main Exposures—Place Factors
Deprivation Two forms of deprivation, material and social, were measured by anarea-based index developed by Pampalon and Raymond,19 based largely on thework of Peter Townsend. The index was derived by linking postal codes ofparticipants at data collection cycle 1, when children were approximately 5 monthsof age, to census data (1996) describing enumeration areas. Principal componentsanalysis was used to create the index using six socioeconomic indicators: proportionof persons who have no high-school diploma; ratio of employment to totalpopulation; average income; proportion of persons who are separated, divorced,or widowed; proportion of people living alone; and proportion of single-parentfamilies. The first three indicators form the material dimension of the index. Thisrefers to the general inability of area residents to obtain the goods and conveniencesthat are a part of everyday life. The latter three indicators form the social dimensionof the index, which refers to the fragmentation and weakening of the householdstructure. The index has been previously used to assess disparities in Canadianmortality rates20 and by the Québec Government to assess community serviceneeds.21
For ease of interpretation and consistent with another paper, both dimensionswere divided into population quintiles, from quintile 1 (least disadvantaged) to 5(most disadvantaged), and then dichotomized into “deprived” (quintiles 4 and 5)versus “not deprived” (quintiles 1–3).22
Perceived Neighborhood Social Cohesion and Disorder Neighborhood socialcohesion and disorder were measured by two scales that have been adapted fromthe work of Barnes-McGuire23 and the Canadian National Longitudinal Survey ofChildren and Youth.24 Both are based on the mother’s perception of herneighborhood. Items forming the social cohesion scale assess the level of agreementto five statements about the support of neighbors, while items on the social disorderscale assess the presence and severity of four types of problems in the neighbor-hood.25 The items for each of the scales can be found in Appendix 1. Scale scoreswere calculated by averaging item responses for each scale. Social cohesion scoresrange from 1 to 4, where higher scores indicate a less cohesive neighborhood. Socialdisorder scores range from 1 to 3 with a lower score indicating the presence of socialproblems. Both scales were dichotomized to increase interpretability. Social cohesionwas dichotomized based on the 50th percentile. For social disorder, children werecategorized as either having a perfect score of 3 (no social problems at all in theneighborhood) versus G3 (social problems present). A similar approach was takenby Curtis et al.28 in their analysis of neighborhood influences on a variety of healthoutcomes in a Canadian sample of children. Both cohesion and disorder wereavailable every other data collection cycle starting at cycle 1 (children were 5 monthsof age) and therefore were analyzed as time-dependent variables (Table 1). Sincevalues were missing for all children at cycle 8 (7 years), the observation at the
PLACE AND EARLY WEIGHT GAIN 227

TABLE 1 Description of considered explanatory variables in the QLSCD
Variable Description Change over time
Socio-economic/demographicSex Male yes/no InvariantSocioeconomic status (SES)a Calculated based on gross household
income, and mother’s and father’seducation level, and job prestige;categorized into tertiles—low,middle, and high
Dependent
Mother is an immigrant Yes/no InvariantSingle parent family Yes/no DependentEarly life exposuresRapid weight gain in infancy Highest two quintiles of average
monthly weight gainfrom 0 to 5 months
Invariant
Mother smoked duringpregnancy
Yes/no Invariant
Breastfeeding status Exclusively breastfed to 3 months of ageor older; never breastfed; other
Invariant
Birth weightb LowG2.5 kg; normal≥2.5 kg but ≤4 kg;high94 kg
Invariant
Genetic proxiesc
Mother is obese Mother’s BMI≥30 based on self-reportedheight and weight
Invariant
Overeating phenotyped “Often” eats too much and/or “sometimes”or “often” eats too fast
Invariant
PlaceMaterially deprived Highest two quintiles of the material
deprivation factorial scoreInvariant
Socially deprived Highest two quintiles of the socialdeprivation factorial score
Invariant
High social cohesion Scale score in the bottom 50 % DependentHigh social disorder Less than a perfect scale score (G3) DependentPopulation density: DependentHigh Census metropolitan areas with
≥100,000 inhabitantsMedium Census agglomerations with 10,000
to G100,000 inhabitantsLow Rural or small towns with G10,000
inhabitants
Time dependency reflects the fact that these variables were measured at all study time points (4, 6, 7, 8, and10 years of age) where all available data points were entered into the mixed models analysis. Values for socialcohesion and disorder were not collected at 7 years for all children so the value at 6 years was used. For SES andpopulation density, values were not collected at 4 years for all children so the value at 3.5 years (fourth datacollection cycle) was used. All time invariant variables were measured at the first data collection cycle of theoriginal cohort study (5 months) except for the genetic proxies
aFor more information on how this variable was calculated and interpreted, please see Ref. 25bBased on medical records at birthcRecognizing that these factors could also capture elements of the home environment, as well as lifestyle
behaviors. Obesity status of the mother might also be considered an early life factor as this was measured whenthe child was 1.5 years (at the second data collection cycle)
dConsidered for inclusion based on research showing that at least half of the genetic influence on obesityoperates through appetite (see Refs. 26,27; measured at 4 years
CARTER ET AL.228

previous data collection cycle was carried forward (at 6 years) in order to be able toconduct the analysis.
Population Density The population density variable was constructed by ISQ bylinking participants’ postal codes to census data describing geographical areas usingStatistics Canada’s postal code conversion file. According to the linked censusinformation, children were categorized as living in one of four types of geographicalareas.25 For the purpose of this study, these four categories were collapsed into three,namely, census metropolitan areas containing more than 100,000 inhabitants (highdensity), census agglomerations containing 10,000 to G100,000 inhabitants (mediumdensity), or rural/small towns containing G10,000 inhabitants (low density). Thisvariable was measured in all data collection cycles (except cycle 5 when children were4 years of age) and, thus, was analyzed as a time-dependent variable. Because nochildren had population density collected at 4 years of age, the observation at theprevious data collection cycle was carried forward (from 3.5 years).
Other Explanatory FactorsOther potentially important explanatory factors were identified from recentsystematic reviews29,30 and results of previous studies using the QLSCD.18,31,32
These variables were included in order to gain a more holistic understanding ofweight change, as well as to control for potential confounding. A description ofthese variables is given in Table 1. The mechanism by which explanatory variablescould influence weight gain was not the primary focus here. Therefore, factors likelifestyle behaviors (e.g., physical activity, diet, and sleep), family functioning,parenting styles, food security, and general well-being of parents and child werenot analyzed in this study as they were considered more proximate mediators.
STATISTICAL ANALYSIS
In order to achieve the study’s main objective, a growth-curve or random-effectsanalysis was conducted using PROC MIXED in SAS, version 9.2, using therestricted maximum likelihood estimation method.
First, an exploratory unadjusted analysis was conducted to examine variabledistributions and identify outliers and other potential problems with the data.Graphical analysis was conducted to investigate the shape of the BMI Z-score trendand to assess, in an exploratory fashion, the importance of the consideredexplanatory variables. Time was treated as a continuous variable (age in years)and was centered at the mean (approximately 7 years). To determine the base modelfrom which to conduct further multivariable modeling, four “unadjusted” models,i.e., including only age as either linear, quadratic, cubic, or spline at 7 years, werecompared using likelihood ratio tests.33 The G matrix was assumed to be factoranalytic.34 It was determined that the quadratic model fit the data better than theother models and was thus used in further model building. Modeling of explanatoryfactors involved adding all potential explanatory variables together to theunadjusted model and adding interactions between the explanatory variables andage and age2. The interaction terms involving age and age2 were reduced bybackwards elimination using α=0.05.
The fit of the adjusted model was checked graphically to investigate violations ofassumptions about random effects or the specification of fixed effects to identifypotential outliers or observations having undue influence on the model and the need
PLACE AND EARLY WEIGHT GAIN 229
to transform particular covariates. Variance inflation factors were calculated for across-sectional model of BMI Z-score in order to assess multicollinearity betweenincluded explanatory variables. Ethics approval to conduct this analysis was givenby the University of Ottawa Research Ethics Board—certificate number H 05-10-18.
RESULTS
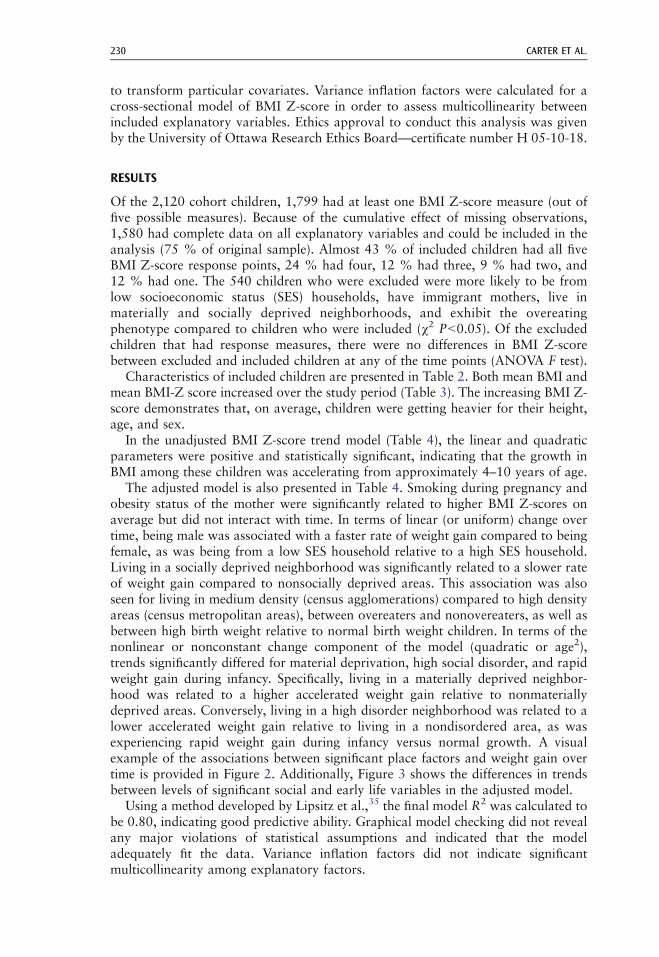
Of the 2,120 cohort children, 1,799 had at least one BMI Z-score measure (out offive possible measures). Because of the cumulative effect of missing observations,1,580 had complete data on all explanatory variables and could be included in theanalysis (75 % of original sample). Almost 43 % of included children had all fiveBMI Z-score response points, 24 % had four, 12 % had three, 9 % had two, and12 % had one. The 540 children who were excluded were more likely to be fromlow socioeconomic status (SES) households, have immigrant mothers, live inmaterially and socially deprived neighborhoods, and exhibit the overeatingphenotype compared to children who were included (χ2 PG0.05). Of the excludedchildren that had response measures, there were no differences in BMI Z-scorebetween excluded and included children at any of the time points (ANOVA F test).
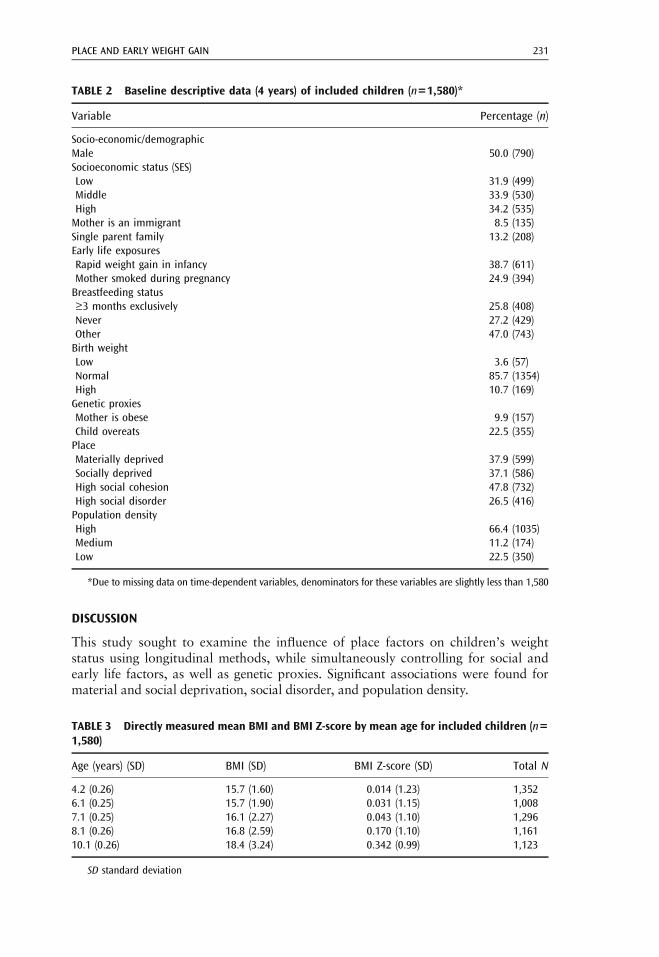
Characteristics of included children are presented in Table 2. Both mean BMI andmean BMI-Z score increased over the study period (Table 3). The increasing BMI Z-score demonstrates that, on average, children were getting heavier for their height,age, and sex.
In the unadjusted BMI Z-score trend model (Table 4), the linear and quadraticparameters were positive and statistically significant, indicating that the growth inBMI among these children was accelerating from approximately 4–10 years of age.
The adjusted model is also presented in Table 4. Smoking during pregnancy andobesity status of the mother were significantly related to higher BMI Z-scores onaverage but did not interact with time. In terms of linear (or uniform) change overtime, being male was associated with a faster rate of weight gain compared to beingfemale, as was being from a low SES household relative to a high SES household.Living in a socially deprived neighborhood was significantly related to a slower rateof weight gain compared to nonsocially deprived areas. This association was alsoseen for living in medium density (census agglomerations) compared to high densityareas (census metropolitan areas), between overeaters and nonovereaters, as well asbetween high birth weight relative to normal birth weight children. In terms of thenonlinear or nonconstant change component of the model (quadratic or age2),trends significantly differed for material deprivation, high social disorder, and rapidweight gain during infancy. Specifically, living in a materially deprived neighbor-hood was related to a higher accelerated weight gain relative to nonmateriallydeprived areas. Conversely, living in a high disorder neighborhood was related to alower accelerated weight gain relative to living in a nondisordered area, as wasexperiencing rapid weight gain during infancy versus normal growth. A visualexample of the associations between significant place factors and weight gain overtime is provided in Figure 2. Additionally, Figure 3 shows the differences in trendsbetween levels of significant social and early life variables in the adjusted model.
Using a method developed by Lipsitz et al.,35 the final model R2 was calculated tobe 0.80, indicating good predictive ability. Graphical model checking did not revealany major violations of statistical assumptions and indicated that the modeladequately fit the data. Variance inflation factors did not indicate significantmulticollinearity among explanatory factors.
CARTER ET AL.230
DISCUSSION
This study sought to examine the influence of place factors on children’s weightstatus using longitudinal methods, while simultaneously controlling for social andearly life factors, as well as genetic proxies. Significant associations were found formaterial and social deprivation, social disorder, and population density.
TABLE 3 Directly measured mean BMI and BMI Z-score by mean age for included children (n=1,580)
Age (years) (SD) BMI (SD) BMI Z-score (SD) Total N
4.2 (0.26) 15.7 (1.60) 0.014 (1.23) 1,3526.1 (0.25) 15.7 (1.90) 0.031 (1.15) 1,0087.1 (0.25) 16.1 (2.27) 0.043 (1.10) 1,2968.1 (0.26) 16.8 (2.59) 0.170 (1.10) 1,16110.1 (0.26) 18.4 (3.24) 0.342 (0.99) 1,123
SD standard deviation
TABLE 2 Baseline descriptive data (4 years) of included children (n=1,580)*
Variable Percentage (n)
Socio-economic/demographicMale 50.0 (790)Socioeconomic status (SES)Low 31.9 (499)Middle 33.9 (530)High 34.2 (535)Mother is an immigrant 8.5 (135)Single parent family 13.2 (208)Early life exposuresRapid weight gain in infancy 38.7 (611)Mother smoked during pregnancy 24.9 (394)Breastfeeding status≥3 months exclusively 25.8 (408)Never 27.2 (429)Other 47.0 (743)Birth weightLow 3.6 (57)Normal 85.7 (1354)High 10.7 (169)Genetic proxiesMother is obese 9.9 (157)Child overeats 22.5 (355)PlaceMaterially deprived 37.9 (599)Socially deprived 37.1 (586)High social cohesion 47.8 (732)High social disorder 26.5 (416)Population densityHigh 66.4 (1035)Medium 11.2 (174)Low 22.5 (350)
*Due to missing data on time-dependent variables, denominators for these variables are slightly less than 1,580
PLACE AND EARLY WEIGHT GAIN 231
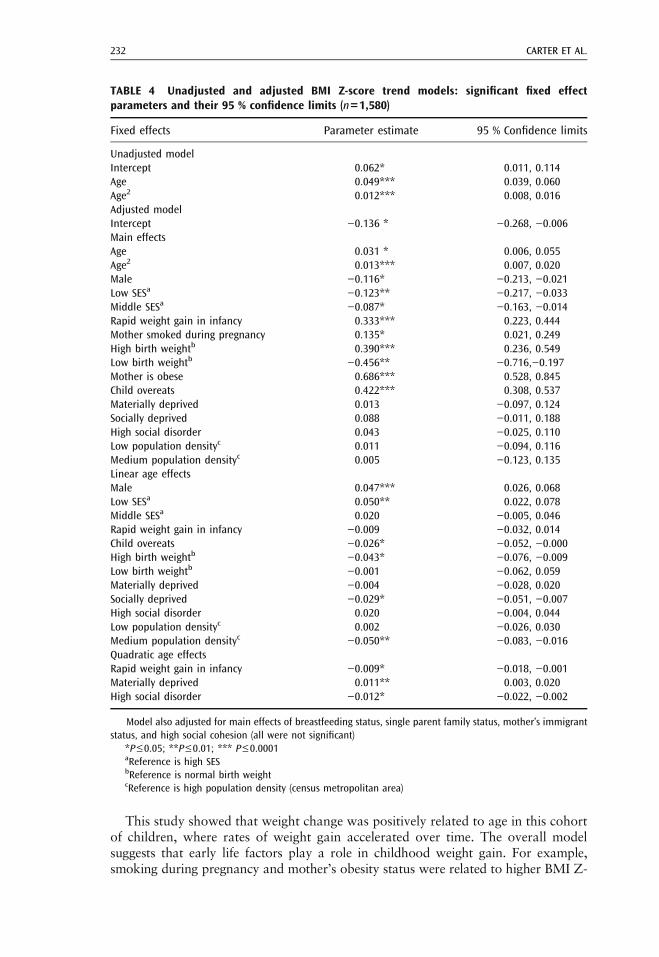
This study showed that weight change was positively related to age in this cohortof children, where rates of weight gain accelerated over time. The overall modelsuggests that early life factors play a role in childhood weight gain. For example,smoking during pregnancy and mother’s obesity status were related to higher BMI Z-
TABLE 4 Unadjusted and adjusted BMI Z-score trend models: significant fixed effectparameters and their 95 % confidence limits (n=1,580)
Fixed effects Parameter estimate 95 % Confidence limits
Unadjusted modelIntercept 0.062* 0.011, 0.114Age 0.049*** 0.039, 0.060Age2 0.012*** 0.008, 0.016Adjusted modelIntercept −0.136 * −0.268, −0.006Main effectsAge 0.031 * 0.006, 0.055Age2 0.013*** 0.007, 0.020Male −0.116* −0.213, −0.021Low SESa −0.123** −0.217, −0.033Middle SESa −0.087* −0.163, −0.014Rapid weight gain in infancy 0.333*** 0.223, 0.444Mother smoked during pregnancy 0.135* 0.021, 0.249High birth weightb 0.390*** 0.236, 0.549Low birth weightb −0.456** −0.716,−0.197Mother is obese 0.686*** 0.528, 0.845Child overeats 0.422*** 0.308, 0.537Materially deprived 0.013 −0.097, 0.124Socially deprived 0.088 −0.011, 0.188High social disorder 0.043 −0.025, 0.110Low population densityc 0.011 −0.094, 0.116Medium population densityc 0.005 −0.123, 0.135Linear age effectsMale 0.047*** 0.026, 0.068Low SESa 0.050** 0.022, 0.078Middle SESa 0.020 −0.005, 0.046Rapid weight gain in infancy −0.009 −0.032, 0.014Child overeats −0.026* −0.052, −0.000High birth weightb −0.043* −0.076, −0.009Low birth weightb −0.001 −0.062, 0.059Materially deprived −0.004 −0.028, 0.020Socially deprived −0.029* −0.051, −0.007High social disorder 0.020 −0.004, 0.044Low population densityc 0.002 −0.026, 0.030Medium population densityc −0.050** −0.083, −0.016Quadratic age effectsRapid weight gain in infancy −0.009* −0.018, −0.001Materially deprived 0.011** 0.003, 0.020High social disorder −0.012* −0.022, −0.002
Model also adjusted for main effects of breastfeeding status, single parent family status, mother’s immigrantstatus, and high social cohesion (all were not significant)
*P≤0.05; **P≤0.01; *** P≤0.0001aReference is high SESbReference is normal birth weightcReference is high population density (census metropolitan area)
CARTER ET AL.232

scores on average, and even though high birth weight and rapid weight gain in infancywere associated with slightly slower rates of weight change over time, children who hadthese characteristics had higher BMI Z-scores throughout the study compared to thosewithout (Figure 3). Taken together, these results corroborate those of previous studiesin a recent systematic review.29
In terms of individual and family characteristics, the difference in trends betweenmales and females found in this study is in contrast to the findings of two otherlongitudinal studies that did not find significant interactions with time.11,36 Low SESbeing related to faster weight gain, on the other hand, has been demonstrated inother longitudinal studies.37
For the main explanatory factors of interest, living in materially deprivedneighborhoods was related to higher accelerated weight gain. The general positiverelationship uncovered here is in line with previous cross-sectional and longitudinalstudies.9,38,39 Very few studies examining the effect of neighborhood characteristicson weight in children have actually partitioned neighborhood deprivation into twodimensions, such as was done in this study. Here, the influence of social deprivationwas in contrast to that of material deprivation; the rate of weight gain amongchildren who lived in areas with high social deprivation was slower than that ofchildren who lived in nonsocially deprived areas. Using Québec information systemscovering mortality, hospitalizations, and births, the creators of the deprivation indexused in this study found that the two forms of deprivation had differing impacts onhealth.19 However, a cross-sectional study that used the same index did not find thatsocial deprivation was significantly related to overweight among Canadian adults.22
Pre
dict
ed B
MI Z
-sco
re
-2.0
-1.5
-1.0
-0.5
0.0
0.5
1.0
1.5
2.0
Approximate age in years
3 4 5 6 7 8 9 10 11
Material deprivation Not materially deprivedMaterially deprived
Pre
dict
ed B
MI Z
-sco
re
-2.0
-1.5
-1.0
-0.5
0.0
0.5
1.0
1.5
2.0
Approximate age in years
3 4 5 6 7 8 9 10 11
Social deprivation Not socially deprivedSocially deprived
Pre
dict
ed B
MI Z
-sco
re
-2.0
-1.5
-1.0
-0.5
0.0
0.5
1.0
1.5
2.0
Approximate age in years
3 4 5 6 7 8 9 10 11
High neighbourhood social disorder No Yes
Pre
dict
ed B
MI Z
-sco
re
-2.0
-1.5
-1.0
-0.5
0.0
0.5
1.0
1.5
2.0
Approximate age in years
3 4 5 6 7 8 9 10 11
Population density Low (RST)Medium (CA)
High (CMA)
FIGURE 2. Predicted BMI Z-score smoothed individual trends by significant place factors in theQLCSD, adjusted for other model covariates.
PLACE AND EARLY WEIGHT GAIN 233

Pre
dict
ed B
MI Z
-sco
re
-2.0
-1.5
-1.0
-0.5
0.0
0.5
1.0
1.5
2.0
Approximate age in years
3 4 5 6 7 8 9 10 11
Sex Female Male
Pre
dict
ed B
MI Z
-sco
re
-2.0
-1.5
-1.0
-0.5
0.0
0.5
1.0
1.5
2.0
Approximate age in years
3 4 5 6 7 8 9 10 11
SES in tertiles Low SES Middle SESHigh SES
Pre
dict
ed B
MI Z
-sco
re
-2.0
-1.5
-1.0
-0.5
0.0
0.5
1.0
1.5
2.0
Approximate age in years
3 4 5 6 7 8 9 10 11
Mother smoked during pregnancy No Yes
Pre
dict
ed B
MI Z
-sco
re
-2.0
-1.5
-1.0
-0.5
0.0
0.5
1.0
1.5
2.0
Approximate age in years
3 4 5 6 7 8 9 10 11
Child is an overeater No Yes
Pre
dict
ed B
MI Z
-sco
re
-2.0
-1.5
-1.0
-0.5
0.0
0.5
1.0
1.5
2.0
Approximate age in years
3 4 5 6 7 8 9 10 11
Birth weight category High LowNormal
Pre
dict
ed B
MI Z
-sco
re
-2.0
-1.5
-1.0
-0.5
0.0
0.5
1.0
1.5
2.0
Approximate age in years
3 4 5 6 7 8 9 10 11
Rapid weight gain in infancy No Yes
Pre
dict
ed B
MI Z
-sco
re
-2.0
-1.5
-1.0
-0.5
0.0
0.5
1.0
1.5
2.0
Approximate age in years
3 4 5 6 7 8 9 10 11
Obesity status of the mother Not obeseObese
FIGURE 3. Predicted BMI Z-score smoothed individual trends by significant social and early lifefactors, adjusted for other model covariates.
CARTER ET AL.234
Similar to high social deprivation, living in neighborhoods with high socialdisorder was related to lower accelerated weight gain relative to not living in suchareas. Again, few studies have related this neighborhood characteristic to weightstatus in children. Rather, studies have examined a similar concept, neighborhoodsafety, but have met with largely null results.9 Even though the findings for highsocial deprivation and high social disorder are in contrast to the original hypothesis,that they would be positively related to weight gain in children, they are interestingand informative nonetheless, and reflect the complexity of environmental influenceson childhood weight status. One explanation for this finding is that such adversesocial places may take longer to exert their weight promoting effects. While childrenare young, on the other hand, they may have the opposite effect—restricting growth,similar to what is often found in the early child development literature.28,40,41 Onthe other hand, it may be that these environmental influences provide protectionfrom weight gain for reasons not yet understood.
Finally, population density was hypothesized to have a linear relationship withweight status, such that as density increased, weight gain would decrease. Thefindings here do not corroborate this: Children living in medium density (censusagglomerations) areas exhibited slower growth than children in high density areas(census metropolitan areas), and there was no difference between low density (rural/small towns) and high density areas. Overall, the literature in this area ismethodologically heterogeneous with similarly mixed results.9,42 A study conductedby Statistics Canada used nationally representative data to determine the unadjustedregional distribution of child and adolescent overweight. They did not find that theprevalence of overweight significantly differed across census metropolitan areas,census agglomerations, and rural/small towns.43
The reason(s) for an inverse association between living in medium density areasand weight status may reflect a more complex reality than the original hypothesiswas able to capture. For example, even though census agglomerations are lessdensely populated than census metropolitan areas, they have an urban core and canact like census metropolitan areas.44 Some have high functional metropolitan scoresbecause they act as regional centers and therefore provide a range of services.44
Some may not have high functional scores but are located in close proximity to acensus metropolitan area, benefiting from services provided close by. Thus, censusagglomerations may function as more of a close-knit community than a censusmetropolitan area, with services close at hand, in contrast to rural/small townswhose residents must commute longer distances to access services and to go to work.The importance of population density on weight gain in children requires furtherstudy, and indeed longitudinal findings like these may not corroborate some earliercross-sectional relationships observed. It is also possible that the relationshipbetween population density and weight may change over time. This could also besaid for the other factors considered here.
The findings of the present study should be interpreted in light of somelimitations. First, this was a secondary analysis, which limited us to the variablesthat were collected. For example, material and social deprivation were measuredonce at the start of the cohort study and therefore could have changed over the studyperiod. The place factors available in the QLSCD provided a 10,000 versus 100 ft
PLACE AND EARLY WEIGHT GAIN 235

view of the place–weight status relationship, as more direct variables such asamenities, infrastructure, etc. were not available.
Due to the study design, some earlier time-dependent covariate data (from5 months to 3.5 years) could not be accounted for in modeling. The study designalso did not permit the use of sample weights. Therefore, the results are notnecessarily generalizable to the Québec population. The overall model was fairlysimplistic in regards to social–ecological theory. Other settings such as daycare andschool were not included, and effect modification was not explored in order to keepthe analysis manageable and parsimonious. Consideration should also be given tothe importance of the place factors relative to the genetic proxies and factorsoperating in early life; variables such as obesity status of the mother, overeating,high birth weight, rapid weight gain in infancy, and smoking during pregnancyappear to be more strongly related to weight status than the individual socio-demographic/economic and place factors (see Figures 2 and 3).
Finally, children in this cohort may not follow a homogenous functional form ofweight development, which can be characterized by a population-averaged model.This warrants a comparison between the results observed here and those derivedfrom a group-based trajectory modeling approach, such as has been used in previousstudies of childhood obesity.45–47
This study shows that, on average, cohort children were getting heavier over timeand suggests the existence of individual and neighborhood social inequalities inchildhood weight change. Further work is needed to clarify these relationships,especially for neighborhood-level factors. As in other studies, results here also pointto early life as a potentially important developmental window for obesity. Futurework, therefore, should also seek to determine the relationship between placecharacteristics during the perinatal period and these early life risk factors for obesity.Childhood obesity research is, by its very nature, complex. This merits a holisticapproach where researchers should continue to focus “upstream” on the interrela-tionships between different contexts, settings, life stages, and generational transmis-sion, in addition to traditional risk factors such as diet and physical activity.
ACKNOWLEDGMENTS
This work was supported by grants from the Canadian Institutes for HealthResearch. The QLSCD was conducted by Santé Québec, a division of the Institut dela Statistique du Québec (ISQ) and funded by the Ministry of Health and SocialServices of Québec.
Disclaimer. This analysis was based on the ISQ QLSCD master files. All computationswere prepared by the lead author. The responsibility for the use and interpretation ofthese data is solely that of the authors, not ISQ. The opinions expressed in this paper arethose of the authors and do not represent the views of the ISQ.
OPEN ACCESS This article is distributed under the terms of the Creative CommonsAttribution License which permits any use, distribution, and reproduction in anymedium, provided the original author(s) and the source are credited.
CARTER ET AL.236

APPENDIX 1
REFERENCES
1. Tremblay MS, Katzmarzyk PT, Willms JD. Temporal trends in overweight and obesity inCanada, 1981–1996. Int J Obes Relat Metab Disord. 2002; 26(4): 538–543.
2. Shields M. Overweight and obesity among children and youth. Health Rep. 2006; 17(3):27–42.
3. Kohn M, Booth M. The worldwide epidemic of obesity in adolescents. Adolesc Med.2003; 14(1): 1–9.
4. Lobstein T, Baur L, Uauy R. Obesity in children and young people: a crisis in publichealth. Obes Rev. 2004; 5(Suppl 1): 4–104.
5. Hertzman C. Framework for the social determinants of early child development.Encyclopedia on early child development 2010. http://www.enfant-encyclopedie.com/pages/PDF/HertzmanANGxp.pdf. Accessed 1 Nov 2010.
6. Bernard P, Charafeddine R, Frohlich KL, Daniel M, Kestens Y, Potvin L. Healthinequalities and place: a theoretical conception of neighbourhood. Soc Sci Med. 2007; 65(9): 1839–1852.
7. Stafford M, Cummins S, Ellaway A, Sacker A, Wiggins R, Macintyre S. Pathways toobesity: identifying local, modifiable determinants of physical activity and diet. Soc SciMed. 2007; 65(9): 1882–1897.
8. Black JL, Macinko J. Neighborhoods and obesity. Nutr Rev. 2008; 66(1): 2–20.9. Carter MA, Dubois L. Neighbourhoods and child adiposity: a critical appraisal of the
literature. Health Place. 2010; 16(3): 616–628.10. Bell JF, Wilson JS, Liu GC. Neighborhood greenness and 2-year changes in body mass
index of children and youth. Am J Prev Med. 2008; 35(6): 547–553.11. Oliver LN, Hayes MV. Effects of neighbourhood income on reported body mass index: an
eight year longitudinal study of Canadian children. BMC Public Health. 2008; 8: 16.
TABLE 5 Neighborhood social scale items
Scale Response categories
Social cohesionPlease tell me whether you strongly agree, agree, disagree, or strongly disagree about the followingstatement…
1. If there is a problem around here, the neighbors get together to deal with it Strongly agree=12. There are adults in the neighborhood that children can look up to Agree=23. People around here are willing to help their neighbors Disagree=34. You can count on adults in this neighborhood to watch out that children are
safe and do not get in troubleStrongly disagree=4
5. When I am away from home, I know that my neighbors will keep their eyesopen for possible trouble
Social disorderHow much of a problem is the following in this neighbourhood…1. Litter, broken glass or garbage? A big problem=12. Selling or using drugs? Somewhat of a
problem=23. Alcoholics and excessive drinking in public? No problem=34. Groups of young people who cause trouble?
PLACE AND EARLY WEIGHT GAIN 237

12. Cecil-Karb R, Grogan-Kaylor A. Childhood body mass index in community context:neighborhood safety, television viewing, and growth trajectories of BMI. Health SocWork. 2009; 34(3): 169–177.
13. Concepts, definitions and operational aspects: 5 month old enfants. Québec LongitudinalStudy of Child Development (QLSCD1998–2002). Institut de la statistique duQuébec 2001,vol 1. no. 12. http://www.iamillbe.stat.gouv.qc.ca/bebe/bebe_n12_pdf_an.htm. Accessed 25Oct 2010.
14. Survey description and methodology: 5-month old infants. Québec Longitudinal Study ofChild Development (ELDEQ 1998–2002). Institut de la statistique du Québec 2000; vol 1,no. 1. http://www.iamillbe.stat.gouv.qc.ca/bebe/pdf/baby_no1-2.pdf. Accessed 26 Oct 2010.
15. Ogden CL, Kuczmarski RJ, Flegal KM, et al. Centers for disease control and prevention2000 growth charts for the United States: improvements to the 1977 national center forhealth statistics version. Pediatrics. 2002; 109(1): 45–60.
16. Kuczmarski RJ, Ogden CL, Guo SS, et al. CDC growth charts for the United States:methods and development. Vital Health Stat. 2002; 11(246):1–190.
17. Must A, Anderson SE. Body mass index in children and adolescents: considerations forpopulation-based applications. Int J Obes. 2006; 30(4): 590–594.
18. Desrosiers H, Dumitru V, Dubois L. Excess weight in children 4 to 7 years of age—targetingrisk factors for intervention. Institut de la Statistique du Québec 2009. Vol. 4, No. 3.
19. Pampalon R, Raymond G. A deprivation index for health and welfare planning inQuebec. Chron Dis Can. 2000; 21(3): 104–113.
20. Pampalon R, Hamel D, Gamache P, Raymond G. A deprivation index for health planningin Canada. Chron Dis Can. 2009; 29(4): 178–191.
21. Pampalon R, Philibert M, Hamel D. Développement d’un système d’évaluation de ladéfavorisation des communautés locales et des clientèles de CLSC. Montréal, Québec:Institut national de santé publique du Québec; 2004. Report no. INSPQ-2004-024.
22. Lebel A, Pampalon R, Hamel D, Theriault M. The geography of overweight in Québec: amultilevel perspective. Can J Public Health. 2009; 100(1): 18–23.
23. Barnes-McGuire J. The reliability and validity of a questionnaire describing neighbor-hood characteristics relevant to families and young children living in urban areas. JCommunity Psychol. 1997; 25(6): 551–566.
24. Statistics Canada. Microdata user guide: national longitudinal survey of children andyouth—cycle 1. Ottawa: Human Resources Development Canada and Statistics Canada;1997.
25. Variables dérivées de l’ÉLDEQ 1998–2008: partie A. Institut de la statistique duQuébec 2009. http://www.jesuisjeserai.stat.gouv.qc.ca/pdf/doc_tech/E1aE11Variables_Derivees1101.pdf. Accessed 25 Oct 2010.
26. Carnell S, Wardle J. Appetitive traits in children. New evidence for associations withweight and a common, obesity-associated genetic variant. Appetite. 2009; 53(2): 260–263.
27. Llewellyn CH, van Jaarsveld CH, Johnson L, Carnell S, Wardle J. Nature and nurture ininfant appetite: analysis of the Gemini twin birth cohort. Am J Clin Nutr. 2010; 91(5):1172–1179.
28. Curtis LJ, Dooley MD, Phipps SA. Child well-being and neighbourhood quality: evidencefrom the Canadian National Longitudinal Survey of Children and Youth. Soc Sci Med.2004; 58(10): 1917–1927.
29. Monasta L, Batty GD, Cattaneo A et al. Early-life determinants of overweight andobesity: a review of systematic reviews. Obes Rev. 2010;11:695–708
30. Shrewsbury V, Wardle J. Socioeconomic status and adiposity in childhood: a systematicreview of cross-sectional studies 1990–2005. Obesity. 2008; 16(2): 275–284.
31. Dubois L, Farmer A, Girard M, Peterson K, Tatone-Tokuda F. Problem eating behaviorsrelated to social factors and body weight in preschool children: a longitudinal study. Int JBehav Nutr Phys Act. 2007; 4: 9.
CARTER ET AL.238

32. Dubois L, Girard M. Early determinants of overweight at 4.5 years in a population-basedlongitudinal study. Int J Obes. 2006; 30(4): 610–617.
33. Cheng J, Edwards LJ, Maldonado-Molina MM, Komro KA, Muller KE. Reallongitudinal data analysis for real people: building a good enough mixed model. StatMed. 2010; 29(4): 504–520.
34. Fitzmaurice GM, Laird NM, Ware JH. Applied longitudinal analysis. Hoboken: Wiley;2004.
35. Lipsitz SR, Leong T, Ibrahim J, Lipshultz S. A partial correlation coefficient andcoefficient of determination for multivariate normal repeated measures data. Statistician.2001; 50(1): 87–95.
36. Wardle J, Brodersen NH, Cole TJ, Jarvis MJ, Boniface DR. Development of adiposity inadolescence: five year longitudinal study of an ethnically and socioeconomically diversesample of young people in Britain. BMJ. 2006; 332(7550): 1130–1135.
37. Hejazi S, Dahinten S, Ratner PA, Marshall SK. Developmental trajectories of weightstatus in childhood and adolescence. In: Bagchi D, editor. Global perspectives onchildhood obesity. New York: Academic Press; 2011. pp. 21–29.
38. Oreskovic NM, Kuhlthau KA, Romm D, Perrin JM. Built environment and weightdisparities among children in high- and low-income towns. Acad Pediatr. 2009; 9(5):315–321.
39. Grow HM, Cook AJ, Arterburn DE, Saelens BE, Drewnowski A, Lozano P. Child obesityassociated with social disadvantage of children’s neighborhoods. Soc Sci Med. 2010; 71(3): 584–591.
40. Kohen DE, Brooks-Gunn J, Leventhal T, Hertzman C. Neighborhood income andphysical and social disorder in Canada: associations with young children’s competencies.Child Dev. 2002; 73(6): 1844–1860.
41. Leventhal T, Brooks-Gunn J. The neighborhoods they live in: the effects of neighborhoodresidence on child and adolescent outcomes. Psychol Bull. 2000; 126(2): 309–337.
42. Dunton GF, Kaplan J, Wolch J, Jerrett M, Reynolds KD. Physical environmentalcorrelates of childhood obesity: a systematic review. Obes Rev. 2009; 10(4): 393–402.
43. Shields M, Tjepkema M. Regional differences in obesity. Health Rep. 2006; 17(3): 61–67.44. Mendelson R, Lefebvre J. Reviewing census metropolitan areas (CMA) and census
agglomerations (CA) in Canada according to metropolitan functionality. Ottawa,Canada: Statistics Canada; 2003. Report no. 2003-001.
45. Hejazi S, Dahinten VS, Marshall SK, Ratner PA. Developmental pathways leading toobesity in childhood. Health Rep. 2009; 20(3): 63–69.
46. Li C, Goran MI, Kaur H, Nollen N, Ahluwalia JS. Developmental trajectories ofoverweight during childhood: role of early life factors. Obesity. 2007; 15(3): 760–771.
47. Mustillo S, Worthman C, Erkanli A, Keeler G, Angold A, Costello EJ. Obesity andpsychiatric disorder: developmental trajectories. Pediatrics. 2003; 111(4 Pt 1): 851–859.
PLACE AND EARLY WEIGHT GAIN 239