Embed Size (px)
Citation preview

RJOAS, 1(97), January 2020
174
DOI 10.18551/rjoas.2020-01.22
THE INFLUENCE OF STRATEGIC RESOURCES AND COMPETITIVE STRATEGY ON IMPROVING OF BUSINESS PERFORMANCE
Riana I Gede*, Wibawa I Made Artha, Suparna Gede
Researchers, Indonesia *E-mail: [email protected]
ABSTRACT This study investigates the influence of resources strategic and competitive strategy on the performance of SMEs in Bali, Indonesia. The sample of this study consists of 149 SMEs, comprised of 114 small businesses and 35 medium enterprises, and selected using the stratified random sampling. The data is analyzed in two steps; the descriptive statistical analysis and inferential analysis. The descriptive analysis aims to discover the characteristics and the responses on the questionnaire items, while the inferential analysis; using the Structural Equation Modeling (SEM) through AMOS software to test the hypothesis of the research. The finding shows that the strategic resources have a positive and significant effect on the competitive strategy; the competitive strategy has a positive and significant effect on performance, and the strategic resources have a positive and significant effect on the performance. Also, it is found that strategic resources have a positive indirect effect on business performance through a competitive strategy. The descriptive analysis reveals that for the resources strategic, the achievement of reputation resources has the highest response of 4.06. Meanwhile, for the competitive strategy, the highest response of 4.08 is given to the focus strategy. The highest response of 3.94 the performance is productivity. KEY WORDS Strategies resources, competitive strategy, business performance, SMEs.
A good economic structure is a structure of development supported by all the power of people’s economy (Esfandiara, 2019). The empowerment of people’s economy is inseparable from the empowerment of entrepreneurship activities, which are commonly acknowledged as one of the most important impulses in developing national economy (Trung, 2008). Nowadays, SMEs have contributed greatly towards economic development; in terms of providing jobs and work opportunities and increasing public income and non-oil export (Cosenza & Notob, 2018). The SMEs sector is the major drive which promotes the growth of jobs in a country’s economy (Kaja and Osmani, 2013). The efforts to empower SMEs is becoming more critical, considering the dramatic changes in the global business environment in which the SMEs are required to have competitive advantages to win the competition and survive (Suardhika, 2012). Indonesia has joined the AEC - 2016 by implementing the free market in various sectors such as capital, goods, services, and labours. One of the three main pillars of AEC is its mission to create a better economic climate in ASEAN to compete with more economically-advanced countries. However, on the other hand, the competitiveness of SMEs is generally low and prone to the negative effects of changes in the business environment. This will lead to low productivity, which in turn will result in business failure due to the inability to adapt to the business environment (Zimmerer & Scarborough, 2008).
One of the proposed solutions for this challenge is the resource-based operation or management to create a unique competency (Grant, 2010; Mosakowski, 1993) and providing strategic choices to achieve sustainable competitive advantages (Grant, 2010; Barney, 1991). Realising sustainable competitive advantages can`t be separated from the resource-based view (RBV) approach that leads the management to identify, control, and develops strategic resources to produce optimal performance (Barney, 1995).
Strategic resources are a series of assets and capabilities which becomes the core competencies of a company to produce competitive advantage (Williams, 2014). Fernandes (2019), mentioned that strategic resources are the basic strategic instruments in creating a

RJOAS, 1(97), January 2020
175
competitive advantage to add values to the operation and competition of a company, as well as the foundation to choose a business strategy. The processes of development, maintenance, and control of strategic resources have to be performed from time to time to create a strong foundation for achieving sustainable competitive advantages and to produce a superior performance of the company (Hair et al., 2014).
The suitability and conformity of the implemented strategy with the company’s resources is an important beginning for improving the company’s performance (Wernerfelt, 1984; Porter, 1998). Moreover, Grant (2010), stated that strategic resources owned and controlled by the company should be utilized as the basis for formulating and implementing strategies to realise optimal business performance. Barney (1995) adds that the survival of a company depends on its resources and the strategy it chooses to empower those resources so that they can respond well to the opportunities and challenges provided by the business environment.
The role of the company’s resources as the determining factor of performance has been well-proven (Ainuddin et al., 2007; Talaja, 2012; Ferreira & Azevedo, 2007). Edelman et al. (2002), who empirically investigate small enterprises in a less-interesting industry in the United States, utilise the intangible concept of resources (human and organizational resources) to predict the implementation of business strategy and business performance. The findings of Edelman et al. (2002) indicate that both resources and strategy cannot explain the
performance, on their own. However, strategies that suit the profiles of the resources can improve business performance. Furthermore, Edelman et al. (2002) report that human and organizational resources, combined with customer service strategy, can increase a company’s performance.
LITERATURE REVIEW
Business Performance. The measurement of business performance is performed using
financial and non-financial approaches to determine the achievement of the company’s goals (Chong, 2008). However, difficulties emerge when the manager or owner of SMEs is unwilling or reluctant to provide information about financial performance nature (effendi and Arifin, 2010). To anticipate the unavailability of real performance data, such information can be explored through the perception approach of the owner or manager of SMEs (Dess & Beard, 1984). This is relevant to measure the performance of an enterprise, particularly because the small business seldom has appropriate financial report to publish (Özdemirci, 2011). Rosli (2012), measures the performance of SMEs by referring to three aspects, namely profitability, productivity, and market. The profitability aspect measures performance based on the achievement of the financial target set by the company. The financial target aim is generally to focus on the achievement of revenue, profit, cash flow, return on capital employed, return on investment, or economic value added (Parnell et al., 2006). Further, Camison notes that the measurement of performance is base on the respondents’ expectation of and interest on those measures. Performance is analyzed based on the company’s achievement, in terms of the extent of satisfaction level on business performance achievement (Rosli, 2012).
Resource-Based View of the Firm (RBV) Theory. A company’s ability to continuously
create and sustain superior values is determined by the competitive advantage of that company (Barney, 1995; McWilliams & Siegel, 2011). There are two models of competitiveness to explain the concept of sustainable competitive advantage. The first is the industrial organization competitive advantage model, developed by Porter (1998) using the theoretical paradigm of structure-conduct performance (SCP) stemmed from the theory of industrial organization economy theory. This is the main explanation for sustainable competitive advantage. The second model is the Resource-Based View (RBV) model, stemmed from the internal strength and resources of the company, which primarily explains the value production of the company (Barney, 1991; Peteraf, 1993; Grant, 2010). Based to Porter (1998), to create a sustainable competitive advantage, a company has to reconfigure its chain of values, including the configuration of primary and secondary activities in an integrated chain of values. Further, Porter formulates three models of competitive strategy for

RJOAS, 1(97), January 2020
176
a company to produce sustainable competitive advantage; including (1) the cost leadership strategy, (2) the differentiation strategy, and (3) the focus strategy. Research by Rosli (2012) mentioned that The SMEs had placed high emphasis on resources strategic, e.g., firm management, marketing and human resource management; and moderate emphasis on total innovation.
The RBV model, based on the unique competence and resources of a company, can improve its competitive advantage and produce superior values beyond the average competitiveness of its competitors (Fahy, 2000). This is because a company has unique resources of competence, skills, knowledge, and productive factors that its competitors can never imitate. Barney (1995) defines competitive advantage from the perspective of Resource-Based View as follow; ―An enterprise has a competitive advantage if it can create more economic value than the marginal competitor in its product market‖. This definition is consistent with the spirit of competitive advantage definition proposed by Porter (1998) in the industrial organization approach and with the value-based view approach. In RBV, one of the ways to produce sustainable competitive advantage is by creating or generating a kind of the firm’s specific resources (FSR), which, in theory, is something unique or specific to the company or firm so that it is hard to imitate.
RBV states that the complex system of an organization, which is the foundation for strategic advantage, is resulted from the unique historical background of each firm or organization. However, the real source of such resources is still unclear (Ollavarrieta & Ellinger, 1997). The key source of the unique resources that can improve a firm’s competitive advantage is the company’s specific resources resulted from the differences in attributes of companies in an industry (Barney, 1991; Wang et al., 2011; Wang, 2014).
Competitive Strategy. Every business must design several strategies to achieve its goals, including marketing strategy, technological strategy, and resources appointment strategy. Strategy and the formulation of strategy play an important part in the firms’ management process (Miles & Darroch, 2006). The strategy gives the direction that a firm has in mind and in which way they want to achieve their goals (Gibcus and Kemp, 2003; Qi et al., 2011; Parnell, 2011). Researchers, in general, refer to two approaches of competitive strategy; the competitive strategy of Miles & Snow and the competitive strategy of Porter. Miles & Snow strategy (2003) focuses on the strategic orientation, classifying three strategies related to good performance: prospector, defender, and analyzer, and one strategy related to bad performance; i.e. reactor strategy. Meanwhile, Porter’s competitive strategy focuses on the strategic position by proposing three generic strategies to produce competitive advantage: the overall cost leaders, the differentiation, and the focus strategies. On the other hand, the stuck-in-the-middle strategy proposed by Porter contributes to a negative effect on performance (Estévez et al., 2018).
This study uses Porter’s (1998), competitive strategy operational because this strategy is considered relevant to the practices of SMEs (Suliyanto & Rahab, 2012; Hashim et al.,
2001). Also, it is closely related to the SMEs efforts to improve and develop its competitive position and its market segment in the industry (Wheelen & Hunger, 2012). Based on this strategy, the value of SMEs resources depends on their suitability to the structure of SMEs industry, and on their ability to support the implementation of the performance improvement strategy. Three generic competitive strategies Porter’s (1998) are described as follows: 1) The overall cost leaders’ strategy, refers to the achievement of SMEs overall cost leaders in its industry by setting a relatively high market control, access to raw materials, or other cost leaders; 2) The differentiation strategy refers to the production of new goods and services by the company, which are considered unique products in its industry. This strategy depends on differentiation designed to attract customers who are responsive to the attributes of better products; 3) The focus strategy, is a hybrid strategy, based on low cost and differentiation, focusing on the efforts to serve the needs of a certain segment of the market.
Based on these descriptions, the following hypothesis put forward as bellow. Hypotheses 1: resources strategies have a significant effect on competitive strategy; Hypotheses 2: resources strategies have a significant business performance; Hypotheses 3: competitive strategy has a significant effect on business performance.

RJOAS, 1(97), January 2020
177
METHODS OF RESEARCH
The population in this research is all SMEs in the wood-carving industry in Bali,
Indonesia. The total number of SME reported by the Industry and Trade Office of Gianyar Regency in 2015 is 238 units; comprised of 182 units of small business and 56 units of the medium enterprise. The sample of this study is determined using the Slovin formula, resulted in 149 SMEs sample. The stratified random sampling is used to select the sample because the population is heterogeneous. Since the number of units in each stratum is different, the disproportionate stratified random sampling. The following is the calculation to determine the sample taken from the population.
Table 1 – Distribution of samples
No Sub-District
Type of Business
Small Business Medium Enterprise
Population Sample Population Sample
1 Sukawati 53 33 9 6
2 Tegallalang 32 20 4 3
3 Gianyar 12 8 10 6
4 Ubud 70 43 27 17
5 Blah Batuh 4 3 3 2
6 Tampak Siring 8 5 2 1
7 Payangan 3 2 1 1
Total 182 114 56 35
Source: Industry and Trade Office of Gianyar Regency.
Based on the information in the table, it can be concluded that 149 units of the sample
are targeted in this research, consisting of 114 units of Small Business (SB) and 35 units of Medium Enterprise (ME). The respondents for this study are the managers of SMEs, chosen for their capacity and capability concerning the knowledge of the existing and operating business activities which will answer the items in the research instruments. The investigation implements descriptive statistical analysis to describe and obtain an overview concerning the studied object as it is without performing general analysis and drawing general conclusion (Kumar, 2011). The descriptive analysis aims to discover the characteristics of and the respondents’ responses to the questionnaire items.
Meanwhile, to test the empirical model and the hypothesis in this research. Moreover, inferential analysis is utilized, using structural equation modelling (SEM) by estimating the covariant matrix-based maximum likelihood (MLE) (Hair et al., 2014). The inferential analysis is implemented through the AMOS program.
The Characteristics of SMEs’ Respondent. The description of respondents shows that
the managers of SMEs are mostly of the age characteristics between 35-39 years old (33.6 percent); followed by those in the age range of 40-42 years old (24.2 percent), 45-50 years old (16.8 percent), under 30 years old (10.7 percent), and 30-34 years old (9.4 percent). The eldest respondent is beyond 50 years old, with a distribution of 5.4 percent. This information on respondents’ distribution based on age indicates that the managers of SMEs are dominant of productive and adult age (35-44 years old). The respondents’ characteristics based on a sex show that the owners and managers of SMEs are mostly male, 64.4 percent. The distribution of female managers and owners of SMEs is 35.6 percent. This indicates that women begin to show their participation and interest in the field of entrepreneurship. Their role in the future will be more prominent as entrepreneurs in SMEs.
The education level of SMEs managers reflects their ability and skills in performing business activities. Most SMEs managers hold a Senior High School diploma, 38.3 percent, followed by a bachelor's degree (34.9 percent), college diploma (25.5 percent), and post-graduate degree (1.3 percent). This information indicates that the education and training program for SMEs managers needs to be improved to develop their skills and knowledge in managing their business. Similarly, the kinds of enterprises selected for SMEs operation indicate the responsibilities and the amount of capital involved in its operation. SMEs with the

RJOAS, 1(97), January 2020
178
legal body of the enterprise are considered as a formal and legal business and can export products. The SMEs are mostly Commanditaire Vennootschap - CV (59.1 percent), followed by Limited Company (PT) (30.9 percent), Trading Business (UD) (6.7 percent), and Firms - Fa (3.4 percent).
The respondents’ characteristics based on the length of operational time reveal that 67 units or 45 percent of SMEs have operated for 5 – 10 years; 46 units have operated for 11 – 15 years; 23 units have operated for 16 – 20 years; and 13 units of SMEs have operated for more than 20 years. This condition reflects that most of the SMEs businesses have matured, in the sense that during the length of operation, the managers have fully understood the internal capabilities their businesses possess, which leads them to be more adaptive toward the changes in a business environment. Concerning the ownership of the businesses, the respondents indicate that most of the SMEs are individually-owned (89.3 percent distribution). The rest are owned through cooperation with investors or fully-owned by foreign investors. 2.7 percent of SMEs cooperate with local investors and 6 percent of all SMEs cooperate with foreign investors. Only 2 percent of the total SMEs are fully-owned by foreign investors.
Based on its system of production, most SMEs produce commodities ordered by the customers and exporting agents (84.6 percent distribution); while 8.7 percent produce commodities in a combination of customers’ orders and mass production. Only ten units of SMEs do not produce commodities based on orders; their production bears the company’s unique characteristics. This is possible because the 10 SMEs are mature and settled, have a unique product and strong market control.
The control upon raw materials is a crucial component for a company to ensure the continuity of its production. The characteristic of raw-material control indicates that 75.8 percent of respondents procure their raw materials from a supplier, while 22.1 percent obtains their raw materials from a combination of sources. Only 2 percent of SMEs can provide their raw materials. This information shows that most SMEs still depend on supplier to get their raw materials, which means that the suppliers have strong bargaining power. Meanwhile, the business characteristics of production method show that most SMEs combine the use of the machine and manual work in their production (61.1 percent); 37.6 percent of SMEs perform manual production, while 1.3 percent solely use the machine in their production activities. Based on the marketed commodities, most of the products are produced by SMEs (73.8 percent), while the other 26.2 percent cooperate with partners to produce their goods. This means that the partnership among the enterprises is still low. The partnership should be developed and improved because it can lead to added value for the company, such as timeliness and efficiency of production.
RESULTS AND DISCUSSION
This study specifically identifies and analyses the existence of 149 SMEs of wood-
carving artisans in 2015. The SMEs consist of 114 small business artisans and 35 medium enterprise artisans.
The strategic resources in this study are reflected through six indicators, including the availability of physical resources, the achievement of reputation resources, the management of organizational resources, the management of financial resources, the management of human resources, and the mastery of technological resources. The respondents’ descriptions of the strategic resources show that the wood-crafting SMEs quite strongly master or control its strategic resources. Such good control of strategic resources is reflected in the total average score of 3.96. Other information indicates that the highest response is on the indicator of reputation resources achievement, with a total average of 4.06. This means that the reputation achieved by SMEs is the best source of competitive advantage, compared with other resources. Meanwhile, the lowest response is on the organizational resources management indicator, with an average score of 3.87.
On the indicator of achievement of reputation resources, the items of product quality and customer service have the highest response with an average score of 4.10. This finding

RJOAS, 1(97), January 2020
179
means that the achievement of wood-carving SMEs in reputation resources tends to focus on customer satisfaction, in terms of both product quality and services provided. Also, the work condition and product uniqueness are achieved well, since their average scores are above four points.
The ability to operate businesses obtain the highest response in the organizational resources management, with an average score of 3.92, compared with the ability of reporting and planning that have an average response of 3.88 and 3.80, respectively. This finding indicates that the SMEs capability in organizational management puts more emphasis on its ability to operate the business. In the management of financial resources, the financial report and profit item gets the highest response of 4.07 averages, while the source of fund item has the lowest response of 3.93 averages. This means that the SMEs ability to manage its financial resources focuses on the skills of composing financial reports, while the ability to gather funds from financial institutions or other parties is relatively low.
Concerning the management of human resources, the respondents give the highest response to skilled employees, with an average score of 4.01. This finding shows that SMEs ' ability to manage their human resources focuses more on the procurement of employees that suit the business needs. On the other hand, the SMEs efforts to develop employees are still low, with an average score of 3.97. The development of technology items has the highest response in technology development, with an average score of 4.01, while the mastery and utilization of technology receive average scores of 3.93 and 3.87, respectively. This finding indicates that the mastery of technological resources of SMEs tends to be aimed at technological development to support its production processes.
Competitive strategy is defined as the efforts of wood-carving SMEs to relatively have an operational advantage over their competitors. In this study, competitive strategy is measured using Porter’s generic strategies; consisted of cost leadership, differentiation, and focus strategies. The analysis attempts to identify the tendency of SMEs in implementing the strategies to face competition to achieve their business goals. The result of the analysis shows that competitive strategy has been implemented sufficiently well by the SMEs, as proven by the total average of 4.02. Concerning this variable, it can be reported that the SMEs tend to implement the focus strategy in competing (average score of 4.08), followed by the differentiation strategy (average score of 4.03). The SMEs implements the cost leadership strategy only infrequently (average score of 3.96).
Related to the implementation of the cost leadership strategy, the respondents tend to respond to the distribution cost item, with an average score of 4.05; meanwhile, the items of production process cost, the product price, and the raw material price only have average scores of 3,98, 3.94, and 3.85, respectively. This finding indicates that the cost leadership strategy implemented by the SMEs relatively focuses more on the efficiency of distribution cost. This is because the costs spent on export is relatively high, including the administration, permit, and shipping costs.
In the implementation of a differentiation strategy, the item of the value-added product gets the highest response with an average score of 4.03. This finding indicates that the differentiation strategy implemented by the SMEs tends to provide products with added value to the customers. Also, they provide special services to the customers and producing a varied and high-quality product. It means that there are innovations in the implementation of differentiation strategy; besides highlighting the uniqueness of artistic products, SMEs also emphasize the multi-functional products (with other uses besides their artistic function).
In the focus strategy implementation, providing services for certain segment gets the highest response with an average score of 4.08. It can be interpreted that the implementation of focus strategy in SMEs, to get a better advantage over the competitors, tends to emphasize the provision of the best services for a certain segment. Also, the SMEs attempt to produce a suitable product with a suitable price for the target segment, and to find and select a market with a low level of competition.
Work performance is a perception of SME managers concerning the result of business they have achieved in the last three years in terms of profitability, productivity, and market achievements. The respondents’ description shows that the work performance achieved by
RJOAS, 1(97), January 2020
180
the SMEs is sufficiently good, with a total average of 3.87. Other information also shows that the indicator of productivity achievement has the highest response of 3.94, followed by profitability and market achievements with the average scores of 3.87 and 3.81, respectively. The finding indicates that the results achieved by the SMEs in the last three years are mostly related to the efforts to satisfy the needs and expectations of customers and to improve the productivity of employees.
Among the five items used as the indicators of productivity achievement, the item of employees’ productivity receives the highest response with an average score of 4.03. This finding indicates that the improvement of employees’ productivity results from the SMEs’ efforts to satisfy the increasing and more varied demand for commodities from the customers. Meanwhile, the target of production gets the lowest response, with an average score of 3.86. It means that the products produced by the SMEs are mostly below the standard expected by the customers (in terms of raw materials, colors, and product design), which means that the achievement of the production target of SMEs is low.
The responses on profitability achievement show that the development of capital has the highest response with the average score of 3.89; compared with the profit and asset development indicators, with 3.86 and 3.85 average scores, respectively. This finding indicates that the profit gained by the SMEs is relatively low, but accumulatively it is expected to increase the business capital. Concerning the achievement of the market, the respondents perceive more on the development of sales volume, with an average score of 3.92, while the achievement of market segment and market position only achieve average scores of 3.80 and 3.71, respectively. This finding means that the SMEs development of market segment and acquisition of market position are relatively low, focusing on the satisfaction of customers’ demand or order.
To obtain the best estimation in the structural equation model (SEM), the evaluation of underlying assumptions needs to be done. Such evaluation is performed to statistically measure whether the observation data have satisfied the assumptions in the structural equation model. There are three assumptions that need to be satisfied to use the SEM: normality and multi-co linearity are described as follow:
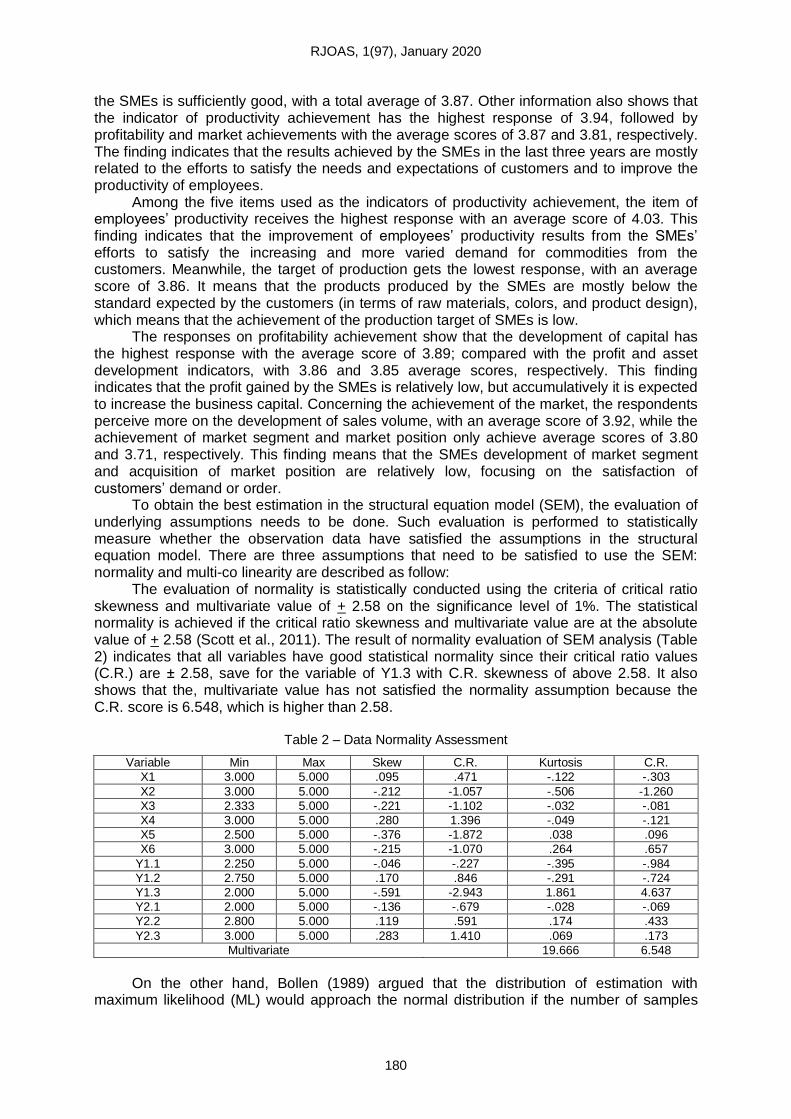
The evaluation of normality is statistically conducted using the criteria of critical ratio skewness and multivariate value of + 2.58 on the significance level of 1%. The statistical normality is achieved if the critical ratio skewness and multivariate value are at the absolute value of + 2.58 (Scott et al., 2011). The result of normality evaluation of SEM analysis (Table 2) indicates that all variables have good statistical normality since their critical ratio values (C.R.) are ± 2.58, save for the variable of Y1.3 with C.R. skewness of above 2.58. It also shows that the, multivariate value has not satisfied the normality assumption because the C.R. score is 6.548, which is higher than 2.58.
Table 2 – Data Normality Assessment
Variable Min Max Skew C.R. Kurtosis C.R.
X1 3.000 5.000 .095 .471 -.122 -.303
X2 3.000 5.000 -.212 -1.057 -.506 -1.260
X3 2.333 5.000 -.221 -1.102 -.032 -.081
X4 3.000 5.000 .280 1.396 -.049 -.121
X5 2.500 5.000 -.376 -1.872 .038 .096
X6 3.000 5.000 -.215 -1.070 .264 .657
Y1.1 2.250 5.000 -.046 -.227 -.395 -.984
Y1.2 2.750 5.000 .170 .846 -.291 -.724
Y1.3 2.000 5.000 -.591 -2.943 1.861 4.637
Y2.1 2.000 5.000 -.136 -.679 -.028 -.069
Y2.2 2.800 5.000 .119 .591 .174 .433
Y2.3 3.000 5.000 .283 1.410 .069 .173
Multivariate 19.666 6.548
On the other hand, Bollen (1989) argued that the distribution of estimation with
maximum likelihood (ML) would approach the normal distribution if the number of samples

RJOAS, 1(97), January 2020
181
increases or exceeds the estimated parameter in the model. Also, the sample of at least five times of the analysed variables in the model, or equal to 100-200 cases, can satisfy the normal distribution requirement (Astrachan, et. al, 2014). Referring to Scott et al. (2011), the number of sample of 153 is considered adequate and sufficient to satisfy the normality assumption for the 12 indicators estimated in the research model.
The problem of multi-co linearity can be detected through the correlation of each variable investigated. High correlation (above 0.90) among the variables suggests the existence of a multi-co linearity problem (Scott et al., 2011). Based on the output analysis of SEM, there is no multi-co linearity problem identified, both in the correlation matrix of an observable variable (sample correlations) and in the correlation of exogenous and endogenous variables. Therefore, the data statistically satisfy the assumption of multi-co linearity and can be used for further analysis.
The statistical assessment of the proposed hypothetical model uses structural equation model (SEM) analysis through version 16 of AMOS software. However, before the evaluation can be performed, an assessment of the structural model fit will be conducted from the causality relationship of the variables of the study. The assessment model used has been proven to have good uni-dimensionality and reliability. The assessment of structural model fit aims to evaluate the suitability of the observational or real input (co-variance matrix) with the prediction of the proposed model. The evaluation is based on Hair et al, (2010), who emphasize the implementation of more than one fit statistics to assess the overall structural model fit. In addition, Hair et al, (2010) state that there is no requirement that all indexes of goodness of fit have to fit in all situations; they are only general guidance for different situations. The overall model fit assessment in this study is congruent with the assessment recommended by Hair et al, (2010); consisting of the absolute fit assessment using Chi-Square, Root Mean Square Error of Approximation (RMSEA), and Goodness of Fit Index (GFI), as well as the incremental fit assessment using Adjusted Goodness of Fit Index (AGFI), Comparative Fit Index (CFI), and Tucker-Lewis Index (TLI).
Table 3 – Evaluation of the Structural Model’s Goodness of Fit
Goodness of Fit Indices Cut-off Value Result from Model Remarks
Chi-square Small 146.744 -
Probability (p) > 0.05 0.004 Marginal
RMSEA < 0.08 0.083 Marginal
GFI > 0.90 0.859 Marginal
AGFI > 0.90 0.904 Marginal
CFI ≥ 0.90 0.907 Good
TLI ≥ 0.90 0.880 Marginal
Figure 1 – Path Analysis of SEM
The result of structural model fit assessment in this study, based on the criteria of
goodness of fit indices (Table 3) shows that only CFI Index can exceed the required cut-off value, while the other indices are still below the requirement. However, Nitzl (2016), states that a model is considered good if one or two criteria of goodness of fit have been satisfied. Therefore, the structural model of this study can be considered suitable for SEM analysis and
Strategies
Resources
(X0
Business
performance
(Y2)
0,279 (sig) 0,830 (sig)
0,141 (sig)
Competitive
strategy
(Y1)

RJOAS, 1(97), January 2020
182
can be used to predict the causality of the variables. The results SEM analysis using AMOS is explained as in figure 1 and table 4.
Table 4 – Path Analysis of SEM Result (Standardized)
Correlations of Variables Direct Effect Indirect
Effect Total Effect
Coefficient p- values
Strategies Resources (X) → Competitive Strategy (Y1) 0.279 0.003 - 0.279
Competitive Strategy (Y1) → Business Performance (Y2) 0.830 0.000 - 0.830
Strategies Resources (X)→ Business Performance (Y2)* 0.141 0.023 0.232 0.373 *Indirect effect of Strategies Resources (X) on Business Performance (Y2) through the mediation of Competitive Strategy (Y1)
The analysis of each path in the research model is based on the path coefficient
(standardized) and significance (p) of the correlation between variables in the model. The analysis of each path in the model is presented in Table 4 and Figure 1, as it can be seen that the strategic resources (X) have a positive and significant influence on competitive strategy (Y1). The analysis shows a path coefficient (standardized regression weight) with a positive value of 0.279 and probability (p) of 0.003 (p < 0.05), which means that the stronger the strategic resources are, the more suitable the competitive strategy (Meutia, 2013).
The competitive strategy (Y1) has a positive and significant correlation with business performance (Y2). The analysis reveals a path coefficient with a positive value of 0.830 and probability (p) of 0.000 (p < 0.05). This indicates that the more developed the implementation of competitive strategy is, the more business performance improves (Kumar et al., 2001; Ruizhi & Chaoyang, 2008; Jusoh & Parnell, 2008; Santos-Vijande et al., 2012). The strategic resources (X) have a positive and significant direct correlation with business performance (Y2). The path coefficient of the analysis is the positive value of 0.141, with probability (p) of 0.023 (p < 0.05), which means that the strategic resources improve business performance further — examining the influence of mediating resource strategy towards business performance through competitive advantages using a formula of Variance Accounted For (VAF) (Schubring, 2016). The calculated results on the role of mediation were 0.2932 (29,32%), meaning that the role of mediating competitive strategy was partial mediation. This implies that both direct resource strategic and indirect ones are in a position to improve business performance through competitive advantages (Kraja & Osmani, 2013).
Also, it is explained that the strategic resources (X) have a positive indirect correlation with business performance (Y2) through the competitive strategy (Y1), with a path coefficient of 0.232. This finding indicates that the more effective strategic resources are as the basis of competitive strategy, the more it improves business performance (Ma, 2000; Pertusa-Ortega et al., 2010). Further analysis in Table 4 shows that the path coefficient of the indirect effect of strategic resources on business performance through competitive strategy (0.232) is higher than the path coefficient of its direct correlation (0.141), with a total effect of 0.373. This signifies that the strategic resources used as the basis of competitive strategy have a greater effect on business performance than its direct effect.
CONCLUSION
The strategic resources have a positive and significant effect on the competitive
strategy. The stronger strategic resources will improve the suitability of competitive strategy. The more the implementation of competitive strategy improves, the better the business performance will be. The strategic resources have a positive and significant direct correlation with business performance. Also, it is found that strategic resources have a positive indirect influence on business performance through a competitive strategy. It indicates that the more effective strategic resources are as the basis of competitive strategy, the more it improves business performance. Further analysis shows that the path coefficient of the indirect effect of strategic resources on business performance through competitive strategy (0.232) is higher than the path coefficient of its direct correlation (0.141), with a total effect of 0.373. This signifies that the strategic resources used as the basis of competitive strategy have a

RJOAS, 1(97), January 2020
183
greater effect on business performance than its direct effect. There are several implications of this research, as outlined below. The organizational
resources play the most important role for SMEs to strengthen the control over strategic resources. Therefore, the organizational resources in the forms of abilities to operate the business effectively, formulate work reports, and design a business plan, need to be addressed by the managers to improve the implementation of cost leadership strategy, which will increase the profitability. To have the most suitable competitive strategy, the SMEs need to align their strategies with the combination of strategic resources and the dynamics of the business environment. Environmental uncertainty is a more crucial problem for SMEs than the intensity of competition. Therefore, the uncertainties in the form of newcomers, threats of competitors’ replacing products, high level of competition, suppliers’ bargaining power to determine the cost of raw material, and the customers’ power to determine the sales price, need to be seriously and carefully analyzed. Moreover, Building partnerships and cooperation with other similar companies is an important strategy for SMEs. A strong partnership will improve SMEs competitive advantage to satisfy customers’ demands and to produce cost efficiency, which will lead to an increase in profitability.
REFERENCES
1. Ainuddin, A, R., Beamish, P. W., Hulland, J. S. & Rouse, Michael J., 2007, Resource
Attributes and Firm Performance in International Joint Ventures, Journal of World Business, Elsevier, 42, pp.47-60.
2. Astrachan, C. B., Patel, V. K., & Wanzenried, G. (2014). A comparative study of CB-SEM and PLS-SEM for theory development in family firm research. Journal of Family Business Strategy, 5(1), 116-128.
3. Barney, J.B., 1991, Firm Resources and Sustained Competitive Advantage, Journal of Management, 17 (1): 99-120.
4. Barney, J.B., 1995, Looking Inside for competitive Advantage, Academy of management Executive, 9, 49–61.
5. Chong, H. Gin, 2008, Measuring Performance of Small and Medium Sized Enterprises: The Grounded Theory Approach, Journal of Business and Public Affairs, ISSN 1934-7219, Vol. 2, Issue : 1.
6. Cosenza, F., and Notob, G. 2018. Fostering entrepreneurial learning processes through Dynamic Start-up business model simulators, The International Journal of Management Education, 16, pp. 468–482.
7. Dess, G. G. & Beard, D. W., 1984, Dimensions of Organizational Task Environments, Administrative Science Quarterly, 29, pp. 57 – 23.
8. Edelman, L. F., Brush, C. G., & Manolova, T. (2002). The mediating role of strategy on small firm performance. Journal of Business venturing, 4(3), 27-35.
9. Effendi, M. I., & Arifin, M. M. (2010). The relationships between environment, strategy, organizational structure, and business performance. Global Journal of Management and Business Research, 10(5).
10. Esfandiar, K., , M., S., , T., S., Altinay, P., L. 2019, Understanding entrepreneurial intentions: A developed integrated structural model approach, Journal of Business Research, 94, pp. 172–182.
11. Fahy, J. (2000). The resource-based view of the firm: some stumbling-blocks on the road to understanding sustainable competitive advantage. Journal of European industrial training, 24(2/3/4), 94-104.
12. Ferreira, J., & Azevedo, S. (2007). Entrepreneurial orientation as a main resource and capability on small firm’s growth.
13. Fernandes, J. P., 2019, Developing viable, adjustable strategies for planning and management—A methodological approach, Land Use Policy, 82, pp. 563–572.
14. Gibcus, P. and Kemp, R., G., M. 2003. Strategy and small firm performance. Research Report H200208. This report is part of the research programme SMEs and Entrepreneurship, which is financed by the Netherlands Ministry of Economic Affairs

RJOAS, 1(97), January 2020
184
15. Grant, R., M. 2010, Contemporary Strategy Analysis, 7th Edition, John Wiley & Sons, Ltd 16. Hair, J.F., Anderson, R.E., Tatham, R.L. dan Black W.C. (2010). Multivariate Data
Analysis (forth ed.). New Jersey : Prentice-Hall. 17. Hair, J. F ., Sarstedt, M., Hopkins, L., Kupelwieser, P., G. 2014, Partial least squares
structural equation modeling (PLS-SEM) An emerging tool in business research, European Business Review, Vol. 26, No. 2, pp. 106-121.
18. Hashim, M. K., Wafa S. A. & Sulaiman. 2001, Testing Environment as Mediator Between Bussiness Strategy - Performance Relationship : A Study of Malaysian SMEs, 46th ICSB World Conference, Jan 17-20 2001, Taipei, Taiwan.
19. Jusoh, R., & Parnell, J. A. (2008). Competitive strategy and performance measurement in the Malaysian context: An exploratory study. Management decision, 46(1), 5-31.
20. Kraja, Y., & Osmani, E. (2013). Competitive advantage and its impact in small and medium enterprises (SMEs)(Case of Albania). European Scientific Journal, 9(16).
21. Kumar, K., Subramanian, R., & Strandholm, K. (2001). Competitive strategy, environmental scanning and performance: a context specific analysis of their relationship. International Journal of commerce and Management, 11(1), 1-33.
22. Kumar, Ranjit. 2011. Research Methodology, a step-by-step guide for beginners. SAGA Publication Ltd.
23. Miles, M. P., & Darroch, J. (2006). Large firms, entrepreneurial marketing processes, and the cycle of competitive advantage. European journal of marketing, 40(5/6), 485-501.
24. McWilliams, A., & Siegel, D. S. (2011). Creating and capturing value: Strategic corporate social responsibility, resource-based theory, and sustainable competitive advantage. Journal of Management, 37(5), 1480-1495.
25. Ma, H. (2000). Competitive advantage and firm performance. Competitiveness Review: An International Business Journal, 10(2), 15-32.
26. Meutia. 2013. Improving Competitive Advantage and Business Performance through the Development of Business Network, Adaptability of Business Environment and Innovation Creativity: An Empirical Study of Batik Small and Medium Enterprises (SME) in Pekalongan, Central Java, Indonesia. Aceh International Journal of Social Sciences, 2 (1): pp. 11 - 20
27. Miles, R. E., & Snow, C. 2003, Organizational Strategy, Structure and Process, Stanford University Press, California.
28. Nitzl, C., 2016, The use of partial least squares structural equation modelling (PLS-SEM) in management accounting research: Directions for future theory development, Journal of Accounting Literature, 37, pp. 19–35.
29. Ollavarrieta, S & Ellinger, A. 1997, Resource-Based Theory and Strategic Logistic Research, International of Physical Distribution and Logistic Management, Vol. 27, No. 9/10, 559-587.
30. Özdemirci, A., 2011, Corporate Entrepreneurship and Strategy Process: A Performance Based Research on Istanbul Market, Procedia Social and Behavioral Sciences, 24, pp. 611–626.
31. Porter, M., E. 1998, Competitive Advantage: Creating and Sustaining Superior Performance, The Free Press, New York
32. Peteraf, M.A., 1993, The Cornerstone of Competitive Advantage: A Resource-Based View, Strategic Management Journal, 14(3): 179-192.
33. Pertusa-Ortega, E. M., Molina-Azorín, J. F., & Claver-Cortés, E. (2010). Competitive strategy, structure and firm performance: A comparison of the resource-based view and the contingency approach. Management Decision, 48(8), 1282-1303.
34. Parnell, J. A. (2011). Strategic capabilities, competitive strategy, and performance among retailers in Argentina, Peru and the United States. Management decision, 49(1), 139-155.
35. Parnell, J. A., O'Regan, N., & Ghobadian, A. (2006). Measuring performance in competitive strategy research. International Journal of Management and Decision Making, 7(4), 408-417.
36. Qi, Y., Zhao, X., & Sheu, C. (2011). The impact of competitive strategy and supply chain strategy on business performance: the role of environmental uncertainty. Decision

RJOAS, 1(97), January 2020
185
Sciences, 42(2), 371-389. 37. Rosli, M. M. (2012). Competitive strategy of Malaysian small and medium enterprises: An
exploratory investigation. American International Journal of Contemporary Research, 2(1), 93-105.
38. Ruizhi, L., & Chaoyang, X. (2008). Competitive strategy, firm performance, and sustainable competitive advantage: Empirical evidence from Chinese listed companies [J]. Science Research Management, 6.
39. Santos-Vijande, M. L., López-Sánchez, J. Á., & Trespalacios, J. A. (2012). How organizational learning affects a firm's flexibility, competitive strategy, and performance. Journal of Business Research, 65(8), 1079-1089.
40. Scott, B. M., Podsakof, M., P., Podsakoff., N., M. 2011, Construct Measurement And Validation Procedures In Mis And Behavioral Research: Integrating New And Existing Techniques, MIS Quarterly, Vol. 35, No. 2. Pp, 293 - 334
41. Schubring, S., 2016, The PLS agent: Predictive modeling with PLS-SEM and agent-based simulation, Journal of Business Research, 69, pp. 4604–4612.
42. Suardhika, I. N., 2012, Model Inntegrasi Dalam Resource Based View Untuk Penerapan Strategi Bersaing Dan Pencapaian Kinerja Usaha,Jurnal Ekonomi dan Keuangan, Vol. 16, No. 1, pp. 63-83.
43. Suliyanto and Rahab, 2012, The Role of Market Orientation and Learning Orientation in Improving Innovativeness and Performance of Small and Medium Enterprises, Asian Social Science, Vol. 8, No. 1, pp. 134-145.
44. Talaja, A., 2012, Testing Vrin Framework: Resource Value And Rareness As Sources Of Competitive Advantage And Above Average Performance, Management, Vol. 17, 2, pp. 51-64.
45. Trung, T. Q. 2008. Performance of export-oriented small and medium-sized manufacturing enterprises in Viet Nam, Asia-Pacific Research and Training Network on Trade Working Paper Series, Vol. no. 54, pp 83 - 151
46. Uchegbulam, P., & Akinyele, S. T. (2015). Competitive strategy and performance of selected SMEs in Nigeria.
47. Wang, WC., Lin, CH, Chu, YC. 2011. Type of Competitive Advantage And Analysis. International Journal of Business And Management. Vol.6, No.5: May 2011.
48. Wang, H., 2014, Theories for competitive advantage, Being Practical with Theory: A Window into Business Research, pp. 33-43.
49. Wernerfelt, B., 1984, A Resource-Based View of the Firm, Strategic Management Journal, 5: pp.171-180.
50. Wheelen, Thomas L., & Hunger, J. David. 2012. Strategic management and business policy: Concepts.13th ed. Pearson/Prentice Hall.
51. Williams, S.D., 2014, A Strategic Resource-Based View of Higher Education Institutions’ Resources, International Journal of Business and Social Science, Vol. 5, No. 12, pp. 8-23
52. Zimmerer, T. W., & Scarborough, N. M. 2008, Essential of Entrepreneurship and Small Business Management, Prentice Hall International Inc., New Jersey.