Embed Size (px)
Citation preview
Journal of Islamic Economics Perspectives, Volume 1. Issue 1 (2019)
State Islamic Institut of Jember
1
The Influence of Work Culture, Creativity and Innovation toward
Competitive Advantage on Small Batik Industry in Pamekasan
Farid Firmansyah
IAIN Madura
Abstract Small batik industry in Pamekasan spread across several districts, with the biggest distribution
was spread in Proppo District and the smallest was in Waru district. The Numbers of batik
Craftsmen declined in some districts, the largest declining happened in Galis district. The
phenomenon of competition on small batik industry in Pamekasan attracted researcher using
variables of Work Culture, Creativity, Innovation and Competitive Advantage. The sample of
this study was seventy-five SMEs. The conclusions of this research were: 1. Partially, three
independent variables used in this study influenced. 2. Creativity has a positive and significant
impact. 3. The effect of product innovation on competitive advantage can be feasible models.
Keywords: Competitive Advantage, SME, Batik
INTRODUCTION
Around a decade ago, the ASEAN leaders agreed to establish an integrated market. The
market which was formed after the cooperation among ASEAN countries. Markets are
expected to compete in the global market and able to enhance intra-ASEAN trade. In
2015, the implementation of the cooperation among ASEAN countries was realized,
which is booming with the terms of MEA or AEC (Masyarakat Ekonomi ASEAN/ ASEAN
Economic Community).
AEC enforcement in 2015 made a traffic-free trade in Southeast Asia easier without
many obstacles. AEC is a form of agreement from the ASEAN countries to establish a
free trade area to improve economic competitiveness by making the ASEAN region as a
world production base and create a regional market for approximately 500 million of
ASEAN citizens.1 Free trade means natural course without tariffs (Import duty of 0-
5%) as well as non-tariff barriers for ASEAN member countries.
The realization of AEC (ASEAN Economic Community) created a lot of potential
market opportunities, either for the labor market and companies. Wide-Open market
opportunities will make the enterprise markets in Indonesia are growing rapidly.
Indonesian workers will also be more flexible in selecting their dream jobs that match
their qualifications. However, the wide-open opportunities also result the great
challenge for markets, companies, and Indonesian labors. Market opportunities,
1 Humphrey Wangke, “Peluang Indonesia dalam Masyarakat Ekonomi Asean 2015,” Info Singkat
Hubungan Internasional VI, no. 10/II/P3DI/Mei/20124 (2014): 4.
Farid Firmansyah
2
companies, and labors are related to how the company can be innovative and creative to
meet consumers’ desires and needs. The ability to maintain self-employment and work
culture as the emergence of new companies. The ability to see these opportunities will
make the company arrange a strategy to maintain the product’ position in the market
and able to increase the competitive advantage.
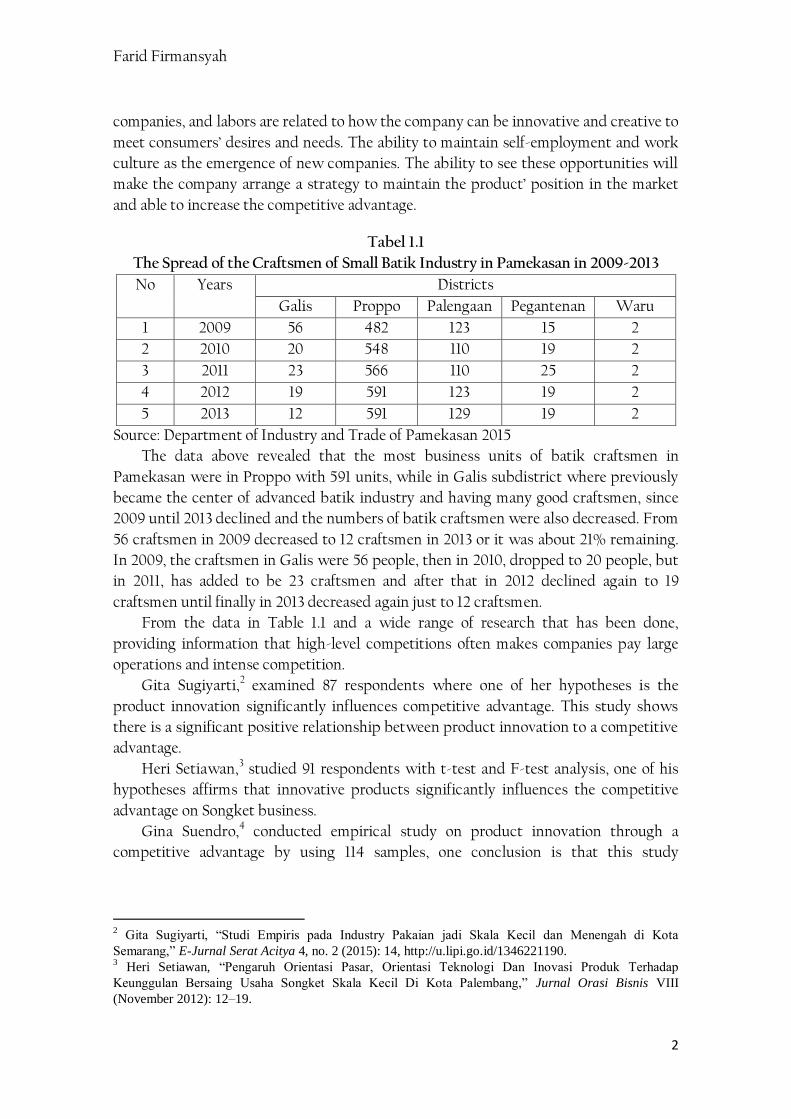
Tabel 1.1
The Spread of the Craftsmen of Small Batik Industry in Pamekasan in 2009-2013
No Years Districts
Galis Proppo Palengaan Pegantenan Waru
1 2009 56 482 123 15 2
2 2010 20 548 110 19 2
3 2011 23 566 110 25 2
4 2012 19 591 123 19 2
5 2013 12 591 129 19 2
Source: Department of Industry and Trade of Pamekasan 2015
The data above revealed that the most business units of batik craftsmen in
Pamekasan were in Proppo with 591 units, while in Galis subdistrict where previously
became the center of advanced batik industry and having many good craftsmen, since
2009 until 2013 declined and the numbers of batik craftsmen were also decreased. From
56 craftsmen in 2009 decreased to 12 craftsmen in 2013 or it was about 21% remaining.
In 2009, the craftsmen in Galis were 56 people, then in 2010, dropped to 20 people, but
in 2011, has added to be 23 craftsmen and after that in 2012 declined again to 19
craftsmen until finally in 2013 decreased again just to 12 craftsmen.
From the data in Table 1.1 and a wide range of research that has been done,
providing information that high-level competitions often makes companies pay large
operations and intense competition.
Gita Sugiyarti,2 examined 87 respondents where one of her hypotheses is the
product innovation significantly influences competitive advantage. This study shows
there is a significant positive relationship between product innovation to a competitive
advantage.
Heri Setiawan,3 studied 91 respondents with t-test and F-test analysis, one of his
hypotheses affirms that innovative products significantly influences the competitive
advantage on Songket business.
Gina Suendro,4 conducted empirical study on product innovation through a
competitive advantage by using 114 samples, one conclusion is that this study
2 Gita Sugiyarti, “Studi Empiris pada Industry Pakaian jadi Skala Kecil dan Menengah di Kota
Semarang,” E-Jurnal Serat Acitya 4, no. 2 (2015): 14, http://u.lipi.go.id/1346221190. 3 Heri Setiawan, “Pengaruh Orientasi Pasar, Orientasi Teknologi Dan Inovasi Produk Terhadap
Keunggulan Bersaing Usaha Songket Skala Kecil Di Kota Palembang,” Jurnal Orasi Bisnis VIII
(November 2012): 12–19.
The Influence of Work Culture, Creativity and Innovation toward Competitive Advantage on
Small Batik Industry in Pamekasan
3
attempted to address the factors that can improve product innovation performance to
produce optimal marketing, so that it will achieve sustainable competitive advantage
when it is seen from the aspects of customer orientation, competitor orientation and
across functions coordination.
Heri Susanto and Nuraini Aisiyah conducted empirical studies about work culture
and its influence on the work performance, the conclusion was work culture has no
significant influence on the employee performance in Kebumen District Land Office.
Ernani Hadiyati (2011)5 conducted empirical studies on Creativity and Innovation
and their influence to Small Business Enterprise, with a population of 53 respondents,
one of the conclusions is significant F value is smaller than α. creativity and innovation
variables simultaneously influenced significantly to the enterprise.
This research is expected to develop a model to present phenomena in the existing
management practices into a relatively simplified analysis system.
RESEARCH METHOD
Approach and Kind of Research
This study used a quantitative approach in which the primary data obtained by the
survey. Kind of research method used is survey method aimed for descriptive purposes,
explanatory and exploration, the survey also called non-experimental design.6 The
research was conducted on small batik industries in Pamekasan.
Research Variables and Operational Definitions
a. Research Variables
Variable is an attribute or trait or aspect of a person or object that has certain
variations determined by the researcher to be concluded.7 The importance of the
variable identification is to direct and to restrict research on the issues that are going to
be studied. The variables in this study were work culture, creativity, product
innovation, competitive advantage.
b. Operational Definition
Here are operational definitions of each variable to be analyzed.
Work culture is commendable attitudes and behaviors done repetitively and become
habitual actions in one organization in a workplace. Work culture variable (X1) in this
research refers to the work culture elements proposed by Suparyadi, measured by
indicators: love to work, sense of responsibility, reluctant, discipline, hard work,
creative, cooperative, independent, and like to help colleagues.
4 Ginanjar Suendro, “Analisis Pengaruh Inovasi Produk Melalui Kinerja Pemasaran Untuk Mencapai
Keunggulan Bersaing Berkelanjutan (Studi Kasus Pada Industri Kecil Dan Menengah Batik Pekalongan)”
(Tesis, Universitas Diponegoro, 2010). 5 Ernani Hadiyati, “Kreativitas dan Inovasi Berpengaruh Terhadap Kewirausahaan Usaha Kecil,” Jurnal
Manajemen dan Kewirausahaan 13, no. 1 (September 30, 2011): 8–16,
https://doi.org/10.9744/jmk.13.1.8-16. 6 Ulber Silalahi, Metode Penelitian Sosial Kuantitatif (Bandung: PT. Refika Aditama, 2015), 129.
7 Sugiyono, Metode Penelitian Administrasi (Bandung: Alfabeta, 1998), 20–21.
Farid Firmansyah
4
Creativity is a process of organizing knowledge in raising or resulting useful things
that can be developed and improved. The creativity variable in this study refers to the
creativity proposed by Rusdiana, it is measured by indicators: improving work
efficiency, improving the initiative, improving appearance, improving product quality,
improving profits.
Product Innovation is defined as a combination of the various processes that
influence each other. This variable is measured by indicators: product expansion,
product imitation, new products.
Competitive Advantage is the advantages exist when a company has and produce a
product and or service seen from its target market better than the closest competitor.
Competitive advantage variable is measured by indicators: price or value, pleasing the
consumer, customer experience, product attributes that can be written and a unique
service privilege.
Population and Sample
a. Population
Ulber Silalahi said that "Population can be either organism, person or group of
individuals, communities, organizations, goods, object, phenomenon or report from
which the sample was taken to measure.8 The population in this research is all small
batik industries in Pamekasan.
b. Sample
The samples in this study were small batik industries in Pamekasan. The samples
were selected by considering a principle that the smaller the sample size of the
population, the greater the sampling rate produces an accurate sample. The greater the
population allows smaller sampling ratio for the sample as good.9 In this study, the
researcher examined the hypothesis that has been proposed, therefore it only needed
the lesser sample size. In the multivariate study (including multivariate regression
analysis), the sample size is determined as much as twenty-five independent variables.10
So the sample is seventy-five respondents.
Data Collection Techniques
Data collection techniques used were: 1. Pick-up Survey.11 Data were collected by
conducting a survey where the questions were made in the form of questionnaires
distributed to each respondent and the results were obtained directly by researchers, as
a basis to identify issues to be discussed. 2. Documentation, data collection technique
implemented by citing the existing data.
8 Silalahi, Metode Penelitian Sosial Kuantitatif, 372.
9 Silalahi, 387.
10 Augusty Ferdinand, Metode Penelitian Manajemen, 5th ed. (Semarang: BP Universitas Diponegoro,
2014), 137. 11
HM Jogiyanto, Pedoman Survei Kuesioner (Yogyakarta: BPFE, 2016), 10.
The Influence of Work Culture, Creativity and Innovation toward Competitive Advantage on
Small Batik Industry in Pamekasan
5
Data Analysis
a. Descriptive Statistics
To give the data about the respondent demographics and the descriptive of the
research variables, researcher used a central tendency which means a data
simplification to facilitate researcher in interpreting and drawing the conclusion.12
b. Reliability Testing
Reliability according to Jogiyanto used to determine the level of how much
instrument can measure and result a stable and consistent measurement.13 In this study,
reliability coefficient is expected in the range of 0.70 to 0.80.
c. Validity Testing
Product moment correlation utilized to test the internal validity, it is calculated by
correlating each item score with total score. To determine questionnaire items that are
valid or invalid, examined by using a t-test to product-moment correlation. The results of t-
test must have significance level under or equal to 0,05 or 5% to be considered as a valid
indicator. Rule of thumb which is commonly used or is still acceptable in determining
validity is if the product-moment correlation value (r-value) is between 0,6-0,7 for
exploratory research.14
d. Feasibility Test Model
To analyze the model developed by Work Culture variable, Creativity variable,
Product Innovation variable, and Competitive Advantage variable.
e. t-test
t-test formula is used to determine whether Work Culture, Creativity, and Product
Innovation partially influence significantly to the Competitive Advantage.
g. Two Stages Regression
This formula is used to determine whether Work Culture and Creativity influence
to the Product Innovation and whether Product Innovation influence to the
Competitive Advantage.
RESULTS
a. General description of the respondents
75 pieces of Questionnaires were distributed to small Batik industries in Pamekasan.
The distribution period and the final return of the questionnaire for two months in
April and May 2018. Here are the details of the distribution and the return of the
questionnaire shown in Table 1.
12
Agus Irianto, Statistik: Konsep Dasar Dan Aplikasinya (Jakarta: Prenada Media, 2004), 25. 13
Jogiyanto, Pedoman Survei Kuesioner, 43. 14
Silalahi, Metode Penelitian Sosial Kuantitatif, 478.
Farid Firmansyah
6
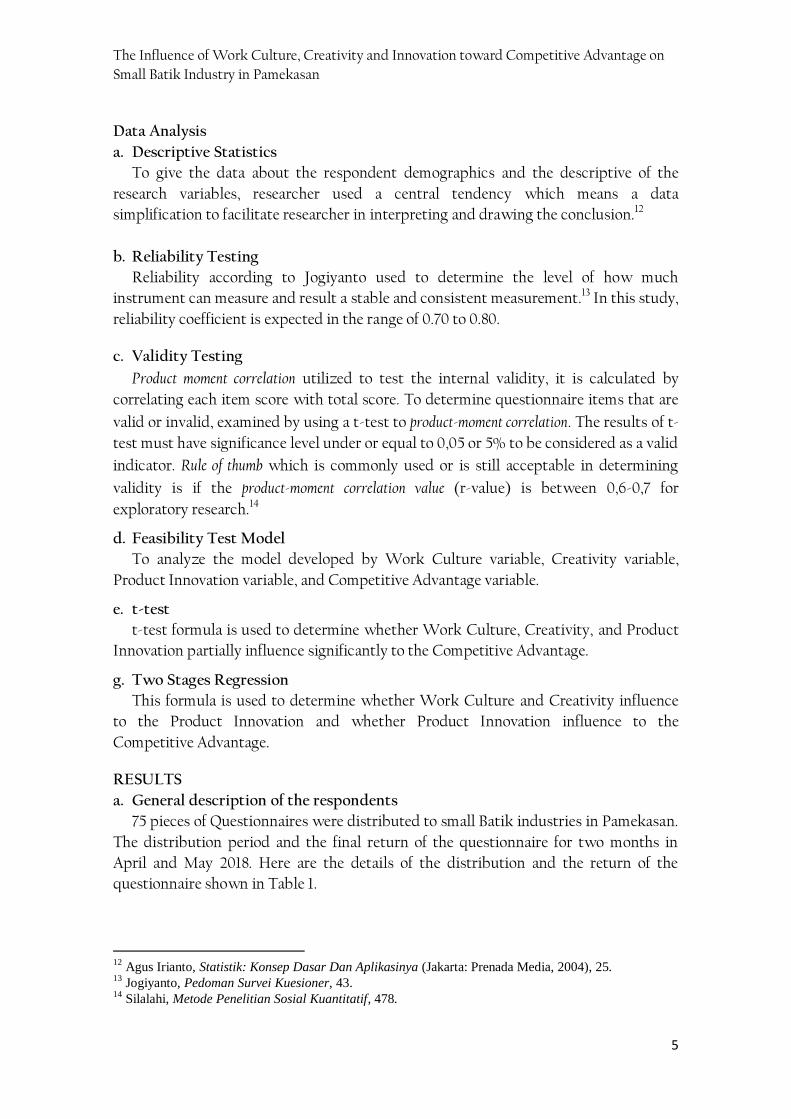
Tabel 1
The detail of distribution and return of the questionnaire
Distributed questionnaire 75
Unreturnable questionnaire 0
Incomplete questionnaire 0
Selected questionnaire 75
Respond rate 100%
Usable respond rate 100%
Source: Research Result, 2018
Table 1 shows the data about 75 distributed questionnaires. The response rate was
100% indicated that the role of respondents was high in this research. The analyzed
questionnaire were also 75 questionnaires without necessary to test non-response bias
since the usable questionnaires were more than 50%.
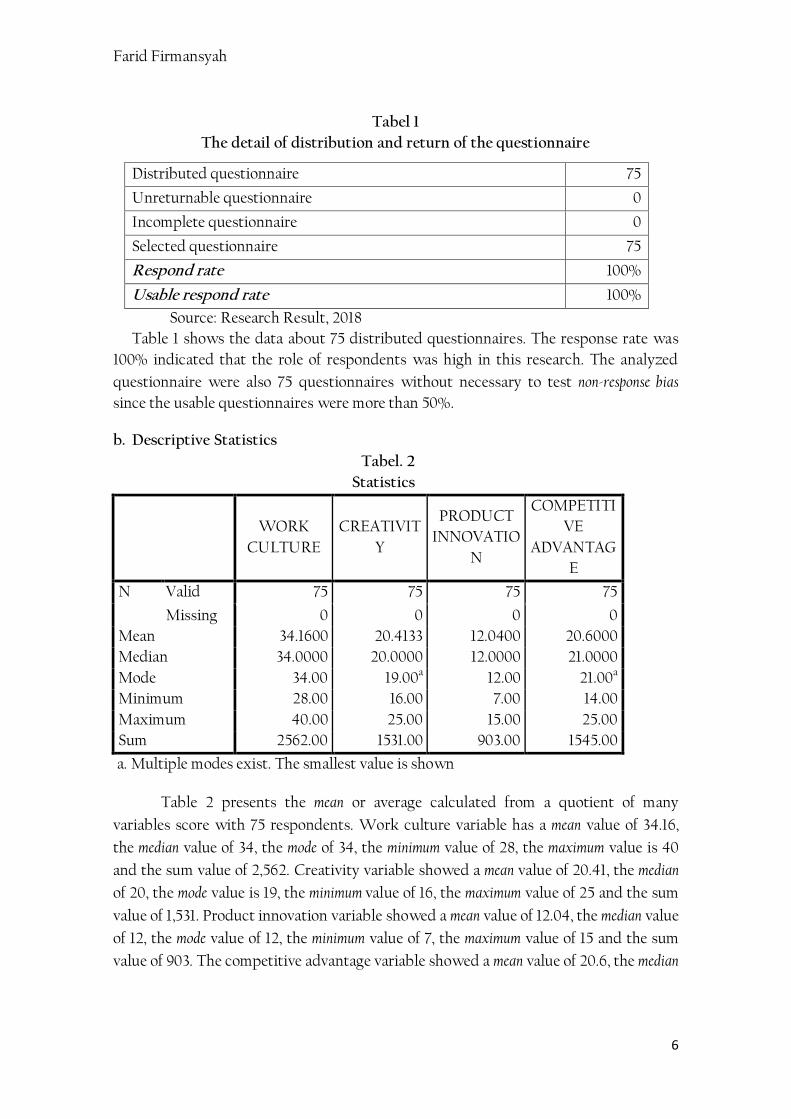
b. Descriptive Statistics
Tabel. 2
Statistics
WORK
CULTURE
CREATIVIT
Y
PRODUCT
INNOVATIO
N
COMPETITI
VE
ADVANTAG
E
N Valid 75 75 75 75
Missing 0 0 0 0
Mean 34.1600 20.4133 12.0400 20.6000
Median 34.0000 20.0000 12.0000 21.0000
Mode 34.00 19.00a 12.00 21.00a
Minimum 28.00 16.00 7.00 14.00
Maximum 40.00 25.00 15.00 25.00
Sum 2562.00 1531.00 903.00 1545.00
a. Multiple modes exist. The smallest value is shown
Table 2 presents the mean or average calculated from a quotient of many
variables score with 75 respondents. Work culture variable has a mean value of 34.16,
the median value of 34, the mode of 34, the minimum value of 28, the maximum value is 40
and the sum value of 2,562. Creativity variable showed a mean value of 20.41, the median
of 20, the mode value is 19, the minimum value of 16, the maximum value of 25 and the sum
value of 1,531. Product innovation variable showed a mean value of 12.04, the median value
of 12, the mode value of 12, the minimum value of 7, the maximum value of 15 and the sum
value of 903. The competitive advantage variable showed a mean value of 20.6, the median
The Influence of Work Culture, Creativity and Innovation toward Competitive Advantage on
Small Batik Industry in Pamekasan
7
value of 21, the mode value of 21, a minimum value of 14, the maximum value of 25 with the
sum value of 1.545.
c. Validity Test
Validity test is done to determine the validity level of the research instrument used
in data collection. Validity test was conducted to determine whether the items
presented in the questionnaire able to reveal what to be studied definitely. It is
measured by items analysis, where each score of each item correlated with a total score
of all items in the questionnaire to one variable by using the formula of product-moment.
The coefficient value of Pearson correlation in this research is in the range of strong
correlation with the level of significance under 5%.
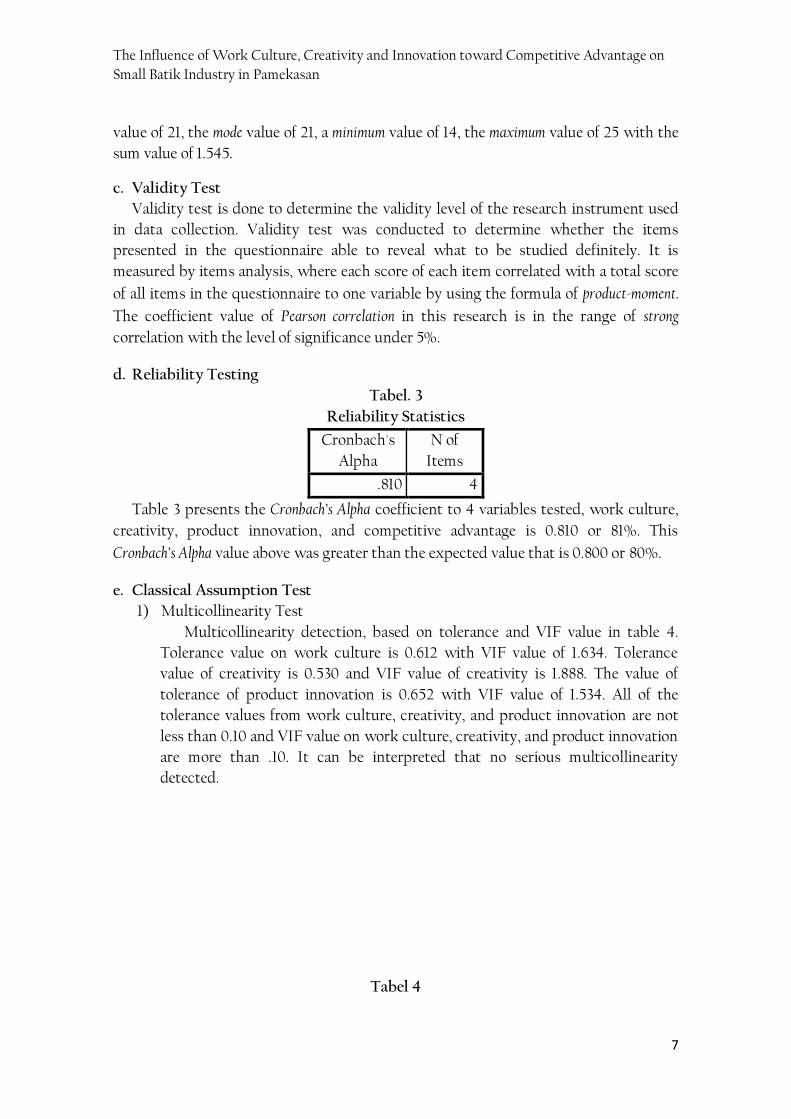
d. Reliability Testing
Tabel. 3
Reliability Statistics
Cronbach's
Alpha
N of
Items
.810 4
Table 3 presents the Cronbach’s Alpha coefficient to 4 variables tested, work culture,
creativity, product innovation, and competitive advantage is 0.810 or 81%. This
Cronbach’s Alpha value above was greater than the expected value that is 0.800 or 80%.
e. Classical Assumption Test
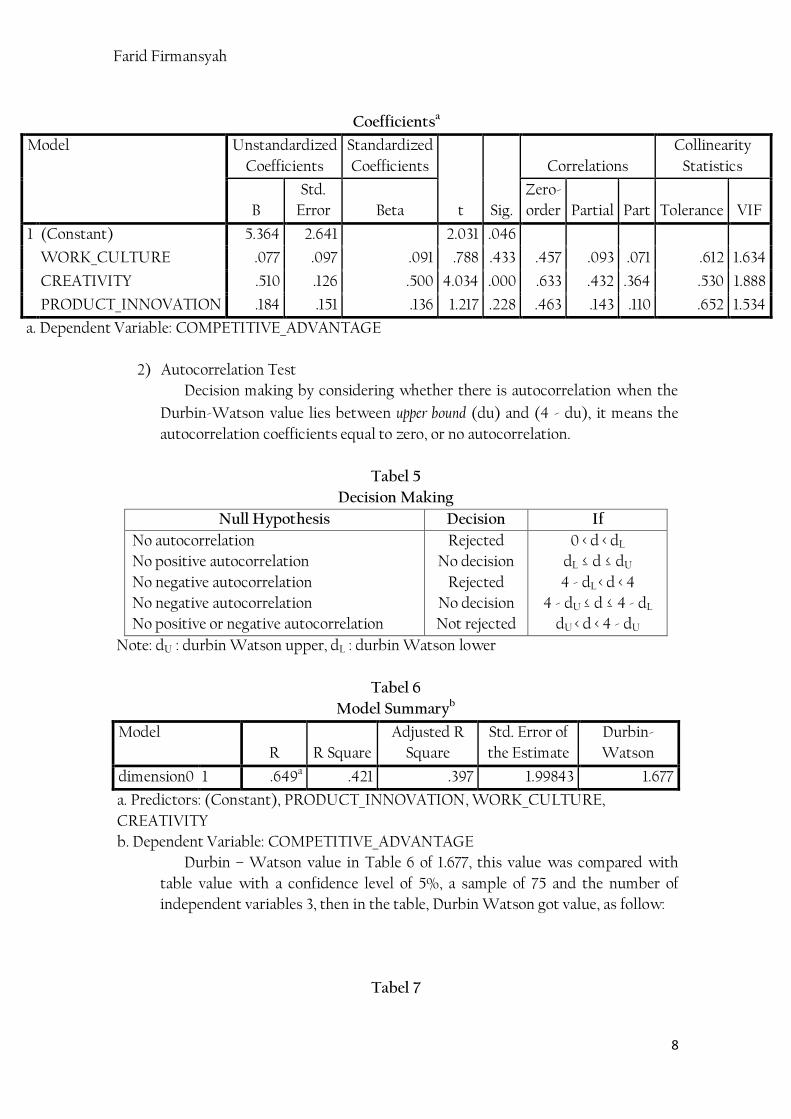
1) Multicollinearity Test
Multicollinearity detection, based on tolerance and VIF value in table 4.
Tolerance value on work culture is 0.612 with VIF value of 1.634. Tolerance
value of creativity is 0.530 and VIF value of creativity is 1.888. The value of
tolerance of product innovation is 0.652 with VIF value of 1.534. All of the
tolerance values from work culture, creativity, and product innovation are not
less than 0.10 and VIF value on work culture, creativity, and product innovation
are more than .10. It can be interpreted that no serious multicollinearity
detected.
Tabel 4
Farid Firmansyah
8
Coefficientsa
Model Unstandardized
Coefficients
Standardized
Coefficients
t Sig.
Correlations
Collinearity
Statistics
B
Std.
Error Beta
Zero-
order Partial Part Tolerance VIF
1 (Constant) 5.364 2.641 2.031 .046
WORK_CULTURE .077 .097 .091 .788 .433 .457 .093 .071 .612 1.634
CREATIVITY .510 .126 .500 4.034 .000 .633 .432 .364 .530 1.888
PRODUCT_INNOVATION .184 .151 .136 1.217 .228 .463 .143 .110 .652 1.534
a. Dependent Variable: COMPETITIVE_ADVANTAGE
2) Autocorrelation Test
Decision making by considering whether there is autocorrelation when the
Durbin-Watson value lies between upper bound (du) and (4 - du), it means the
autocorrelation coefficients equal to zero, or no autocorrelation.
Tabel 5
Decision Making
Null Hypothesis Decision If
No autocorrelation
No positive autocorrelation
No negative autocorrelation
No negative autocorrelation
No positive or negative autocorrelation
Rejected
No decision
Rejected
No decision
Not rejected
0 < d < dL
dL ≤ d ≤ dU
4 - dL < d < 4
4 - dU ≤ d ≤ 4 - dL
dU < d < 4 - dU
Note: dU : durbin Watson upper, dL : durbin Watson lower
Tabel 6
Model Summaryb
Model
R R Square
Adjusted R
Square
Std. Error of
the Estimate
Durbin-
Watson
dimension0 1 .649a .421 .397 1.99843 1.677
a. Predictors: (Constant), PRODUCT_INNOVATION, WORK_CULTURE,
CREATIVITY
b. Dependent Variable: COMPETITIVE_ADVANTAGE
Durbin – Watson value in Table 6 of 1.677, this value was compared with
table value with a confidence level of 5%, a sample of 75 and the number of
independent variables 3, then in the table, Durbin Watson got value, as follow:
Tabel 7
The Influence of Work Culture, Creativity and Innovation toward Competitive Advantage on
Small Batik Industry in Pamekasan
9
N k = 3 4 - dU d Decision
dL dU
75 1,395 1,557 2,443 1,677 Not rejected
Since the value of Durbin Watson (1.677) is greater than upper bound (dU)
1.577 and less than 4 - - dU (2,443), it can be concluded that there is positive
autocorrelation or negative autocorrelation in regression models.
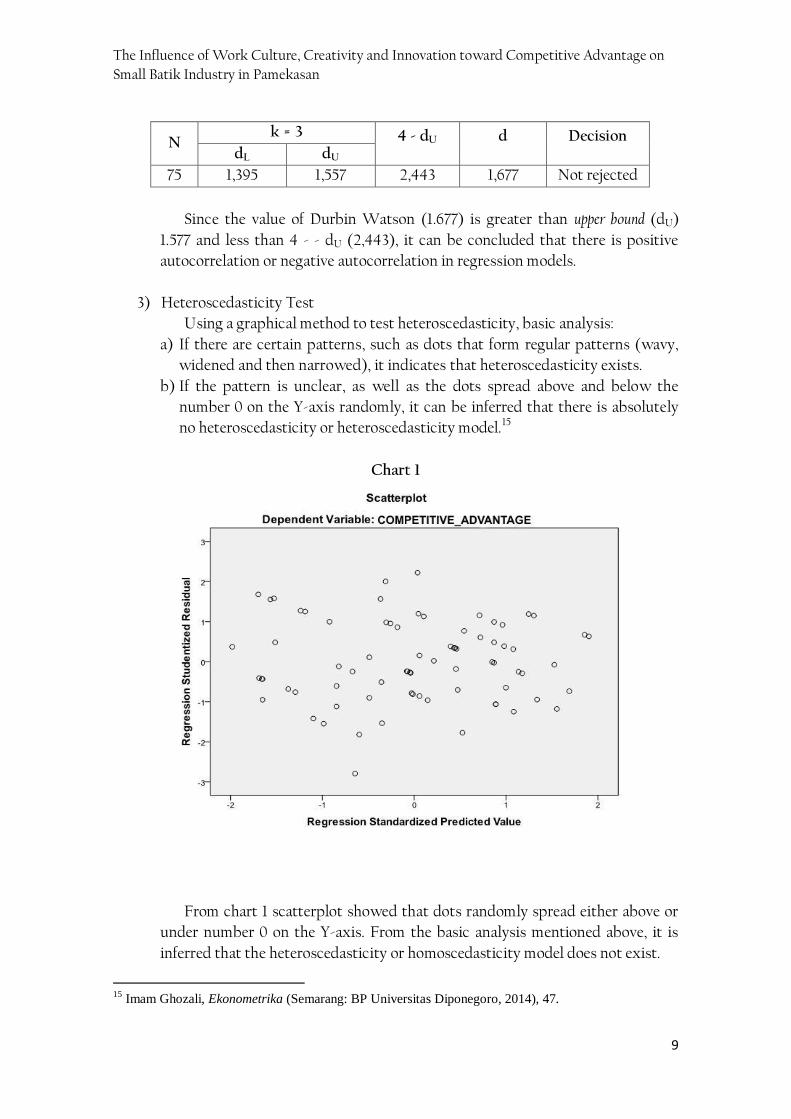
3) Heteroscedasticity Test
Using a graphical method to test heteroscedasticity, basic analysis:
a) If there are certain patterns, such as dots that form regular patterns (wavy,
widened and then narrowed), it indicates that heteroscedasticity exists.
b) If the pattern is unclear, as well as the dots spread above and below the
number 0 on the Y-axis randomly, it can be inferred that there is absolutely
no heteroscedasticity or heteroscedasticity model.15
Chart 1
From chart 1 scatterplot showed that dots randomly spread either above or
under number 0 on the Y-axis. From the basic analysis mentioned above, it is
inferred that the heteroscedasticity or homoscedasticity model does not exist.
15
Imam Ghozali, Ekonometrika (Semarang: BP Universitas Diponegoro, 2014), 47.
Farid Firmansyah
10
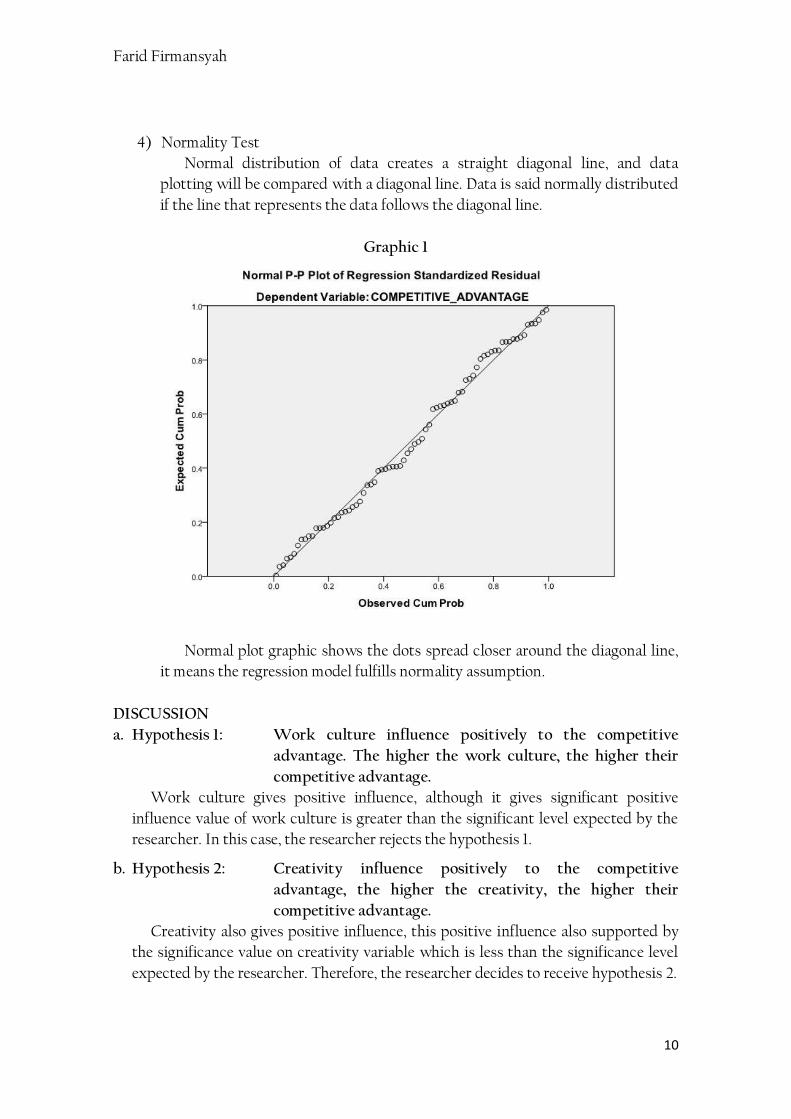
4) Normality Test
Normal distribution of data creates a straight diagonal line, and data
plotting will be compared with a diagonal line. Data is said normally distributed
if the line that represents the data follows the diagonal line.
Graphic 1
Normal plot graphic shows the dots spread closer around the diagonal line,
it means the regression model fulfills normality assumption.
DISCUSSION
a. Hypothesis 1: Work culture influence positively to the competitive
advantage. The higher the work culture, the higher their
competitive advantage.
Work culture gives positive influence, although it gives significant positive
influence value of work culture is greater than the significant level expected by the
researcher. In this case, the researcher rejects the hypothesis 1.
b. Hypothesis 2: Creativity influence positively to the competitive
advantage, the higher the creativity, the higher their
competitive advantage.
Creativity also gives positive influence, this positive influence also supported by
the significance value on creativity variable which is less than the significance level
expected by the researcher. Therefore, the researcher decides to receive hypothesis 2.
The Influence of Work Culture, Creativity and Innovation toward Competitive Advantage on
Small Batik Industry in Pamekasan
11
c. Hypothesis 3: Product innovation influences positively toward a
competitive advantage. The higher the product innovation,
the higher its competitive advantage.
Product innovation also gives positive influence, yet the significance level of
product innovation variable is greater than the significance level expected by the
researcher. Therefore, hypothesis 3 is also rejected.
The rejection of work culture and product innovation variables makes the
researcher excludes those two variables to find the best model in this research. The
revision to the expected model enables the researcher to eliminate insignificant
variables and re-analyze it.
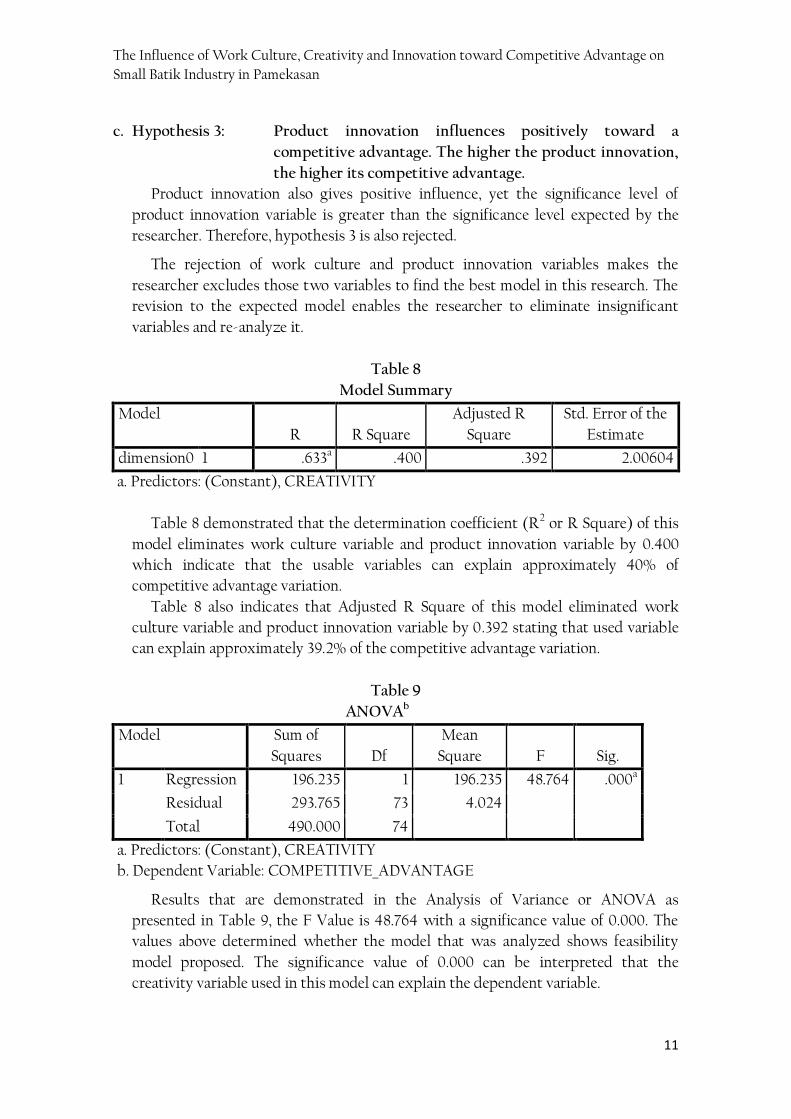
Table 8
Model Summary
Model
R R Square
Adjusted R
Square
Std. Error of the
Estimate
dimension0 1 .633a .400 .392 2.00604
a. Predictors: (Constant), CREATIVITY
Table 8 demonstrated that the determination coefficient (R2 or R Square) of this
model eliminates work culture variable and product innovation variable by 0.400
which indicate that the usable variables can explain approximately 40% of
competitive advantage variation.
Table 8 also indicates that Adjusted R Square of this model eliminated work
culture variable and product innovation variable by 0.392 stating that used variable
can explain approximately 39.2% of the competitive advantage variation.
Table 9
ANOVAb
Model Sum of
Squares Df
Mean
Square F Sig.
1 Regression 196.235 1 196.235 48.764 .000a
Residual 293.765 73 4.024
Total 490.000 74
a. Predictors: (Constant), CREATIVITY
b. Dependent Variable: COMPETITIVE_ADVANTAGE
Results that are demonstrated in the Analysis of Variance or ANOVA as
presented in Table 9, the F Value is 48.764 with a significance value of 0.000. The
values above determined whether the model that was analyzed shows feasibility
model proposed. The significance value of 0.000 can be interpreted that the
creativity variable used in this model can explain the dependent variable.
Farid Firmansyah
12
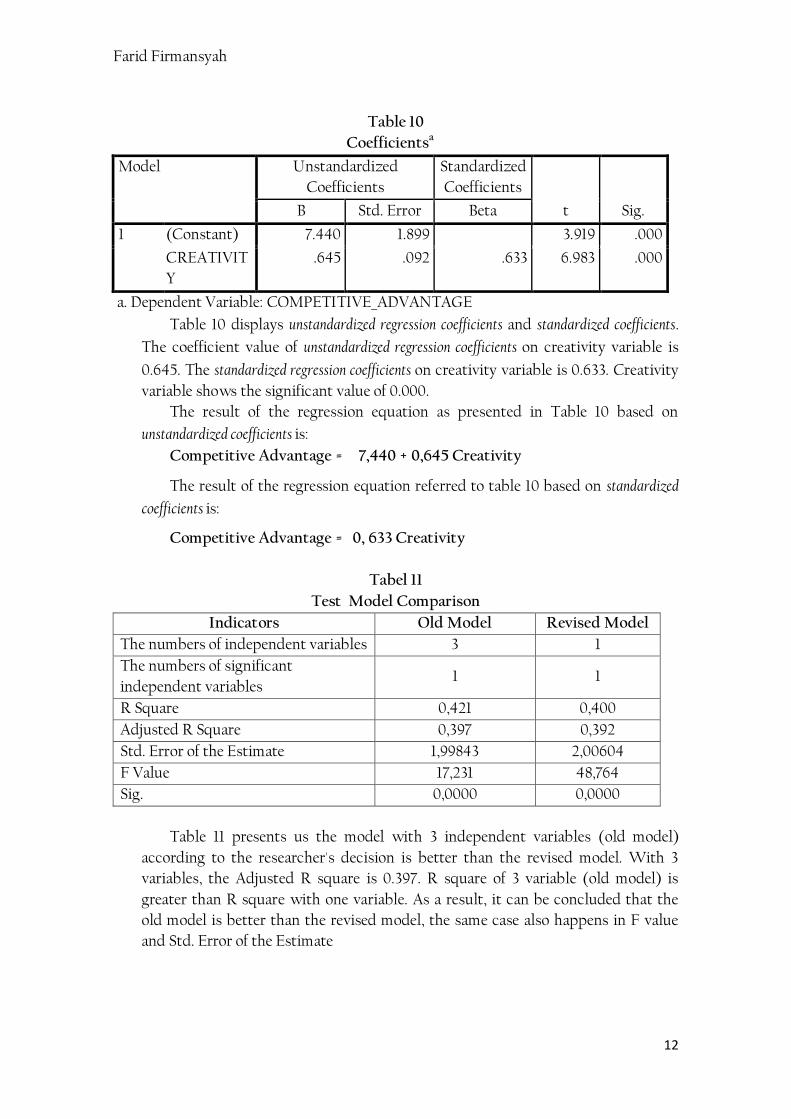
Table 10
Coefficientsa
Model Unstandardized
Coefficients
Standardized
Coefficients
t Sig. B Std. Error Beta
1 (Constant) 7.440 1.899 3.919 .000
CREATIVIT
Y
.645 .092 .633 6.983 .000
a. Dependent Variable: COMPETITIVE_ADVANTAGE
Table 10 displays unstandardized regression coefficients and standardized coefficients.
The coefficient value of unstandardized regression coefficients on creativity variable is
0.645. The standardized regression coefficients on creativity variable is 0.633. Creativity
variable shows the significant value of 0.000.
The result of the regression equation as presented in Table 10 based on
unstandardized coefficients is:
Competitive Advantage = 7,440 + 0,645 Creativity
The result of the regression equation referred to table 10 based on standardized
coefficients is:
Competitive Advantage = 0, 633 Creativity
Tabel 11
Test Model Comparison
Indicators Old Model Revised Model
The numbers of independent variables 3 1
The numbers of significant
independent variables 1 1
R Square 0,421 0,400
Adjusted R Square 0,397 0,392
Std. Error of the Estimate 1,99843 2,00604
F Value 17,231 48,764
Sig. 0,0000 0,0000
Table 11 presents us the model with 3 independent variables (old model)
according to the researcher's decision is better than the revised model. With 3
variables, the Adjusted R square is 0.397. R square of 3 variable (old model) is
greater than R square with one variable. As a result, it can be concluded that the
old model is better than the revised model, the same case also happens in F value
and Std. Error of the Estimate
The Influence of Work Culture, Creativity and Innovation toward Competitive Advantage on
Small Batik Industry in Pamekasan
13
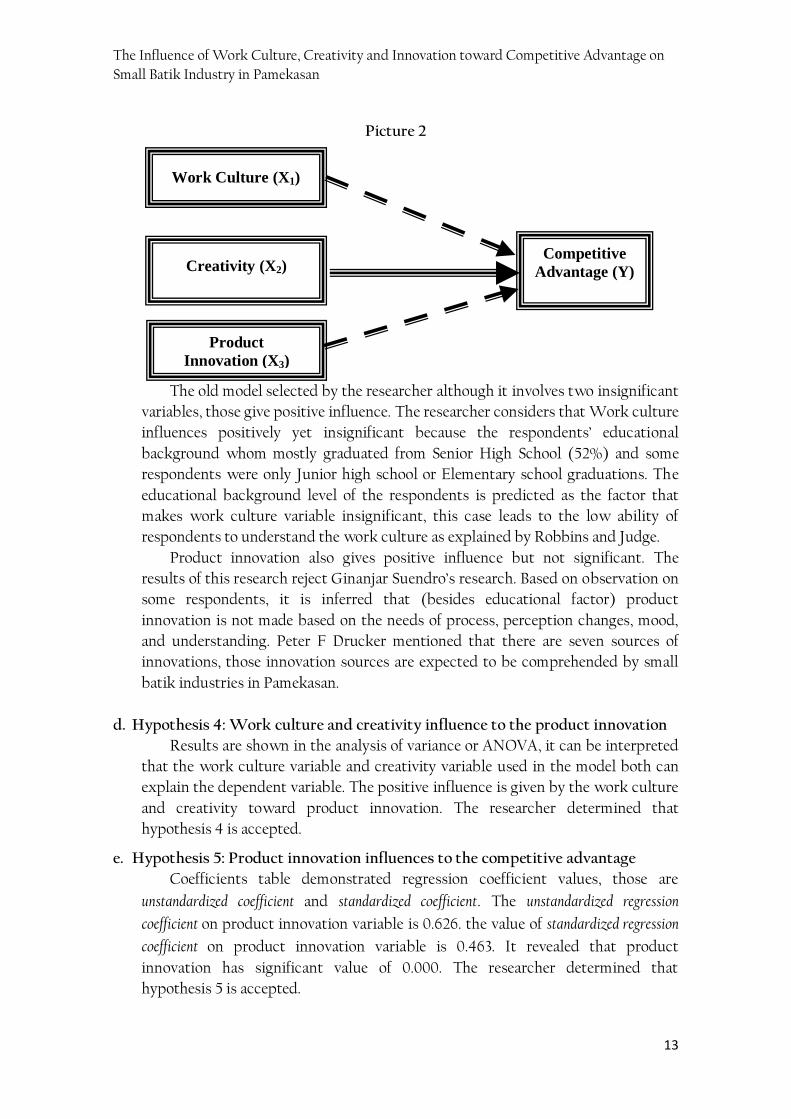
Picture 2
The old model selected by the researcher although it involves two insignificant
variables, those give positive influence. The researcher considers that Work culture
influences positively yet insignificant because the respondents’ educational
background whom mostly graduated from Senior High School (52%) and some
respondents were only Junior high school or Elementary school graduations. The
educational background level of the respondents is predicted as the factor that
makes work culture variable insignificant, this case leads to the low ability of
respondents to understand the work culture as explained by Robbins and Judge.
Product innovation also gives positive influence but not significant. The
results of this research reject Ginanjar Suendro’s research. Based on observation on
some respondents, it is inferred that (besides educational factor) product
innovation is not made based on the needs of process, perception changes, mood,
and understanding. Peter F Drucker mentioned that there are seven sources of
innovations, those innovation sources are expected to be comprehended by small
batik industries in Pamekasan.
d. Hypothesis 4: Work culture and creativity influence to the product innovation
Results are shown in the analysis of variance or ANOVA, it can be interpreted
that the work culture variable and creativity variable used in the model both can
explain the dependent variable. The positive influence is given by the work culture
and creativity toward product innovation. The researcher determined that
hypothesis 4 is accepted.
e. Hypothesis 5: Product innovation influences to the competitive advantage
Coefficients table demonstrated regression coefficient values, those are
unstandardized coefficient and standardized coefficient. The unstandardized regression
coefficient on product innovation variable is 0.626. the value of standardized regression
coefficient on product innovation variable is 0.463. It revealed that product
innovation has significant value of 0.000. The researcher determined that
hypothesis 5 is accepted.
Work Culture (X1)
Competitive
Advantage (Y)
Creativity (X2)
Product
Innovation (X3)
Farid Firmansyah
14
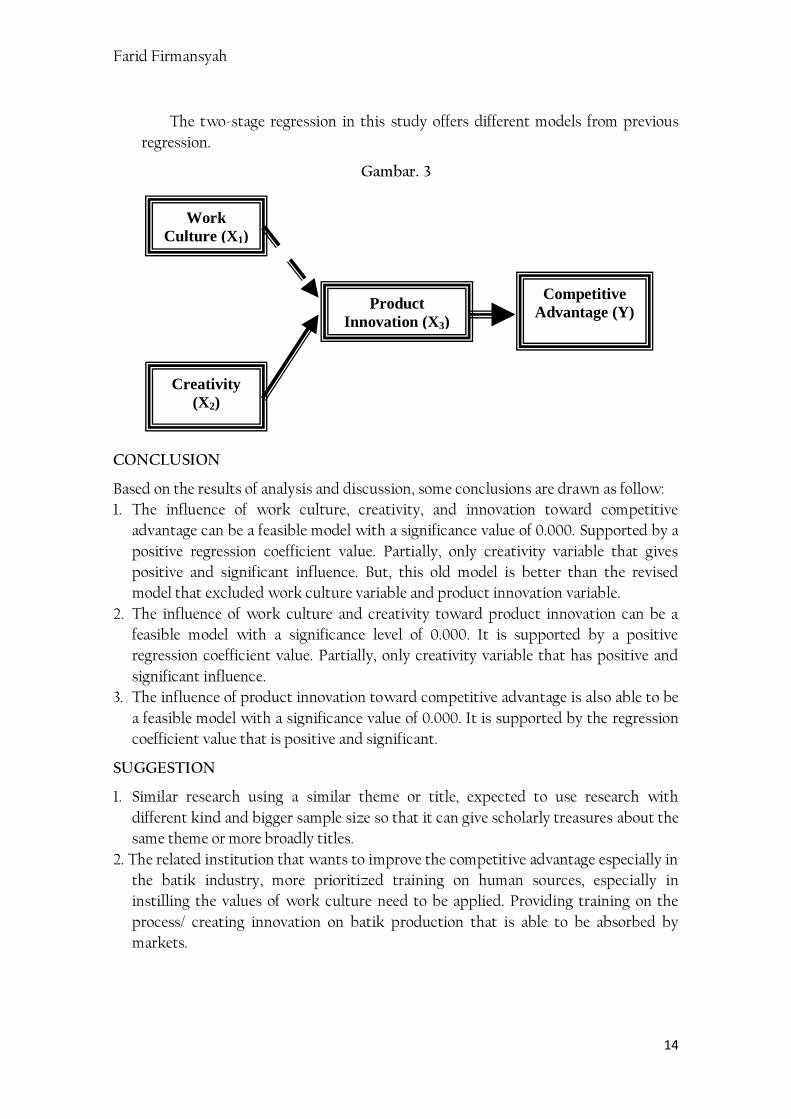
The two-stage regression in this study offers different models from previous
regression.
Gambar. 3
CONCLUSION
Based on the results of analysis and discussion, some conclusions are drawn as follow:
1. The influence of work culture, creativity, and innovation toward competitive
advantage can be a feasible model with a significance value of 0.000. Supported by a
positive regression coefficient value. Partially, only creativity variable that gives
positive and significant influence. But, this old model is better than the revised
model that excluded work culture variable and product innovation variable.
2. The influence of work culture and creativity toward product innovation can be a
feasible model with a significance level of 0.000. It is supported by a positive
regression coefficient value. Partially, only creativity variable that has positive and
significant influence.
3. The influence of product innovation toward competitive advantage is also able to be
a feasible model with a significance value of 0.000. It is supported by the regression
coefficient value that is positive and significant.
SUGGESTION
1. Similar research using a similar theme or title, expected to use research with
different kind and bigger sample size so that it can give scholarly treasures about the
same theme or more broadly titles.
2. The related institution that wants to improve the competitive advantage especially in
the batik industry, more prioritized training on human sources, especially in
instilling the values of work culture need to be applied. Providing training on the
process/ creating innovation on batik production that is able to be absorbed by
markets.
Work
Culture (X1)
Competitive
Advantage (Y)
Creativity
(X2)
Product
Innovation (X3)
The Influence of Work Culture, Creativity and Innovation toward Competitive Advantage on
Small Batik Industry in Pamekasan
15
REFERENCES
Ferdinand, Augusty. Metode Penelitian Manajemen. 5th ed. Semarang: BP Universitas
Diponegoro, 2014.
Ghozali, Imam. Ekonometrika. Semarang: BP Universitas Diponegoro, 2014.
Hadiyati, Ernani. “Kreativitas dan Inovasi Berpengaruh Terhadap Kewirausahaan
Usaha Kecil.” Jurnal Manajemen dan Kewirausahaan 13, no. 1 (September 30, 2011):
8–16. https://doi.org/10.9744/jmk.13.1.8-16.
Irianto, Agus. Statistik: Konsep Dasar Dan Aplikasinya. Jakarta: Prenada Media, 2004.
Jogiyanto, HM. Pedoman Survei Kuesioner. Yogyakarta: BPFE, 2016.
Setiawan, Heri. “Pengaruh Orientasi Pasar, Orientasi Teknologi Dan Inovasi Produk
Terhadap Keunggulan Bersaing Usaha Songket Skala Kecil Di Kota Palembang.”
Jurnal Orasi Bisnis VIII (November 2012): 12–19.
Silalahi, Ulber. Metode Penelitian Sosial Kuantitatif. Bandung: PT. Refika Aditama, 2015.
Suendro, Ginanjar. “Analisis Pengaruh Inovasi Produk Melalui Kinerja Pemasaran
Untuk Mencapai Keunggulan Bersaing Berkelanjutan (Studi Kasus Pada
Industri Kecil Dan Menengah Batik Pekalongan).” Tesis, Universitas
Diponegoro, 2010.
Sugiyarti, Gita. “Studi Empiris pada Industry Pakaian jadi Skala Kecil dan Menengah di
Kota Semarang.” E-Jurnal Serat Acitya 4, no. 2 (2015): 14.
http://u.lipi.go.id/1346221190.
Sugiyono. Metode Penelitian Administrasi. Bandung: Alfabeta, 1998.
Wangke, Humphrey. “Peluang Indonesia dalam Masyarakat Ekonomi Asean 2015.” Info
Singkat Hubungan Internasional VI, no. 10/II/P3DI/Mei/20124 (2014): 4.