Embed Size (px)
Citation preview

The Informal Sectorand Waste PaperRecovery in BombayPieter van Beukering, EdwinSchoon and Ajit Mani
CREED Working Paper Series No 5
June 1996
International Institute for Environment and Development,LondonInstitute for Environmental Studies, Amsterdam

The authors
Drs Pieter van Beukering is a researcher at the Institute for Environmental Studies (IVM), theNetherlands. Edwin Schoon is a trainee at IVM, where he is completing his Masters degree. Theymay be contacted at:
IVMVrije UniversiteitDe Boelelaan 11151081 HV AmsterdamTHE NETHERLANDS
Tel: (31) 20 444 9555Fax: (31) 20 444 9553Email: [email protected]
Ajit Mani is Director of Intervention (India) Pvt. Ltd and may be contacted at:
#2 Haudin House13 Haudin RoadUlsoorBangalore 560 042INDIA
Tel: (91) 80 559 9092

Fax: (91) 80 227 4699

The programme of Collaborative Research in the Economics of Environment and Development (CREED)was established in 1993 as a joint initiative of the International Institute for Environment and Development(IIED), London, and the Institute for Environmental Studies (IVM), Amsterdam. The Secretariat forCREED is based at IIED in London. A Steering Committee is responsible for overall management andcoordination of the CREED Programme.
Environmental Economics Programme, IIED
IIED is an independent, non-profit organisation which seeks to promote sustainable patterns of worlddevelopment through research, training, policy studies, consensus building and public information. TheEnvironmental Economics Programme is one of seven major programmes of IIED; it conducts economicresearch and policy analysis for improved management of natural resources and sustainable economicgrowth in the developing world.
Environmental Economics ProgrammeIIED, 3 Endsleigh StreetLondon WC1H 0DD, UKTel +44 (0)171 388 2117; Fax +44 (0)171 388 2826e-mail: [email protected]
Institute for Environmental Studies, (IVM)
IVM is a non-profit research institute, based at Vrije Universiteit, Amsterdam. The Institute's primaryobjective is to carry out multi- and interdisciplinary research on environmental issues, based on cross-fertilisation of monodisciplinary sciences. Environment and the Third World is one of eight major IVMresearch programmes.
IVM, Vrije UniversiteitDe Boelelaan 11151081 HV AmsterdamThe NetherlandsTel: +31 20 444 9555; Fax: +31 20 444 9553e-mail:[email protected]
CREED Steering Committee members include:
Prof Johannes Opschoor, Institute for Social Studies, The Netherlands (Chair)Prof Gopal Kadekodi, Centre for Multidisciplinary Development Research, IndiaDr Ronaldo Seroa da Motta, IPEA, BrazilDr Mohamud Jama, Institute for Development Studies, KenyaDr Anantha Duraiappah, IVM, The NetherlandsProf Harmen Verbruggen, IVM, The NetherlandsJoshua Bishop, IIED, UKMaryanne Grieg-Gran, IIED, UK

AbstractLack of raw materials is generally considered one of the main constraints to a comprehensiverecycling industry in developing countries. This paper examines the possibilities for increasing wasterecovery in the South. First a literature study provides a general introduction to the problems of solidwaste management in developing country cities. Based on field surveys in the informal recoverysector and the literature on formal waste collection, a simulation model for the solid waste flows inBombay is developed. Two policy options under varying degrees of public responsiveness areconsidered: the encouragement of the existing informal recovery sector and the introduction of aWestern style recovery system. Extrapolations of four effects are provided for the period to 2010:formal and informal employment, environmental impact, public expenditure and income distribution.Results demonstrate that policy makers in developing country cities should be reluctant to introduce aWestern style waste collection system. Promoting informal recovery does seem to be a cost effectiveand an environmentally optimal policy measure, although this does result in adverse consequences forincome distribution.
ResumenLa falta de materia prima se considera como uno de los factores más importantes para la creación deuna industria completa de reciclaje en el sur. Este trabajo examina las posibilidades que existen paraincrementar la recuperacion de desechos reciclables en los países en vías de desarrollo, centrándoseen Bombay, India. En primer lugar, un revision de la literatura sobre este tema servirá comointroducción general a los problemas relacionados con los desechos sólidos y su recuperacion en lasciudades. Se desarrolla en este artículo un modelo que representa el movimiento de desechos sólidosen Bombay basado en estudios de campo en el sector informal de la recuperacion de basura, y en laliteratura sobre la recuperacion en el sector formal. Se estudian aquí dos opciones de las prácticas aseguir, según las diversas actitudes del público: el fomento del ya establecido sector informal derecuperacion, y la introducción de un sistema de recuperacion de desechos al estilo de los que yaexisten en los países de Occidente. Se presentan extrapolaciones de cuatro efectos distintos,cubriendo el período hasta el 2010: el empleo formal y informal, el impacto medioambiental, el gastopúblico, y la distribucion de ingresos. El fomento de la recuperacion informal parece ser la maseconómica y una medida de política medioambiental óptima: los requisitos, en lo que se refiere a lainversión, son mínimos, y, a la vez, los gastos de los vertederos se ven reducidos; los efectos sobre elempleo también son positivos debido a la cantidad de mano de obra necesaria para el desempeño de larecuperacion informal de basura. Sin embargo, el impacto sobre la distribucion de ingresos es peorque en las políticas de reciclaje de Occidente.
AbrégéOn considère que l'absence de matières premières représente une des principales limitations imposéesà une industrie globale du recyclage dans le Sud. Analysant le cas de Bombay, en Inde, ce documentexamine les possibilités d'accroissement de la récupération des déchets recyclables dans les pays endéveloppement. À titre d'introduction générale aux problèmes que posent, dans les villes de ces pays,les déchets solides et leur récupération, les auteurs étudient la littérature existante à ce sujet. Sur labase d'enquêtes de terrain menées dans le secteur informel de la récupération et de la littératuretraitant de la collecte formelle des déchets, un modèle simulant les flux des déchets solides dansBombay est élaboré. Deux options politiques, formulées selon différents degrés de réaction du public,sont envisagées: encourager l'actuel secteur informel de récupération ou introduire un système derécupération de style occidental. Les extrapolations de leurs effets sur quatre domaines différents sontprésentées pour la période allant jusqu'à 2010: effets sur l'emploi formel et informel, impacts surl'environnement, conséquences en termes de dépenses publiques et effets sur la répartition desrevenus. La promotion de la récupération informelle apparaît comme une mesure politique à la foisd'une plus grande efficacité-coût et optimale du point de vue de l'environnement: ses exigences entermes d'investissement sont minimales alors que le coût des décharges s'en trouve réduit; ses effets

sur l'emploi sont eux aussi favorables à cause du caractère fortement intensif en main d'œuvre de larécupération informelle des déchets. Cependant, son impact sur la répartition des revenus est pire quedans le cadre d'une politique de style occidental.

Contents
Introduction 1
Solid Waste Management and Recycling in Developing Countries 2State-of-the-art of SWM in developing countries 2Theoretical framework for waste management and recycling 3
The Waste Paper Collection Sector in India 6General structure 6A case study of the waste collection sector of Bombay 8
The Source and Collection of Paper 9The waste picker 9Other stakeholders in the supply and collection of waste 13
The Waste Paper Trade 17The buyers 17The wholesalers 19
The Network Flow Model for the Waste Paper Supply in Bombay 22The simulation model 22Constraints 24Simulation results 26The evaluation model 30
Conclusions 33
Appendices 44
References 46

CREED Working Paper Series No 5 1
Introduction
International trade and local recovery of waste paper seem to be two separate issues, yet bothactivities are closely linked through the price of waste paper. This implies that changes in therecovery of waste paper in one country can have a significant impact on the recovery of wastepaper in another. A perfect example of this relationship was demonstrated in the late 1980s andearly 1990s when the German government introduced various policy measures to increase therecovery of waste paper in Germany. From 1989 to 1993 collection in Germany increased byalmost 50%. This sudden increase in supply resulted in a negative price for low grade wastepaper on the international market (Hagen 1994). Many neighbouring countries encounteredconsiderable problems in maintaining the local collection system and subsidies had to beprovided to waste paper collectors to prevent bankruptcy.
The option to establish subsidies is not always available to developing countries governmentswho face tighter budgetary constraints; in addition, the recovery sector in developing countriesis much more market-driven than in the North. The impact of price fluctuations can, therefore,be more severe in the South.
In this paper, waste recovery in developing countries will be described. In order to assess thepossible impact of international price fluctuations on the local recovery of waste paper, a casestudy will be presented on the recovery sector in Bombay, India. As well as focusing on theeconomic effects, including developments in value added and public costs, the social impacts,such as employment and income distribution as well as the environmental effects, are alsoconsidered. Note that the impacts of the recycling process are ignored in this paper. Based onthis assessment, recommendations may be made for improving the recovery sector in Bombay.
The paper is structured as follows. First, a general introduction to waste recovery and wastemanagement in developing countries is described. A theoretical framework for the problem isthen developed The issue is then narrowed down to waste paper in Bombay. The sources ofwaste paper and the actors involved in collecting the waste are described in the followingsection, followed by an assessment of the waste paper trade sector. A simulation model isdeveloped in order to determine the overall economic, environmental and social impact fordifferent scenarios of waste management. Finally, conclusions are drawn.

CREED Working Paper Series No 5 2
Solid Waste Management and Recyclingin Developing Countries
Developing countries have been recovering and using recyclable materials from municipal solidwaste for many years. Moreover, recycling activities in the South are expanding rapidly(Savage and Diaz 1995, Bennis et al. 1996). Two factors underlie this development. First,local industries have increasingly recognised the advantages of recycling, such as lower energyconsumption and therefore they have increased demand for recyclable materials. Secondly,consumers and collectors have become more aware of the economic value of recyclable wasteand therefore have improved separation techniques and expanded the supply of secondarymaterials. In this section, the last factor will be discussed and analysed. As literature on thissubject is rather scarce, most conclusions are based on a survey undertaken for the waste papercollection sector in Bombay. First a literature overview on recyclable waste collection indeveloping countries is presented.
State-of-the-art of Solid Waste Management (SWM) in developing countries
According to the World Bank (1995), the share of population living in cities in developingcountries rapidly increased from 28% in 1970 to 38% in 1993. Projections for futuredevelopments show that this tendency will continue at an even faster rate. This trend towardsurbanisation coincides with economic development, leading to higher income and consumptionlevels. As a result, municipal solid waste will become a major problem for many cities in theSouth. The well-known waste management hierarchy which stems from SWM in industrialisedcountries - waste prevention, reuse, recycle, energy recovery, disposal - is also in force indeveloping countries (Schall 1995). However, though the order of the options is similar to theindustrialised world, the configuration of these options differs. For example, waste prevention isparticularly relevant for countries with high consumption levels. Unnecessary packagingmaterials or extravagant consumer behaviour is generally less common in developing countries,and therefore the possibilities to reduce waste production at the source are also less.
Disposal options in developing countries differ from the North. At present, up to 50% ofmunicipal budgets in developing countries is spent on solid waste management. Yet, wasteofficials are not able to manage this problem efficiently. Due to the lack of funds, on averageonly 50% is collected in developing cities (Cointreau 1991). But even when budgets areadequate for collection, safe disposal remains a problem. Overall, inappropriate solid wastemanagement leads to a number of societal problems, such as increased risk for epidemics, air-pollution caused by illegal waste burning and pollution of groundwater. The limited resourcesfor SWM by the municipalities in developing countries increases the need for cost-effectiveoptions for urban solid waste management.
Most developing cities are serviced by an informal sector which exists in parallel with the formalwaste collection authorities. This sector is mainly guided by market forces. The role ofgovernments in recovering secondary materials is small. This informal sector is essential for theenvironment as well as the local economies in urban centres: first, by collecting waste materialsthe informal sector takes over a part of the burden of the municipalities. Second, since the waste
CREED Working Paper Series No 5 3
collection is labour intensive and involves no special skills or transaction costs, it provides alivelihood to many new immigrants and marginalised people in big cities in developing countries.Estimates show that these activities account for an estimated 1-2% of the workforce in largecities (Cointreau 1989). Waas and Diop (1991) estimate that in Dakar around 200,000 peopleare employed by the informal recycling sector. Third, informal collection avoids environmentalcosts and reduces capacity problems at dumpsites.
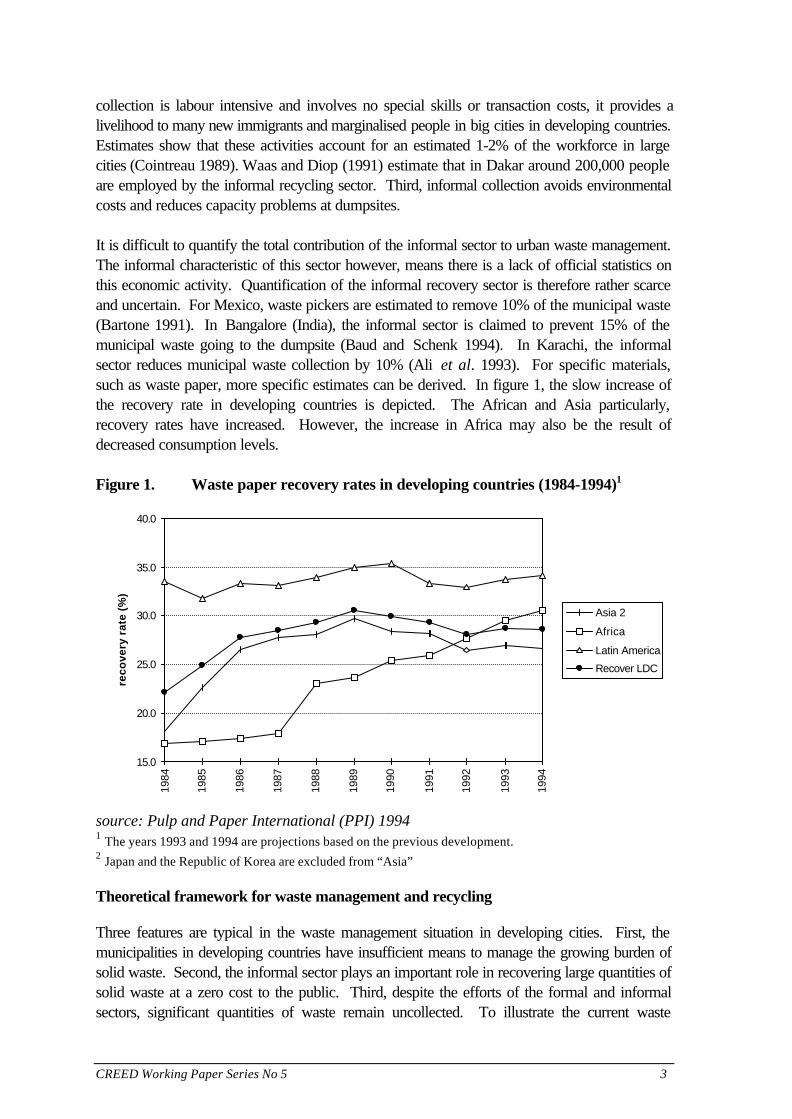
It is difficult to quantify the total contribution of the informal sector to urban waste management.The informal characteristic of this sector however, means there is a lack of official statistics onthis economic activity. Quantification of the informal recovery sector is therefore rather scarceand uncertain. For Mexico, waste pickers are estimated to remove 10% of the municipal waste(Bartone 1991). In Bangalore (India), the informal sector is claimed to prevent 15% of themunicipal waste going to the dumpsite (Baud and Schenk 1994). In Karachi, the informalsector reduces municipal waste collection by 10% (Ali et al. 1993). For specific materials,such as waste paper, more specific estimates can be derived. In figure 1, the slow increase ofthe recovery rate in developing countries is depicted. The African and Asia particularly,recovery rates have increased. However, the increase in Africa may also be the result ofdecreased consumption levels.
Figure 1. Waste paper recovery rates in developing countries (1984-1994)1
15.0
20.0
25.0
30.0
35.0
40.0
1984
1985
1986
1987
1988
1989
1990
1991
1992
1993
1994
rec
ov
ery
ra
te (
%)
Asia 2
Africa
Latin America
Recover LDC
source: Pulp and Paper International (PPI) 19941 The years 1993 and 1994 are projections based on the previous development.2 Japan and the Republic of Korea are excluded from “Asia”
Theoretical framework for waste management and recycling
Three features are typical in the waste management situation in developing cities. First, themunicipalities in developing countries have insufficient means to manage the growing burden ofsolid waste. Second, the informal sector plays an important role in recovering large quantities ofsolid waste at a zero cost to the public. Third, despite the efforts of the formal and informalsectors, significant quantities of waste remain uncollected. To illustrate the current waste

CREED Working Paper Series No 5 4
management situation in developing cities, a simplified illustration is presented in figure 2. Pricesfor each type of recovered material are assumed to remain constant. From this economicframework, the optimal waste management options (landfill and recovery) can be derived. Onthe vertical axis, direct costs and revenues are depicted of both options. The horizontal axisshows the quantities of the respectively recovered (recycled) waste and disposed (landfilled)waste. The total amount of generated waste 0W remains constant.
The waste has three possible destinations: informal recovery for recycling, formal collection forlandfilling, and, in the worst case, the waste will be left uncollected. These management optionsare expressed in the cost curves which depict the net marginal cost or benefits of each additionalunit of waste for that particular management option. The net marginal cost curve for informalrecovery starts above the horizontal axis because recycling initially generates net revenues. Themarginal revenue decreases with increased collection because the remaining recyclable waste atthe source becomes more scarce and the quality deteriorates. Relatively more effort is requiredto recover it. Recycling is cost-effective until the quantity R., which depicts the optimal quantityof recovered waste under free market conditions. Recovery of waste beyond R is not cost-effective. Recovery in developing countries will not exceed R because the informal sector is notcompensated for the resulting additional costs.
Figure 2. Current and optimal recovery and disposal configuration
net marginal cost of disposal / landfill
net marginal revenue of recovery
R Q D0% recovery100% disposal
100% recovery0% disposal
reve
nue
per t
onne
cost
s pe
r ton
ne
0 WQ*R* D*
source: based on Bertolini 1994
The net marginal cost curve of disposal/landfill should be read from the right to the left. Wastecollection starts at W and will move gradually towards the left as long as the municipal budgetholds. This curve starts below the horizontal axes because formal collection does not generatenet benefits. Therefore, this curve never intersects with the horizontal axes. As opposed to thenet marginal curve of informal recovery, an increase in formal waste collection decreases its netmarginal costs. These economies of scale are illustrated by the more than proportional declineof the marginal cost line, starting at the right hand side. Because municipalities in developingcountries generally have insufficient budgets to collect all the disposed waste, formal waste

CREED Working Paper Series No 5 5
collection usually does not accomplish the desired quantity of WR. In figure 2 this is indicatedby the amount WD which is the actual formal collection and landfill. This leaves an amount ofRD as uncollected waste. Yet at R, the marginal costs of recovery are still lower than themarginal cost of disposal. Therefore, from the perspective of the municipality, it is still cheaperto recover waste instead of collecting it for landfilling. At the intersection of both marginal costscurves Q, recycling is no longer preferred above landfilling. Beyond Q disposing of waste ischeaper than recovery. This leaves a quantity of QW of waste to be disposed. A quantity ofRD remains uncollected.
In industrialised countries where municipal budgets do not form a constraint, the most costeffective solution is to first increase the recovery for recycling purposes (from R to Q). BeyondQ, it is cheaper to collect the waste for disposal and thus follow the net marginal cost curve(DQ). For developing country, budgets are more limited which prevents the total formalcollection of waste. Second, government involvement with the informal recovery sector isabsent. Therefore, the municipality is not in a position to exploit the cheaper option ofrecovering RQ for recycling.
What is the most efficient solution to solving the problem of uncollected waste in developingcities, given the limited budget of municipalities and the limited involvement of governments withrecycling? In the above theoretical framework, two options prevail. First, the waste collectionof the municipality can be improved by increasing the efficiency of solid waste management.Official solid waste collection systems are often very inefficient: generally, second-hand vehiclesare operated which are extremely polluting and not suitable for local conditions. As a result,maintenance costs are very high (Pearce and Turner 1994). Improvement to solid wastemanagement will allow more waste to be collected for a similar SWM budget (shift D to D*).This progress is depicted in figure 2 by a shift of the net marginal costs curve to the right.
The second option for reducing the uncollected solid waste is to encourage the recovery ofrecyclable waste by the informal sector. This can be achieved through the reduction orelimination of sales tax on local waste trade or through the promotion of waste separation atsource. Another option which is often considered is the replacement of the informal sector by aWestern style recovery system. Whether this alternative is feasible will be discussed in thecoming sections. An improvement of the informal collection sector is depicted in figure 2 by ashift of the net marginal revenue curve to the right. This implies that the amount of recyclablewaste collected cost-effectively will increase from R to R*. In the new situation, the uncollectedsolid waste has decreased from RD to R*D*.

CREED Working Paper Series No 5 6
The Waste Paper Collection Sector in India
General Structure
In order to determine the economic, social and environmental impacts of different policiesdirected at the local collection of waste paper in India, it is necessary to understand the complexsystem of entrepreneurs and processes which are linked to this sector. Ignoring thesecomplexities would lead to an underestimation of the social dimensions of the paper chain,because it is mainly the underprivileged who play an important role in this sector. Theboundaries which will be considered in this partial life-cycle run from paper consumption to thedisposal or recovery of paper products. Impacts from the actual utilisation of local waste paperare excluded. These upstream effects are considered in Beukering and Duraiappah (1996). Thevarious routes of paper in the recovery sector are depicted by the flow-diagram in figure 3.
ProcessesUnlike the processes which take place before consumption, the processes in this phase areextremely labour intensive and involve only a limited input of capital. The following processeswill be considered. First, the consumption process is of major importance. Most studies onthe paper cycle only look at the consumption of paper products which is either supplied by localmanufacturers or by foreign producers. The fact that part of the consumption also involves re-use of waste paper without reprocessing taking place, is generally ignored. Yet, particularly indeveloping countries, re-use is an important alternative destination for waste paper and therebymay have a negative impact on the supply of secondary fibre to the recycling industry.Therefore, re-use is included in this study. This has two implications. First, the total level ofconsumption in this analysis will be higher than the formal level of consumption. The actualconsumption will therefore be extended by a certain amount of re-used waste paper. Second,as re-use has a negative effect on the quality of the waste paper, it is assumed that paper whichis re-used can no longer be available for recycling. This implies that the quantity ofunrecoverable waste paper for disposal will increase if more waste paper is re-used.

CREED Working Paper Series No 5 7
Figure 3. Flow-diagram of the local paper consumption and post-consumerdestinations of waste paper
Consumption
Waste Pickers
Households
Institutions
IWBs
Factories
Buyers
Wholesalers
Paper Factories
Reuse
Disposal
note: IWBs =Itinerant Waste Buyers (see below)
After consumption part of the paper diverts from the cycle through either long term storagesuch as libraries, and through structural losses such as sewage. The waste paper can also beburned in order to reduce the disposal burden. The remaining paper is either landfilled at thedumpsite or it is recovered and supplied to the trade sector through different entrepreneurs. Inthe case of landfilling, the waste paper can still be recovered by entrepreneurs who operate atthe dumpsites. Eventually, the trade sector will supply the waste to the paper industry or offerpart of the merchandise for re-use to the consumers.
EntrepreneursThe entrepreneurs who operate in this field can be broadly categorised into two groups: theformal and the informal sector. Generally, the Waste Management Department of the MunicipalCorporation in cities in India are the only formal stakeholders in the post-consumption wastepaper chain. The municipality is responsible for the collection, removal and disposal of garbageand sweepings from public roads, streets, foot-paths and lanes, and maintenance of dumpinggrounds (Hadker, 1995). Often, in developing countries, dumping or incineration is performedin an uncontrolled manner, resulting in high municipal costs. Recycling is rarely considered by theformal sector. The informal sector, which according to the International Labour Organisation(ILO) refers to those employers classified as own-account workers, unpaid family workers andthose “not classifiable by status”, collects and trades mostly unregistered waste materials(World Bank 1995). Various entrepreneurs play a role in the local supply of waste paper.
The main source of waste paper is households. They save their own waste paper which iseither sold to the buyer or to the Itinerant Waste Buyer (IBW). As this mainly involvesnewspapers and magazines, the households are also the main source for re-use. In additioninstitutions and factories participate in the informal paper cycle. This group includesgovernment departments, private companies and shops. Office boys or caretakers gather thewaste paper which is generated in the offices, and they sell it off to IWBs or buyers. The

CREED Working Paper Series No 5 8
collection of waste paper is performed by either waste pickers or IWBs. The waste pickers, themajority of whom are unskilled migrants, roam the streets and dumpsites to collect any type ofmaterial which they can sell to the buyer. The IWB is also mobile, but instead of picking wastefrom bins or dumpsites, goes from door to door by bicycle to buy the waste from households orshops. Since his materials have not yet been mixed with disposable waste, the quality is muchhigher than the waste paper gathered by the waste pickers (Ali et al. 1993); this implies that theIWB is a major supplier of re-usable paper.
Finally, the waste enters the trade sector, which despite the fixed location may still beconsidered an informal activity because the traded materials are mainly unregistered and thelabourers sorting out the waste belong to the non-wage employment. The buyers’ main role inthe paper cycle is to purchase from the above sources, sort out the waste, bundle it and sell itoff to the wholesaler. The role of the wholesaler is to accumulate the purchased material untilthe quantity is sufficient for transportation to the recycling plant. The main difference betweenthe wholesaler and the buyer is that the former is specialised in one specific type of material,whereas the buyer generally buys any type of waste which is offered. Also, the quantities dealtwith by the wholesalers are much larger than the buyers’ trade volumes. Occasionally,quantities are even sufficient for wholesalers to set up their own reprocessing factories.
A case study on the waste collection sector of Bombay
The collection of waste paper in India, mainly takes place in urban centres for obvious reasons:the amount of waste generated increases with increasing incomes and increasing population.Also the "throw-away" consumer behaviour is more manifest in cities. In addition, collection ofwaste is easier in cities as the population density is higher. Yet, this relation does not alwayshold. Traffic jams and high rise buildings can hamper the recovery and collection of waste.Also booming real estate prices makes it more difficult for waste traders to remain in the cityareas. In this case study, Bombay was selected because it is representative of other megacitiesin developing countries. Since reliable information on local waste recovery in developingcountries is lacking, several surveys were conducted in Bombay. A summary of the mostimportant findings of these three surveys is given in the following sections. Information on theother stakeholders in the waste paper collection cycle is retrieved from literature or othersurveys. The main objective of the surveys is to determine the relative contribution of thevarious entrepreneurs in the waste paper collection sector, and to analyse the performance ofthe entrepreneurs so that suggestions for improvement of the waste management in developingcities may be made. These data will be combined in the simulation model in a later section.
CREED Working Paper Series No 5 9
The Source and Collection of Waste Paper
The waste picker
Waste pickers contribute to solid waste management and to the supply of the recycling industrythrough the collection, sorting and selling of recyclable waste materials to buyers (Huisman1994). The individuals operating as waste pickers originate from various groups, such as run-away children, migrant women or unemployed labourers. Research on waste pickers is ratherscarce. In 1988, Gilhuis emphasised the role of waste pickers in Curitiba (Brazil). For Bogota(Colombia) it was estimated that 30,000-50,000 people earn from collecting recyclable waste(Hardoy et al. 1992). Huisman (1994) focused particularly on the position of female wastepickers in Bangalore (India). Furedy (1990, 1994) contributes by giving an overview of thesocial context of waste pickers in various Asian cities. The general conclusion of these studies isthat waste pickers play a significant role in the management of waste in developing countrycities.
A survey among waste pickers was conducted in order to facilitate quantification of theircontribution. In other words, how much of the supply of waste to the recycling industrydepends on waste pickers’ activities and how much landfilling is avoided? In order to representthe variations in areas worked, 60 waste pickers were interviewed casually1, in four types ofareas: a dump site, a residential area, an industrial area, and a commercial area. Additionally, 7group discussions2 were held to enable the respondents to talk more freely about their activitiesand the social conditions. The outcome of these surveys will be used in the flow model which isexplained in the coming sections. In addition, the possibilities for improving their performanceare considered. For this reason, a qualitative assessment is made.
Profile of the waste pickerOf the total number of 60 waste pickers interviewed, 23 were male and 37 were female. Sincerespondents were selected at random, we can infer that the waste picking workforce is notequally divided between males and females. Since waste picking is a transitory occupationrequiring no skills and resorted to by new immigrants to the city, it is seen as suitable for femalesand boys. This accounts for the bias in favour of females. Huisman (1994) confirms thisfinding.
The frequency distribution in figure 4 shows that 60% of the respondents were 25 years old oryounger. Of this young workforce almost 17% of the sample were children of 15 years or less.The drop-out rate from the workforce, particularly for males is pronounced after the age of 35.Again this outcome coincides with Huisman's study (1994) as well as NEERI (1995). Anexplanation for this phenomenon is that men find waste picking too inferior. Another reasoncould be that, although both boys and girls enter the trade at an early age, boys "graduate" into
1 Casual selection implies that the interviewer operates in a specific area and randomly selects recognised wastepickers for an interview.2 The group discussions were held among waste pickers who were already interviewed and waste pickers whojoined their friends.

CREED Working Paper Series No 5 10
other occupations, while women tend to stay on. Women perceive the advantages of bringingtheir children along with them and the freedom to decide upon their own hours of work.
Figure 4. Number of male & female waste pickers according to sex and age
0
5
10
15
20
25
<9 10 to 15 16 to 34 35 to 50 >50
age
Nu
mb
er
of
wa
ste
pic
ke
rs i
n s
am
ple
male
female
Practically all the respondents were migrants. Almost 52% originated from Maharashstra State,of which Bombay is the State capital. 38% of the interviewed waste pickers came from TamilNadu. Half of the respondents were originally from rural areas, while only 7% came from otherlarge cities. The illiteracy rate among the respondents was 75%. Only 10 waste pickers hadhad some kind of formal schooling, between Classes 4 and 9. Clearly, waste picking is atransitory occupation of new migrants who have little chance of finding other occupations.Another important finding was the dominance of Hindus in waste picking. Only one Muslim andone Buddhist worker were registered in the survey. However , Muslims were more prevalent inthe buyers and the wholesalers surveys. This indicates that it is not necessarily the prescriptionof the Islamic religion which prevents Muslims from working with waste. A more likelyexplanation could be the stronger back-up of the underprivileged in the Muslim community,which makes resorting to waste picking unnecessary. Also the reluctance of Muslim women togo around in public places might be an additional explanation.
The social profile of the respondents was diverse. However, some patterns in social conditionswere discernible A large majority of the waste pickers lived with their families and contributedto household income. It was observed that in waste picking families, young childrenaccompanied their mothers from an early age. Only the male workers complained about policeharassment. This particular vulnerability could also explain the lack of older male waste pickers.Common forms of harassment included extortion, verbal and physical abuse, false accusation incases which occasionally led to imprisonment.
The female waste pickers did not complain of any harassment by the police. Although they didnot confess to taking drugs, group discussions showed that a majority of the older male wastepickers and a few female waste pickers were addicted to drugs and alcohol. The women wastepickers complained about their husbands being addicted to alcohol. The common health
CREED Working Paper Series No 5 11
hazards that waste pickers faced were directly related to the unhealthy conditions in which theyworked and the unhygienic and sometimes hazardous materials which they handled. Commonailments included viral infections, respiratory disorders, and skin infections. Cuts and woundsdue to sharp objects in the waste handled were common.
Performance of the waste pickerAll the respondents operated regularly in a particular territory. Trespassing into territories ofothers rarely occurred. A new arrival relied on a "senior" waste picker to whom he or she wasattached for some time before operating individually. All the waste pickers said they sorted thematerials before selling them. The sorting usually took place near the buyers’ shop, just beforethe transaction.
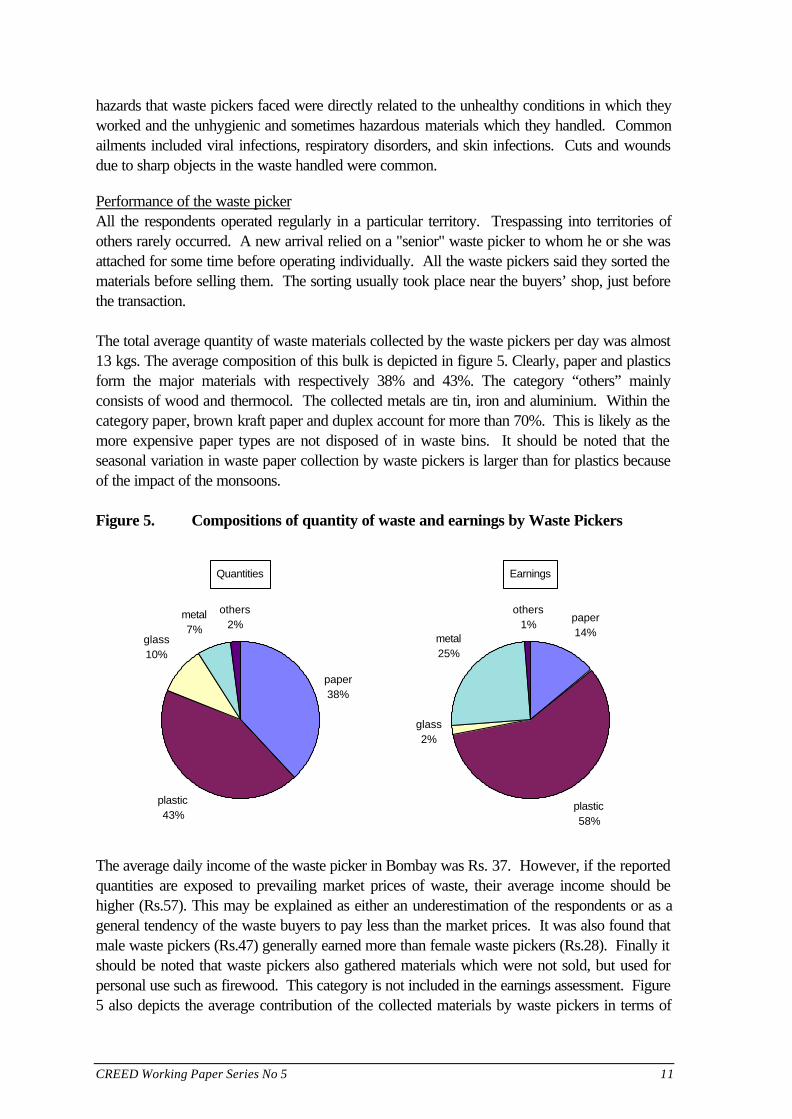
The total average quantity of waste materials collected by the waste pickers per day was almost13 kgs. The average composition of this bulk is depicted in figure 5. Clearly, paper and plasticsform the major materials with respectively 38% and 43%. The category “others” mainlyconsists of wood and thermocol. The collected metals are tin, iron and aluminium. Within thecategory paper, brown kraft paper and duplex account for more than 70%. This is likely as themore expensive paper types are not disposed of in waste bins. It should be noted that theseasonal variation in waste paper collection by waste pickers is larger than for plastics becauseof the impact of the monsoons.
Figure 5. Compositions of quantity of waste and earnings by Waste Pickers
Quantities
paper38%
plastic43%
glass10%
metal7%
others2%
Earnings
paper14%
plastic58%
glass2%
metal25%
others1%
The average daily income of the waste picker in Bombay was Rs. 37. However, if the reportedquantities are exposed to prevailing market prices of waste, their average income should behigher (Rs.57). This may be explained as either an underestimation of the respondents or as ageneral tendency of the waste buyers to pay less than the market prices. It was also found thatmale waste pickers (Rs.47) generally earned more than female waste pickers (Rs.28). Finally itshould be noted that waste pickers also gathered materials which were not sold, but used forpersonal use such as firewood. This category is not included in the earnings assessment. Figure5 also depicts the average contribution of the collected materials by waste pickers in terms of

CREED Working Paper Series No 5 12
earnings. Whereas paper was important in terms of volume, the earnings derived from paperwere not significant. Because of the generally lower price of waste paper and low quality of thewaste paper collected from the bins, paper only contributed 14% to the income of the wastepicker. Plastic on the other hand contributed 58% of the total income. Typically, metals whichonly accounted for 7% of the collected materials in terms of volume, generated 25% of income.This explains the habit of waste pickers to burn waste at the dumpsites to recover the metalsfrom the ashes.
Various correlation tests were performed in order to find variables which determined the incomeof the waste picker. In view of the unskilled nature of the work, it was expected that therewould be a correlation between hours of work and earnings. However, the test rejected thisnotion. Also the correlation between age and earnings was negligible. Even the area ofoperation did not have an impact on the income levels. This suggests that waste picking is anactivity which requires no particular skills and which is considered to be a survival strategy:waste pickers work until enough income is generated to buy the basic commodities. This issupported by the fact that only 7% of the waste pickers saved an appreciable amount of theirincomes.
Almost 72% of the respondents reported seasonal variation in the quantity as well as the qualityof waste collected. During the monsoons less waste was collected; moreover it was of a lowerquality. Because lower quality means lower quantity, traders anticipated this slack period bystocking material and hence lower prices were apparent during the monsoons.
The respondents were also asked how they reacted to price changes. In the case of increasedprices of waste materials, only one third of the waste pickers behaved predictably bymaximising income. Most of the remaining waste pickers were not price-sensitive and collecteduniform quantities. Only one respondent claimed to collect less with higher prices. More than71% of the waste pickers had regular transactions with one buyer while 29% of the wastepickers sold materials to 2-3 buyers. This is a strong indication that there exists a largedependency on a particular buyer. The buyer attempts to enlarge his relatively small margin bykeeping the prices as low as possible. In times of inflation, rising prices, poor weather andcompetition the waste pickers have to suffer the consequences of the decline in their income.The buyer binds them for longer periods of time through loans and other facilities.
Male respondents particularly considered waste picking as a temporary occupation. Theypreferred to switch to other manual labour such as construction work or street vending, ifopportunities arose. The majority of the female workers preferred waste picking because of theindependent nature of the work. Also, they claimed that waste picking was more rewarding.Coolies and construction workers earned respectively Rs.20 and Rs.25 per day (Huisman1994). This difference in attitude between male and female is supported in part by the numberof years the respondents had worked in waste picking. While males had an average experienceof 7 years, females had 9 years experience.
Before the contribution of waste pickers to the SWM in Bombay and the supply to the papercycle in India may be analysed by integrating the findings in the material flow model, severalcoefficients need to be defined. First, it is necessary to know how many waste pickers are

CREED Working Paper Series No 5 13
required to collect a specific quantity of waste paper. According to the survey, one wastepicker collected approximately 1,400 kgs of waste paper per year if the negative impact of themonsoon is taken into account. This means that for the supply of 1,000 tonnes of waste paperderived from the street bins and the dumpsite, 714 waste pickers need to work for one year.The value added of this activity is completely determined by the weighted average of prices ofthe waste paper which is supplied by the waste picker. Because of the low quality of this wastepaper, the average price is only Rs.1,610 per tonne. The contribution to the SWM in Bombaygoes beyond the collection of waste paper - plastics, metals and other recyclable waste need tobe taken into account in this respect. The findings showed that a waste picker collectedapproximately 4,000 kgs of waste per annum. It is assumed that the major share of this wasteis collected from street bins.
One important social aspect of the survey was the number of children working in this type ofactivity. Child labour is a complex issue. Often, poor households have no choice but to sendtheir children to work. Also, children who work in waste picking often have no families. Thesurvey revealed that it is often boys who survive without families, while most girls accompaniedtheir mothers and thereby supported the family income. Overall, 18% of the respondents were15 years of age or younger.
A final estimation, required for the model is the number of waste pickers operating in Bombay.No official figures on the total numbers are known. Attempts to estimate numbers wereperformed in Bangalore (25,000 waste pickers from a population of 4.5 million) (Huisman1994), and in Karachi (20,000 waste pickers from a population of 9 million) (Ali et al. 1993).This implies a ratio of one waste picker to between 200 and 450 citizens. Based on this ratio,Bombay would have about 25,000 to 50,000 waste pickers. However, the reliability of such anextrapolation is limited. Based on the surveys, it could be estimated that Bombay employsaround 35,000 waste pickers. In terms of volume, 38% (13,300 waste pickers) of their effortsis concentrated on waste paper.
Other stakeholders in the supply and collection of waste
The remaining stakeholders of the group of suppliers to the waste trade sector will be describedin this section. Given the diversity of this group, no survey was undertaken. Being theconsumer of newly produced and re-usable paper and the only source of local waste paper,households, factories and institutions performed an equal role in the paper cycle in Bombay.Therefore, these stakeholders will be discussed simultaneously. IWBs, however, perform adifferent role and therefore they will be discussed separately.
Households, factories and institutionsThe official per capita consumption of paper in India is 4 kg per year (Rao 1995). To obtain anidea of the volume of the waste paper flow in Bombay, this official figure must be adjusted.First, it does not provide a realistic representation of the true consumption in Bombay because itis the average per capita consumption of paper for India. The rural population, which stillaccounts for almost three quarters of the population, is predominantly illiterate (WorldDevelopment Report 1995). Second, the amount of re-used paper is ignored in this estimatebecause the trade of waste paper for re-use is not registered. Finally, data on volume andcomposition of the waste in Bombay demonstrates that the per capita disposal of paper is at
CREED Working Paper Series No 5 14
least 13 kgs per year (Hadker 1995). This figure excludes the waste paper which is recoveredfor the purpose of re-use. On the basis of these facts, it is estimated that the averageconsumption of newly produced paper in Bombay is 18 kgs. Also, it is assumed that per capitare-use of waste paper for each Bombay citizen is approximately 2 kg. The total “informal” percapita consumption is therefore determined at 20 kg per year.
The post-consumption stage of paper in households and institutions can be divided into threecategories. The first category is the paper that is diverted from the paper cycle for other reasonsthan disposal, such as sanitary paper and long term storage. Obviously, sanitary paperconsumption is more important in the North than in the South. Therefore, sanitary losses areignored in Bombay. Storage, on the other hand, is an important leak in the paper cycle. Giventhe conservative attitude towards disposing of books, magazines and reports, this ratio issignificant in India. The second category includes the waste paper which is directly or indirectlysupplied to the waste trade sector by households and institutions. From the buyers survey it wasestimated that the buyer purchased approximately 50% of the traded materials from households,institutions, and factories. The IWB is fully dependent on households and institutions. The thirdcategory is the waste paper which, together with the other waste, is disposed in the street bins.Before this waste eventually ends up at the dumpsite, waste pickers will select out variousvaluable materials. This reduces the volume and changes the composition of the waste.Eventually 1.67 million tonnes of institutional and household waste paper were landfilled by themunicipality in Bombay in 1992-93 (Hadker 1995). Given the average per capita wastegeneration of 0.5 kg per day which aggregates to 1.96 million tonnes for Bombay, and anapproximation of 35,000 waste pickers in Bombay, it can be assumed that 8% of the post-consumer waste is recovered by waste pickers and 7% of the post-consumption waste isburned or remains uncollected. Although this figure is rather uncertain, more accurate estimatescould not be derived from the available data.
Finally, the question remains of how to increased household waste separation. There have beena number of studies by behavioural psychologists to examine the motivation of participants inrecycling schemes and the effects of different kinds of incentives on the rate of participation.Urban citizens in the US were found to participate mainly for personal satisfaction associatedwith environmentally responsible behaviour. Yet, financial incentives such as direct charges forwaste management services were also found to be necessary to motivate the lessenvironmentally motivated citizens (Gandy 1994). Given cultural and economic dissimilarities,differences in motivation of citizens in developing and industrialised countries seem to berational. A survey conducted among households in Bangalore revealed that the reasons forseparating and selling waste were not purely economic (Furedy 1994). Most householdsreplied that it was a tradition or habit. Nevertheless, 76% of the respondents also mentionedthat “waste trading was important to their household, since the money they derived from sellingthe materials was useful”. It should be taken into account that it is generally not the head of thehousehold who takes care of the waste but the servant. For this group, the economic criteriaare more important than for middle or higher class families who consume the paper. The maycan be said for office-boys and caretakers working for institutions. It may be concluded that,although it is difficult to quantify, households and institutions make a significant contribution tothe paper cycle in supplying waste paper

CREED Working Paper Series No 5 15
Although waste separation at the source is a tradition in most families and offices, efficiency canstill be improved through environmental awareness campaigns. It should be realised, however,that overall economic development may also have counteractive effects on waste recovery. Thedanger exists that growing urbanisation will force the buyers to move from the residential centresto the industrial suburbs. As distances increase, the motivation of the households and institutionsto separate and sell the waste diminishes. This trend may have a negative impact on therecovery rate (Furedy 1990).
IWBsIWBs form an important part of the waste recycling system in Indian cities. They go around thecity on bicycles or even on foot buying recyclable waste from houses, institutions, offices andother sources. The collected recyclable waste, mainly consisting of paper, plastic, glass bottles,and metal scrap, is purchased from households and institutions and sold to buyers. The IWBsare important for the paper cycle as they obtain waste at source before it is mixed, damaged orcontaminated. Because the IWBs cover a different segment of the waste recovery sector, theyare not in competition with waste pickers (Ali et al. 1996). Most of them are independentoperators, while some are employees of the buyers on whom they are dependent for financialassistance. The IWB collects about 40 kgs of recyclable waste per day which generates a dailyincome of Rs.50-60 (Furedy 1994). Although the IWBs are common in most Indian cities,their presence in Bombay is minimal. Whereas their contribution to the supply of waste paper inBangalore accounted for 19% (Beukering 1994), the field survey indicated a contribution of lessthan 4% by the IWBs in the Bombay waste paper supply. This can be explained by the factthat, due to the high rise housing in Bombay, it may be very difficult for the IWBs to access theresidential and commercial areas and for door-to-door collection. Also the heavy trafficimpedes the performance of the IWBs.
The municipalityThe Solid Waste Management (SWM) in Bombay is undertaken by the Municipal Corporationof Greater Bombay (MCGB). The annual growth in waste generation in Bombay of 6.2% isalmost four times as large as the population growth of 1.6%. Because of this exponentialincrease in solid waste, the total budget spent on SWM is simultaneously growing. At present7% of the MCGBs budget is spent on SWM (Hadker 1995).
The solid waste department of MCGB employs 26,239 people. This implies that MCGBrequires more than 9 employees to process 1,000 tonnes in a year. The total wage bill isaround Rs.992 million, thus for labour only, SWM costs Rs.348 per tonne of garbage. Alsotransport is costly: assuming that about 780 trucks operate each day, covering a distance of 100kms, the total daily consumption of diesel exceeds 2,600 litres. This alone costs around Rs.93million per year. The overall budget of the SWM department in Bombay was Rs1,273 millionin 1992-93, which means that the total costs of managing one tonne of garbage is Rs.447.Budgets of solid waste departments in developing cities rarely reflect full costs (Cointreau,1996). One may consider this estimate to be slightly undervalued as the 170 hectares of landused for dumpsites in Bombay could be priced at Rs.1.5 billion (Hadker 1995). Theseopportunity costs are ignored. Also indirect costs such as related staff in other departments arenot taken into account. As opposed to the entrepreneurs in the informal sector, the economicpotential of solid waste is rarely exploited by municipalities. Obviously, the most valuable

CREED Working Paper Series No 5 16
materials have already been harvested before it waste reaches the dumpsite. Attempts in Indiato convert solid waste into compost have not been very successful until recently. Too often"Western technologies" are applied which are not suitable for Indian conditions (Baud &Schenk 1994). Although experiments are conducted to develop decentralised composting andenergy recovery of solid waste, these new methods have not been applied on a large scale.

CREED Working Paper Series No 5 17
Table 1. Waste volume and composition for different stages in Bombay 1993 (inKilo Tonnes, KT)
Material disposed (bin) recovered burn/uncollected
collected MCGB
in KT % in KT % in KT % in KT %
organics 1136 58 3 2 3 2 1130 68
dust 292 15 0 0 0 0 292 18
paper 197 10 61 38 51 38 85 5
plastic 210 11 69 43 57 43 83 5
glass 58 3 11 7 10 7 38 2
metal 41 2 16 10 13 10 12 1
others 27 1 0 0 0 0 27 2
Total 1961 100 160 100 134 100 1667 100
source: compiled from Ali et al.1993, NEERI 1994 and Hadker 1995
The volume and the composition of the waste changes during the process of collection anddisposal. Waste pickers scour the street bins to extract valuable material. Table 1 demonstrateshow much of each material is recovered from the bins in Bombay and how the compositionalters accordingly. This change in volume and composition is an important element whenevaluating environmental impacts, but also to verify the contribution of waste pickers to the solidwaste management system. According to the table, it can be concluded that waste pickers playan important role in the further reduction of the post-consumption waste.
The waste which is eventually left will be either landfilled or burned. Waste burning is carriedout both by the formal and informal sector. The main reason for the municipality to burn wasteis to reduce the volume, particularly for the uncollected waste. Sometimes waste burning is alsoperformed by waste pickers in order to select the metals which are left in the ashes. Obviously,this activity is very damaging to the environment. An air-pollution study in Manila indicated thatrefuse burning was the second major cause of health damage through air pollution (Larssen etal. 1996). Energy recovery does occur at a household level. Sometimes note books andmagazines are used to heat traditional boilers. With continuous uncontrolled waste dumping andlandfilling, the quality of the land deteriorates. As a result, underground water will becomepolluted through leaching of hazardous substances (Hadker 1995).

CREED Working Paper Series No 5 18
The Waste Paper Trade
The buyers
Buyers differ from the suppliers since they operate from a fixed location. They also trade allrecyclable material. Their knowledge of materials and related prices is considerable. Thisknowledge ensures profitability since the margin between buying and selling price is generallylow. In order to understand the performance of the buyer a survey was undertaken across 37traders. As in the previous sections, the profile, the performance and the coefficients for themodel are described.
Profile of the buyerThe majority of the buyers interviewed owned a compound of operations. 40 % of therespondents operated from rented units. The religious representation differed from the wastepickers survey: the composition of 65% Hindus, 19% Muslims and 13,5% Jains was more inline with the average distribution of the Indian population. The buyers were also bettereducated than the waste pickers: Of the 73% of the buyers that had some sort of education,63% had enjoyed education until the primary level, 26% up to the secondary level, while 7%were educated up to undergraduate level. Half of the respondents entered the waste tradingbusiness because it was already a family activity. Compared to the wholesalers, buyers enteredthe cycle quite recently: 35% of the units started business after 1985 and 27% of the units wereestablished between 1976 and 1985. The remainder of the units were set up before 1976.
The most important suppliers of waste to the buyers were waste pickers (47%) and households(42%). Smaller amounts were supplied by itinerant waste buyers (4%), factories (4%) andinstitutions (3%). An essential difference between buyers and wholesalers was their locationalpreference. While most wholesalers were located in commercial or industrial areas, buyerspreferred (68%) residential areas, probably to minimise the distance to their suppliers; 13 unitswere located randomly. The reasons given by the respondents for a certain location wereproximity to residence, suppliers and customers, as well as good facilities and no interferencefrom the government.
The scale of the area of operation was relatively small, consisting of 230 square feet (sq ft) onaverage with a range of between 50 and 1200 sq ft. This feature indicates that the averagebuyer dis not have much space to keep stocks. The average stock kept by a buyer was 1.34tonnes per week. The majority of the buyers worked 9 to 12 hours a day and operated 6 daysa week.
Performance of the buyerThe average buyer traded 39 tonnes of recyclable waste every month, with a slack periodduring the monsoons between June and September. The waste traded mainly consisted ofpaper, plastic, metal and glass. The composition in volume and value terms is illustrated in figure6. Although waste paper is the most notable commodity in terms of volume (53%), in valueterms plastic is more important. The seasonal impact is taken into account, as these are annualaverages.

CREED Working Paper Series No 5 19
Figure 6. Composition of the quantity and gross profits of the buyer
Quantity
paper53%plastic
36%
metal8%
glass3%
Gross Profit
paper32%
plastic36%
metal31%
glass1%
The average total turnover of a buyer was about Rs.100.000 per month, with an averageturnover of Rs.32,000 per month for waste paper. For paper, plastic and metal the gross profitper tonne was respectively Rs.1,390, Rs.1,767 and Rs.6,684. The average gross profit wasRs.22,500 per month of which Rs.7,290 gross was from paper. In order to determine the netprofits, other costs are estimated. For employment costs, it was found that the average buyerunit employed 1.2 workers, excluding the owner. The average wage bill of a buyer unit, with anaverage wage of Rs.775 per month per employee, was Rs.900 per month. The averageelectricity bill and water bill only accounted for Rs.167 and Rs.27 per month respectively.Some entrepreneurs also indicated that they paid a certain amount of “hafta” - these areinformal costs paid to the authorities to obtain permission to maintain a business. Only 5% ofthe respondents paid taxes. This cumulates to a limited amount of variable costs of aboutRs.1,100 per month (excluding tax and hafta). Thus variable costs seem not to be veryimportant for the performance of the buyer.
Price fluctuations of recyclable waste, on the other hand, had a major impact on the buyer’sperformance. It should be noted, however, that the cost of the property is not taken intoaccount. Given the high land value in Bombay, this may have a considerable impact. Despitethe relatively high gross profit rates, there was fierce competition between buyers: 86% of thebuyers experienced the competition from other buyers as a major threat to their performance.The majority of the buyer units (62%) were located in areas with a high concentration of otherbuyer units. As a result, several buyers (18%) consulted other traders in order to fix prices andnegotiate on territories.
To model of the collection sector in Bombay, several parameters need to be determined. Inorder to make a clear assessment of the total impact of the buyers of waste in Bombay,knowledge of the number of buyers operating in Bombay is crucial. Based on the average

CREED Working Paper Series No 5 20
quantity of waste paper traded by a buyer in the paper cycle and the total volume of wastepaper traded, it was estimated that approximately 360 buyers operated in Bombay. It isassumed that buyers themselves do not supply to factories, but to wholesalers only.
The wholesalers
The distinctive features of the wholesalers were that they traded one type of waste, operated ona larger scale than buyers, and supplied directly to the paper mills. This section is based on datacollected during a survey among 37 waste paper wholesalers.
Profile of the wholesalersThe majority of the respondents owned their company and the place of operation, while 35%operated from a rented location. This group comprised a relatively high representation ofMuslims: 51 % Hindu, 43% Muslim and 3% Jain. The educational background of thewholesalers was generally higher than that of the buyers with 35 % enjoying primary level, 27 %secondary level, 14% undergraduate level and 3% graduated. The remaining 19% wereexposed to some sort of informal education. More than half of the respondents entered thetrade because it was traditionally practised by the family, while 32% claimed to have entered thewaste trade for economic reasons. 11% of the wholesalers were former buyers and hadexpanded their businesses. The majority of the companies were established before 1985 (92%)of which 26% were established before 1965. There were not many recent entries to the sector.
The most important suppliers of waste to the wholesalers were buyers (39%), waste pickers(20%), factories (11%), institutions (23%), IWBs (5%) and households (2%). The location ofthe companies was generally (41%) in a commercial area, while industrial areas (24%),residential areas (24%) and mixed areas (11%) were less popular The reasons given by therespondents for these locations were the short distances to customers and suppliers, living in thearea themselves and the existence of good facilities in the neighbourhood. Most of thewholesalers (78%) were located in an area where other wholesalers were active, including thosespecialising in plastics, glass and metals. The surface of the operating area varied from 50 to400 sq. metres, with most wholesalers (62%) working from a surface area of less than 100 sq.metres.
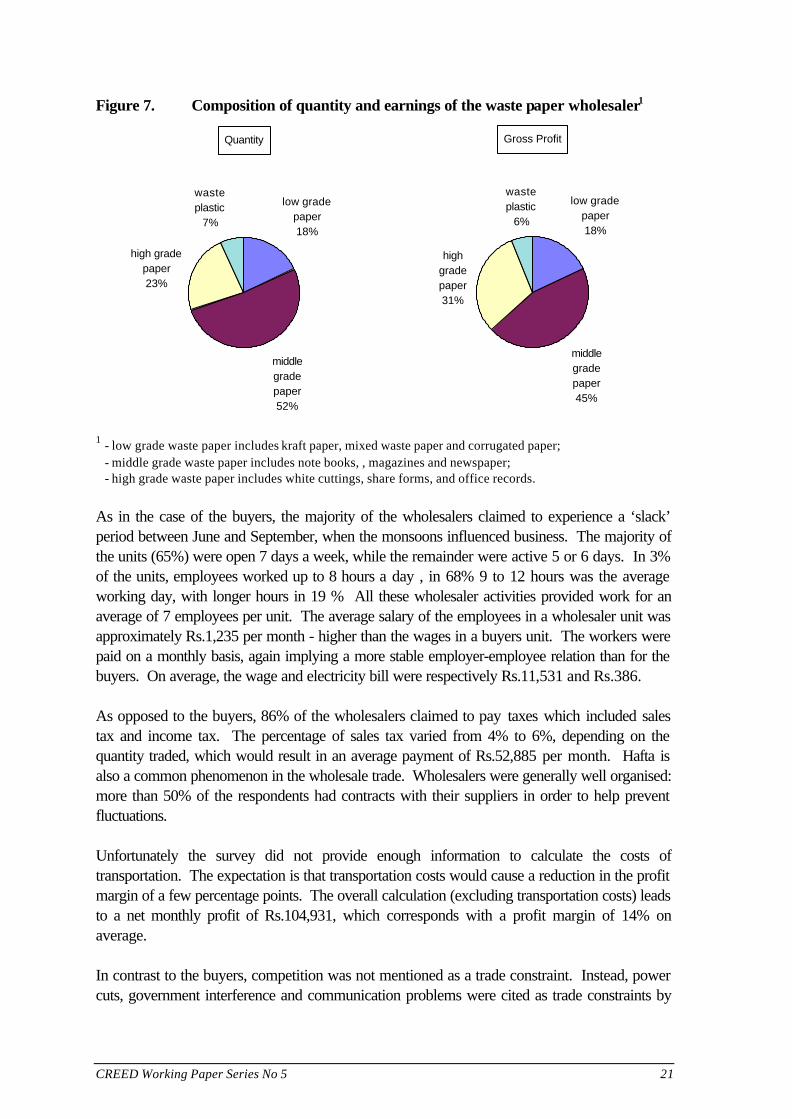
Performance of the wholesalersThe average wholesaler had a monthly turnover of Rs.767,737. The monthly amount of wastetraded by an average wholesaler was 382 tonnes, making the scale of a wholesaler unit muchlarger than the average buyer unit. The same applies to the gross profit which totalledRs.170,076 a month, representing 22% of average turnover. Figure 7 illustrates thecomposition of the average waste paper wholesale trade. Most wholesalers traded in limitedamounts of waste plastic. Middle grade waste paper constituted the major commodity for thewholesaler, the source for which was generally from households and institutions. The high gradepaper, mainly comprised of white cuttings, originated from factories or printers. As can be seenfrom the distribution of gross profit this category provides larger profit margins. For example,the gross profit on white cuttings is Rs.3,025 per tonne while newspaper only generates a profitof Rs.850 per tonne for the wholesaler.
CREED Working Paper Series No 5 21
Figure 7. Composition of quantity and earnings of the waste paper wholesaler1
Quantity
low grade paper18%
middle grade paper52%
high grade paper23%
waste plastic
7%
Gross Profit
low grade paper18%
middle grade paper45%
high grade paper31%
waste plastic
6%
1 - low grade waste paper includes kraft paper, mixed waste paper and corrugated paper; - middle grade waste paper includes note books, , magazines and newspaper; - high grade waste paper includes white cuttings, share forms, and office records.
As in the case of the buyers, the majority of the wholesalers claimed to experience a ‘slack’period between June and September, when the monsoons influenced business. The majority ofthe units (65%) were open 7 days a week, while the remainder were active 5 or 6 days. In 3%of the units, employees worked up to 8 hours a day , in 68% 9 to 12 hours was the averageworking day, with longer hours in 19 % All these wholesaler activities provided work for anaverage of 7 employees per unit. The average salary of the employees in a wholesaler unit wasapproximately Rs.1,235 per month - higher than the wages in a buyers unit. The workers werepaid on a monthly basis, again implying a more stable employer-employee relation than for thebuyers. On average, the wage and electricity bill were respectively Rs.11,531 and Rs.386.
As opposed to the buyers, 86% of the wholesalers claimed to pay taxes which included salestax and income tax. The percentage of sales tax varied from 4% to 6%, depending on thequantity traded, which would result in an average payment of Rs.52,885 per month. Hafta isalso a common phenomenon in the wholesale trade. Wholesalers were generally well organised:more than 50% of the respondents had contracts with their suppliers in order to help preventfluctuations.
Unfortunately the survey did not provide enough information to calculate the costs oftransportation. The expectation is that transportation costs would cause a reduction in the profitmargin of a few percentage points. The overall calculation (excluding transportation costs) leadsto a net monthly profit of Rs.104,931, which corresponds with a profit margin of 14% onaverage.
In contrast to the buyers, competition was not mentioned as a trade constraint. Instead, powercuts, government interference and communication problems were cited as trade constraints by
CREED Working Paper Series No 5 22
the wholesalers. 16% of the wholesalers reported frequent contact with competitors forterritory and price fixing. This suggests that there exists oligopolistic power among certainwholesalers. The total number of wholesalers can be estimated by dividing the total volume ofwaste paper traded by the average trade of a waste paper wholesaler. According to thisapproach Bombay appears to have around 67 wholesalers, implying a ratio of 7 buyers forevery wholesalers. Estimates in Bangalore have revealed a slightly higher ratio (1:10) (Furedy1994).

CREED Working Paper Series No 5 23
The Network Flow Model for theWaste Paper Supply in Bombay
To structure the waste paper flow of Bombay, a simulation model is developed. The mainpurpose of the model is to asses the current situation for economic, social and environmentalcharacteristics and to analyse the impacts of changed circumstances or policy measures. Threemain scenarios are presented: a baseline scenario, a scenario with the introduction of a Westernrecycling system, and a scenario in which the current informal system is improved. Thesescenarios are elaborated in the following sections. Crucial to the success of a particularmanagement option is the willingness of the Bombay public to separate waste. Because thisinformation is not available, a range (5) of exogenously determined public responses aresimulated. Based on this exercise, it is possible to identify the optimal management measuresunder varying responses from the public. Including the baseline, 11 scenarios are assessed.
The time span of the analysis runs from 1993 to 2010. This period is sufficiently long todemonstrate the short and mid term effects of certain policy measures. Extension to the timehorizon would be inappropriate because extensive societal changes would negate the underlyingassumptions. The results of the analysis will first be presented of each individual year. Giventhe uncertainties regarding the data on the informal recovery sector and the performance of theformal waste management, the reliability of the model is limited. Relative price changes ortechnological developments are not taken into account. Therefore, the outcomes of this modelshould be solely interpreted as an illustration of the possible effects of the simulated policies.
Finally, the outputs of the simulation model will be evaluated by application of multicriteriaframework. No attempt is made to internalise the intangible effects. Economic valuation ofthese effects lies beyond the scope of this study.
The simulation model
A graphic representation of the model and its boundaries is given in figure 3. Note that theindustrial recycling process of waste paper is ignored in this model. The evaluation criteria ofthe simulation model respectively represent employment (ye), environmental impact (yi), incomeinequality (yp) and public costs (yy) within the waste paper cycle. These criteria are driven bythe physical allocation of waste paper after consumption. The configuration of this allocation isspecified by:
yn = fn (x) = fn(xs, xb, xl, xu, xi, xw), n = e, i, p, y
The variable x is the vector of six types of physical allocations of waste paper: storage (xs),burning (xb), landfill (xl), re-use (xu), informal recycling (xi) and Western-style recycling (xw). Inthe simulation the waste paper allocations are constrained within:
A = {xs, xb, xl, xu, xi, xw}

CREED Working Paper Series No 5 24
where
∀ x ∈ A, x ∈ S = { 0 � x � X; xs + xb + xl + xu + xi + xw = X }
A represents the constraint set for the number of scenarios which are simulated. S represents theconstraint set of the waste paper cycle. These constraint sets are described in the coming sections.A specification of the model is presented in appendix 1. The four evaluation criteria provide ageneral understanding of the economic, social and environmental aspects of the waste paperrecovery cycle.
Total employment: Employment is expressed in labour-years. The allocation of waste paperdetermines the composition of the actors involved in the waste paper recovery cycle. These actorsinclude households, institutions, factories, waste pickers, IWBs, buyers, wholesalers, municipaldisposal workers, and municipal recyclers; households, institutions and factories are excluded fromthe workforce because collection of waste paper forms a negligible part of their productive time.Because the model is limited to the waste paper cycle, the employees of the waste managementdepartment of the Bombay municipality (MCGB) are included only for the amount of waste paperwhich they collect. Similarly, waste pickers, buyers and wholesalers are included in the employmentcalculation for the part of their time they spend on the collection of waste paper. It should be kept inmind that the total group of people that depends on waste collection is much larger than theemployment figure calculated in the model because the other waste flows are ignored. Formally the“employment” criteria is:
y ee a ta
= ∑ , (1)
where ea,t denotes the number of persons employed in a certain type of work a in period t. Adetailed description of the employment function is given in appendix 1.
Environmental impact: The environmental impact of the recovery sector derives from transport ofcollected or disposed waste paper, burning of waste paper and the landfilling of solid waste. Notethat burning is different from incineration: it is only practised to reduce volume, no energy isrecovered. As mentioned, the indirect effects of waste paper recovery such as savings on industrialenergy and preventing deforestation, are excluded. To calculate the environmental impact,environmental indices are calculated based on the methodology presented in Weaver et al. (1995)(see appendix 2). First, the emissions generated by the processes in the waste paper recovery cycleare translated into six environmental problems (global warming, human toxicity, ecological toxicity,photochemical oxidation, acidification, nitrification and solid waste). Next, assuming equalimportance of the six environmental problems, environmental indices are designed for each process.These indices on a per unit bases are presented in table 2. Consequently, for each scenario in thewaste paper cycle an environmental score is generated. Formally, the environmental” criteria is:
y ii j tj
= ∑ , (2)
where ij,t denotes the environmental impact of a process j in period t. A detailed description of theenvironmental function is given in appendix 1.

CREED Working Paper Series No 5 25
Table 2. Environmental indices for the processes in the waste paper recovery sectorin Bombay
unit eco-index
transport by truck per kg/km 0.0285
waste paper burning per kg 10.7270
landfilling per kg 7.6930
source: based on Virtanen and Nilsson 1993
Income inequality: In order to use the variable income distribution as a social indicator, the Gini-concentration ratio is calculated which is a numerical measure of overall income inequality (seeappendix 5) (Gillis et al. 1987). The theoretical range of the Gini ratio is from zero (perfectequality) to one (perfect inequality). The group which is considered in this context excludeshouseholds and institutions. Included in the calculation of the Gini ratio is the group of people thatloose their jobs. Formally the “income distribution” criteria is:
y fp = ( γt) (3)
where γ denotes the Gini-coefficient of a certain allocation of waste paper in period t. A detaileddescription of the income inequality function is given in appendix 1.
Public costs: Public costs for MCGB for the collection waste paper includes the wages of the civilservants, the costs of petrol and depreciation costs of the SWM equipment. In the case of theintroduction of a Western waste paper collection system, the public costs will increaseproportionally with the amount of collected waste paper by the municipality. Formally, the “publiccosts” criteria is:
y cy j tj
= ∑ , (4)
where cj denotes the public costs of a certain policy option j in period t. A detailed description ofthe public cost function is given in appendix 1.
Constraints
Consumption: Consumption is considered to grow with income and population. As explained,paper and paperboard consumption in Bombay is considered to be 20.4 kg per capita in the firstperiod. The annual combined growth rate of population and income is estimated to be 5.91%(NEERI 1994). It is assumed that the sum of the post-consumption allocations (Σxj) in period t isequal to the total consumption in Bombay over the period in Bombay. The definition function of thegrowth path of the total consumption and the sum of the post-consumption is:
Xt = 20.4 ⋅ (1.0591)t (5)
where Xt denotes the total consumption of paper in Bombay in period t.
Recovery: For reasons of long term storage, sanitary losses and technical limitations, the maximumrecovery rate is 90% of the total consumption (Virtanen & Nilsson 1993).

CREED Working Paper Series No 5 26
(xu,t + xr,t + xw,t) < 0.9 Xt (6)where xu,t denotes waste paper recovery for re-use, xr,t denotes informal waste paper recoveryfor recycling, and xw,t denoted formal recovery for recycling in period t.
Reuse: With growing income, reuse of waste paper declines. Quality demands of societyincrease so that, for instance, newspapers are no longer considered hygienic packaging material.Therefore, the share of waste paper which is diverted for reuse is assumed to halve over theperiod from 1993 to 2010. This implies the total volume of re-used waste paper (xu,t) will growproportionally less (1.67%) than the volume of paper consumption (5.91%) each year. This isdenoted as:
xu,t = xu,t-1 * 1.0167 (7)
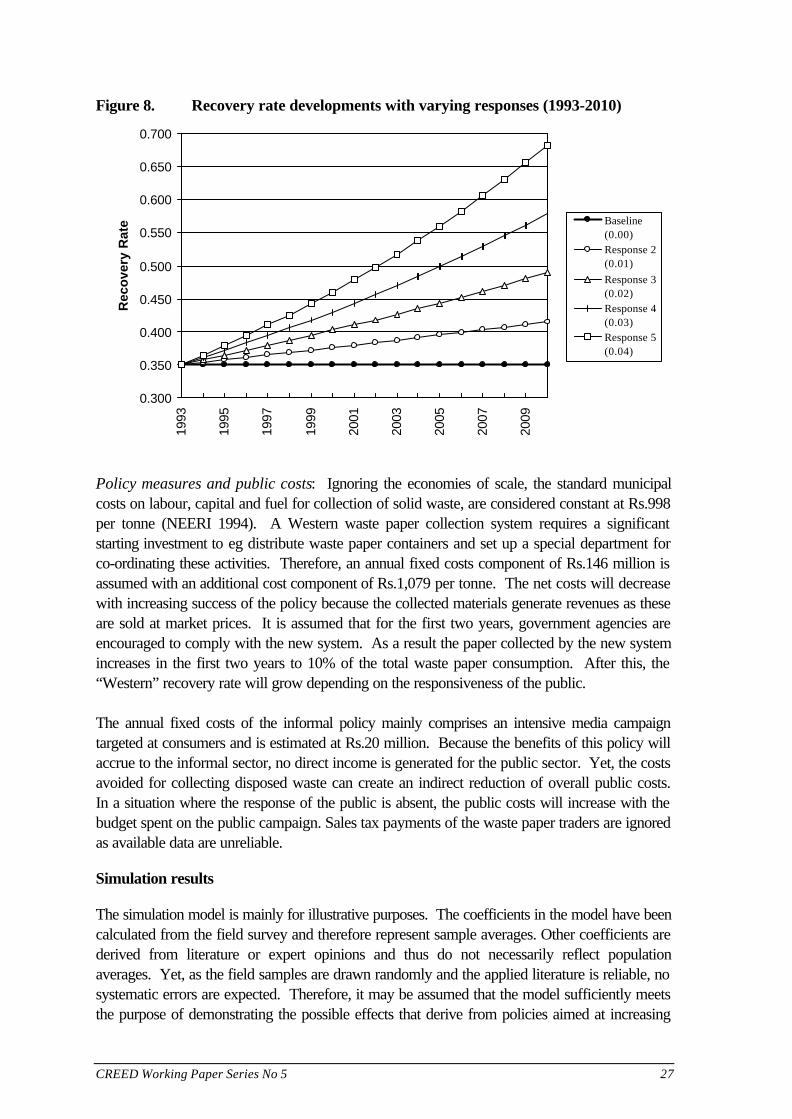
Responsiveness: A key feature in the analysis of the management alternatives is theeffectiveness of a particular policy measure. Because an important instrument is theencouragement of consumers to separate the waste, success largely depends on societalresponse to recycling campaigns. A case study in Hong Kong demonstrated that despite agenerally positive attitude in terms of willingness to improve recycling behaviour, in practise thesuccess of a recycling campaign cannot be guaranteed (Chung and Poon 1994). Therefore, fivedifferent levels of responsiveness are exogenously defined to simulate the different degrees ofsuccess of the recycling campaigns. The responsiveness modifies the growth rate of the totalwaste paper recovery.
RR,t = RR,t-1 ⋅ (1 + á) (8)
where RR,t denotes the overall recovery rate, which is the sum of the reuse rate (ru,t), theinformal recycling rate (rr,t) and the formal recycling rate (rw,t) in period t. The á represents theresponse of society. A responsiveness parameter of á=0.05 implies that a particularmanagement effort would lead to an annual growth of the recovery rate of 5%. Figure 8illustrates the impact of the different degrees of responsiveness of the public to policy measureson the overall recovery rate.
CREED Working Paper Series No 5 27
Figure 8. Recovery rate developments with varying responses (1993-2010)
0.300
0.350
0.400
0.450
0.500
0.550
0.600
0.650
0.700
1993
1995
1997
1999
2001
2003
2005
2007
2009
Rec
ove
ry R
ate Baseline
(0.00)Response 2(0.01)
Response 3(0.02)Response 4(0.03)Response 5(0.04)
Policy measures and public costs: Ignoring the economies of scale, the standard municipalcosts on labour, capital and fuel for collection of solid waste, are considered constant at Rs.998per tonne (NEERI 1994). A Western waste paper collection system requires a significantstarting investment to eg distribute waste paper containers and set up a special department forco-ordinating these activities. Therefore, an annual fixed costs component of Rs.146 million isassumed with an additional cost component of Rs.1,079 per tonne. The net costs will decreasewith increasing success of the policy because the collected materials generate revenues as theseare sold at market prices. It is assumed that for the first two years, government agencies areencouraged to comply with the new system. As a result the paper collected by the new systemincreases in the first two years to 10% of the total waste paper consumption. After this, the“Western” recovery rate will grow depending on the responsiveness of the public.
The annual fixed costs of the informal policy mainly comprises an intensive media campaigntargeted at consumers and is estimated at Rs.20 million. Because the benefits of this policy willaccrue to the informal sector, no direct income is generated for the public sector. Yet, the costsavoided for collecting disposed waste can create an indirect reduction of overall public costs.In a situation where the response of the public is absent, the public costs will increase with thebudget spent on the public campaign. Sales tax payments of the waste paper traders are ignoredas available data are unreliable.
Simulation results
The simulation model is mainly for illustrative purposes. The coefficients in the model have beencalculated from the field survey and therefore represent sample averages. Other coefficients arederived from literature or expert opinions and thus do not necessarily reflect populationaverages. Yet, as the field samples are drawn randomly and the applied literature is reliable, nosystematic errors are expected. Therefore, it may be assumed that the model sufficiently meetsthe purpose of demonstrating the possible effects that derive from policies aimed at increasing
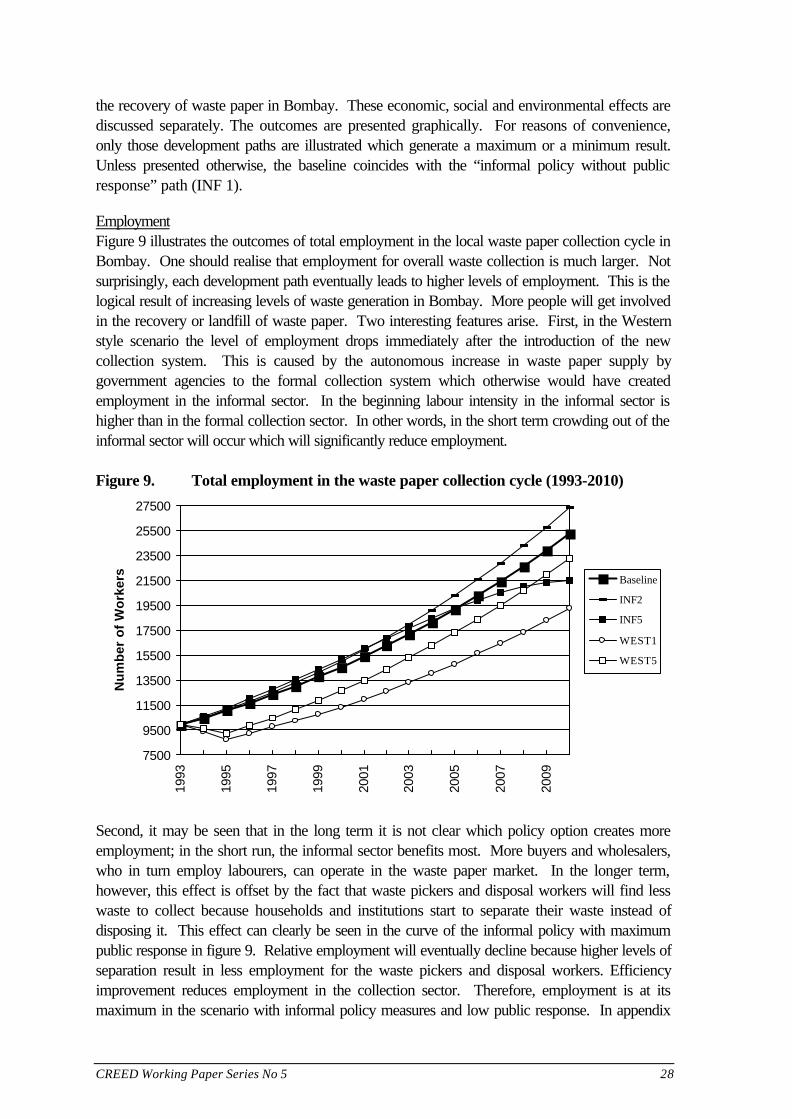
CREED Working Paper Series No 5 28
the recovery of waste paper in Bombay. These economic, social and environmental effects arediscussed separately. The outcomes are presented graphically. For reasons of convenience,only those development paths are illustrated which generate a maximum or a minimum result.Unless presented otherwise, the baseline coincides with the “informal policy without publicresponse” path (INF 1).
EmploymentFigure 9 illustrates the outcomes of total employment in the local waste paper collection cycle inBombay. One should realise that employment for overall waste collection is much larger. Notsurprisingly, each development path eventually leads to higher levels of employment. This is thelogical result of increasing levels of waste generation in Bombay. More people will get involvedin the recovery or landfill of waste paper. Two interesting features arise. First, in the Westernstyle scenario the level of employment drops immediately after the introduction of the newcollection system. This is caused by the autonomous increase in waste paper supply bygovernment agencies to the formal collection system which otherwise would have createdemployment in the informal sector. In the beginning labour intensity in the informal sector ishigher than in the formal collection sector. In other words, in the short term crowding out of theinformal sector will occur which will significantly reduce employment.
Figure 9. Total employment in the waste paper collection cycle (1993-2010)
7500
9500
11500
13500
15500
17500
19500
21500
23500
25500
27500
1993
1995
1997
1999
2001
2003
2005
2007
2009
Nu
mb
er o
f W
ork
ers
Baseline
INF2
INF5
WEST1
WEST5
Second, it may be seen that in the long term it is not clear which policy option creates moreemployment; in the short run, the informal sector benefits most. More buyers and wholesalers,who in turn employ labourers, can operate in the waste paper market. In the longer term,however, this effect is offset by the fact that waste pickers and disposal workers will find lesswaste to collect because households and institutions start to separate their waste instead ofdisposing it. This effect can clearly be seen in the curve of the informal policy with maximumpublic response in figure 9. Relative employment will eventually decline because higher levels ofseparation result in less employment for the waste pickers and disposal workers. Efficiencyimprovement reduces employment in the collection sector. Therefore, employment is at itsmaximum in the scenario with informal policy measures and low public response. In appendix
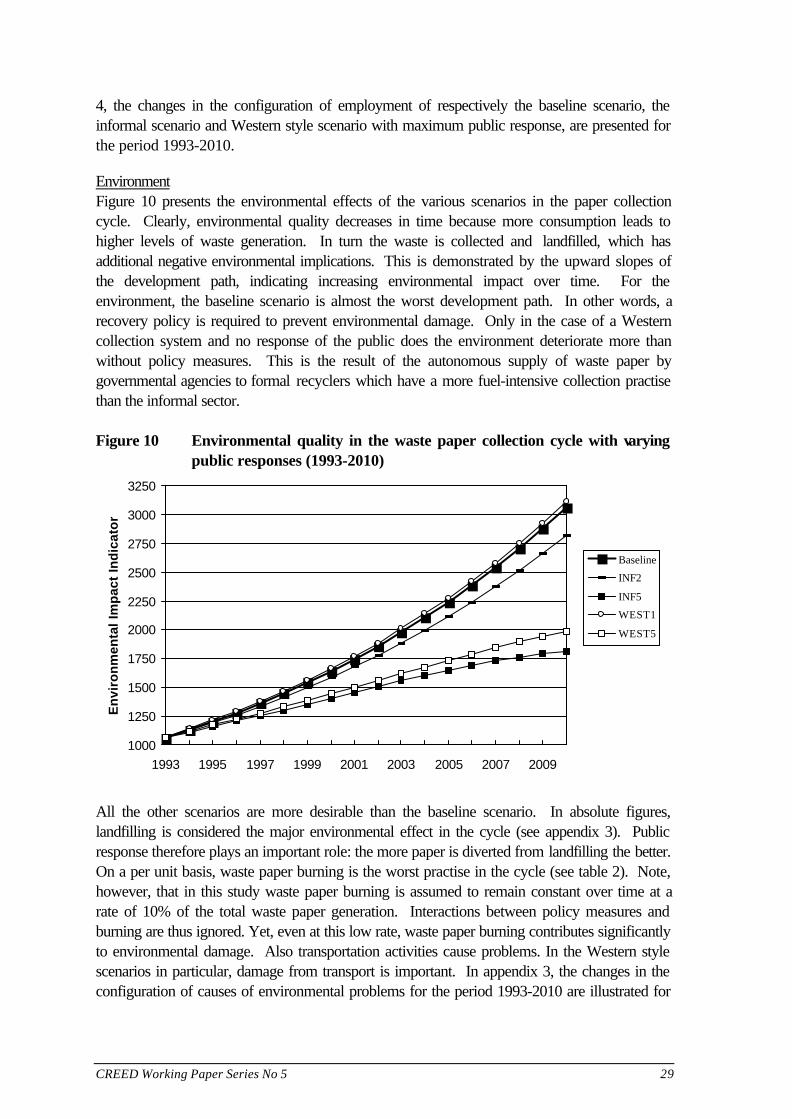
CREED Working Paper Series No 5 29
4, the changes in the configuration of employment of respectively the baseline scenario, theinformal scenario and Western style scenario with maximum public response, are presented forthe period 1993-2010.
EnvironmentFigure 10 presents the environmental effects of the various scenarios in the paper collectioncycle. Clearly, environmental quality decreases in time because more consumption leads tohigher levels of waste generation. In turn the waste is collected and landfilled, which hasadditional negative environmental implications. This is demonstrated by the upward slopes ofthe development path, indicating increasing environmental impact over time. For theenvironment, the baseline scenario is almost the worst development path. In other words, arecovery policy is required to prevent environmental damage. Only in the case of a Westerncollection system and no response of the public does the environment deteriorate more thanwithout policy measures. This is the result of the autonomous supply of waste paper bygovernmental agencies to formal recyclers which have a more fuel-intensive collection practisethan the informal sector.
Figure 10 Environmental quality in the waste paper collection cycle with varyingpublic responses (1993-2010)
1000
1250
1500
1750
2000
2250
2500
2750
3000
3250
1993 1995 1997 1999 2001 2003 2005 2007 2009
En
viro
nm
enta
l Im
pac
t In
dic
ato
r
Baseline
INF2
INF5
WEST1
WEST5
All the other scenarios are more desirable than the baseline scenario. In absolute figures,landfilling is considered the major environmental effect in the cycle (see appendix 3). Publicresponse therefore plays an important role: the more paper is diverted from landfilling the better.On a per unit basis, waste paper burning is the worst practise in the cycle (see table 2). Note,however, that in this study waste paper burning is assumed to remain constant over time at arate of 10% of the total waste paper generation. Interactions between policy measures andburning are thus ignored. Yet, even at this low rate, waste paper burning contributes significantlyto environmental damage. Also transportation activities cause problems. In the Western stylescenarios in particular, damage from transport is important. In appendix 3, the changes in theconfiguration of causes of environmental problems for the period 1993-2010 are illustrated for
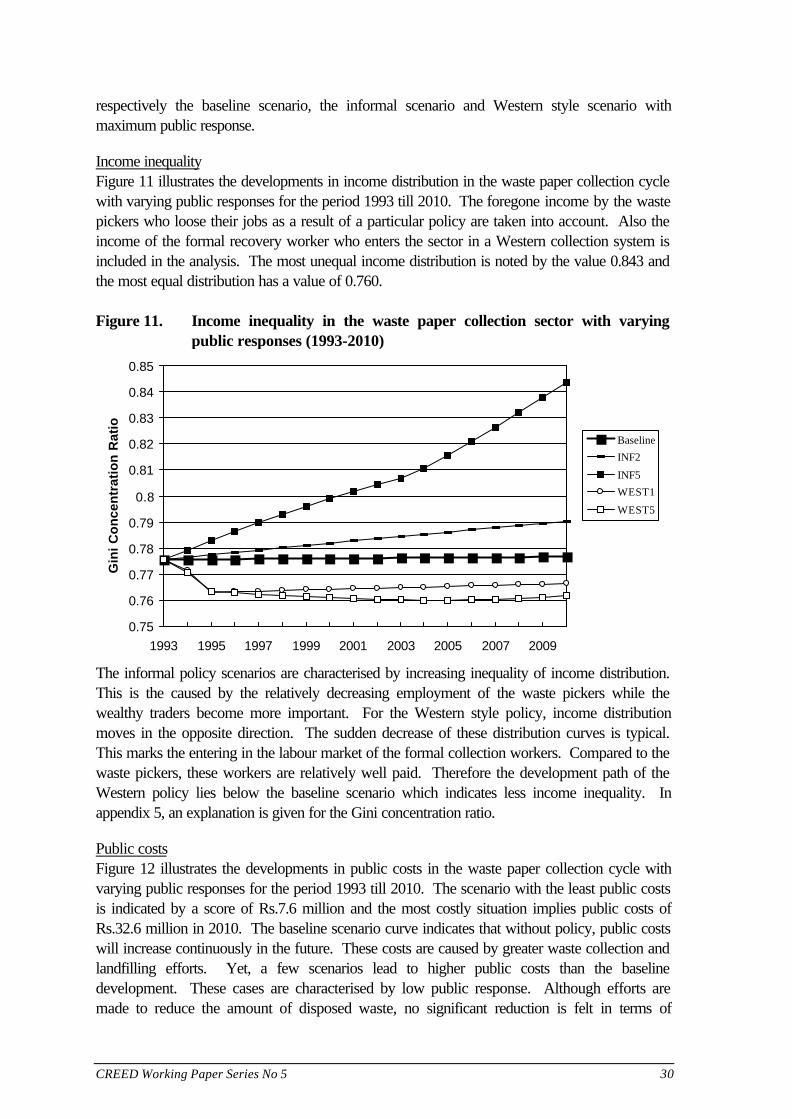
CREED Working Paper Series No 5 30
respectively the baseline scenario, the informal scenario and Western style scenario withmaximum public response.
Income inequalityFigure 11 illustrates the developments in income distribution in the waste paper collection cyclewith varying public responses for the period 1993 till 2010. The foregone income by the wastepickers who loose their jobs as a result of a particular policy are taken into account. Also theincome of the formal recovery worker who enters the sector in a Western collection system isincluded in the analysis. The most unequal income distribution is noted by the value 0.843 andthe most equal distribution has a value of 0.760.
Figure 11. Income inequality in the waste paper collection sector with varyingpublic responses (1993-2010)
0.75
0.76
0.77
0.78
0.79
0.8
0.81
0.82
0.83
0.84
0.85
1993 1995 1997 1999 2001 2003 2005 2007 2009
Gin
i C
on
cen
trat
ion
Rat
io
Baseline
INF2
INF5
WEST1
WEST5
The informal policy scenarios are characterised by increasing inequality of income distribution.This is the caused by the relatively decreasing employment of the waste pickers while thewealthy traders become more important. For the Western style policy, income distributionmoves in the opposite direction. The sudden decrease of these distribution curves is typical.This marks the entering in the labour market of the formal collection workers. Compared to thewaste pickers, these workers are relatively well paid. Therefore the development path of theWestern policy lies below the baseline scenario which indicates less income inequality. Inappendix 5, an explanation is given for the Gini concentration ratio.
Public costsFigure 12 illustrates the developments in public costs in the waste paper collection cycle withvarying public responses for the period 1993 till 2010. The scenario with the least public costsis indicated by a score of Rs.7.6 million and the most costly situation implies public costs ofRs.32.6 million in 2010. The baseline scenario curve indicates that without policy, public costswill increase continuously in the future. These costs are caused by greater waste collection andlandfilling efforts. Yet, a few scenarios lead to higher public costs than the baselinedevelopment. These cases are characterised by low public response. Although efforts aremade to reduce the amount of disposed waste, no significant reduction is felt in terms of

CREED Working Paper Series No 5 31
landfilling. Nor does the Western collection system generate sufficient income from collectedwaste paper.
Figure 12. Public costs in the waste paper collection sector with varying publicresponses (1993-2010)
75000
125000
175000
225000
275000
325000
375000
1993
1995
1997
1999
2001
2003
2005
2007
2009
Co
sts
(in R
s.1,
000) Baseline
INF1
INF5
WEST1
WEST5
Another striking feature in figure 12 is the sudden increase in public costs with the introductionof a Western collection system in 1993/94. Obviously, the initial investment is much higher thanfor the informal policy where efforts are mainly focused on campaigns to encourage separation.A complex and voluminous infrastructure must be set up and maintained. The formal policy cantherefore only be successful under conditions of maximum public response. This is illustrated bythe curve “West 5” which reaches a public cost level of Rs.7.6 million in the year 2010. Oneshould realise however that the informal policy reaches its break even point in a much earlierstage, under the condition of a public response parameter (á) exceeds zero. Thus, the netpresent value of the informal policy is higher than the formal policy, despite the fact that withmaximum response the formal policy scores better in 2010. If the model accounts for thepotential tax payments by the informal sector, this policy turns out to be more favourable than aWestern collection system.
The evaluation model
The main purpose of the evaluation model is to select one alternative on the basis of its overallvalue score. This “weighed additive value function approach” involves several steps (Keeney1992). First, the separate evaluation criteria need to be aggregated over time. Second, valuefunctions are applied which associate a value between 0 and 1 with each criteria score in therange. The 0 and 1 values represent respectively the worst and best situations considered. Thisnormalisation step facilitates comparison between the different discounted evaluation criteria.Finally, hypothetical weights are attached to combine the separate evaluation values into a singlescore. The outcome of this analysis is shown in table 3, and an explanation of this table is givenbelow.

CREED Working Paper Series No 5 32
Table 3. Discounted scores of the separate and combined criteria
Public Costs TotalEmployment
Environmentaleffect
Incomedistribution
Averagevalue *
Overallrank
Baseline 0.82 0.83 0.06 0.68 0.599 6
INF1 0.66 0.83 0.06 0.68 0.557 7
INF2 0.73 1.00 0.26 0.52 0.627 5
INF3 0.81 0.90 0.48 0.34 0.632 4
INF4 0.90 0.85 0.72 0.16 0.659 3
INF5 1.00 0.78 1.00 0.00 0.694 1
WEST1 0.00 0.05 0.00 0.92 0.243 11
WEST2 0.07 0.00 0.08 0.95 0.275 10
WEST3 0.22 0.23 0.39 0.99 0.457 9
WEST4 0.31 0.35 0.60 0.98 0.560 8
WEST5 0.45 0.45 0.86 1.00 0.688 2* equal weighs for criteria
For the aggregation of the evaluation criteria over time different approaches are followed,ranging from discounting to simple summation. Because of its monetary nature it is legitimate todiscount the public costs over the period 1993-2010. Using a 10% discount rate (Hadker etal. 1995), the lowest present value is reported for the scenario “Inf 5”. In this scenario, theadditional public investments for increasing recovery are limited while at the same time theavoided costs for the municipality are at a maximum as a result of the high recovery of waste bythe public. Sensitivity analysis shows that the “public cost” ranking order is not very receptivefor the discount rate selected. Only with a discount rate smaller than 2% “West 5” dominatesthe result of “Inf 1”, because the former scenario generates significant revenues in the future.The conclusion for public costs criteria is therefore that the introduction of Western recyclingsystem is by no means a costs saving solution. With the informal recovery policy, public costreduction will already be achieved if the societal response leads to an annual recovery rategrowth (α) of more than 1%. Such conditions are not ambiguous in most large cities in India.
For employment, the employment levels over the period are aggregated. From the ranking twoconclusions can be drawn. First, it is clear that the Western policy generates much lessemployment than the informal policy. This is mainly caused by crowding out the informal sector.Yet, if the response of the public is positive formal employment will gradually increase becausethe labour intensity of Western recovery is higher than landfilling. As a result, in scenario “West5” the level of employment eventually exceeds the level of scenario “Inf 5”. For the informalpolicy an adverse relation between employment and response exists. The more successful therecycling campaign, the less employment is generated. More and more waste pickers will loosetheir employment as households start separating their waste and sell it directly to the informaltraders. Recyclable materials become harder to find in the municipal waste. Typically, scenarios

CREED Working Paper Series No 5 33
“Inf 2, 3 and 4” score better averages than the baseline because the extra employment gained inwaste trade exceeds the employment lost in landfilling and waste picking.
Environmental impact is ranked based on annual averages. The relationship between responseand environmental impact is very strong. Regardless of the type of policy, higher publicresponse leads to lower environmental impact. Therefore, formal and informal policies scorealternately in the environmental impact criteria. The best score is registered for the informalpolicy because this scenario is less transport intensive than a Western style policy.
Income distribution is ranked on annual averages. Similar to the employment analysis, theresponse rate has an adverse impact on income distribution for respectively the formal and theinformal policy. For the latter policy, a high response leads to higher income inequality becausethe income of the relatively wealthy traders will increase additionally. Note that the wastepickers become unemployed as a result of a successful campaign. The Western recycling policygenerates more formal employment if the response is high, while at the same time the informaltraders are by-passed. Therefore, scenario “West 5” scores best for income distribution.
In order to determine which scenario or policy alternative has the best overall score, theobjectives of the decision maker are specified by attaching weights to each of the separateevaluation criteria (Beinaut 1996). These weights represent the relative importance of onecriteria compared to the other. By incorporating weights, the utility function can be written as:
U(Y) = we U(Ye) + wi U(Yi) + wp U(Yp) + wy U(Yy)
where weights are indicated by wx, x = e, i, p, y, and are normalised to add up to 1. Generally,weights can be determined from opinion polls and/or expert judgements. This is beyond thescope of this project. Therefore, for illustrative purposes, a combined score is composed basedon equal weights of the various evaluation criteria. The results are presented in the last twocolumns of table 3. Obviously, this illustration provides an inappropriate representation of thepreferences of policy makers from Indian cities. In most cases, public costs will be a moreimportant criteria than, for example, income distribution. Also employment may probably beconsidered more important than the environmental impact of the different scenarios. A surveyamong policy makers who make waste management decisions could reveal the correct weights.Nevertheless, the column “overall ranking” is helpful in demonstrating that there is not oneparticular policy which dominates the others. “West 5” owes its second rank to its beneficialincome distribution and the environmental characteristics. However, in general the informalpolicy option scores better.
Therefore, policy makers in developing cities should be reluctant to introduce a Westerncollection system unless they are sure about a significant positive response of the public. Thechange that the public in developing countries is anxious to voluntarily separate their wastewithout financial compensation is probably small. Therefore, it seems to better to do nothing(baseline) than to initiate a Western recovery system. Promoting informal recovery does seemto be a cost-effective policy in most cases. Unfortunately, this is rarely performed in developingcities.

CREED Working Paper Series No 5 34
Conclusions
With growing urbanisation and increasing per capita consumption, waste is becoming an urgentsocial problem in many developing country cities. Given the composition of the disposed waste,the solution to this issue will mainly lie in the choice between recycling and landfilling. So far,developing country efforts for improvement have mainly focused on the latter. However, as istheoretically illustrated in previous sections , the potential for solving the waste problem throughenhancing recovery activities certainly deserves more attention. The local governments can playan important role in this process by initiating appropriate recovery policies. In this paper, thequestion is addressed whether these activities should follow the Western approach of recyclingor whether an alternative “informal” policy would be more appropriate. For this purpose, casestudy research was undertaken on waste paper collection in Bombay, taking into account boththe formal and informal sector. Indirectly, this analysis can also be applied to the problem ofcrowding out the informal sector through an increase in imported waste paper. In this section,conclusions are drawn with regard to the economic, social and environmental dimensions ofthese research questions.
Recovery of recyclable waste in Bombay is an activity which at present is mainly performed bythe informal sector, with minimal participation by government agencies. The largest group in theinformal sector is the waste pickers. Partly as a result of increased attention of the media, thisgroup is generally seen as the figure-head of recycling in developing countries. Therefore, onewould think that what is good for the waste picker is also good for the recycling sector. Thisnotion is not completely true. Waste pickers are dependent on the recyclable waste which isdisposed of by households and institutions. Policies aimed at improving waste recovery at thesource will therefore have a negative impact on the waste pickers’ activities. This dependencyimplies a trade-off between social costs on the one hand and economic and environmental gainsat the other. Waste pickers are dependent on inefficiencies of society. Yet advantages forsociety occur with improved recovery of waste. Increased unemployment among waste pickersmay be compensated by the growth in the demand for labour from the expanding waste tradingnetwork and recycling industries. Another social advantage would be that waste pickers wouldnot have to perform low status and unhealthy work , although obviously having no job is aworse alternative. The most important lesson from this distinctive relationship is that NGOs andpolicy makers should not restrict their views to the well-being and functioning of the wastepickers, but obviously not ignore their present role either.
Another important group is the generators of recyclable waste, such as households, institutionsand factories. The earlier the separation of recyclable materials from the main waste streamoccurs, the better. This will prevent unnecessary contamination and damaging of valuablesecondary resources. Also, with separation at source, social benefits can be achieved as it isoften the poorer servants and caretakers who gain from this process. Obviously this results inpositive environmental impacts due to diminished entropy of resources, and less waste islandfilled or burned. In fact, source separation also facilitates a higher degree of re-use, whichis certainly placed high in the waste management hierarchy, and helps to upgrade the low qualityof waste paper for the paper industry. The main question is how separation at the source shouldbe promoted and how the public would respond to such policies.

CREED Working Paper Series No 5 35
A link in the informal recovery sector which receives only limited attention is the buyers and thewholesalers of recyclable waste. This trade network forms a solid foundation for improving therecovery rate. Replacement of this informal network with a Western collection system mayhave devastating effects. Fortunately, examples of such government interventions are scarce.Still, some municipalities in developing cities seriously consider the incorporation of expensivesource separation systems. Given current levels of poverty, such Western systems whichdepend heavily on “consumer volunteerism” are bound to fail. Nevertheless, the municipalattitudes towards the informal recycling are discouraging. “The municipal officers support theconcept of recycling, but their plans are at the level of installing composting plants andgenerating energy from waste” (Ali et al. 1993).
The simulation and evaluation models which were developed for the waste paper collectionsector in Bombay enabled the evaluation of the introduction of two types of policies: a Westerncollection system and an “informal” policy scenario. Also an explanation is provided for thedevelopment path without policy intervention. The wide range of public response to the policiesillustrates the importance of this parameter which is generally not taken into account sufficientlyin waste management policy decisions. In most scenarios, the “informal” policy of encouragingthe public to separate their waste and market it personally to the informal network, appears tobe the better option. The Western collection system can only be successful if voluntarism islarge in developing cities. Given the relatively high level of poverty in most urban areas, it canbe expected that would consumers prefer to sell their waste to the informal network instead ofsupplying it for free to the formal collectors. Other policy options such as securing waste prices,or subsidising the informal sector were not analysed because of the impossibility of enforcingsuch policies in an unregistered sector.
Finally, the effects of increased importation of recyclable ` on the informal waste collectionsector are assessed. The disadvantage of a market driven sector is the vulnerability to pricefluctuations. Most local waste traders have sufficient margins in their trade to survive arecession. The most vulnerable groups in the informal sector are the waste pickers and theIWB who operate at subsistence level. Given the importance of these actors in the currentsystem, a decrease in the price of waste might lead to significant damage in the recovery rate ofrecyclable waste. Not only can this result in a shortage of raw materials for the recyclingindustry, it also increases the solid waste burden in developing cities. This is another argumentfor improving the current system and reducing its vulnerability to price fluctuations. Encouragingconsumers to sell their waste directly to the informal waste sector is a way of achieving this.Consumers will not be as sensitive to price fluctuations as waste pickers because their totallivelihoods do not depend on it. The main issue, however, is whether waste imports will have aneffect on the price of local waste. This question is addressed in Ramaswamy et al. 1996.
This paper focused predominantly on policies which directly address recovery of recyclablewaste in developing countries. It is concluded that local governments can improve this processprovided their policies build on the existing trade-networks and take into account the prevailingmarket forces. Only than can recovery rates increase which subsequently reduce landfill costs.Yet, besides policies which directly focus at the supply of recyclable waste, indirect policiesstimulating local demand for secondary materials can be regarded as important tools. Thesedemand policies, such as providing financial incentives to industries to use more recyclables or
CREED Working Paper Series No 5 36
designing government procurement specification to allow recyclable content, can have similarpositive effects on recovery rates as direct supply-oriented policies.

CREED Working Paper Series No 5 37
Appendix 1
SET OF EQUATIONS
I. The Basic ModelXt = ∑j xj,t j = s, b, l, u, w, r
Xt = Xt-1 (1 + µ) X1 = 204,000; µ = 0.0591rj,t = xj,t / Xt
rs,t + rb,t + rl,t = RL,t
ru,t + rr,t + rw,t = RR,t determines rr,t
RL,t + RR,t = 1RR,t = RR,t-1 (1 +á) RR,1 = 0.35; for á see belowrs,t = 0.1rb,t = 0.1ru,t = ru,t-1 (1 + ô) ru,t = 0.10; ô = -0.04rw,t = rw,t (1 + á) for t > 2, rw,1 = 0.05; rw,2 = 0.10
II. EmploymentEt = Ef,t + Einf,t
Ef,t = el,t + ew,t
Einf,t = ewp,t+ eiwb,t+ ebe,t + ewe,t + ebu,t + ewh,t
ea,t = qa,t /åa a = l, w, wp, iwb, bu, wh
ee,t = 1.2 ebu,t + 7.3 ewh,t e = be, we
ql,t = xl,t
qw,t = xw,t
qwp,t = szwp,t (xu,t + xr,t) sz
wp,1 = 0.41qiwb,t = sz
iwb,t (xu,t + xr,t) sziwb,1 = 0.03
qrest,t = szrest,t (xu,t + xr,t) sz
rest,1 = 0.56qbu,t = sx
bu,t (qwp,t + qiwb,t + qrest,t) sxbu,1 = 0.24
qwh,t = sxwh,t (qwp,t + qiwb,t + qrest,t) sx
wh,1 = 0.76sz
wp,t + sziwb,t + sz
rest,t = 1sx
bu,t + sxwh,t = 1
sia,t = si
a,t-1 (1 + ηa) a = l,w,wp,iwb,bu,wh,rest; for ηa see below
III. EnvironmentIt = ib,t + il,t + itr,tib,t = φb⋅xb,t
il,t = φl ⋅xl,t
itr,t = φt (xu,t⋅du,t + xr,t⋅dr,t + xw,t⋅dw,t + xl,t⋅dl,t) du,1=15; dr,1= 50; dw,1= 75; dl,1= 20dj,t = dj,t-1(1 + β) j = u,r,w,l; β = 0.021
IV. Public CostsCt = cl,t + cinf,t + cf,t
cl,t = 998 xl,t
cinf,t = cinf,t-1(1 + Ù) cinf,1 = 20,000; Ù = 0.02

CREED Working Paper Series No 5 38
cf,t = 145,669 - 1080 xw,t
V. Income Distributionγt = ∫A / ∫(A+B) for A and B see below∫A = ∫(A+B) - ∫B
∫B = a=∑
1
9
ea,t {b
a
=
−
∑1
1
yb,t + 0.5⋅ya,t} a = eu,wp,iwb,we,l,w,bu,wu
b = eu,wp,iwb,we,l,w,bu,wu
∫(A+B) = 0.5⋅{a=∑
1
9
ea,t ⋅a=∑
1
9
ya,t} a = eu,wp,iwb,we,l,w,bu,wu
ya,t = ea,t ⋅ wa a = eu,wp,iwb,we,l,w,bu,wu
Table 4. Parameters values for different scenariosBase- Informal Policy Formal Policyline Inf1 Inf2 Inf3 Inf4 Inf5 West1 West2 West3 West4 West5
α* 0.00 0.00 0.01 0.02 0.03 0.04 0.00 0.01 0.02 0.03 0.04
ηwp** 0.00000 0.00000 -0.00140 -0.02190 -0.03760 0.05270 -0.00750 -0.00750 -0.00750 -0.00750 -0.00750
ηiwb*
*
0.00000 0.00000 0.01000 0.01750 0.02500 0.03000 0.00000 0.00000 0.00000 0.00000 0.00000
ηrest** 0.00000 0.00000 0.01000 0.01750 0.02500 0.03000 0.00500 0.00500 0.00500 0.00500 0.00500
ηbu** -
0.00580-0.00580 0.00000 0.00530 0.01020 0.01470 -0.01230 -0.01960 -0.02790 -0.03770 -0.04950
ηwh** 0.00173 0.00173 0.00000 -0.00178 -0.00359 -0.00546 0.00343 0.00510 0.00673 0.00833 0.00991
* α is the annual growth rate of the overall recovery rate** ηa is the annual growth rate of the share of actor a in the supply or trade of waste paper
SYMBOL DEFINITIONS
Meaning of Variables
Xt total paper consumptionRj,t j = R,L process categoriesrj,t j=s,b,l,u,w,r process ratesxj,t j=s,b,l,u,w,r process quantitiesEt total employmentEj,t j=inf,f employment per worker groupea,t a=l,w,wp,iwb,be,we,bu,wh employment per sub-worker groupqa,t a=l,w,wp,iwb,be,we,bu,wh quantity of waste paper per sub-worker groupåa a=l,w,wp,iwb,be,we,bu,wh productivity per worker in sub-worker groupss
a,t a=l,w,wp,iwb,bu,wh; s=z,x share of sub-worker group in worker process sIt total environmental impactij,t j=b,l,tr environmental impact of processesdj,t j=u,r,w,l distance of related to processCt total public costscj,t j=r,inf,f public cost of policiesγt Gini coefficient

CREED Working Paper Series No 5 39
ya,t a=ue,l,w,wp,iwb,be,we,bu,wh income of work groupyb,t b=ue,l,w,wp,iwb,be,we,bu,wh income of work groupea,t a=ue,l,w,wp,iwb,be,we,bu,wh labour years of work groupwa a=ue,l,w,wp,iwb,be,we,bu,wh wages of the actors in the work group
Meaning of Indicest: time
Categories (R) L: “diverted from cycle”R: recovered
Processes (x,r) s: storageb: burningl: landfillingu: re-usew: formal “Western” recyclingr: informal recycling
Worker group (E) f: formalinf: informal
Sub-worker group (e) l: landfillw: formal recoverywp: waste pickersiwb: itinerant waste buyersbu: buyerswh: wholesalersrest: households, institutions, factories
Worker process (s) z: source separationx: waste paper trade
Process activity (i) b: burningtr: transportl: landfilling
Policy (c) l: regular landfillinginf: promote informal recoveryf: promote formal recovery
Income actors (y,e) ue: unemployed workerswp: waste pickersbe: employees of the buyersiwb: itinerant waste buyerswe: employees of the wholesalersl: landfillw: formal recoverybu: buyerswh: wholesalers

CREED Working Paper Series No 5 40
Appendix 2
Environmental Indices
The environmental impact of each process is expressed by an index. The following steps shouldbe followed:
The first step is to build an eco-balance for each relevant process (e.g., transport, burning,landfilling) based upon an inventory of environmentally-relevant inputs (e.g., energy) and outputs(e.g., air emissions, solid waste). The fuel use in landfilling comes from the bulldozer operations.Table 5 depicts the inputs/outputs, related to the relevant processes linked to 1 tonne of wastepaper.
Table 5. Eco-Balances
Transport by Diesel Truck in India (per km/ton waste paper)Input unit Output UnitEnergy MJ 1.3379 Particles kg 0.001259
CO2 kg 0.116476CO kg 0.000626HC kg 0.000313NOx kg 0.001566
Fuel oil (light) kg 0.03148 SO2 kg 0.001259
Burning Waste Paper (per ton waste paper)Input unit Output UnitWaste paper kg 1,000 Solid Waste kg 55.87609
CO2 kg 939.624CO kg 1.39999VOC kg 0.299334NOx kg 1.500028SO2 kg 1.300009
Landfilling of Waste Paper in India (per ton waste paper)Input unit Output UnitWaste paper kg 1,000 Particles kg 0.0012592Energy MJ 1.3379 CO2 kg 142.35658
CH4 kg 51.767331NOx kg 0.00156613HC kg 0.00031323SO2 kg 1.300009CO kg 0.00062645VOC kg 0.299334Organic matter kg 751.22513
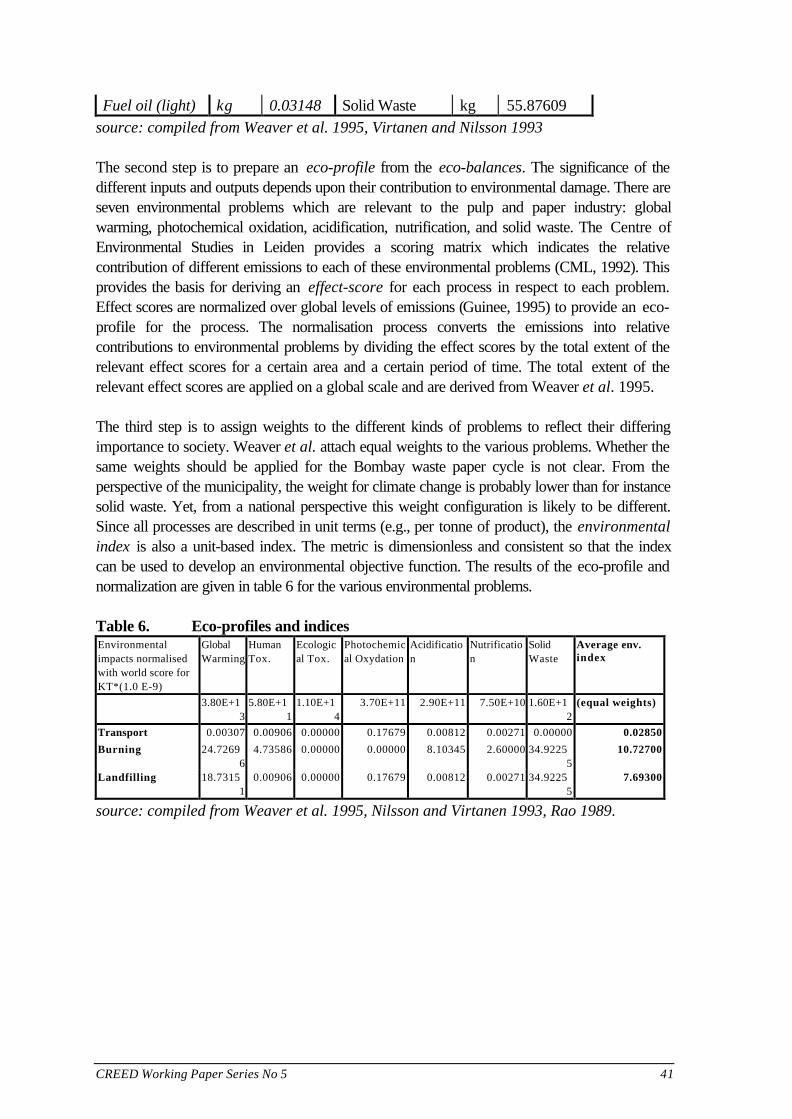
CREED Working Paper Series No 5 41
Fuel oil (light) kg 0.03148 Solid Waste kg 55.87609source: compiled from Weaver et al. 1995, Virtanen and Nilsson 1993
The second step is to prepare an eco-profile from the eco-balances. The significance of thedifferent inputs and outputs depends upon their contribution to environmental damage. There areseven environmental problems which are relevant to the pulp and paper industry: globalwarming, photochemical oxidation, acidification, nutrification, and solid waste. The Centre ofEnvironmental Studies in Leiden provides a scoring matrix which indicates the relativecontribution of different emissions to each of these environmental problems (CML, 1992). Thisprovides the basis for deriving an effect-score for each process in respect to each problem.Effect scores are normalized over global levels of emissions (Guinee, 1995) to provide an eco-profile for the process. The normalisation process converts the emissions into relativecontributions to environmental problems by dividing the effect scores by the total extent of therelevant effect scores for a certain area and a certain period of time. The total extent of therelevant effect scores are applied on a global scale and are derived from Weaver et al. 1995.
The third step is to assign weights to the different kinds of problems to reflect their differingimportance to society. Weaver et al. attach equal weights to the various problems. Whether thesame weights should be applied for the Bombay waste paper cycle is not clear. From theperspective of the municipality, the weight for climate change is probably lower than for instancesolid waste. Yet, from a national perspective this weight configuration is likely to be different.Since all processes are described in unit terms (e.g., per tonne of product), the environmentalindex is also a unit-based index. The metric is dimensionless and consistent so that the indexcan be used to develop an environmental objective function. The results of the eco-profile andnormalization are given in table 6 for the various environmental problems.
Table 6. Eco-profiles and indicesEnvironmentalimpacts normalisedwith world score forKT*(1.0 E-9)
GlobalWarming
HumanTox.
Ecological Tox.
Photochemical Oxydation
Acidification
Nutrification
SolidWaste
Average env.index
3.80E+13
5.80E+11
1.10E+14
3.70E+11 2.90E+11 7.50E+10 1.60E+12
(equal weights)
Transport 0.00307 0.00906 0.00000 0.17679 0.00812 0.00271 0.00000 0.02850
Burning 24.72696
4.73586 0.00000 0.00000 8.10345 2.60000 34.92255
10.72700
Landfilling 18.73151
0.00906 0.00000 0.17679 0.00812 0.00271 34.92255
7.69300
source: compiled from Weaver et al. 1995, Nilsson and Virtanen 1993, Rao 1989.
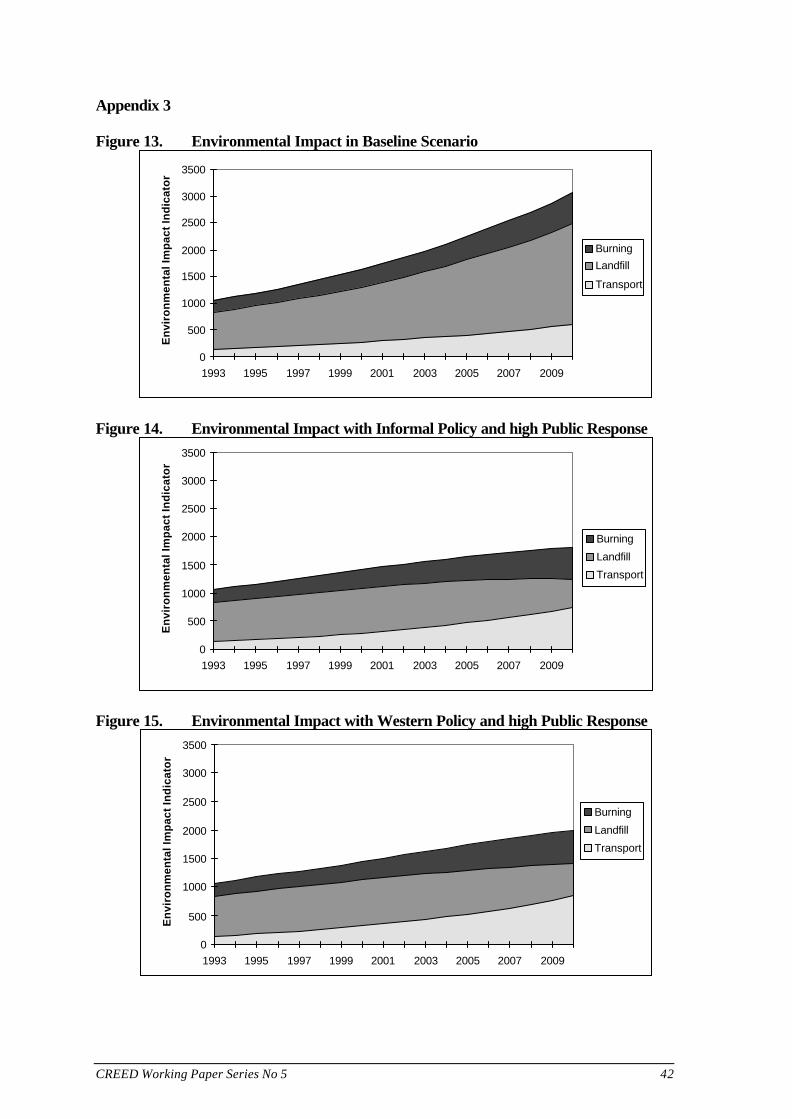
CREED Working Paper Series No 5 42
Appendix 3
Figure 13. Environmental Impact in Baseline Scenario
0
500
1000
1500
2000
2500
3000
3500
1993 1995 1997 1999 2001 2003 2005 2007 2009
En
viro
nm
enta
l Im
pac
t In
dic
ato
r
Burning
Landfill
Transport
Figure 14. Environmental Impact with Informal Policy and high Public Response
0
500
1000
1500
2000
2500
3000
3500
1993 1995 1997 1999 2001 2003 2005 2007 2009
En
viro
nm
enta
l Im
pac
t In
dic
ato
r
Burning
Landfill
Transport
Figure 15. Environmental Impact with Western Policy and high Public Response
0
500
1000
1500
2000
2500
3000
3500
1993 1995 1997 1999 2001 2003 2005 2007 2009
En
viro
nm
enta
l Im
pac
t In
dic
ato
r
Burning
Landfill
Transport

CREED Working Paper Series No 5 43
Appendix 4
Table 7. Labour distribution in the “baseline”, the “informal”, and the Westernpolicy scenario with maximum public response in 2010.
Baseline West 5 Informal 5number share number share number share
unemployed waste pickers 0 0.000 974 0.039 5233 0.180waste pickers 18462 0.708 17487 0.708 13229 0.454buyer employees 965 0.037 542 0.022 2714 0.093IWBs 364 0.014 205 0.008 1694 0.058wholesaler employees 1291 0.050 1631 0.066 2515 0.086disposal workers 3993 0.153 1195 0.048 1049 0.036formal recovery workers 0 0.000 1981 0.080 0 0.000buyers 830 0.032 466 0.019 2336 0.080wholesalers 182 0.007 230 0.009 355 0.012Total 26088 1.000 24711 1.000 29126 1.000

CREED Working Paper Series No 5 44
Appendix 5
Gini-coefficientThe most common method for calculating income distribution is the Lorenz curve, which isillustrated in figure 16. To draw a Lorenz curve, income Recipients are ranked from the lowestincome to the highest along the horizontal axis. The Lorenz itself shows the percentage ofincome accounted for by any cumulative percentage of recipients. The shape of this curveindicates the degree of inequality in the income distribution (Gillis et al. 1987). The curve mustby definition touch the 45o line at the lower left corner (zero percent of recipients must receivezero percent of income) and at the upper right corner (100 percent of recipients must receive100 percent income). If all recipients had the same income, the Lorenz curve would lie along the45o line (perfect equality). The inequality of the distribution curve is greater the further it bendsaway from the 45o line of perfect equality (the greater the shaded area A, the greater isinequality). The Gini concentration ratio is the value of area A divided by A plus B in figure 16.
Figure 16. Lorenz curve for the Western policy with high public response
B
A
0
10
20
30
40
50
60
70
80
90
100
0 5 10 15 20 25 30 35 40 45 50 55 60 65 70 75 80 85 90 95 100
Cumulative % of Recepients Collection Sector
Cu
mu
lati
ve %
of
Inco
me
in C
oll
ecti
on
Sec
tor

CREED Working Paper Series No 5 45
References
Ali, S.M., Cotton, A. and Coad, A. 1993. Informal Sector Waste Recycling. Paper presented atthe 19th WEDC Conference on Water, Sanitation, Environment and Development: 153-155Accra, Ghana.
Ali, S.M., Cotton, A. and Coad, A. 1996. “Municipal and Informal Systems in Solid WasteManagement. In: Nabell Hamdi and Emy Al Sherif (eds). Educating for Real IntermediateTechnology (IT) Publications: London.
Bartone, C., Leith, L., Triche, T. and Schertenleid, R. 1991. “Private Sector Participation inMunicipal Solid Waste Service: Experiences in Latin America. Waste Management and Research9 :495-509.
Baud, I. and Schenk H. (eds.) 1994. Solid Waste Management: Modes, Assessments,Appraisals and Linkages in Bangalore. Manohar: New Delhi.
Beinaut, E. 1996. Multiattribute Value Functions for Environmental Management. Phd Thesis.Tinbergen Institute Research Series No. 103. Tinbergen, Amsterdam.
Bennis, M., Beukering, P.J.H. van and Hoogeveen, H. 1996. International Trade of WastePaper: a Global Assessment with a Special Focus on India. CREED Final Report. Institute forEnvironmental Studies: Amsterdam.
Bertolini, G. 1994. “Waste Cycle Management: Incentives and Product Chain Pressure Point of‘Leverage Point’ Analysis. In: H. Opschoor and R.K. Turner (eds). Economic Incentives andEnvironmental Policies:299-249 Kluwer Academic Publishers. Amsterdam.
Beukering, P. van. 1994. “An Economic Analysis of Different Types of Formal and InformalEntrepreneurs, Recovering Urban Solid Waste in Bangalore (India).” Resources, Conservationand Recycling 12 :229-252.
Beukering, P. van and Duraiappah, A. Forthcoming. An Environmental Impact Assessment ofThe International Trade of Waste Paper to India: A Material Balance Flow Model. CREEDWorking Paper. IES: Amsterdam.
Chung, S.S. and Poon, C.S. 1994. “Recycling Behaviour and Attitude: the Case of Hong KongPeople and Commercial and Household Wastes”. International Journal of SustainableDevelopment and World Ecology 1: 130-145
CML 1992. Environmental Life Cycle Assessment of Products; I: Guide, II: Backgrounds.Centre of Environmental Science No. 9266. CES: Leiden.
Cointreau-Levine, S.J. 1989. “Solid Waste Recycling: Case Studies in Developing Countries.”Regional Development Dialogue. 10-3.
Cointreau-Levine, S.J. and de Kadt, M. 1991. “Living with Garbage: Cities Learn to Recycle.”Development Forum, Jan-Febr:12-13.
Cointreau-Levine, S.J. 1996. Private Sector Participation in Solid Waste Management inDeveloping Countries. World Bank: Washington, DC
Furedy, C. 1990. “Social Aspects of Solid Waste Recovery in Asian Cities.” EnvironmentalSanitations Review.30: 2-52.

CREED Working Paper Series No 5 46
Furedy, C. 1994. “One World of Waste: Should Countries Like India Deal with Solid WasteProblems through Source Separation?” In E.L. Tepper and J.R. Wood (eds.). Enriched by SouthAsia: Celebrating 25 years of South Asian Studies in Canada. Vol 2: 87-108 Canadian AsianStudies Association, Montreal.
Gandhy, M. 1994. Recycling and the Politics of Urban Waste. Earthscan: London.
Gilhuis, H. 1988. Scavengers Between Self-Employment and Wage Work, the RecyclingBusiness in Curitiba - Brazil. Free University: Amsterdam.
Gillis, M., Perkins, D.H., Roemer M. and Snodgrass, D.R. 1987. Economics of Development.2nd edition. Norton & Company:New York.
Guinee, J.B. 1995. Development of a Methodology for the Environmental Life-CycleAssessment of Products; with a Case Study of Margarines. Phd Thesis. University ofLeiden:Leiden.
Hadker, N. 1995. Accounting for Informal Sectors: a Case Study of Solid Waste ManagementSystems in Bombay. Prepared for the ESCAP project, Environmental Accounting for India. IndiraGandhi Institute of Development Research: Bombay.
Hadker, N., Sharma, V.K., David A., Muraleedharan, T.R., Geetha, S. and Babu, P.G. 1995. ArePeople in Developing Countries Willing to Pay for Natural Reserve Preservation?: Evidencefrom a CV of the Borivli National Park, Bombay. Discussion Paper No 121. Indira GandhiInstitute of Development Research: Bombay.
Hagen, Oskar von dem 1994. Is Recycling Bad? Waste Paper and the Forest. Discussion PaperNo. V-144-94. Institut fur Volkswirtschaftslehre: Universitat Oldenburg..
Hardoy, J.E., Mitlin, D. and Satterwaite D. 1992. Environmental Problems in Third WorldCities. Earthscan: London.
Huisman, M. 1994. “The Position of Waste Pickers in Solid Waste Management.” In: I. Baud andH. Schenk (eds.) Solid Waste Management: Modes, Assessments, Appraisals and Linkages inBangalore: 46-104. Manohar: New Delhi.
Keeney, R.L. 1992. Value-Focused Thinking. Harvard University Press: Cambridge.
Larssen, S., Gram, F., Hagen, O., Jansen, H., Olsthoorn, X., Aundhe, Uhlas, J., Metha, K.H.,Hahashoor, A.A. 1996. Urban Air Quality: Management Strategy in Asia (URBAIR): GreaterBombay City Specific Report. Kjeller.
National Environmental Engineering Research Institute (NEERI) 1994. Solid Waste Managementin Greater Bombay. Phase I Report. Metropolitan Environmental Improvement Program, A WorldBank project. Nagpur.
Pearce, D. and Turner, R.K. 1994. Economics and Solid Waste Management in the DevelopingWorld. CSERGE Working Paper WM 95-05. Centre for Social and Economic Research on theGlobal Environment: London.
Matussek, H., Salvesen, W. and Pearson, J. (eds). 1994. Pulp and Paper International (PPI)International Fact and Price Book. Brussels.

CREED Working Paper Series No 5 47
Ramaswamy, K.V., Vaidya, R., Hoogeveen, H. & Bennis, M. Forthcoming. Input Substitution Inthe Indian Paper Industry: a Variable Cost Function Approach. CREED Working Paper. IES:Amsterdam.
Rao, Y.A. 1995. Pulp and Paper Production in Asia; Economic, Social and EnvironmentalIssues. Paper presented at the Regional Workshop on the Sustainable Paper Cycle, IIED andWorld Business Council for Sustainable Development, 21-22 February, Bangkok.
Savage, G.M. and Diaz, L.F. 1995. “Future Trends in Solid Waste Management.” In:International Directory of Solid Waste Management 1995/96:22-28 The ISWA Yearbook.London..
Schall, J. 1995. Does the Solid Waste Hierarchy Make Sense? A Technical, Economic andEnvironmental Justification for the Priority of Source Reduction and Recycling. YaleUniversity: New Haven.
Virtanen, Y. and Nilsson, S. 1993. Environmental Impacts of Waste Paper Recycling.International Institute for Applied Systems Analysis. Earthscan: London.
Waas, E. and Diop, O. 1991. “Waste Recycling as an Economic Activity in Dakar.” AfricanEnvironment. VIII, 1-2 (29-30): 111-132.
Weaver, P.M., Gabel, H.L., Bloemhof-Ruwaard, J.M. and van Wassehove L.N. 1995. OptimizingEnvironmental Product Life Cycles: a Case Study of the European Pulp and Paper Industry.INSEAD, Fontainebleau.
World Bank 1995. Workers in an Integrated World. World Development Report 1995:Oxford University Press, New York.